republic of turkey the study on optimal power … · republic of turkey general directorate of...
TRANSCRIPT

REPUBLIC OF TURKEY GENERAL DIRECTORATE OF ELECTRIC POWER RESOURCES SURVEY AND DEVELOPMENT ADMINISTRATION
TURKISH ELECTRICITY TRANSMISSION CO. (TEIAS)
REPUBLIC OF TURKEY
THE STUDY ON OPTIMAL POWER GENERATION FOR PEAK DEMAND IN
TURKEY
(Summary)
February 2011
(2011)
JAPAN INTERNATIONAL COOPERATION AGENCY(JICA)
IDDJR
10-134

Contents
Chapter 1 Introduction ..................................................................................................................................1
1.1 Background of the Study....................................................................................................................1
1.2 Purpose of the Study and Implementation Details............................................................................1
1.2.1 Purpose of the Study ...................................................................................................................1
1.2.2 Implementation Details (TOR).....................................................................................................1
Chapter 2 Energy Sector and Electricity Sector..........................................................................................3
2.1 Energy Sector .....................................................................................................................................3
2.1.1 Energy Policy ...............................................................................................................................3
2.2 Electricity Sector..................................................................................................................................4
2.2.1 Institutional Arrangement and Sector Overview.........................................................................4
2.2.2 Role of Key Entities......................................................................................................................7
Chapter 3 Review of Long-term Demand/Supply Plan ..............................................................................9
3.1 Current status of Power Demand Forecast.......................................................................................9
3.2 Current Power Development Plan and Its Review .........................................................................11
3.2.1 Power Development Plan Liberalized Electricity Market .........................................................11
3.3 Current Status and Evaluation of System Planning........................................................................13
3.4 Current Status of Power System Operation....................................................................................15
3.4.1 Overview of Power Market ........................................................................................................15
Chapter 4 Optimal Power Generation for Peak Demand.........................................................................17
4.1 Economic Comparison among Various Power Sources through Screening................................17
4.2 Formulation of Data for Demand and Supply Operation Simulation .............................................20
4.2.1 Demand Forecast ......................................................................................................................20
4.2.2 Current Status and Future Prospects for Peak Demand.........................................................21
4.3 Study of Appropriate Reserve Capacity Rate Based on Supply Reliability...................................23
4.4 Possibility of Introduction of Various Power Supplies as Peak Supply Capacity..........................24
4.4.1 Evaluation of Various Power Generations for Peak Demand.................................................24
4.4.2 Feasibility of Expansion of Existing Reservoir-Type Hydropower Plant as a Peak
Supplier .....................................................................................................................................26
4.4.3 Availability of Power Import from Neighboring Countries ........................................................29
4.5 Study of Optimal Power Supply Configuration in 2030 ..................................................................30
4.5.1 Study of the Necessary Amount of Peak Supply Capacity .....................................................30
4.5.2 Study on Necessary Amount of Pumped Storage Power Plants (Study in the Base
Case).........................................................................................................................................32
4.5.3 Risk Assessment .......................................................................................................................36
4.6 Power Optimal Plan for Peak Demand ...........................................................................................37
Chapter 5 Finding and Evaluation of PSPP Potential Sites .....................................................................39
5.1 Preparation of Criteria for Finding of PSPP Candidate Sites .........................................................39
5.2 Map Study.........................................................................................................................................40
5.3 Detailed Site Survey on Conceptual Design Sites..........................................................................49
5.3.1 Result of Site Survey .................................................................................................................49
Chapter 6 Proposal of Long-Term Power Development Planning (from 2011 to 2030) ........................52
6.1 Current Power Development Plan and Its Future Directions .........................................................52
6.1.1 Future Direction of Power Development ..................................................................................52
6.2 Study on Long-Term Power Development Plan(2011~2030).................................................52
6.3 Proposal of Optimal Power Development Plan...............................................................................56
Chapter 7 Conceptual Design of Priority PSPP........................................................................................57
7.1 Study on Optimum Development Scale..........................................................................................57
7.2 Conceptual Design of Altınkaya PSPP............................................................................................58
7.2.1 Design of Power Generation Plan ............................................................................................58
7.2.2 Design of the Main Structures and Equipment ........................................................................61
7.2.3 Rough Cost Estimate.................................................................................................................65
7.2.4 Standard Development Schedule of PSPP Project.................................................................67
7.3 Conceptual Design of Gökçekaya PSPP........................................................................................67
7.3.1 Design of Power Generation Planning .....................................................................................67
7.3.2 Design of the Main Structures and Equipment ........................................................................70
7.3.3 Preliminary Cost Estimation ......................................................................................................73
7.3.4 Standard Development Schedule of PSPP Project.................................................................74
7.4 Rough Cost Estimate of Transmission Facility ...............................................................................75
7.4.1 Rough Estimation of Transmission Line Construction.............................................................75
7.4.2 Rough Cost Estimate of Transmission Line of Altınkaya PSPP.............................................75
7.4.3 Rough Cost Estimate of Transmission Line of Gökçekaya PSPP..........................................76
7.4.4 Status of Power Flow of 380 kV System with Operating PSPP..............................................77
7.5 Prioritization of PSPP Development ................................................................................................78
7.6 Recommendation of Investigation Works for Next Step.................................................................79
7.6.1 Hydrological and Metrological Investigation .............................................................................79
7.6.2 Geological Investigation.............................................................................................................79
7.6.3 Feasibility Study .........................................................................................................................81
Chapter 8 Recommendations from the Study Team................................................................................82
8.1 Proposal on Long-Term Development Plan....................................................................................82
8.2 Recommendation for Construction of PSPP...................................................................................84
8.2.1 Introduction of Advanced Technologies ...................................................................................84
8.2.2 Environmental and Social Considerations................................................................................85
8.3 Suggestion for Possession of PSPP ...............................................................................................86
8.3.1 Ownership and Operation Schemes of PSPP in Other Countries..........................................86

8.3.2 Proposal of Business Model......................................................................................................89
Figures Figure 2. 1 The Institutional Arrangement of Turkish Power Sector ........................................................4 Figure 2. 2 Step of Liberalization ..............................................................................................................6 Figure 2. 3 Formulation Process of Power Development Planning ...........................................................7 Figure 2. 4 Application Process of Power Plant Development ..................................................................8 Figure 3. 1 Input and Output of MAED.....................................................................................................9 Figure 3. 2 Load Forecast in High Demand and Low Demand Cases .....................................................10 Figure 3. 3 Image of Electricity Flow among Entities .............................................................................11 Figure 3. 4 Relations of Power Purchase-Supply Contracts (Bilateral Contracts)...................................16 Figure 4. 1 Generating Cost .....................................................................................................................19 Figure 4. 2 Generating Cost (for peak supply).........................................................................................19 Figure 4. 3 Demand Forecast until 2030..................................................................................................20 Figure 4. 4 Demand Shape on Maximum Demand Occurrence Days in Summer...................................21 Figure 4. 5 Demand Shape Forecasts in 2020 and 2030 ..........................................................................22 Figure 4. 6 Relationship between LOLE and Supply Reserve Capacity Rate .........................................23 Figure 4. 7 Layout of Extension Plan of Keban HES ..............................................................................26 Figure 4. 8 Correlation between No. of Extension Unit & B/C or B-C...................................................28 Figure 4. 9 Cost Comparison between Gas Turbine and Combined Cycle..............................................30 Figure 4. 10 Changes in Economics of Peak Supply Capacity due to Changes in Supply Reserve
Capacity Rate .......................................................................................................................31 Figure 4. 11 Example of Dispatching of Conventional Hydro to Demand..............................................32 Figure 4. 12 Relationship between Installed Capacity and Supply Capacity of PSPP ............................33 Figure 4. 13 Optimal Necessary Amount of PSPP ..................................................................................34 Figure 4. 14 Image Picture of Dispatching PSPP to Demand..................................................................35 Figure 5. 1 Map of Active Faults and PSPP Potential Sites.....................................................................40 Figure 5. 2 Map of National Parks and PSPP Potential Sites ..................................................................41 Figure 5. 3 Selection Flow of PSPP Candidate Sites ...............................................................................42 Figure 5. 4 Location of 28 PSPP Candidate Sites....................................................................................42 Figure 5. 5 Location of Candidates for Site Survey.................................................................................43 Figure 6. 1 Relationship between Plant Maximum Capacity and Supply Capacity of PSPP ..................52 Figure 6. 2 General hydro power plants dispatch(in 2025 and 2029).................................................53 Figure 6. 3 Dispatching PSPP (in 2025 and 2029) ............................................................................53 Figure 6. 4 Comparison of Different Scenarios(In terms of Peak Supply Capacity) .........................54 Figure 6. 5 Optimal Power Development Plan ........................................................................................56 Figure 6. 6 Transition of Plant Type Composition Ratio.........................................................................56 Figure 7. 1 Altınkaya PSPP General Layout............................................................................................59 Figure 7. 2 Altınkaya PSPP Waterway Longitudinal Section..................................................................60 Figure 7. 3 Configuration of Adjustable Speed System...........................................................................64 Figure 7. 4 Input Adjustment Range during Pumping Operation ............................................................64 Figure 7. 5 Gökçekaya PSPP General Layout .........................................................................................68 Figure 7. 6 Gökçekaya PSPP Waterway Longitudinal Section ...............................................................69 Figure 7. 7 Transmission Line Route of Altınkaya PSPP.......................................................................75 Figure 7. 8 Transmission Route of Gökçekaya PSPP..............................................................................76 Figure 8. 1 Splitter Runner.......................................................................................................................85 Figure 8. 2 PSPP Operations before and after Introducing Power Market ..............................................87 Figure 8. 3 Plan for TEIAS to guarantee annual fixed payment ..............................................................89 Figure 8. 4 Plan to sign relative contract with distribution companies, etc. ............................................91
Tables
Table 2. 1 Liberalization Progress of Turkish Electricity Industry............................................................5 Table 3. 1 Growth Rates in High Demand and Low Demand Cases .......................................................10 Table 4. 1 Unit Construction Cost ...........................................................................................................17 Table 4. 2 Standard Unit Construction Cost ............................................................................................17 Table 4. 3 Annual Fixed Cost ..................................................................................................................18 Table 4. 4 IEA Projection ........................................................................................................................18 Table 4. 5 Fuel Cost .................................................................................................................................18 Table 4. 6 Transition of Maximum Daily Demand and Minimum Daily Demand..................................22 Table 4. 7 Characteristics of Various Power Generations for Peak Demand ..........................................24 Table 4. 8 Assumptions of The Study on Extension Plan of Keban HES................................................27 Table 4. 9 Cost-benefit Analysis(B/C, B-C) .........................................................................................28 Table 4. 10 Power Trade between Greece and Bulgaria in 2008 Unit: GWh..........................................29 Table 4. 11 Comparison in Economic Efficiency between Gas Turbine and Combined Cycle ..............30 Table 4. 12 Ancillary Service of Various Peaking Power Plants.............................................................37 Table 5. 1 Criteria for Finding Potential Pumped Storage Project in Turkey..........................................39 Table 5. 2 List of candidate sites of PSPP ...............................................................................................44 Table 5. 3 Natural and Social Environment Evaluation of PSPP Potential Sites.....................................45 Table 5. 4 Criteria for Priority Ranking...................................................................................................45 Table 5. 6 Results of Site Survey of PSPP Candidate Sites (1/2) ............................................................47 Table 5. 7 Results of Site survey of PSPP Candidate Sites (2/2).............................................................48 Table 5. 8 Issues based on the Results of Detailed Site Survey...............................................................49 Table 6. 1 Value comparison as of 2021..................................................................................................55 Table 7. 1 Analysis Results of the Optimum Development Scale ...........................................................57 Table 7. 2 Results of the Optimum Development Scale ..........................................................................57 Table 7. 3 Main Features of Altınkaya PSPP...........................................................................................61 Table 7. 4 Rough Cost Estimate of Altınkaya PSPP................................................................................65 Table 7. 5 Standard Development Schedule(Altınkaya PSPP ).........................................................67 Table 7. 6 Main Features of Gökçekaya PSPP ........................................................................................70 Table 7. 7 Cost Estimation of Gökçekaya PSPP Site...............................................................................73 Table 7. 8 Standard Development Schedule(Gökçekaya PSPP ) ......................................................74 Table 7. 9 Unit Construction Cost of 380kV Double Circuit Transmission Line....................................75 Table 7. 10 Comprehensive Rank of Two Priority PSPP Projects ..........................................................78 Table 7. 11 Proposal of Geological Investigation Works in the FS Stage for Altınkaya PSPP...............79 Table 7. 12 Proposal of Geological Investigation Works in the FS Stage for Gökçekaya PSPP.............80 Table 7. 13 Draft Schedule of Feasibility Study and Development.........................................................81 Table 8. 1 Comparison between proposed business models ....................................................................92

Abbreviations
Abbreviations Words (Original) AC Alternating Current APK Research Planning and Coordination B/C Benefit by Cost BO Build Operate BOT Build Operate Transfer BOTAS Petroleum Pipeline Corporation BTU British Thermal Unit C/C Combined Cycle CFRD Concrete Face Rockfill Dam CITES Convention on International Trade in Endangered Species of Wild Fauna
and Flora CO2 Carbon Dioxide C/P Counterpart CSR Corporate Social Responsibility DGP Balancing Power Market DPT State Planning Organization DSI General Directorate of State Hydraulic Works DSM Demand Side Management EIA Environmental Impact Assessment EIE General Directorate of Electric Power Resources Survey and
Development Administration EMRA Energy Market Regulatory Authority ENPEP Energy & Power Evaluation Program (Software name) ENTSO-E European Network of Transmission System Operators for Electricity EPDK Energy Market Regulatory Authority ETKB Ministry of Energy and Natural Resources EU Europe Union EUAS Electric Generation Company FS Feasibility Study GDP Gross Domestic Product GME Gestore dei Mercati Energetici S.p.A GT Gas Turbine HES Hydro Electric Station HH Household HPP Hydro Power Plant HWL High Water Level IEA International Energy Agency IPP Independent Power Producer JICA Japan International Cooperation Agency KCETAS Kayseri Region Electricity Company LDC Load Dispatch Center LOLE Loss of Load Expectation LOLP Loss Of Load Probability LWL Low Water Level MAED Model for Analysis of Energy Demand MENR Ministry of Energy and Natural Resources MFSC Market Financial Settlement Center MTA General Directorate of Mineral Research & Exploration NCC National Control Center NDP National Development Plan

NLDC National Load Dispatch Center OECD Organization for Economic Co-operation and Development O&M Operation and Maintenance PDP Power Development Planning PDPAT II Power Development Planning Assist Tool (Software name) PMUM Market Financial Settlement Center PP Power Plant PPA Power Purchase Agreement P/S Power Station PSPP Pumped Storage Power Plant PSS Power System Stabilizer PV Photovoltaic PYS Market Management System RAP Resettlement Action Plan RCC Regional Control Center RE Renewable Energy REDA Regional Electricity Distribution Company RH Reservoir Hydro RWE RWE (Company name) SPO State Planning Organization ST Steam Turbine SVC Static Var Compensator TBM Tunnel Boring Machine TEAS Turkish Electricity Generation and Transmission Company TEDAS Turkish Electricity Distribution Company TEIAS Turkish Electricity Transmission Corporation TEK Turkish Electricity Authority TEPCO Tokyo Electric Power Company, Inc TEPSCO Tokyo Electric Power Services Co., Ltd. TETAS Turkish Electricity Trading and Contracting Co.Inc. TKI Turkish Coal Enterprises TOR (or TOOR) Transfer of Operating Right TOR Terms Of Reference TPP Thermal Power Plant TSO Transmission System Operator TTK Turkish Hardcoal Authority UCTE Union for the Coordination of Transmission of Electricity US United States USC United States Cent USD United States Dollar WASP IV Wien Automatic System Planning (Software name)
Abbreviations Words (Original) Words (Turkish) APK Research Planning and Coordination Araştırma Planlama Koordinasyon BOTAS Petroleum Pipeline Corporation Boru Hatları ile Petrol Taşıma A.Ş. DPT State Planning Organization Devlet Planlama Teşkilatı Müsteşarlığı DSI General Directorate of State Hydraulic
Works Devlet Su İşleri
DGP Balancing Power Market Dengeleme Güç Piyasası EIE General Directorate of Electric Power
Resources Survey and Development Elektrik Isleri Etüt Idaresi Genel Müdürlügü

Administration ETKB Ministry of Energy and Natural
Resources Enerji ve Tabii Kaynaklar Bakanl
EPDK Energy Market Regulatory Authority Enerji Piyasası Düzenleme Kurumu EUAS Electric Generation Company Elektirik Üretim Anonim Şirketi KCETAS Kayseri Region Electricity Company Kayseri ve Civari Elektrik T.A.S MTA General Directorate of Mineral
Research & Exploration Maden Tetkik ve Arama Genel Müdürlüğü
PMUM Market Financial Settlement Center Piyasa Mali Uzlastirma Merkezi PYS Market Management System Piyasa Yönetim Sistemi TEAS Turkish Electricity Generation and
Transmission Company Türkiye Elektrik Anonim Şirketi
TEDAS Turkish Electricity Distribution Company
Türkiye Elektrik Dağıtım Anonim Şirketi
TEIAS Turkish Electricity Transmission Corporation
Türkiye Elektrik İşleri Anonim Şirketi
TEK Turkish Electricity Authority Türkiye Elektrik Kurumu TETAS Turkish Electricity Trading and
Contracting Co.Inc. Türkiye Elektrik Ticaret ve Taahhüt A.Ş.
TKI Turkish Coal Enterprises Türkiye Kömür İşletmeleri TTK Turkish Hardcoal Authority Türkiye Taşkömürü Kurumu

The Study on Optimal Power Generation for Peak Demand in Turkey
1
Chapter 1 Introduction
1.1 Background of the Study The Turkish government has shown a power development scenario in which the power consumption
and the maximum power demand will annually increase by 7 % on average by 2015. Given such a steep increase in the demand and the generation capacity, number of construction plans, etc., it is projected that the country would be unable to cope with the peak demand by 2015. In line with such an increase in the power demand, the peak demand will also increase. Therefore, it is urgently required to carefully study an appropriate method for providing sufficient electricity during peak hours in the future.
For the supply of electricity during peak hours, pumped storage power generation is considered as the most appropriate method since it is capable of raising the output in short time and allows the surplus electricity during off-peak hours to be utilized if a certain level of base power source is secured. Pumped storage power generation requires advanced technologies not only in construction but also for operation due to its particularity. However, the Turkish government has no experience in constructing or operating a pumped storage power plant (PSPP). The Turkish government has a plan to proceed with PSPP development until around 2015, and has requested the Japanese government to provide support for their PSPP development since 2006.
1.2 Purpose of the Study and Implementation Details 1.2.1 Purpose of the Study
The purpose of the Study is to conduct the following operations in accordance with the designated schedule:
Formulate an optimal power development plan designed to meet the peak demand growth (from 2010 to 2030).
Review the development plan of pumped storage power projects (herein after referred to PSPPs) as a peak power supplier, which the Turkish side is currently studying.
Transfer the technologies related to the above study to the counterpart.
1.2.2 Implementation Details (TOR)
This Study is made of roughly three operation elements. Summaries of the individual operation elements are shown in the following:
(1) Basic Investigation The related data for analyzing the current status and the future planning of the electricity supply
system in Turkey will be collected and analyzed. The power demand forecast method and the electricity system development planning conducted by the current implementing agencies will also be reviewed, and areas to be improved will be proposed as appropriate.
(2) Case Study of Possible Plans for Peak Power Sources to Meet the Peak Demand Growth (Including PSPP)
Pumped storage generation candidate sites which are independently investigated or extracted by the Turkish-side counterpart will be reviewed, while desk research will also be conducted by the Study Team to select development candidate sites. Priority projects will be ranked among all development candidate sites selected by the both parties, and concept designing including studies in Turkey for the extracted and optimal pumping sites will be made. Proposal will be made on investigation contents regarding the development possibility to support a future independent study to be conducted by the Turkish side.

The Study on Optimal Power Generation for Peak Demand in Turkey
2
(3) Studying an Optimal Power Development Plan to Meet the Peak Demand Based on the results from the two operation elements as described above, the optimal development
size of measures will be proposed, such as by setting a long-term power development scenario taking into consideration the electricity supply during peak hours.

The Study on Optimal Power Generation for Peak Demand in Turkey
3
Chapter 2 Energy Sector and Electricity Sector
2.1 Energy Sector
2.1.1 Energy Policy
The Turkish government published the ninth national development plan (2007-2013) (hereinafter “the NDP”) and laid out the basic policy and visions for development with strong growth, fair redistribution of income, and strengthening of international competitiveness to shift to an information-oriented society and complete assimilation into the EU society. The target for the energy sector in the NDP is to supply the required energy stably for Turkey’s economical growth at minimum cost through the diversification of fuel and its suppliers and the reduction of public expenditures by privatization of the national generating and distribution companies. Environmental consideration for the limitation of environmental impact in the energy development is also mentioned in NDP
The Turkish government also published quarterly and annual action plans for the NDP, and the focus
in energy sector for 2010 is on the energy security through diversification of the fuel portfolio. Since Turkey presently depends on imported natural gas for nearly half of its fuel for electric power generation, Turkey will face problems of uncontrolled electricity costs and the increase of payment in foreign currency in the future. To improve the situation, Turkey gives priority to energy security and makes decisions on active utilization of the renewable energy and domestic primary energy (lignite) resources, and the development of nuclear power. For the utilization of renewable energy, the “Law on utilization of Renewable Energy Resources for the Purpose of generating Electrical Energy (law no. 5346)” became effective and electricity generation from wind and geothermal increased by 70% in the last year (2009). The Turkish government also recently made an agreement with the Russian government regarding the construction of a 4800 MW nuclear power plant and its PPA.
The policy and action plan for the power sector is announced with specific numerical targets, in
“Electricity Energy Market and Supply Security Strategy Paper” by the State Planning Organization, which is the revised paper of “Electricity Sector Reform and Privatization Strategy Paper” published in 2004. Numerical targets for the best mix of fuel portfolio and utilization of domestic fuel in the strategy paper are as follows: It is targeted for the share of nuclear power plants in electricity energy to increase up to at least 5%
by the year 2020. To realize that, it is planned to install nuclear power stations, total capacity of 5000 MW, by 2020, and Akkuyu/Mersin are mentioned as the candidate sites.
Target of the share of renewable resources in electricity energy is to increase up to at least 30% by 2023. Especially, the installed capacity of wind energy power is targeted to increase to 20,000 MW, which is a half of the present total installed capacity in Turkey.
Through measures for utilization of domestic and renewable resources, the share of natural gas in electricity generation will be reduced to below 30%.
Proven lignite deposits and hard coal resources will be put to use by 2023 in electricity energy generation activities. To that end, efforts will continue for making good use of exploitable domestic lignite and hard coal fields in electricity generation projects.
Power plants based on high-quality imported coal will also be made use of, taking into consideration supply security and developments in utilization of such resources.
The Study on Optimal Power Generation for Peak Demand in Turkey
4
2.2 Electricity Sector
2.2.1 Institutional Arrangement and Sector Overview
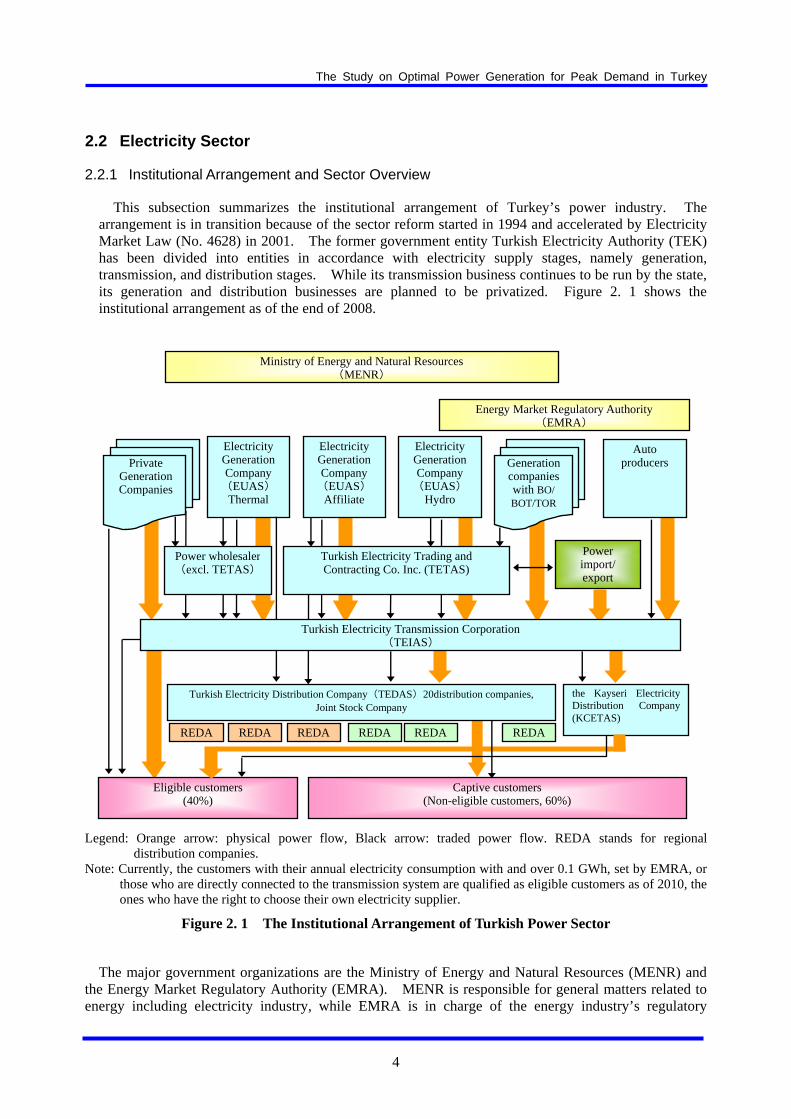
This subsection summarizes the institutional arrangement of Turkey’s power industry. The arrangement is in transition because of the sector reform started in 1994 and accelerated by Electricity Market Law (No. 4628) in 2001. The former government entity Turkish Electricity Authority (TEK) has been divided into entities in accordance with electricity supply stages, namely generation, transmission, and distribution stages. While its transmission business continues to be run by the state, its generation and distribution businesses are planned to be privatized. Figure 2. 1 shows the institutional arrangement as of the end of 2008.
Legend: Orange arrow: physical power flow, Black arrow: traded power flow. REDA stands for regional
distribution companies. Note: Currently, the customers with their annual electricity consumption with and over 0.1 GWh, set by EMRA, or
those who are directly connected to the transmission system are qualified as eligible customers as of 2010, the ones who have the right to choose their own electricity supplier.
Figure 2. 1 The Institutional Arrangement of Turkish Power Sector
The major government organizations are the Ministry of Energy and Natural Resources (MENR) and
the Energy Market Regulatory Authority (EMRA). MENR is responsible for general matters related to energy including electricity industry, while EMRA is in charge of the energy industry’s regulatory
Ministry of Energy and Natural Resources(MENR)
Energy Market Regulatory Authority (EMRA)
Captive customers(Non-eligible customers, 60%)
Eligible customers(40%)
Power import/ export
Turkish Electricity Distribution Company(TEDAS)20distribution companies, Joint Stock Company
Private Generation Companies
Electricity Generation Company (EUAS)
Thermal
Electricity Generation Company (EUAS)
Affiliate
Generation companies with BO/ BOT/TOR
REDA REDA REDA
the Kayseri Electricity Distribution Company (KCETAS)
REDA REDA REDA
Auto producers
Electricity Generation Company (EUAS)
Hydro
Turkish Electricity Transmission Corporation(TEIAS)
Power wholesaler (excl. TETAS)
Turkish Electricity Trading andContracting Co. Inc. (TETAS)

The Study on Optimal Power Generation for Peak Demand in Turkey
5
matters. EMRA issues six types of licenses for electricity business: generation, transmission, distribution, wholesale, retail, and auto production (generation of electricity for own needs).
For the power business entities, transmission business is operated by the state-owned monopoly Turkish Electricity Transmission Corporation (TEIAS), while generation market is a liberalized competitive market. TEIAS owns assets related to electricity transmission activities. National Load Dispatch Center and Market Financial Settlement Center (MFSC) are created within TEIAS’ organization. MFSC is the market operator and is planned to be independent from TEIAS in future.
Electric Generation Company (EUAS), the state generation company, owns and operates publicly owned hydropower plants (HPPs) and thermal power plants (TPPs). The company is supposed not to develop new power plants, except the case required due to electricity supply security.
The unique state-owned company is TETAS (Turkish Electricity Trading and Contracting Co. Inc.). The company is established to carry out wholesale activities specifically with generators constructed under the build-operate (BO) and build-operate-transfer (BOT) models and those operated under the transfer of operating rights (TOOR) model. The company has taken over the power purchase contracts by public with the above-mentioned generators. TETAS also purchases electricity from EUAS and sells the electricity to the state distribution company, Turkish Electricity Distribution Company (TEDAS), through a purchase agreement. Besides the above main role, TETAS deals with electricity trading business with neighboring countries, which is allowed under the wholesale license. Further, in accordance with the MENR’s energy policies to decrease the dependency on foreign energy resources for electricity generation, TETAS has been assigned the duty to purchase electricity generated by the nuclear power plants and by the lignite-fueled Afsin C and D power plants.
Distribution business is operated by 21 regional monopolies. Currently most of them are under a joint-stock company, TEDAS, a state-owned enterprise, while the others are privatized. With the government’s plan, all the distribution companies are to be privatized under TOOR scheme. Around 40% of electricity retail market is deregulated. The customers with annual electricity consumption over 0.1 GWh are qualified as eligible customers (as of June 2010). By 2012, customers except residential customers are planned to be deregulated. During the transition period between 2006 and 2010 (recently extended to 2012), the distribution companies need to purchase 85% of electricity for non-eligible customers from TETAS and EUAS. After the transition period, the distribution companies will be able to select sources to procure electricity. Table 2. 1 and Figure 2. 2 summarize the liberalization progress of Turkish electricity industry.
Table 2. 1 Liberalization Progress of Turkish Electricity Industry
1970 The establishment of TEK (Turkish electricity Authority), which was a publicly owned and vertically integrated statutory monopoly
1984 1st movement of market liberalization with the Law No: 3096 (Transfer of Operating Rights). The private sector participation to the power market has been permitted. 2 different laws, Law No: 3996 (Build Operate-Transfer) in 1994 and Law No: 4283 (Build Own Operate) in 1997, followed the law.
1994 TEK was divided into two state-owned enterprises; Turkish Electricity Generation-Transmission Corporation (TEAS¸) and Turkish Electricity Distribution Company (TEDAS).
2001 2nd movement: With the Law No:4628; Electricity Market Law, liberalization was initiated. TEAS was unbundled into three companies responsible for different sub-sectors, namely EÜAS (generation), TEIAS¸ (transmission) and TETAS¸ (wholesale). Around 30 % of the electricity retail market has been open to competition. An independent regulatory body, EMRA, has been established.
2004 “The Strategy Paper concerning Electricity Market Reform & Privatization” has been issued: State-owned distribution companies and generation companies are to be privatized by

The Study on Optimal Power Generation for Peak Demand in Turkey
6
2012. Privatization Administration is in charge of privatization activities.
Privatization of distribution sector is to start in 2005. Privatization of generation sector is to start in 2006.
2006 The Balancing & Settlement System started. The Market Financial Settlement Center (MFSC or PMUM) by TEIAS
2009 Day Ahead Market and Privatization of Distribution started. The strategy paper of 2004 has been updated as “Electricity Energy Market and Supply Security Strategy Paper.”
Souce: Developed by the Study Team based on the following materials: the website of Privatization Administration; “Energy Policies of IEA Countries: Turkey 2005 Review” by IEA; and “Privatization of Turkey’s Electricity Distribution Industry” Privatization Administration, Mar. 2009)
Note: The privatization of EUAS’ plants would result in its market share decrease from 60% to 20% in terms of installed capacity.
Figure 2. 2 Step of Liberalization
TEK
1994 2001
TEDAŞ
TEAŞ TETAŞ
TEİAŞ
EÜAŞ
TEDA
Distribution
Vertically Integrated
Generation、 Transmission &
Trade
Trade
1970
Transmission
Generation
Distribution

The Study on Optimal Power Generation for Peak Demand in Turkey
7
2.2.2 Role of Key Entities
(1) The formulation of power development plan
a. Overview
Similar to “System Adequacy Forecast” of ENTSO-E, the European grid organization, TEIAS annually develops Turkey’s 10-Year generation capacity projection. The projection does not necessarily secure future power supply.
Electricity demand forecast to be used in the projection is supposed to be prepared by distribution companies, though the forecast is still prepared by the Ministry of Energy and Natural Resources (MENR) due to the transitional period.
For the existing generation system, TEIAS obtains data mainly from EUAS, TETAS, and EMRA. EMRA collects the data of private power companies, including their construction plans. For the newly developed generation system, the data are obtained mainly from DSI (State Hydraulic Works) in addition to the above entities. Figure 2. 3 shows the formulation process of power development planning in Turkey.
Source: 10-year Generation Capacity Projection: 2009-2018, TEIAS
Figure 2. 3 Formulation Process of Power Development Planning
Energy Market Regulatory Authority(EMRA)
Electric Generation Company (EUAS) Private power
generation companies
Auto-producers
Turkish Electricity Transmission Co.(TEIAS)
Draft: capacity projection List of applicants
Application: plant construction plan
Approval
Turkish Electricity Transmission Co.(TEIAS)
Turkish Electricity Distribution Company(TEDAS) 20distribution companies,
the Kayseri Electricity Distribution Company (KCETAS)
Demand forecast
Announcement: Demand forecast (Oct.1st every year)
(Law on Demand forecast)
State Planning Organization (SPO)
National policy
development
General Directorate of Electric Power Resources Survey and Development Administration (EIE)
Ministry of Energy and Natural Resources(MENR)

The Study on Optimal Power Generation for Peak Demand in Turkey
8
(2) Power plant development In accordance with the national liberalization policy, public sector organizations such as EUAS,
DSI, and EIE do not have a future plan to construct a new large-scale hydropower plant except in an emergency case. Only hydropower plants with installed capacity of less than 100 MW are planned, mainly led by EIE. Investors from private sector who are interested in power plant development are to submit their applications to EMRA. It is not allowed to develop power plants with schemes such as Build, Operate (BO)/Build, Operate, Transfer (BOT)/Transfer of Operating Right (TOOR) any longer.
Source: Developed by the Study Team based on the interview with EMRA and TEIAS
Figure 2. 4 Application Process of Power Plant Development
The maximum construction period is not clearly stated in existing law and regulation, though
standard construction period is described in a relevant document of Electricity Market Licensing Regulation’s Article 10. According to the document “Reference periods of regarding the completion of the generation plant (Board Decree 1855/20.11.2008),” the standard preparation period prior to construction period for coal-fired thermal power plants (including lignite) and reservoir-type hydropower plants is 24 months, while that for other type of plants is 16 months.
The period of construction itself varies by fuel type and the installed unit’s capacity. For example, in case of thermal power plants with combined-cycle system, the standard construction period is 32 months for plants with installed capacity of less than 50 MW, while the period is extended to 48 months for those with capacity of more than 500 MW. In case of reservoir-type hydropower plants, the period is 36 months for plants with its reservoir capacity of less than 1,000,000 m3, while the period is extended to 66 months for those with the capacity of over 10,000,000 m3. Likewise, in the case of wind power generation, the construction period is 16 months for plants of installed capacity of less than 10 MW, while the period is extended to 40 months for those of over 100 MW. The total period from license issuance to the commission of the plant is the sum of the preparation period and the construction period. In principle, if licensees fail to keep the standard period, their license will expire unless EMRA Board accepts the excuses for the extension.
Energy Market Regulatory Authority (EMRA)
Generationcompanies
Application
License Fuel Supply agreement
Fuel supply firms: - BOTAS, - TKI, - TTK, and etc.

The Study on Optimal Power Generation for Peak Demand in Turkey
9
Chapter 3 Review of Long-term Demand/Supply Plan
3.1 Current status of Power Demand Forecast Demand forecast is made by the Ministry of Energy and Natural Resources, ETKB, by using the
Energy & Power Evaluation Program (ENPEP), Model for Analysis of Energy Demand (MAED) module, and Balance module.
MAED makes the assumption of overall energy demand based on the growth rates of population and industrial sectors as well as the development scenario on the socioeconomic and technological fronts, and then calculates the future power demand. However, at the moment, there is a huge margin of error even in population surveys. Therefore, the forecast is not necessarily reliable. There is a plan to develop a new demand forecast software with support of the United States, in which conditions such as energy savings will be incorporated. The results of such demand forecasts are made public in the “Turkish Electrical Energy 10-Year Generation Capacity Projection” jointly issued by ETKB and TEIAS.
Source: Model for Analysis of Energy Demand (MAED-2) User’s Manual, IAEA, 2006
Figure 3. 1 Input and Output of MAED
The APK, Research Planning and Coordination Division of TEIAS, used to make simulations of power
development plans by using WASP modules based on the demand forecast calculated by MAED. However, since the enactment of Electricity Market Law No. 4628 (regulation 4628), it has become difficult for TEIAS to gather necessary information. Therefore, since 2003, plans as to by whom, when, and where power plants using what fuel will be built have become difficult to grasp.
Therefore, the current “Capacity Projection 2009-2018” was compiled based on the power generation plan on plants under construction or with license granted, but it is not possible to analyze the necessary development capacity volume or optimal power sources composition based on appropriate supply reliability. As for network facilities such as transmission lines (mainly 380 kV), new construction plans are projected based on the past trend. It is considered that such a situation will not be a bottleneck as there is some reserve capacity for the time being.
On the other hand, among distribution companies which are required to make demand forecast in recent years, TEDAS makes forecast on both macro and micro levels by using demand forecast software developed by a consulting firm, McKenzie. At present, however, since some of statistical data which must be input are unavailable and there are frequent changes in contracts with eligible consumers, making forecast remains quite difficult.
Below is the content of demand forecast described in the “Capacity Projection 2009-2018” issued in June, 2009. Although demand forecast is supposed to be made up to 10 years ahead by the local power distribution companies according to the above-mentioned regulation 4628, since it is not available at present, high demand and low demand forecast made by ETKB are used.
The demand forecast was made by ETKB in May 2008, and “high demand” was projected via DPT (SPO). It is based on contribution by agriculture, construction, mining, manufacturing, energy, and service sectors on the GDP growth rate, while the “low demand” is based on the assumed 4.5% GDP growth of 2009 and after.
MAED Input ・ Energy sector data ・ Scenario assumptions (Socio-economic,
Technological) ・ Substitutable energy uses ・ Load characteristics
Output ・ Energy demand ・ Electricity demand ・ Hourly electric load ・ Load duration curves

The Study on Optimal Power Generation for Peak Demand in Turkey
10
Table 3. 1 Growth Rates in High Demand and Low Demand Cases
Period Growth Rate in High Demand Case (%)
Growth Rate in Low Demand Case (%)
2000-2005 4.6 4.6 2005-2010 5.8 5.3 2010-2015 5.5 4.5 2015-2030 5.5 4.5
Source: Turkish Electrical Energy 10-year Generation Capacity Projection (2008-2017), Turkish Electricity Transmission Corporation, Research Planning and Coordination Department, July 2008
Source: Turkish Electrical Energy 10-year Generation Capacity Projection
(2009-2018), TEIAS, June 2009
Figure 3. 2 Load Forecast in High Demand and Low Demand Cases
Although the growth rate up to 2011 was revised downward, it is expected to make steady growth
afterwards. Even in the low-demand scenario, the growth level of the high 6% range is expected from 2012 onward.
As of May 2009, according to the forecast made by ETKB, demand was forecast at 499 TWh in the high-demand scenario (7.5% growth) and 406 TWh in the low-demand scenario (5.96% growth). If it is extrapolated to 2020, the figures are projected at around 410 TWh and 380 TWh, respectively.
In the next section, development plans for generation facilities based on these forecasts will be evaluated.

The Study on Optimal Power Generation for Peak Demand in Turkey
11
3.2 Current Power Development Plan and Its Review
3.2.1 Power Development Plan Liberalized Electricity Market
This subsection describes the current power development plan in Turkish liberalized electricity market. Figure 3. 3 shows the map of electricity-related entities.
NOTE: MFSC: Market Financial Settlement Center
(1) Figures in parentheses stand for the annual amount of electricity traded in fiscal year 2008. (2) TETAS deals with power trading with neighboring countries.
(Source: Developed by the Study Team based on interview with relevant entities; “Turkish Electricity Market Structure” Navitas Enerji. 2009; “Capacity projection 2009-2018” TEIAS; and “TEIAS 2008 Annual Report” TEIAS.)
Figure 3. 3 Image of Electricity Flow among Entities
After the privatization of EUAS’ portfolio power plants as well as affiliate plants, the market share of
EUAS would decrease from the current 60% to around 20% in terms of installed capacity.
(1) The formulation of power development plan of Turkey; the measure to secure power supply. The latest Turkish power development plan is the one developed by TEIAS in 2004 employing
power development simulation software, WASP (Wien Automatic System Planning). Since then, the plan has not been updated due to difficulty in collecting necessary information for TEIAS. As reference, the government’s national energy policy has been updated since 2004, for example, delay in the nuclear power plant development and increase in the installed capacity of wind power generation.
The following explains the details.
(a) Demand forecast and power development planning before 2004. MENR’s Energy Affairs Department had conducted the energy demand forecast employing a
Bilateral contract
TEDAS Kayseri
Autoproducer EUAS-Hydro EUAS-affiliate EUAS-Portfolio
Private generation Co.
BO, BOT, TOR Generation co.
TETAS (wholesaler)
(60 TWh) (24 TWh) (23 TWh) (46 TWh) (24 TWh) (15 TWh) 29 % 13 % 10% 27% 12% 8%
PUBLIC: 50%
Eligible customers Non-eligible customers
(192 TWh)
(162 TWh)
(24 TWh)
Via MFSC (the balance & settlement market)
TEIAS
PRIVATE: 50% PRIVATE: 50%

The Study on Optimal Power Generation for Peak Demand in Turkey
12
software, MAED (Model for Analysis of the Energy Demand), until 2003. TEIAS had conducted its power development planning employing WASP, based on the demand forecast result led by MENR. The situation has changed since 2001, the year of the enactment of Electricity Market Law (no. 4628). It has become harder for the TEIAS to force generation companies to provide their power development plans, which has resulted in uncertainty in the national power development plan. That is, it has become harder for TEIAS to know by whom, when, where, and with what type of fuel power plants would be developed.
(b) Demand forecast and power development planning after 2004
Electricity demand forecast to be used in the TEIAS’ 10-year capacity projection is supposed to be prepared by distribution companies, though the forecast is updated by the Ministry of Energy and Natural Resources (MENR) due to the transitional period.
Most of the newly added power plants have been/will be constructed by private generation companies which obtained licenses from EMRA. Private investors who plan the power plant development are to submit their application to the EMRA, which is the market regulatory authority. The issue is that the majority of the development plans have uncertainty. For example, EMRA issues one and a half times as many licenses as that necessary for the estimated supply capacity. Furthermore, it is not certain whether the plans would be commissioned as scheduled. Such a situation might be attributed to the fact that EMRA would not take responsibility for power supply security, while the authority issues the power development licenses.
The current administration system where EMRA issues power generation licenses enables TEIAS to forecast the national power development plan only for the next 5-6 years. Due to such reasons, the Turkish national long-term (10-20 years ahead) power development plan, which tries to secure supply capacity so as to meet the forecasted demand, has not been updated since 2004. Besides the fact, no one is sure that even the power plants planned to be commissioned in the next 5-6 years would really be commissioned. Therefore, TEIAS, the owner of the national grid, cannot help expanding the grid based on a rough estimate. Such investment seems inefficient because the investment could turn out to be unnecessary if the actual power development comes out to be largely different from the initial estimate. TEIAS has made efforts to avoid such inefficiency as well as future supply shortages by closely communicating with relevant entities like MENR to obtain up-to-date information.
(c) Issue: power supply security Under the current environment, it is not realistic to place the full responsibility of electricity
supply security to TEIAS only. A similar story also applies to BOTAS (Petroleum Pipeline Corporation) in the gas sector. While EUAS is to construct power plants in an emergency case – supply shortage – such a potential crisis has been avoided since the start of the liberalization program in 2001.
Different from US and Western European countries, whose demand growth has slowed down, Turkey’s electricity demand is expected to grow to be twice as large as the current demand in capacity in the next 20 years. Under such circumstances, some concerns remain: (1) whether additional supply capacity of 40 GW would be fully fulfilled in the Turkish liberalized market and (2) whether a balanced mixture of generation fuel would be achieved from fuel supply security points of view.
For the first concern, in theory of market principle, if there is demand (or electricity trading price increases), the corresponding amount of supply would be provided (or new entrants would participate in the generation market). Its consequence could, however, be the outflow of industry which consumes large amount of electricity out of Turkey, leading to slowdown of the nation’s economic growth. The Turkish government’s ninth development plan also raises the issue of expensive domestic electricity retail tariff, which is higher than that of the average among OECD countries.
For the second concern, in a completely liberalized market without government’s intervention,

The Study on Optimal Power Generation for Peak Demand in Turkey
13
market participants generally tend to pursue short-term profit. One of the typical consequences is the choice of an economically competitive fuel – currently natural gas. It is not preferred in terms of national energy security to depend on single type of fuel, as historically shown, e.g. skyrocketing energy price during the oil crisis in 1970s in Japan. The Turkish government aims to avoid such a crisis, setting its goal in their policy to reduce the share of natural gas-fired power generation from the current 50% to less than 30% by 2023, and to increase the share of nuclear power generation to at least 5%. The government’s involvement would be one of the key factors to secure energy supply for sustainable economic development; at the same time, it is also important that the involvement does not sacrifice the power companies’ financial independence.
(2) The role of “Turkish Electrical Energy 10-Year Generation Capacity Projection”
TEIAS develops national power generation capacity projection annually under the above-mentioned
circumstances. As mentioned earlier, the capacity projection only aggregates information from the market participants such as EUAS, TETAS, and EMRA. EMRA collects the data of private power companies, including the construction plans. For a newly developed generation system, the data are obtained mainly from DSI (State Hydraulic Works) in addition to the above entities. The projection covers the development plan of power plants under construction of those with licenses obtained from EMRA. What makes TEIAS’ projection development challenging is the fact that plants which obtained licenses do not always keep their commissioning schedule as expected. To summarize, the projection does not necessarily secure future supply amount to meet the forecasted demand. The latest capacity projection (2009-2018) was also developed under the circumstance where power generation plan is uncertain, and it does not show the power development plan meeting the demand fully.
(3) Future Power Development Planning and National Policy (including nuclear and renewable energy) The national energy policy has been described in Section 2.1.1. EMRA plays a screening role,
easing the development of renewable energy (RE) power plants, while restricting that of gas-fired thermal power plants. Investors make a decision whether to enter the generation market with signal from MFSC.
3.3 Current Status and Evaluation of System Planning TEIAS establishes the criteria of transmission system, which show the preconditions for power
network system planning and the technical requirements for power stations and power consumers to realize these preconditions.
These criteria determine the following items regarding the power network system planning: Methodology of power network system configuration
To make plans so as to keep the adequate capacities of power transmission lines and transformers even when a single circuit or a transformer is removed from the system (the N-1 fault occurs) while all the thermal and hydropower stations are fully operated.
Main specifications of power system facilities
Descriptions of the main specifications are as follows: maximum number of the feeders connected to substations, bus configurations, numbers
and capacities of transformers, neutral grounding, voltage regulators, installation of high-voltage to medium-voltage transformers, connections of loads, connections of transformers, 380 kV series capacitors, capacities of shunt capacitors and reactors, conductors, phase twisting, voltage steps, load levels of distribution lines, basic specifications of generators such as power factor, types of protection relays, high-speed single-phase reclosing method, etc.
The Study on Optimal Power Generation for Peak Demand in Turkey
14
target power frequency level target voltage level power factor of generators fault clearing time: 380 kV – 120 ms, 154 kV – 140 ms fault current level: 380 kV – 50kA, 154 kV – 31.5 kA
The requirements for main specifications of generators, their control system, and the facilities of
power consumers to be connected to the grids are determined as follows:
Power generator control system The specifications of the governors have to be reported to TEIAS when they are
commissioned or modified. The main specifications of the governor, auto voltage regulator, and power system stabilizer (PSS) have to be described in the connection agreement between TEIAS and the power station company.
Frequency control The power generation unit designated as the secondary frequency control unit has to be
equipped with facilities to treat the signals sent from the central dispatching center. The functions or the specifications of the governors to take roles in the primary and the
secondary frequency control have to obey the standards adopted for UCTE in consideration with the international connections.
The modifications of the specifications that would affect the power network system have to be made under the technical supervision of TEIAS. The specifications of the protection system installed by the network users have to obey the
standards regarding the power supply reliability and its quality and the connection agreement between TEIAS and the power station company.
Power factors of power consumers and power generators have to be kept in the range of the predetermined levels.
TEIAS may request for countermeasures for the sub-synchronous resonance of power generators. TEIAS may do load shedding by under-frequency relays.
According to these criteria, the power network plans have to be made so as to keep the adequate
capacities of power transmission lines and transformers even when the N-1 fault occurs while all the thermal and hydropower stations are fully operated. However, the power system model obtained from TEIAS contains the power generation units that are not fully operated as previously mentioned.
Some power stations are not clearly planned such as IPPs. There is some uncertainty about the power network system planning that is several years away.
TEIAS will start to make the plans of the transmission lines required for the nuclear power stations located in the southern region, the Sinop nuclear power plant located in the Black Sea area, and the thermal power stations to reflect the power network system plans that will be established in 2012-2013. However, there are no specific plans of these power transmission lines as yet.

The Study on Optimal Power Generation for Peak Demand in Turkey
15
3.4 Current Status of Power System Operation
3.4.1 Overview of Power Market
Power transactions in Turkey can take two forms: based on a bilateral contract and through the power trading market. Transactions based on a bilateral contract, which is mainly a contract between a power generation company and distribution company/customers, account for over 80% of the total trading. TEIAS, a state-owned transmission company, owns and operates transmission systems while operating the power trading market via Market Financial Settlement Center, PMUM. Transactions through it account for about 20% of the total. In a sense that prices are determined by bilateral contracts or on the market, both types of transactions are made in liberalized markets.
Bilateral contracts are made between EUAS and a distribution company, between power plants built on BO, BOT, or TOR and TETAS, between TETAS and a distribution company, between a private power producer (IPP) and a private distribution company and eligible consumers, etc. TETAS is a power trading company which purchases power from generation companies privatized by BO, BOT, or TOR schemes or from the state-owned EUAS, and sells power to distribution companies such as TEDAS. Its transactions account for 45% of the entire power market. Auto producers can sell up to 5% of their generated power to others in addition to supplying to their own facilities.
The criterion for eligible consumer is those who consume 100 MWh or higher in a year. (The figure is revised in January every year. It was previously 480 MWh.) Although it is possible to choose to not to be an eligible consumer, potentially nearly 60% of power users are now eligible. In the energy strategy formulated by SPO in 2009 as well, the plan was set to encompass all consumers to be eligible except for household consumers by 2012. Household consumers are also scheduled to be eligible by 2015.
Under the policy of distribution business privatization officially decided in 2004, 20 distribution companies out of 21 distribution districts in Turkey were reorganized under TEDAS by March 2005, while the remaining one was an originally private distribution company in Kayseri district. By August 2010, tender was announced for all distribution companies with some exceptions, and the operation rights for five companies were transferred by September 2010. Privatization is conducted by transferring operation rights for the determined period (TOR method), while the ownership of its asset is retained by TEDAS and the exclusive operation right for distribution and electricity sales in the district is approved by EPDK. It is planned that the distribution license and the electricity sales license are divided by 2013 and the retail market of electricity will be deregulated.
At present, due to regulation 4628, 15 distribution companies under TEDAS must purchase 85% of power consumption of non-eligible consumers from power plants, in which there is a specified composition (6 portfolios) of TETAS and EUAS, and 15% from the power trading market. Therefore, TEDAS contracts with EUAS and TETAS as a representative of its 15 distribution companies to make up 85% of the total. In the beginning, regulation 4628 was supposed to be enforced for five years from 2004, but a 2-year extension was decided upon in 2008 to last until 2012.
TETAS must purchase power at prices decided upon in contracts with power generation companies built by BO, BOT, or TOR schemes before the liberalization in 2001, which are rather high prices. Therefore, TETAS strikes a good balance by buying power from hydropower plants in transition period contract with EUAS (which are not immediately subject to privatization but are to be privatized after the transition period). Recently, prices from the power trading market are getting higher than these prices.
On the other hand, key players of the power trading market are independent power producers, or IPPs, and distribution companies. At present, distribution companies under TEDAS are not allowed to contract with IPPs, while private distribution companies can be supplied by IPPs via TETAS. However, prices at which TETAS purchases power shall not exceed the upper limit set by EMRA, so currently IPPs can sell at higher prices through the power trading market. Consequently, IPPs did not bid for the tender offered by TETAS. Therefore, from the viewpoint of energy security, under a new regulation, IPPs are required to make bilateral contracts as much as possible. In the Baskent Distribution Company, the distribution company for Central Anatolia around Ankara and its operation right was transferred to the Sabanci Group, one of the two big business groups in Turkey, the source of power purchase has not
The Study on Optimal Power Generation for Peak Demand in Turkey
16
changed since before privatization, and is the determined portfolio of TETAS and EUAS, at the time of August 2010.
The power trading market started on August 1, 2006. At the outset, trading was made on a daily basis. Then, in order to more accurately strike a good balance between supply and demand, hourly based transactions started on December 1, 2009. The hourly based transactions are comprised of the Day Ahead Market operated by PMUM using PYS, and the Balancing Power Market (DGP) managed on the current day by the NLDC. Prices are posted on the PMUM system.
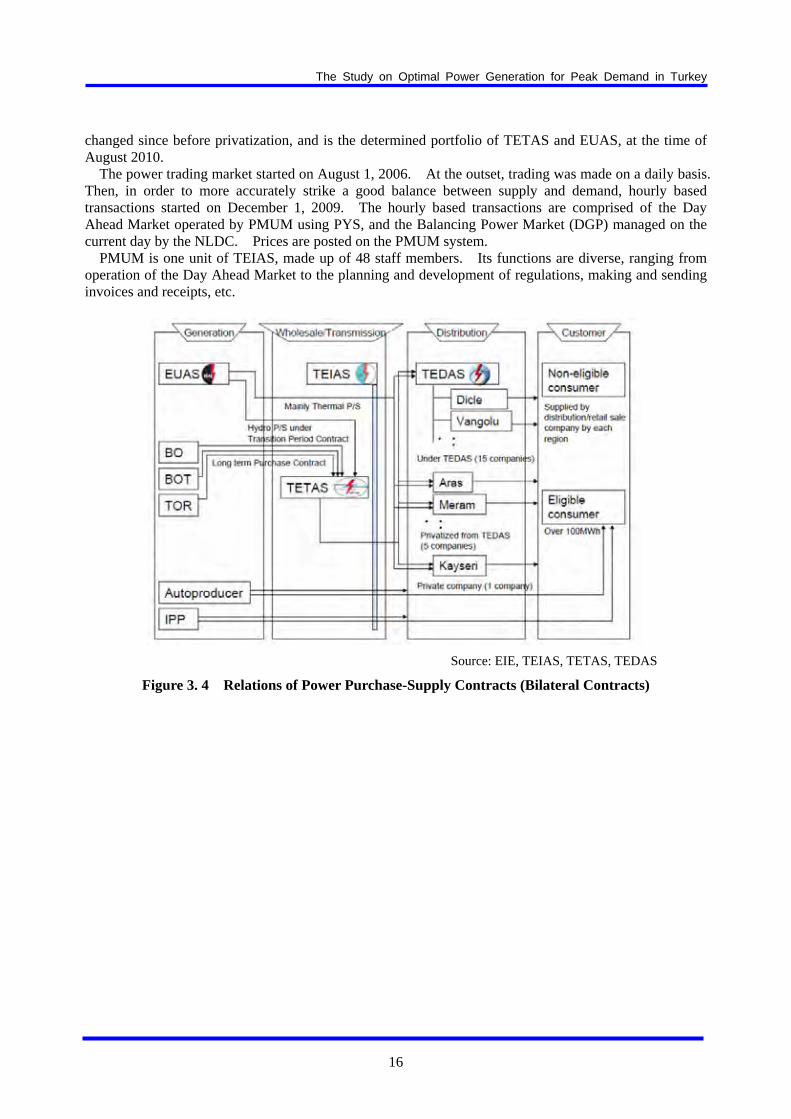
PMUM is one unit of TEIAS, made up of 48 staff members. Its functions are diverse, ranging from operation of the Day Ahead Market to the planning and development of regulations, making and sending invoices and receipts, etc.
Source: EIE, TEIAS, TETAS, TEDAS
Figure 3. 4 Relations of Power Purchase-Supply Contracts (Bilateral Contracts)

The Study on Optimal Power Generation for Peak Demand in Turkey
17
Chapter 4 Optimal Power Generation for Peak Demand 4.1 Economic Comparison among Various Power Sources through Screening
A generating cost for each availability factor is calculated based on construction cost (fixed cost) and fuel cost (variable cost) of various power sources, and then which power source is optimal as each of base, middle and peak supply capacities are examined.
(1) Unit construction cost
Unit construction costs for various power sources provided from EIE are as in Table 4. 1.
Table 4. 1 Unit Construction Cost
Unit construction costs
provided by EIE Natural gas-fired thermal 650 – 750 USD/kW Lignite thermal 1,600 USD/kW Import-coal fired thermal 1,450 – 1,700 USD/kW Hydro (run-of-river type & reservoir type) 1,200 – 1,500 USD/kW Nuclear 1,800 – 2,700 USD/kW
By reference to the above-described values, standard unit construction costs for various powers used
for calculating the costs in the base case have been set as in Table 4. 2.
Table 4. 2 Standard Unit Construction Cost
Values in the base case Natural gas-fired thermal (C/C) 700 USD/kW Natural gas-fired thermal (GT) 500 USD/kW Oil-fired thermal (ST) 800 USD/kW Oil-fired thermal (GT) 500 USD/kW Lignite-fired thermal 1,600 USD/kW Import-coal fired thermal 1,600 USD/kW Hydro (run-of-river type & reservoir type) 1,400 USD/kW Pumped Storage Power Plant 700 USD/kW Nuclear 2,400 USD/kW
(2) Annual fixed cost The annual fixed costs are calculated as shown in Table 4. 3 based on the unit construction costs
described above. Generally speaking, the annual fixed costs differ depending on the depreciation methods, and are the highest just after the start of operation rather than being constant every year. In this case, equalized costs by lifetime are shown assuming that the interest rate is 10%. Note that the calculations were made assuming that the lifetimes for generation facilities are 40 years for hydro facilities where civil engineering facilities account for a large proportion, and 20 years for thermal and nuclear facilities, respectively.

The Study on Optimal Power Generation for Peak Demand in Turkey
18
Table 4. 3 Annual Fixed Cost
Annual expense rate (%)
Unit construction
cost (USD/kW)
Interest rate, depreciation
O&M costs Total
Annual expense
(USD/kW/year)
Natural gas-fired thermal (C/C) 700 11.75 4.5 16.25% 113.8Natural gas-fired thermal (GT) 500 11.75 5.0 16.75% 83.8Oil-fired thermal (ST) 800 11.75 2.5 14.25% 114.0Lignite thermal 1,600 11.75 3.5 15.25% 244.0Import-coal fired thermal 1,600 11.75 3.5 15.25% 244.0Conventional hydro 1,400 10.23 0.5 10.73% 150.2Pumped Storage Power Plant 700 10.23 1.0 11.23% 78.6Nuclear 2,400 11.75 3.0 14.75% 354.0
(3) Fuel cost The fuel cost projection until 2030 published by IEA in 2009 has been used for the future fuel cost
projection. The projected prices are shown in Table 4. 4.
Table 4. 4 IEA Projection
2008 2015 2020 2025 2030 Oil USD/bbl 97.19 86.67 100.00 107.50 115.00 Gas USD/Mbtu 10.32 10.46 12.10 13.09 14.02 Coal USD/tonne 120.59 91.05 104.16 107.12 109.40
Fuel costs in standard power plants in 2020 are calculated based on the price projection, as shown in
Table 4. 5.
Table 4. 5 Fuel Cost
IEA forecast (2020) Fuel price
(USC/kcal)Efficiency
Fuel cost (USC/kWh)
Oil ST 100.0 USD/bbl 9,600 kcal/kg 7.3 38% 16.5Oil GT Ditto Ditto Ditto 29% 21.6Gas C/C 12.10 USD/Mbtu 4.0 kcal/Btu 4.8 55% 7.5 Gas GT Ditto Ditto Ditto 29% 14.2Coal ST 104.16 USD/tonne 6,000 kcal/kg 1.7 41% 3.6
(4) Generating cost Standard generating costs for various power sources in 2020 are calculated as shown in Figure 4. 1
based on the above-described projections of the unit construction costs and fuel costs. Note that the fuel cost for PSPP is based on the assumption that water is pumped by coal-fired thermal power and pumping efficiency is 70%. In addition, the fuel cost for nuclear power plants has been assumed to be 1 USC/kWh.

The Study on Optimal Power Generation for Peak Demand in Turkey
19
Figure 4. 1 Generating Cost
In the base supply capacity region (i.e., the range where the availability factor is 70% or more), nuclear and coal-fired thermal plants with lower fuel unit prices are economically advantageous. In the middle supply capacity region (where the availability factor is 30-60%), conventional hydro is the most excellent. This is because conventional hydro is developed preferentially in sites where the cost is lower than other power sources and economic efficiency is obtained when the availability factor is 40-50% (operation time: approx. 4,000 hours).
Details of the generating costs for the peak supply capacity (i.e., the range where the availability factor is up to 20%) are as shown in Figure 4. 2.
Figure 4. 2 Generating Cost (for peak supply)
The generating cost is as high as 30 cent/kWh in any facility when the availability factor is 4%. In the case where the unit construction cost for PSPP is 700USD/kW, the generating cost of PSPP is the lowest for peak supply capacity. In the case where the unit construction cost of PSPP exceeds 800USD/kW, the generating cost of gas GT is lower than that of PSPP when the availability factor is very low (with the availability factor being 2% or less).
0
10
20
30
40
0% 20% 40% 60% 80% 100%Capacity factor
Hydro PSPP Gas CC Gas GTCoal Nuclear Oil ST Oil GT
(Cent/kWh)
0
20
40
60
80
0% 2% 4% 6% 8% 10% 12% 14%Capacity factor
PSPP (800) PSPP (600) Gas CCGas GT Oil ST Oil GT

The Study on Optimal Power Generation for Peak Demand in Turkey
20
0
20000
40000
60000
80000
100000
2005 2010 2015 2020 2025 2030
Actual result High demand High (extend)
Low demand Low (extend)
(MW)
4.2 Formulation of Data for Demand and Supply Operation Simulation
Data for PDPAT II was formulated for implementing demand and supply operation simulation by using PDPAT II.
4.2.1 Demand Forecast
(1) Future demand forecast in the capacity projection formulated by TEIAS The future demand forecast in the 10-Year Generation Capacity Projection (2009–2018) formulated
by TEIAS (until 2018) is as shown in Figure 3. 2. According to this projection, it is assumed that the future annual load factors will remain unchanged
from the actual result of 74.1% in 2009 both for high demand and low demand. This means that the demand shape will hardly change.
(2) Peak demand forecast in 2019 and thereafter
No values published by authoritative institutions have been found regarding the demand forecast in 2019 and thereafter.
The values forecasted by the Study Team for 2019 and thereafter are shown in Figure 4. 3, expressed as extended straight lines by reference to the increase tendency until 2018 in TEIAS’s projection. Since the lines are extended linearly, the rate of increase is forecasted to gradually decrease.
Formulated by the Study Team by reference to TEIAS’s forecast values
Figure 4. 3 Demand Forecast until 2030
Based on this forecast, the peak load in 2030 will be approx. 80,000 MW (80 GW) for a low-demand case. The base case demand in this study is forecasted to reach the demand size of 80 GW in entire Turkey around 2030. Accordingly, the study for 2030 will be conducted for the demand size of 80 GW. Note that in a high-demand case, where the demand increases at a faster rate than forecast, the result of the study will be for about 2025, which is earlier than 2030.

The Study on Optimal Power Generation for Peak Demand in Turkey
21
4.2.2 Current Status and Future Prospects for Peak Demand
In the demand forecast in the capacity projection formulated by TEIAS, it is forecasted that the annual load factor would be constant and the demand shape would hardly change until 2018. However, it is commonly recognized among involved parties that promoted introduction of air conditioners has led to great increase in the demand, mainly in summer daytime, recently.
On the basis of such situations, change in the future peak demand shape has been estimated.
(1) Demand shape of the maximum demand occurrence day in summer The demand shape on the maximum demand occurrence days in summer from 2001 to 2009 is
shown in Figure 4. 4.
Formulated by the Study Team based on the data provided from TEIAS
Figure 4. 4 Demand Shape on Maximum Demand Occurrence Days in Summer
Based on this, the following could be said as the trend of recent demand shapes. (The increase rate herein refers to the increase for 7 years between 2001 and 2008.) The maximum demand occurrence time is shifting from 12:00 to 15:00. (The annual demand
increase rate at 15:00 is 8.0%, which is larger than the demand increase rate 7.5% at 12:00.) Lighting peak at around 20:00 and 21:00, the so-called evening lighting peak, has decreased.
(The annual demand increase rate at 21:00 is 6.7%, which is the lowest among all time zones.) The midnight load (minimum demand/maximum demand) has been gradually decreasing. (The
annual increase rate of the maximum demand is 8.0%, while the annual increase rate of the minimum demand is 6.9%.)
Demands when the maximum demand occurred (at 15:00) and when the minimum demand occurred
(at 7:00) in individual years from 2001 to 2008 are shown in Table 4. 6.
60%
70%
80%
90%
100%
0 6 12 18 24
2001 2002 2005 2007 2008 2009

The Study on Optimal Power Generation for Peak Demand in Turkey
22
Table 4. 6 Transition of Maximum Daily Demand and Minimum Daily Demand
Average increase 2001 2002 2003 2004 2005 2006 2007 2008
(MW) (%) Maximum 17,839 18,427 19,680 21,484 23,457 25,945 27,962 30,482 1,806 8.0Minimum 12,876 13,280 13,991 14,934 16,079 17,650 19,569 20,511 1,091 6.9
Formulated by the Study Team based on the data provided from TEIAS Though the maximum demand has been increasing annually by 1,806 MW on average, the minimum
demand has been increasing annually by only 1,091 MW (60.4% of the maximum demand increase). If the increase tendency from 2001 to 2008 is assumed to continue until 2030 for all time zones, the demand shapes shown in Figure 4. 5 can be forecasted for 2020 (with the demand size of 56 GW) and 2030 (with the demand size of 80 GW).
Formulated by the Study Team based on the data provided from TEIAS
Figure 4. 5 Demand Shape Forecasts in 2020 and 2030
60%
70%
80%
90%
100%
0 6 12 18 24
2002 2009 2020 2030

The Study on Optimal Power Generation for Peak Demand in Turkey
23
4.3 Study of Appropriate Reserve Capacity Rate Based on Supply Reliability
The relationship between loss of load expectation (LOLE) and the supply reserve capacity rate was obtained taking into consideration the facility composition forecast around 2020 (with the demand size of approx. 56 GW), and the appropriate reserve capacity rate was determined for the determined supply reliability criteria (LOLE value).
(1) Relationship between LOLE and supply reserve capacity rate
The relationship between LOLE and the supply reserve capacity rate determined based on the inputted data as described above is shown in Figure 4. 6.
Figure 4. 6 Relationship between LOLE and Supply Reserve Capacity Rate
In the data inputted to WASP used in the TEIAS’ study when establishing the long-term planning in 2004, the criteria of the supply reliability was set to be 2% in the LOLP value, which corresponds to 175 hours per year if the level is converted to an LOLE value. Accordingly, it is read from the above-described graph that only approx. 4% have to be secured for the supply reserve capacity rate. In the study in 2004, the electricity price when the supply capacity is not sufficient is set to be 1 USD/kWh.
When referring to examples in other countries, approx. 24 hours in LOLE value is targeted as the
supply reliability criterion in Thailand and Vietnam as well. Given the economic situation in Turkey at this moment, damage to economic activities because of a power failure that occurs due to insufficient supply capacity would be large and the electricity price when supply capacity is insufficient would become 1 USD/kWh or more. Accordingly, 24 hours or less should be targeted in the LOLE value.
When the above-described viewpoint is taken into consideration, approx. 9% would be needed as the supply reserve capacity rate.
As a result of the study described above, the future study in this investigation should aim at securing
the supply reserve capacity rate of 8-10% as the supply reliability level.
0
50
100
150
200
0% 2% 4% 6% 8% 10% 12% 14% 16%
Reserve capacity rate
LO
LE
(H
ours
)

The Study on Optimal Power Generation for Peak Demand in Turkey
24
4.4 Possibility of Introduction of Various Power Supplies as Peak Supply Capacity
Large-scale reservoir type hydro power stations such as Keban, Karakaya, and Ataturk are currently
operating to meet the peek demand in Turkey. Appropriate power generations are needed in future because the demand is expected to increase at around 7 % per year. In this section, possible power generations that are under necessity to meet the peak demand in future are evaluated.
4.4.1 Evaluation of Various Power Generations for Peak Demand
(1) Characteristics of various power supplies for peak demand Possible power generations to meet the peak demand are PSPP, expansion of existing reservoir-type
hydro, development of new reservoir-type hydro, development of low load factor thermal (such as GT), and electricity purchasing from other countries. The characteristics of individual power generations are shown in Table 4. 7. Note that all below power plants have the feature as a power generation for peak demand, in common, that operation at the maximum output is possible within a short period (within 5 minutes) of the operation being activated.
Table 4. 7 Characteristics of Various Power Generations for Peak Demand
Advantages Disadvantages
PSPP
Fixed cost is low. Frequency adjustment is possible
also at night. (in the case of variable speed units)
There are many sites where large-scale (1,000 MW or more) development is possible.
Operable time is restricted within the pondage volume.
Motive power for pumping is needed.
Expansion of existing reservoir type hydro
Fuel cost is not needed. There is possibility that increase in
generating energy is expected.
Fixed cost is high. Use of conventional hydro may be
restricted due to decrease in water level during the construction work period
Development of new reservoir type hydro
Fuel cost is not needed. Generating energy is greatly
increased.
Fixed cost is high. (It is higher than expansion of conventional reservoir type hydro.)
Large-scale economic sites have already been developed.
Gas turbine (GT)
Operation is always possible. The fixed cost is low.
Fuel cost is high.
Electricity purchasing from other countries
Special generation facility is not needed. (Demand can be met only by interconnected transmission lines.)
Available amounts and prices are influenced by the partner country.
(2) Verification of advantages of reservoir-type hydro
Rough estimation was made on the unit construction costs for expansion of existing reservoir-type hydro and development of new reservoir-type hydro, which will create advantages as peak supply capacity over development of GT. (Refer to Section 4.1 for economical efficiency data.)

The Study on Optimal Power Generation for Peak Demand in Turkey
25
(a) Expansion of existing reservoir-type hydro Expansion of an existing reservoir-type hydro facility has a benefit of eliminating the need for
development of a gas turbine. However, this just changes the time and scale for operating existing power plants, and thus reduction effect in the fuel cost is hardly expected. Accordingly, expansion of the existing reservoir-type hydro facility will be considered to be economical, if the annual expense needed for expanding the existing reservoir-type hydro facility equals to or is less than the annual expense needed for canceling the development of a gas turbine. Based on the unit construction cost of a gas turbine, 500USD/kW, and its annual expense ratio, 16.75%, its annual expense should be 83.8 USD/kW/year. Since the lifetime of a conventional hydro is longer than that of a GT, the annual expense ratio of hydro is 10.73%, which is much lower than that of GT. Accordingly, the break-even unit construction cost should be 780 USD /kW.
(83.8 USD/kW/year/10.73% = approx. 780 USD/kW)
(b) Development of new reservoir-type hydro A case where a reservoir-type hydro facility of 500 MW is to be newly developed is assumed.
The annual availability factor is assumed to be 10%. In this case the annual generating energy should increase by 438 GWh (500 MW × 8,760 hours × 10%).
In addition to the reduction effect of the fixed cost obtained by canceling the development of a GT, it is possible to reduce the fuel cost corresponding to the annual generating energy. GT and CC are thought to be the thermal power plants for which combustion can be reduced by the development of a new reservoir-type HPP. If it is assumed that generation of these can be reduced half, the average unit price should be 10.8 USC/kWh based on the fuel unit prices 14.2 USC/kWh for GT and 7.5 USC/kWh for CC. Given the effect of reduction in the fuel cost, the break-even unit construction cost should be 1,660 USD/kW. (Approx. 780 USD/kW + 10.8 USC/kWh × 438 GWh/10.73%/500 MW = approx. 1,660 USD/kW)
When the annual availability factor of a newly developed reservoir-type is large, the reduction of
fuel cost is expected to be high. Thus, the break-even unit construction cost will be gradually higher and assumed to be 2,540 USD/kW and 3,430 USD/kW when the annual availability factor is 20 % and 30 %, respectively.

The Study on Optimal Power Generation for Peak Demand in Turkey
26
4.4.2 Feasibility of Expansion of Existing Reservoir-Type Hydropower Plant as a Peak Supplier
(1) Development of peak supply capacity by expansion of existing hydropower plants Keban and Karakaya hydropower plants are currently operated as a middle supplier. Therefore,
there is high possibility that Keban and Karakaya hydropower plants are expanded in order to meet the drastic increase of peak power demand in the future.
In consideration of expansion work of hydropower plants, the Study Team will examine change of water operation in line with expansion of hydropower plants in the same river system by reservoir operation simulation, and study comparative layouts of expansion plans such as location of intake, cofferdam, power station, and waterway route based on the existing topographical map of 1/25,000 on the desk. Then, the Study Team will execute a site survey to investigate geographical and geological conditions as well as environmental conditions.
Based on the site survey results, the Study Team will review the expansion plan, estimate the project cost of several scales of expansion plan, and select the optimal scale of expansion plan.
(a) Results of site survey and assessment
The Study Team identified that there are no social and environmental issues for both extension alternatives and the extension alternative on the left bank is more likely than that on the right bank because it has fewer geological issues.
After the site survey, the latest topographical map of 1:25,000 was provided from EIE. Then, the Study Team revised the layout of the extension alternative on the left bank, taking into consideration the location of the existing dam, the power facilities, and topographical conditions. The revised layout is shown in Figure 4. 7.
Figure 4. 7 Layout of Extension Plan of Keban HES
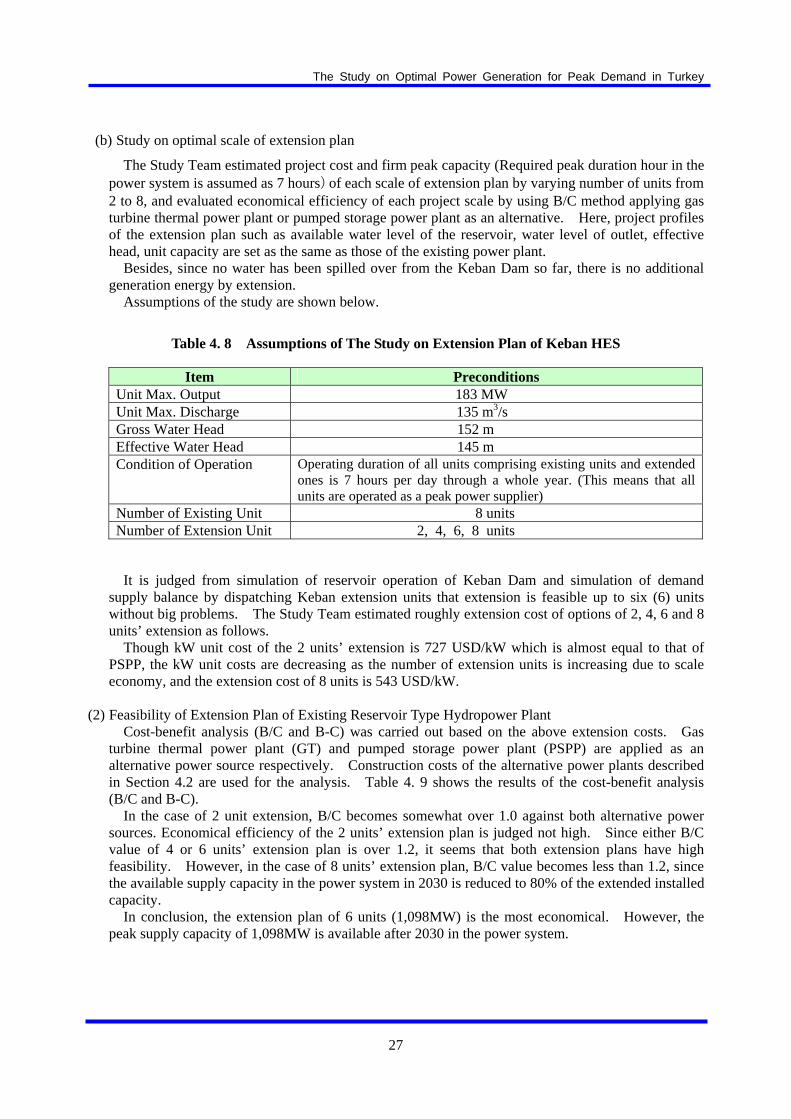
The Study on Optimal Power Generation for Peak Demand in Turkey
27
(b) Study on optimal scale of extension plan
The Study Team estimated project cost and firm peak capacity (Required peak duration hour in the power system is assumed as 7 hours)of each scale of extension plan by varying number of units from 2 to 8, and evaluated economical efficiency of each project scale by using B/C method applying gas turbine thermal power plant or pumped storage power plant as an alternative. Here, project profiles of the extension plan such as available water level of the reservoir, water level of outlet, effective head, unit capacity are set as the same as those of the existing power plant.
Besides, since no water has been spilled over from the Keban Dam so far, there is no additional generation energy by extension.
Assumptions of the study are shown below.
Table 4. 8 Assumptions of The Study on Extension Plan of Keban HES
Item Preconditions Unit Max. Output 183 MW Unit Max. Discharge 135 m3/s Gross Water Head 152 m Effective Water Head 145 m Condition of Operation Operating duration of all units comprising existing units and extended
ones is 7 hours per day through a whole year. (This means that all units are operated as a peak power supplier)
Number of Existing Unit 8 units Number of Extension Unit 2, 4, 6, 8 units
It is judged from simulation of reservoir operation of Keban Dam and simulation of demand
supply balance by dispatching Keban extension units that extension is feasible up to six (6) units without big problems. The Study Team estimated roughly extension cost of options of 2, 4, 6 and 8 units’ extension as follows.
Though kW unit cost of the 2 units’ extension is 727 USD/kW which is almost equal to that of PSPP, the kW unit costs are decreasing as the number of extension units is increasing due to scale economy, and the extension cost of 8 units is 543 USD/kW.
(2) Feasibility of Extension Plan of Existing Reservoir Type Hydropower Plant
Cost-benefit analysis (B/C and B-C) was carried out based on the above extension costs. Gas turbine thermal power plant (GT) and pumped storage power plant (PSPP) are applied as an alternative power source respectively. Construction costs of the alternative power plants described in Section 4.2 are used for the analysis. Table 4. 9 shows the results of the cost-benefit analysis (B/C and B-C).
In the case of 2 unit extension, B/C becomes somewhat over 1.0 against both alternative power sources. Economical efficiency of the 2 units’ extension plan is judged not high. Since either B/C value of 4 or 6 units’ extension plan is over 1.2, it seems that both extension plans have high feasibility. However, in the case of 8 units’ extension plan, B/C value becomes less than 1.2, since the available supply capacity in the power system in 2030 is reduced to 80% of the extended installed capacity.
In conclusion, the extension plan of 6 units (1,098MW) is the most economical. However, the peak supply capacity of 1,098MW is available after 2030 in the power system.

The Study on Optimal Power Generation for Peak Demand in Turkey
28
Table 4. 9 Cost-benefit Analysis(B/C, B-C)
Figure 4. 8 Correlation between No. of Extension Unit & B/C or B-C
2 4 6 8366 732 1,098 1,464366 732 1,098 1,171727 604 563 543
B/C 1.07 1.29 1.39 1.15B-C (mil.USD) 2.1 13.9 25.6 12.8B/C 1.01 1.21 1.30 1.08B-C (mil.USD) 0.2 10.1 20.0 6.8
Number of Extension UnitsTotal Extension Capacity (MW)
Unit Costs (USD/kW)
AlternativePowerSource
Gas Turbine
PSPP
Supply Capacity (MW)
Altenative Power Plant : GT
0.90
1.00
1.10
1.20
1.30
1.40
1.50
0 2 4 6 8No. of Extension Units
B/C
0.0
5.0
10.0
15.0
20.0
25.0
30.0B
-C (
mil
.US
D)
B/CB-C (mil.USD)
Alternative Power Plant : PSPP
0.90
1.00
1.10
1.20
1.30
1.40
1.50
0 2 4 6 8
Number of Extension Units
B/C
0.0
5.0
10.0
15.0
20.0
25.0
30.0
B-C
(m
il.U
SD
)
B/CB-C (mil.USD)

The Study on Optimal Power Generation for Peak Demand in Turkey
29
4.4.3 Availability of Power Import from Neighboring Countries
There is a possibility that the supply reliability improvement and the reduction in fuel consumption are achieved in a Turkish system by interconnection with the ENTSO-E system. On the other hand, it is possible not to obtain those results, depending on the interconnection transmission line capacity restriction.
According to the information of ENTSO-E in 2008, Bulgaria, which was connected with Turkey’s system, had surplus power export balance of trade (5,324 GWh), Greece had had exceeding power import of balance of trade (5,706 GWh).
Table 4. 10 Power Trade between Greece and Bulgaria in 2008 Unit: GWh
Greece Bulgaria Country Import Export Country Import Export
Bulgaria 4,628 - Greece - 4,628 Macedonia 1,189 - Macedonia - 1,142 Italy 1,758 181 Romania 3,095 268 Turkey - 30 Yugoslavia 1 2,382 Albania - 1,658 - - -
Total 7,575 1,869 Total 3,096 8,420 The annual capacity rate of interconnection lines from Bulgaria and Macedonia to Greece is over 80%
and a congestion line. Therefore, the ability to obtain a necessary marginal supply capability in the Turkish system in peak periods depends on the congestion of interconnection lines during the peak demand period.

The Study on Optimal Power Generation for Peak Demand in Turkey
30
4.5 Study of Optimal Power Supply Configuration in 2030
First, the optimal configuration ratio of the peak supply capacity was studied in a system with a demand size of 80 GW, which is estimated to be reached around 2030. Next, out of the necessary peak supply capacities, the optimal development amount of PSPP was studied.
Note that if the demand increases more than what is forecasted, the study should be conducted for a time earlier than 2030, while if the demand increases less than what is forecasted, the study should be conducted for a time later than 2030.
4.5.1 Study of the Necessary Amount of Peak Supply Capacity
(1) Comparison between gas turbine plant and combined cycle plant The necessary amount of peak supply capacity was studied by comparing a gas turbine, which is
economical as peak supply capacity, and combined cycle, which is economical as middle supply capacity.
Economic specifications for both are shown in Table 4. 11. Note that though both use natural gas as fuel and the fuel prices are the same, the difference in efficiency is large, which causes a great difference in the fuel unit price.
Table 4. 11 Comparison in Economic Efficiency between Gas Turbine and Combined Cycle
Construction cost Annual fixed cost Fuel cost
Gas turbine (GT) 500 USD/kW 83.8 USD/kW/year 14.2 USC/kWh
Combined cycle (C/C) 700 USD/kW 113.8 USD/kW/year 7.5 USC/kWh Though GT with a lower unit construction cost than C/C has a lower annual fixed cost, its fuel unit
price will be higher due to poor efficiency. The calculation results are shown below. As the supply reliability level, an 8% of reserve supply
capacity against maximum demand shall be secured (LOLE values of 5-10 hours).
Figure 4. 9 Cost Comparison between Gas Turbine and Combined Cycle
-200-150-100-50
050
100150200
0 1000 2000 3000 4000 5000 6000
Gas turbine Capacity (MW)
Fixed cost Fuel cost Total(Million USD)
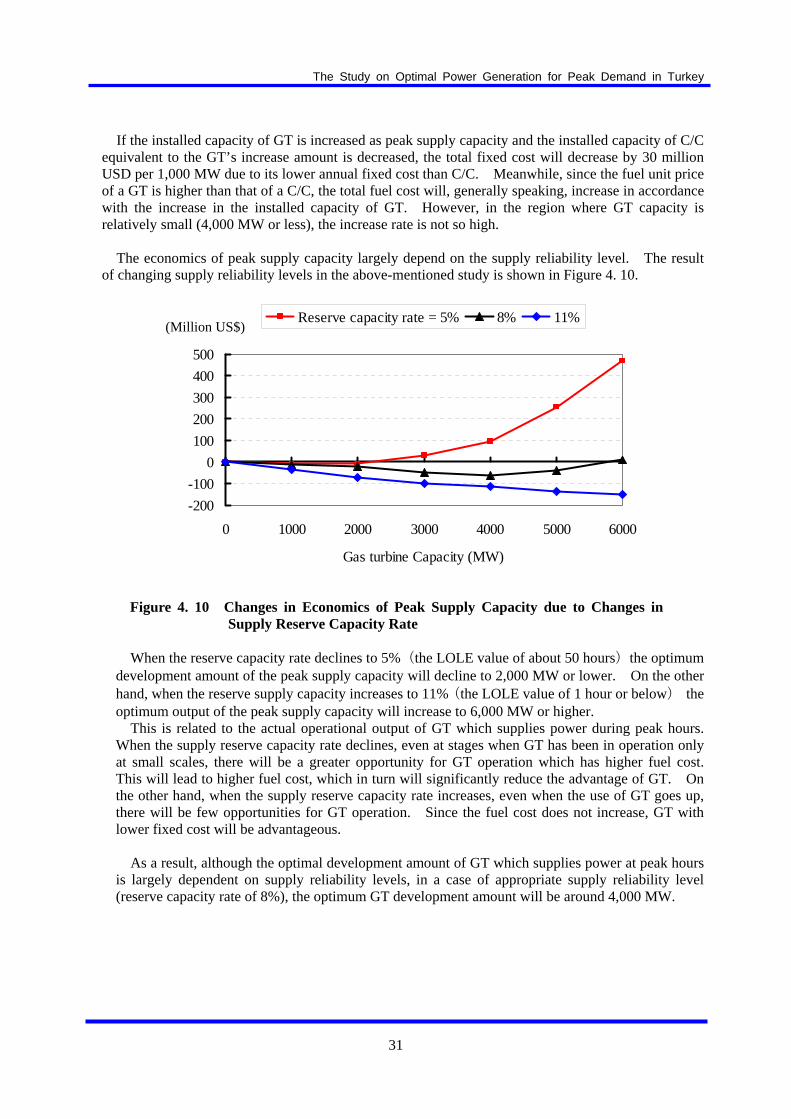
The Study on Optimal Power Generation for Peak Demand in Turkey
31
If the installed capacity of GT is increased as peak supply capacity and the installed capacity of C/C equivalent to the GT’s increase amount is decreased, the total fixed cost will decrease by 30 million USD per 1,000 MW due to its lower annual fixed cost than C/C. Meanwhile, since the fuel unit price of a GT is higher than that of a C/C, the total fuel cost will, generally speaking, increase in accordance with the increase in the installed capacity of GT. However, in the region where GT capacity is relatively small (4,000 MW or less), the increase rate is not so high.
The economics of peak supply capacity largely depend on the supply reliability level. The result
of changing supply reliability levels in the above-mentioned study is shown in Figure 4. 10.
Figure 4. 10 Changes in Economics of Peak Supply Capacity due to Changes in Supply Reserve Capacity Rate
When the reserve capacity rate declines to 5%(the LOLE value of about 50 hours)the optimum development amount of the peak supply capacity will decline to 2,000 MW or lower. On the other hand, when the reserve supply capacity increases to 11%(the LOLE value of 1 hour or below) the optimum output of the peak supply capacity will increase to 6,000 MW or higher.
This is related to the actual operational output of GT which supplies power during peak hours. When the supply reserve capacity rate declines, even at stages when GT has been in operation only at small scales, there will be a greater opportunity for GT operation which has higher fuel cost. This will lead to higher fuel cost, which in turn will significantly reduce the advantage of GT. On the other hand, when the supply reserve capacity rate increases, even when the use of GT goes up, there will be few opportunities for GT operation. Since the fuel cost does not increase, GT with lower fixed cost will be advantageous.
As a result, although the optimal development amount of GT which supplies power at peak hours is largely dependent on supply reliability levels, in a case of appropriate supply reliability level (reserve capacity rate of 8%), the optimum GT development amount will be around 4,000 MW.
-200
-100
0
100
200
300
400
500
0 1000 2000 3000 4000 5000 6000
Gas turbine Capacity (MW)
Reserve capacity rate = 5% 8% 11%(Million US$)

The Study on Optimal Power Generation for Peak Demand in Turkey
32
4.5.2 Study on Necessary Amount of Pumped Storage Power Plants (Study in the Base Case)
(1) Study on the pondage volume of PSPP Prior to the necessary amount of the PSPP, the optimal pondage volume for PSPP is studied.
Generally speaking, the unit of the pondage volume of a hydro (the effective pondage volume) is cubic meters (m3). However, the unit here is expressed by the time duration (hours) for which the operation of a PSPP at the maximum output can continue.
Generally speaking, if the pondage volume is to be increased, it is also necessary to increase the height of the dam as a matter of course. Accordingly, in the case where a large benefit is not expected, further expansion of the pondage volume would become inefficient due to its high construction cost.
The same amount of the development amount and the supply capacity are always expected for thermal power plants unless fuel supply is restricted. On the other hand, in case of hydro, the daily operable amount is restricted by the river inflow amount and the capacity of pond which regulates the inflow amount. (In the case of a PSPP, the operable amount is restricted by the capacity of the pond of the upstream dam since there is almost no river inflow amount to the dam.)
(a) Estimation in a realistic case
In the study in the previous paragraph, a case where there is no conventional hydro was estimated. In the actual system in Turkey, however, there are many conventional hydropower plants (HPPs). Since these conventional HPPs do not need fuel costs, it would be the most economical to accord conventional HPPs with top priority.
Most of the large-scale (50 MW or more) conventional HPPs in Turkey operate only in the daytime when the demand is large and stop operation during nighttime when the demand is small. In other words, currently, most of the demand peak areas can be supplied by conventional HPPs.
With the status as described above taken into consideration, the result applied to the demand is
shown in Figure 4. 11.
Figure 4. 11 Example of Dispatching of Conventional Hydro to Demand
When a conventional HPP is applied to the peak time zones of the demand, the post-application demand shape becomes very flat. While the peak shape remains only for 1 hour at 15:00 in August when the maximum demand is large, the shape becomes completely flat from 9:00 to 24:00 in May when the maximum demand is small.
The relationship between the installed capacity of the PSPP and the supply capacity of the PSPP in
August in a system in 2030 (with the demand size of 80 GW) is shown in Figure 4. 12.
0
20000
40000
60000
80000
1 7 13 19Time (hour)
Hydro
(MW)
After dispatching Hydro
May
0
20000
40000
60000
80000
1 7 13 19Time (hour)
Hydro
(MW)
After dispatching Hydro
August

The Study on Optimal Power Generation for Peak Demand in Turkey
33
Figure 4. 12 Relationship between Installed Capacity and Supply Capacity of PSPP
Estimation was made for three cases where the pondage volumes (in the unit of the number of hours) are 4 hours, 7 hours, and 10 hours, respectively. The result showed that the installed capacity is the same as the supply capacity in August in any case, as long as the installed capacity of PSPP is 1,500 MW or less. In the case where the installed capacity of PSPP is 1,800 MW, the installed capacity will be the same as the supply capacity if the pondage volume (in the unit of the number of hours) is 7 hours or more; however, the expected supply capacity will decrease if the pondage volume is only 4 hours. In the case where the installed capacity of PSPP is 2,100 MW or more, the installed capacity will not be the same as the supply capacity if the pondage volume is 7 hours or more; however, the difference is small between the cases when the pondage volume is 7 hours and when it is 10 hours.
(b) Conclusion
As studied above, though increase in the pondage volume to approx. 6-7 hours produces the effect of a corresponding increase in the supply capacity, increase to 7 hours or more does not produce a very large benefit. Therefore, when investment efficiency is taken into consideration, the pondage volume of 7 hours would be appropriate.
(2) Study on optimal necessary amount of PSPP
In the study in Section 4.5.1 , it was concluded that the additional development peak supply capacity in the amount of approx. 4,000 MW is needed by PSPP and gas turbines, in addition to by conventional hydro.
Here, which of PSPP and gas turbine (GT) is more economical as peak supply capacity was studied. Figure 4. 13 shows how the expense for the entire system changes when the development amount of PSPP is increased. The cost represents the difference between the actual case and the reference level under which no PSPP has been developed. Furthermore, by basically stopping the development of GT with the same capacity in response to the development of PSPP, the supply reserve capacity rates are maintained at a constant level (8%) in all cases.
1000
1500
2000
2500
3000
1000 1500 2000 2500 3000
PSPP Installed capacity (MW)
PSPP
Sup
ply
capa
city
4hrs 7hrs 10hrs(MW)

The Study on Optimal Power Generation for Peak Demand in Turkey
34
Figure 4. 13 Optimal Necessary Amount of PSPP
(a) Fixed cost When the development amount of PSPP is increased, the corresponding development amount of
GT will decrease. Since the annual fixed costs are 78.6 USD/kW/year for PSPP and 83.8 USD/kW/year for GT, respectively, the total annual fixed cost will gradually (5.2 million USD per 1,000 MW) decrease as the development amount of PSPP increases. This trend continues until the development amount of PSPP reaches 1,800 MW. However, if further development than 1,800 MW is implemented, the supply capacity will not become the same as the development amount. Accordingly, if the development amount of GT in the same amount as that of PSPP is decreased, it will cause insufficient supply capacity to maintain a certain supply reserve capacity rate. (The reason for this will be described later.) In order to maintain a certain supply reserve capacity rate, this situation needs be addressed by reducing the decrease in the development amount of GT which will be made possible by the development of PSPP, causing increase in the fixed cost. Specifically, in the case where the development amount of PSPP is 1,800 MW, it is possible to maintain a certain supply reserve capacity rate even if the development amount of GT decreases by an equal amount, 1,800 MW. However, in the case where the development amount of PSPP is 2,100 MW, it is necessary to suppress the decrease in the development amount of GT to 1,967 MW in order to maintain a certain supply reserve capacity rate.
Meanwhile, the fuel cost decreases as the development amount of PSPP increases. This is because the introduction of PSPP promotes effective utilization of less-expensive power for pumping at night. However, this trend continues only until the development amount of PSPP reaches approx. 600 MW, and even if the development amount of PSPP is further increased, the fuel cost will substantially remain unchanged.
In terms of the total expense of the fixed cost and the fuel cost, the total expense gradually decreases until the development amount of PSPP reaches 1,800 MW. However, if the development amount of PSPP is further increased, the entire expense will greatly increase due to dramatic increase in the fixed cost. In this way, it will be the most economical when the development amount of PSPP is 1,800 MW.
The reason the supply capacity does not match the development amount if development of 1,800
MW or more is implemented is thought to be as follows.
-30-20-10
01020
304050
0 500 1000 1500 2000 2500 3000
PSPP Capacity (MW)
Fixed cost Fuel cost Total
(Million USD)

The Study on Optimal Power Generation for Peak Demand in Turkey
35
A picture of dispatching of PSPP to the demand when 2,100 MW of PSPP is developed is shown in Figure 4. 14.
Figure 4. 14 Image Picture of Dispatching PSPP to Demand
The demand shape after application of conventional hydro is flat from 9:00 to 24:00 except at 15:00. Accordingly, when the development amount of PSPP is increased, the time period when the demand should be met by PSPP will increase to 16 hours. On the contrary, since the PSPP has the pondage volume only equivalent to 7 hours at the maximum output operation, it is not possible for the facilities to operate at the maximum output for the entire time period to be addressed, requiring the operation while suppressing the output.
(b) Fuel cost
The fuel cost will decline as the development amount of PSPP increases. This is because excess power generated during nighttime can be effectively used to power pumping. Although the fuel cost will steadily go down until the development amount of PSPP of around 600 MW, even if the development amount is raised further, no further reduction in fuel cost can be expected, thus remaining flat.
(c) Overall evaluation
In terms of fixed and fuel costs combined, they will gradually decline until the development amount of 1,800 MW of PSPP. However, when the development amount of PSPP is increased, because of the significant incremental fixed cost, the overall costs will significantly go up as well. Furthermore, these costs include the supply incapable cost in a case of supply impossible.
On the environmental front, the development of PSPPs will enable efficient operation of thermal power plants, thus allowing the reduction in CO2 emissions.
In the overall evaluation by taking into account the economical and environmental fronts, out of 4,000 MW of the optimal installed capacity at peak period, the development amount of 1,800 MW of PSPPs is optimal.
45000
50000
55000
60000
65000
1 7 13 19Time (hour)
PSPP (G)
(MW) August
PSPP (P)
The Study on Optimal Power Generation for Peak Demand in Turkey
36
4.5.3 Risk Assessment
Advantages of PSPP are largely influenced by external factors such as secured reserve supply capacity, daily demand curve profile, plant composition, and fuel prices. On the other hand, construction of a PSPP takes a long time, and it takes more than 10 years from decision making on development till the start of the operation. Therefore, if the situation dramatically changes, there is a risk that most of the intended advantages may disappear.
These external factors are associated as follows: Slow demand growth and increased reserve supply capacity weaken the need of peak supply
capacity. Through active promotion of DSM and the like, demand profile does not become sharp and
supply capacity comparable to plant maximum capacity cannot be expected. Power plants expected to power pumping have not been developed. Active promotion of the development of reservoir-type power plants as peak supply capacity
(including expansion of existing hydropower plants) leads to the relative value of PSPP to decline.
Developers of PSPP need to take measures to avoid these risks when making development decisions. However, even with efforts by developers, these events cannot be avoided. Therefore, developers are forced to take measures to minimize potential losses associated with these events.
One of the measures includes the postponement of operation starting period in response to changing situation. If it is before starting full-scale construction work, financial burden will not be too great, causing small amount of losses. The ratio of civil engineering work in PSPP construction is high. After starting full-scale construction work, postponing the operation starting period would cause significant losses. If all of these risks have to be borne by developers, it is thought that developers are very unlikely to make decisions to develop PSPPs. Therefore, in promoting development of PSPPs, measures must be considered to ensure costs associated with the above-mentioned risks be evenly borne by beneficiaries. (Refer to Section 8.3.2 )
In thermal power plants as well, there is a risk that initially assumed benefits may reduce. For
following reasons, however, developers are more likely to make development decisions on them than for PSPPs:
Shorter duration from development decision making till operation starting period. Decline in benefits is not as extreme as with PSPPs. In cases of postponing the operation starting period, equipment can be sought to be transferred
to other locations. (The ratio of equipment is higher than for a PSPP.)

The Study on Optimal Power Generation for Peak Demand in Turkey
37
4.6 Power Optimal Plan for Peak Demand
(1) Comparison among multiple peaking power plants
(a) Comparison based on functionality In the study in the last section, the comparison was made about the only sum of fixed and
variable (fuel) costs by focusing on the economics. In other words, benefits deriving from the ability to provide ancillary service, which is one of the major features of various peaking power plants, are not incorporated. Whether ancillary service is available or not is a factor which has an important impact on the level of power quality. For Turkey, which is required to raise its power quality, it will be essential to appropriately evaluate the value of ancillary service.
The availability of various ancillary services for a variety of peaking power plants is described
below.
Table 4. 12 Ancillary Service of Various Peaking Power Plants
Frequency Control (Primary & Secondary reserve)
Peak period Off-peak period
Stand-by operation (Tertiary reserve)
Pumped storage power plant Possible
Possible via pumping operation(in a case of adopting variable-speed pump)
Possible
Reservoir type hydro Possible
Possible but very uneconomical during hours with low marginal cost
Possible
Gas turbine (GT) Possible
Possible but very uneconomical during hours with low marginal cost
Possible(slower than hydro)
Buying power from other countries
Possible Possible Possible
(dependent on other countries)
Combined (C/C)thermal
Possible by adding adjustment equipment, but need to lower output to operate and somewhat uneconomical.
Possible(slower than GT)
Ref
er
Coal-fired thermal
Possible by adding adjustment equipment, but need to lower output to operate and considerably uneconomical.
Impossible
Different peaking power plants have very similar ancillary functions, but only PSPP and system to buy power from other countries have frequency control function during off-peak periods. During off-peak period, if there are conditions under which conventional hydropower plants and combined-cycle thermal power plants can make frequency adjustments, the off-peak frequency adjustment functions that PSPPs have cannot be seen as greatly valuable. However, looking at the current status and future of Turkey, the country will face the following challenges, and system operators will likely to have considerable difficulty in adjusting frequencies during off-peak hours. This means frequency adjustment function during off-peak hours will be of high value.
Issues in power plants to supply frequency adjustment function
A majority of conventional hydropower plants of large and medium capacity (50 MW or larger) are shut down during off-peak hours.

The Study on Optimal Power Generation for Peak Demand in Turkey
38
Combined-cycle thermal power plants owned by private companies aim to operate at the maximum output as much as possible rather than making output adjustment.
Increasing needs of frequency adjustment
Large-scale introduction of wind turbines whose output largely fluctuate during short duration.
The introduction of nuclear power plants which constantly operate at the maximum output is planned.
(b) Conclusion
In terms of economics, what is thought to be the most economical combination is either <PSPP (1,800 MW), RH (600 MW), and GT (1,600 MW)> or <PSPP (1,800 MW), RH (0 MW), and GT (2,200 MW)>. However, that is largely influenced by the values of fixed cost. If a peaking power plant with low fixed cost emerges, it can be most economical to install the model for all of the locations.
On the other hand, in terms of functionality of peaking power plants, there are few differences in peak-time functions, whereas in terms of off-peak frequency adjustment function, PSPP is superior to other types of power plant. When this advantage is evaluated, it is judged that PSPP has an advantage enough to influence the economics. Therefore, even if the total economics of PSPP is somewhat inferior to some, overall, PSPP can be considered to have a higher value.
Based on the above-mentioned points, in areas where PSPP is expected to deliver supply capacity comparable to its installed capacity, it is considered the best to develop PSPP.

The Study on Optimal Power Generation for Peak Demand in Turkey
39
Chapter 5 Finding and Evaluation of PSPP Potential Sites
5.1 Preparation of Criteria for Finding of PSPP Candidate Sites
The criteria for project finding of pumped storage power plan were prepared, taking into consideration the following conditions and special circumstances of Turkey after discussion between C/P and the Study Team:
The criteria for finding pumped storage power projects in Turkey were determined as shown in Table 5. 1.
Table 5. 1 Criteria for Finding Potential Pumped Storage Project in Turkey
Item Consideration point Criteria
Generation plan
- Peak duration time - Installed capacity
- 7hrs - More than 500 MW
○ ○
Limit of manufacturing of Power facility
- Design head - K Value (Hpmax / Hgmin) - Max. utilizing water depth of
pond
- Less than 750m of maximum head - Less than the limit (1.25-1.4) - Less than 30m (40m in case of full
facing pond type)
○ ○ ○
Location / Layout
- Catchment area of Lower reservoir
- Crest length of Lower Dam - Dam height - Length of water way - Length / Head (L/H) - Overburden of underground
power cavern
- More than 50km2 - Less than 500m - Less than 200m - Less than 10km - Less than 10 - Less than 500m
○
○ ○ ○ ○ ○
Tec
hnic
al
Geological conditions
- Active fault (Quaternary fault) - Fault and fractured zone - Landslide area - Permeability of peripheral rock
of upper reservoir
- Elongation from active faults >10km - Avoid large-scaled fault and
fractured zone - Avoid large-scaled landslide area - Avoid lime stone / Quaternary
volcanic rock
● ●
● ●
Topographical conditions
- Demand center / pumping energy source
- Existing and planned power network
- Accessibility
- Near demand center / pumping energy source
- Near bulk power network (Substation)
- Good accessibility to the site
○
○
●
Natural
- Protected Area (e.g. Natural Parks)
- Endangered species
- Avoid important Protected Areas (Natural Parks, Nature Parks, and Ramsar Sites)
- Avoid the critical habitats of important fauna and flora
○
●
Env
iron
men
tal
Social - Mining right - Historical and Cultural heritage- Houses to be resettled
- Avoid the area of mining concession - Avoid being submerged - Less than 50
● ● ●
○: considered in primary project finding ●: necessary to confirm the situation by site survey

The Study on Optimal Power Generation for Peak Demand in Turkey
40
5.2 Map Study
(1) Finding and evaluation of PSPP potential sites
(a) Evaluation of PSPP potential sites selected by EIE
Eighteen pumped storage projects selected by EIE are screened from the viewpoints of the geological condition of elongation from the active faults and the environmental conditions of physical relationship between locations of potential sites and the national parks and other environmental protection areas (incl. Ramsar sites). In addition, the Study Team carried out map study for the screened projects and revised those project plans to meet the above-mentioned project-finding criteria.
As a result, 14 potential sites out of 18 pumped storage projects selected by EIE were excluded from the viewpoints of topographical and geological conditions and natural/social environmental conditions, and the Study Team revised the project plans of the remaining four potential sites, such as location of the upper reservoir, and selected them as the candidate sites.
(b) Finding and evaluation of new PSPP potential sites
The Study Team found 38 new potential sites by using the 1:25,000 topographical map.
1) Screening by geological criteria There are various types of active faults in this country. The North Anatolian Fault is the
biggest active fault in Turkey and the East Anatolian Fault is the second biggest. Figure 5. 1 shows all the PSPP potential sites plotted on the map of active faults. Since the 11
PSPP potential sites plotted by the black circle are located within an elongation less than 10 km from the active faults, those are excluded.
Figure 5. 1 Map of Active Faults and PSPP Potential Sites
(Source; MTA)
110
32 25 26
36
3539 38
28
27
24
3430
29 2
21
19
20
22
7 9
11
374
513
1415
161718
63
Ankara
Istanbul
Antalya
31
Kayseri
110
32 25 26
36
3539 38
28
27
24
3430
29 2
21
19
20
22
7 9
11
374
513
1415
161718
63
Ankara
Istanbul
Antalya
31
Kayseri
Legend
Vicinity of active fault
Environmental & Social Attention is required
Environmentally Important Sites(Located in national parks)
Legend
Vicinity of active fault
Environmental & Social Attention is required
Environmentally Important Sites(Located in national parks)
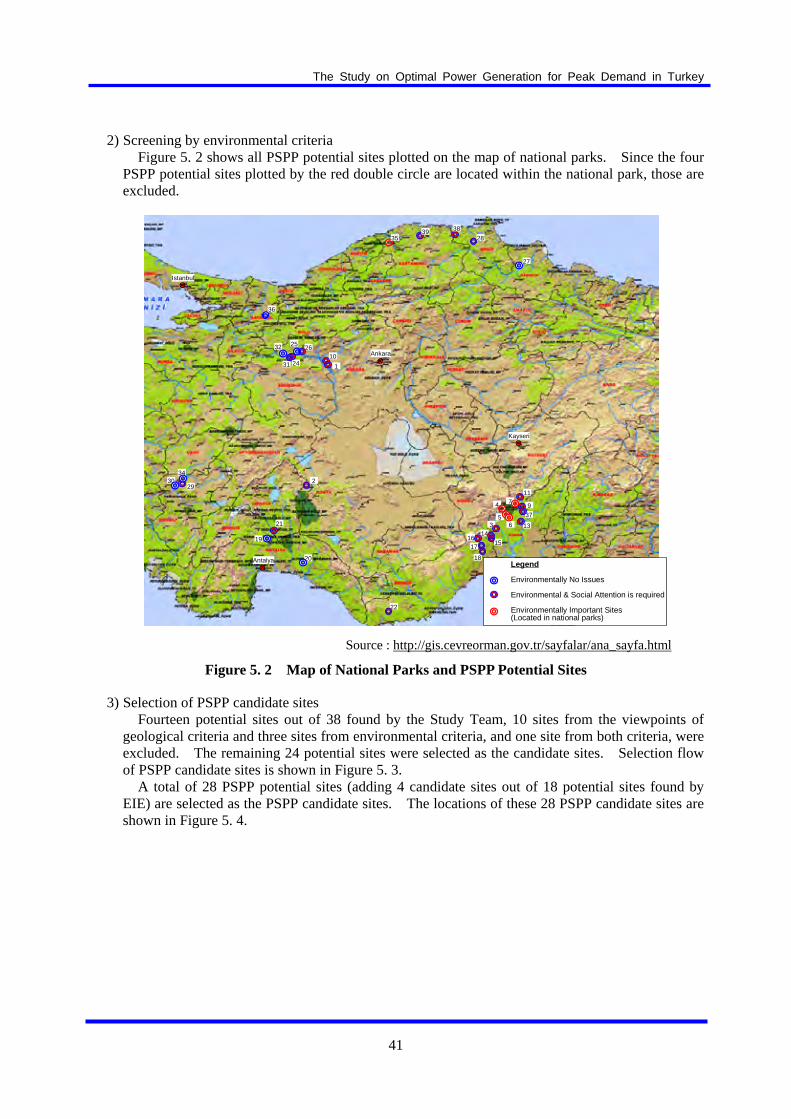
The Study on Optimal Power Generation for Peak Demand in Turkey
41
2) Screening by environmental criteria Figure 5. 2 shows all PSPP potential sites plotted on the map of national parks. Since the four
PSPP potential sites plotted by the red double circle are located within the national park, those are excluded.
Figure 5. 2 Map of National Parks and PSPP Potential Sites
3) Selection of PSPP candidate sites Fourteen potential sites out of 38 found by the Study Team, 10 sites from the viewpoints of
geological criteria and three sites from environmental criteria, and one site from both criteria, were excluded. The remaining 24 potential sites were selected as the candidate sites. Selection flow of PSPP candidate sites is shown in Figure 5. 3.
A total of 28 PSPP potential sites (adding 4 candidate sites out of 18 potential sites found by EIE) are selected as the PSPP candidate sites. The locations of these 28 PSPP candidate sites are shown in Figure 5. 4.
Source : http://gis.cevreorman.gov.tr/sayfalar/ana_sayfa.html
Legend
Environmentally No Issues
Environmental & Social Attention is required
Environmentally Important Sites(Located in national parks)
1
10
32 2526
36
3539 38
28
27
24
3430
292
21
19
20
22
79
11
37
4
513
14
151617
18
63
Ankara
Istanbul
Antalya
31
Kayseri

The Study on Optimal Power Generation for Peak Demand in Turkey
42
Figure 5. 3 Selection Flow of PSPP Candidate Sites
Figure 5. 4 Location of 28 PSPP Candidate Sites
Identification of criteria
18 Potential Sites by EIE
Review & Revise the Plans Based on the criteria
4 Candidate Sites selected
28 Potential Sites
Primary Prioritization of PSPP
38 New Potential Sites by JICA
24 Candidate Sites selected
Screening based on Environmental and Geological Criteria
Candidate sites

The Study on Optimal Power Generation for Peak Demand in Turkey
43
(2) Selection of candidate sites for site survey
The project profile and cost of 28 candidate sites of PSPP and results of primary prioritization are shown in Table 5. 2 .
Here, priority rank of ◎: Excellent, ○: Fairly Good, △: Good, and ×: Bad are applied. At last, 10 out of 13 candidate sites with priority of Excellent and Fairly Good are selected to be
surveyed in consultation with EIE counterparts. Locations of the 10 candidates selected for site survey are shown in Figure 5. 5.
Figure 5. 5 Location of Candidates for Site Survey
27-1
21-1
2431
2632-2
37-1
11-1, 11-2
19
27-1
21-1
2431
2632-2
37-1
11-1, 11-2
19Candidates for Site Survey

The Study on Optimal Power Generation for Peak Demand in Turkey
44
Tab
le 5
. 2
Lis
t of
can
did
ate
site
s of
PS
PP
L
atit
ude
Nor
thL
ongi
tude
Eas
tH
WL
(m)
LW
L(m
)
Dam Vol
.(1
06 m3 )
Act
ive
Cap
.(1
06 m3 )
HW
LL
WL
Dam Vol
.(1
06 m3 )
1A
nka
ra39
°56'
51"
31°4
6'
29"
1065
1045
1.63
(Exc
avat
ion
)6.
855
7.5
552.
6P
riva
te H
PP
roje
ct51
21.
113,
246
6.3
696
10▲
-No
stor
age
capa
city
for
PS
PP
in
th
e lo
w r
eser
voir
wh
ich
is
deve
lope
d by
Pri
vate
Co.
6A
dan
a37
°39'
31"
35°1
5'
43"
1580
1550
15.6
7.5
1125
1110
6.4
470
1.17
3,67
47.
888
730
×-L
arge
upp
er d
am a
nd
low
eco
nom
ic e
ffic
ien
cy
9K
ayse
ri37
°48'
30"
35°2
8'
08"
1380
1350
2.9
5.1
700
690
2.3
690
1.13
2,14
83.
170
430
○-C
onst
ruct
ion
of
alte
rnat
ive
publ
ic r
oad
arro
un
d L
ower
rese
rvoi
r w
ould
be
har
d.
10A
nka
ra39
°57'
47"
31°4
6'
35"
1000
980
1.7
7.0
510
500
2.2
500
1.13
3,84
67.
772
710
△-A
com
mu
nit
y ex
ists
on
th
e su
rfac
e of
UG
PH
11-1
Kay
seri
37°5
8'
08"
35°2
8'
23"
1650
1630
1.75
(Exc
avat
ion
)5.
810
6010
406.
561
01.
131,
613
2.6
709
30○
○-U
pper
res
ervo
ir :
Art
ific
ial
pon
d an
d fu
ll f
acin
g m
igh
t be
nee
ded
11-2
Kay
seri
37°5
7'
36"
35°2
8'
56"
1590
1560
2.5
6.3
1050
1030
5.1
560
1.16
2,15
03.
870
630
◎○
11-3
Kay
seri
37°5
8'
05"
35°3
0'
54"
1540
1520
5.2
(Exc
avat
ion
)7.
110
6010
406.
550
01.
151,
842
3.7
758
30△
-Upp
er r
eser
voir
: A
rtif
icia
l po
nd
and
full
fac
ing
mig
ht
ben
eede
d
19B
urd
ur
37°1
7'
42"
30°5
0'
15"
740
710
6.1
6.3
188
185
Exi
stin
g55
51.
132,
349
4.2
695
30◎
○
20A
nta
lya
36°5
5'
43"
31°3
4'
46"
910
890
1.2
4.7
184
166
Exi
stin
g74
41.
122,
456
3.3
646
20△
-In
th
e L
imes
ton
e zo
ne
-Un
derf
low
s fr
om l
imes
ton
e ca
ve e
xist
(E
IE)
21-1
Ispa
rta
37°2
4'
49"
30°5
5'
34"
860
840
1.2
5.7
270
242
Exi
stin
g61
81.
154,
824
7.8
706
40○
○-I
n t
he
Lim
esto
ne
zon
e-O
utl
et :
Mor
nin
g gl
ory
type
du
e to
sh
arro
w d
ead
spac
e of
Low
er r
eser
voir
21-2
Ispa
rta
39°5
6'
61"
31°4
6'
39"
730
700
5.4
7.3
270
242
Exi
stin
g48
81.
203,
764
7.7
754
40△
-In
th
e L
imes
ton
e zo
ne
-Ou
tlet
: M
orn
ing
glor
y ty
pe d
ue
to s
har
row
dea
d sp
ace
ofL
ower
res
ervo
ir
22-1
Mer
sin
36°1
7'
01"
33°0
1'
49"
1180
1150
2.4
(Exc
avat
ion
)4.
846
045
073
01.
122,
754
3.8
770
20△
-In
th
e L
imes
ton
e zo
ne
-Lim
esto
ne
cave
s ex
ist
(EIE
)
22-2
Mer
sin
36°1
2'
03"
32°5
8'
30"
860
840
3.6
(Exc
avat
ion
)4.
814
013
073
01.
112,
693
3.7
780
20△
-In
th
e L
imes
ton
e zo
ne
-Lim
esto
ne
cave
s ex
ist
(EIE
)
24E
skis
ehir
40°0
1'
08"
31°0
6'
40"
1100
1070
4.3
4.9
389
377.
5E
xist
ing
723
1.12
3,81
55.
370
710
○○
25A
nka
ra40
°05'
28"
31°1
3'
41"
970
940
8.8
5.9
389
377.
5E
xist
ing
593
1.14
4,03
96.
875
620
△-N
arro
w c
ol e
xist
s on
th
e le
ft b
ank
of R
eser
voir
26A
nka
ra40
°05'
05"
31°1
5'
50"
980
960
2.3
5.8
389
377.
5E
xist
ing
603
1.12
2,97
74.
969
420
◎○
27-1
Sam
sun
41°2
3'
48"
35°3
5'
30"
810
790
1.8
5.4
189
160
Exi
stin
g65
01.
155,
302
8.2
706
10◎
○
27-2
Sam
sun
41°2
3'
57"
35°3
7'
47"
820
790
5.7
5.4
189
160
Exi
stin
g66
01.
164,
222
6.4
716
10△
-Sev
eral
Com
mu
nes
exi
st a
rrou
nd
Upp
er r
eser
voir
28S
inop
41°4
4'
16"
34°3
7'
58"
1190
1160
10.6
7.0
700
680
7.0
510
1.18
3,28
16.
482
320
×-L
arge
upp
er a
nd
low
er d
am, a
nd
low
ecc
onom
ic e
ffic
ien
cy
29D
eniz
li39
°56'
70"
31°4
6'
48"
910
890
3.9
5.6
300
290
Exi
stin
g62
01.
111,
811
2.9
712
30△
-Car
bon
ate
rock
zon
e-A
com
mu
ne
exis
ts c
lose
d to
Upp
er r
eser
voir
31E
skis
ehir
40°0
0'
48"
31°0
4'
00"
1010
980
4.8
5.6
389
377.
5E
xist
ing
633
1.13
3,22
05.
171
110
○○
32-1
An
kara
40°0
4'
04"
30°5
7'
50"
805
780
1.1
(Exc
avat
ion
)6.
627
3.1
272
Exi
stin
g53
31.
113,
784
7.1
732
20△
-Low
er d
am p
rofi
le i
s n
ot c
lear
32-2
An
kara
40°0
3'
51"
30°5
9'
31"
800
770
1.6
8.4
389
377.
5E
xist
ing
422.
51.
183,
649
8.6
689
20○
○-B
ig c
omm
un
e ex
ists
on
th
e le
ft b
ank
of U
pper
res
evoi
r
34D
eniz
li38
°09'
19"
29°0
9'
08"
770
740
5.7
7.4
300
290
Exi
stin
g48
01.
162,
263
4.7
727
30△
-Car
bon
ate
rock
zon
e-L
ower
dam
pro
file
is
not
cle
ar
37-1
Ada
na
37°4
5'
16"
35°2
8'
30"
1250
1220
2.8
5.0
550
540
3.1
710
1.12
3,76
85.
370
930
○○
37-2
Ada
na
37°4
4'
37"
35°3
1'
47"
1260
1230
1.6
5.0
550
540
3.1
720
1.12
4,74
06.
671
330
○-I
n t
he
Lim
esto
ne
zon
e
38S
inop
41°5
0'
23"
34°1
8'
52"
930
900
5.6
5.9
340
330
3.7
600
1.14
2,73
14.
673
040
○-T
rasn
mis
son
Lin
es a
re s
ubm
erge
d in
Low
er R
eser
voir
39K
asta
mon
u41
°48'
33"
33°3
8'
40"
1140
1110
5.6
6.2
580
570
4.8
570
1.14
3,34
15.
974
980
△-L
ong
new
pow
er l
ine
Low
er R
eser
voir
Upp
er R
eser
voir
No.
Pro
vin
ceM
ax.
Hea
dH
pmax
/Hgm
inR
ank
Su
rvey
Sit
eN
otes
Wat
erw
ayle
ngt
h(L
)L
/HC
ost
(mU
S$)
New
pow
erli
ne
(km
)

The Study on Optimal Power Generation for Peak Demand in Turkey
45
(3) Results of survey and priority evaluation Based on the results of the natural/social environment survey, the Study Team quantified the priority
of each site as shown in Table 5. 3. The results of the re-review of project plan and project cost are shown in Table 5. 5 and Table 5. 6.
Meanwhile, the countermeasure cost for geological issues was estimated roughly based on the experience of the Study Team and was included in the project cost.
Considering the economical efficiency and comprehensive score of each site, the Study Team put the priority rank on the candidate sites surveyed based on the criteria for priority ranking as shown in Table 5. 4.
As a result, three candidate sites of No. 19, No. 27-1, and No. 32-2 are selected with a priority rank of “AA.”
Table 5. 3 Natural and Social Environment Evaluation of PSPP Potential Sites
Natural Environment Social Environment Site No. Direct Indirect Direct Indirect
Multiplied Score
Comprehensive Score
11-1 1 1 1 1 1 1.00 11-2 1 1 2 1 2 1.19 19 1 1 2 1 2 1.19
21-1 1 1 1 2 2 1.19 24 2 1 1 1 2 1.19 26 1 1 1 1 1 1.00
27-1 1 1 1 1 1 1.00 31 2 1 1 1 2 1.19
32-2 1 1 1 2 2 1.19 37-1 2 2 2 2 16 2.00
Scores of environmental Impacts: 3 = Significant negative impacts 2 = Can be mitigated, or uncertain 1 = No significant impacts Comprehensive Score Score = Geometrical average (forth root of multiplied score) If any individual items are scored as "3", no calculation. --> Regarded as "Environmentally Difficult" to develop
Table 5. 4 Criteria for Priority Ranking
Priority Rank Criterion AA It is economically superior and there is no significant natural / social
environmental impacts expected. A It is economically superior, and there are natural / social environmental
impacts or technical problems expected B It is economically feasible and there are natural / social environmental impacts
or technical problems expected C It is uneconomical or there are significant natural / social environmental
impacts or technical problems expected.
Furthermore, from the viewpoints of technology transfer, the Study Team selected two candidate sites for the conceptual design of No. 27-1 and No. 32-2 among three high-priority candidate sites,

The Study on Optimal Power Generation for Peak Demand in Turkey
46
because the upper dam types of No. 27-1 and No. 32-2 are different: the upper dam of No. 27-1 is a concrete gravity dam type or concrete facing dam type and the upper dam of No. 32-2 is artificial pond with full facing type.
In consultation with EIE, the Study Team and EIE use the following project names for further study
on three high-priority candidate sites: No. 19 → “Karacaoren II PSPP” No. 27-1 → “Altınkaya PSPP” No. 32-2 → “Gökçekaya PSPP”

The Study on Optimal Power Generation for Peak Demand in Turkey
47
Tab
le 5
. 5
Res
ult
s of
Sit
e S
urv
ey o
f P
SP
P C
and
idat
e S
ites
(1/
2)
Uni
t11
-111
-219
21-1
24(M
W)
1,00
01,
000
1,00
01,
000
1,00
0(m
3 /s)
248
240
240
222
179
(m)
510
525
525
568
707
(hr)
7.0
7.0
7.0
7.0
7.0
Type
Full
Face
d Po
ndag
e (A
spha
lt)Fi
ll Ty
pe D
amC
oncr
ete
Gra
vity
Dam
Full
Face
d Po
ndag
e (A
spha
lt)Fi
ll Ty
pe D
amH
eigh
t(m
)N
o.1:
35,
No.
2: 2
585
130
No.
1: 7
5, N
o.2:
30
75Cr
est L
engt
h(m
)N
o.1:
460
, No.
2: 2
4057
045
0N
o.1:
500
, No.
2: 3
0025
0D
am (B
ank)
Vol
ume
(100
0m3 )
No.
1: 1
,100
, No.
2: 3
004,
900
1,50
0N
o.1:
2,2
60, N
o.2:
340
1,63
4E
xava
tion
Vol
ume
(100
0m3 )
320
00
1,70
00
HW
L(m
)1,
650.
01,
610.
076
0.0
860.
01,
150.
0LW
L(m
)1,
630.
01,
580.
073
0.0
840.
01,
120.
0Ac
tive
Wat
er D
epth
(m)
20.0
30.0
30.0
20.0
30.0
Activ
e St
orag
e Ca
paci
ty(1
000m
3 )6,
300
6,10
06,
100
5,60
04,
600
Cat
chm
ent A
rea
(m2 )
Type
Conc
rete
Gra
vity
Dam
Con
cret
e G
ravi
ty D
amK
arac
aöre
n II
Dam
Kar
acaö
ren
I Dam
Gök
çeka
ya D
amH
eigh
t(m
)14
516
5(3
3)(5
3)(4
4)Cr
est L
engt
h(m
)23
514
0(3
50)
(1,2
00)
(250
)D
am (B
ank)
Vol
ume
(100
0m3 )
1,20
092
0(4
70)
(3,5
00)
(550
)H
WL
(m)
1,11
0.0
1050
.018
8.0
270.
038
9.0
LWL
(m)
1,09
0.0
1030
.018
5.0
(182
.0)
242.
0 (2
41.6
)37
7.5
(377
.0)
Activ
e W
ater
Dep
th(m
)20
.020
.06.
028
.412
.0Ac
tive
Stor
age
Capa
city
(100
0m3 )
6,30
07,
000
6,30
0 (6
,100
)88
7,00
0 (5
,600
)21
4,00
0 (4
,600
)C
atch
men
t Are
a(k
m2 )
Wat
er W
ayPeak
Dur
atio
n H
ours
Reservoir
Upp
er
Low
er(C
offe
r)
No.
Inst
alle
d C
apac
ity P
Des
igne
d D
isch
arge
Qd
Effe
ctiv
e H
ead
H
d
Hea
drac
e L(
m) x
n80
0 x
190
0 x
10
900
x 1
3,50
0 x
1Pe
nsto
ck L
(m) x
n85
0 x
190
0 x
11,
100
x 1
1100
x 1
1,30
0 x
1Ta
ilrac
e L
(m) x
n45
0 x
270
0 x
11,
200
x 1
3200
x 1
1,20
0 x
1H
oriz
onta
l Len
gth
(m)
1,50
02,
000
2,10
05,
000
5,70
0Lo
ngitu
dina
l Len
gth
(m)
2,10
02,
500
2,30
05,
300
6,00
0
Wat
er W
ay
Pow
erho
use
Type
Egg
Sha
pe T
yoe
Egg
Shap
e Ty
oeEg
g Sh
ape
Tyoe
Egg
Shap
e Ty
oeE
gg S
hape
Tyo
eC
aver
n Vo
lum
e(1
000m
3 )15
015
015
015
015
0O
verb
urde
n D
epth
(m)
500
500
250
500
450
2.94
3.81
4.00
8.80
8.06
(Yea
r)6
66
67
(mil.
US$
)ni
lLe
akag
e fr
om u
pper
dam
: 36
Leak
age
from
upp
er d
am :
30U
nder
grou
nd P
ower
hous
e : 2
2O
utle
t Slo
pe P
rote
ctio
n : 4
2U
nder
grou
nd P
ower
hous
e : 2
2
(mil.
US$
)74
478
073
477
876
7(U
S$/k
W)
744
780
734
778
767
(km
)30
3030
4010
1.00
1.19
1.19
1.19
1.19
AB
AA
BB
Pow
erho
use
Leng
th o
f pow
er li
ne
Prio
rity
Ran
k
Proj
ect C
ost
Con
stru
ctio
n Pe
riod
Uni
t Cos
t
Prim
ary
eval
uatio
n st
ores
of S
ocia
l/Nat
ural
Env
iron
men
t
Cou
nter
mea
sure
Cos
t
L/H
d

The Study on Optimal Power Generation for Peak Demand in Turkey
48
Tab
le 5
. 6
Res
ult
s of
Sit
e su
rvey
of
PS
PP
Can
did
ate
Sit
es (
2/2)
U
nit
2627
-131
32-2
37-1
(MW
)1,
000
1,00
01,
000
1,00
01,
000
(m3 /s
)22
621
421
933
020
1(m
)55
859
157
738
262
8(h
r)7.
07.
07.
07.
07.
0
Type
Full
Face
d Po
ndag
e (A
spha
lt)Co
ncre
te G
ravi
ty D
amCo
ncre
te G
ravi
ty D
amFu
ll Fa
ced
Pond
age
(Asp
halt)
Fill
Type
Dam
Hei
ght
(m)
4565
105
No.
1: 5
5, N
o.2:
25
75Cr
est L
engt
h(m
)55
030
042
0N
o.1:
600
, No.
2: 3
8041
0D
am (B
ank)
Vol
ume
(100
0m3 )
1,36
038
095
0N
o.1:
2,5
00, N
o.2:
430
2,75
0Ex
avat
ion
Volu
me
(100
0m3 )
3,67
00
01,
520
0H
WL
(m)
990
810.
01,
010.
080
0.0
1,25
0.0
LWL
(m)
960
790.
098
0.0
770.
01,
220.
0Ac
tive
Wat
er D
epth
(m)
30.0
20.0
30.0
30.0
30.0
Activ
e St
orag
e Ca
paci
ty(1
000m
3 )5,
700
5,40
05,
600
8,40
05,
100
Catc
hmen
t Are
a(m
2 )Ty
peG
ökçe
kaya
Dam
Altın
kaya
Dam
Gök
çeka
ya D
amG
ökçe
kaya
Dam
Conc
rete
Gra
vity
Dam
Hei
ght
(m)
(44)
(54)
(44)
(44)
75Cr
est L
engt
h(m
)(4
00)
(300
)(3
00)
(250
)20
0D
am (B
ank)
Vol
ume
(100
0m3 )
(900
)(9
00)
(620
)(4
40)
340
HW
L(m
)38
9.0
190.
038
9.0
389.
058
0.0
LWL
(m)
377.
5 (3
77.0
)16
0.0
(159
.9)
377.
5 (3
77.0
)37
7.5
(377
.0)
560.
0Ac
tive
Wat
er D
epth
(m)
12.0
30.1
12.0
12.0
20.0
Activ
e St
orag
e Ca
paci
ty(1
000m
3 )21
4,00
0 (5
,700
)2,
892,
000
(5,4
00)
214,
000
(5,6
00)
214,
000
(8,4
00)
5,10
0Ca
tchm
ent A
rea
(km
2 )
Reservoir
Upp
er
Low
er(C
offe
r)
Wat
er W
ay
Des
igne
d D
isch
arge
Qd
Effe
ctiv
e H
ead
H
d Pe
ak D
urat
ion
Hou
rs
Inst
alle
d Ca
paci
ty P
No.
Hea
drac
e L(
m) x
n1,
650
x 1
2,30
0 x
12,
000
x 1
2,30
0 x
12,
300
x 1
Pens
tock
L(m
) x n
1,05
0 x
11,
100
x 1
1,10
0 x
160
0 x
112
00 x
1Ta
ilrac
e L
(m) x
n1,
300
x 1
2,10
0 x
11,
300
x 1
800
x 1
1,20
0 x
1H
oriz
onta
l Len
gth
(m)
3,70
05,
200
4,10
03,
400
3,40
0Lo
ngitu
dina
l Len
gth
(m)
4,00
05,
500
4,40
03,
700
3,70
0
Wat
er W
ay
Pow
erho
use
Type
Egg
Shap
e Ty
oeEg
g Sh
ape
Tyoe
Egg
Shap
e Ty
oeEg
g Sh
ape
Tyoe
Egg
Shap
e Ty
oeCa
vern
Vol
ume
(100
0m3 )
150
150
150
150
150
Ove
rbur
den
Dep
th(m
)30
045
050
040
055
0
6.63
8.80
7.11
8.90
5.41
(Yea
r)6
77
66
(mil.
US$
)O
utle
t Slo
pe P
rote
ctio
n : 2
1ni
l.Le
akag
e fr
om u
pper
dam
: un
know
nni
l.U
nder
grou
nd P
ower
hous
e : 2
2
(mil.
US$
)75
872
7-
732
729
(US$
/kW
)75
872
7-
732
729
(km
)20
1010
230
1.00
1.00
1.19
1.19
2.00
AA
AC
AA
B
Prim
ary
eval
uatio
n st
ores
of S
ocia
l/Nat
ural
Env
iron
men
t
Prio
rity
Ran
k
Cons
truc
tion
Peri
od
Proj
ect C
ost
Uni
t Cos
t
Leng
th o
f pow
er li
ne
Coun
term
easu
re C
ost
L/H
d
Pow
erho
use

The Study on Optimal Power Generation for Peak Demand in Turkey
49
5.3 Detailed Site Survey on Conceptual Design Sites
5.3.1 Result of Site Survey
Table 5. 7 shows issues based on the detailed site survey on the conceptual design sites.
Table 5. 7 Issues based on the Results of Detailed Site Survey
Site Assessment results and issues
Geography Geology
Transportation Conditions The length of roads to be altered, which are necessary for approach
and maintenance of the upper reservoir and the outlet, is estimated at about 30 km for the upper dam and 15 km for the outlet. Besides, a connection road of 15 km between the upper dam and the outlet for construction and maintenance needs to be constructed newly.
Upper Reservoir Mudstones are divided into stick-like fragments by development of
slaking and are crumbled in many places. Confirmation of the quality of concrete aggregate for concrete gravity dam or rock materials for fill-type dam is an important issue.
Outlet Lacks of outcrop of rock are observed in some places that are washed
out by the lake water and show concave terrain. The width of a lacking zone is several meters. It implies that hidden weak zones such as fracture or hydrothermal alteration exist in this area.
It is judged that rocks around the surface slant to the south due to creep. Mudstones which are divided into stick-like fragments by slaking were observed on the surface near the outlet site. Geological investigation such as bore-hole drilling and seismic prospecting is required in and around the outlet site to clarify the weathering depth and bedrock condition.
Waterway and Underground Powerhouse There are no hydrothermal alterations and fracture zones on the cut
slope of the dirt road in the mountain. However, there may be some hidden weak zones under the ground; therefore, seismic prospecting along the waterway route and bore-hole drilling and in-situ tests for the surge tank and underground powerhouse are required.
Altınkaya PSPP
Environment
Crucial environmental and social issues were not found as mentioned above. Also, the existing Altınkaya reservoir can be utilized as the lower reservoir. Therefore, it is expected at this moment that environmental and social impacts by the PSPP project will be limited.
The villagers are hoping to have job opportunities during the construction, and also to realize an additional water supply project and expansion of surrounding roads under the purview of corporate social responsibility (CSR) activities related to the project. Therefore, the villagers are expecting realization of the project.

The Study on Optimal Power Generation for Peak Demand in Turkey
50
Gökçekaya PSPP
Geography Geology
Transportation Since the existing local road runs through the upper pond, before
constructing the upper pond, a bypass road should be constructed. As for approach and maintenance road to the outlet site, the existing road has to be altered and extended by 2 km newly so as to have an approach from the upper pond.
Meanwhile, it is appropriate that an access tunnel is constructed from the existing Gökçekaya dam’s spillway to the outlet site, since the slope of the right bank near the Gökçekaya dam is so steep and pollution of the Gökçekaya reservoir by fall of excavated soil and rocks should be prevented.
Upper Reservoir The dam axis was shifted to upstream of around 200 m, judging from
the topographical condition based on the 1/5,000 map. There are some fragments of weathered bedrock on the surface, and no bedrocks were observed. However an outcrop of bedrock was observed on the top of the hill near the dam site. The thickness of sediment at the dam site is estimated at less than 3 m.
It is expected that there is little possibility of water leakage from the upper pond, because tuff and tuffaceous rock of Temg are distributed mainly around the upper pond. However, the boundary with PEge or PEg, the lower stratum, is undulated, and permeability of the boundary and PEge or PEg is unclear. Therefore, it’s required to examine the hydrogeological property and permeability of the bedrock of the upper pond by bore-hole drilling including Lugeon tests. If there is no risk of water leakage from the upper pond, i.e., confirming higher ground water level than HWL on both right and left bank and low permeability, the full facing with asphalt can be omitted.
Outlet Massive and hard bedrock crop out on the right bank of the Gökçekaya
reservoir, however, there is a rock mass that has slipped down from halfway the slope due to creeping at the outlet site. The rock mass should be removed, and the upper slope of the outlet should be protected for the stability of slope during and after construction.
Waterway and Underground Powerhouse Geological investigations concerning weathering condition are
required for the intake and intake gate shaft site. On the other hand, the degree of weathering through waterway route and the underground power station is expected to be low, since the fresh and hard rock belonging to PEg is distributed.
Geological condition of TPek and PEge and location of the boundary between TPek or PEge and PEg need to be identified along the waterway route from the intake to the upper reach of headrace tunnel. PEg outcrop is fresh and hard.

The Study on Optimal Power Generation for Peak Demand in Turkey
51
Environment
As for the upper reservoir, three houses and several tens’ graves will be required to relocate. And also, since the construction yard of the upper reservoir is closed to Kavak Village, special considerations such as noise and vibration measures are required. Resettlement Action Plan and Environmental Management Plan should be prepared taking the residents’ opinion into consideration through sufficient consultation with them. In addition, since the upper reservoir will be an artificially excavated pond type, a bypass channel will be constructed to avoid sediment inflow. The bypass channel is also required from the viewpoint of a social measure that provides water places for animal breeding.
As for the waterway and the powerhouse, crucial environmental and social impacts by the PSPP project are not anticipated. Also, the existing Gökçekaya reservoir can be utilized as the lower reservoir. Therefore, it is expected at this moment that environmental and social impacts by the PSPP project will be limited.

The Study on Optimal Power Generation for Peak Demand in Turkey
52
Chapter 6 Proposal of Long-Term Power Development Planning (from 2011 to 2030)
Based on the result of the study made so far, the Study Team proposed a draft of a long-term power development plan covering 20 years between 2011 and 2030.
6.1 Current Power Development Plan and Its Future Directions
6.1.1 Future Direction of Power Development
As for future directions of power development, the government with the SPO playing a central role has formulated “The Electricity Energy Market and Supply Security Strategy Paper” (May 2009). This paper includes the following numerical targets: Nuclear power: Seek to account for at least 5% of the total generation by 2020.
Introduce the total capacity of 5,000 MW between 2010 and 2020. Renewable energy: Seek to generate at least 30% of the total power by 2023. Wind: Develop 20,000 MW by 2023. Natural gas: Reduce the current share of 50% to 30% or lower. Domestic lignite coal and coal:
Use up the available amount currently under exploration by 2023 as power generation fuels. Afterward, make efforts to utilize the amount which is considered to be exploitable.
Imported coal: Examine ways to achieve high-quality power generation and enhance generation efficiency.
6.2 Study on Long-Term Power Development Plan(2011~2030) (1) Relationship between plant maximum capacity and supply capacity of PSPP
Relationships between plant maximum capacity and supply capacity of PSPP in 2021 and onward are shown in Figure 6. 1.
Figure 6. 1 Relationship between Plant Maximum Capacity and Supply Capacity of PSPP
Prior to the year of 2025, supply capacity which is only a third of plant maximum capacity can be expected. This is closely related to the residual demand profile after dispatching the conventional hydropower plants.
0
200
400
600
800
1000
1200
2021 2022 2023 2024 2025 2026 2027 2028 2029 2030
P=300MW P=600MW P=900MW P=1200MW

The Study on Optimal Power Generation for Peak Demand in Turkey
53
The residual demand profiles in 2025 and 2029 after dispatching conventional hydropower plants are shown in Figure 6. 2.
Figure 6. 2 General hydro power plants dispatch(in 2025 and 2029)
In 2025, since the ratio of conventional hydropower plants is high relative to the scale of demand, the entire peak demand is met by conventional hydropower plants and the demand profile after dispatching conventional hydro will be completely flat between 9:00 and 24:00. Furthermore, after dispatching the conventional hydro, the demand profile does not show major differences between daytime and nighttime and hours when pumping is possible are not many. On the other hand, in 2029, since the demand profile does not become completely flat after dispatching conventional hydro, the supply capacity of PSPP can be expected to be equal to their plants’ maximum capacity. In addition, the difference between daytime and nighttime becomes larger and hours during which pumping is possible are longer.
A result of dispatching PSPP to the residual demand profile after dispatching conventional hydropower plants in 2025 and 2029 is shown in Figure 6. 3.
Figure 6. 3 Dispatching PSPP (in 2025 and 2029)
0
20000
40000
60000
80000
1 7 13 19Time (hour)
(MW) 2029
Hydro
After dispatching Hydro
0
20000
40000
60000
80000
1 7 13 19Time (hour)
(MW)
After dispatching Hydro
2025
Hydro
40000
45000
50000
55000
60000
1 7 13 19Time (hour)
PSPP (G)
(MW) 2029
PSPP (P)
40000
45000
50000
55000
60000
1 7 13 19Time (hour)
PSPP (G)
(MW) 2025
PSPP (P)

The Study on Optimal Power Generation for Peak Demand in Turkey
54
In terms of PSPP supply capacity, about a third of the plant maximum capacity, or a mere 443 MW, can be expected in 2025, while 1,200 MW, which is equivalent of the plant maximum capacity, can be expected as a supply capacity in 2029.
(2) Development planning scenarios
The construction of PSPP is considered to take more than 10 years in a case of adopting simple processes. (refer to Section 7.2.4.) These processes include many uncertainties such as negotiations with parties concerned. Based on these viewpoints, with 2021 as the earliest possible period of developing PSPPs, the economics of five different scenarios by changing the development ratio of PSPP and gas turbine thermal power plants are compared as shown in Figure 6. 4.
Figure 6. 4 Comparison of Different Scenarios(In terms of Peak Supply Capacity)
Scenario P1: PSPP Priority
GT: 300GT: 300 GT: 300
P: 300 P: 300 P: 300 P: 300 P: 300 P: 3002021 2022 2023 2024 2025 2026 2027 2028 2029 2030
Scenario P2: PSPP Promotion
GT: 300 GT: 300 GT: 300 GT: 300P: 300 P: 300 P: 300 P: 300 P: 300 P: 3002021 2022 2023 2024 2025 2026 2027 2028 2029 2030
Scenario P3: Base
GT: 300 GT: 300 GT: 300P: 300 P: 300 GT: 300 P: 300 P: 300 P: 300 P: 3002021 2022 2023 2024 2025 2026 2027 2028 2029 2030
Scenario P4: PSPP Delayed
GT: 300 GT: 300 GT: 300 P: 300 P: 300 P: 3002021 2022 2023 2024 2025 2026 2027 2028 2029 2030
Scenario P5: GT Priority
GT: 300GT: 300 GT: 300 GT: 300 GT: 300 P: 300 GT: 300 P: 300
2021 2022 2023 2024 2025 2026 2027 2028 2029 2030
P: 600 P: 600
GT: 600 P: 600
GT: 600

The Study on Optimal Power Generation for Peak Demand in Turkey
55
(3) Economics Comparison is made between the base scenario and four different scenarios in terms of the
cumulative cost during 10 years from 2021 to 2030 by using the present value as of 2021.
Table 6. 1 Value comparison as of 2021
(Million USD) Fixed cost Fuel cost Total Scenario P1: PSPP Priority 230.0 - 4.7 225.2 Scenario P2: PSPP Promotion 84.9 1.3 86.2 Scenario P3: Base Base Base Base Scenario P4: PSPP Delayed - 156.7 6.4 - 150.3 Scenario P5: GT Priority - 149.0 10.3 - 138.7
It was found that Scenario P4, in which GT is preferentially developed until 2025 and from 2026
PSPP will be developed, is the most economical as peak capacity. Among any scenarios, gap of fuel cost is not so great while fixed cost shows big differences. This is because under scenarios with early operation start of PSPP, supply capacity equivalent of the plant maximum capacity cannot be expected, and in order to secure the same reserve capacity rate, more plant development will be necessary. In other words, if supply capacity equivalent of the plant maximum capacity can be expected, PSPP is more economical than GT, and it is beneficial to start developing PSPP in 2026 and thereafter, when the supply capacity equivalent of plant maximum capacity can be expected.
(4) Other considerations
This study compared gas turbine with PSPP as peak supply capacity by focusing on the economics. As peak supply capacity, reservoir-type hydropower plants are also subjects of the study. Since the economical efficiency of peak supply capacity is largely influenced by the fixed cost, if the construction cost of reservoir type is cheaper than PSPP (kW unit price), it will be better to preferentially develop a reservoir-type hydropower plant. However, in a case where a reservoir volume is not so large, there is a possibility that supply capacity equivalent of the plant maximum capacity cannot be expected depending on the demand profile.
In addition, in a case where development is being studied with an expectation of frequency adjustment and other functions during off-peak periods, which are advantages of PSPP, there is a possibility that it may be beneficial to develop PSPP prior to 2025 depending on the value of the function.

The Study on Optimal Power Generation for Peak Demand in Turkey
56
6.3 Proposal of Optimal Power Development Plan
(1) Draft of optimal power development plan As a result of the last chapter, we propose the following draft of optimal power development plan for
2016–2030. (The content of the plan is the same as Scenario 1 in the projection made by TEIAS in the period between 2011 and 2015.)
Figure 6. 5 Optimal Power Development Plan
In addition, the following developments are also under consideration: Wind: Develop 800 MW every year Conventional hydro: Develop 200 MW every year Small-scale gas-fired thermal: Develop 100 MW every year Geothermal: Develop 100 MW every 5 years
(2) Plant-type composition ratio(generated energy)
The transition of plant-type composition ratio is shown in Figure 6. 6.
Figure 6. 6 Transition of Plant Type Composition Ratio
Looking at the plant-type composition in 2030, semi-domestic energy (nuclear, hydro, and wind combined) which emits no CO2, gas, and coal (domestic and imported) respectively account for a third of the total generated energy, which shows that energy diversity has been achieved.
GT: 300 GT: 300
GT: 300 P: 300 P: 300 P: 300
GT: 300 GT: 300
2016 2017 2018 2019 2020 2021 2022 2023 2024 2025 2026 2027 2028 2029 2030
GT: 600 P: 600
G: 700N: 1200 N: 1200 N: 1200 C: 1200 C: 1200
C: 600
G: 700
C: 600 C: 600C: 1200
C: 600
G: 1400G: 700
N: 1200G: 700
N: 1200
G: 700H: 1200
G: 700
C: 600 C: 600
G: 700
C: 600 G: 700 G: 700
N: 1200 N: 1200 N: 1200
0%
20%
40%
60%
80%
100%
2011 2013 2015 2017 2019 2021 2023 2025 2027 2029
Wind Hydro Nuclear Gas Imp-Coal Dom-Coal

The Study on Optimal Power Generation for Peak Demand in Turkey
57
Chapter 7 Conceptual Design of Priority PSPP
7.1 Study on Optimum Development Scale
(1) Analysis results of optimum development scale
(a) Altınkaya PSPP The project’s (B/C) and (B-C) of each case are shown in Table 7. 1.
Table 7. 1 Analysis Results of the Optimum Development Scale
Peak Duration (hr) 6 7 8 Output (MW) 1,000 1,400 1,800 1,000 1,400 1,800 1,000 1,400 1,800
Effective Output (MW)
857 1,200 1,543 1,000 1,400 1,800 1,000 1,400 1,800
Benefit (B) 203.1 284.3 365.5 217.5 304.5 391.5 217.5 304.5 391.5Cost (C) 146.9 177.4 208.0 147.1 177.8 208.8 147.3 178.6 209.6
B/C 1.38 1.60 1.76 1.48 1.71 1.87 1.48 1.70 1.87B-C 56.2 106.9 157.5 70.4 126.7 182.7 70.2 125.9 181.9
The case of installed capacity of 1,800 MW (450 MW × 4 units) and peak duration hours of 7 hours was selected as the optimum development scale for Altınkaya PSPP, since it has the maximum B/C value of 1.87.
(b) Gökçekaya PSPP
The project’s Benefit/Cost (B/C) ratio and Benefit- Cost (B-C) of each case are shown in Table 7. 2.
Table 7. 2 Results of the Optimum Development Scale
Peak Duration (hr) 6hr 7hr 8hr Output (MW) 1,000 1,200 1,400 1,000 1,200 1,400 1,000 1,200 1,400
Effective Output (MW)
857 1,029 1,200 1,000 1,200 1,400 1,000 1,200 1,400
Benefit (B) 203.1 243.7 284.3 217.5 261.0 304.5 217.5 261.0 Cost (C) 145.7 161.9 178.3 146.2 162.7 181.0 147.1 165.4
B/C 1.39 1.51 1.59 1.49 1.60 1.68 1.48 1.58 B-C 57.4 81.8 106.0 71.3 98.4 123.5 70.4 95.7
The case of installed capacity of 1,400 MW (350 MW × 4 units) and peak duration hours of 7 hours was selected as the optimum development scale for Gökçekaya PSPP, since it has the maximum B/C value of 1.68.
Unit : mil..USD
Unit : mil. USD

The Study on Optimal Power Generation for Peak Demand in Turkey
58
7.2 Conceptual Design of Altınkaya PSPP
As a result of the conceptual design of Altınkaya PSPP, the main features are shown in Table 7. 3 and structural drawings are presented in Figure 7. 1 and Figure 7. 2. The conceptual design of the site is as follows.
7.2.1 Design of Power Generation Plan
A power generation plan is an important matter in the design of a PSPP’s facilities. However, many revisions are necessary to reach an optimum plan, since features of a power generation plan are also changed by the design of facilities.
The conceptual design was carried out based on the topographical maps of 1/5,000. The main features of power generation plan were decided as shown in Table 7. 3.

The Study on Optimal Power Generation for Peak Demand in Turkey
59
Figure 7. 1 Altınkaya PSPP General Layout

The Study on Optimal Power Generation for Peak Demand in Turkey
60
Figure 7. 2 Altınkaya PSPP Waterway Longitudinal Section
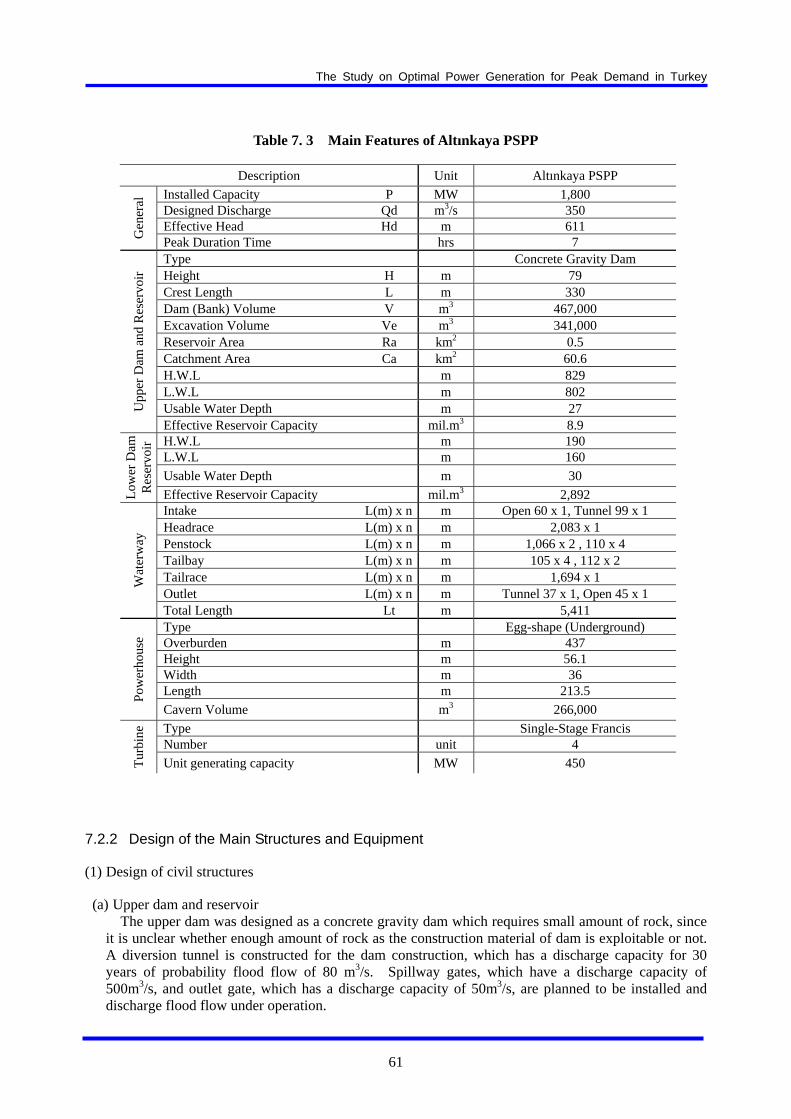
The Study on Optimal Power Generation for Peak Demand in Turkey
61
Table 7. 3 Main Features of Altınkaya PSPP
Description Unit Altınkaya PSPP
Installed Capacity P MW 1,800 Designed Discharge Qd m3/s 350 Effective Head Hd m 611
Gen
eral
Peak Duration Time hrs 7 Type Concrete Gravity Dam Height H m 79 Crest Length L m 330 Dam (Bank) Volume V m3 467,000 Excavation Volume Ve m3 341,000 Reservoir Area Ra km2 0.5 Catchment Area Ca km2 60.6 H.W.L m 829 L.W.L m 802 Usable Water Depth m 27 U
pper
Dam
and
Res
ervo
ir
Effective Reservoir Capacity mil.m3 8.9 H.W.L m 190 L.W.L m 160
Usable Water Depth m 30
Low
er D
am
Res
ervo
ir
Effective Reservoir Capacity mil.m3 2,892 Intake L(m) x n m Open 60 x 1, Tunnel 99 x 1 Headrace L(m) x n m 2,083 x 1 Penstock L(m) x n m 1,066 x 2 , 110 x 4 Tailbay L(m) x n m 105 x 4 , 112 x 2 Tailrace L(m) x n m 1,694 x 1 Outlet L(m) x n m Tunnel 37 x 1, Open 45 x 1
Wat
erw
ay
Total Length Lt m 5,411 Type Egg-shape (Underground) Overburden m 437 Height m 56.1 Width m 36 Length m 213.5 P
ower
hous
e
Cavern Volume m3 266,000
Type Single-Stage Francis Number unit 4
Tur
bine
Unit generating capacity MW 450
7.2.2 Design of the Main Structures and Equipment
(1) Design of civil structures
(a) Upper dam and reservoir The upper dam was designed as a concrete gravity dam which requires small amount of rock, since
it is unclear whether enough amount of rock as the construction material of dam is exploitable or not. A diversion tunnel is constructed for the dam construction, which has a discharge capacity for 30 years of probability flood flow of 80 m3/s. Spillway gates, which have a discharge capacity of 500m3/s, and outlet gate, which has a discharge capacity of 50m3/s, are planned to be installed and discharge flood flow under operation.
The Study on Optimal Power Generation for Peak Demand in Turkey
62
(b) Intake Lateral type of intake is adopted, which is applied generally for the intake of PSPP. It is laid out
in line with the ridge in the reservoir, and the mouths are designed to make the flow velocity at inlet of water less than 1 m/s. The bottom level of intake is set as 793 m, which is 1 m higher than the sedimentation level, and height of mouth is 8.4 m, which is the same as the height of the headrace tunnel. LWL is set as 802 m, which is 0.6 m higher than the top elevation of the mouth. In addition, 1.5 m height of anti-vortex girder is installed.
(c) Waterway and underground powerhouse Generally, the shortest route shall be selected between the upper reservoir and the lower reservoir
for the waterway alignment, based on the topographical and geological conditions. However, there are following constraints concerned in this project site.
・ Waterway tunnel cannot be constructed under the village on the southeast of the intake. ・ Outlet should be located in a cove of the lower reservoir, which is a suitable place to construct
the cofferdam. Therefore, waterway should be curved to meet the above requirements. The curves are planned to
be located at the points which have a distance of 30D each from the intake and the outlet to prevent drift flow in the intake and outlet. As well, the curves’ radiuses were designed as 300 m considering the workability of construction. Here, D is the internal diameter of headrace/tailrace tunnel.
The shape of waterway was designed as circular in order to prevent stress concentration.
1) Headrace Reinforced concrete shall be placed for the headrace lining. The inner diameter is determined as
8.4 m under the condition of maximum velocity of 6.5 m/s based on the experiences in Japan. Detailed design of the headrace is as follows: ・ The headrace tunnel length is approximately 2,100 m and the shape of excavation section is a
horseshoe with height of 9.8 m. ・ Reinforced concrete lining is constructed after excavation. ・ Consolidation grouting is planned to improve permeability and deformation modulus of the
area loosened by excavation, and to expect pre-stress effect on the concrete lining.
2) Headrace surge tank Headrace surge tank is planned to place at the joint of headrace and penstock, and the top of the
surge tank is on the ground surface of a ridge. Upper surge was estimated 40 m higher than HWL of the upper reservoir. Shaft diameter is set as 15 m, and port section diameter is set as 4.5 m according to the surging analysis. The waterway is bifurcated at the headrace surge tank.
3) Penstock
The penstock is designed as a 10% inclined tunnel from the headrace surge tank to the upper bending point, which has an overburden depth of more than 50 m, and as 48° inclined shaft, which degree is decided considering the repose angle of the excavated rock, from the upper bending point to the lower bending point at the elevation of pump-turbine center. Two penstocks are bifurcated to four branches in total in the lower horizontal part, and each branch is put together with the inlet valve. The maximum averaged flow velocity in the penstock is set as 10 m/s and that in the joint part is set as 20 m/s based on the experiences in Japan. A steel pipe is installed in the tunnel and shaft, after which the space is filled with concrete.
4) Underground powerhouse
Principally, the location and direction of the powerhouse caverns are determined after excavating the exploratory adits and investigating geological conditions, e.g., the initial ground pressure and rock mass properties such as by in-situ tests. At this stage, the location of the underground powerhouse is selected to make the waterway the shortest, and where its overburden depth is less

The Study on Optimal Power Generation for Peak Demand in Turkey
63
than 500 m, which is the maximum value of the existing underground powerhouses. An egg-shape type, which shape is pertinent for the surrounding rock of cavern to be the most
stable mechanically, is selected. The scale of cavern is determined to secure the required space to install electrical equipment based on experiences.
5) Tailbay
Tailbay is defined as waterway between the draft tube and the tailrace surge tank, and four draft gates chambers are installed at the side of the equipment transportation tunnel above the draft gates. Four-branched waterways are merged to two branches in the tailbay and connect to the tailrace surge tank.
6) Tailrace surge tank
A tailrace surge tank is constructed at the joint point of tailbay and tailrace, which has a port and an upper chamber because it is constructed underground. In line with that, the upper surge is not a constraint to decide the diameter of the shaft. Therefore, the inner diameter of the shaft of 10 m and the port diameter of 4.5 m are decided so that the water level of down surge is higher than the LWL of the lower reservoir minus 60 m by calculation of surging. The two branched tunnels are merged to one at the tailrace surge tank.
7) Tailrace
Reinforced concrete shall be placed for the tailrace lining. The inner diameter is determined as 8.4 m under the condition of maximum velocity of 6.5 m/s based on the experiences in Japan. Detailed design of the tailrace is as follows:
(d) Outlet
A lateral type of outlet is adopted, which is applied generally for outlets of a PSPP, and it is laid out in line with the ridge in the lower reservoir. Since the outlet is constructed in the existing reservoir, the size of outlet shall be small in order to make the cofferdam as small as possible. Although flow velocity at the opposite bank is generally the critical condition to decide the size of the mouth, in this case, the slope of the opposite bank is planned to be protected and the size of mouth is designed just so as to make averaged flow velocity at pumping operation less than 1 m/s. In addition, the top elevation of the mouth is set as 0.5 m lower than the LWL of the reservoir, and a 1.5 m high anti-vortex girder is installed.
(2) Design of Electromechanical Equipment
(a) Pump-turbine
Francis-type single-stage pump-turbine is selected for the Altınkaya PSPP in consideration of this site condition consisting of 610 m effective head and 450 MW unit capacity, which was determined through the study of optimum development scale.
(b) Generator-motor
In the study on optimum development scale, a generator-motor was designed on condition that adjustable-speed pumped storage power system would be adopted. The adjustable-speed system was developed in order to secure frequency adjustment ability in power system during pumping operation and realize high-efficiency operation during generating operation.
1) Main feature of adjustable-speed pumped storage power system
The main feature of this system is to control the rotating speed of rotor during generating and pumping operation in line with adjusting slip with stator by exciting the cylindrical rotor’s three-winding with variable-frequency three-phase AC.

The Study on Optimal Power Generation for Peak Demand in Turkey
64
Figure 7. 3 Configuration of Adjustable Speed System
The merits of adopting this technology are as follows:
Input power to motor during pumping operation can be adjusted because axial input power changes in proportion to the cube of the rotating speed of rotor, which can be adjusted within a certain range. As a result of this, frequency adjustment capacity of power system during low demand at night is expanded.
High-efficiency operation during generating operation can be realized by setting rotating speed to the most efficient point according to head and discharge, and consequently output adjustable range; in other words, frequency adjustment capacity during generating operation in the daytime is expanded by suppressing turbine oscillation and cavitation during low-head and low-load operation.
Figure 7. 4 Input Adjustment Range during Pumping Operation
2) Determination of generator-motor capacity In the case of adjustable-speed system, the active power input/output of motor-generator is divided
proportionally between stator and rotor according to the rotating speed of rotor (slip with stator).

The Study on Optimal Power Generation for Peak Demand in Turkey
65
Also, input power from power system to motor increases in proportion to the cube of rotating speed when increasing the rotating speed during pumping operation. In this design, stator rated capacity of 525 MVA is calculated based on TEPCO’s experiences of PSPPs, assuming that the adjustable range of rotating speed is ±4% of the synchronous speed.
(3) Design of hydromechanical works
(a) Penstock and steel liner
The thickness of penstock and steel liner is calculated in consideration of sharing ratio of internal pressure by bedrock.
(b) Gate Spillway gate and outlet gate of the upper dam, stop log of the diversion tunnel, intake and outlet
gates, and draft gate are planned to be installed. Radial gate and jetflow gate are applied for spillway and outlet, respectively, and slide gate is applied for the others.
(4) Access road
The newly built approach roads for approach/maintenance are estimated to be about 30 km long in total and the existing 30 km roads will be altered if necessary. A plan of roads for construction shall be prepared based on the study on detailed road specifications and construction schedule.
7.2.3 Rough Cost Estimate
Conceptual design is carried out based on the information and data obtained from the detailed site survey and the topographical maps of 1/5000, and the quantity of each construction work is calculated. Cost of each construction work is estimated based on its quantity and its construction unit cost provided by EIE. The results of cost estimate are shown in Table 7. 4. The detailed method to estimate is described below.
Table 7. 4 Rough Cost Estimate of Altınkaya PSPP
Cost Items Cost (106USD) Remarks
A. Preparatory Works 90.0 B. Construction Works 398.7 Upper dam and reservoir 46.9 Lower reservoir 40.4 Waterway 154.6 Power house and switch yard 88.9 Main tunnels 53.0 Investigation and test 15.0 C. Equipment 409.9 Hydro-mechanical works 84.3 Electro-mechanical works 310.0 Building relations 15.5 Electro-mech*0.05 D. Engineering service 50.0 E. Administrative expense 9.0 (A-C)*0.01 F. Land compensation and resettlement 9.0 A*0.1 G. Contingency 96.7 (A-F)*0.1 H. Price contingency 96.7 (A-F)*0.1 I. Custom duty 41.0 C*0.1 Total project cost 1,201
Unit cost (USD/kW) 667
The Study on Optimal Power Generation for Peak Demand in Turkey
66
(1) Construction cost
(a) Preparatory works The construction cost of preparatory works is the construction cost of approach roads. The
quantities of access roads are roughly estimated based on the 1/5,000 topographical maps and site survey results.
(b) Civil works
The unit cost of each civil work provided by the counterpart of EIE is applied for calculating the cost of each civil work, but some unit costs are revised or added based on the experiences in Japan.
The quantities of excavation (soil, rock, and tunnel), concrete, re-bar, and so on, are roughly calculated for each main civil structure in line with the preliminary design drawing based on the topographical maps of 1/5,000 and the detailed site survey results. As a miscellaneous work cost, 10% for open work cost and 15% for tunnel work cost are added to each civil work cost. Taking into account the geological condition uncertainties, 30% is added for tunnel work cost as well.
Investigation and testing costs are estimated to be 15 million USD in total and categorized in civil works.
(c) Hydro-mechanical works
The precedents for other countries are applied for the price of the hydro-mechanical work such as steel pipe and gate. The installation costs are estimated as 15% of the above price.
(d) Electrical and mechanical equipment
The cost of electrical-mechanical equipment is estimated based on the experiences in Japan and overseas. The estimated cost includes price of the generator, transportation cost, price of auxiliary equipment, and installation cost.
(2) Engineering services
The costs of engineering services such as feasibility study, detailed design, bidding procedure, and construction supervision has been estimated to be 50 million USD in total.
(3) Administration expenses Administration expenses of the project owner are also estimated, at 1.0% of the construction cost
above.
(4) Land expropriation and resettlement compensation Cost of land expropriation and resettlement compensation is estimated at 10% of the preparatory
works.
(5) Custom duty The mechanical and electrical equipments will be imported; therefore, 10% of the cost of
electrical-mechanical equipment above is estimated as a custom duty.
(6) Physical contingency Ten percent of (1)-(4) is estimated for physical contingency.
(7) Price contingency
Ten percent of (1)-(4) is estimated for price contingency.

The Study on Optimal Power Generation for Peak Demand in Turkey
67
7.2.4 Standard Development Schedule of PSPP Project
The standard development schedule of PSPP project is shown in Table 7. 5. The entire implementation period of the project will take approximately 13 years in normal case after
the start of the feasibility study.
Table 7. 5 Standard Development Schedule(Altınkaya PSPP )
7.3 Conceptual Design of Gökçekaya PSPP
As a result of the conceptual design of Gökçekaya SPP, the main features are shown in Table 7. 6 and structural drawings are presented in Figure 7. 5, Figure 7. 6. The conceptual design of the site is as follows.
7.3.1 Design of Power Generation Planning
A power generation plan is an important matter of design of the PSPP’s facilities. However, many revisions are necessary to reach an optimum plan, since features of the power generation plan are also changed by design of the facilities.
The conceptual design was carried out based on the topographical maps of 1/5,000. The main features of power generation plan were decided as shown in Table 7. 6.
Q1 Q2 Q3Q4 Q1 Q2 Q3 Q4 Q1 Q2 Q3 Q4 Q1 Q2Q3 Q4 Q1 Q2 Q3 Q4 Q1 Q2 Q3 Q4 Q1Q2 Q3 Q4 Q1 Q2 Q3 Q4 Q3 Q4 Q1 Q2 Q3 Q4
Feasibility Study
Geological Investigation
Geological Evaluation & Basic Design
Environmental Investigation
Environmental Impact Assessment
Development Organization & Funding Plan
Selection of Consultant
Detailed Design & Bidding Documents
Bid Tender for Construction Work
Construction
Preparatory Works
Civil Structure
Electro Mechanical Equipment
Transmmition Line
1st Year 2nd 3rd 4th 12th 13th5th 6th 7th 8th

The Study on Optimal Power Generation for Peak Demand in Turkey
68
Figure 7. 5 Gökçekaya PSPP General Layout

The Study on Optimal Power Generation for Peak Demand in Turkey
69
Figure 7. 6 Gökçekaya PSPP Waterway Longitudinal Section

The Study on Optimal Power Generation for Peak Demand in Turkey
70
Table 7. 6 Main Features of Gökçekaya PSPP
Description Unit Gökçekaya PSPP Installed Capacity P MW 1,400 Designed Discharge Qd m3/s 428 Effective Head Hd m 379.5
Gen
eral
Peak Duration Time hrs 7 Type Full Face Pond (Asphalt) Height H m 35 Crest Length L m 2,700 Dam (Bank) Volume V m3 1,557,000 Excavation Volume Ve m3 10,310,000 Reservoir Area Ra km2 0.5 Catchment Area Ca km2 4.8 H.W.L m 800 L.W.L m 770 Usable Water Depth m 30 U
pper
Dam
and
Res
ervo
ir
Effective Reservoir Capacity mil.m3 10.8 H.W.L m 389 L.W.L m 377.5 Usable Water Depth m 11.5
Low
er D
am
Res
ervo
ir
Effective Reservoir Capacity mil.m3 214 Intake L(m) x n m Bellmouth 34 x 1, Tunnel 396 x 1 Headrace L(m) x n m 2,028 x 1 Penstock L(m) x n m 662 x 2 , 110 x 4 Tailbay L(m) x n m 125 x 4 , 116 x 2 Tailrace L(m) x n m 476 x 1 Tailrace L(m) x n m Tunnel 53 x 1, Open 51 x 1
Wat
erw
ay
Total Length Lt m 4,051 Type Egg-shape (Underground) Overburden m 365.0 Height m 57.5 Width m 37.0 Length m 210.0 P
ower
hous
e
Cavern Volume m3 266,000 Type Single-Stage Francis Number unit 4
Tur
bine
Unit generating capacity MW 350
7.3.2 Design of the Main Structures and Equipment
(1) Design of civil structures
(a) Upper dam and reservoir The site around the upper reservoir is comparatively flat and strong and hard rocks were observed.
In addition, the width of the river is wider than that in the up- and downstream. The artificial excavation-type pond is suitable, judging from the above topographical conditions. The pond is planned to be fully faced with asphalt to prevent water leaking completely, since there are limestone outcrops around the pond. Besides, bypass channel is planned on the right bank of the pond, where there are no residents, since the pond segmentalizes the current river. The discharge capacity of the

The Study on Optimal Power Generation for Peak Demand in Turkey
71
bypass channel is designed as 76 m3/s.
(b) Intake Morning glory type of intake, which is reinforced concrete structure, is adopted and is constructed
in the bottom of the pond in order to increase the efficiency of water storage, since the upper pond is full-face artificial excavation pond. The steel liner is installed in vertical shaft and tunnel part up to the intake gate in order to prevent water leakage.
The inflow velocity in front of the screen is designed less than 0.5 m/s, and the inflow velocity in the bell mouth is designed less than 0.7 m/s according to the experiences in Japan. Since the top elevation of the mouth is 0.5 m lower than the LWL of the pond, and the height is 8.5 m, the bottom of pond around intake is tapered.
(c) Waterway and powerhouse Generally, the shortest route shall be selected between the upper reservoir and the lower reservoir
for the waterway alignment, based on the topographical and geological conditions. However, in order to avoid construction under the village on the southeast of the upper pond, waterway should be curved. The curves are planned to be located at points which have a distance of 30D from the intake to prevent drift flow in the intake. As well, the curves’ radiuses were designed as 300 m. The shape of waterway was designed as circular in order to prevent stress concentration.
1) Headrace Reinforced concrete shall be placed for the headrace lining. The inner diameter is determined as
9.2 m under the condition of maximum velocity of 6.5 m/s based on the experiences in Japan.
2) Headrace surge tank Headrace surge tank is planned to place at the joint of headrace and penstock, and the top of the
surge tank is on the ground surface of a ridge. Upper surge was estimated 40 m higher than HWL of the upper reservoir. Shaft diameter is set as 17 m, and port section diameter is set as 5.0 m according to the surging analysis. The waterway is bifurcated at the headrace surge tank.
3) Penstock The penstock is designed as a horizontal tunnel from the headrace surge tank to the upper bending
point, where the overburden depth is of more than 50 m, and as vertical shaft from the upper bending point to the lower bending point at the elevation of the pump-turbine center. Two penstocks are bifurcated to four branches in total in the lower horizontal part, and each branch is put together with the inlet valve. The maximum averaged flow velocity in the penstock is set as 10 m/s and that in the joint part is set as 20 m/s based on the experiences in Japan. The steel pipe is installed in the tunnel and shaft, and after that the space is filled with concrete.
4) Underground powerhouse
Principally, the location and direction of the powerhouse cavern are determined after excavating the exploratory adits and investigating the geological condition, e.g., initial ground pressure and rock mass properties such as by in-situ tests. In this stage, the location of the underground powerhouse is selected to make the waterway the shortest, and where its overburden depth is less than 500 m, which is the maximum value of the existing underground powerhouses.
In addition, main tunnels around the underground powerhouse such as an equipment transportation tunnel 2,650 m long, a cable tunnel of 980 m, a drainage tunnel of 970 m, etc., are planned based on the topographical maps of 1/5,000.
5) Tailbay Tailbay is defined as the waterway between the draft tube and the tailrace surge tank, and four
draft gate chambers are installed at the side of the equipment transportation tunnel above the draft

The Study on Optimal Power Generation for Peak Demand in Turkey
72
gates. Four-branched waterways are merged to two branches in the tailbay and connect to the tailrace surge tank.
6) Tailrace surge tank
A tailrace surge tank is constructed at the joint point of tailbay and tailrace, which has a port and an upper chamber because it is constructed underground. In line with that, the upper surge is not a constraint to decide the diameter of the shaft. Therefore, the inner diameter of the shaft of 10 m and the port diameter of 5.5 m are decided so that the water level of down surge is higher than the LWL of the lower reservoir minus 40 m by calculation of surging. The two branched tunnels are merged to one at the tailrace surge tank.
7) Tailrace Reinforced concrete shall be placed for the tailrace lining. The inner diameter is determined as
9.2 m under the condition of maximum velocity of 6.5 m/s based on the experiences in Japan.
(d) Outlet A lateral type of outlet is adopted, which is applied generally for outlet of PSPP. It is laid out in
line with the ridge in the lower reservoir. Since the outlet is constructed in the existing reservoir, the size of outlet shall be small in order to make the cofferdam as small as possible. In the design of the outlet, flow velocity at the opposite bank and velocity of pumping were considered, but the distance to the slope of the opposite bank is long enough and the size of mouth is designed just so as to make the averaged flow velocity at pumping operation less than 1 m/s. In addition, the top elevation of the mouth is 0.5 m lower than the LWL of the reservoir, and a 1.5 m high anti-vortex girder is planned to be installed.
(2) Design of Electromechanical Equipment
(a) Pump-turbine
A Francis-type single-stage pump-turbine is selected for the Gökçekaya PSPP in consideration of this site condition consisting of 380 m effective head and 350 MW unit capacity, which was determined through the study of optimum development scale.
Rated rotating speed of 429 min-1 is adopted in consideration of this restriction and improvement of economic efficiency by downsizing.
(b) Generator-motor
A generator-motor was designed on the same condition as Altınkaya PSPP’s, that an adjustable-speed pumped storage power system be adopted.
(3) Design of hydromechanical works
(a) Penstock and steel liner The thickness of penstock and steel liner is calculated in consideration of sharing ratio of internal
pressure by bedrock.
(b) Gate In this project, intake and outlet gates and draft gates are planned to be installed, which are slide
gates.
(4) Access road The newly built approach roads for approach/maintenance are estimated to be about 10 km long in
total and the existing 5 km roads will be altered if necessary. A plan of roads for construction shall be prepared based on the study on detailed road specifications and construction schedule.
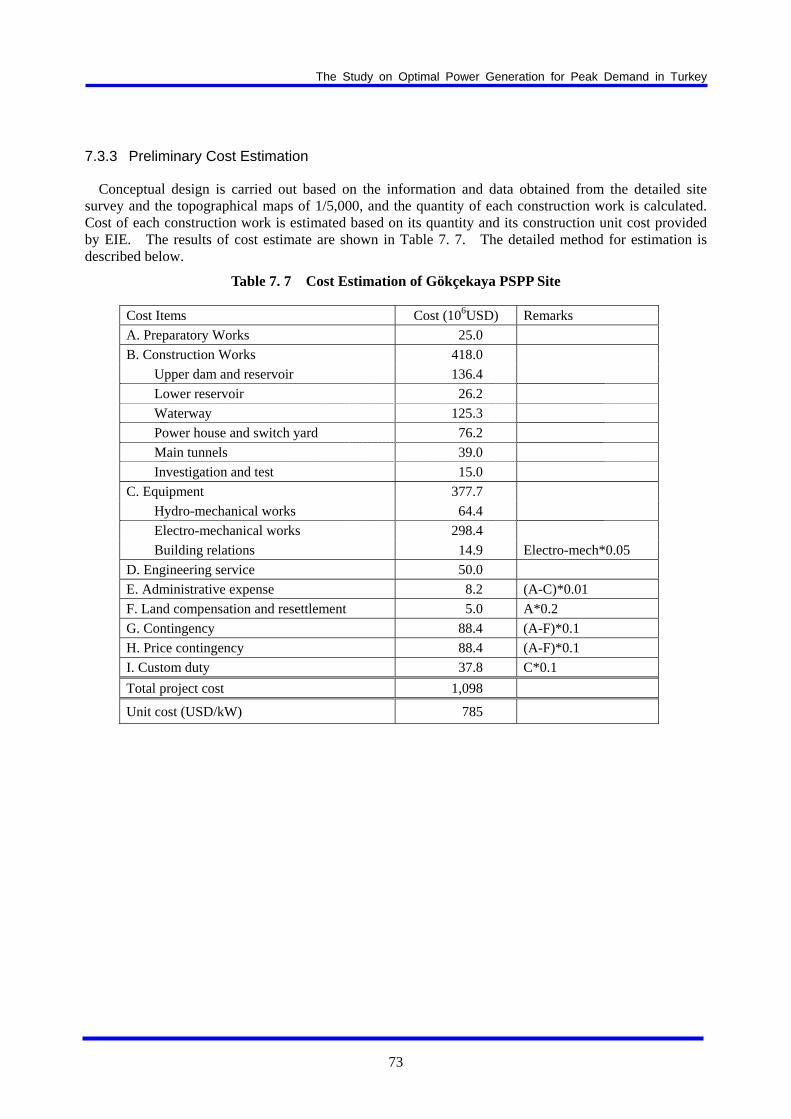
The Study on Optimal Power Generation for Peak Demand in Turkey
73
7.3.3 Preliminary Cost Estimation
Conceptual design is carried out based on the information and data obtained from the detailed site survey and the topographical maps of 1/5,000, and the quantity of each construction work is calculated. Cost of each construction work is estimated based on its quantity and its construction unit cost provided by EIE. The results of cost estimate are shown in Table 7. 7. The detailed method for estimation is described below.
Table 7. 7 Cost Estimation of Gökçekaya PSPP Site
Cost Items Cost (106USD) Remarks
A. Preparatory Works 25.0
B. Construction Works 418.0
Upper dam and reservoir 136.4
Lower reservoir 26.2
Waterway 125.3
Power house and switch yard 76.2
Main tunnels 39.0
Investigation and test 15.0
C. Equipment 377.7
Hydro-mechanical works 64.4
Electro-mechanical works 298.4
Building relations 14.9 Electro-mech*0.05
D. Engineering service 50.0
E. Administrative expense 8.2 (A-C)*0.01
F. Land compensation and resettlement 5.0 A*0.2
G. Contingency 88.4 (A-F)*0.1
H. Price contingency 88.4 (A-F)*0.1
I. Custom duty 37.8 C*0.1
Total project cost 1,098
Unit cost (USD/kW) 785

The Study on Optimal Power Generation for Peak Demand in Turkey
74
7.3.4 Standard Development Schedule of PSPP Project
The standard development schedule of PSPP project is shown in Table 7. 8. The entire implementation period of the project will take approximately 12 years in normal case after
the start of the feasibility study.
Table 7. 8 Standard Development Schedule(Gökçekaya PSPP )
Q1 Q2 Q3Q4 Q1 Q2 Q3 Q4 Q1 Q2 Q3 Q4 Q1 Q2Q3 Q4 Q1 Q2 Q3 Q4 Q1 Q2 Q3 Q4 Q1Q2 Q3 Q4 Q1 Q2 Q3 Q4 Q3 Q4 Q1 Q2 Q3 Q4
Feasibility Study
Geological Investigation
Geological Evaluation & Basic Design
Environmental Investigation
Environmental Impact Assessment
Development Organization & Funding Plan
Selection of Consultant
Detailed Design & Bidding Documents
Bid Tender for Construction Work
Construction
Preparatory Works
Civil Structure
Electro Mechanical Equipment
Transmmition Line
11th 12th5th 6th 7th 8th1st Year 2nd 3rd 4th
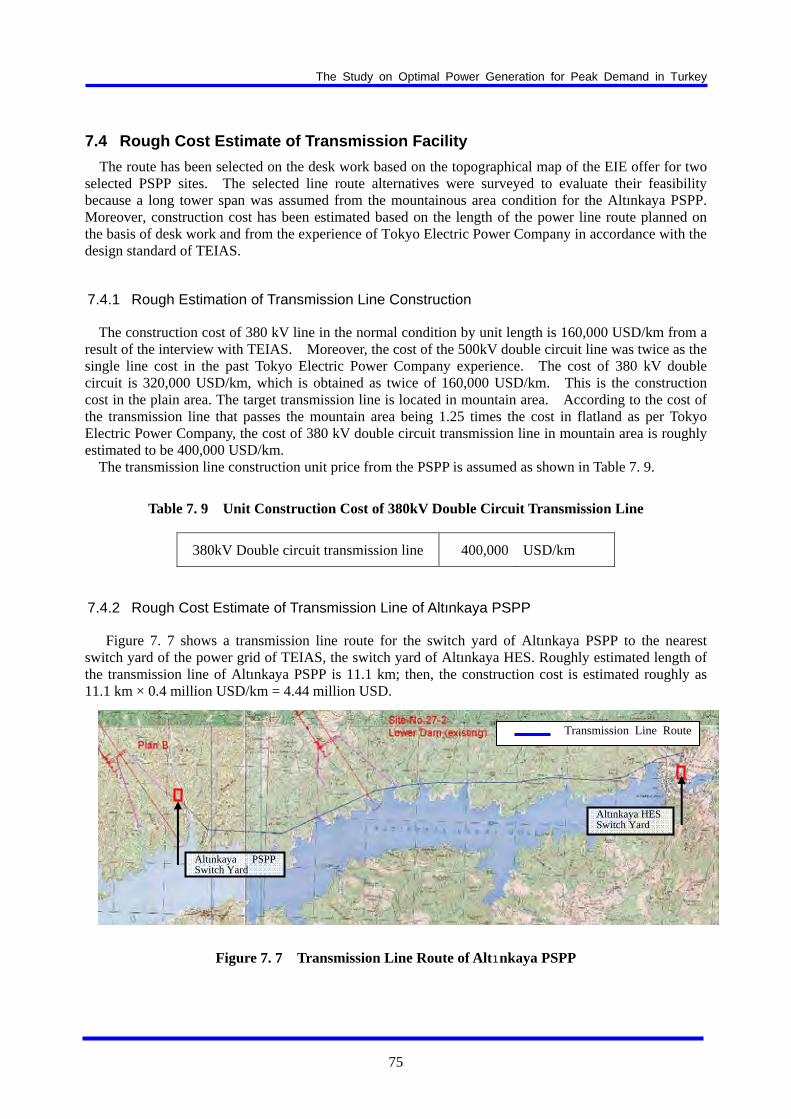
The Study on Optimal Power Generation for Peak Demand in Turkey
75
7.4 Rough Cost Estimate of Transmission Facility The route has been selected on the desk work based on the topographical map of the EIE offer for two
selected PSPP sites. The selected line route alternatives were surveyed to evaluate their feasibility because a long tower span was assumed from the mountainous area condition for the Altınkaya PSPP. Moreover, construction cost has been estimated based on the length of the power line route planned on the basis of desk work and from the experience of Tokyo Electric Power Company in accordance with the design standard of TEIAS.
7.4.1 Rough Estimation of Transmission Line Construction
The construction cost of 380 kV line in the normal condition by unit length is 160,000 USD/km from a result of the interview with TEIAS. Moreover, the cost of the 500kV double circuit line was twice as the single line cost in the past Tokyo Electric Power Company experience. The cost of 380 kV double circuit is 320,000 USD/km, which is obtained as twice of 160,000 USD/km. This is the construction cost in the plain area. The target transmission line is located in mountain area. According to the cost of the transmission line that passes the mountain area being 1.25 times the cost in flatland as per Tokyo Electric Power Company, the cost of 380 kV double circuit transmission line in mountain area is roughly estimated to be 400,000 USD/km.
The transmission line construction unit price from the PSPP is assumed as shown in Table 7. 9.
Table 7. 9 Unit Construction Cost of 380kV Double Circuit Transmission Line
380kV Double circuit transmission line 400,000 USD/km
7.4.2 Rough Cost Estimate of Transmission Line of Altınkaya PSPP
Figure 7. 7 shows a transmission line route for the switch yard of Altınkaya PSPP to the nearest switch yard of the power grid of TEIAS, the switch yard of Altınkaya HES. Roughly estimated length of the transmission line of Altınkaya PSPP is 11.1 km; then, the construction cost is estimated roughly as 11.1 km × 0.4 million USD/km = 4.44 million USD.
Figure 7. 7 Transmission Line Route of Altınkaya PSPP
Transmission Line Route
Altınkaya PSPP Switch Yard
Altınkaya HESSwitch Yard

The Study on Optimal Power Generation for Peak Demand in Turkey
76
7.4.3 Rough Cost Estimate of Transmission Line of Gökçekaya PSPP
Roughly estimated length of the transmission line of Gökçekaya PSPP is 1.8 km; then, the construction cost is estimated roughly as 1.8 km × 0.4 million USD/km = 0.72 million USD.
Figure 7. 8 Transmission Route of Gökçekaya PSPP
Transmission Line Route
Gökçekaya PSPP Switch Yard
Gökçekaya HES Switch Yard

The Study on Optimal Power Generation for Peak Demand in Turkey
77
7.4.4 Status of Power Flow of 380 kV System with Operating PSPP
(1) Required circuits of the transmission lines for PSPP operation The PSPP is connected to the base system and the required circuits of the 380 kV transmission lines
for PSPP operation are estimated according to the system criteria set out in the previous section.
(a) Required circuits of the transmission lines for Altınkaya PSPP operation The required circuits of the 380 kV transmission lines for Altınkaya PSPP operation were estimated
in the base system. Altınkaya PSPP was assumed to be connected to the Altınkaya hydropower station by the double circuits of 380 kV transmission lines.
When the Altınkaya PSPP is operated following Generation Pattern A, the 380 kV system would not have any overloaded circuits in the normal operation. However, the intervals of Altınkaya–Kayabasi–Baglum–Sincan and that of Boyabat–Cankiri become overloaded when a single circuit fault occurs at some other circuits.
When the Altınkaya PSPP is operated following Generation Pattern B, the 380 kV system would not have any overloaded circuits in the normal operation and when a single circuit fault occurs at some other circuits.
Thus, the following circuits are to be added so that the system becomes compatible with Generation Pattern A when the Altınkaya PSPP is operated:
Altınkaya PSPP–Altınkaya hydropower station 380 kV 11.1 km double circuit Altınkaya –Kayabasi–Baglum–Sincan 380 kV 394 km single circuit Cayirihan–Adapazari 380 kV 136 km single circuit
There are no overloaded circuits at normal operation or in case of a single circuit fault when
Altınkaya PSPP pumps up the water during the off-peak period of time after the above-mentioned reinforcement. Furthermore, the results of the system stability analysis described later show that there are no significant problems in the system for the case of the single circuit fault at the interval of the transmission line with long length and heavy load conditions.
(b) Required circuits of the transmission lines for Gökçekaya PSPP operation The required circuits of the 380 kV transmission lines for Gökçekaya PSPP operation were
estimated in the base system. Gökçekaya PSPP was assumed to be connected to the Gökçekaya hydropower station by the double circuits of 380 kV transmission lines.
When the Gökçekaya PSPP is operated following Generation Pattern A, the 380 kV system would not have any overloaded circuits in the normal operation. However, the intervals of Gökçekaya–Eskisehir and the interval of Gökçekaya–Adapazari become overloaded when a single circuit fault occurs in some other circuits.
When the Gökçekaya PSPP is operated following Generation Pattern B, the 380 kV system would not have any overloaded circuits in the normal operation. However, the intervals of Gökçekaya–Eskisehir and the interval of Gökçekaya–Adapazari become overloaded when a single circuit fault occurs in some other circuits.
Thus, the following circuits are to be added so that the system becomes compatible with Generation Patterns A and B when the Gökçekaya PSPP is operated:
Gökçekaya PSPP–Gökçekaya hydropower station 380 kV 1.8 km double circuit Gökçekaya PSPP (or Gökçekaya hydropower station) – Adapazari 380 kV 100 km single
circuit There are no overloaded circuits at normal operation or in case of a single circuit fault when
Altınkaya PSPP pumps up the water during the off-peak period of time after the above-mentioned reinforcement. Furthermore, the results of the system stability analysis described later show that there are no significant problems in the system for the case of the single circuit fault at the interval of the transmission line with long length and heavy load conditions.

The Study on Optimal Power Generation for Peak Demand in Turkey
78
7.5 Prioritization of PSPP Development Priority of the two conceptual design sites (Altınkaya PSPP and Gökçekaya PSPP) was evaluated. The evaluation points are as follows. First, rank was put on each PSPP by evaluation point; second,
comprehensive rank was put on each PSPP. - Social and natural environment impact - Construction cost (power plant, transmission line) - Distance from the demand center
Since contribution for the power system stability is considered as an evaluation point, the contribution by each PSPP project is described in another section.
Meanwhile, since the transmission lines of both PSPPs are planned to connect to the existing 380 kV switch yard of the hydropower plant, the construction cost of the connecting transmission line and the newly expanded transmission lines described in Section 7.4.6 are included.
The comprehensive rank of two priority PSPPs is shown in Table 7. 10.
Table 7. 10 Comprehensive Rank of Two Priority PSPP Projects
Evaluation Point Altınkaya PSPP Gökçekaya PSPP Installed Capacity 1,800MW 1,400MW
Standard Development Schedule
13 years 12 years
Social
Number of Directly Affected Houses: 0 HH Loss of Water mill: 2 units Loss of Agricultural Land: 16 ha
Number of Directly Affected Houses: 2 HH (Both of them are second houses) Loss of Storage for Animal Breeding: 2 houses Loss of Agricultural Land: 110 ha Several tens’ Graves to be relocated Two new deep wells to be drilled
Env
iron
men
t Im
pact
Natural Some direct impacts to the environment, but limited.
Quite limited-direct impacts to the environment
Power Plant 1,201mil. USD, 667 USD/ kW 1,098 mil. USD, 785 USD/ kW
Transmission Line
100 mil. USD (530km+11km) 19 mil. USD (100km+2 km)
Con
stru
ctio
n C
ost
Total 1,301mil. USD, 723 USD/ kW 1,117 mil. USD, 798 USD/ kW
Distance from Ankara About 300 km About 170 km
Rank of Environment ① ②
Rank of Economy ① ②
Comprehensive Rank ① ②

The Study on Optimal Power Generation for Peak Demand in Turkey
79
7.6 Recommendation of Investigation Works for Next Step
7.6.1 Hydrological and Metrological Investigation
Although either of the conceptual design PSPP sites is planned to utilize the existing reservoir as a lower reservoir, it is recommended to install a gauging station near the upper dam site and measure hydrological data and meteorological data for the following main purposes:
Altınkaya PSPP For design of the upper dam such as sedimentation volume, flood discharge, and dam height and construction planning
Gökçekaya PSPP For design of the upper reservoir such as bypass channel around reservoir and countermeasure of sediment, and construction planning
7.6.2 Geological Investigation
(1) Altınkaya PSPP Items to be clarified in the next step and recommendable geological investigation and laboratory tests
for each item are summarized in Table 7. 11.
Table 7. 11 Proposal of Geological Investigation Works in the FS Stage for Altınkaya PSPP
Structure Purpose Investigation item Notes Upper dam / Reservoir
Geological structure Geotechnical Property of dam
foundation Permeability of dam foundation
and hydrogeological feature of the reservoir
Slaking properties of mudstone
1. Surface survey 2. Seismic prospecting 3. Drilling 4. Lugeon test 5. Long-term water level
observation in bore-holes 6. laboratory tests
Quarry site Quality of aggregate for concrete gravity dam, rock material for CFRD
1. Seismic prospecting 2. Drilling 3. Laboratory tests
Intake Geological property of the intake and its surrounding area
1. Seismic prospecting 2. Drilling 3. Laboratory tests
* Surface survey intends for whole area of the upper reservoir
Waterway/ Surge tank
Geotechnical feature of the waterway route (possibility of hidden weak zone such as fracture zones and hydrothermal altered zones)
1. Seismic prospecting 2. Drilling (including sonic
logging in bore-hole) 3. Lugeon test 4. Laboratory tests
Underground Powerhouse
Geological structure Geotechnical Property of the
UGPH and neighboring rocks
1. Surface survey 2. Drilling (including sonic
logging in bore-hole) 3. Lugeon test 4. Laboratory tests
* Seismic prospecting intends for only a waterway route
* Surface survey intends for surrounding area of the surge tank and the UGPH

The Study on Optimal Power Generation for Peak Demand in Turkey
80
Geological structure Subsurface loosened zone
caused by rock creeping of the outlet site
Weathering condition of the outlet site
1. Surface survey 2. Seismic prospecting 3. Drilling 4. Laboratory tests
Outlet/ Coffer dam
Geological condition of coffer dam foundation
1. Drilling 2. Laboratory tests 3. Sonic prospecting
* Surface survey intends for surrounding area of the outlet and along the service road in Altınkaya lake side
(2) Gökçekaya PSPP
Items to be clarified in the next step and recommendable geological investigation and laboratory tests for each item are summarized in Table 7. 12.
Table 7. 12 Proposal of Geological Investigation Works in the FS Stage for Gökçekaya PSPP
Structure Purpose Investigation item Notes Upper dam /reservoir
Geological structure Geotechnical Property of the
dam foundation Permeability of the dam
foundation and hydrogeological feature of reservoir
Hydrogeological feature of Temg, PEg and boundary between Temg and PEg
Presence of expansive clay minerals
1. Surface survey 2. Seismic prospecting 3. Two-dimensional
resistivity prospecting 4. Drilling (including sonic
logging in bore-hole) 5. Standard Penetration test 6. Lugeon test 7. Long-term water level
observation in bore-holes8. Laboratory tests including
XRD Analysis Intake Geological properties of intake
and its surrounding area
1. Drilling (including sonic logging in bore-hole)
2. Laboratory tests
* Surface survey intends for whole area of the upper reservoir
* Both Seismic prospecting and Two-dimensional resistivity prospecting should be conducted on the same line
*SPT should be taken at the weathered zone in borehole
Waterway/ Surge tank
Geological feature of the waterway route
1. Seismic prospecting 2. Drilling (including sonic
logging in bore-hole) 3. Lugeon test 4. Laboratory tests
Underground Powerhouse
Geological structure
1. Surface survey 2. Drilling (including sonic
logging in bore-hole) 3. Lugeon test 4. Laboratory tests
*Seismic prospecting is conducted for only the waterway route
* Surface survey is
conducted for surrounding area of the surge tank and the UGPH
Geological structure Subsurface loosened zone by
rock creeping Weathering depth and
geotechnical properties of outlet and surrounding area
1. Surface survey 2. Seismic prospecting 3. Drilling 4. Laboratory tests
Outlet/ Coffer dam
Geological condition of the coffer dam foundation
1. Drilling 2. Laboratory tests 3. Sonic prospecting
* Surface survey is conducted for surrounding area of the outlet on the right bank of Gökçekaya reservoir

The Study on Optimal Power Generation for Peak Demand in Turkey
81
7.6.3 Feasibility Study
(1) Scope of Work
For the first feasibility study on the PSPP projects, not only technical examination but also study on development program of PSPP such as necessity (scale, timing), operation, ownership and framework, etc. should be carried out.
(2) Implementation Schedule of Feasibility Study
Duration of the feasibility study will be two years as shown in Table 7. 13.
Table 7. 13 Draft Schedule of Feasibility Study and Development
2011 2012 2013 2014 2015 2016 2017 2018 2019 2020 2021 2022 2023 20241 2 3 4 5 6 7 8 9 10 11 12 1 2 3 4 5 6 7 8 9 10 11 12 1 4 7 10 1 4 7 10 1 4 7 10 1 4 7 10 1 7 1 7 1 7 1 7 1 7 1 7 1 4 7 10 1 4 7 10
The Study on Optimal Power Generation for Peak Demand
Completion of Final Report
Feasibility Study
Consultant Selection
Hydrological Data Measurement
Geological Investigation
Necessity, Operation and Framework
Geological Evaluation and Basic Design
Enironmental Investgation and Assessment
EIA Preparation
Additional Site Investigation for EIA
Draft EIA, EMP, RAP
Disclusure and Finalization of EIA
Financing Plan
Appraisal by Lender
Project Preparation
Consultant Selection
D/D, Bidding Document Preparation
Tendering
Project Implementation
Preparation Works
Construction Works
Commercial Operation
LA
Tendering
Contract
Operation of No.1 UnitOperation of No.2 Unit
LA: Loan Agreement

The Study on Optimal Power Generation for Peak Demand in Turkey
82
Chapter 8 Recommendations from the Study Team
8.1 Proposal on Long-Term Development Plan
(1) Avoid risk from users’ point of view In Turkey liberalization of the electricity market is proceeding and there are many players in the
power sector. Each player has its own interest and carries out its own business activity. Therefore, risk items vary from player to player and one way of hedging risks for some could be risk for the others.
In this chapter, risks in power supply will be studied from users’ viewpoints. There are two major risks for users: Decline of electricity quality Sharp rise of electricity prices When the above-mentioned risks are taken into account, small-scale general power users would be
left with the only option to avoid the risks, that is, not to want to purchase power. Therefore, if there is no alternative to electricity, general users who wish to buy power would be forced to purchase power from distribution companies despite quality or price levels.
In the course of liberalization of the electricity market, power generation companies in the private sector make decisions fully based on the cost basis. This means that they make decisions on the development of certain power plants when they judge they can supply power at lower prices via those plants than with other power plants. For this reason, electricity prices generally tend to decline. However, because private generation companies seek to maximize profit under the current system in which revenue increases according to utilization amounts, they constantly strive to operate their plants at 100% of their capacity.
On the other hand, in order to ensure stable power system operation and supply quality power to
users, they need to satisfy the following two points:
(a) Secure reserve supply capacity In a case of emergencies such as sudden forced outage of power plants or demand surge, it is
necessary to secure certain generation equipment to generate reserve supply capacity and keep it on standby in an operative state at all times. Expecting to purchase power from other countries can be an option, but it would depend on the supply/demand condition of those countries. Therefore, it is essential to secure at least 3% or higher of the total power demand as reserve supply capacity within the country in preparation for a single unit of the largest output being shut down.
Equipment designated as providing reserve supply capacity is forced to stand by at normal time; thus, it operates at very low annual utilization rate of 10% or lower. Therefore, under the current system, it is very unlikely that private generation companies develop such facilities themselves. Hence it is feared that in the near future reserve supply capacity will run short, leading to blackout in wide areas on sudden shutdown of power plants.
(b) Secure frequency adjustment capabilities
In order to maintain the frequency of the power system, it is necessary to change the output of power plants as well as to match the demand profile which changes at every minute and every second. Giving command on output adjustment of power plants is basically conducted by a system operator. However competent a system operator is, without a power plant which can flexibly change output in accordance with the intentions of the system operator, it is impossible to supply power with quality to users. In other words, from the viewpoint of supplying good-quality power to users, it is absolutely

The Study on Optimal Power Generation for Peak Demand in Turkey
83
necessary to have generation equipment whose output can be changed fast and to which a system operator can give command freely at its will.
EUAS-owned generation equipment currently accounts for more than half of the entire plants, and at power plants which are capable of frequency adjustment, frequency adjustment is carried out based on the system operator’s command. In the near future, however, such power plants will be sold to private generation companies. Therefore, there are concerns that frequency adjustment function will be missing, which in turn will lower the power quality.
As mentioned above, from the viewpoint of securing power quality, it would be problematic to
leave everything to the free will of private generation companies. It is important for the public sector that represents users to stay involved. Specific measures are described as follows: Design a system which makes private generation companies feel attracted to make frequency
adjustment and standby operation. Build a system under which reasonable amount will be paid for all ancillary services
The public sector owns power plants which contribute to the improvement of power quality (or owns right to freely operate them).
Oblige all private generation companies to provide ancillary service based on their generation output. Also, by mandating private generation companies that are unable to provide the service to purchase it from other private generation companies, the ancillary service market will be formed.
(2) Development plan of transmission network
TEIAS naturally has formulated the transmission network development plan. In the past, TEIAS obtained information on a future power plant development plan from EUAS and made efficient planning of transmission networks. However, with the power market increasingly getting liberalized, it is getting more difficult to obtain information on the power plant development plan. Therefore, it is becoming increasingly difficult to make an efficient planning of the transmission network development.
Power demand of Turkey is expected to grow at high levels of 6-7% a year from now on. With this demand forecast, in 2020 it will roughly double the current level, and triple in 2030. There is a need to develop transmission networks along with power plants in an accelerating manner in response to such demand growth. If a transmission network plan is formulated based on information on a relatively short-span planning of power plant development (about 5 years), only focusing on the transmission methods of those power plants in a near-sighted manner, it may lead to weakening transmission lines and higher cost.
Since power demand is expected to roughly triple the current level in 2030, it is likely that the current highest voltage of 380 kV transmission lines will reach the limit and higher-voltage lines will become necessary. In order to build transmission networks which have achieved stability and efficiency in a well-balanced manner in the future, the introduction of higher-voltage lines should be taken into account in formulating a future vision, and based on that vision transmission networks must be laid systematically.
Furthermore, in order to promote the selection of sites close to where power is needed, which can contribute to lower cost, or choose sites with smaller supply capacities from supply/demand balancing perspective, it is desirable to give incentives to power plant sites and introduce a system to induce the installation of power plants in areas that transmission companies find desirable.

The Study on Optimal Power Generation for Peak Demand in Turkey
84
8.2 Recommendation for Construction of PSPP
8.2.1 Introduction of Advanced Technologies
Since the following two advanced technologies of civil works have a high possibility to make the reduction of construction cost of Altınkaya PSPP, whose water head is very high and unit capacity is large, it is recommended to study the introduction of these advanced technologies for Altınkaya PSPP. In addition, since there is a high possibility to improve the PSPP function significantly by introducing an advanced technology of the electromechanical equipment, it is recommended to study the introduction of an advanced technology to both Altınkaya and Gökçekaya PSPPs.
Civil structures ・ Full-face tunnel boring machine (TBM) ・ High-tensile-strength steel (HT100)
Electromechanical equipment ・ Splitter runner
(1) Full-face tunnel boring machine (TBM) for excavation of inclined penstock shaft
The merits of adopting this technology are as follows: In the conceptual design of Altınkaya PSPP, the conventional method of Alimac Climber is
considered as an excavation method for pilot tunnel of inclined penstock shaft. In this case, two interlevel working tunnels are required because the tunnel length excavated by Alimac Climber is limited to 300 m; on the contrary, the length of the inclined penstock shaft in Altınkaya PSPP is about 900 m.
The benefits of adopting a full-face TBM are as follows: Construction period of inclined shaft tunnel excavation is shortened. Safety of tunnel excavation is improved significantly. Penstock interlevel working tunnel can be omitted. Risk of choke of pilot tunnel can be hedged.
(2) High-tensile-strength steel (HT100)
In the conceptual design of Altınkaya PSPP, high-tensile-strength steel of HT80 is used for the penstock and the maximum thickness of steel pipe is estimated as 80 mm. HT100 can make the ratio of inner pressure burdened by surrounding rock of embedded penstock increase and reduce the total weight of penstock by more than 20% in comparison to HT80. Moreover, in line with the reduction of weight, the construction period of penstock also can be shortened by about 20%.
(3) Splitter runner
A splitter runner is newly developed for Francis-type reversible pump-turbine to enhance added value such as improvement of pump-turbine efficiency, expansion of output adjustable range, and applicability to the site with high head change ratio.
Figure 8. 1 shows a conceptual diagram and a photo of splitter runner which was installed in the Kannagawa PSPP.

The Study on Optimal Power Generation for Peak Demand in Turkey
85
Figure 8. 1 Splitter Runner
It has a structure that full blades and splitter blades are arranged alternatively. In the Kannagawa PSPP equipped with the splitter runner, reversible pump-turbine efficiency was improved by 1.5% and operable range was expanded by 1.2 times in comparison to that of a conventional type.
The advantages by adopting this technology are as follows:
To improve reversible pump-turbine efficiency due to rectification of flow pattern by increase in the number of blades and reduction of disk friction loss by downsizing of the runner diameter The economical benefit of efficiency improvement is to reduce the pumping power cost with low power losses through pumping and generating cycle.
To expand output adjustable range due to reduction of pressure fluctuation and improvement of cavitation performance The economical benefit of output’s adjustable range expansion is to allow thermal power plants to operate at high efficiency level, since additional operational reserve for automatic frequency control (AFC) is secured by minimizing the output level of PSPP improved with splitter runner. The improvement of minimum output level for generating operation reduces the pumping power. In addition, reduction of pressure fluctuation and pump-turbine oscillation lead to the extension of equipment life and reduction of maintenance cost.
To enhance the reliability of runner in line with the improvement of runner rigidity by increase in the number of blades
8.2.2 Environmental and Social Considerations
Environmental and social considerations for PSPP are not so different from those of ordinary large-scale hydropower projects, but special attentions to be paid for PSPPs are as follows:
1) Related to reservoir location
Since it has two reservoirs whose elevations are quite different, the water quality and temperature might also be different. Therefore, influence to water quality should be considered.
Ecosystem or biological systems of the reservoirs might be different. Therefore, influence to aquatic plants and animals should be carefully considered.
Main Blade (Long Blade)
Splitter Blade (Short Blade)

The Study on Optimal Power Generation for Peak Demand in Turkey
86
2) Related to plant operation Water of two reservoirs is mixed during plant operation. Therefore, influence on water
quality, especially temperature, turbidity, and other quality items, should be considered. Daily draw-up and draw-down depths of reservoirs are large. Therefore, influence on
users’ activities and safety in the reservoirs should be considered. 3) Related to the scale of development
PSPP project consists of two dams, many tunnels, underground structures, and related access roads; hence, a wide range of land might be altered. Therefore, negative impact on local residents such as involuntary resettlement and changes of livelihood should be carefully considered. Negative impacts on important flora and fauna could also be the same.
The following are quite important in order to reduce the negative impacts as much as possible:
1) Not to select project sites which have heavy environmental load in the stage of potential study 2) To carry out sufficient site survey in order to understand the current environmental and social
situation 3) To propose effective mitigation measures against negative impacts through appropriate
assessment method in consideration of features of PSPP 4) To conduct sufficient monitoring
The Study Team prepared “Guidelines for Environmental and Social Considerations for PSPP Development” together with the counterpart of EIE. It is expected that the guidelines will be utilized for PSPP development in the future.
8.3 Suggestion for Possession of PSPP The liberalization of the electric power market is being progressed in Turkey, and public sector
organizations are not allowed to construct new power plants except for emergency cases under the current regulation. Therefore, “Who will construct a PSPP and how will its development fund be recovered?” will be the critical issue when developing PSPP in the future.
Since the liberalization of the electric power market in 2001, small-sized power plants such as gas-fired thermal and run-of-river type hydro have been mainly constructed because those types of power plants have little risks due to their prospective short development term and stable revenue. As a result, many of the large scale power plant projects are retarded, and it is anticipated that the power shortage might occur in the near future. Meanwhile, it is considered that Turkey’s electric power market will be operated in accordance with the rules of EU network in the future since they are interconnected since September 2010.
Considering these situations, ownership and operation schemes of PSPP are studied in this section, for future PSPP development.
8.3.1 Ownership and Operation Schemes of PSPP in Other Countries
(1) EU Area Turkey’s electric power network was interconnected and synchronized with EU network through
Greece and Bulgaria, in September 2010. After 1 year of various tests in synchronized operation, Turkey is planned to join EU power market. After the power market integration, the generated power in Turkey will be traded in European network, and the power of PSPP will also be included naturally.
In addition, EU committee is implementing “20-20-20 Strategy”, which is to reduce greenhouse effect gas by 20%, increase the ratio of renewable energy in generated power energy to be more than 20%, and improve energy efficiency by 20%, all by 2020. Due to the effect of increasing renewable energy sources, issues of reserving power plants for demand supply control and network stabilizing

The Study on Optimal Power Generation for Peak Demand in Turkey
87
facility are emerged. In this background, current situation of PSPP in European network is overviewed, taking RWE of Germany and Terna of Italy as example.
(a) Germany - RWE network
Operation pattern of PSPP greatly changed by introducing power market in 1998. Before the liberalized power market, PSPP was usually pumped up at off peak hours and generated at peak hours, while in the situation under the market, in order to sell PSPP’s reserves for both generating and pumping, regardless of peak or off peak hours, it is always planned to keep reserve and is not set at its full output. In this situation, frequent generation and pumping operations are planned, and startup times are increased by 78% from before market as a result. Due to the requirement of N-1 reserve for power generator as stated above, and other requirement to secure “black start reserve,” hydro power plants are mainly utilized for its requirement because of their characteristics of quick startup and output change rate, therefore availability of PSPP has been decreased due to keeping reserves. For other power plants such as thermal power as well, they need to operate at its minimum output to reserve backup power in some cases, and this causes to make efficiency lower.
In the course of implementing ancillary services, TSO can prepare generation capability from the secondary market for the reserve of secondary frequency control. TSO purchases option of secondary reserve on future designated time from a power generator so that it will be able to purchase the reserve at listed price, choosing from the secondary market that 9 power generators make bids for every 15 minutes. When it comes to the designated time, TSO has the option whether it would activate its option and purchase reserve as determined or not, judging from current situation of market and demand supply condition.
Due to massive introduction of renewable energies, such as wind power, in recent years, there occurred cases of shortening reserves for demand supply control at off peak hours, and of negative price in the power market as a result. In 2009, wind power outputs were suppressed for the first time due to the shortage of primary reserve, and on December 26, 2009, the price in the power market recorded - 200Euro/MWh due to the low demand on holiday and the high wind power output.
It is planned to introduce 30GW of photovoltaic power by 2020, and to abolish nuclear power plants, which may cause more shortages of primary reserve, even in peak hours, and shortages of reactive power sources. Therefore, German government recognizes the necessity of PSPP development, as a measure of securing power supply quality.
Source: RWE
Figure 8. 2 PSPP Operations before and after Introducing Power Market

The Study on Optimal Power Generation for Peak Demand in Turkey
88
(b) Italy – Terna network While Enel was the integrated power company in Italy, after disintegration of power generation and
transmission, Enel became a generation company, and Terna became the TSO. Currently, most of PSPP in Italy were owned by Enel and more than 90% of Italy’s PSPP are owned by Enel and Edipower.
Power market was introduced in 2005, with which one is the Energy Market for generated power, operated by GME (Gestore dei Mercati Energetici S.p.A.), and the other is the Ancillary Service & Balancing Market for secondary reserve, operated by Terna. For each power generator, 1.5% of its generation capacity is required to keep as the primary reserve.
In 2010, average price of power in the Energy Market is around 70Euro/MWh, with around 90Euro/MWh at peak hours and around 40Euro/MWh at off peak hours. In the Ancillary Service & Balancing Market, the price is approximately twice of that of the Energy Market, 120-140Euro/MWh.
The basic operation scheme of PSPP is to purchase energy from the Energy Market for pumping up, and to sell generated energy in the Ancillary Service & Balancing Market. According to the records in 2008 and 2009, generation was traded in the Energy Market for 74% and in the Ancillary Service & Balancing Market for 26%, while pumping was traded in the Energy Market for 52% and in the Ancillary Service & Balancing Market for 48%.
On the Ancillary Service & Balancing Market, the prices of output raise and down are applied for bid at every hour. Terna makes the price list of reserve power for the following day based upon the bid result, operates based upon the list, and makes payment based upon the operation result. The output of PSPP is traded at the Ancillary Service & Balancing Market throughout a day for both directions of generation and pumping, which shows its contribution to stabilize the network frequency through the market, as well as the role of peak supply.
In accordance with the target of 2020 in EU Committee, Italy Government started to develop massive renewable energy, 12GW of wind power, 8GW of photovoltaic, and 8GW of bio-mass generation plants. Most of the wind power and photovoltaic plants are planned to construct in the southern region of Sicilia and Sardegna due to the climate and environmental situation, but since demand is low in this area, improvement of transmission network will be necessary in order to transmit power from the south to the central and northern regions of Italy.
So far, the shortage of the primary reserve in off peak hours due to increasing wind power is not very serious, and the output of wind power is not suppressed. However, it is recognized that the facilities of maintaining frequency and voltage in the transmission network will be further required as increasing renewable energy and long distance transmission line. In order that, Italian Government considers to allow Terna to develop and install the facility for stabilizing power network, and Terna started the study of the feasibility of PSPP, energy storage equipment such as battery, and SVC for this purpose.
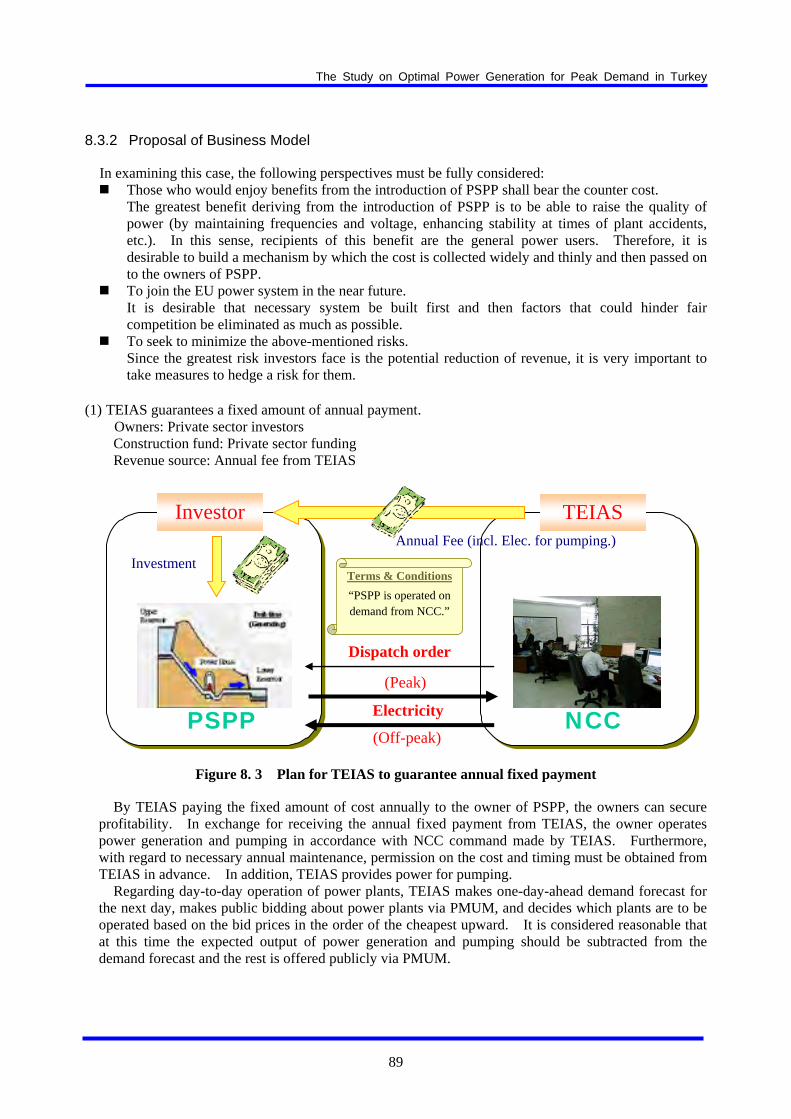
The Study on Optimal Power Generation for Peak Demand in Turkey
89
8.3.2 Proposal of Business Model
In examining this case, the following perspectives must be fully considered: Those who would enjoy benefits from the introduction of PSPP shall bear the counter cost.
The greatest benefit deriving from the introduction of PSPP is to be able to raise the quality of power (by maintaining frequencies and voltage, enhancing stability at times of plant accidents, etc.). In this sense, recipients of this benefit are the general power users. Therefore, it is desirable to build a mechanism by which the cost is collected widely and thinly and then passed on to the owners of PSPP.
To join the EU power system in the near future. It is desirable that necessary system be built first and then factors that could hinder fair competition be eliminated as much as possible.
To seek to minimize the above-mentioned risks. Since the greatest risk investors face is the potential reduction of revenue, it is very important to take measures to hedge a risk for them.
(1) TEIAS guarantees a fixed amount of annual payment. Owners: Private sector investors Construction fund: Private sector funding Revenue source: Annual fee from TEIAS
Figure 8. 3 Plan for TEIAS to guarantee annual fixed payment
By TEIAS paying the fixed amount of cost annually to the owner of PSPP, the owners can secure profitability. In exchange for receiving the annual fixed payment from TEIAS, the owner operates power generation and pumping in accordance with NCC command made by TEIAS. Furthermore, with regard to necessary annual maintenance, permission on the cost and timing must be obtained from TEIAS in advance. In addition, TEIAS provides power for pumping.
Regarding day-to-day operation of power plants, TEIAS makes one-day-ahead demand forecast for the next day, makes public bidding about power plants via PMUM, and decides which plants are to be operated based on the bid prices in the order of the cheapest upward. It is considered reasonable that at this time the expected output of power generation and pumping should be subtracted from the demand forecast and the rest is offered publicly via PMUM.
Investment
Dispatch order
Electricity NCC PSPP
Investor TEIAS
Terms & Conditions
“PSPP is operated on demand from NCC.”
Annual Fee (incl. Elec. for pumping.)
(Peak)
(Off-peak)

The Study on Optimal Power Generation for Peak Demand in Turkey
90
(2) Supply power and carry out ancillary service on completely free market. Owner: Private sector investors Construction fund: Private sector funding Revenue source: Counter price for power supply + Power system ancillary service counter price Owners of PSPP provide power and ancillary service on the completely free market and receive
counter price as their revenue source. It is exactly the same with the EU system; thus, there is very little possibility that EU will issue directives to mandate improvements.
In order to make this plan feasible, it is necessary to appropriately evaluate functions of PSPP and build a system under which appropriate counter prices are paid in accordance with the functions. Specifically there could be the following two plans:
(a) Set reasonable unit prices for various ancillary services which PSPP can provide.
Set unit prices for the following services and TEIAS pays the counter prices in accordance with the amount of service. Per-second frequency adjustment (daytime, rapid demand growth in the morning, nighttime) Per-minute frequency adjustment (daytime, rapid demand growth in the morning, nighttime) Backup operation (in case of emergencies such as supply drop due to plant accidents or sharp
demand surge, systems are maintained ready for operation at all times, and in a case of actual emergency, the plant gets connected to the power system in parallel to supply power)
Voltage adjustment (reactive power generation)
(b) Oblige all power plants to offer ancillary service. Mandate the provision of ancillary service in accordance with the generation output to all power
plants which provide power (including renewable energy). By taking this measure, in a case of trying to operate power plants without a function to provide ancillary service, it becomes necessary to operators to have other power plant to substitute its function. This naturally creates an ancillary service market among power generation companies.
(3) Direct construction and ownership by TEIAS.
Owner: TEIAS Fund: Public investment (or private sector funding) Revenue source: Wheeling charge PSPP is considered to be a facility to stabilize frequencies and voltages of the power system and
improve the quality of power to be provided. Based on this thinking, TEIAS constructs, owns, and operates PSPP freely on its own judgment just like substations and transmission lines. To recover the invested capital cost, it is factored into the calculation of unit price of wheeling charge and is collected widely from general power users.
(4) Guarantee by TEIAS to pay fixed plant fee rate (take or pay contract)
Owners: Private investors Construction fund: Private funding Revenue source: Power supply counter price + (In a case of low operation TEIAS guarantees the
purchase.) This is a plan in between Plan (1) and Plan (2). When a counter price for ancillary service remains
at the current level and its functions are not appropriately evaluated, it is indispensable to operate at a certain capacity factor; in order to gain necessary income only with the power supply counter price coupled with ancillary service counter price as described in Plan (2), it is essential to operate at a certain capacity factor (5% or higher). However, as was described earlier, the capacity factor of PSPP is largely influenced by external factors such as supply/demand condition; thus, it is difficult to forecast

The Study on Optimal Power Generation for Peak Demand in Turkey
91
revenue. Therefore, it is extremely difficult for private investors to make decisions on the construction of PSPP.
As a measure to complement this, an owner of PSPP and TEIAS can determine in advance the minimum amount to purchase power generated by the PSPP, and TEIAS guarantees the payment equivalent of the minimum power purchased to the owner despite the volume of the real generated power.
Basically, the owner of PSPP supplies power and provides ancillary service on the completely free market and receives revenue from counter prices for them, while TEIAS owns the right to give directives to the owner such as on the operation and standby as necessary. As a result, when the owner generates power below the agreed minimum purchase, TEIAS pays the difference with the amount equivalent to the agreed output. On the other hand, when the owner generates power more than the minimum purchase output and earns an amount greater than the predetermined level, neither party makes the payment adjustment.
(5) Implement long-term mutual transactions between distribution companies and generation companies
Owner: Private investors Construction fund: Private funding Revenue source: Annual fee from distribution companies
Figure 8. 4 Plan to sign relative contract with distribution companies, etc.
PSPP owners intend to keep stable income by signing long-term power supply/receipt contracts with multiple distribution companies during peak period to secure constant capacity factor.
Furthermore, with regard to power for pumping, it will be possible to avoid a risk of sharp rise in power for pumping by concluding relative contracts with multiple generation companies.
Investment
Electricity (peak)
PSPP
Investor Distribution companies
Annual Fee
Generation companies
Electricity (off-peak)
Annual Fee

The Study on Optimal Power Generation for Peak Demand in Turkey
92
(6) Summary Mentioned five measures are compared from the viewpoints of power quality, conformity to national
policy and EU regulation, and risk hedge as shown below.
Table 8. 1 Comparison between proposed business models
1 2 3 4 5
TEIAS guarantees a fixed payment
Carry out ancillary service
Direct construction by TEIAS (EUAS)
Take or Pay contract (by TEIAS)
Long-term transactions between REDA
Owners Private sector investors
Private sector investors
TEIAS (or EUAS)
Private sector investors
Private sector investors
Construction fund
Private sector funding
Private sector funding
Public investment
Private sector funding
Private sector funding
Revenue source Annual fee from TEIAS
Counter price for power supply + ancillary service
Wheeling Charge
Counter price for power supply + guarantees
Annual fee from distribution companies
Risk Avoidance Excellent Bad - Good Moderate
Consistency with Gov. policy
Moderate Excellent Bad Good Good
Consistency with EU rule
Bad Excellent Bad Moderate Moderate
Securing quality Excellent Good Excellent Moderate Moderate
Priority order (Initial stage)
1 NG 1 2 NG
Priority order (in future)
NG 1 NG 3 2
The 1st measure is best in terms of risk hedge for investors since stable revenue is secured every year,
and 2nd one is worst because all revenue depends on a market. From the view point of conformity to national policy, 2nd one which conforms to regulation 4628 is appropriate and 3rd one that public is in charge of development is worst. In terms of conformity to EU regulation, 2nd one is best, and 1st and 3rd are worst. In terms of supplying high quality power, 1st and 3rd measures are appropriate.
Under the current circumstances where appropriate counter prices are not paid as ancillary service, it is little possibility that PSPPs are installed into the power system even if 2nd measure is adopted because the risks on revenue are too high for private sectors to participate. When considering installing PSPPs as a measure to secure quality power, it is recommended that 1st and 3rd measures are adopted at first and shifted to 2nd measure after an appropriate system to pay counter prices as ancillary service is established.