republic of serbia: request for stand-by arrangement · imf country report no. 11/311 january 8,...
TRANSCRIPT

© 2011 International Monetary Fund October 2011 IMF Country Report No. 11/311 January 8, 2009 January 28, 2009 xxxJanuary 29, 2001 29, 2001 January 28, 2009 Republic of Serbia: Request for Stand-By Arrangement The following documents have been released and are included in this package: The staff report, prepared by a staff team of the IMF, following discussions that ended on
August 30, 2011, with the officials of the Republic of Serbia on economic developments and policies. Based on information available at the time of these discussions, the staff report was completed on September 16, 2011. The views expressed in the staff report are those of the staff team and do not necessarily reflect the views of the Executive Board of the IMF.
A staff statement by the IMF Representative on the Republic of Serbia
A Press Release summarizing the views of the Executive Board as expressed during its September 29, 2011 discussion of the staff report for the Republic of Serbia
A statement by the Executive Director for the Republic of Serbia
The document(s) listed below will be separately released Letter of Intent sent to the IMF by the authorities of the Republic of Serbia*
Memorandum of Economic and Financial Policies* Technical Memorandum of Understanding* *Also included in Staff Report
The policy of publication of staff reports and other documents allows for the deletion of market-sensitive information.
Copies of this report are available to the public from
International Monetary Fund Publication Services 700 19th Street, N.W. Washington, D.C. 20431
Telephone: (202) 623-7430 Telefax: (202) 623-7201 E-mail: [email protected] Internet: http://www.imf.org
International Monetary Fund
Washington, D.C.

INTERNATIONAL MONETARY FUND
REPUBLIC OF SERBIA
Request for Stand-By Arrangement1
Prepared by the European Department (In consultation with other departments)
Approved by Juha Kähkönen and James Roaf
September 16, 2011
Executive Summary Background
With global and regional growth slowing, Serbia’s gradual recovery is likely to pause; spillover risks from euro-area sovereign debt and banking system tensions have increased.
Serbia’s foreign exchange (FX) reserves are comfortable, the banking sector has large liquidity and capital buffers, and the real exchange rate seems fairly valued.
But the still relatively high external trade imbalance remains a concern, capital inflows could dry up quickly, and non-financial companies have significant un-hedged FX exposures.
With growth slowing and the political system gearing up for parliamentary and local elections early next year, the fledgling fiscal responsibility framework is under stress.
Serbia’s transition to a more balanced growth model remains work in progress: an oversized public sector and a difficult investment climate are hamstringing private sector activity.
Main elements of the program
The authorities have requested an 18-month precautionary Stand-By Arrangement (SBA), with access of SDR 935.4 million (equivalent to 200 percent of quota).
The fiscal program envisages measures to close fiscal gaps of 1 percent of GDP in 2011 and 2½ percent of GDP in 2012, with the brunt of adjustment falling on spending.
The authorities plan to tighten procedural rules to protect the fiscal responsibility framework, improve capital budgeting, increase tax compliance, and strengthen public debt management.
Monetary policy will remain focused on inflation, maintaining a managed float. The government and central bank will take further measures to develop the domestic T-bill
market and to reduce risks from un-hedged FX exposures. The program seeks to improve the investment climate by better securing property rights,
restructure state-owned enterprises, and mitigate labor market rigidities. There are significant program implementation risks, mainly related to political will to stick
to program agreements and low administrative capacity.
1 Discussions were held in Belgrade during May 18–27 and August 17–30, 2011. The IMF team comprised Alejandro Hajdenberg, Niko Hobdari, Albert Jaeger, Eva Jenkner, Srdjan Kokotović, Bogdan Lissovolik, Kristin Magnussen, Desanka Nestorović, Carel Oosthuizen, and Maral Shamloo.

2
Contents Page
I. Background .............................................................................................................................4
II. Recent Economic Developments ..........................................................................................4
III. The SBA-Supported Program ..............................................................................................6 A. Program Objectives and Strategy ..............................................................................6 B. Macroeconomic Framework .....................................................................................7 C. Fiscal Policy ..............................................................................................................8 D. Monetary and Exchange Rate Policies ....................................................................11 E. Financial Sector Policies .........................................................................................12 F. Structural Policies ....................................................................................................12
IV. Program Modalities ...........................................................................................................13 A. Length and Access ..................................................................................................13 B. Capacity to Repay the Fund and Risks to the Program ...........................................14 C. Program Monitoring and Conditionality .................................................................14
V. Staff Appraisal ....................................................................................................................15
Boxes 1. Main Messages of the Ex Post Assessment and Ex Post Evaluation .....................................5 2. The Fiscal Deficit Rule: Writing an Implementation Rulebook from Scratch ......................9
Figures 1. Output and Labor Market Indicators, 2008-11 ....................................................................17 2. Inflation and Monetary Policy, 2008-12 ..............................................................................18 3. BOP Flows, Treasury-Bills and Exchange Rate Developments, 2008-11...........................19 4. Financial Stability Indicators in Central and Eastern Europe ..............................................20 5. Euroization of Loans and Deposits in Serbia and Regional Peers, 2010 .............................21 6. EBRD Transition Indicators in Central and Eastern Europe, 2004-2010 ............................22 7. International Reserves, 2008-11 ..........................................................................................23 Tables 1. Selected Economic and Social Indicators, 2006-12 .............................................................24 2. Savings-Investment Balances, 2006-15 ...............................................................................25 3. Real GDP Growth Components, 2006-12 ...........................................................................26 4. Medium-Term Program Scenario, 2008-15 .........................................................................27 5. Balance of Payments, 2008-15 ............................................................................................28 6. External Financing Requirements and Sources, 2008-15 ....................................................29 7. External Balance Sheet, 2008-15 .........................................................................................30 8. Balance of Payments, Precautionary SBA Shock Scenario, 2010-15 .................................31 9. Indicators of Capacity to Repay the Fund, 2011-16 ............................................................32 10. Macroeconomic Framework - Baseline and External Spillover Scenarios, 2010-13 ........33

3
11a. General Government Fiscal Operations, 2009-2015 (Billions of RSD) ..........................34 11b. General Government Fiscal Operations, 2009-2015 (Percent of GDP) ..........................35 11c. Intergovernmental Fiscal Operations, 2011 .....................................................................36 11d. Intergovernmental Fiscal Operations, 2012 .....................................................................37 11e. General Government Operations According to GFSM, 2001, 2009-2015 ......................38 12. Banking Sector Financial Soundness Indicators, 2006-11 ................................................39 13. Monetary Survey, 2008-12 ................................................................................................40 14. Balance Sheet of the NBS, 2008-12 ..................................................................................41 15. Balance Sheet of Commercial Banks, 2008-11 .................................................................42 16. Rankings of Selected Competitiveness and Structural Indicators .....................................43 17. Proposed Schedule of Purchases under the Stand-By Arrangement, 2011-13 ..................44 18. Quantitative Conditionality Under the SBA, 2011 ............................................................45 19. Structural Conditionality under the SBA, 2011-2012 ........................................................46
Appendices I. External Debt Sustainability .................................................................................................47 II. Public Debt Sustainability ...................................................................................................50 Attachments Letter of Intent .........................................................................................................................53 Memorandum of Economic and Financial Policies .................................................................55 Technical Memorandum of Understanding .............................................................................66

4
I. BACKGROUND
1. Serbia’s transition to a more sustainable growth model remains incomplete and fragile. The global financial crisis in 2008-09 unmasked Serbia’s unsustainable growth model, which relied too much on nontradable sector growth, low domestic savings, and excessive external borrowing. While the economy has started to rebalance toward more export-based growth, the rebalancing has been accompanied by massive private sector job losses. Serbia’s external imbalance has declined markedly since 2008, but significant capital inflows are still required to cover it. At the same time, given Serbia’s politically fragmented setting, it has proven difficult to reduce high government sector employment levels, restructure the large public enterprise sector, and improve the adverse investment climate.
2. The authorities have requested a precautionary SBA to insure against external risks and to provide a policy anchor. This follows a 27-month, exceptional access SBA, which expired on April 15 with all reviews completed, and the completion of an ex-post assessment of Serbia’s program engagement with the Fund (Box 1). However, with global growth sputtering and sovereign balance sheet and banking tensions in the euro area unresolved, spillover and contagion risks from a potential second crisis wave to the region have mounted in recent months. Moreover, the authorities and other stakeholders, including foreign investors, reckon that a new SBA could act as an effective commitment device to anchor Serbia’s fledgling fiscal responsibility framework. Finally, the SBA could help catalyze specific structural reforms that address three long-standing growth bottlenecks: uncertain property rights; an oversized public sector; and a dysfunctional labor market. 3. However, SBA implementation will likely face political headwinds. Serbia’s fragmented and fractious politics provides a challenging backdrop to any commitment-based policy framework. Moreover, with parliamentary and local elections scheduled for early-2012, the new SBA would straddle the transition between the present and the next government, increasing implementation risks.
II. RECENT ECONOMIC DEVELOPMENTS
4. GDP continued to expand in the first half of 2011, but there are signs that the recovery is stalling for now. With investment and exports as the main drivers, the estimated first-half year GDP growth (2¾ percent) was in line with previous projections (Figure 1). However, a large negative trade shock is percolating through the region, as reflected in a sudden drop-off in steel demand from regional trading partners. Moreover, recent leading indicators in key trading partners, including Germany and Italy, suggest that the recovery will likely pause for the remainder of 2011.
5. Labor shedding in the private sector has continued. While the public sector has maintained its (high) employment level, the private sector has shed about 20 percent of its jobs since 2008 (Figure 1). With a significant number of jobs in companies that are dependent on subsidies, the official statistics may still not fully capture Serbia’s labor market malaise.
5
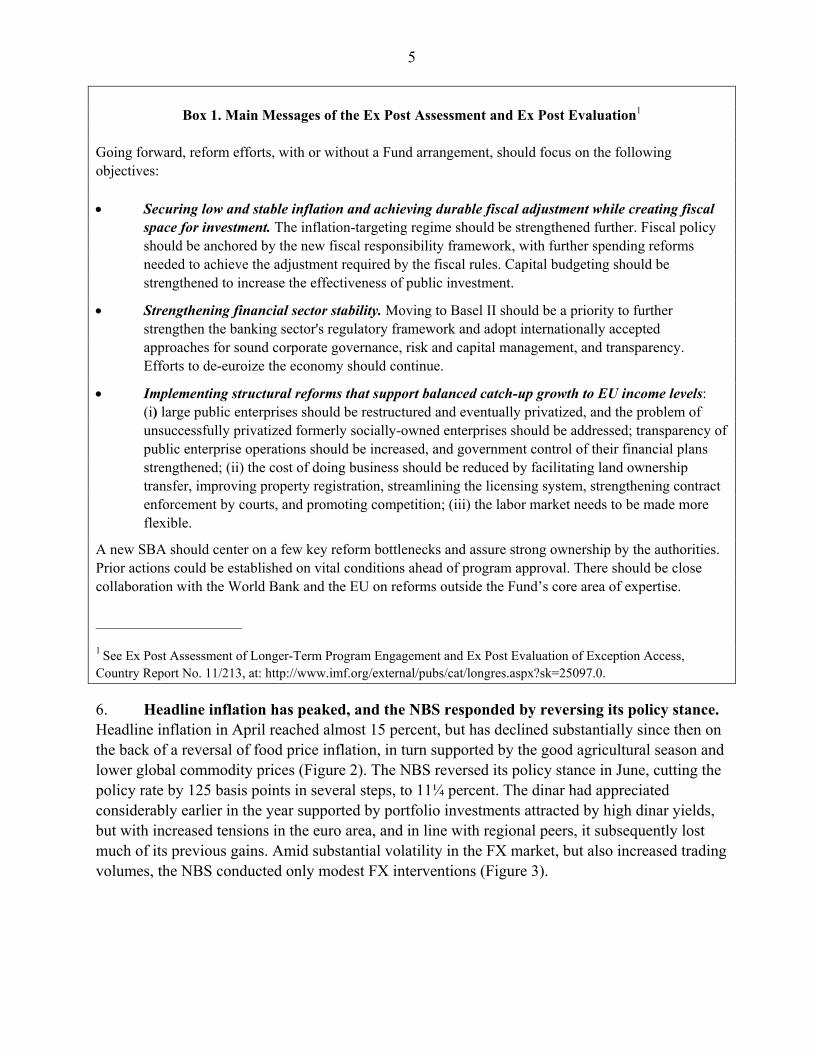
Box 1. Main Messages of the Ex Post Assessment and Ex Post Evaluation1
Going forward, reform efforts, with or without a Fund arrangement, should focus on the following objectives: Securing low and stable inflation and achieving durable fiscal adjustment while creating fiscal
space for investment. The inflation-targeting regime should be strengthened further. Fiscal policy should be anchored by the new fiscal responsibility framework, with further spending reforms needed to achieve the adjustment required by the fiscal rules. Capital budgeting should be strengthened to increase the effectiveness of public investment.
Strengthening financial sector stability. Moving to Basel II should be a priority to further strengthen the banking sector's regulatory framework and adopt internationally accepted approaches for sound corporate governance, risk and capital management, and transparency. Efforts to de-euroize the economy should continue.
Implementing structural reforms that support balanced catch-up growth to EU income levels: (i) large public enterprises should be restructured and eventually privatized, and the problem of unsuccessfully privatized formerly socially-owned enterprises should be addressed; transparency of public enterprise operations should be increased, and government control of their financial plans strengthened; (ii) the cost of doing business should be reduced by facilitating land ownership transfer, improving property registration, streamlining the licensing system, strengthening contract enforcement by courts, and promoting competition; (iii) the labor market needs to be made more flexible.
A new SBA should center on a few key reform bottlenecks and assure strong ownership by the authorities. Prior actions could be established on vital conditions ahead of program approval. There should be close collaboration with the World Bank and the EU on reforms outside the Fund’s core area of expertise.
____________________
1 See Ex Post Assessment of Longer-Term Program Engagement and Ex Post Evaluation of Exception Access, Country Report No. 11/213, at: http://www.imf.org/external/pubs/cat/longres.aspx?sk=25097.0.
6. Headline inflation has peaked, and the NBS responded by reversing its policy stance. Headline inflation in April reached almost 15 percent, but has declined substantially since then on the back of a reversal of food price inflation, in turn supported by the good agricultural season and lower global commodity prices (Figure 2). The NBS reversed its policy stance in June, cutting the policy rate by 125 basis points in several steps, to 11¼ percent. The dinar had appreciated considerably earlier in the year supported by portfolio investments attracted by high dinar yields, but with increased tensions in the euro area, and in line with regional peers, it subsequently lost much of its previous gains. Amid substantial volatility in the FX market, but also increased trading volumes, the NBS conducted only modest FX interventions (Figure 3).

6
III. THE SBA-SUPPORTED PROGRAM
A. Program Objectives and Strategy
7. The new Fund arrangement’s overall objectives are to maintain macroeconomic and financial stability, while addressing key bottlenecks in the investment climate. To achieve these objectives, the program provides additional insurance against external downside risks, anchors the fiscal responsibility framework, supports mitigation of financial sector stability risks, and targets specific structural reforms:
Insurance against external downside risks. Serbia is still only partly integrated in the EU’s regional supply chain. Nevertheless, as illustrated by the 2008–09 crisis spillover experience, present trade links can quickly lead to a synchronized region-wide slowdown in trade that can hit Serbia’s exports hard. Moreover, given the composition of Serbia’s commodity trade structure, the terms of trade effect of a severe regional trade shock would likely be negative. And although Serbia’s external current account gap is now much smaller than in 2008, it still relies on significant FDI and bank-intermediated capital inflows that could quickly dry up in a sharp external downside scenario. Serbia’s comfortable level of FX reserves, a flexible and competitive exchange rate, and relatively assuring indicators of bank funding risks may provide a sturdy first line of defense. Nevertheless, contagion risk from vulnerable regional economies is high, and the relatively large proposed access under the precautionary SBA is intended to reinforce Serbia’s financial buffers.
Anchoring the new fiscal responsibility framework. During the brief interlude between the previous and the new proposed program, parliament adopted a populist fiscal decentralization law that transferred taxes equivalent to about 1¼ percent of GDP additional to local governments without devolving commensurate spending responsibilities. This was done over the explicit objections of the Fiscal Council, illustrating that the new fiscal rules remain open to political challenge. Thus, the SBA would serve as a commitment device to protect the fiscal responsibility framework.
Mitigating financial stability risks. This includes developing local financial markets to facilitate FX hedging and maintaining adequate liquidity and capital buffers in the banking system. In case a severe downside scenario materializes, the program would likely have to be adjusted to include a private sector involvement component, as under the previous SBA.
Catalyzing structural reforms. In coordination with other international financial institutions (IFIs), the program seeks to soften up key growth bottlenecks, using a targeted and realistic structural reform approach that focuses on areas where IMF staff has some expertise and where a critical mass of ownership can be mobilized.

7
B. Macroeconomic Framework
8. Slowing global and regional growth will dent Serbia’s output outlook, and prospects for a turnaround in the labor market remain dim. Slower growth in Serbia’s main trading partners, especially the euro area, will likely result in GDP growth pausing during the second half of 2011, notwithstanding what could be an above-par agricultural season. For the year as a whole, growth has been revised downward to 2 percent. Although the recovery is projected to resume again in 2012, growth is unlikely to exceed 3 percent, but catch-up growth is projected to resume over the medium term (Tables 1–4).
9. Inflation is projected to return within the NBS’s target tolerance band in the first half of 2012. Barring new shocks, the rapid decline of food and agricultural prices during the summer and base effects will ensure the return of inflation to single-digit inflation by the end of 2011, although it will still be above the NBS’s target tolerance band. Assuming a continued tight monetary stance, a large output gap, and reasonably anchored inflationary expectations, the disinflation trend is expected to continue during 2012, with inflation moving toward the center of the band by the end of the year (Figure 2).
10. External financing needs will remain relatively high but are projected to be fully covered under the program’s baseline scenario. With net exports rising in response to earlier FDI inflows—for example, Fiat is scheduled to start car production in 2012—the trade imbalance is expected to narrow gradually (Table 5). The external financing needs will be mostly covered by FDI and net inflows to banks, as well as a moderate drawdown of FX reserves in 2012 (Tables 6). Gross external debt would decline to 75 percent of GDP in 2011 and continue on a downward path over the medium term, although this re-assuring projection is quite sensitive to exchange rate assumptions (Table 7 and Appendix I).
11. An actual balance of payments (BoP) financing need under the proposed program could be triggered by adverse financial spillovers. The main potential risks include rising euro area tensions that constrain external financing prospects, resulting in lower-than-projected capital inflows (Table 8). Access of about 200 percent of quota (SDR 935.4 million) is expected to provide adequate insurance against such scenarios.
12. However, if even more adverse financial spillovers combine with a more pronounced global and regional growth slowdown, higher access may be needed to cover external financing gaps. The main driver behind this more extreme downside scenario could be a disorderly resolution of the euro area sovereign debt and banking system tensions, which could result in a sudden stop of capital inflows opening a significant external financing gap, even if the current account deficit declines sharply (Table 10). This would likely give rise to an actual BoP need in excess of presently proposed access. Under such a pronounced downside scenario, consideration could be given to retooling the program, as happened under the previous SBA, combining appropriate policy responses with higher access.

8
C. Fiscal Policy
13. Serbia has hard-wired political economy biases that favor higher spending and deficits. Serbia’s political system is highly fragmented and competitive, with complex coalition governments commanding only narrow majorities in parliament. This political setting is prone to pre-election populism, as illustrated by the recent fast-track adoption of the fiscal decentralization law. Moreover, given the oversized public sector, government and state-owned enterprise (SOE) employees enjoy strong bargaining positions given their job security, and are relatively immune to the adverse consequences of higher spending and deficits. Finally, several social groups and regions have well organized interest groups, which seek to impose their spending or resource sharing preferences through the political process.
14. The authorities are trying to counter these fiscal spending and deficit biases through a new and still largely untested fiscal responsibility framework. Under the previous SBA, parliament adopted a numerical rule for the fiscal deficit, introduced a 45 percent of GDP ceiling on public and publicly-guaranteed debt, and established a Fiscal Council to oversee the new framework. The framework is giving rise to a number of implementation challenges (Box 2). There was agreement that the new proposed SBA would provide a valuable additional external anchor to keep at bay fiscal pressures arising from political economy biases.
15. Large fiscal gaps emerged for 2011 and 2012. Spending on public wages and pensions will be higher owing to higher-than-projected inflation, as well as additional capital spending plans, mainly by local governments. In absence of a matching revenue over-performance, the general government deficit during the first semester was relatively large, consistent with a fiscal gap of about 1 percent of GDP in 2011. With unchanged policies, the 2011 base effects and the impact of the fiscal decentralization law would have created an even larger fiscal gap in 2012, estimated at about 2½ percent of GDP.
16. There was agreement to close these gaps primarily through expenditure cuts, while strengthening public sector payment discipline. The authorities plan to close the identified fiscal gaps for 2011 and 2012 mainly by cutting low-priority capital and goods and services outlays, shifting expenditure responsibilities for local projects and road maintenance from the central to local governments, and sharply reducing subsidies and net lending in 2012 (MEFP ¶s 7–10, Tables 11a-11e, and text table). Capital spending will continue to grow in nominal terms, but future consolidation efforts beyond 2012 will need to curtail current spending further to create space for higher capital spending. The authorities are also determined to increase payment discipline throughout the public sector, including by avoiding any arrears accumulation under the program and requiring that by end-December all government entities, and particularly local governments, will report their payments arrears (MEFP ¶12).

9
Box 2. The Fiscal Deficit Rule: Writing an Implementation Rulebook from Scratch
In October 2010, Serbia’s parliament adopted a numerical fiscal deficit rule, where the maximum fiscal deficit-GDP ratio (d) in year t is calculated as:
d(t) = d(t-1) – 0.3[d(t-1) – d*] – 0.4[g(t) – g*], where d* is the medium-term deficit target (set at 1 percent of GDP), g is the real GDP growth rate, and g* is medium-term GDP growth (set at 4 percent). Thus, the deficit ratio in year t is calculated as last year’s deficit ratio, corrected for one third of the deviation of last year’s deficit ratio from the medium-term target (to reduce the accumulated “error” in achieving the deficit target), and also corrected for 40 percent of the deviation of actual real GDP growth from its medium-term average (to allow for at least partial operation of automatic fiscal stabilizers if d(t-1) deviates from d*). Serbia is the first country to adopt this type of numerical fiscal deficit rule. As a consequence, there are no precedents on how to resolve practical implementation issues. Thus, the authorities have to develop an implementation rulebook from scratch. A pressing implementation issue that may have to be faced in the near future is the extent to which automatic fiscal stabilizers can be allowed to operate if real GDP growth continues to surprise on the downside. For example, in the external spillover scenario, real GDP growth in 2012 is projected to turn negative, and the maximum fiscal deficit based on the fiscal rule would surge to 5½ percent of GDP (Table 10). There could be even sharper downside scenarios, where the maximum fiscal deficit could be significantly higher. If such a downside scenario occurs, it may become necessary to restrict the operation of automatic fiscal stabilizers beyond the extent envisaged by the maximum deficit allowed under the rule, both because it may not be possible to finance the deficit at reasonable terms and because the higher deficits would lead to an outright breach of the public debt limit rule. Moreover, the continued downward surprises in GDP growth could signal that the medium-term growth assumption for g* is too optimistic, and that additional fiscal adjustment is in fact needed because the underlying fiscal position is deteriorating (a re-assessment of the rule’s parameters is scheduled for 2014). Under these circumstances, the appropriate deficit target will have to be based on a careful analysis and balancing of trade-offs, with the availability of financing and the need to maintain the public’s confidence key considerations. Serbia’s case illustrates that numerical rules are unlikely to ever put fiscal policy on automatic pilot, and that a dose of discretionary decision making and interpretation will be unavoidable from time to time.

10
17. Further politically difficult reforms of the public pension system are inevitable. Serbia’s public pension system puts a large burden on contributors and taxpayers. Moreover, long-term projections suggest that this burden would increase under unchanged policies, as the rapid aging of the population will eventually reduce the ratio of contributors per pensioner to about one. As building up a funded second-pillar pension system seems an unlikely option, the authorities are faced with choosing some combination of reduced pension replacement rates and increases in effective retirement ages. The authorities noted that they do not believe that shifting the pension system to a basic subsistence system would be socially sustainable, and therefore believe that the next government will have little choice but to put in place gradual but significant increases in effective retirement ages, in line with reforms efforts elsewhere in the region (MEFP ¶13).
18. Property restitution will be consistent with fiscal sustainability constraints. Improving the investment climate, complying with EU integration requisites, and moral imperatives all call for addressing expeditiously the restitution of property confiscated during and after World War II. However, with in-kind restitution impractical in many cases, the mission stressed that fiscal sustainability puts tight constraints on the scope for financial restitution, also in view of an already weak government balance sheet. A restitution law that includes a fiscally responsible cap on financial restitution payments, which was a prior action for approval of the SBA, has been submitted to parliament (MEFP ¶14).
19. The fiscal rules will be supported by stronger procedures to limit the risk of enacting fiscally irresponsible legislation. Despite the Pay-As-You-Go (PAYG) principle already contained in the Budget System Law (BSL), new laws that result in discretionary increases in the budget deficit have continued to be enacted without proper scrutiny. The recent experience with the fiscal decentralization law has only been one of several recent cases. In response, the authorities are committed to amend the BSL with a view to tighten the PAYG rule (MEFP ¶16).
Billions of dinars
Percent of GDP
Billions of dinars
Percent of GDP
Total 30 0.9 90 2.5
I. Expenditure cuts 25 0.7 81 2.2
Reduced capital outlays, including on local projects and from own resources 18 0.5 28 0.8
Reduced goods and services outlays, including from own resources 4 0.1 12 0.3
Devolution of road maintenance from Roads of Serbia to the local level 11 0.3
Reductions in subsidies other than agriculture; railways; and mining 1 0.0 12 0.3
Savings in active labor market programs and the transition fund 1 0.0 4 0.1
Cuts in net lending 1 0.0 15 0.4
II. Revenue increases 6 0.2 9 0.2
Dividends from the Development Fund and Mortgage Insurance Agency and other nontax revenue 6 0.2 3 0.1
Increased royalties on mining activities 3 0.1
Improved collection of social contributions 3 0.1
Source: Fund staff estimates.
Serbia: Fiscal Adjustment Measures in 2011 and 2012
2011 2012

11
20. The program envisages improvements in capital budgeting, public debt management, and tax compliance:
Improving capital budgeting is critical given that infrastructure gaps are a key bottleneck for boosting tradable sector growth. Capital budgeting is presently riddled with inefficiencies, including unpredictable medium-term spending allocations, cumbersome procurement procedures, and institutional fragmentation. As a result, with capital budgets already under-resourced, public investment has been under-executed, averaging about 70 percent at the Republican level over the last four years. The program includes measures to strengthen the capital budgeting process (MEFP ¶17).
The capacity of public debt management to monitor and manage debt risks needs to be upgraded urgently. Most of Serbia’s public debt is still on concessional terms. However, over the last two years, the issuance of about 7 percent of GDP in T-bills, mostly in dinars, has introduced significant rollover risks. Moreover, most of the concessional debt will, over time, have to be refinanced at market terms. The authorities will address debt management weaknesses during the early phase of the program (MEFP ¶18).
Tax collection is undermined by weak compliance, calling for further actions to modernize tax administration. Collection efficiency of social contributions is especially low. Uneven enforcement of tax collection aggravates the already difficult investment climate and is considered unfair by the Serbian public. The tax administration will develop operational plans for improving compliance, including by upgrading regulations, staff skills, and IT capacity (MEFP ¶19).
D. Monetary and Exchange Rate Policies
21. Monetary policy responded adequately to the recent inflation surge. There was agreement that inflation expectations remained better anchored than in previous inflationary flare-ups, reflecting positively on the NBS’ credibility and communication strategy. The policy tightening—conceived as a response to a transitory food price shock and aimed at containing expectations and second round effects—was effective. Notwithstanding, it was agreed that the magnitude of the policy rate increase during the tightening cycle (4½ percentage points) was still very large and is a sign that the NBS still has room to further consolidate its credibility. A more benign inflation outlook emerged since May, allowing a gradual loosening of the policy stance.
22. Absent further shocks, disinflation is expected to continue, offering the opportunity to reduce policy rates further. In light of the inflation outlook, it was agreed that there is room for further cuts in the policy rate, but risks to this outlook are substantial. The main sources of risks were identified as: (i) a possible spike in Serbia’s FX risk premium, leading to currency depreciation; (ii) a loosening of the fiscal stance in the run-up to next year’s elections; and (iii) a poor outcome of the late-summer agricultural season. In addition, lower policy rates could reduce T-bill purchases, particularly in the event of further pressures on the dinar.

12
23. A downside scenario with slower growth and higher risk premia could create a dilemma for monetary policy. On the one hand, higher FX risk premia would lower capital inflows, and, given the large external financing needs, lead to depreciation of the dinar and inflationary pressures. On the other hand, declining economic activity would reduce demand for Serbian exports and dampen domestic demand, imparting a disinflationary impulse. The adequate monetary policy response would have to weigh these opposing forces.
E. Financial Sector Policies
24. Serbia seems well prepared for addressing renewed financial stability pressures. Buffers regarding FX reserves, bank liquidity, bank capital, and non-performing loan provisioning seem comfortable (Figure 4, and Tables 12–15). Moreover, the flexible exchange rate should help cushion shocks, and legal changes during the previous SBA have strengthened the bank resolution framework.
25. Nevertheless, the authorities intend to focus on the following steps to strengthen further the financial sector’s resilience to shocks:
Improving the regulatory framework. Preparations are on track for the scheduled implementation of Basel II framework by December 2011, which will strengthen further banking sector’s standards in corporate governance, risk management, capital management, and transparency. In the context of Basel II adoption, the NBS is also reviewing the banks’ asset classification and provisioning regime, aiming to relax somewhat the conservative provisioning rules adopted during the pre-crisis period to put a brake on rapid credit growth (MEFP ¶21).
Promoting dinarization. The level of euroization of banks deposits and loans remains high (Figure 5), constraining the effectiveness on monetary policy. In addition, un-hedged FX exposures, particularly those of the corporate sector, constitute a serious financial stability risk for the Serbian economy. To address these problems, the authorities have adopted a detailed action plan focusing on the development of primary and secondary T-Bills market and promotion of FX hedging (MEFP ¶23).
F. Structural Policies
26. Serbia’s lagging structural reforms are rooted in strong resistance from vested interests and lack of implementation capacity. While Serbia’s pace of structural reform improvements over the past five years was somewhat above its regional peers, the level of key structural reform indicators has remained unsatisfactory, partly reflecting the late start to transition (Figure 6 and Table 16). While many laws have now been upgraded toward EU standards, implementation has lagged, particularly on labor and social policies, reflecting red tape and lack of administrative capacity.
27. The SBA will address several key investment climate bottlenecks. First, on property rights, there is a golden opportunity to build on the expedited schedule for adopting the law on

13
restitution and also take immediate steps to ease the use and transferability of construction land (MEFP ¶24). Regarding the public enterprises, the program seeks to provide new impetus to the process of resolving the problems of the socially owned enterprises and take meaningful steps to restructure large SOEs, preparing them for eventual privatization once market conditions are more favorable (MEFP ¶25). Finally, the labor shedding has prompted the authorities to consider a roll-back of some legislative restrictions, with a commitment to consider a more far-reaching labor market overhaul in the post-election period, including collective bargaining reforms and a revenue-neutral swap of cuts in social contributions for increases in indirect taxes (MEFP ¶15 and ¶26).
28. There was agreement that additional structural reform efforts across a broad front were needed. The authorities recognized the importance of consolidating recent achievements in regulatory simplification, as well as reforming agriculture and building on the recent progress in improving energy sector legislation. The World Bank, using a series of Development Policy Loans, will continue to support reforms across a wide spectrum, including in education, health, and social assistance. In the context of EU accession, the authorities plan to pursue judicial reforms, and strengthen competition policy, public procurement, and trade integration (MEFP ¶27).
29. The new SBA’s structural agenda takes some steps towards addressing the gaps identified in the recent ex-post assessments. The proposed package of measures represents progress toward the objectives stated in Box 1. While a more aggressive structural reform agenda would be desirable, the program seeks to strike a balance between what is desirable and what is doable given the constraints imposed by the Serbian political context and the global financial setting. For example, privatization of the public enterprises at fair values is unlikely to be an option in the present market conditions. After the elections, the reform agenda could be strengthened during future program reviews.
IV. PROGRAM MODALITIES
A. Length and Access
30. As requested by the authorities, the SBA will cover 18 months. The relatively short duration of the arrangement strikes a compromise between the limitations imposed by Serbia’s electoral calendar (which would argue for a short program) and the need to advance difficult structural reforms (which would argue for a longer program). The SBA will still cover the implementation of the 2011 budget, as well as the adoption of the 2012 and 2013 budgets, and will provide a meaningful window to tackle reforms in several important areas. The next government (which will likely take office during the summer of 2012) will have the option to request an extension of the program or complete it with the final two reviews.
31. The authorities intend to treat the arrangement as precautionary. Under the baseline scenario, Serbia is not expected to face BoP financing needs. Nevertheless program access is relatively frontloaded to provide insurance against short-term downside risks. Serbia’s gross FX

14
reserve position remains comfortable; although net international reserves and net free reserves are significantly lower (Figure 7). Serbia’s FX reserve position is projected to improve marginally in 2011 and more rapidly thereafter (Table 7). Public and external indebtedness remain relatively manageable. The banking system is liquid and well capitalized. The disbursement schedule is presented in Table 17.
B. Capacity to Repay the Fund and Risks to the Program
32. Should Serbia make purchases under the arrangement, staff is confident that it could meet its financial obligations to the Fund. On the basis of drawings so far, Serbia’s repayments to the fund would peak in 2013 at about 7 percent of gross reserves. Even if the downside external risks discussed earlier were to materialize and full drawings were to be made, repayments to the Fund would increase only marginally to a manageable 8¼ percent of gross reserves.
33. However, the program is subject to high implementation risks. In particular, political and social tensions and the proximity of the next elections could undermine the authorities’ resolve to implement the measures targeted under the program.
C. Program Monitoring and Conditionality
34. Given that a key rationale for the SBA is to act as a high-profile commitment device, the program will be monitored through quarterly reviews. Table 18 sets out specific quantitative performance criteria that are to be observed under the SBA for the overall general government balance, net international reserves of the NBS, guarantees provided by the public sector, and accumulation of external payment arrears. In addition, there will be an inflation consultation band and indicative targets on the current expenditure of the Republican budget, on the gross accumulation of payment arrears by the Republican budget, and on the gross accumulation of domestic guarantees by the Republican budget and the Development Fund (guarantees are included in the definition of public debt under the fiscal responsibility framework) and domestic borrowing by the Development Fund. The safeguards assessment of the NBS will be updated.
35. Structural conditionality focuses on preserving fiscal discipline and strengthening the environment for private sector development. The authorities will implement two prior actions for approval of the arrangement. Namely, they will submit to Parliament: (i) a fiscally responsible draft restitution law; and (ii) a 2011 supplementary budget aligning the general government deficit with the target implied by the fiscal responsibility framework. Conditionality on the 2012 budget will be set during the first review. Structural benchmarks seek to strengthen tax administration and capital budgeting, maintaining financial discipline in SOEs, and reduce labor market rigidities (Table 19). Additional conditionality could be set during the upcoming reviews.

15
V. STAFF APPRAISAL
36. Serbia’s export-led recovery is facing headwinds, reflecting a slowdown in regional growth. GDP growth in the second half of 2011 is projected to stall, even if an above-par agricultural harvest materializes, interrupting the gradual recovery from the 2009 output slump. The economy is expected to resume growth in 2012 on the back of net exports and investment. This outlook will further dim the prospects of a recovery of private sector employment.
37. While downside risks have clearly mounted, the Serbian economy is in better shape than three years ago when it had to confront the first wave of the global financial crisis. A possible second wave of shocks would likely be transmitted via close trade links to EU and regional economies and the large share of Serbia’s banking sector owned by euro-area banks. A global slowdown could also reduce the price of Serbian export commodities and impact the availability and pricing of external funding. But Serbia’s external position is stronger than in 2008. The current account deficit, while still requiring substantial financing, is much smaller and there seems to be no significant exchange rate misalignment. In addition, the NBS’s foreign exchange reserves and banks’ liquidity and capital buffers remain comfortable.
38. Nevertheless, the authorities’ program—supported by the proposed precautionary SBA—represents a prudent step in the present uncertain global and regional environment. The new SBA has been designed with three main objectives in mind. First, the availability of Fund financing would provide insurance against downside scenarios where Serbia would have to face contagion as an innocent by-stander. Second, the SBA seeks to anchor the fiscal responsibility framework in the context of a fragmented political environment and populist pressures from approaching elections. Finally, the arrangement is expected to act as a catalyst for investment climate reforms.
39. There are, however, significant risks to program implementation. The authorities’ political will and administrative capacity to implement program measures could disappoint.
40. In particular, meeting the 2011 and 2012 fiscal deficit targets will require significant effort and perseverance, and there are risks that even more fiscal adjustment will be needed. The error-correction mechanism embedded in the fiscal deficit rule requires substantial underlying adjustment to keep fiscal deficits at manageable levels. This task has been complicated by the passage of a fiscally irresponsible fiscal decentralization law, which added considerably to the 2012 fiscal gap. At the same time, given significant downside risks to the growth outlook, further fiscal tightening may be needed going forward, as the maximum fiscal deficits implied by the fiscal deficit rule could exceed what can be financed at reasonable terms, while the debt-GDP ratio could breach the 45 percent of GDP limit enshrined in the fiscal responsibility framework.
41. The NBS has conducted monetary policy effectively. The NBS tightened monetary policy appropriately in the face of heightened inflationary pressures, to limit second round effects from a food price shock and avoid an exchange rate-led price escalation, with positive results evidenced in a limited upward drift of inflation expectations. More recently, facing an improved

16
inflation outlook, the NBS has reverted to a loosening stance and is on course to steer inflation back into its targeted band in early 2012.
42. While rapidly declining inflation points to further room for monetary policy easing, the risks to this outlook are large. Absent additional shocks, inflation should continue receding in a context of declining food prices and weak aggregate demand. This would allow the NBS to decrease the policy rate from a still-relatively high level by regional standards. However the NBS needs to remain vigilant, including by reacting in timely manner to possible adverse spillovers from external developments or an inappropriate relaxation of fiscal policy prior to the 2012 elections.
43. The banking sector remains well-capitalized, and the steps to adopt the Basel II framework and reduce un-hedged FX risks are welcome. The envisaged relaxation of the conservative NBS provisioning requirements adopted prior to the crisis, while maintaining large buffers relative to international standards, is appropriate. The adoption the Basel II framework will also result in a welcome upgrade of the banking sectors’ standards in corporate governance, risk management, capital management, and transparency. Finally, the planned actions to step up the development of primary and secondary T-Bills market will help promote dinarization, strengthening monetary policy effectiveness and reducing un-hedged FX risks.
44. Without improving Serbia’s difficult investment climate, the economy cannot deliver sustainable catch-up growth toward EU income levels. The economy’s low capacity to produce, export, and save is at the root of Serbia’s protracted struggle to achieve more balanced growth. Consequently, Serbia should use the 1½ year window provided by the program to accelerate the pace of structural reforms necessary to the development of a more vibrant export sector. In particular, the SBA’s reform agenda, including reforming SOEs, securing property rights, deregulating the labor market should be deepened further once the next government is in office. But it is important that the present government will muster the political will and mount the administrative efforts to implement the agreed SBA measures, notwithstanding the upcoming elections.
45. If the authorities implement their program steadfastly while being ready to respond to new adverse developments, staff expects that the Serbian economy will succeed in overcoming its present difficulties. Therefore, staff supports the authorities’ request for an 18-month SBA.

17
Figure 1. Serbia: Output and Labor Market Indicators, 2008-11
Sources: Serbian authorities and WEO.1/ The 3-month moving averages for each month expressed in euros are compared with the same month during the pre-crisis period (defined as October 2007-September 2008). 2/ CEFTA--the Central European Free Trade Agreement--includes Albania, Bosnia and Herzegovina, Croatia, Kosovo, Macedonia FYR, Moldova, Montenegro, and Serbia. 3/ Includes estimated informal employment based on labor surveys.
-6
-4
-2
0
2
4
6
8
10
-6
-4
-2
0
2
4
6
8
10
200
8Q2
200
8Q3
200
8Q4
200
9Q1
200
9Q2
200
9Q3
200
9Q4
201
0Q1
201
0Q2
201
0Q3
201
0Q4
201
1Q1
201
1Q2
The economy started to recover in 2010, but growth has stalled recently...
Real GDP Growth(in percent)
y-o-y
q-o-q (annualized)
60
80
100
120
140
160
180
60
80
100
120
140
160
180
Oct
-08
Dec
-08
Fe
b-09
Apr
-09
Jun
-09
Aug
-09
Oct
-09
Dec
-09
Fe
b-10
Apr
-10
Jun
-10
Aug
-10
Oct
-10
Dec
-10
Fe
b-11
Apr
-11
Jun
-11
...as export growth that sparked the recovery has slowed down significantly...
Exports of Goods(index, pre-crisis=100) 1/
TotalEUCEFTA 2/Pre-crisis
-10
-8
-6
-4
-2
0
2
4
6
8
10
2,000
2,200
2,400
2,600
2,800
3,000
200
8Q1
200
8Q2
200
8Q3
200
8Q4
200
9Q1
200
9Q2
200
9Q3
200
9Q4
201
0Q1
201
0Q2
201
0Q3
201
0Q4
201
1Q1
201
1Q2
Employment and Growth
Real GDP growth (percent, y-o-y, right axis)
Total employment (thousands) 3/
...and labor market developments continue to disappoint...
60
70
80
90
100
110
120
60
70
80
90
100
110
120
200
8-Q
1
200
8-Q
2
200
8-Q
3
200
8-Q
4
200
9-Q
1
200
9-Q
2
200
9-Q
3
200
9-Q
4
201
0-Q
1
201
0-Q
2
201
0-Q
3
201
0-Q
4
201
1-Q
1
201
1-Q
2
Employment (2008Q3=100)
Total employment
General government
Non-Government Sector
...with the corporate private sector suffering most job losses, while general government employment grew.

18
0
2
4
6
8
10
12
14
16
18
20
0
2
4
6
8
10
12
14
16
18
20
Jan-
08
May
-08
Sep
-08
Jan-
09
May
-09
Sep
-09
Jan-
10
May
-10
Sep
-10
Jan-
11
May
-11
Sep
-11
Jan-
12
May
-12
Sep
-12
Inflation(Annual percentage change)
CPILower boundUpper boundInflation target
Figure 2. Serbia: Inflation and Monetary Policy, 2008–12
Sources: National Bank of Serbia; Serbian Statistical Office; and IMF staff estimates and projections.
...as is the large negative output gap.
Import prices in euros have stabilized...
Inflation expectations have increased moderately.
Headline inflation has started to decline but is projected to remain elevated until late 2011.
0
2
4
6
8
10
12
0
2
4
6
8
10
12
Jan-
10
Apr
-10
Jul-1
0
Oct
-10
Jan-
11
Apr
-11
Jul-1
1
Oct
-11
Jan-
12
Apr
-12
Jul-1
2
One-Year Ahead Inflation Expectations (Financial sector, percent)
Inflation expectationsLower boundUpper boundInflation target
...and slow wage growth is still a downward factor...
Food prices have been the main contributor for the inflation surge and are leading the decline.
-2
1
4
7
10
13
16
-2
1
4
7
10
13
16
Jan-
09
Apr
-09
Jul-0
9
Oct
-09
Jan-
10
Apr
-10
Jul-1
0
Oct
-10
Jan-
11
Apr
-11
Jul-1
1
Contribution to Annual Inflation (Percent)
Other goods and services
Food
12-month Inflation
-25
-20
-15
-10
-5
0
5
10
15
20
25
-25
-20
-15
-10
-5
0
5
10
15
20
25
2008
Q1
2008
Q2
2008
Q3
2008
Q4
2009
Q1
2009
Q2
2009
Q3
2009
Q4
2010
Q1
2010
Q2
2010
Q3
2010
Q4
2011
Q1
Imports Prices and Inflation(Annual percentage change)
CPI
Imports prices (in euros)
-5
0
5
10
15
20
-5
0
5
10
15
20
Jan-
08
Apr
-08
Jul-0
8
Oct
-08
Jan-
09
Apr
-09
Jul-0
9
Oct
-09
Jan-
10
Apr
-10
Jul-1
0
Oct
-10
Total Economy Wage Bill and Inflation(Twelve-month percentage change)
CPI
Wage bill
-5
-4
-3
-2
-1
0
1
2
3
4
-5
-4
-3
-2
-1
0
1
2
3
4
2009 2010 2011 2012
Output Gap(percent of potential GDP)

19
Figure 3. Serbia: BOP Flows, Treasury-Bills, Exchange Rate and Sovereign Spread Developments, 2008-11
Sources: National Bank of Serbia; Bloomberg; and WEO.
Financial inflows have been less buoyant in recent months...
...exhibiting somewhat more volatility than regional peers...
... the exchange rate has reversed the earlier appreciation and the NBS stayed mostly on the
sidelines...
-100
0
100
200
300
400
500
75
80
85
90
95
100
105
110
Sep
-08
Dec
-08
Mar
-09
Jun
-09
Sep
-09
Dec
-09
Mar
-10
Jun
-10
Sep
-10
Dec
-10
Mar
-11
Jun
-11
Exchange Rate and FX Interventions
RSD/euro exchange rate
Sale of FX reserves by the NBS (millions of euro, positive value = sale, right scale)
...while the sovereign spread has risen in line with the regional trend.
-600
-400
-200
0
200
400
600
800
1000
1200
-600
-400
-200
0
200
400
600
800
1000
1200S
ep-0
8
Dec
-08
Mar
-09
Jun
-09
Sep
-09
Dec
-09
Mar
-10
Jun
-10
Sep
-10
Dec
-10
Mar
-11
Jun
-11
BOP Developments(millions of euros)
Current account deficit
Capital and financial account
0
200
400
600
800
1000
1200
1400
0
200
400
600
800
1000
1200
1400
Sep
-08
Dec
-08
Mar
-09
Jun
-09
Sep
-09
Dec
-09
Mar
-10
Jun
-10
Sep
-10
Dec
-10
Mar
-11
Jun
-11
Sovereign Risk(EMBI spreads, basis points)
Serbia
Bulgaria
Croatia
Hungary
Romania
60
70
80
90
100
110
120
60
70
80
90
100
110
120
Sep
-08
Dec
-08
Mar
-09
Jun
-09
Sep
-09
Dec
-09
Mar
-10
Jun
-10
Sep
-10
Dec
-10
Mar
-11
Jun
-11
Nominal Effective Exchange Rates(September 2008 = 100)
SerbiaBulgariaCroatiaHungaryRomania

20
Figure 4. Financial Stability Indicators in Central and Eastern Europe
Source: Global Financial Stability Report.
0
5
10
15
20
25
0
5
10
15
20
25
PO
L
HU
N
LVA
RO
M
ALB BIH
LTU
MN
E
MK
D
BG
R
HR
V
TU
R
SR
B
Bank Regulatory Capital to Risk-Weighted Assets, 2010(in percent)
0
5
10
15
20
25
0
5
10
15
20
25
LVA
ALB
HU
N
LTU
RO
M
PO
L
BLG
MK
D
MN
E
TU
R
HR
V
BIH
SR
B
Bank Capital to Total Assets, 2010(in percent)
-0.5
0.0
0.5
1.0
1.5
2.0
2.5
-0.5
0.0
0.5
1.0
1.5
2.0
2.5
MN
E
LTU
LVA
BIH
RO
M
HU
N
ALB
MK
D
HR
V
PO
L
SR
B
BG
R
TU
R
Bank Return on Assets, Average 2006-10(in percent)
-5
0
5
10
15
20
-5
0
5
10
15
20
MN
E
LVA
LTU
BIH
SR
B
RO
M
MK
D
HR
V
ALB
HU
N
TU
R
PO
L
BG
R
Bank Return on Equity, Average 2006-10(in percent)
Serbia's has large capital buffers relative to other countries in the region...
...but the high capital buffers weigh down on its banking sector's profitability.

21
Figure 5. Serbia: Euroization of Loans and Deposits in Serbia and Regional Peers, 2010
Source: Serbian authorities; and Fund staff estimates.
1/ 2009 data.
60
65
70
75
80
85
90
60
65
70
75
80
85
90
Jan-
08
Mar
-08
May
-08
Jul-0
8
Sep
-08
Nov
-08
Jan-
09
Mar
-09
May
-09
Jul-0
9
Sep
-09
Nov
-09
Jan-
10
Mar
-10
May
-10
Jul-1
0
Sep
-10
Nov
-10
Jan-
11
Mar
-11
May
-11
Banking Sector Euroization in Serbia(in percent)
Deposit euroization
Loan euroization
ALB
BIH
BGR 1/
HRVHUN
LVA 1/
LTU
MKD
POL
ROM
SRB
TUR
0
10
20
30
40
50
60
70
80
90
100
0
10
20
30
40
50
60
70
80
90
100
0 10 20 30 40 50 60 70 80 90 100
Loan
s
Deposits
Banking Sector Euroization Across the Region(in percent)
Euroization in Serbia is among the highest in the region...
...with the sharp nominal depreciation since the 2008 crisis contributing to an increase in deposit euroization and a decline in loan euroization.

22
Figure 6. EBRD Transition Indicators in Central and Eastern Europe, 2004-2010
Note: SEE includes ALB, BiH, BLG, HRV, MKD, HUN, MNE, POL, ROM, SVK, SVN.Source: EBRD Transition Report.
2.0
2.2
2.4
2.6
2.8
3.0
3.2
3.4
3.6
3.8
2.0
2.2
2.4
2.6
2.8
3.0
3.2
3.4
3.6
3.8
2004 2005 2006 2007 2008 2009 2010
Average of All Indicators
SEE average
Croatia
Romania
Serbia
Slovak Republic
0.5
1.0
1.5
2.0
2.5
3.0
3.5
4.0
0.5
1.0
1.5
2.0
2.5
3.0
3.5
4.0
2004 2005 2006 2007 2008 2009 2010
Competition Policy
SEE averageCroatiaRomaniaSerbiaSlovak Republic
ALB
BIH
BGR
HRV
EST
MKD
HUN
LVA
LTU
MDA
MNE
POL
ROM
RUS
SRB
SVK
SVN
UKR
0.00
0.10
0.20
0.30
0.40
0.50
0.60
0 1 2 3 4 5In
crea
se 2
004-
2010
2004 indicator value
Change in Structural Reforms(change in average value of indicator)
2.0
2.5
3.0
3.5
4.0
4.5
2.0
2.5
3.0
3.5
4.0
4.5
2004 2005 2006 2007 2008 2009 2010
Large-Scale Privatization
SEE averageCroatiaRomaniaSerbiaSlovak Republic
Serbia has advanced structural reforms at a faster pace than other transition countries during 2000s, butstarting from a low base reflecting the late start to transition...
...and progress across sectors has been uneven.

23
Figure 7. Serbia: International Reserves, 2008-11
Sources: National Bank of Serbia, WEO; and IMF staff estimates.
1/ Defined as net foreign assets minus the reverse repo stock held by banks with the NBS.
0
2000
4000
6000
8000
10000
12000
0
2000
4000
6000
8000
10000
12000
Sep
-08
Dec
-08
Mar
-09
Jun-
09
Sep
-09
Dec
-09
Mar
-10
Jun-
10
Sep
-10
Dec
-10
Mar
-11
Jun-
11
Gross and Net Reserves (Millions of euros)
Gross international reservesNet international reservesFree reserves 1/
0
0.5
1
1.5
2
2.5
0
0.5
1
1.5
2
2.5
ES
T
LVA
BG
R
RO
M
UK
R
MK
D
TU
R
PO
L
HR
V
HU
N
SR
B
Gross FX Reserves over Short-Term External Debt(Remaining Maturity, 2010)
Median
Rule of Thumb (100 percent coverage)
Serbia's reserve coverage compares favorably to other emerging markets...
...but net reserves are about half of gross reserves.

24
2006 2007 2008 2011 2012
Proj. Proj.
Real GDP 3.6 5.4 3.8 -3.5 1.0 2.0 3.0Real domestic demand (absorption) 4.8 10.2 4.9 -9.0 -2.2 1.4 1.4Consumer prices (average) 12.7 6.5 12.4 8.1 6.2 11.3 4.3Consumer prices (end of period) 6.6 11.0 8.6 6.6 10.3 7.9 3.5Import prices (dinars, average) 15.3 -2.8 13.9 4.4 16.0 4.3 7.1Nominal gross wage 23.2 22.4 17.8 -3.3 7.5 10.1 7.0Real gross wage 10.4 14.5 4.8 -10.5 1.2 -1.0 2.5Registered employment -3.4 -2.1 -1.7 -4.8 -5.2 -1.7 0.3Unemployment rate (in percent) 21.6 18.8 14.7 17.4 20.0 22.2 22.4Nominal GDP (in billions of dinars) 1,962 2,277 2,661 2,713 2,987 3,359 3,615
General government financesRevenue 44.2 44.0 42.8 42.3 41.0 39.2 39.3Expenditure 45.8 45.9 45.5 46.7 45.6 43.7 43.1 Current 41.1 40.5 40.9 42.5 41.1 39.5 39.2 Capital and net lending 4.6 5.4 4.6 4.2 4.5 4.2 4.0Fiscal balance (cash basis) -1.6 -1.9 -2.7 -4.5 -4.6 -4.6 -3.9Structural fiscal balance 1/ -3.5 -4.2 -6.3 -5.0 -3.8 -3.3 -2.3Gross debt 43.0 35.6 34.2 38.2 44.9 44.1 44.5
Monetary sectorMoney (M1) 37.1 25.3 -3.8 8.7 -2.2 9.3 13.6Broad money (M2) 38.4 44.5 9.6 21.8 13.9 20.7 11.1Domestic credit to non-government 17.1 36.9 35.0 15.9 29.0 10.8 14.3
Interest rates (dinar)NBS repo rate 14.0 10.0 17.8 9.5 11.5 … …Deposit rate 5.1 4.1 6.4 5.1 5.6 … …
Balance of payments Current account balance -10.2 -15.9 -21.4 -7.1 -7.2 -7.6 -8.8
Exports of goods 22.0 22.4 22.7 20.7 25.7 26.6 28.5Imports of goods 43.3 45.7 48.7 38.5 42.2 42.0 43.2
Trade of goods balance -21.4 -23.1 -26.0 -17.7 -16.5 -15.4 -14.7Capital and financial account balance 32.0 18.4 16.7 11.1 2.8 7.6 7.2External debt 63.3 61.8 66.7 79.4 82.2 75.3 70.1 of which: Private external debt 36.0 39.5 47.2 54.0 53.4 49.0 48.0Gross official reserves (in billions of euro) 8.7 9.5 8.2 10.6 9.8 10.1 9.4
(In months of prospective imports) 6.6 6.3 7.7 8.6 7.0 6.5 5.8(Percent of short-term debt) 294.5 268.4 162.3 200.7 186.2 158.8 137.1(in percent of broad money, M2) 112.4 84.5 72.7 74.9 76.5 76.5 77.5
Exchange rate (dinar/euro, period average) 84.2 80.0 81.5 93.9 103.5 … …REER (annual average change, in percent; + indicates appreciation) 8.0 9.6 6.5 -6.8 -7.8 10.5 1.0
Social indicatorsPer capita GDP (in US$) 3,958 5,336 6,616 5,642 5,233Population (in million) 7.41 7.38 7.35 7.32 … … …Absolute poverty rate (in percent) 8.8 8.3 6.1 6.9 9.2 … …
Sources: Serbian authorities; and IMF staff estimates and projections.
1/ Fiscal balance adjusted for the automatic effects of the output gap both on revenue and spending.
Table 1. Serbia: Selected Economic and Social Indicators, 2006–12
(Percent of GDP)
(End of period 12-month change, percent)
(Percent of GDP, unless otherwise indicated)
2009 2010
(Percent change, unless otherwise indicated)
(End of period, percent)

25
(Percent of GDP)
2006 2007 2008 2009 2010 2011 2012 2013 2014 2015Proj. Proj. Proj. Proj. Proj.
Domestic demand 121.6 124.2 126.6 117.7 116.5 115.4 115.0 113.9 112.8 111.5
Consumption 97.4 95.2 96.8 94.7 93.7 90.8 90.4 89.6 88.9 88.1Non-government 78.5 74.7 76.7 74.5 74.5 72.2 72.2 71.5 70.8 70.2Government 18.9 20.6 20.1 20.2 19.2 18.6 18.3 18.1 18.0 17.9
Gross domestic savings 2.6 4.8 3.2 5.3 6.3 9.2 9.6 10.4 11.1 11.9Non-government -0.6 1.3 0.9 5.5 6.3 9.1 8.8 8.2 7.9 7.8Government 3.2 3.4 2.3 -0.2 0.1 0.1 0.8 2.1 3.3 4.1
Net factor receipts and transfers 11.4 8.0 5.1 10.5 9.3 7.8 6.3 5.4 5.3 5.1Non-government 12.1 8.5 5.6 10.8 9.7 8.3 7.0 6.1 6.0 5.9Government -0.8 -0.5 -0.5 -0.3 -0.4 -0.5 -0.8 -0.7 -0.7 -0.7
Gross national savings 13.9 12.8 8.3 15.9 15.6 17.0 15.8 15.8 16.4 17.1Non-government 11.5 9.8 6.5 16.4 16.0 17.5 15.8 14.3 13.9 13.7Government 2.4 2.9 1.8 -0.5 -0.3 -0.4 0.0 1.4 2.6 3.4
Gross domestic investment 24.1 29.0 29.7 23.0 22.8 24.7 24.6 24.2 23.9 23.5Non-government 20.0 24.2 25.9 19.6 19.3 21.2 20.9 20.3 19.8 19.1Government 4.1 4.8 3.9 3.4 3.5 3.4 3.7 4.0 4.2 4.4
Overall savings-investment balance -10.2 -16.2 -21.4 -7.1 -7.2 -7.6 -8.8 -8.5 -7.5 -6.4Non-government -8.5 -14.3 -19.4 -3.2 -3.3 -3.8 -5.1 -5.9 -5.9 -5.5Government -1.7 -1.9 -2.0 -4.0 -3.8 -3.8 -3.6 -2.5 -1.6 -0.9
Foreign savings 10.2 16.2 21.4 7.9 8.0 8.3 9.4 9.1 8.0 6.9
Memorandum items:Net exports of goods and services 1/ -21.6 -24.2 -26.6 -17.7 -16.5 -15.4 -15.0 -13.9 -12.8 -11.5Current account balance -10.2 -15.9 -21.4 -7.1 -7.2 -7.6 -8.8 -8.5 -7.5 -6.4General government fiscal balance -1.6 -1.9 -2.7 -4.5 -4.6 -4.6 -3.9 -2.8 -1.9 -1.2
Sources: Statistics Office; National Bank of Serbia; Ministry of Finance; and IMF staff estimates and projections.
1/ Equal to GDP minus domestic demand.
Table 2. Serbia: Savings-Investment Balances, 2006–15

26
(Percent)
2006 2007 2008 2009 2010 2011 2012Proj. Proj.
Gross Domestic Product (GDP) 3.6 5.4 3.8 -3.5 1.0 2.0 3.0Domestic demand (absorption) 4.8 10.2 4.9 -9.0 -2.2 1.4 1.4
Non-government 3.1 7.5 6.9 -9.6 -2.5 2.8 1.4Government 11.1 20.0 -1.8 -7.0 -1.3 -3.0 1.4
Consumption 4.5 4.5 4.4 -3.0 -3.4 -0.6 1.2Non-government 4.5 0.3 5.4 -2.3 -3.8 0.2 1.7Government 4.3 18.2 1.6 -5.1 -2.4 -3.0 -0.1
Investment 5.8 29.8 6.2 -25.4 2.0 8.2 1.8Gross fixed capital formation 14.5 25.6 1.9 -9.1 2.0 8.2 1.8
Non-government 7.3 25.1 6.3 -7.6 1.4 10.2 0.6Government 58.8 28.0 -16.2 -16.4 5.1 -2.8 9.4
Change in inventories 1/ -1.5 1.9 1.5 -5.9 0.0 0.0 0.0Net exports of goods and services 1/ -1.9 -6.4 -2.1 7.5 3.5 0.4 1.5
Exports of goods and services 4.9 17.2 8.9 -14.9 19.1 11.2 12.3Imports of goods and services 7.8 26.0 9.3 -22.9 4.1 7.4 6.2
(Contribution to real growth by expenditure category)
Gross Domestic Product (GDP) 3.6 5.4 3.8 -3.5 1.0 2.0 3.0Domestic demand (absorption) 5.5 11.8 5.9 -11.0 -2.6 1.6 1.5
Non-government 2.8 6.7 6.4 -9.1 -2.2 2.4 1.2Government 2.6 5.0 -0.5 -1.9 -0.3 -0.8 0.3
Consumption 4.0 4.0 3.9 -2.7 -3.1 -0.5 1.0Non-government 3.1 0.2 3.5 -1.5 -2.6 0.1 1.1Government 0.9 3.8 0.4 -1.2 -0.5 -0.7 0.0
Investment 1.5 7.8 2.0 -8.3 0.5 2.1 0.5Gross fixed capital formation 3.0 5.9 0.5 -2.4 0.5 2.1 0.5
Non-government 1.3 4.6 1.4 -1.7 0.3 2.2 0.1Government 1.7 1.3 -0.9 -0.7 0.2 -0.1 0.4
Change in inventories -1.5 1.9 1.5 -5.9 0.0 0.0 0.0Net exports of goods and services -1.9 -6.4 -2.1 7.5 3.5 0.4 1.5
Exports of goods and services 1.3 4.6 2.6 -4.6 5.2 3.6 4.4Imports of goods and services 3.2 11.0 4.7 -12.1 1.7 3.2 2.8
(Contribution to real GDP growth by production category)
Gross Domestic Product (GDP) 3.6 5.4 3.8 -3.5 1.0 2.0 3.0Gross Value Added 5.4 5.6 5.2 -2.1 1.2 2.4 3.9
Agriculture 0.0 -0.9 0.8 0.1 -0.1 0.2 0.2Industry 0.9 0.8 0.3 -2.1 0.7 0.5 0.8Services 2.7 5.5 2.7 -1.4 0.3 1.3 2.0
Wholesale and retail trade 1.0 2.0 0.8 -1.0 -0.1 0.4 0.7Construction 0.2 0.3 0.1 -0.5 -0.1 0.1 0.1Transport and communications 2.8 2.4 1.7 0.9 0.6 0.5 1.0Financial services 0.4 0.5 0.5 0.2 0.0 0.1 0.2Other 0.1 0.4 1.0 0.4 0.2 0.5 0.8
Taxes minus subsidies 0.0 1.5 0.6 -0.9 0.3 0.3 0.5
Memorandum items:Tradables GDP 0.9 0.4 1.3 -2.4 0.7 0.8 1.2Non-tradables GDP 4.3 6.5 4.2 -0.8 0.2 1.2 1.9
Sources: Serbian Statistical Office; and IMF staff estimates and projections.
1/ Contributions to GDP growth.
Table 3. Serbia: Real GDP Growth Components, 2006–12

27
2008 2009 2010 2011 2012 2013 2014 2015Proj. Proj. Proj. Proj. Proj.
GDP and prices (percent change)GDP (real) 3.8 -3.5 1.0 2.0 3.0 4.5 5.0 5.0Domestic demand growth (real) 4.9 -9.0 -2.2 1.4 1.4 3.2 3.5 3.2Consumer price inflation (end of period) 8.6 6.6 10.3 7.9 3.5 4.0 4.0 4.0
Savings and investment (percent of GDP)Savings - investment balance -21.4 -7.1 -7.2 -7.6 -8.8 -8.5 -7.5 -6.4
Non-government -19.4 -3.2 -3.3 -3.8 -5.1 -5.9 -5.9 -5.5Government -2.0 -4.0 -3.8 -3.8 -3.6 -2.5 -1.6 -0.9
General government (percent of GDP)Overall fiscal balance -2.7 -4.5 -4.6 -4.6 -3.9 -2.8 -1.9 -1.2
Revenue 42.8 42.3 41.0 39.2 39.3 39.4 39.7 39.6Expenditure 45.5 46.7 45.6 43.7 43.1 42.3 41.6 40.8
Current 40.9 42.5 41.1 39.5 39.2 38.0 37.1 36.1of which: Wages and salaries 11.0 11.1 10.4 10.1 10.1 9.9 9.7 9.5of which: Pensions 12.4 14.3 13.2 12.6 12.6 12.2 11.8 11.5of which: Goods and services 7.8 7.8 7.6 7.3 7.1 7.1 7.2 7.2
Capital and net lending 4.6 4.2 4.5 4.2 4.0 4.3 4.5 4.7Structural fiscal balance -6.3 -5.0 -3.8 -3.3 -2.3 -1.4 -0.9 -0.7Output gap 9.0 1.3 -1.5 -3.3 -4.0 -3.4 -2.4 -1.3Gross debt 34.2 38.2 44.9 44.1 44.5 43.1 40.8 38.2
Balance of payments (percent of GDP)Current account -21.4 -7.1 -7.2 -7.6 -8.8 -8.5 -7.5 -6.4
of which: Trade balance -26.0 -17.7 -16.5 -15.4 -14.7 -13.9 -12.8 -11.5of which: Current transfers, net (excl. grants) 7.2 11.5 10.8 9.5 8.8 7.8 7.6 7.3
Capital and financial account 16.7 11.1 2.8 7.6 7.2 10.7 10.2 9.3of which: Foreign direct investment 5.5 4.7 3.0 4.6 5.2 4.1 4.1 4.1
External debt (end of period) 66.7 79.4 82.2 75.3 70.1 69.6 67.7 65.8of which: Private external debt 47.2 54.0 53.4 49.0 48.0 51.0 51.3 50.4
Gross official reserves (billions of euros) 8.2 10.6 9.8 10.1 9.4 9.6 10.1 11.1REER (ann. av. change; + = appreciation) 6.5 -6.8 -7.8 10.5 1.0 1.5 2.4 2.4
Sources: Serbian authorities; and IMF staff estimates and projections.1/ Definitions and coverage as in previous tables.
Table 4 Serbia: Medium-Term Program Scenario, 2008–15 1/

28
2008 2009 2012 2013 2014 2015Proj. Proj. Proj. Proj. Proj.
Current account balance -7.0 -2.1 -2.1 -2.5 -3.0 -3.2 -3.1 -2.9Trade of goods balance -8.5 -5.1 -4.8 -5.1 -5.1 -5.2 -5.3 -5.2
Exports of goods 7.4 6.0 7.4 8.7 9.9 11.2 12.8 14.5Imports of goods -15.9 -11.1 -12.2 -13.8 -15.0 -16.4 -18.0 -19.7
Services balance -0.2 0.0 0.0 0.0 -0.1 0.0 0.0 0.0Income balance -0.9 -0.5 -0.7 -0.8 -1.1 -1.1 -1.2 -1.2
Net interest -0.7 -0.6 -0.6 -0.8 -1.1 -1.1 -1.2 -1.2Others, including reinvested earnings -0.2 0.1 0.0 0.0 0.0 0.0 0.0 0.0
Current transfer balance 2.6 3.5 3.4 3.3 3.3 3.2 3.4 3.5
Capital and financial account balance 5.5 3.2 0.8 2.5 2.5 4.0 4.2 4.2Capital transfer balance 0.0 0.0 0.0 0.0 0.0 0.0 0.0 0.0Foreign direct investment balance 1.8 1.4 0.9 1.5 1.8 1.5 1.7 1.8Portfolio investment balance -0.1 -0.1 0.1 0.1 0.1 0.1 0.2 0.2Other investment balance 3.7 1.9 -0.1 0.9 0.6 2.4 2.3 2.2
General government 0.1 0.7 0.7 0.3 0.0 -0.1 0.4 0.5Domestic banks 0.5 1.6 0.3 0.6 0.4 0.1 0.1 0.2Other private sector 3.2 -0.4 -1.2 0.1 0.2 2.4 1.8 1.4
Errors and omissions -0.1 0.1 0.0 0.0 0.0 0.0 0.0 0.0
Overall balance -1.7 1.2 -1.3 0.0 -0.5 0.8 1.1 1.3
Financing 1.7 -1.2 1.3 0.0 0.5 -0.8 -1.1 -1.3Gross international reserves (increase, -) 1.7 -2.4 0.8 -0.2 0.7 -0.2 -0.5 -1.0Prospective drawings … 1.1 0.5 0.2 0.0 0.0 0.0 0.0 EU … 0.0 0.0 0.1 0.0 0.0 0.0 0.0 World Bank … 0.0 0.1 0.1 0.0 0.0 0.0 0.0 IMF … 1.1 0.3 0.1 0.0 0.0 0.0 0.0Prospective repayments (IMF) … … … … -0.2 -0.6 -0.6 -0.3
Current account balance -21.4 -7.1 -7.2 -7.6 -8.8 -8.5 -7.5 -6.4Trade of goods balance -26.0 -17.7 -16.5 -15.4 -14.7 -13.9 -12.8 -11.5
Exports of goods 22.7 20.7 25.7 26.6 28.5 30.0 31.1 32.2Imports of goods -48.7 -38.5 -42.2 -42.0 -43.2 -43.8 -43.9 -43.7
Services balance -0.5 0.1 0.0 0.0 -0.3 0.0 0.0 0.0Income balance -2.8 -1.7 -2.3 -2.3 -3.2 -3.0 -2.8 -2.7Current transfer balance 8.0 12.3 11.6 10.2 9.4 8.4 8.2 7.8
Capital and financial account balance 16.7 11.1 2.8 7.6 7.2 10.7 10.2 9.3Capital transfers balance 0.0 0.0 0.0 0.0 0.0 0.0 0.0 0.0Foreign direct investment balance 5.5 4.7 3.0 4.6 5.2 4.1 4.1 4.1Portfolio investment balance -0.3 -0.2 0.2 0.3 0.3 0.3 0.5 0.5Other investment balance 11.4 6.6 -0.4 2.8 1.7 6.3 5.6 4.8
Errors and omissions -0.5 0.3 0.0 0.0 0.0 0.0 -0.1 0.0
Overall balance -5.2 4.3 -4.4 0.0 -1.5 2.2 2.6 2.9
Memorandum items:Export growth 16.2 -19.4 23.8 17.9 13.3 13.6 13.7 13.6Import growth 22.2 -30.3 9.8 13.2 8.8 9.6 9.7 9.3
Export volume growth 5.0 -14.9 19.1 11.2 12.3 12.7 13.4 13.2Import volume growth 6.4 -22.9 4.1 7.4 6.2 8.3 8.9 8.5Trading partner import growth 3.2 -18.2 9.2 4.9 4.6 4.8 5.2 5.1Export prices growth 10.7 -5.3 4.0 6.0 0.9 0.9 0.3 0.3Import prices growth 14.9 -9.7 5.5 5.4 2.5 1.2 0.8 0.7Change in terms of trade -3.6 4.9 -1.4 0.6 -1.6 -0.4 -0.4 -0.4
GDP (billiions of euros) 32.7 28.8 28.9 32.8 34.7 37.5 41.1 45.0
Sources: NBS; and IMF staff estimates and projections.
Table 5. Serbia: Balance of Payments, 2008–15 1/
1/ Some estimates, in particular for private remittances and reinvested earnings, are subject to significant uncertainty. In addition, due to data shortcomings, intercompany loan transactions are recorded as debt flows rather than FDI flows.
(Percent, unless otherwise indicated)
(Percent of GDP)
(Billions of euros)
2010 2011

29
(Billions of euros, unless otherwise indicated)
2008 2009 2010 2011 2012 2013 2014 2015Proj. Proj. Proj. Proj. Proj.
1. Gross financing requirements 8.13 7.21 6.38 8.04 8.66 10.20 10.73 11.98
Current account deficit 7.00 2.05 2.07 2.50 3.04 3.18 3.07 2.88
Debt amortization 3.62 4.25 4.33 5.31 6.35 6.82 7.16 8.09Medium- and long-term debt 2.67 2.65 2.72 3.78 4.71 5.19 5.52 6.46
Public sector 1/ 0.12 0.14 0.24 0.50 1.17 1.09 0.63 0.49Commercial banks 0.54 0.12 0.47 0.35 0.37 0.67 0.65 0.89Corporate sector 2.01 2.39 2.01 2.93 3.17 3.43 4.24 5.07
Short-term debt 0.94 1.61 1.61 1.54 1.64 1.64 1.64 1.64Commercial banks … 1.17 1.17 1.10 1.14 1.13 1.13 1.13Corporate sector … 0.44 0.44 0.44 0.51 0.51 0.51 0.51
Accumulation of gross reserves 0.00 2.36 -0.79 0.23 -0.73 0.20 0.50 1.00
Repayment of prospective IMF credits ... ... ... ... 0.19 0.63 0.57 0.33
Other outflows, net 2/ -2.48 -1.46 0.76 0.00 0.00 0.00 0.00 0.00
2. Available financing 7.26 6.06 5.77 7.82 8.66 10.20 10.73 11.98
Capital transfers 0.01 0.00 0.00 0.00 0.00 0.00 0.00 0.00Foreign direct investment (net) 1.81 1.37 0.86 1.50 1.80 1.54 1.68 1.85Portfolio investment (net) -0.09 -0.06 0.07 0.10 0.10 0.10 0.20 0.20
Debt financing 5.53 4.75 4.84 6.22 6.18 9.20 9.45 10.25Medium- and long-term debt 4.86 3.14 3.32 4.69 4.54 7.57 7.82 8.61
Public sector 1/ 0.18 0.39 0.97 0.75 0.40 1.00 1.00 1.00Commercial banks 0.23 0.90 1.12 0.94 0.74 0.75 0.78 1.10Corporate sector 4.46 1.85 1.22 3.00 3.40 5.82 6.04 6.51
Short-term debt 0.67 1.61 1.52 1.54 1.64 1.64 1.64 1.64Commercial banks … 1.17 1.17 1.10 1.14 1.13 1.13 1.13Corporate sector … 0.44 0.44 0.44 0.51 0.51 0.51 0.51
3. Financing gap 3/ 0.00 1.16 0.47 0.22 0.00 0.00 0.00 0.00
European Union … 0.00 0.00 0.10 0.00 0.00 0.00 0.00 World Bank … 0.04 0.13 0.07 0.00 0.00 0.00 0.00 IMF … 1.12 0.34 0.05 … … … …
Memorandum items:Debt service 4.35 4.89 5.01 5.85 6.94 7.41 7.75 8.70 Interest 0.73 0.63 0.68 0.54 0.59 0.59 0.59 0.60 Amortization 3.62 4.25 4.33 5.31 6.35 6.82 7.16 8.09
Sources: NBS; and Fund staff estimates and projections.
1/ Excluding IMF.2/ Includes all other net financial flows, SDR allocations, and errors and omissions.3/ For 2011, the financing gap is for the first quarter.
Table 6. Serbia: External Financing Requirements and Sources, 2008–15

30
International investment position 2/ -23.3 -23.5 -25.5 -27.5 -30.2 -33.0 -35.7 -38.2
Public sector 3/ 1.8 3.0 1.1 1.1 1.3 2.2 2.9 3.7
Private sector 3/ -25.1 -26.5 -26.7 -28.6 -31.5 -35.2 -38.6 -41.9
FDI and portfolio investment (net) 4/ -12.2 -13.2 -14.2 -15.8 -17.7 -19.3 -21.2 -23.2
External debt (net) 4/ -21.8 -23.2 -24.1 -25.1 -24.7 -26.5 -28.2 -30.0
Gross external debt -21.8 -22.8 -23.7 -24.7 -24.3 -26.1 -27.8 -29.6
General government -6.4 -6.1 -6.9 -7.1 -6.3 -6.3 -6.6 -7.1
Private sector -15.4 -15.6 -15.4 -16.1 -16.7 -19.1 -21.1 -22.7
Banks -3.9 -4.7 -5.1 -5.7 -6.1 -6.1 -6.3 -6.5
Other private sector -11.5 -10.9 -10.3 -10.4 -10.6 -13.0 -14.8 -16.2
Liabilities from drawings under the SBA -1.1 -1.5 -1.5 -1.3 -0.7 -0.1 0.2
Gross external assets (SDR holdings in excess of allocations) -0.4 -0.4 -0.4 -0.4 -0.4 -0.4 -0.4
Other, net (inc. commercial banks foreign assets) 2.6 2.3 2.9 3.2 2.8 3.2 3.6 4.0
Central bank gross international reserves 8.2 10.6 9.8 10.1 9.4 9.6 10.1 11.1
o/w central bank free net reserves 4.8 5.0 4.7 4.9 4.2 4.4 4.9 5.9
International investment position 2/ -71.3 -81.6 -88.5 -84.0 -87.0 -88.0 -86.9 -84.8
Public sector 3/ 5.4 10.5 4.0 3.3 3.8 5.9 7.1 8.3
Private sector 3/ -76.7 -92.0 -92.4 -87.2 -90.7 -93.9 -94.0 -93.1
FDI and portfolio investment (net) 4/ -37.4 -45.9 -49.1 -48.1 -50.9 -51.5 -51.6 -51.6
External debt (net) 4/ -66.7 -80.4 -83.5 -76.4 -71.2 -70.6 -68.6 -66.7Gross external debt -66.7 -79.1 -82.2 -75.3 -70.1 -69.6 -67.7 -65.8
General government -19.5 -21.2 -23.8 -21.7 -18.2 -16.7 -16.1 -15.8
Private sector -47.2 -54.0 -53.4 -49.0 -48.0 -51.0 -51.3 -50.4
Banks -12.0 -16.3 -17.6 -17.3 -17.4 -16.4 -15.2 -14.3
Other private sector -35.2 -37.7 -35.7 -31.6 -30.6 -34.7 -36.0 -36.1
Liabilities from drawings under the SBA -3.9 -5.1 -4.6 -3.8 -1.9 -0.3 0.4
Gross external assets 0.0 -1.3 -1.3 -1.2 -1.1 -1.0 -0.9 -0.9
Other, net (inc. commercial banks reserves) 7.9 7.8 10.0 9.8 8.2 8.6 8.8 8.9
Central bank gross international reserves 25.0 36.9 34.1 30.7 26.9 25.5 24.5 24.5
o/w central bank free net reserves 14.7 17.2 16.3 15.0 12.1 11.7 11.9 13.1
Memorandum items:
Central bank international reserves
Gross reserves (months of next year's imports) 7.7 8.6 7.0 6.5 5.8 5.4 5.1 5.1
Free net reserves (months of next year's imports) 4.5 4.0 3.3 3.2 2.6 2.5 2.5 2.7
Short term external debt by original maturity due 1.6 1.6 1.5 1.6 1.6 1.6 1.6 1.6
(in percent of central bank gross reserves) 19.7 15.1 15.6 16.3 17.5 17.1 16.3 14.8
(in percent of central bank free net reserves) 33.4 32.4 32.6 33.4 39.0 37.2 33.4 27.8
(percent of total debt) 7.4 7.1 6.5 6.7 6.7 6.3 5.9 5.5
(percent of GDP) 4.9 5.6 5.3 5.0 4.7 4.4 4.0 3.6
Short term external debt by remaining maturity 5.0 5.3 5.3 6.4 6.8 7.2 8.1 9.4
(percent of central bank gross reserves) 61.6 49.8 53.7 63.0 72.9 74.9 80.5 85.1
(percent of central bank free net reserves) 104.5 106.7 112.5 129.0 162.7 162.9 165.4 159.6
(percent of total debt) 23.1 23.3 22.3 25.7 28.0 27.4 29.1 31.7
(percent of GDP) 15.4 18.4 18.3 19.4 19.6 19.1 19.7 20.9
GDP 32.7 28.8 28.9 32.8 34.7 37.5 41.1 45.0
Sources: NBS; and IMF staff estimates and projections.
2/ + denotes a net asset position, - a net liability.
4/ Intercompany loans cannot be identified and are included in external debt rather than in FDI position.3/ Staff estimates (available data on gross external debt assets and other items is not sufficient to accurately estimate the breakdown public/private).
1/ NBS estimates for gross external debt and international reserves. Stock data for other items are staff estimates based on flows since the beginning of transition.
2008 2009
(Billions of euros, unless otherwise indicated)
Table 7. Serbia: External Balance Sheet, 2008-15 1/
2011Proj.
2014Proj.
(Bllions of euros)
(Percent of GDP)
2010 2012Proj.
2015Proj.
2013Proj.

31
2012 2013 2014 2015Proj. Proj. Proj. Proj. Proj.
Current account balance -2.1 -2.5 -2.9 -3.2 -3.1 -2.9Trade of goods balance -4.8 -5.1 -5.0 -5.3 -5.3 -5.2
Exports of goods 7.4 8.7 9.7 11.3 12.8 14.5Imports of goods -12.2 -13.8 -14.7 -16.6 -18.0 -19.7
Services balance 0.0 0.0 -0.1 0.0 0.0 0.0Income balance -0.7 -0.8 -1.1 -1.1 -1.2 -1.2
Net interest -0.6 -0.8 -1.1 -1.1 -1.2 -1.2Others, including reinvested earnings 0.0 0.0 0.0 0.0 0.0 0.0
Current transfer balance 3.4 3.3 3.3 3.2 3.4 3.5
Capital and financial account balance 0.7 1.3 1.5 4.0 4.2 4.2Capital transfer balance 0.0 0.0 0.0 0.0 0.0 0.0Foreign direct investment balance 0.9 1.4 1.6 1.5 1.7 1.8Portfolio investment balance 0.1 0.1 0.1 0.1 0.2 0.2Other investment balance -0.2 -0.1 -0.2 2.4 2.3 2.2
General government 0.7 0.3 0.0 -0.1 0.4 0.5Domestic banks 0.3 0.1 0.1 0.1 0.1 0.2Other private sector -1.3 -0.5 -0.3 2.4 1.8 1.4
Errors and omissions 0.1 0.0 0.3 0.0 0.0 0.0
Overall balance -1.3 -1.2 -1.1 0.7 1.1 1.3
Financing 1.3 1.2 1.1 -0.7 -1.1 -1.3Gross international reserves (increase, -) 0.8 0.6 0.8 -0.3 -0.5 -1.0Prospective drawings 0.5 0.6 0.5 0.1 0.0 0.0 EU 0.0 0.1 0.0 0.0 0.0 0.0 World Bank 0.1 0.1 0.0 0.0 0.0 0.0 IMF 0.3 0.4 0.5 0.1 0.0 0.0Prospective repayments (IMF) … … -0.2 -0.6 -0.6 -0.3
Current account balance -7.2 -7.6 -8.5 -8.6 -7.5 -6.4Trade of goods balance -16.5 -15.4 -14.4 -14.0 -12.8 -11.5
Exports of goods 25.7 26.6 28.0 30.2 31.1 32.2Imports of goods -42.2 -42.0 -42.5 -44.2 -43.9 -43.7
Services balance 0.0 0.0 -0.3 0.0 0.0 0.0Income balance -2.3 -2.3 -3.2 -3.0 -2.8 -2.7Current transfer balance 11.6 10.2 9.4 8.4 8.2 7.8
Capital and financial account balance 2.5 4.0 4.3 10.7 10.2 9.3Capital transfers balance 0.0 0.0 0.0 0.0 0.0 0.0Foreign direct investment balance 3.0 4.1 4.6 4.1 4.1 4.1Portfolio investment balance 0.2 0.3 0.3 0.3 0.5 0.5Other investment balance -0.8 -0.4 -0.6 6.3 5.6 4.8
Errors and omissions 0.3 0.0 0.9 -0.1 -0.1 0.0
Overall balance -4.4 -3.6 -3.2 2.0 2.6 2.9
Memorandum items:Export growth 23.8 17.9 11.5 16.4 12.7 13.6Import growth 9.8 13.2 7.0 12.5 8.7 9.3
Export volume growth 19.1 11.2 12.3 12.7 13.4 13.2Import volume growth 4.1 7.4 6.2 8.3 8.9 8.5Trading partner import growth 9.2 4.6 4.8 5.2 5.1 5.1Export prices growth 4.0 6.0 -0.7 3.3 -0.6 0.3Import prices growth 5.5 5.4 0.8 3.9 -0.2 0.7Change in terms of trade -1.4 0.6 -1.4 -0.5 -0.4 -0.4
GDP (billiions of euros) 28.9 32.8 34.7 37.5 41.1 45.0
Sources: NBS; and IMF staff estimates and projections.1/ Some estimates, in particular for private remittances and reinvested earnings, are subject to significant uncertainty. In addition, due to data shortcomings, intercompany loan transactions are recorded as debt flows rather than FDI flows.
Table 8. Serbia: Balance of Payments, Precautionary SBA Shock Scenario, 2010–15 1/
2010 2011
(Billions of euros)
(Percent of GDP)
(Percent, unless otherwise indicated)

32
2011 2012 2013 2014 2015 2016
Fund repurchases and charges
In millions of SDRs 13 202 589 514 173 93
In millions of euro 14 235 688 602 204 111
In percent of exports of goods and NFS 0.1 1.7 4.8 3.7 1.1 0.5
In percent of GDP 0.0 0.7 1.8 1.5 0.5 0.2
In percent of quota 2.7 43.2 126.0 109.9 37.1 19.9
In percent of total external debt service 0.2 2.2 5.8 5.0 1.6 0.8
In percent of gross international reserves 0.1 2.6 8.2 7.0 2.2 1.1
Fund credit outstanding (end-period)
In millions of SDRs 1,433 1,357 789 288 120 31
In millions of euro 1,657 1,576 921 337 142 37
In percent of exports of goods and NFS 14.1 11.7 6.5 2.1 0.8 0.2
In percent of GDP 5.1 4.5 2.5 0.8 0.3 0.1
In percent of quota 306.3 290.2 168.8 61.5 25.7 6.7
In percent of total external debt 6.7 6.5 3.5 1.2 0.5 0.1
In percent of gross international reserves 17.1 17.2 11.0 3.9 1.6 0.4
Memorandum items:
Exports of goods and NFS 11,795 13,485 14,249 16,080 18,289 20,625
Quota (in millions of SDRs) 468 468 468 468 468 468
Total external debt service 9,193 10,876 11,755 11,991 12,683 13,993
Public sector external debt (end-period) 8,624 7,661 6,950 6,752 6,936 6,670
Total external debt stock (end-period) 24,687 24,328 26,083 27,812 29,642 31,109
Gross international reserves 9,715 9,149 8,369 8,619 9,119 10,119
Source: Fund staff estimates.
1/ Based on the shock scenario outlined in Table 8 and full drawing under proposed precautionary SBA.
(Millions of euros, unless otherwise indicated)
Table 9. Serbia: Indicators of Capacity to Repay the Fund, 2011–16 1/

33
2010 2011 2012 2013Proj Proj Proj
Output, prices and wagesReal GDP 1.0 2.0 3.0 4.5
Contribution of domestic demand -2.6 1.6 1.5 3.5Contribution of exports 3.5 0.4 1.5 1.0
Domestic demand -2.2 1.4 1.4 3.2Export volume 19.1 11.2 12.3 12.7Import volume 4.1 7.4 6.2 8.3CPI (end of period) 10.3 7.9 3.5 4.0REER (CPI based) -7.8 10.5 1.0 1.5Output gap -1.5 -3.3 -4.0 -3.4Nominal wage growth (percent) 12.1 10.6 6.1 6.4Wage bill (percent of GDP) 32.6 31.4 31.3 31.7
General governmentOverall balance -4.6 -4.6 -3.9 -2.8
Revenues 41.0 39.2 39.3 39.4Expenditures 45.6 43.7 43.1 42.3
Structural balance -3.8 -3.3 -2.3 -1.4Gross debt 44.9 44.1 44.5 43.1
External sectorCurrent account -7.2 -7.6 -8.8 -8.5
Trade balance -16.5 -15.4 -14.7 -13.9Capital account 2.8 7.6 7.2 10.7External debt 82.2 75.3 70.1 69.6Gross international reserves 34.1 30.7 26.9 25.5
(in months of next year's imports) 7.0 6.5 5.8 5.4Net international investment position -88.5 -84.0 -87.0 -88.0
2010 2011 2012 2013Proj Proj Proj
Output, prices and wagesReal GDP 1.0 1.7 -1.3 3.6
Contribution of domestic demand -2.6 1.4 -4.9 2.3Contribution of exports 3.5 0.3 3.6 1.2
Domestic demand -2.2 1.3 -4.5 2.2Export volume 19.1 10.9 -0.5 9.7Import volume 4.1 7.4 -8.2 5.1CPI (end of period) 10.3 7.9 6.0 4.0REER (CPI based) -7.8 9.5 -3.3 6.1Output gap -1.5 -3.5 -8.3 -8.6Nominal wage growth (percent) 12.1 10.3 3.0 6.8Wage bill (percent of GDP) 32.6 31.4 31.5 30.9
General governmentOverall balance -4.6 -4.6 -5.6 -4.4
Revenues 41.0 39.2 39.0 38.2Expenditures 45.6 43.8 44.6 42.7
Structural balance -3.8 -3.2 -2.3 -1.0Gross debt 44.9 45.4 49.2 49.6
External sectorCurrent account -7.2 -7.8 -6.6 -6.0
Trade balance -16.5 -15.7 -13.2 -11.2Capital account 2.8 4.7 -0.2 6.4External debt 82.2 73.1 76.8 70.4Gross international reserves 34.1 28.7 26.8 24.6
(in months of next year's imports) 7.0 7.3 6.7 6.2Net international investment position -88.5 -86.1 -95.2 -89.7
Sources: IMF staff estimates and projections.
(Percent of GDP)
Table 10. Serbia: Macroeconomic Framework - Baseline and External Spillover Scenarios, 2010-13
Baseline
(Percent)
(Percent of GDP)
External spillover scenario
(Percent)
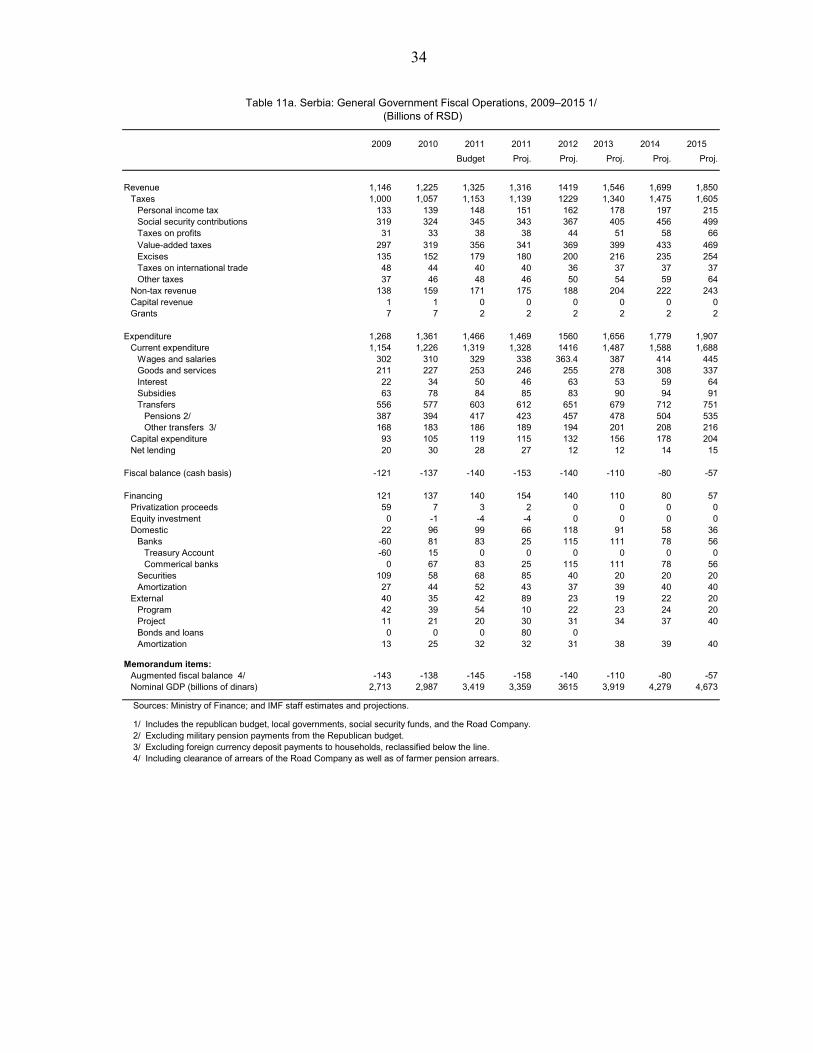
34
2010 2011 2011 2012 2013 2014 2015
Budget Proj. Proj. Proj. Proj. Proj.
Revenue 1,146 1,225 1,325 1,316 1419 1,546 1,699 1,850Taxes 1,000 1,057 1,153 1,139 1229 1,340 1,475 1,605
Personal income tax 133 139 148 151 162 178 197 215Social security contributions 319 324 345 343 367 405 456 499Taxes on profits 31 33 38 38 44 51 58 66Value-added taxes 297 319 356 341 369 399 433 469Excises 135 152 179 180 200 216 235 254Taxes on international trade 48 44 40 40 36 37 37 37Other taxes 37 46 48 46 50 54 59 64
Non-tax revenue 138 159 171 175 188 204 222 243Capital revenue 1 1 0 0 0 0 0 0Grants 7 7 2 2 2 2 2 2
Expenditure 1,268 1,361 1,466 1,469 1560 1,656 1,779 1,907
Current expenditure 1,154 1,226 1,319 1,328 1416 1,487 1,588 1,688Wages and salaries 302 310 329 338 363.4 387 414 445Goods and services 211 227 253 246 255 278 308 337Interest 22 34 50 46 63 53 59 64Subsidies 63 78 84 85 83 90 94 91Transfers 556 577 603 612 651 679 712 751
Pensions 2/ 387 394 417 423 457 478 504 535Other transfers 3/ 168 183 186 189 194 201 208 216
Capital expenditure 93 105 119 115 132 156 178 204Net lending 20 30 28 27 12 12 14 15
Fiscal balance (cash basis) -121 -137 -140 -153 -140 -110 -80 -57
Financing 121 137 140 154 140 110 80 57Privatization proceeds 59 7 3 2 0 0 0 0Equity investment 0 -1 -4 -4 0 0 0 0Domestic 22 96 99 66 118 91 58 36
Banks -60 81 83 25 115 111 78 56Treasury Account -60 15 0 0 0 0 0 0Commerical banks 0 67 83 25 115 111 78 56
Securities 109 58 68 85 40 20 20 20Amortization 27 44 52 43 37 39 40 40
External 40 35 42 89 23 19 22 20Program 42 39 54 10 22 23 24 20Project 11 21 20 30 31 34 37 40Bonds and loans 0 0 0 80 0Amortization 13 25 32 32 31 38 39 40
Memorandum items:Augmented fiscal balance 4/ -143 -138 -145 -158 -140 -110 -80 -57Nominal GDP (billions of dinars) 2,713 2,987 3,419 3,359 3615 3,919 4,279 4,673
Sources: Ministry of Finance; and IMF staff estimates and projections.
1/ Includes the republican budget, local governments, social security funds, and the Road Company.2/ Excluding military pension payments from the Republican budget.3/ Excluding foreign currency deposit payments to households, reclassified below the line.4/ Including clearance of arrears of the Road Company as well as of farmer pension arrears.
2009
Table 11a. Serbia: General Government Fiscal Operations, 2009–2015 1/ (Billions of RSD)

35
2010 2011 2011 2012 2013 2014 2015
Budget Proj. Proj. Proj. Proj. Proj.
Revenue 42.3 41.0 38.8 39.2 39.3 39.4 39.7 39.6Taxes 36.9 35.4 33.7 33.9 34.0 34.2 34.5 34.3
Personal income tax 4.9 4.7 4.3 4.5 4.5 4.5 4.6 4.6Social security contributions 11.7 10.8 10.1 10.2 10.2 10.3 10.6 10.7Taxes on profits 1.1 1.1 1.1 1.1 1.2 1.3 1.4 1.4Value-added taxes 10.9 10.7 10.4 10.2 10.2 10.2 10.1 10.0Excises 5.0 5.1 5.2 5.4 5.5 5.5 5.5 5.4Taxes on international trade 1.8 1.5 1.2 1.2 1.0 0.9 0.9 0.8Other taxes 1.4 1.5 1.4 1.4 1.4 1.4 1.4 1.4
Non-tax revenue 5.1 5.3 5.0 5.2 5.2 5.2 5.2 5.2Capital revenue 0.1 0.0 0.0 0.0 0.0 0.0 0.0 0.0Grants 0.2 0.2 0.1 0.1 0.1 0.0 0.0 0.0
Expenditure 46.7 45.6 42.9 43.7 43.1 42.3 41.6 40.8Current expenditure 42.5 41.1 38.6 39.5 39.2 38.0 37.1 36.1
Wages and salaries 11.1 10.4 9.6 10.1 10.1 9.9 9.7 9.5Goods and services 7.8 7.6 7.4 7.3 7.1 7.1 7.2 7.2Interest 0.8 1.1 1.5 1.4 1.7 1.4 1.4 1.4Subsidies 2.3 2.6 2.5 2.5 2.3 2.3 2.2 1.9Transfers 20.5 19.3 17.6 18.2 18.0 17.3 16.6 16.1
Pensions 2/ 14.3 13.2 12.2 12.6 12.6 12.2 11.8 11.5Other transfers 3/ 6.2 6.1 5.5 5.6 5.4 5.1 4.9 4.6
Capital expenditure 3.4 3.5 3.5 3.4 3.7 4.0 4.2 4.4Net lending 0.8 1.0 0.8 0.8 0.3 0.3 0.3 0.3
Fiscal balance (cash basis) -4.5 -4.6 -4.1 -4.6 -3.9 -2.8 -1.9 -1.2
Financing 4.5 4.6 4.1 4.6 3.9 2.8 1.9 1.2Privatization proceeds 2.2 0.2 0.1 0.1 0.0 0.0 0.0 0.0Equity investment 0.0 … -0.1 -0.1 0.0 0.0 0.0 0.0Domestic 0.8 3.2 2.9 2.0 3.3 2.3 1.4 0.8
Banks -2.2 2.7 2.4 0.7 3.2 2.8 1.8 1.2Treasury Account -2.2 0.5 0.0 0.0 0.0 0.0 0.0 0.0Commerical banks 0.0 2.2 2.4 0.7 3.2 2.8 1.8 1.2
Securities 4.0 2.0 2.0 2.5 1.1 0.5 0.5 0.4Amortization 1.0 1.5 1.5 1.3 1.0 1.0 0.9 0.9
External 1.5 1.2 1.2 2.7 0.6 0.5 0.5 0.4Program 1.5 1.3 1.6 0.3 0.6 0.6 0.6 0.4Project 0.4 0.7 0.6 0.9 0.9 0.9 0.9 0.9Bonds and loans 0.0 … 0.0 2.4 0.0 0.0 0.0 0.0Amortization 0.5 0.8 0.9 0.9 0.9 1.0 0.9 0.9
Memorandum items: Structural fiscal balance 4/ -5.0 -3.8 … -3.3 -2.3 -1.4 -0.9 -0.7Output gap 5/ 1.3 -1.5 … -3.3 -4.0 -3.4 -2.4 -1.3Augmented fiscal balance 6/ -5.3 -4.6 -4.3 -4.7 -3.9 -2.8 -1.9 -1.2Gross debt 38.2 44.9 … 44.1 44.5 43.1 40.8 38.2Nominal GDP (billions of dinars) 2,713 2,987 3,419 3,359 3,615 3,919 4,279 4,673
Sources: Ministry of Finance; and IMF staff estimates and projections.
1/ Includes the republican budget, local governments, social security funds, and the Road fund. 2/ Excluding military pension payments from the Republican budget.3/ Excluding foreign currency deposit payments to households, reclassified below the line.
5/ Percentage deviation of actual from potential GDP. 6/ Including clearance of arrears of the Road Company and of farmer pension arrears.
2009
4/ Fiscal balance adjusted for the automatic effects of the output gap on the fiscal position and for social transfers associated with the financial crisis.
Table 11b. Serbia: General Government Fiscal Operations, 2009–2015 1/(Percent of GDP)

36
Gen. Gov.Republican
budgetOwn
budgetsLocal gov.
and V.Road
company
Social security funds
Pension Fund
Health Fund
Labor Fund
Netting operations
Total revenue 1316 707 48 174 37 411 256 136 19 -61 Current revenue 1314 707 47 173 37 411 256 136 19 -61 Tax revenue 1139 658 0 120 19 404 253 134 16 -61 Personal income tax 151 71 80 Social security contributions 343 0 404 253 134 16 -61 Corporate income tax 38 35 3 VAT 341 341 0 Excises 180 162 19 Taxes on international trade 40 40 Other taxes 46 9 0 37 Extrabudgetary taxes 0 0 0 0 Nontax revenue 175 49 47 53 18 7 3 2 2 Capital revenue 0 0 0 0 0 0 0 0 0 Grants 2 0 1 1 0 0 0
Total expenditure and net lending 1469 536 38 252 39 666 450 191 25 -61 Current expenditure 1328 480 30 194 21 665 449 191 25 -61 Expenditure on goods and services 585 268 27 136 19 195 7 185 4 -61
Wages and salaries 338 172 7 64 1 94 3 89 2 Employer contribution 0 32 1 11 0 16 1 15 0 -61 Goods and services 246 64 18 61 18 85 3 81 2
Interest payments 46 42 0 2 2 0 0 0 0Subsidies 85 55 2 28 0 0 0 0Pensions 447 24 0 0 0 423 423 0 0Other transfers to households 165 92 0 27 46 19 6 21
Capital expenditure 115 30 8 57 18 1 1 0 0Own resource 85 23 8 46 6 1 0 0 0Foreign financed 30 7 11 12
Net lending 27 26 0 1 0 0 0 0Budgetary reserve 0 0
Fiscal balance (before transfers) -153 171 10 -78 -2 -255 -194 -55 -7 0 Transfers from other levels of government 387 0 0 67 0 320 247 57 17 0 Republican budget 322 67 0 255 238 1 17 Local governments and Vojvodina 0 0 0 0 0 0
Social security funds 65 65Road fund 0 0 0 0Transfers to other levels of government 387 321 1 0 0 65 52 2 10 0 Local governments and Vojvodina 67 66 1 0
Cities and municipalities 29Vojvodina 26Other transfers 11
Social security funds 320 255 0 0 0 65Road fund 0 0 0 0Net transfer to other levels of government 0 -321 -1 67 0 255 194 55 7 0
Fiscal balance -153 -150 9 -11 -2 0 0 0 0 0
Sources: Ministry of Finance; and IMF staff estimates.
Table 11c. Serbia: Intergovernmental Fiscal Operations, 2011

37
Gen. Gov.Republican
budgetOwn
budgetsLocal gov.
and V.Road
company
Social security funds
Pension Fund
Health Fund
Labor Fund
Netting operations
Total revenue 1419.2 743.4 51.1 219.4 30.1 440.9 274.4 146.4 20.0 -65.8 Current revenue 1417.2 743.4 50.1 218.5 30.1 440.9 274.4 146.4 20.0 -65.8 Tax revenue 1229.4 691.9 0.0 159.7 10.4 433.2 271.4 144.2 17.6 -65.8 Personal income tax 162.4 46.2 116.2 Social security contributions 367.4 0.0 433.2 271.4 144.2 17.6 -65.8 Corporate income tax 44.0 40.5 3.4 VAT 369.5 369.5 0.0 Excises 200.5 190.1 10.4 Taxes on international trade 36.1 36.1 Other taxes 49.6 9.6 0.0 40.0 0.0 Nontax revenue 187.9 51.5 50.1 58.8 19.7 7.7 3.1 2.3 2.4 Capital revenue 0.1 0.0 0.0 0.1 0.0 0.0 0.0 0.0 0.0 Grants 1.8 0.0 1.0 0.8 0.0 0.0 0.0
Total expenditure and net lending 1559.5 548.1 41.1 292.5 31.7 711.9 484.7 204.7 22.5 -65.8 Current expenditure 1415.8 505.9 32.3 221.6 11.9 709.8 483.8 203.9 22.1 -65.8 Expenditure on goods and services 618.4 282.5 28.3 155.1 9.9 208.3 7.3 197.3 3.7 -65.8
Wages and salaries 363.4 186.1 7.6 68.7 1.0 99.9 3.5 94.5 1.9 Employer contribution 0.0 34.6 1.0 12.1 0.2 18.0 0.6 17.1 0.3 -65.8 Goods and services 254.9 61.8 19.7 74.3 8.7 90.4 3.2 85.7 1.6
Interest payments 63.1 58.8 0.0 2.3 2.0 0.0 0.0 0.0 0.0Subsidies 82.9 43.6 4.0 35.2 0.0 0.0 0.0 0.0Pensions 482.8 25.8 0.0 0.0 0.0 457.0 457.0 0.0 0.0Other transfers to households 168.7 95.2 0.0 28.9 44.5 19.5 6.6 18.3
Capital expenditure 132.3 32.0 8.8 69.8 19.8 1.9 0.7 0.8 0.4Own resource 96.5 20.5 8.8 57.8 7.5 1.9 0.0 0.8 0.4Foreign financed 35.8 11.5 12.0 12.3
Net lending 11.5 10.2 0.0 1.1 0.0 0.2 0.2 0.0 0.0
Fiscal balance (before transfers) -140.3 195.4 10.0 -73.0 -1.6 -271.0 -210.3 -58.3 -2.4 0.0 Transfers from other levels of government 401.0 0.0 0.0 63.1 0.0 337.9 266.9 60.3 10.7 0.0 Republican budget 334.1 63.1 0.0 271.0 259.4 0.9 10.7 Local governments and Vojvodina 0.0 0.0 0.0 0.0 0.0 0.0
Social security funds 66.9 66.9 59.4Road fund 0.0 0.0 0.0 0.0Transfers to other levels of government 401.0 334.1 0.0 0.0 0.0 66.9 56.7 2.0 8.2 0.0 Republican budget 0.0 0.0 0.0 Local governments and Vojvodina 63.1 63.1 0.0 0.0
Cities and municipalities 31.3Vojvodina 27.3Other transfers 4.6
Social security funds 337.9 271.0 0.0 0.0 0.0 66.9 Pension Fund 266.9 259.4 7.5 2.0 5.5 Health Fund 60.3 0.9 59.4 56.7 0.0 2.7 Labor Fund 10.7 10.7 0.0
Road fund 0.0 0.0 0.0 0.0Net transfer to other levels of government 0.0 -334.1 0.0 63.1 0.0 271.0 210.3 58.3 2.4 0.0
Fiscal balance -140.3 -138.7 10.0 -9.9 -1.6 0.0 0.0 0.0 0.0 0.0
Sources: Ministry of Finance; and IMF staff estimates.
Table 11d. Serbia: Intergovernmental Fiscal Operations, 2012

38
2010 2011 2011 2012 2013 2014 2015
Budget Proj. Proj. Proj. Proj. Proj.
Revenue 1,145 1,224 1,325 1,316 1,419 1,545 1,699 1,850Taxes 1,000 1,057 1,153 1,139 1229 1,340 1,475 1,605
Personal income tax 133 139 148 151 162 178 197 215Social security contributions 319 324 345 343 367 405 456 499Taxes on profits 31 33 38 38 44 51 58 66Value-added taxes 297 319 356 341 369 399 433 469Excises 135 152 179 180 200 216 235 254Taxes on international trade 48 44 40 40 36 37 37 37Other taxes 37 46 48 46 50 54 59 64
Non-tax revenue 138 159 171 175 188 204 222 243Grants 7 7 2 2 2 2 2 2
Expense 1,154 1,226 1,319 1,328 1416 1,487 1,588 1,688
Wages and salaries 302 310 329 338 363 387 414 445Goods and services 211 227 253 246 255 278 308 337Interest 22 34 50 46.0 63 53 59 64Subsidies 63 78 84 85 83 90 94 91Transfers 556 577 603 612 651 679 712 751
Pensions 3/ 387 394 417 423 457 478 504 535Other transfers 4/ 168 183 186 189 194 201 208 216
Gross operating balance (cash basis) -9 -2 6 -12 3 58 112 162
Net acquisition of nonfinancial assets 92 104 119 115 132 156 178 203Capital revenue 1 1 0 0 0 0 0 0Capital expenditure 93 105 119 115 132 156 178 204
Unidentified measures 0 0 0 0 0
Net lending/borrowing (cash basis) -101 -107 -113 -127 -129 -98 -66 -42
Net acquisition of financial assets 21 9 29 33 12 12 14 15
Domestic 21 9 29 33 12 12 14 15Currency and deposits 60 -15 0 0 0 0 0 0Loans (net lending) 20 30 28 27 12 12 14 15Equity and investment fund shares (privatization) -59 -7 -3 2 0 0 0 0Equity investment 0 1 4 4 0 0 0 0
Foreign 0 0 0 0 0 0 0 0
Net incurrence of liabilities 122 116 141 155 140 110 80 57
Domestic 82 81 99 66 118 91 58 36Commerical banks 0 67 83 25 115 111 78 56Securities 109 58 68 85 40 20 20 20Amortization 27 44 52 43 37 39 40 40
Foreign 40 35 42 89 23 19 22 20Program 42 39 54 10 22 23 24 20Project 11 21 20 30 31 34 37 40Bonds and loans 0 0 0 80 0Amortization 13 25 32 32 31 38 39 40
Memorandum items:Official fiscal balance (cash basis) -123 -137 -140 -153 -140 -110 -80 -57Augmented fiscal balance 5/ -144 -139 -145 -158 -140 -110 -80 -57Nominal GDP (billions of dinars) 2,713 2,987 3,419 3,359 3615 3,919 4,279 4,673
Sources: Ministry of Finance; and IMF staff estimates and projections.
1/ The IMF is in the process of migrating toward the presentation of the fiscal accounts in line with the 2001 GFS manual. 2/ Includes the republican budget, local governments, social security funds, and the Road Company.3/ Excluding military pension payments from the Republican budget.4/ Excluding foreign currency deposit payments to households, reclassified below the line.5/ Including clearance of arrears of the Road Company as well as of farmer pension arrears.
Table 11e. Serbia: General Government Operations According to GFSM 2001, 2009–2015 1/ 2/
2009
(Billions of RSD)

39
2006 2007 2008 2009 2010 2011Jun
Capital Adequacy
Regulatory capital to risk-weighted assets 24.7 27.9 21.9 21.3 19.9 19.7
Capital to assets 18.5 21.0 23.6 21.0 19.7 21.0
Asset Quality
Gross non performing loans to total loans ... ... 11.3 15.5 16.9 18.6
Specific provisions to gross non-performing loans ... ... 56.9 49.5 47.2 44.4
Total provisions to gross non-performing loans 1/ ... ... 187.8 168.1 149.4 141.3
Non performing loans net of provisions to tier I capital ... ... 14.8 25.5 31.7 37.1
Specific provisions to gross loans 11.0 8.4 7.1 9.2 9.1 9.2
Profitability
Return on assets (ROA) 1.7 1.7 2.1 1.3 1.1 1.4
Return on equity (ROE) 9.7 8.5 9.3 5.7 5.4 7.0
Net interest margin to gross operating income 2/ … … … 62.6 64.3 67.4
Non-interest expenses to gross operating income 3/ … … … 84.5 84.8 79.8
Non-interest expenses to average assets … … … 6.9 6.1 5.6
Personnel expenses to non-interest expenses … … … 28.7 28.9 29.2
Liquidity and Foreign Exchange Risk
Core liquid assets to total assets 4/ 40.7 37.3 30.3 31.9 21.1 21.2
Core liquid assets to short-term liabilities 69.0 58.9 48.0 49.0 33.9 34.6
Liquid assets to total assets 5/ 22.9 46.7 43.3 40.7 35.1 36.5Liquid assets to short term liabilities 38.8 73.7 68.6 62.6 56.4 59.4
FX-denominated loans and FX-indexed loans to total loans ... ... 78.0 84.1 79.4 73.8FX- deposits to total deposits 65.9 64.2 69.0 75.5 79.1 76.9FX- liabilities to total liabilities 72.4 67.8 72.1 75.9 78.9 77.5
Deposits to assets 57.0 61.4 57.7 60.0 59.4 57.2Loans to deposits 86.7 89.3 104.3 92.5 108.5 111.8FX- loans to FX-deposits (including indexed) … … 113.3 103.1 109.0 107.3
Sensitivity to Market RiskNet open FX position (overall) as percent of tier I capital 21.7 14.5 7.4 3.2 3.4 2.5Off-balance sheet operations as percent of assets 6/ 41.0 49.2 56.2 45.9 33.9 32.6
Source: National Bank of Serbia.1/ Ratio of total provisions for potential losses for on and off-balance sheet exposures to gross NPLs.
4/ Cash, repos, t-bills, and mandatory reserves.
6/ Includes only risk-classified off-balance sheet items.
2/ Gross operating income in this ratio excludes FX gains due to their volatility and distortionary impact.3/ Non-interest expenses in the calculation of this ratio abstracts from FX losses.
5/ Sum of first- and second-degree liquid receivables of the bank.
Table 12. Serbia: Banking Sector Financial Soundness Indicators, 2006-11

40
2008 2009 2010 2011 2012Proj. Proj.
Net foreign assets 2/ 484 571 507 468 394in billions of euro 5.5 5.9 4.8 4.5 3.8Foreign assets 847 1,185 1,287 1,311 1,267
NBS 725 1,023 1,063 1,067 1,006Commercial banks 123 163 224 244 261
Foreign liabilities (-) -364 -615 -780 -843 -873NBS -14 -115 -170 -180 -163Commercial banks -350 -500 -610 -663 -710
Net domestic assets 484 608 835 960 1,193Domestic credit 1,048 1,276 1,708 1,958 2,355
Government, net -53 -4 67 134 269NBS -50 -101 -105 -105 -105Banks -4 97 172 239 374
Local governments, net -16 -14 -1 4 5Non-government sector 1,117 1,295 1,643 1,820 2,081
Households 382 419 528 627 751Enterprises 711 851 1,078 1,153 1,287Other 23 25 36 40 44
Other assets 56 111 29 33 37Capital and reserves (-) -505 -633 -726 -835 -976
NBS -63 -166 -202 -284 -366Banks -442 -467 -524 -552 -610
Provisions (-) -115 -146 -176 -195 -223
Broad money (M2) 968 1,179 1,343 1,428 1,587Dinar-denominated M2 371 412 392 416 462
M1 230 250 244 250 284Currency in circulation 90 96 92 88 95Demand deposits 140 154 152 162 189
Time and saving deposits 141 162 148 166 178Foreign currency deposits 597 767 951 1,012 1,125
in billions of euro 6.7 7.3 9.2 9.6 10.8
Memorandum items:Twelve-month growth:
M1 -3.8 8.7 -2.2 9.3 13.6M2 9.6 21.8 13.9 20.7 11.1Credit to non-gov. (actual exchange rates) 48.7 9.4 13.7 5.2 10.6
Domestic 35.0 15.9 29.0 10.8 14.3Households 25.0 9.5 26.1 18.7 19.7Enterprises 40.0 19.6 26.7 6.9 11.6
External 67.2 2.2 -2.7 -3.7 3.6Credit to non-gov. (constant exchange rates) 3/ 35.9 2.5 7.1 8.4 9.5
Domestic 13.8 13.0 8.8 7.3 13.1Households … … … … …Enterprises … … … … …
External 49.6 -5.5 -11.5 -1.9 2.1Velocity (M1) 11.6 10.9 12.2 12.1 10.7Velocity (M2) 2.8 2.3 2.2 2.1 1.9
Sources: National Bank of Serbia; and IMF staff estimates and projections.1/ Foreign exchange denominated items are converted at contemporaneous exchange rates.2/ Excluding undivided assets and liabilities of the FSRY and liabilities to banks in liquidation.
3/ Using the August 2008 dinar/euro rate as the base for converting FX and FX-indexed loans to dinars for the period 2008-12. Assumes all FX loans are in euros.
Tabie 13. Serbia: Monetary Survey, 2008–12(Billions of dinars, unless otherwise indicated; end of period) 1/

41
2008 2009 2010 2011 2012Proj. Proj.
Net foreign assets 2/ 517 628 543 580 502in billions of euro 5.8 6.6 5.1 5.6 4.8Gross foreign reserves 725 1,023 1,063 1,067 1,006Gross reserve liabilities (-) -208 -394 -520 -487 -504
Net domestic assets -208 -382 -364 -404 -306Net domestic credit -145 -216 -162 -120 60
Government -50 -101 -105 -105 -105Claims 11 11 1 1 1
RSD 11 11 1 1 1foreign currency 0 0 0 0 0
Liabilities (-) -60 -112 -107 -107 -107RSD -20 -63 -54 -54 -54foreign currency -41 -49 -53 -53 -53
Other public sector -15 -12 -15 -14 -14Banks -88 -151 -46 -85 -35
Claims 2 1 1 5 5Liabilities (-) -90 -152 -47 -90 -40
Other sectors 7 48 5 83 215Capital accounts (-) -63 -166 -202 -284 -366
Reserve money 309 247 179 177 196Currency in circulation 90 96 92 88 95Commercial bank reserves 219 151 87 88 101
Required reserves 165 112 65 72 84Excess reserves 5 7 11 4 4Vault cash and giro accounts 48 32 11 12 13
Sources: National Bank of Serbia; and IMF staff estimates and projections.1/ Foreign exchange denominated items are converted at contemporaneous exchange rates.2/ Excluding undivided assets and liabilities of the FSRY and liabilities to banks in liquidation.
Table 14. Serbia: Balance Sheet of the NBS, 2008–12(Billions of dinars, unless otherwise indicated; end of period) 1/

42
Table 15. Serbia: Balance Sheet of Commercial Banks, 2008-11 1/(Billions of dinars, unless otherwise indicated)
2008 2009 2010 2011June Billions of Percent
euros of GDP
Assets 1,925 2,342 2,747 2,696 26.3 80.3Foreign exchange 123 163 224 149 1.5 4.4Claims on NBS 508 583 484 467 4.6 13.9
Dinar cash and reserves 219 151 87 92 0.9 2.7Foreign exchange reserves 194 279 349 300 2.9 8.9NBS bills and other claims 95 153 48 74 0.7 2.2
Claims on government 9 108 193 193 1.9 5.7Claims on other sectors 1,118 1,299 1,652 1,693 16.5 50.4
Households 382 418 528 583 5.7 17.4Enterprises 710 849 1,076 1,055 10.3 31.4Other institutions 27 31 49 54 0.5 1.6
Fixed assets 88 99 107 109 1.1 3.2Other assets 78 90 87 86 0.8 2.6
Liabilities 1,925 2,342 2,747 2,696 26.3 80.3Foreign liabilities 350 500 610 527 5.1 15.7Dinar deposits 301 338 314 315 3.1 9.4
Demand deposits 140 155 153 147 1.4 4.4Time and saving deposits 154 178 157 165 1.6 4.9Government deposits 7 5 4 4 0.0 0.1
Foreign currency deposits 599 770 962 952 9.3 28.3Enterprises 140 145 159 154 1.5 4.6Households 414 565 731 743 7.2 22.1Government 6 7 17 16 0.2 0.5Other institutions 40 53 55 40 0.4 1.2
Other deposits 1 2 51 53 0.5 1.6Liabilities to NBS 6 1 1 1 0.0 0.0Other liabilities 122 128 120 128 1.2 3.8Provisions 103 135 166 174 1.7 5.2Capital and reserves 442 467 524 547 5.3 16.3
Memorandum items:Off-balance sheet items 2/ 2,157 2,305 2,656 2,889 28.2 86.0
Source: National Bank of Serbia.1/ Numbers are on a gross basis; credit numbers include provisions.
2/ As of June 2011, about 12 percent of off-balance sheet items represented various guarantees, mostly on cross-border loans. Other off-balance sheet items include collateral against loans and repo contracts, undrawn credit lines, and derivative contracts. Figures in euros and in percent of GDP correspond to the latest available observation.

43
2008 2010 2008 2010 2008 2010
EBRD transition indicators 66 68 92 92 -27 -25Large scale privatization 62 62 92 92 -31 -31Small scale privatization 85 85 100 100 -15 -15Enterprise restructuring 54 54 85 85 -31 -31Price liberalization 92 92 100 100 -8 -8Trade and foreign exchange system 85 92 100 100 -15 -8Competition policy 46 54 85 85 -39 -31Banking reform 69 69 92 92 -23 -23Non-bank financial institutions 46 46 92 92 -46 -46Overall infrastructure reform 54 54 85 85 -31 -31
Transparency International Corruption Perception Index 34 35 Slovenia 67 Estonia 65 -33 -30
World Bank Doing Business survey 4/ 48 51 Estonia 88 Estonia 91 -40 -39Starting a business 41 55 FYR Macedonia 93 FYR Macedonia 97 -52 -43Dealing with licenses 6 4 Estonia 90 Estonia 87 -84 -83Registering property 46 45 Lithuania 98 Lithuania 96 -51 -51Getting credit 85 92 Bulgaria 97 Albania 97 -13 -5Protecting investors 61 60 Albania 92 Albania 92 -31 -32Paying taxes 30 25 FYR Macedonia 85 Estonia 84 -55 -59Trading across borders 66 60 Estonia 97 Estonia 98 -31 -38Enforcing contracts 47 49 Latvia 98 Latvia 92 -51 -44Closing a business 45 53 Lithuania 81 Slovak Republic 82 -36 -29
Sources: EBRD; Transparency International; World Bank; World Economic Forum; and IMF staff calculations.1/ For comparability, all indices normalized so that they range from 0 (lowest) to 100 (best). 2/ Country name and index of best performers among: Albania, Bosnia-Herzegovina, Bulgaria, Croatia, Estonia, Hungary,
Latvia, Lithuania, FYR Macedonia, Montenegro, Poland, Romania, Serbia, Slovak Republic, and Slovenia.Country names are not shown for EBRD transition indicators due to the presence of multiple entries.
3/ Distance of Serbia from best performer for each index.4/ As pointed out in an independent evaluation of the Doing Business survey (see www.worldbank.org/ieg/doingbusiness),care should be exercised when interpreting these indicators given subjective interpretation, limited coverage of businessconstraints, and a small number of informants which tend to overstate the indicators' coverage and explanatory power.
Table 16. Serbia: Rankings of Selected Competitiveness and Structural Indicators 1/
Serbia Best performers 2/ Distance 3/

44
Cumulative
In millions of SDR
In millions of euros 2/
In percent of quota 1/
In percent of quota 1/
1 9/29/2011 187.080 209.8 40 40 Board approval of arrangement.
2 11/15/2011 163.695 184.1 35 75 Observance of continuous and end-September 2011 performance criteria, and completion of the review.
3 2/15/2012 116.925 131.8 25 100 Observance of continuous and end-December 2011 performance criteria, and completion of the review.
4 5/15/2012 116.925 132.0 25 125 Observance of continuous and end-March 2012 performance criteria, and completion of the review.
5 8/15/2012 116.925 132.1 25 150 Observance of continuous and end-June 2012 performance criteria, and completion of the review.
6 11/15/12 116.925 132.3 25 175 Observance of continuous and end-September 2012 performance criteria, and completion of the review.
7 2/15/2013 116.925 132.5 25 200 Observance of continuous and end-December 2012 performance criteria, and completion of the review.
Total 935.400 1,054.7 200 200
Source, FIN, WEO.1/ The quota is SDR 467.7 million.2/ At projected WEO exchange rates.
Table 17. Serbia: Proposed Schedule of Purchases under the Stand-By Arrangement, 2011-13
Available on or after
Amount of Purchase
Conditions

45
Sept. Dec.
Prog. Prog.
Quantitative Performance Criteria
Floor on net international reserves of the NBS (in billions of euro) 4.7 4.5
Ceiling on consolidated general government overall deficit (in billions of dinars) 2/ 110 153
Ceiling on contracting or guaranteeing by the public sector of new short-term external debt (up to and including one year, in millions of euro) 2/
0 0
Ceiling on contracting or guaranteeing by the public sector of new nonconcessional external debt (over one year, in millions of euro) 2/ 3/
993 1950
Ceiling on accumulation of public sector external payment arrears (continuous, in millions of euro)
0.0 0.0
Inflation Consultation Bands (in percent)
Central point 9.5 7.9
Band, upper limit 11.5 9.9
Band, lower limit 7.5 5.9
Indicative Targets
Ceiling on current expenditure of the Serbian Republican budget (in billions of dinars) 2/ 614 827
Ceiling on gross accumulation of payment arrears of the Serbian Republican budget (in billion of dinars)
0.0 0.0
Ceiling on gross accumulation of domestic guarantees by the Republican budget and the Development Fund and domestic borrowing by the Development Fund (in billions of dinars) 2/
30 30
1/ As defined in the Letter of Intent, the Memorandum on Economic and Financial Policies,
and the Technical Memorandum of Understanding.
2/ Cumulative from January 1.
3/ Excluding loans from the IMF, EBRD, EIB, EU, IBRD, KfW, Eurofima, CEB, IFC,
and bilateral government creditors, as well as debt contracted in the context of restructuring agreements.
Table 18. Serbia: Quantitative Conditionality Under the SBA, 2011 1/
2011

46
Table 19. Serbia: Structural Conditionality under the SBA, 2011–2012 1
Measure Target Date
Prior actions
1. Submit to parliament a 2011 supplementary budget and adopt supporting measures consistent with the program (MEFP ¶7)
September 22, 2011
2. Submit to parliament a restitution law that includes a fiscally responsible cap on financial restitution payments(MEFP ¶14)
September 22, 2011
Structural benchmarks
1. Labor Ministry to submit to Economic and Social Council amendments to labor legislation that bases severance pay on duration of employment at last employer and extends duration of fixed contracts (MEFP ¶26)
End-October 2011
2. Adopt a taxpayer segment focused risk treatment plan for 2012 (MEFP ¶19)
End-December 2011
3. Tighten Pay-As-You-Go rules in the Budget System Law (MEFP ¶16) End-December 2011
4. Strengthen capital budgeting framework (MEFP ¶17) End-December 2011
5. Introduce stricter financial control on largest SOEs, including wage bill targets (MEFP ¶25)
End-December 2011
6. Begin reporting on a monthly basis payment arrears for all consolidated general government entities (MEFP ¶12)
End-December 2011
7. Complete incorporation of all large SOEs (MEFP ¶25).
End-December 2012
1 Additional structural benchmarks may be agreed in the context of future reviews.

47
Appendix I. Republic of Serbia: External Debt Sustainability
1. Serbia’s external debt-to-GDP ratio is expected to have peaked, but remains relatively high. From 2008 to 2010, external debt as share of GDP rose from 67 percent of GDP to 82 percent, as the stock of debt accumulated during the boom years prior to the crisis, to a large extent by the private non-bank sector, was hit by a large correction of the overvalued exchange rate and the slowdown in economic activity. With the economy gradually starting to recover, high inflation combined with a relatively stable exchange rate, and a modest increase in nominal terms, external debt is projected to fall to around 75 percent of GDP by end-2011 (Table A1).
2. Over the medium term, external debt is projected to decline to 60 percent in 2016. This relies on the expectation of a gradual recovery of GDP growth and reduction of the current account deficit (in turn predicated on the economic rebound led by the export sector), a significant share of the external financing needs covered by FDI flows, and continued deleveraging of the private sector.
3. The main risks to this scenario stem from the impact of currency depreciation given the high share debt denominated in foreign currency. If a real depreciation of 30 percent were to occur in 2011, the external-debt-to-GDP ratio would rise to about 110 percent in 2012. The other standard shocks would have much more modest effects, with the debt-to-GDP ratio increasing by up to 3 percentage points (for the current account shock) in 2012 before gradually returning to a declining path. Such relatively favorable dynamics for all but the exchange rate shocks crucially depend on the assumptions of positive GDP growth and a narrowing current account deficit towards the end of the projection period.
Dec-07 Dec-08 Dec-09 Dec-10 Jun-11
Public 34 29 28 31 40
Private 66 71 72 69 60 Banks 22 18 22 23 32 Other private 43 53 50 46 28
Total 100 100 100 100 100
Source: NBS and staff estimates.
Serbia: Structure of External Debt, 2007-11

48
Projections2006 2007 2008 2009 2010 2011 2012 2013 2014 2015 2016 Debt-stabilizing
non-interest current account 6/
Baseline: External debt 63.9 62.5 66.7 79.1 82.2 75.3 70.1 69.6 67.7 65.8 62.9 -7.6
Change in external debt -0.4 -1.4 4.2 12.4 3.1 -7.0 -5.2 -0.5 -1.9 -1.9 -2.9Identified external debt-creating flows (4+8+9) -3.0 -4.3 8.1 11.5 3.9 1.3 1.1 1.2 -0.3 -1.2 -2.0
Current account deficit, excluding interest payments 8.1 13.7 18.8 3.6 3.3 3.9 4.3 5.5 4.6 3.7 3.0Deficit in balance of goods and services 21.6 24.2 26.6 17.7 16.5 15.4 15.0 13.9 12.8 11.5 10.4
Exports 29.9 30.5 31.1 29.4 34.9 36.0 38.8 38.0 39.1 40.6 41.7Imports 51.4 54.7 57.6 47.0 51.4 51.4 53.8 51.9 51.9 52.1 52.2
Net non-debt creating capital inflows (negative) -4.9 -8.8 -5.3 -4.6 -3.2 -4.9 -5.5 -4.4 -4.6 -4.6 -4.5Net foreign direct investment, equity 3.4 6.4 5.5 4.7 3.0 5.2 5.5 4.4 4.5 4.5 4.5Net portfolio investment,equity 1.5 2.4 -0.3 -0.2 0.2 0.3 0.3 0.3 0.5 0.5 0.5
Automatic debt dynamics 1/ -6.2 -9.1 -5.4 12.4 3.7 2.3 2.3 0.1 -0.3 -0.4 -0.5Contribution from nominal interest rate 2.1 2.4 2.6 3.5 3.8 3.7 4.5 3.0 2.8 2.7 2.5Contribution from real GDP growth -2.0 -2.8 -2.1 2.6 -0.8 -1.5 -2.2 -2.9 -3.2 -3.1 -3.0Contribution from price and exchange rate changes 2/ -6.3 -8.8 -6.0 6.2 0.6 ... ... ... ... ... ...
Residual, incl. change in gross foreign assets (2-3) 3/ 2.6 2.9 -3.9 0.9 -0.8 -8.2 -6.3 -1.7 -1.6 -0.7 -0.8
External debt-to-exports ratio (in percent) 213.8 204.8 214.7 269.1 235.6 209.3 180.4 183.1 173.0 162.1 150.8
Gross external financing need (in billions of US dollars) 4/ 4.3 7.5 10.6 6.7 6.4 6.4 7.8 9.3 9.9 10.1 10.9in percent of GDP 18.5 26.2 32.5 23.3 22.2 22.2 23.7 26.7 26.3 24.6 24.1
Scenario with key variables at their historical averages 5/ 75.3 73.0 75.7 79.1 83.3 87.2 -7.4
Key Macroeconomic Assumptions Underlying Baseline
Real GDP growth (in percent) 3.6 5.4 3.8 -3.5 1.0 1.0 2.0 3.0 4.5 5.0 5.0GDP deflator in euros (change in percent) 10.8 15.9 10.5 -8.6 -0.8 -0.8 11.4 2.7 3.3 4.4 4.4Nominal external interest rate (in percent) 3.7 4.7 4.9 4.6 4.9 4.9 5.1 6.3 4.7 4.5 4.3Growth of exports (euro terms, in percent) 31.0 24.8 16.9 -16.5 18.8 18.8 17.1 14.3 5.7 12.9 13.7Growth of imports (euro terms, in percent) 25.2 30.0 20.8 -28.0 9.4 9.4 13.6 11.0 4.0 9.7 10.1Current account balance, excluding interest payments -8.1 -13.7 -18.8 -3.6 -3.3 -3.9 -4.3 -5.5 -4.6 -3.7 -3.0Net non-debt creating capital inflows 4.9 8.8 5.3 4.6 3.2 4.9 5.5 4.4 4.6 4.6 4.5
1/ Derived as [r - g - (1+g) + (1+r)]/(1+g++g) times previous period debt stock, with r = nominal effective interest rate on external debt; = change in domestic GDP deflator in euro terms, g = real GDP growth rate,
= nominal appreciation (increase in dollar value of domestic currency), and = share of domestic-currency denominated debt in total external debt.
2/ The contribution from price and exchange rate changes is defined as [-(1+g(1+r1+g++g) times previous period debt stock. increases with an appreciating domestic currency (> 0) and rising inflation (based on GDP deflator).
3/ For projection, line includes the impact of price and exchange rate changes.
4/ Defined as current account deficit, plus amortization on medium- and long-term debt, plus short-term debt at end of previous period.
5/ The key variables include real GDP growth; nominal interest rate; dollar deflator growth; and both non-interest current account and non-debt inflows in percent of GDP.
6/ Long-run, constant balance that stabilizes the debt ratio assuming that key variables (real GDP growth, nominal interest rate, dollar deflator growth, and non-debt inflows in percent of GDP) remain at their levels
of the last projection year.
Actual
Table A1. Country: External Debt Sustainability Framework, 2006-2016(In percent of GDP, unless otherwise indicated)

49
Baseline
0
10
20
30
40
50
60
70
80
90
100
2006 2008 2010 2012 2014 2016
Interest rate shock (in percent)
Figure A1. Serbia: External Debt Sustainability: Bound Tests 1/(External debt in percent of GDP)
Sources: International Monetary Fund, Country desk data, and staff estimates.1/ Shaded areas represent actual data. Individual shocks are permanent one-half standard deviation shocks. Figures in the boxes represent average projections for the respective variables in the baseline and scenario being presented. Ten-year historical average for the variable is also shown. 2/ Permanent 1/4 standard deviation shocks applied to real interest rate, growth rate, and current account balance.3/ One-time real depreciation of 30 percent occurs in 2011.
HistoricalBaseline
0
5
10
15
20
25
30
35
40
0
10
20
30
40
50
60
70
80
90
100
2006 2008 2010 2012 2014 2016
Baseline and historical scenarios
Baseline
0
10
20
30
40
50
60
70
80
90
100
2006 2008 2010 2012 2014 2016
Baseline
0
10
20
30
40
50
60
70
80
90
100
2006 2008 2010 2012 2014 2016
Combined shock 2/
Baseline
0
10
20
30
40
50
60
70
80
90
100
110
120
2006 2008 2010 2012 2014 2016
Real depreciation shock 3/
Gross financing need under baseline(RHS)
Non-interest current account shock (in percent of GDP)
Baseline
0
10
20
30
40
50
60
70
80
90
100
2006 2008 2010 2012 2014 2016
Growth shock (in percent per year)
Baseline:
Scenario:
Historical:
4.8
5.1
4.3
Baseline:
Scenario:
Historical:
4.5
2.8
2.6
Baseline:
Scenario:
Historical:
-4.2
-7.2
-9.1

50
Appendix II. Republic of Serbia: Public Debt Sustainability
1. General government debt in Serbia remains sustainable. The average maturity of the debt has declined in the past two years due to greater reliance on domestic-currency T-bills, which currently stand at 7 percent of GDP. Notwithstanding, rollover risks remain contained as the short term share of this debt is only 1.5 percent of GDP. At the same time, the large FX share of public debt implies significant vulnerability to a depreciation of the currency. Additional fiscal risks derive from contingent liabilities associated to off-balance sheet transactions, from quasi-fiscal losses of state- and socially owned enterprises, from government support to the private sector, and restitution debt.
2. Under the baseline scenario, gross general government debt would remain broadly flat during the program period and decline over the medium term. Debt increased by 7 percentage points to about 45 percent of GDP in 2010 driven by the primary deficit and dinar depreciation. Between 2011 and 2013 debt is projected to remain flat and then start gradually declining. It is projected to reach 35 percent of GDP in 2016 (Table A2).
3. In an unchanged policies scenario, the public debt-to-GDP ratio would increase to 53 percent of GDP in 2016. This scenario assumes no further fiscal adjustment beyond 2011. By contrast, under the assumption that key variables remain at their historical averages, the public debt-to GDP ratio would decline to 28 percent, as this scenario picks up high growth rates prior to the global crisis coupled with low real interest rates.
4. Standardized bound tests show that Serbia’s debt is particularly sensitive to exchange rate and growth shocks (Figure A1). Given that 90 percent of the debt is denominated in foreign currency (comprising mainly frozen currency deposit bonds and debt to multilaterals and Paris Club creditors); a 30 percent real depreciation of the dinar would put the debt-to-GDP ratio at 47 percent in 2016. A half standard deviation shock to real GDP growth would have a roughly similar impact.
5. Restitution for confiscated assets during and after World War II will add to the stock of debt but the compensation is expected to be capped. The draft law proposes to cap financial compensation at 6 percent of GDP, not risking sustainability. If compensation is granted in FX bonds, sensitivity of public debt to exchange rate fluctuations will rise.
6. Further risks to the debt outlook come from large contingent liabilities, in particular related to public enterprises. Some state-owned and socially-owned enterprises are running large deficits, mainly because of overly high wages and pricing below cost. With most public enterprise debt included in the general government debt stock (due to government guarantees), and with enterprises receiving explicit or implicit subsidies through lower taxes and utility tariffs, their past and regular losses are implicitly covered. However, there are risks from delays in utility price adjustments, large investment plans and needs, and provision of new loan guarantees to nonviable enterprises.
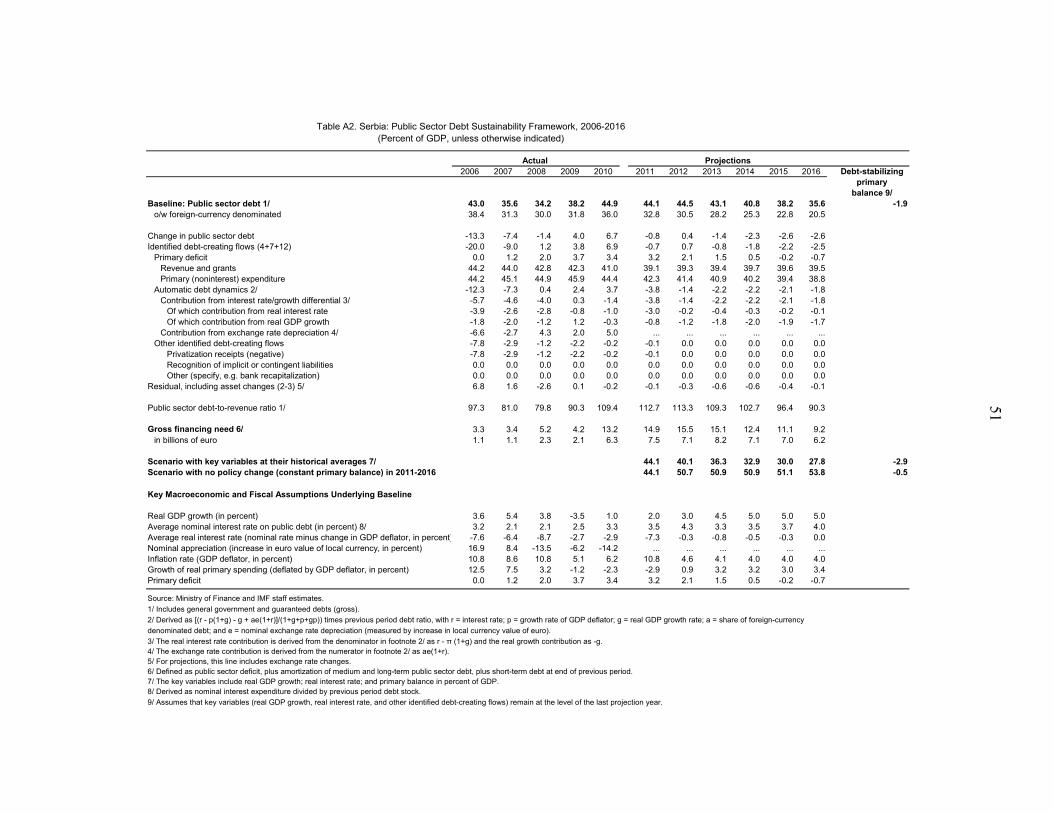
51
Projections2006 2007 2008 2009 2010 2011 2012 2013 2014 2015 2016 Debt-stabilizing
primarybalance 9/
Baseline: Public sector debt 1/ 43.0 35.6 34.2 38.2 44.9 44.1 44.5 43.1 40.8 38.2 35.6 -1.9o/w foreign-currency denominated 38.4 31.3 30.0 31.8 36.0 32.8 30.5 28.2 25.3 22.8 20.5
Change in public sector debt -13.3 -7.4 -1.4 4.0 6.7 -0.8 0.4 -1.4 -2.3 -2.6 -2.6Identified debt-creating flows (4+7+12) -20.0 -9.0 1.2 3.8 6.9 -0.7 0.7 -0.8 -1.8 -2.2 -2.5
Primary deficit 0.0 1.2 2.0 3.7 3.4 3.2 2.1 1.5 0.5 -0.2 -0.7Revenue and grants 44.2 44.0 42.8 42.3 41.0 39.1 39.3 39.4 39.7 39.6 39.5Primary (noninterest) expenditure 44.2 45.1 44.9 45.9 44.4 42.3 41.4 40.9 40.2 39.4 38.8
Automatic debt dynamics 2/ -12.3 -7.3 0.4 2.4 3.7 -3.8 -1.4 -2.2 -2.2 -2.1 -1.8Contribution from interest rate/growth differential 3/ -5.7 -4.6 -4.0 0.3 -1.4 -3.8 -1.4 -2.2 -2.2 -2.1 -1.8
Of which contribution from real interest rate -3.9 -2.6 -2.8 -0.8 -1.0 -3.0 -0.2 -0.4 -0.3 -0.2 -0.1Of which contribution from real GDP growth -1.8 -2.0 -1.2 1.2 -0.3 -0.8 -1.2 -1.8 -2.0 -1.9 -1.7
Contribution from exchange rate depreciation 4/ -6.6 -2.7 4.3 2.0 5.0 ... ... ... ... ... ...Other identified debt-creating flows -7.8 -2.9 -1.2 -2.2 -0.2 -0.1 0.0 0.0 0.0 0.0 0.0
Privatization receipts (negative) -7.8 -2.9 -1.2 -2.2 -0.2 -0.1 0.0 0.0 0.0 0.0 0.0Recognition of implicit or contingent liabilities 0.0 0.0 0.0 0.0 0.0 0.0 0.0 0.0 0.0 0.0 0.0Other (specify, e.g. bank recapitalization) 0.0 0.0 0.0 0.0 0.0 0.0 0.0 0.0 0.0 0.0 0.0
Residual, including asset changes (2-3) 5/ 6.8 1.6 -2.6 0.1 -0.2 -0.1 -0.3 -0.6 -0.6 -0.4 -0.1
Public sector debt-to-revenue ratio 1/ 97.3 81.0 79.8 90.3 109.4 112.7 113.3 109.3 102.7 96.4 90.3
Gross financing need 6/ 3.3 3.4 5.2 4.2 13.2 14.9 15.5 15.1 12.4 11.1 9.2in billions of euro 1.1 1.1 2.3 2.1 6.3 7.5 7.1 8.2 7.1 7.0 6.2
Scenario with key variables at their historical averages 7/ 44.1 40.1 36.3 32.9 30.0 27.8 -2.9Scenario with no policy change (constant primary balance) in 2011-2016 44.1 50.7 50.9 50.9 51.1 53.8 -0.5
Key Macroeconomic and Fiscal Assumptions Underlying Baseline
Real GDP growth (in percent) 3.6 5.4 3.8 -3.5 1.0 2.0 3.0 4.5 5.0 5.0 5.0Average nominal interest rate on public debt (in percent) 8/ 3.2 2.1 2.1 2.5 3.3 3.5 4.3 3.3 3.5 3.7 4.0Average real interest rate (nominal rate minus change in GDP deflator, in percent) -7.6 -6.4 -8.7 -2.7 -2.9 -7.3 -0.3 -0.8 -0.5 -0.3 0.0Nominal appreciation (increase in euro value of local currency, in percent) 16.9 8.4 -13.5 -6.2 -14.2 ... ... ... ... ... ...Inflation rate (GDP deflator, in percent) 10.8 8.6 10.8 5.1 6.2 10.8 4.6 4.1 4.0 4.0 4.0Growth of real primary spending (deflated by GDP deflator, in percent) 12.5 7.5 3.2 -1.2 -2.3 -2.9 0.9 3.2 3.2 3.0 3.4Primary deficit 0.0 1.2 2.0 3.7 3.4 3.2 2.1 1.5 0.5 -0.2 -0.7
Source: Ministry of Finance and IMF staff estimates.
1/ Includes general government and guaranteed debts (gross).
2/ Derived as [(r - p(1+g) - g + ae(1+r)]/(1+g+p+gp)) times previous period debt ratio, with r = interest rate; p = growth rate of GDP deflator; g = real GDP growth rate; a = share of foreign-currency
denominated debt; and e = nominal exchange rate depreciation (measured by increase in local currency value of euro).
3/ The real interest rate contribution is derived from the denominator in footnote 2/ as r - π (1+g) and the real growth contribution as -g.4/ The exchange rate contribution is derived from the numerator in footnote 2/ as ae(1+r). 5/ For projections, this line includes exchange rate changes.6/ Defined as public sector deficit, plus amortization of medium and long-term public sector debt, plus short-term debt at end of previous period. 7/ The key variables include real GDP growth; real interest rate; and primary balance in percent of GDP.8/ Derived as nominal interest expenditure divided by previous period debt stock.
9/ Assumes that key variables (real GDP growth, real interest rate, and other identified debt-creating flows) remain at the level of the last projection year.
Actual
Table A2. Serbia: Public Sector Debt Sustainability Framework, 2006-2016(Percent of GDP, unless otherwise indicated)
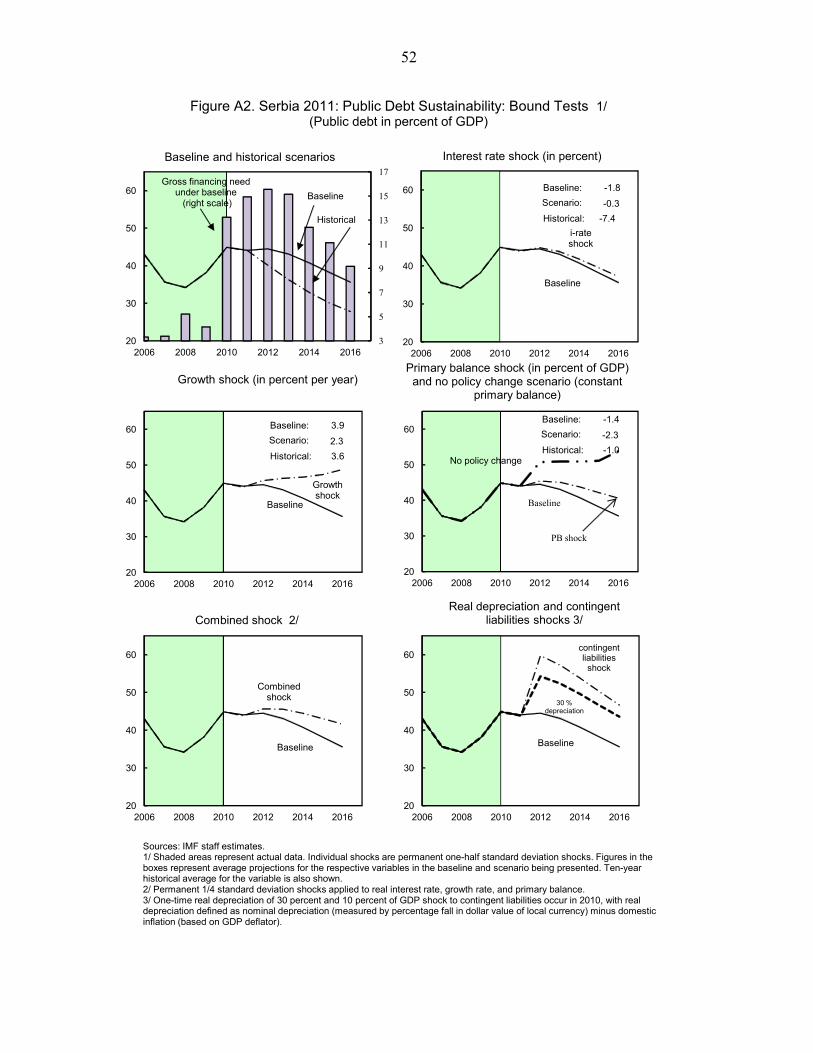
52
Growth shock
Baseline
20
30
40
50
60
2006 2008 2010 2012 2014 2016
Growth shock (in percent per year)
PB shock
Baseline
20
30
40
50
60
2006 2008 2010 2012 2014 2016
i-rate shock
Baseline
20
30
40
50
60
2006 2008 2010 2012 2014 2016
Interest rate shock (in percent)
Figure A2. Serbia 2011: Public Debt Sustainability: Bound Tests 1/ (Public debt in percent of GDP)
Sources: IMF staff estimates.1/ Shaded areas represent actual data. Individual shocks are permanent one-half standard deviation shocks. Figures in the boxes represent average projections for the respective variables in the baseline and scenario being presented. Ten-year historical average for the variable is also shown.2/ Permanent 1/4 standard deviation shocks applied to real interest rate, growth rate, and primary balance.3/ One-time real depreciation of 30 percent and 10 percent of GDP shock to contingent liabilities occur in 2010, with real depreciation defined as nominal depreciation (measured by percentage fall in dollar value of local currency) minus domestic inflation (based on GDP deflator).
Historical
Baseline
3
5
7
9
11
13
15
17
20
30
40
50
60
2006 2008 2010 2012 2014 2016
Baseline and historical scenarios
Combined shock
Baseline
20
30
40
50
60
2006 2008 2010 2012 2014 2016
Combined shock 2/
30 % depreciation
Baseline
contingent liabilities
shock
20
30
40
50
60
2006 2008 2010 2012 2014 2016
Real depreciation and contingent liabilities shocks 3/
Gross financing need under baseline
(right scale)
Primary balance shock (in percent of GDP) and no policy change scenario (constant
primary balance)
No policy change
Baseline: -1.4
Scenario: -2.3
Historical: -1.0
Baseline: 3.9
Scenario: 2.3
Historical: 3.6
Baseline: -1.8
Scenario: -0.3
Historical: -7.4

53
REPUBLIC OF SERBIA: LETTER OF INTENT
Ms. Christine Lagarde Belgrade, September 16, 2011 Managing Director International Monetary Fund Washington, D.C., 20431 U.S.A. Dear Ms. Lagarde, The Stand-By Arrangement (SBA) that expired in April 2011 helped us to contain the adverse trade and financial spillover effects from the global financial crisis to Serbia. It also helped to catalyze fiscal and structural policies that should—over the medium term—bring our transition growth model in line with best-performing peers in Eastern Europe. But the global financial crisis seems by no means to have run its full course, and downside risks to our exports and external funding sources, particularly with regards to EU countries, remain elevated. At the same time, compared with the fall of 2008, our own economy will be able to face any new adverse shocks from a much more balanced external position. Nevertheless, to insure against downside risks and to better anchor our policy framework, we request that the Fund support our new program through a new SBA for a period of 18 months in the amount of SDR 935.4 million (200 percent of quota). The attached Memorandum of Economic and Financial Policies (MEFP) outlines the economic policies that the Government of the Republic of Serbia and the National Bank of Serbia (NBS) intend to implement under the new SBA. Our program has the full support of all coalition partners in the present government, and we plan to implement it firmly, notwithstanding upcoming parliamentary and local elections in early 2012. In view of Serbia’s comfortable international reserves position and continued access to external financing, we intend to treat the arrangement as precautionary. Therefore, we do not intend to make the purchases under the requested arrangement when they become available upon its approval and after observance of its performance criteria and completion of its reviews. The implementation of our program will be monitored through quantitative performance criteria, structural benchmarks, and an inflation consultation clause, as described in the attached MEFP and Technical Memorandum of Understanding (TMU). There will be six reviews of the arrangement by the Fund, scheduled to be completed by mid-November 2011, mid-February 2012, mid-May 2012, mid-August 2012, mid-November 2012, and mid-February 2013, to assess progress in implementing the program and reach understandings on any additional measures that may be needed to achieve its objectives.

54
We believe that the policies set forth in the attached memorandum are adequate to achieve the objectives of our economic program, but we will take any further measures that may become appropriate for this purpose. We will consult with the Fund on the adoption of these measures and in advance of revisions to the policies contained in the MEFP, in accordance with the Fund’s policies on such consultations. And we will provide all information requested by the Fund to assess implementation of the program. Sincerely, /s/ /s/
Mirko Cvetkovic Dejan Soskic Prime Minister and Minister of Finance Governor of the National Bank
of Serbia

55
REPUBLIC OF SERBIA
MEMORANDUM OF ECONOMIC AND FINANCIAL POLICIES
September 16, 2011
I. RECENT ECONOMIC AND POLICY DEVELOPMENTS
1. The Serbian economy is only gradually recovering from its severe slump, but inflation has been volatile, while the external trade deficit remains elevated. Sparked by a recovery of exports to the EU, real GDP grew by about 1 percent in 2010, accelerating to 2¾ percent in the first half of 2011. However, job shedding in the private sector continued throughout the slow recovery, and the unemployment rate is now well above 20 percent. Inflation surged starting in mid-2010, propelled by a series of food price shocks and pass-through from exchange rate depreciation, but has peaked at over 14 percent in April. On the external side, the massive trade deficit in 2008 was almost halved by 2010, but it still remains at a level that requires significant external borrowing.
2. In response to the global financial crisis, we conducted prudent macroeconomic policies:
When output and employment slumped in 2009, our fiscal policy had to adjust both to correct the underlying weak budget position and to off-set the massive drag on fiscal revenue owing to the rebalancing of the unsustainable external position. To consolidate these gains, we put in place a rule-based fiscal responsibility framework that strikes a reasonable balance between the pace of fiscal adjustment and avoiding an excessively pro-cyclical stance.
As regards monetary policy, we maintained and strengthened our inflation targeting framework in a difficult environment of high food price volatility and persistent inflationary pressures from a large exchange rate correction. Despite the recent run-up in headline inflation, inflation expectations remained reasonably well anchored.
Our banking sector has weathered the crisis well, reflecting countercyclical prudential policies during the credit boom that created ample liquidity and capital buffers. An important role was also played by our Financial Sector Support Program, which launched an unprecedented private sector involvement (PSI) initiative, supported by both foreign- and domestically-owned banks.
Finally, progress on structural policies has admittedly been slower than hoped for, particularly as regards restructuring the large public sector. However, the crisis provided an unfavorable backdrop for implementing far-reaching reforms; and, our structural reform efforts have been in line with what was achieved in other countries in the region.

56
II. PROGRAM OBJECTIVES AND ECONOMIC OUTLOOK
3. The program will have two main objectives:
First, to preserve macroeconomic and financial stability. Thus, the program seeks to implement monetary, financial, and fiscal policies that will contain internal and external imbalances in what could be an increasingly difficult and uncertain global and regional economic setting.
Second, to improve the investment climate through specific and targeted structural reforms that address key growth bottlenecks and which command high ownership on the side of implementing agencies.
Our ultimate economic objective remains to put Serbia on a sustainable real convergence growth toward EU income levels. 4. The baseline macroeconomic framework projects slow real GDP growth, further disinflation, and continued capital inflows to finance the current account deficit:
GDP growth is now projected to effectively stall during the second half of 2011, resulting in annual growth of 2 percent, although there may be upside risks from agriculture, while growth is projected to resume again in 2012. Reflecting the rebalancing of the economy, GDP growth will continue to be driven mainly by investment and exports, whereas consumption growth is expected to remain subdued, reflecting mainly continued job losses in the private sector.
CPI inflation is projected to fall well into single digits at end-2011, to come within the NBS tolerance band by mid-2012, and to continue converging toward the middle of the NBS band thereafter.
The current account deficit is expected to temporarily rise, before declining gradually over the medium term, stabilizing at around 6 percent of GDP, with the bulk of financing coming from FDI and most of the remainder from bank-intermediated flows.
5. An abrupt slowdown in regional growth and trade, as well as adverse spillovers from euro-area financial tensions, represent the main risks for the Serbian economy. Our economy has close trade links to EU and regional economies, while our banking system is largely owned by euro-area banks, some of which could face stress in their own home markets. Thus, as in 2008, our economy could be exposed to significant adverse spillovers if trading partner growth slows or prices of key Serbian export commodities decline sharply. At the same time, availability and pricing of external funding could deteriorate. However, Serbia will face any shocks from a much stronger external position compared with the 2008-09 spillovers. In addition, the NBS’s foreign exchange reserves and banks’ liquidity and capital

57
buffers remain comfortable, while the legal and policy frameworks for dealing with problem banks have been upgraded.
III. ECONOMIC POLICIES
6. To achieve our program objectives, we will pursue the following policies:
We will continue fiscal adjustment during 2011–12 in line with minimum requirements of our fiscal responsibility framework. We believe that fiscal consolidation, consistent with deficit targets of 4½ and just below 4 percent of GDP for 2011 and 2012, respectively, is needed for two main reasons: (i) the fiscal deficit remains well above the medium-term level considered prudent given Serbia’s debt level and fiscal risks; and (ii) during a pre-election period, there is a particularly pressing need to reassure investors and the Serbian public that public finances remain under control. In this context, it is important to note that the fiscal deficit rule prescribes the minimum fiscal adjustment required by the fiscal responsibility framework. Given the elevated level of the deficit, we note that the room for letting automatic fiscal stabilizers operate will likely be limited if the growth outlook dims further.
On monetary policy, we will continue to use inflation targets as the economy’s nominal anchor. This monetary policy regime has served Serbia relatively well over the last few years, and we will therefore continue to target headline inflation, while maintaining a managed floating exchange rate.
Financial stability policies will need to continue to preempt, and, if necessary, be ready to react to shocks. Our dinarization strategy is designed to reduce financial stability risks over the medium term, mainly through encouraging corporates to avoid or hedge against foreign exchange risks. While present bank liquidity and capital buffers remain reassuring, supervisors will need to monitor closely liquidity and non-performing loans at individual banks.
Structural reforms that boost the economy’s low capacity to produce, save, and export remain critical for the medium-term success of the Serbian economy. Serbia’s transition to a more efficient, private-sector dominated economy is lagging considerably behind best-performing peers in the region. Thus, we will put in place specific structural reforms that assure property rights, improve the management and transparency of the public enterprise sector, and increase labor market flexibility to support private sector job creation.
A. Fiscal Policy
7. In the supplementary budget for 2011, we will target the fiscal deficit of 4½ percent of GDP, in line with the fiscal rule. Revenue collections this year seem to underperform relative to the 2011 budget, particularly with regard to VAT and social contributions. At the same time, higher-than-expected inflation will result in additional

58
outlays on wages and social transfers, while the decentralization law adopted by parliament in June will start shifting resources from the central to the local governments in October, and additional capital spending plans have emerged during the year, yielding a fiscal gap of about 1 percent of GDP. As a prior action for SBA approval, we will submit to parliament in September a supplementary budget for 2011. The requirements for the prior action are specified in the TMU (¶12), and include a revised financial plan for the Roads of Serbia consistent with the program.
8. The 2011 fiscal gap will be closed mainly by cutting spending allocations. We will focus on cutting non-priority capital spending (including on local projects) (½ percent of GDP) and constraining ministries’ and other agencies’ ability to spend on goods and services and net lending (¼ percent of GDP). The practice of intransparent one-off wage bonuses to particular segments of public employees will be discontinued. Given the tight overall spending envelope and as a consequence of the adverse effect of the decentralization law on central government resources, there will be effectively no room for additional discretionary spending allocations at the Republican budget level. In addition, we are strongly committed to offset through additional spending cuts at the Republican level any spending in excess of agreed targets at other government levels.
9. We will implement additional fiscal adjustment in 2012. Under the baseline macroeconomic scenario, the fiscal deficit rule implies a target of 3.9 percent of GDP in 2012. With unchanged fiscal policies, however, current projections would have suggested a fiscal gap of about 2½ percent of GDP. Close to one half of the fiscal gap reflects the full-year effect of the new decentralization law.
10. We intend to close the identified 2012 fiscal gap primarily through cutting spending. The fiscal package for 2012 is envisaged to include as the main measures: (i) shifting spending responsibilities, particularly on capital spending and local road maintenance, from the Republican to local governments (¾ percent of GDP); (ii) cuts in subsidies at the Republican level (¼ percent of GDP); (iii) a sharp reduction of net lending operations (½ percent of GDP); (iv) cutbacks in planned low-priority capital and goods and services spending (¾ percent of GDP); and (v), several minor revenue measures, including increasing royalties for mining rights and measures to increase tax compliance (¼ percent of GDP). The 2012 budget will be further discussed at the time of the first review.
11. We plan to cover the bulk of our near-term financing requirements by issuing a eurobond. Strong appetite for government paper has helped us to extend the average maturity of our outstanding T-bill stock from about 5 months at end-2010 to about 11 months and has also allowed us to build up a relatively comfortable deposit position of 2½ percent of GDP. In September, we plan to issue a eurobond to cover the remaining financing needs for the year. Should international market conditions turn unfavorable due to global financial tensions, we would try to rely on additional T-bill issuance and domestic bank loans. As a last resort, we could draw on our deposit buffer.

59
12. We will take measures to increase payment discipline throughout the public sector. There is evidence that some payment arrears have been accumulating, in particular at the local government level. We will begin to monitor arrears more closely, and commit to no further arrears accumulation under the program. In order to better control and monitor payment discipline at the local government level we will, by end-December require, as a structural benchmark, that all general government entities report payment arrears on a monthly basis (TMU ¶15). Also, we will introduce obligations for all governments levels to pay outstanding bills due over 60 days by law and a sanctioning mechanism will be put in place, including accrual of penalty interest. In addition, transfers from the Republican budget to local governments will be earmarked for payments on overdue loans or called government guarantees, if applicable.
13. Additional politically difficult reforms will be needed to ensure a more efficient, fair, and fiscally sustainable public pension system. With pension contribution rates and budget transfers to the pension system already at very high levels and given Serbia’s unfavorable demographics, we face two broad options: cutting pension replacement rates drastically to what would likely be socially unacceptable levels, or to raise effective retirement ages and improve labor market incentives to increase the number of contributors per pensioner. Our preference is for the second option. Therefore, in line with reform efforts in other European countries, we expect that the next government and parliament will need to raise effective retirement ages as a matter of priority, not least in view of the fact that retirement age increases need to be phased in over many years. To prepare technically these reforms, with support from the World Bank, we will study the option of targeting a fiscally affordable and socially sustainable replacement rate for a “standard pensioner,” i.e. a pensioner with an average contribution period of 40 years to the pension fund. We will also study options to bring retirement arrangements for coal miners and other professions working under difficult conditions in line with best international practice.
14. A fiscally responsible draft restitution law has been submitted to parliament. The draft law, submission of which is a prior action for SBA approval, proposes in-kind restitution where possible, and envisages a cap of about 6 percent of GDP on financial compensation for cases where in-kind restitution is not possible.
15. We also believe that the next government should consider a revenue-neutral tax reform that would include direct tax cuts. As discussed already under the previous SBA, the next government should consider a comprehensive tax reform that trades reductions in social contributions for increases in indirect taxes, and possibly also property taxes. This reform would help tradable sector competitiveness, stimulate job creation in the formal sector, and curb activities in the informal sector, although it would have to be carefully designed to address issues of tax regressivity and tax administration.
16. We will tighten requirements for new laws that have significant deficit-increasing implications. The Pay-As-You-Go principle of matching changes in spending

60
and revenue already imbedded in the Budget System Law (BSL) will be strengthened. In particular, to limit the risk of enacting fiscally irresponsible laws in the course of the year, as a structural benchmark under the program the BSL will tighten requirements for: (i) adopting offsetting measures in response to discretionary fiscal policy relaxations outside of the annual budget process and (ii) estimating financial effects for any draft legislation that may be submitted to parliament (TMU, ¶13).
17. We plan to strengthen capital budgeting. The government envisages the following actions to address capital budgeting problems: (i) develop a multi-annual capital budget, underpinned by predictable revenue envelopes (structural benchmark for end-2011; TMU ¶13); (ii) streamline procurement rules for domestically-financed capital spending; (iii) strengthen the capacity of the Budget Preparation Department to evaluate capital investment proposals; and (iv) set up a new unit for public investment in the Ministry of Finance tasked with coordinating and monitoring project identification, evaluation, selection, preparation and financing.
18. We intend to upgrade the capacity of public debt management. To better monitor and manage debt risks, we will as a matter of urgency: (i) operationalize the debt data management system; and (ii) strengthen the capacity to assess the risks and trade-offs between alternative debt issuance strategies.
19. We will modernize further our tax administration to strengthen tax compliance. To improve compliance, the risk management unit at the tax administration agency will adopt a taxpayer segment-focused risk treatment plan for 2012 (structural benchmark for end-2011). Other steps in this area include plans to link the collection of all wage-related taxes and contributions with the payout of net wages before the end of the year (TMU ¶14).
B. Monetary and Exchange Rate Policies
20. While inflationary pressures are expected to continue to recede, further policy actions will have to await the resolution of inflation outlook risks. As it became evident that inflation had reached its peak in April, we have lowered the policy rate by 75 basis points in two steps since May. With little pressures from aggregate demand and high unemployment, declining food prices due to a strong agricultural season and lower global commodity prices, and no expected impact from exchange rate fluctuations, we anticipate that inflation will continue on a downward path toward the target tolerance band. Nevertheless there are risks: adverse financial spillovers from the euro area could raise the country risk premium, fiscal policy could be loosened prior to next year’s elections, and food price pressures may resume if the late summer agricultural seasons turns out to be disappointing. In this context, future policy decisions will depend on the materialization of these risks. Under the program, inflation developments will continue to be monitored using a standard inflation consultation clause (Table 1, and ¶7-8 of TMU). Interventions in the

61
foreign exchange market will continue to aim at limiting excessive volatility and, if needed, preserving financial stability.
C. Financial Sector Policies
21. Further aligning the banking sector’s regulatory framework with best international and regional practices remains a priority. The NBS has announced adoption of the Basel II framework effective end-2011, and has already published the set of by-laws. Important elements under the new framework include: (i) maintaining the capital adequacy ratio (CAR) for the banking sector at 12 percent; (ii) adjusting the capital adequacy decision relating to term debt instruments in line with Basel II; (iii) introducing a capital conservation buffer of 2½ percent, thereby prohibiting profit distribution for banks with CARs below 14½ percent; and (iv) adjusting the calculation of bank’s regulatory capital adequacy. In the context of the Basel II implementation, we are also envisaging some relaxation of the conservative bank provisioning regime, while maintaining significant buffers relative to international accounting standard provisions. We expect that the combined impact of these changes will have a negligible impact on required capital levels for the banking sector as a whole.
22. We believe we have all the necessary supervisory tools to deal with a possible severe downside scenario in the banking system. We are closely monitoring particularly vulnerable segments of the banking system. Our cooperation with foreign home supervisors has strengthened appreciably, including through our participation in supervisory colleges. During 2010, the bank distress resolution framework was comprehensively reviewed and updated in line with sound international practices.
23. We will continue our efforts to reduce un-hedged foreign exchange exposures. Large un-hedged foreign exchange positions, especially in corporate balance sheets, are a source of financial stability risks and constrain the effectiveness of monetary policy. As low and stable inflation are key pre-conditions for higher dinarization, we are committed to continuing our prudent macroeconomic policies. In addition, the NBS and the government in September signed a memorandum laying out a detailed dinarization strategy with two main prongs: (i) promote the use of dinars by developing further the primary and secondary dinar bond markets, issuing long-term dinar securities by IFIs, and using incentives to promote savings in dinar; and (ii) reduce un-hedged foreign exchange risks by developing hedging instruments, while continuing public education on foreign exchange risks. In addition, we will continue to press foreign banks and their home supervisors to proactively support our strategy to reduce un-hedged foreign exchange risks.
D. Structural Policies
24. We are initiating long-delayed measures to clarify and guarantee property rights in Serbia:

62
Construction land. To facilitate a pickup in foreign direct investment, the remaining bottlenecks for converting construction land from public into private ownership will be addressed. In particular, we have drafted amendments to the law on urban planning and construction and other decisions that would substantially simplify conversion procedures, including by fostering an independent valuation process by credible professional assessors. We will continue to monitor progress on the conversion issue in regular reports that would be made available to the public, and will consider further steps should this progress fall short of expectations.
Restitution law. While the proposed law gives primacy to in-kind restitution, it would protect legitimate private owners, as privatized enterprises would not be subject to in-kind restitution claims. As implementation of the law would play a major role in dispelling private investor uncertainty, we will create and publicize, with periodic updates, an accurate database of properties that are the subject of restitution claims.
25. To restructure and privatize our still large public enterprise sector, we will take the following actions:
Socially owned enterprises. As a matter of priority, we plan to resolve the problem of the formerly socially-owned enterprises that are currently in the portfolio of the privatization agency. A working group comprising representatives of the Ministry of Economy, the privatization agency, and other experts will be tasked with providing a plan by the end of the year that includes: (i) an analysis of the viability of the enterprises; (ii) how viable companies can survive without Republican budget subsidies; and (iii) how to transfer some of the responsibilities stemming from the operations of these enterprises to local governments.
Large state owned enterprises (SOEs). Our focus on SOEs during the program will be to improve their governance and efficiency, and eventually privatize most of them by attracting strategic investors. To help achieve this, during the program period we will: (i) institute stricter government control and monitoring of all SOEs, including establishing binding targets on their wage bills (structural benchmark for end-2011; TMU ¶23); (ii) complete the incorporation of all large SOEs (structural benchmark for end-2012; TMU ¶23); (iii) improve the transparency of SOEs’ operations by publishing regularly their financial results; and (iv) strengthen the managerial professionalism and operational independence of SOEs, including through selection of managers strictly based on professional criteria.
26. To spur creation of much-needed private sector jobs, we also plan to reform the labor market, sequenced in two steps:

63
In the first step, as an end-October structural benchmark, the Ministry of Labor will submit to the Social and Economic Council amendments to the labor law that: (i) base the calculation of severance pay only on the duration of employment with the last employer; and (ii) extend the duration of fixed-term contracts from one to three years (TMU ¶22). It is expected that the amendments would be forwarded to parliament in due course.
In the second step, we will conduct a comprehensive review of other labor market rigidities, active labor market policies, and collective bargaining, with additional reforms to be supported by structural benchmarks in future program reviews.
27. In addition, we will continue to push forward with a broad array of other structural reforms. First, in cooperation with the World Bank, we will build on the recent acceleration of progress in implementing the regulatory guillotine. Second, while our legal framework for competition policy is now broadly in line with European standards, we will improve implementation, including through upgrading the capacity of the Competition Commission, drawing on the lessons of a recent peer review of the framework. Third, the just-enacted energy law is a significant step in the right direction opening up opportunities for reforming this important sector, which we intend to pursue in cooperation with the World Bank and EBRD. Fourth, we will work on realizing the significant potential of our agricultural sector in co-operation with the World Bank and other donors. Finally, we will intensify our efforts in promoting Serbia’s trade integration, including re-establishment of supply chains that were broken over the past two decades.
IV. PROGRAM MONITORING
28. Progress in the implementation of the policies under this program will be monitored through quarterly quantitative performance criteria (PCs) and indicative targets, structural benchmarks, and an inflation consultation clause. These are detailed in Tables 1 and 2, with definitions provided in the attached Technical Memorandum of Understanding. Quantitative targets for September and December 2011 are PCs.

64
Sept. Dec.
Prog. Prog.
Quantitative Performance Criteria
Floor on net international reserves of the NBS (in billions of euro) 4.7 4.5
Ceiling on consolidated general government overall deficit (in billions of dinars) 2/ 110 153
Ceiling on contracting or guaranteeing by the public sector of new short-term external debt (up to and including one year, in millions of euro) 2/
0 0
Ceiling on contracting or guaranteeing by the public sector of new nonconcessional external debt (over one year, in millions of euro) 2/ 3/
993 1950
Ceiling on accumulation of public sector external payment arrears (continuous, in millions of euro)
0.0 0.0
Inflation Consultation Bands (in percent)
Central point 9.5 7.9
Band, upper limit 11.5 9.9
Band, lower limit 7.5 5.9
Indicative Targets
Ceiling on current expenditure of the Serbian Republican budget (in billions of dinars) 2/ 614 827
Ceiling on gross accumulation of payment arrears of the Serbian Republican budget (in billion of dinars)
0.0 0.0
Ceiling on gross accumulation of domestic guarantees by the Republican budget and the Development Fund and domestic borrowing by the Development Fund (in billions of dinars) 2/
30 30
1/ As defined in the Letter of Intent, the Memorandum on Economic and Financial Policies,
and the Technical Memorandum of Understanding.
2/ Cumulative from January 1.
3/ Excluding loans from the IMF, EBRD, EIB, EU, IBRD, KfW, Eurofima, CEB, IFC,
and bilateral government creditors, as well as debt contracted in the context of restructuring agreements.
Table 1. Serbia: Quantitative Conditionality Under the SBA, 2011 1/
2011

65
Table 2. Serbia: Structural Conditionality under the SBA, 2011-2012 1
Measure Target Date
Prior actions
1. Submit to parliament a 2011 supplementary budget and adopt supporting measures consistent with the program (¶7)
September 22, 2011
2. Submit to parliament a restitution law that includes a fiscally responsible cap on financial restitution payments(¶14)
September 22, 2011
Structural benchmarks
1. Labor Ministry to submit to Economic and Social Council amendments to labor legislation that bases severance pay on duration of employment at last employer and extends duration of fixed contracts (¶26)
End-October 2011
2. Adopt a taxpayer segment focused risk treatment plan for 2012 (¶19) End-December 2011 3. Strengthen capital budgeting framework (¶17) End-December 2011 4. Tighten Pay-As-You-Go rules in the Budget System Law (¶16) End-December 2011 5. Introduce stricter financial control on largest SOEs, including wage bill targets (¶25) End-December 2011 6. Begin reporting on a monthly basis payment arrears for all consolidated general government entities (¶12) End-December 2011
7. Complete incorporation of all large SOEs (¶25) End-December 2012
1 Additional structural benchmarks may be agreed in the context of future reviews.

66
Republic of Serbia
TECHNICAL MEMORANDUM OF UNDERSTANDING
1. This Technical Memorandum of Understanding (TMU) sets out the understandings regarding the definition of indicators used to monitor developments under the program. To that effect, the authorities will provide the necessary data to the European Department of the IMF as soon as they are available. As a general principle, all indicators will be monitored on the basis of the methodologies and classifications of monetary, financial, and fiscal data in place on August 1, 2011, except as noted below.
A. Floor for Net International Reserves of the NBS
In billions of euro Outstanding stock: End-July 2011 5.8 Floor on international reserves: End-September 2011 (performance criterion) 4.7 End-December 2011 (performance criterion) 4.5
2. Net international reserves (NIR) of the NBS are defined as the difference between reserve assets and reserve liabilities, measured at the end of the quarter.
3. For purposes of the program, reserve assets are readily available claims on nonresidents denominated in foreign convertible currencies. They include the NBS holdings of monetary gold, SDRs, foreign currency cash, foreign currency securities, deposits abroad, and the country’s reserve position at the Fund. Excluded from reserve assets are any assets that are pledged, collateralized, or otherwise encumbered (e.g., pledged as collateral for foreign loans or through forward contracts), undivided assets of the former Socialist Federal Republic of Yugoslavia (SFRY), NBS’ claims on resident banks and nonbanks, as well as subsidiaries or branches of Serbian commercial banks located abroad, claims in foreign exchange arising from derivatives in foreign currencies vis-à-vis domestic currency (such as futures, forwards, swaps, and options), precious metals other than monetary gold, assets in nonconvertible currencies, and illiquid assets.
4. For purposes of the program, reserve liabilities are defined as all foreign exchange liabilities to residents and nonresidents with a maturity of less than one year, including commitments to sell foreign exchange arising from derivatives (such as futures, forwards, swaps, and options, including any portion of the NBS gold that is collateralized), and all credit outstanding from the Fund. Excluded from reserve liabilities are undivided foreign exchange liabilities of the SFRY, government foreign exchange deposits with NBS, and amounts received under any SDR allocations received after August 20, 2009.

67
5. For purposes of the program, all foreign currency-related assets will be valued in euros at program exchange rates as specified below. The program exchange rates are those that prevailed on July 31, 2011. Monetary gold will be valued at the average London fixing market price that prevailed on July 31, 2011.
Cross Exchange Rates and Gold Price for Program Purposes Valued in:
RSD Euro USD SDR GBP
Currency:
RSD 1.0000 0.0098 0.0140 0.0088 0.0086
Euro 102.1252 1.0000 1.4333 0.8964 0.8773
USD 71.2517 0.6977 1.0000 0.6254 0.6121
SDR 113.9315 1.1213 1.5990 1.0000 0.9826
GBP 116.4084 1.1399 1.6338 1.0217 1.0000
Gold 116,033.6310 1,136.19 1,628.5 1,018.4 996.7453
6. Adjustors. For program purposes, the NIR target will be adjusted upward pari passu to the extent that: (i) after August 31, 2011, the NBS has recovered frozen assets of the SFRY, assets of the SFRY, long-term assets, and foreign-exchange-denominated claims on resident banks and nonbanks, as well as Serbian commercial banks abroad; and (ii) the restructuring of the banking sector by the Deposit Insurance Agency involves a write-off of NBS foreign exchange-denominated liabilities to resident banks. The NIR floor will also be adjusted upward by any privatization revenue in foreign exchange received after August 31, 2011. Privatization receipts are defined in this context as the proceeds from sale or lease of all or portions of entities and properties held by the public sector that are deposited in foreign exchange at the NBS, either directly, or through the Treasury.
B. Inflation Consultation Mechanism
7. Inflation is defined as the change over 12 months of the end-of-period consumer price index (CPI), as measured and published by the Serbian Statistics Office.
8. Breaching the inflation consultation band limits at the end of a quarter would trigger discussions with IMF staff on the reasons for the deviation and the proposed policy response. A deviation of more than 1 percentage point from either the upper or the lower band specified in Table 1 would trigger a consultation with the IMF’s Executive Board on the reasons for the deviation and the proposed policy response before further purchases could be requested under the SBA.

68
C. Fiscal Conditionality
9. The general government fiscal balance, on a cash basis, is defined as the difference between total general government revenue (including grants) and total general government expenditure (irrespective of the source of financing) as presented in the “GFS classification table” and including expenditure financed from foreign project loans. For program purposes, the consolidated general government comprises the Serbian Republican budget (on-budget and own revenue), local governments, the pension fund (employees, self-employed, and farmers), the health fund, the National Agency for Employment, the Roads of Serbia Company (JP Putevi Srbije) and any of its subsidiaries; and foreign-financed expenditures by the company Corridors of Serbia. Any new extrabudgetary fund or subsidiary established over the duration of the program would be consolidated into the general government.
10. Government current expenditure of the Republican budget (excluding expenditure financed by own sources) includes wages, subsidies, goods and services, interest payments, transfers to local governments and social security funds, social benefits from the budget, other current expenditure, and net lending. It does not include capital spending. The ceiling will be adjusted for the additional expenditure that may be needed for potential lender-of-last-resort operations under the financial stability framework.
11. Ceiling on the accumulation of domestic loan guarantees (gross) extended by the Republican budget and the Development Fund. The ceiling also includes the contracting of any domestic loans by the Development Fund. It excludes any guarantees extended under the financial stability framework, unless such loans or guarantees are extended to entities other than financial sector institutions.
12. Supplementary 2011 budget (prior action). The government will submit the 2011 supplementary budget to parliament, as well as enact a package of supporting measures consistent with the program by September 22, 2011. In particular: (i) given the target for the general government budget deficit in 2011 of RSD 153 billion, the Republican budget deficit (including the balance of own-resource budgets but excluding foreign-financed capital spending) would be limited to RSD 134 billion; (ii) Republican budget expenditure including transfers to other levels of government will not exceed RSD 850 billion; (iii) a government decision will ensure a surplus in the balance of own-resource budget users of at least RSD 9 billion in 2011; and (iv) a revised financial plan of the Roads of Serbia will be consistent with the full-year deficit of RSD 1.6 billion.
13. Fiscal responsibility and capital budgeting. The following two changes to the Budget System law will be introduced.
Amended Article 47 would clarify that new legislation adopted in the course of the fiscal year that envisions a reduction of revenues or an increase in expenditures should be simultaneously accompanied by legislation with an offsetting effect on the

69
fiscal deficit, (i.e., envisioning either an increase in revenues or a decrease in expenditures). Amended Article 48 would extend the requirements for an estimate of the financial effects to any legislative proposals that are submitted to Parliament (not just those that are submitted to the government). These estimates would be required to contain an opinion of the Ministry of Finance regarding their accuracy. In addition, the Ministry of Finance would prepare a rulebook that would contain a set of minimum requirements for such estimates.
A new article on medium-term investment priorities would be inserted, to require budget beneficiaries in charge of public investment to determine medium-term public investment priorities and deliver them to the Ministry not later than by 15 March. Also, the Ministry should deliver to budget beneficiaries the instruction on the contents of plans expressing the medium-term public investment priorities, and the government should be required to adopt the combined and harmonized plan of medium-term public investment priorities. The adopted medium-term public investment plan should be included in the revised Memorandum and plans for the implementation of medium-term public investment priorities shall be prepared as a part of financial plans of budget beneficiaries.
14. Tax administration. Building on the 2011 compliance strategy’s principles for compliance management, the risk management unit at the tax administration should develop and adopt a taxpayer segment-focused risk treatment plan for 2012, which describes on a segment basis: (i) the exact compliance problems to be mitigated within that year; and (ii) the compliance measures (including guidance, audit, enforcement, and other means) that will be utilized to achieve this and ensure overall improvements in compliance (structural benchmark for end-December 2011).
15. Domestic arrears. For program purposes, domestic arrears are defined as the belated settlement of a debtor’s liability which is due under the obligation (contract) for more than 60 days, or the creditor’s refusal to receive a settlement duly offered by the debtor. The program will include indicative targets on the change in domestic arrears of all consolidated general government entities as defined in ¶15 above except local governments. Arrears to be covered include outstanding payments on wages and pensions; social security contributions; obligations to banks and other private companies and suppliers; as well as arrears to other government bodies.
D. Ceilings on External Debt
16. Definitions. The ceilings on contracting or guaranteeing of new nonconcessional external debt by the public sector with original maturity of more than one year and short term external debt (with maturities up to one year) applies not only to debt as defined in point No. 9 of the Guidelines on Performance Criteria with Respect to Foreign Debt adopted on August 24, 2000 (Decision No. 12274–(00/85)) but also to commitments contracted or

70
guaranteed for which value has not been received. Excluded from this performance criterion are normal short-term import credits. For program purposes, debt is classified as external when the residency of the creditor is not Serbian.
17. Excluded from the ceilings are loans from the IMF, EBRD, EIB, EU, IBRD, KfW, CEB, Eurofima, IFC, and bilateral government creditors, as well as debt contracted in the context of restructuring agreements. For the purposes of the program, the public sector comprises the consolidated general government, the Export Credit and Insurance Agency (AOFI), and the Development Fund.
18. For new debt to budgetary users, the day the debt is contracted will be the relevant date for program purposes. For new debt to non-budgetary users, the day the first guarantee is signed will be the relevant date. Contracting or guaranteeing of new debt will be converted into euros for program purposes at the program cross exchange rates described in this TMU. Concessionality will be based on a currency-specific discount rate based on the ten-year average of the OECD’s commercial interest reference rate (CIRR) for loans or leases with maturities greater than 15 years and on the six-month average CIRR for loans and leases maturing in less than 15 years. Under this definition of concessionality, only debt with a grant element equivalent to 35 percent or more will be excluded from the debt limit.
19. Reporting. A debt-by-debt accounting of all new concessional and nonconcessional debt contracted or guaranteed by the public sector, including the original debt documentation, details on debt service obligations, as well as all relevant supporting materials, will be transmitted on a quarterly basis, within four weeks of the end of each quarter.
E. Ceiling on External Debt Service Arrears
20. Definition. External debt-service arrears are defined as overdue debt service arising in respect of obligations incurred directly or guaranteed by the public sector, except on debt subject to rescheduling or restructuring. The program requires that no new external arrears be accumulated at any time under the arrangement on public sector or public sector-guaranteed debts. The authorities are committed to continuing negotiations with creditors to settle all remaining official external debt-service arrears.
21. Reporting. The accounting of non-reschedulable external arrears by creditor (if any), with detailed explanations, will be transmitted on a monthly basis, within two weeks of the end of each month. Data on other arrears, which can be rescheduled, will be provided separately.
F. Other Structural Reforms
22. Labor law. The labor law that would be submitted to the Social and Economic Council would include the following main changes. First, Article 37 would be amended to

71
lengthen the maximum length of fixed contracts from 12 months to 3 years. Second, revised Article 158 would stipulate that the existing method of calculation of severance benefits for redundant employees would be based on employment history with the last employer, instead of the entire employment period of a given employee. Any other changes to the law that may be introduced concurrently should not increase the restrictiveness of the labor market regulation.
23. Large state owned enterprises (SOEs). The SOEs monitored under the program include the following 10 enterprises or their successors: JP Elektroprivreda Srbije (EPS), JP Elektromreza Srbije (EMS), JP Transnafta, JP Srbijagas, JP PTT Srbije, JP Jugoslovenski Aerotransport, JP Zeleznice Srbije, JP Srbijasume, JP Aerodrom Nikola Tesla Beograd, JVP Srbijavode. Under the program, wages bills for large SOEs will be adjusted using the indexation formula applicable for pensions and public sector wages and salaries set out in the Budget System law. In addition, the Ministry of Finance will ensure that the payment of wages by large SOEs during the course of the year is consistent with their approved annual financial plans. Finally, by end-2012, the government will make the needed changes to the legal framework and the foundation acts of large SOEs to permit their incorporation as joint stock companies, including the right to own the assets currently in their use.
24. Reporting. General government revenue data and the Treasury cash situation table will be submitted weekly on Wednesday; updated cash flow projections for the Republican budget for the remainder of the year five days after the end of each month; and the stock of spending arrears of the Republican budget, the Road of Serbia, and the social security funds 45 days after the end of each quarter. General government comprehensive fiscal data (including social security funds) would be submitted by the 25th of each month. The large state-owned enterprises listed in paragraph 19 will submit quarterly accounts and the wage bill data 45 days after the end of the quarter.
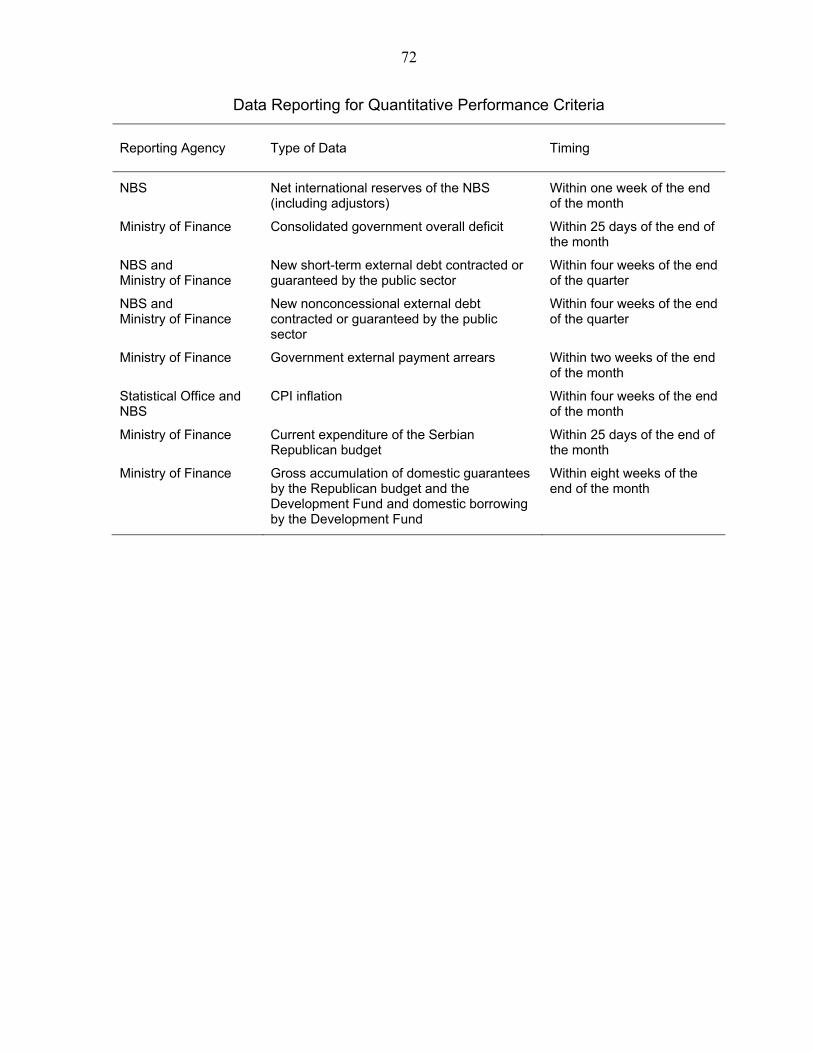
72
Data Reporting for Quantitative Performance Criteria
Reporting Agency Type of Data Timing
NBS Net international reserves of the NBS (including adjustors)
Within one week of the end of the month
Ministry of Finance Consolidated government overall deficit Within 25 days of the end of the month
NBS and Ministry of Finance
New short-term external debt contracted or guaranteed by the public sector
Within four weeks of the end of the quarter
NBS and Ministry of Finance
New nonconcessional external debt contracted or guaranteed by the public sector
Within four weeks of the end of the quarter
Ministry of Finance Government external payment arrears Within two weeks of the end of the month
Statistical Office and NBS
CPI inflation Within four weeks of the end of the month
Ministry of Finance Current expenditure of the Serbian Republican budget
Within 25 days of the end of the month
Ministry of Finance Gross accumulation of domestic guarantees by the Republican budget and the Development Fund and domestic borrowing by the Development Fund
Within eight weeks of the end of the month

Statement by the IMF Staff Representative on the Republic of Serbia Executive Board Meeting
September 29, 2011 This statement provides information that has become available since the issuance of the staff report (EBS/11/141). The new information does not alter the thrust of the staff appraisal. 1. The prior actions for program approval have been completed. As indicated in the staff report, the law on property restitution, including a fiscally responsible cap on financial restitution payments, was submitted to Parliament shortly after the mission left Belgrade, on September 6. The law has been passed by Parliament. On September 23, the government submitted to Parliament a 2011 supplementary budget and adopted supporting measures consistent with the program (TMU ¶12).
2. The government of Serbia placed a US$1 billion Eurobond on September 21. This was Serbia’s first issuance in the international market, excluding bonds issued as part of the 2004 debt restructuring. The bond has a 10 year maturity and was priced to yield 7.5 percent.

Press Release No. 11/353 FOR IMMEDIATE RELEASE September 30, 2011
IMF Executive Board Approves Stand-By Arrangement for the Republic of Serbia
The Executive Board of the International Monetary Fund (IMF) has approved an 18-month Stand-By Arrangement for an amount equivalent to SDR 935.4 million (about US$1.5 billion1 or €1.1 billion) for the Republic of Serbia. However, the Serbian authorities intend to treat the arrangement as precautionary, and not to draw on Fund resources unless the need arises. Following the Executive Board's discussion of Serbia on September 29, 2011, Ms. Nemat Shafik, Deputy Managing Director and Acting Chair, stated: “The authorities’ economic program, supported by the Fund under the new precautionary stand-by arrangement, seeks to maintain macroeconomic and financial stability in a particularly uncertain global and regional environment. The program will help insure the Serbian economy against external shocks, anchor the fiscal responsibility framework, and address bottlenecks in the investment climate to promote employment creation. “Serbia’s external position is more balanced than before the 2008–09 crisis, reflecting a much lower current account deficit and a more competitive exchange rate. Moreover, the central bank’s international reserves remain at a comfortable level. However, external risks, including risks of spillover from the regional financial turbulence, have increased. “Fiscal policy will be based on the fiscal responsibility framework and meeting the program’s fiscal targets will require significant effort and perseverance. Additional fiscal adjustment may be needed if downside risks to growth materialize. “The monetary and exchange rate policies in place have served the country well. The NBS has conducted monetary policy effectively, containing inflation expectations despite a recent surge in food prices. Reduced inflationary pressures may create room for further policy easing, but the National Bank of Serbia needs to remain vigilant to achieve its objective of bringing inflation back into its target band.
1 All amounts based on the SDR exchange rates of September 28, 2011.
International Monetary Fund Washington, D.C. 20431 USA

2
“The banking system remains liquid and well capitalized owing to cautious prudential policies pursued before and during the crisis. The NBS intends to continue improving the regulatory and supervisory framework in line with international best practice and plans to adopt the Basel II framework by 2011. “The next government should accelerate the pace of structural reforms necessary to develop a more vibrant export sector and favor the transition to a sustainable job-creating growth model. This will require deepening the program’s reform agenda, which includes restructuring and privatizing state-owned enterprises, increasing labor market flexibility, and better guaranteeing property rights,” said Ms. Shafik. ANNEX Recent Economic Developments Serbia’s GDP continued to expand in the first half of 2011, but there are signs that the recovery is stalling for now. With investment and exports as the main drivers, the estimated first-half year GDP growth (2¾ percent) was in line with previous projections. However, a large negative trade shock is percolating through the region, as reflected in a sudden drop-off in steel demand from regional trading partners. Labor shedding in the private sector has continued. While the public sector has maintained its (high) employment level, the private sector has shed about 20 percent of its jobs since 2008. With a significant number of jobs in companies that are dependent on subsidies, the official statistics may still not fully capture Serbia’s labor market malaise. Headline inflation has peaked, and the National Bank of Serbia (NBS) responded by reversing its policy stance. Headline inflation in April reached almost 15 percent, but has declined substantially since then on the back of a reversal of food price inflation, in turn supported by the good agricultural season and lower global commodity prices. The NBS reversed its policy stance in June, cutting the policy rate by 125 basis points in several steps, to 11¼ percent. The dinar had appreciated considerably earlier in the year supported by portfolio investments attracted by high dinar yields, but with increased tensions in the euro area, and in line with regional peers, it subsequently lost much of its previous gains. Amid substantial volatility in the foreign exchange market, but also increased trading volumes, the NBS conducted only modest foreign exchange interventions.

3
Program Summary The objectives of the new arrangement are to maintain macroeconomic and financial stability, while addressing key bottlenecks in the investment climate. To achieve these objectives, the program provides additional insurance against external downside risks. Serbia is still only partly integrated in the EU’s regional supply chain. Nevertheless, present trade links can quickly lead to a synchronized region-wide slowdown in trade that can hit Serbia’s exports hard. Serbia’s comfortable level of foreign exchange reserves, a flexible and competitive exchange rate, and relatively assuring indicators of bank funding risks may provide a sturdy first line of defense. Nevertheless, contagion risk from vulnerable regional economies is high, and the relatively large proposed access under the precautionary SBA is intended to reinforce Serbia’s financial buffers. The Stand-By Arrangement also aims at anchoring the new fiscal responsibility framework. During the brief interlude between the previous and the new proposed program, parliament adopted a populist fiscal decentralization law that transferred additional taxes equivalent to about 1¼ percent of GDP to local governments without devolving commensurate spending responsibilities. This was done over the explicit objections of the Fiscal Council, illustrating that the new fiscal rules remain open to political challenge. Thus, the SBA would serve as a commitment device to protect the fiscal responsibility framework. As far as concerns the mitigation of financial stability risks, the Stand-By Arrangement helps developing local financial markets to facilitate foreign exchange hedging and maintaining adequate liquidity and capital buffers in the banking system. In case a severe downside scenario materializes, the program would likely have to be adjusted to include a private sector involvement component, as under the previous Stand-By Arrangement. In coordination with other international financial institutions, the program also seeks to soften up key growth bottlenecks, using a targeted and realistic structural reform approach that focuses on areas where IMF staff has some expertise and where a critical mass of ownership can be mobilized.

4
Serbia: Selected Economic and Social Indicators, 2006–12
2006 2007 2008 2009 2010 2011
Proj.2012 Proj.
(Percent change, unless otherwise indicated)
Real GDP 3.6 5.4 3.8 -3.5 1.0 2.0 3.0
Real domestic demand (absorption) 4.8 10.2 4.9 -9.0 -2.2 1.4 1.4
Consumer prices (average) 12.7 6.5 12.4 8.1 6.2 11.3 4.3
Consumer prices (end of period) 6.6 11.0 8.6 6.6 10.3 7.9 3.5
Import prices (dinars, average) 15.3 -2.8 13.9 4.4 16.0 4.3 7.1
Nominal gross wage 23.2 22.4 17.8 -3.3 7.5 10.1 7.0
Real gross wage 10.4 14.5 4.8 -10.5 1.2 -1.0 2.5
Registered employment -3.4 -2.1 -1.7 -4.8 -5.2 -1.7 0.3
Unemployment rate (in percent) 21.6 18.8 14.7 17.4 20.0 22.2 22.4
Nominal GDP (in billions of dinars) 1,962 2,277 2,661 2,713 2,987 3,359 3,615 (Percent of GDP)
General government finances
Revenue 44.2 44.0 42.8 42.3 41.0 39.2 39.3
Expenditure 45.8 45.9 45.5 46.7 45.6 43.7 43.1
Current 41.1 40.5 40.9 42.5 41.1 39.5 39.2
Capital and net lending 4.6 5.4 4.6 4.2 4.5 4.2 4.0
Fiscal balance (cash basis) -1.6 -1.9 -2.7 -4.5 -4.6 -4.6 -3.9
Structural fiscal balance 1/ -3.5 -4.2 -6.3 -5.0 -3.8 -3.3 -2.3
Gross debt 43.0 35.6 34.2 38.2 44.9 44.1 44.5 (End of period 12-month change, percent)
Monetary sector
Money (M1) 37.1 25.3 -3.8 8.7 -2.2 9.3 13.6
Broad money (M2) 38.4 44.5 9.6 21.8 13.9 20.7 11.1
Domestic credit to non-government 17.1 36.9 35.0 15.9 29.0 10.8 14.3 (End of period, percent)
Interest rates (dinar)
NBS repo rate 14.0 10.0 17.8 9.5 11.5 … …
Deposit rate 5.1 4.1 6.4 5.1 5.6 … … (Percent of GDP, unless otherwise indicated)
Balance of payments
Current account balance -10.2 -15.9 -21.4 -7.1 -7.2 -7.6 -8.8
Exports of goods 22.0 22.4 22.7 20.7 25.7 26.6 28.5
Imports of goods 43.3 45.7 48.7 38.5 42.2 42.0 43.2
Trade of goods balance -21.4 -23.1 -26.0 -17.7 -16.5 -15.4 -14.7
Capital and financial account balance 32.0 18.4 16.7 11.1 2.8 7.6 7.2
External debt 63.3 61.8 66.7 79.4 82.2 75.3 70.1
of which: Private external debt 36.0 39.5 47.2 54.0 53.4 49.0 48.0
Gross official reserves (in billions of euro) 8.7 9.5 8.2 10.6 9.8 10.1 9.4
(In months of prospective imports) 6.6 6.3 7.7 8.6 7.0 6.5 5.8
(Percent of short-term debt) 294.5 268.4 162.3 200.7 186.2 158.8 137.1
(in percent of broad money, M2) 112.4 84.5 72.7 74.9 76.5 76.5 77.5
Exchange rate (dinar/euro, period average) 84.2 80.0 81.5 93.9 103.5 … …
REER (annual average change, in percent;
+ indicates appreciation) 8.0 9.6 6.5 -6.8 -7.8 10.5 1.0
Social indicators
Per capita GDP (in US$) 3,958 5,336 6,616 5,642 5,233
Population (in million) 7.41 7.38 7.35 7.32 … … …
Absolute poverty rate (in percent) 8.8 8.3 6.1 6.9 9.2 … …
Sources: Serbian authorities; and IMF staff estimates and projections.
1/ Fiscal balance adjusted for the automatic effects of the output gap both on revenue and spending.

Statement by Rene Weber, Executive Director for Republic of Serbia, and Srboljub Antic, Senior Advisor to Executive Director
September 29, 2011 On behalf of our Serbian authorities, we thank management and staff for supporting their request for a precautionary Stand-By Arrangement (SBA) in the amount of SDR 935.4 million (200 percent of quota). The arrangement will be instrumental for underpinning and strengthening sound macroeconomic management and for keeping Serbia’s fiscal and structural reform process on track. It thus guides and supports the transition to a more balanced growth model in the face of a deteriorating external environment of slower global growth and potential adverse regional spillovers. Amid such risks, ensuring longer term fiscal sustainability that preserves consumer and investor confidence will be crucial. The staff report accurately captures Serbia’s economic circumstances and charts a sensible and feasible course of policy action. The authorities highly value the staff’s constructive advice on how to address these challenges and share their views. Although the Serbian economy is expected to grow by two percent in 2011 and by three percent in 2012, driven by exports and private investment, this is unfortunately not sufficient to make a significant dent in the high unemployment rate above 20 percent. Fiscal policy will continue to be based on the fiscal responsibility framework. The fiscal gap of about one percent of GDP in 2011 will be closed mainly by expenditure reductions implemented through reassessing spending priorities. The prior action for program approval, i.e., the submission of a supplementary budget to parliament, has been met. A similar approach that should deliver savings of around two percent of GDP will be followed in 2012. The authorities will finance their near term financing requirements by the recent successful US$ 1 billion Eurobond placement. The authorities acknowledge that pension reforms, initiated with the introduction of a new indexation scheme and parametric reforms, must be further pursued. In line with efforts in other European countries, the option of increasing the effective retirement age will be discussed as a matter of priority. Labor market incentives will also be targeted to raise the number of contributors per pensioners. The monetary and exchange rate policies in place have served the country well. As the price shock from surging domestic and international food prices has worn off, a more benign inflation outlook emerged since May. These developments have allowed the National Bank of Serbia (NBS) to gradually loosen the policy stance. Inflation is expected to trend lower, possibly opening up room for further reductions in the policy rate. The NBS will remain vigilant to act, however, should inflation pressures resume.

2
Serbia’s banks are well capitalized and liquid due to cautious prudential policies pursued before and during the crisis. It is a priority for the NBS to continue aligning the regulatory framework for the banking sector with best international standards, and it intends to adopt the Basel II framework effective end-2011. Parliament has adopted reforms that will clarify and guarantee property rights in order to spur investment. They include easing regulations on converting construction land from public into private ownership. Also, a long awaited law on restitution establishes provisions for the use of in-kind restitution and financial compensation. Financial compensation is capped at six percent of GDP to protect the state’s financial position. Other structural reforms include the restructuring and privatization of the remaining public enterprises, while introducing stricter government scrutiny for non-privatized firms and preparing them for eventual privatization. The functioning of the labor market is to be improved by allowing more flexibility in work contracts and severance payments. Our Serbian authorities are aware of the considerable challenges related to program implementation in a pre-election period. They are ready to implement the agreed measures and are prepared—in close consultation with staff—to introduce further remedial ones if downside risks materialize.