reporting requirements, targets, and quotas for women in
TRANSCRIPT
1
Reporting Requirements, Targets, and Quotas for Women in Leadership
Victor E. Sojo a, b *
a Centre for Ethical Leadership, Ormond College, The University of Melbourne, 3052,
Australia [email protected]
b Melbourne School of Psychological Sciences, Faculty of Medicine, Dentistry and Health
Sciences, The University of Melbourne, 3010, Australia
* Corresponding author. Telephone: +61 3 9344 1404
Robert E. Wood a, c
c Australian Graduate School of Management, University of New South Wales, 2052,
Australia
a Centre for Ethical Leadership, Ormond College, The University of Melbourne, 3052,
Australia
Sally A. Wood d
d University of Sydney Business School, Sydney University, 2006, Australia
Melissa A. Wheeler a, e
a Centre for Ethical Leadership, Ormond College, University of Melbourne, 3052, Australia
e Melbourne Poche Centre for Indigenous Health, Faculty of Medicine, Dentistry and Health
Sciences, The University of Melbourne, 3010, Australia

2
Abstract
Reporting requirements, targets, and quotas have been implemented in several
countries to increase female representation in leadership. In three studies, we analyze the
effectiveness of these strategies from a goal-setting perspective. Study 1 evaluates the
relationship between reporting requirements and female representation on boards of directors
with data from Fortune 500 companies from 1996 to 2015. Study 2 analyzes the association
of reporting requirements, targets, and quotas with the representation of women on boards of
directors of public companies across 91 countries. Study 3 evaluates the impact of targets and
quotas for women in parliaments across 190 nations. The board diversity reporting directive
introduced in the US was followed by an acceleration in the increase of female representation
on boards of directors of Fortune 500 companies. Higher goals for women on boards of
directors were related to higher female representation. Similarly, higher gender goals and
strong enforcement mechanisms in parliaments were related to higher female representation.
Keywords: gender quotas; gender targets; leadership; parliament; boards of directors
© <2016>. This manuscript version is made available under the CC-BY-NC-ND 4.0 license
http://creativecommons.org/licenses/by-nc-nd/4.0/
The final version of this paper can be found in:
http://www.sciencedirect.com/science/article/pii/S1048984315001514
DOI: 10.1016/j.leaqua.2015.12.003
3
Introduction
Female participation in the labor force has consistently increased in the last sixty
years worldwide (Charles, 2011; International Labour Office, 2012). Most countries have
also closed the gap between men and women in health outcomes and educational attainment
(World Economic Forum, 2014). Women’s educational attainment has even surpassed that of
men in many industrial nations (Smith, 2014; Stevenson & Wolfers, 2009). Over the last four
decades, women have considerably increased their human capital (Dawson, Kersley, &
Natella, 2014), and gender desegregation has occurred in several higher education programs,
particularly in business, law, and medicine (Charles, 2011). Women’s accumulation of
human capital is one of the leading reasons behind women’s larger workforce participation
and for the reduction of the gender wage gap (International Labour Office, 2012).
However, the gap between men and women in the occupation of managerial roles and
political empowerment remains wide (World Economic Forum, 2014). The evidence
indicates that women rarely get appointed or elected into top leadership positions (European
Commission, 2012; McCann, 2013). By the end of 2014, on average across the world, only
10% of seats on boards of directors of public companies (BoardEx, 2015) and 20% of seats in
parliaments (Inter-Parliamentary Union - IPU, 2015) were occupied by women.
Tackling the issue: equal opportunity, supply-side, and demand-side strategies
Governments and organizations have taken many actions to reduce the gap between
the proportions of men and women in senior leadership roles (Klettner, Clarke, & Boersma,
2014; Meier & Lombardo, 2013). These actions include equal opportunity strategies,
opportunity enhancing strategies, reporting requirements, setting gender targets, and
introducing quotas.
Equal opportunity strategies were among the first actions taken to increase the
representation of women in male-dominated occupations. These practices have been enforced
4
through legislation that forbids discrimination against women and other demographic groups
(Harrison, Kravitz, Mayer, Leslie, & Lev-Arey, 2006). These regulations have been in place
in most industrialized nations for decades now (Jain, Sloane, Horwitz, Taggar, & Weiner,
2003). While equal opportunity legislation might have helped to increase the representation
of women in different occupational sectors (International Bank for Reconstruction and
Development, 2013; van der Meulen Rodgers, 1999), they have not yet successfully closed
the gap between men and women in leadership attainment.
In terms of political participation, legislation granting women the right to vote and
stand as candidates for government bodies has been in place in most of the industrialized
world since the first quarter of the 20th century (Terjesen, Aguilera, & Lorenz, 2015).
However, these legislative efforts to allow female political participation have failed to close
the gender gap in political leadership. The continuing low representation of women in
leadership roles has driven the development of more contemporary and active approaches.
Supply-side or opportunity enhancement strategies have been adopted in many
countries to supplement equal opportunity efforts (Harrison et al., 2006). These strategies,
including mentoring, targeted development, and networking, were developed in order to
increase the supply of women who are qualified or job-ready for senior leadership roles
(Bobocel, Son Hing, Davey, Stanley, & Zanna, 1998; Gilbert, & Stead, 1999). An increase in
the supply of qualified female candidates was expected to lead to a more equal gender
representation in leadership in organizations and government bodies (Hunt et al., 2009;
McDonald & Westphal, 2013).
However, the failure of supply-side strategies to produce acceptable growth in the
proportion of women in senior leadership roles has resulted in recommendations and, in some
countries, the adoption of demand-side strategies (Pande & Ford, 2011). These strategies

5
create a demand for female senior leaders to fill nominated roles. Demand-side strategies can
be broadly grouped into three categories:
(1) Reporting requirements entail disclosing the gender breakdown of senior
leadership roles in annual public reports of organizations (e.g., state owned companies,
publicly listed companies, and political parties). In some cases, organizations are also
required to indicate the strategies in place to increase female representation in leadership.
(2) Targets set goals for the expected percentage/number of women to either occupy
or be nominated for leadership positions, but with minimal or no enforcement mechanisms or
sanctions for failure to achieve the goal (Whelan & Wood, 2012).
(3) Quotas are government or industry mandated percentages of representation or
numbers of each gender in leadership positions paired with clear enforcement mechanisms
(e.g., close monitoring and application of financial or operational penalties on businesses or
political parties for noncompliance with the quota).
Demand-side strategies in the context of goal-setting research
Reporting requirements, targets, and quotas all focus attention and accountability on
outcomes, which in this case are the percentages of women in leadership roles. Targets and
quotas are forms of goal setting because they define a standard of expected achievement on a
specific criterion. Reporting requirements are a form of feedback because they provide
information on achievement against specified criteria. Laboratory and field studies about
academic achievement, sport competition, health behavior, and work performance have
shown that providing individuals with feedback on their problem-solving approaches helps
them to focus their attention on key aspects of the tasks and to develop strategies to improve
their performance (Ashford & De Stobbeleir, 2013). While reporting requirements do not
specify a standard to be attained, the feedback around specific criteria and social comparisons
of outcomes can motivate self-set goals and the desire to improve (Ashford & De Stobbeleir,

6
2013; Locke & Latham, 2013). Reporting requirements may also provide feedback on the
effectiveness of supply-side strategies organizations might have implemented.
In many countries, reporting requirements for gender diversity have been introduced
in order to incentivize organizations to increase female participation and representation
(Quota Project, 2015; World Economic Forum, 2014). Hypothesis 1 is that having reporting
requirements (versus not having reporting requirements) will lead to higher female
representation in leadership roles.
Goals that define specific standards against which individuals can compare their
performance have been shown to have consistent, positive effects on performance and the
achievement of relevant outcomes (Locke & Latham, 2002). Meta-analytic research has
shown that setting specific, attainable, and challenging goals motivates the development of
strategies that, in turn, lead to improvements in the targeted outcomes (Wood, Whelan, Sojo,
& Wong, 2013).
Goal challenge is a key aspect of this process. More ambitious goals are associated
with greater efforts to generate new strategies to meet the goal and the achievement of better
outcomes (Wood et al., 2013). Hypothesis 2 is that countries that set goals for higher
percentages of women in leadership using targets or quotas will achieve higher female
representation than countries only applying reporting requirements or countries without
demand-side strategies in place (Schwindt-Bayer, 2009).
The capacity of goals to produce improvements on the specified criteria depends upon
an individual’s acceptance of the goal and commitment to trying to achieve it (Locke &
Latham, 2013). The consequences of achieving or not achieving a goal can influence the
level of goal commitment. Challenging goals, particularly those that challenge conventions or
norms, are more likely to be rejected or ignored without some accompanying consequences.
Therefore, the level of enforcement of regulatory actions should impact the performance and
7
outcome. Targets and quotas both include assignment of specific goals, but the two strategies
differ in the consequences for failing to achieve the goals. Quotas are effectively targets with
enforcement strategies or sanctions for failure to achieve the goals. Hypothesis 3 is that goals
for representation of women in leadership that are set with clear accountability and
enforcement mechanisms (i.e., quotas) will be more effective in increasing female
representation than goals without enforcement mechanisms (i.e., targets).
Similarly, the amount of time since setting the goal should be related to the level of
progress made. The longer a country has had a demand-side strategy in place, the more likely
it is that actions have been implemented in order to achieve the goal. Additionally, women
appointed to leadership positions may become role models who motivate other women to put
themselves forward for leadership positions (Bhavnani, 2009; Schwindt-Bayer, 2009; Pande
& Ford, 2011). Therefore, Hypothesis 4 is that there will be a positive association between
the number of years since the introduction of a demand-side strategy and female
representation in leadership.
The current research
There is much evidence for arguments both supporting demand-side approaches (e.g.,
Epstein, Niemi, & Powell, 2005; Meier & Lombardo, 2013; Swers & Larson, 2005; Wang &
Kelan, 2013) and opposing them (e.g., Ahern & Dittmar, 2012; Gillespie & Ryan, 2012;
Leslie, Mayer, & Kravitz, 2014). The current research does not address the question of
whether it is fair or appropriate to implement demand-side strategies for women in
leadership. Instead, we are interested in the question of whether these strategies produce a
meaningful shift in the representation of women in two senior leadership roles: (1)
membership of boards of directors of publicly listed companies and (2) elected
representatives in national parliaments. Study 1 examines whether a diversity reporting
requirement, introduced by the U.S. Securities and Exchange Commission - SEC (U.S.
8
Securities and Exchange Commission, 2009), is related to changes in the proportions of
female directors in Fortune 500 companies. In Studies 2 and 3 we work with country level
data. Study 2 analyzes the relative impacts of reporting requirements, targets, and quotas on
the proportions of female directors of public companies. Study 3 evaluates if targets and
quotas with different attributes have differential impacts on female representation in
parliaments. The central question is whether enforced quotas are more effective than targets,
as targets prescribe a goal level but have no sanctions for failure to meet the goal. In addition,
we are interested in whether both targets and quotas are more effective than reporting
requirements that allow for, but do not require, self-set goals.
Study 1: Reporting requirements and female representation on boards of
directors in top performing companies
The central aim of Study 1 was to analyze if the board of directors’ diversity reporting
requirements, introduced by the U.S. Securities and Exchange Commission in 2010, was
followed by a significant increase in the representation of women on boards of directors of
Fortune 500 companies.
For publicly listed companies in the US, the appointment and removal of directors is
voted upon by the shareholders in a general meeting or through a proxy vote. This selection
process falls outside the Uniform Guidelines on Selection Procedures, a standard for
nondiscriminatory selection introduced in the U.S. in 1978 (U. S. Equal Employment
Opportunity Commission, 2011). The degree to which the processes to identify, screen,
select, and then nominate board directors aligns with the standards in the Uniform Guidelines
varies widely, as illustrated by two examples from the published corporate governance
guidelines of large, publicly listed companies (shown in Table S1 in the Supplemental
Materials). Example 1 describes a process that has little formal structure, no specified criteria
and no obvious attempts at impartiality or merit-based processes to identify and select new

9
directors. Example 2 describes a process that is more in line with the Uniform Guidelines.
Example 2 specifies criteria and details steps in the process. All other factors being equal, the
procedures described in Example 2 are expected to be less affected by potential biases that
disadvantage women in selection for senior leadership roles (Genat, Wood, & Sojo, 2012).
U.S. companies are now required to disclose if and how diversity, including gender
diversity, is considered in the nomination of board directors under a ruling by the SEC that
came into effect in 2010. Reporting requirements generate feedback, focus attention on
issues, and motivate the adoption of strategies for improvement. Following hypothesis 1, if
companies included gender as an attribute of diversity in their reporting, an increase in the
percentage of female directors in those companies would be expected. However, the SEC
ruling does not provide a definition of diversity. Instead, the SEC ruling states that
organizations may define diversity in any way they consider appropriate (U.S. SEC, 2009).
Companies might or might not consider gender in their reporting. It has been found that top-
ranked companies are more likely to define diversity in terms of experience than in terms of
demographic attributes (Dhir, 2015). If most top U.S. companies were to continue to focus on
diversity of experience, without attention to gender diversity (Dhir, 2015), it would be less
likely for reporting requirements to help to increase female representation on boards. Study 1
explores if there has been a substantial increase in the percentages of female directors of
Fortune 500 companies since the introduction of the SEC diversity reporting requirements.
Method
Data were obtained from the Catalyst organization, who conducted an annual census
of female representation on the boards of the Fortune 500 companies across 18 years,
between 1996 and 2013 (excluding 2000, 2002, and 2004). The data included company name,
number of women directors, total number of directors, and percentage of women directors for
each of the 15 years of the Catalyst survey (Catalyst, 2014a). To include the most recent data,

10
the authors also coded the total number of directors and number of female directors of the
2014 Fortune 500 (the latest available list of Fortune 500 companies at the time of writing
this study). These data were obtained from the official websites of the companies between
August and September 2015. Company names were normalized to deal with name changes,
mergers, and acquisitions. The full data set, including all companies that were in the Fortune
500 at some time between 1996 and 2015, contained 1137 companies (with a series ranging
from 1 to 16 data points depending on the number of years the company was in the Fortune
500 for which data were available). The full data set included a subsample of 170 companies
that were in the Fortune 500 across all 20 years from 1996 to 2015.
The overall time series was further broken down into industry sectors, using the North
American Industry Classification System (NAICS) from the U.S. Economic Classification
Policy Committee (2012). The companies were allocated into 8 industry categories using
information from their websites. When a company’s products and services covered a range of
industries, we categorized them in the industry of the largest division. The time series of
annual averages of percentages of female directors by industry sectors of the full sample of
companies, as well as for the 170 companies that have been in the top Fortune 500 for 20
years, are in Tables S2 and S3 in the Supplemental Materials.
Data analysis
The time series for the companies were analyzed using a general linear model. In this
model, time was used as a covariate; industry grouping and introduction of the reporting
requirements in 2010 were entered as two factors. Industry grouping was an 8-level factor
(i.e., warehouse and transport, mining and utilities, food processing, chemical and metals
manufacture, high level manufacture, retail and wholesale, information and professional
services, and finance and insurance). Introduction of the reporting requirements was a 2-level
factor (i.e., pre 2010; post 2010). Industry grouping was included as a control variable and it
11
was not used for interpretation. Predictions of the median percentages of women on boards
and the associated 95% confidence intervals until 2030 were then estimated, based on the
trend lines for pre and post introduction of the reporting requirement in 2010.
A plot of the data for all companies is shown in Figure S1 of the Supplemental
Materials. An analysis of residuals revealed that neither a linear nor a quadratic form
provided a good fit with the data for either the full data set of 1137 companies or for the 170
companies in the Fortune 500 for 20 years. A model with log transformations of both the year
and percentage of women (i.e., a log-log model) provided the best fit for both data sets (see
Supplemental Materials, Figures S2 and S3, for residual plots of the two samples).
While the analysis of the log-log model indicates if there is significant change in the
linear trend lines for the percentages of women on boards from before to after the
introduction of the reporting requirement, any inference regarding a change in the trend needs
to be qualified for two reasons. First is the small number of data points since the introduction
of the reporting requirements in 2010 (n=4), which increases the effects of any changes in the
percentage of women post 2010 and reduces the reliability of the estimates. Second is the fact
that the model requires us to specify the change point and fix it at the same year (i.e., 2011)
for all companies. In order to test the potential effects of these two qualifications, we also
conducted a Bayesian analysis that allowed the year of the change point for individual
companies to vary across the 20 years. The method and results for these analyses are reported
in the Supplemental Materials, and the resulting qualifications are mentioned below.
Results and discussion
Tests of the model, including the industry grouping and introduction of reporting
requirements and time as covariates, revealed a significant linear trend in the increasing
percentage of female directors over the 20 years, F (1, 6980) = 69.74, p < .001, and a
significant effect for the interaction of time and the change in reporting requirements, F (1,

12
6980) = 14.86, p < .001. The linear trend of changes in the percentages of women post 2010
is greater than that for the period up to the change in reporting requirements. There were
differences in the linear trends for the industry control variable and these differences varied
over time, which are not interpreted. The same patterns of results were observed for the 20-
year sample of 170 companies as for the full sample (see Supplemental Materials, Figure S4,
Table S4 and S5)
While the change in trend lines for the percentage increases of women on boards
following the introduction of the reporting requirements was significant, the actual
percentages of women on boards in 2015 may not be optimum. Therefore, it is of interest to
explore what might happen in the future. Figure 1 shows two trend lines for all companies in
the Fortune 500 for the period from 1996 to 2015 and the predictions, plus 95% confidence
intervals, until 2030. One prediction is based on the trend line from 1996 to 2010 and the
second for the 2011 to 2015 trend line. The equivalent graph for the subsample of 170
companies is shown in the Supplemental Materials in Figure S5. The overall pattern of results
is the same for both data sets, with some differences in magnitudes of the median percentage
of women and the range of likely outcomes in 2030. Of note in Figure 1, the median
percentage of women on boards in 2015 is 20.2%, which is predicted to increase to 25.6% in
2030 if the trend post 2010 were to continue for the next 15 years. However, the 95%
confidence intervals for that 2030 prediction range from 22% to 33%. If the trend based on
the data for the period 1996 to 2010 were to continue, the predicted median representation of
women in 2030 would be 18%.
(INSERT FIGURE 1 ABOUT HERE)
Consistent with the trend described above, over the 20 years from 1996 to 2015, there
has been a decrease in the number of companies without any female directors. Figure S6 in
13
Supplemental Materials shows a marked drop in the numbers of companies with no female
directors between 1996 and 2013, followed by a large drop in 2015.
These results indicate that there has been a change to the trend following the
introduction of the reporting requirements in 2010. However, the wide range of possible
outcomes must be considered in interpreting the practical significance of that change. Any
interpretation needs to include attention to the fact that changes in the percentages of women
on the boards may be different for individual companies. The Bayesian analyses allowing the
point of change to vary across companies are reported in Supplemental Materials (see
Bayesian Change Point model). The distribution of the most likely change points for
companies (Figure S7 of the Supplemental Materials) shows that increases in the percentage
of women on their boards occurred after 2010 for 27% of companies. For the remaining 73%,
increases began in the years before the reporting requirements.
Summary: The introduction of the SEC reporting requirements appears to have had an
impact on the rate of female directors appointed to the boards of Fortune 500 companies.
However, the potential policy implications of such a conclusion raises the question of how
confident one should be in making interpretations of the impact of the SEC reporting
requirements. Our conclusion is that, while the early signs are promising, not much can be
said until we see what happens in the years ahead. The change in reporting requirements was
followed by increases in female board appointments for some companies; yet many
companies experienced changes in their rates of female board appointments at times that
could not be linked to the SEC change in reporting requirements.
Additionally, the wide range of possible future outcomes suggests that the rate of
progress will depend upon whether companies are willing to implement strategies to increase
female representation, such as mentoring or targeted recruitment of female directors (Whelan
& Wood, 2012). We now turn our focus to the use of demand-side strategies; we will
14
examine in particular the effects of reporting requirements, targets, and quotas on the
percentages of female directors of publicly listed companies across multiple countries.
Study 2: Demand-side strategies and female representation on boards of
directors at the country level
In Study 1, we provided evidence for the impact of diversity reporting requirements
on the levels of female representation on boards of large companies in the USA. In Study 2,
we focus on cross-national data to evaluate the relation of demand-side strategies (i.e.,
reporting requirements, targets, and quotas) with the representation of women on boards of
directors of public companies.
Method
The countries for which we were able to obtain data varied for the different variables.
The smallest number of cases was for the key dependent variable, the percentages of female
directors for publicly listed companies in each country, for which we obtained data for 93
countries. Missing cases in other variables meant we had complete data for 91 countries. A
total of 21 countries had reporting requirements, targets, or quotas for the percentages of
female directors for public companies (see Table S6, in Supplemental Materials for details).
A data set was constructed from a variety of sources. Descriptions of the variables, data
sources, and the logic for their inclusion in the analyses are presented below.
Percentage of female directors on the boards of publicly listed companies was the
main dependent variable. It was the average percentage of women on the boards of directors
of companies per country. Data were obtained from the Gender Map website as of January
2015 (BoardEx, 2015) and represented the percentages of female directors in 2014.
Number of companies was the number of publicly listed companies that BoardEx
(2015) surveyed in each country to obtain the average percentages of female directors. This
was a control variable, as countries varied greatly in the number of companies surveyed.
15
Regulatory actions were categorized based on government legislation or requirements
of regulatory agencies in the different countries. Regulatory actions relating to female
directors were coded in one of four categories: (1) Quotas are legislated percentages of
representation or reserved seats for women on boards of directors with strong enforcement
(e.g., a company would be delisted if it did not comply with the quota). (2) Targets are
legislated percentages of women on boards of directors without enforcement mechanism. (3)
Reporting is a legislated requirement to disclose in an annual report the representation of
women on the board of directors and at other levels of leadership of the organization and, in
some cases, to describe the measures taken to increase the representation of women in
leadership. (4) The group with no action included all countries that had no regulatory
requirements that covered any of the three mechanisms listed above. This information (also
the goal level and the regulatory period, described below) was obtained from and checked
across Catalyst (2014b, 2014c, & 2014d), Davies (2011), the European Parliament (2012),
and the World Economic Forum (2014).
Goal versus no goal was a variable used to differentiate countries that had set a goal
for female representation on boards of directors (i.e., countries with targets or quotas) versus
countries that had not set a goal (i.e., reporting requirements only or no action).
Goal level was defined as the percentage of female directors specified for quotas or
targets in the regulatory requirements of each country. For countries with a numeric goal (i.e.,
Finland, India, and Israel specify 1 woman per board of directors), we used a board size of 9
members to compute the equivalent percentage goal level. This was based on reports that
most boards of directors had a size between 7 and 12 directors, with a mean between 9 and 10
members (e.g., Cheng, 2008; Coles, Daniel, & Naveen, 2008; Horstmeyer, 2011).
Regulatory period was based on the number of years between enactment of the quota,
target, or reporting requirement and 2014 (i.e., the year when the data on women’s

16
representation on boards of directors were obtained). For countries with no quota, target, or
reporting requirement, the regulatory period was zero.
Gross National Income (GNI) was a measure of countries’ living standards. The GNI
for each country was obtained from the U.N. Development Programme (2014a, 2014b).
OECD referred to whether a country was or was not a member of the Organisation for
Economic Cooperation and Development (OECD). This was used as an index of overall
national development. The information was obtained from the OECD’s (2015) website.
Data analysis
The data from 91 countries were first subjected to correlation analysis between the
relevant variables (see Table 1). This was followed by an OLS hierarchical multiple
regression with the percentage of women on boards of directors as the dependent variable.
The first model included the number of companies surveyed in each country, OECD
membership, and log GNI as covariates. The second model included the control variables
plus dummy variables for regulatory action including reporting requirements, targets, and
quotas - using no regulatory action as the contrast category. A one-way ANOVA and Least
Significant Difference (LSD) post-hoc test were used to perform pairwise comparisons of the
effect of each regulatory action (i.e., reporting, targets, and quotas), against each other and
with no action, on the level of representation of women on boards of directors.
Results and discussion
Details of the different countries’ legislative and regulatory guidelines relating to
female directors are in Table S6 in the Supplemental Materials. A descriptive analysis of the
21 countries that have adopted reporting requirements, targets, or quotas for female directors,
shown in Table S6, reveals several unique features of the still developing data set, including:
(1) The 21 countries are a small subsample of the total 196 countries and account for 23% of
the 91 countries for which we obtained data on the percentages of female directors. (2)

17
Among the 21 countries, 8 have reporting requirements with no established goal. Of the 13
countries with a goal (i.e., target or quota), 3 (i.e., India, Israel, and Finland) have set a goal
of 1 female director, whereas Sweden has set the highest goal of 50%. (3) Sanctions to
companies for failure to meet the reporting requirements, targets, or quotas vary widely. For
example, no action, fines as little as US$790 or as much as €1m, publicly naming and
shaming, annulment of board appointments, and delisting. (4) Norway is the only country
with quotas that has passed the deadline when sanctions can be applied. (5) Norway, Iceland,
Finland, and Sweden, have the highest percentages of female directors and disproportionally
affect the averages for all countries with reporting requirements, targets, or quotas. The
average of 34% female directors for these four Nordic countries is almost double the 17.7%
for all countries in Table S6.
Table 1 shows the correlations, means, and standard deviations for the studied
variables for the full sample of 91 countries with complete data below the diagonal. The
equivalent set of statistics for the subsample of 20 countries with reporting requirements,
targets, or quotas are above the diagonal1. As all 20 countries in the subsample have taken
some level of action, there are no correlations for the dummy variable of no regulatory action
above the diagonal. For the full sample, percentages of women on boards were positively
correlated with all of the expected predictors, except reporting requirements and the standard
of living, as indexed by the GNI. OECD countries had higher percentages of women on
boards than non-OECD countries. Lack of regulatory actions was associated with a lower
percentage of women on boards. Using targets and quotas, having goals for female
representation (versus not having goals), goal level, and regulatory period, all had significant,
moderate sized, positive correlations with the percentage of women on boards.
1 Data about female representation on boards of directors of public companies in Rwanda
could not be obtained. Therefore, we only analyzed data from 20 countries with demand-side
strategies, instead of the original 21 countries.

18
In the subsample of countries using regulatory actions, the correlations between the
same variables were of a similar magnitude to those for the full sample, however, they failed
to reach significance. The exception was goal level, which was significantly related to the
percentage of women on boards. The correlations also indicated that relative to countries with
targets and quotas, those with reporting requirements had fewer women on boards of
directors (see Table 1, above the diagonal).
There were high correlations between features of the regulatory actions, in particular
the use of targets and quotas, with goal level and regulatory period (see Table 1). These
results were due to the 71 out of 91 countries that had not legislated any regulatory action
and, therefore, all had scores of 0 for regulatory action, 0% for goal level and 0 years for
regulatory period. The medium correlations between goal level and the use of targets and
quotas above the diagonal in Table 1 were due to the fact that 8 out of the 20 countries that
legislated reporting requirements, but not targets or quotas, had a goal level of 0%.
(INSERT TABLE 1 ABOUT HERE)
In summary, for the available data set, goal level, the regulatory actions, and
regulatory period were redundant predictors for the percentages of women on boards across
the full sample of 91 countries and across the subsample of 20 countries. Given that setting
regulatory actions was a prerequisite to establish a goal level and a regulatory period, we
used the regulatory actions as the primary predictors.
(INSERT TABLE 2 ABOUT HERE)
Table 2 shows the hierarchical multiple regression for the prediction of percentage of
women on boards. In Model 1, only OECD appeared as a significant predictor with a positive
association between membership and the representation of women on boards of directors (see
Table 2, Model 1). In Model 2, the coefficients for the control variables were not significant.
Among the regulatory actions, targets and quotas had significant coefficients; whereas

19
reporting requirements were not related to higher female representation on boards relative to
the contrasting categories of no regulatory action (see Table 2, Model 2). A one-way
ANOVA also indicated the presence of a significant difference between the categories of
regulatory actions in female representation on boards of directors, F (3, 89) = 5.99, p < .001
(see Supplemental Materials, Table S7). The LSD used as a post-hoc test indicated that
countries with targets and quotas had significantly greater percentages of female directors
than countries with no regulatory actions (see Table 3). There was no significant difference in
the representation of women on boards of directors when countries with reporting
requirements were compared against countries with no regulatory action.
(INSERT TABLE 3 ABOUT HERE)
Countries with reporting requirements had lower percentages of female directors than
countries with targets and countries with quotas, although the differences were not
significant. Also, there was no significant difference in the level of representation of women
on boards of directors between countries with quotas and countries with targets (see Table 3).
Figure 2 shows that regulatory actions were related to higher female representation, but only
when the actions included an assigned goal (i.e., targets or quotas).
(INSERT FIGURE 2 ABOUT HERE)
Summary: The results indicate that regulatory actions that set goals (i.e., targets and
quotas) are more effective at increasing female representation on boards of directors than
reporting requirements or having no demand-side strategy in place. Countries that have set
higher targets also have higher representation of women on boards. Similarly, the regulatory
period was positively associated with the representation of women on boards of directors.
The impact of strong enforcement regulations, when goals for representation of
women on boards of directors are set, cannot be fully tested given that Norway is the only
country that has gone through full enforcement of its quota. The case of Norway is further

20
analyzed in the general discussion. In Study 2, reporting requirements on their own were not
related to a substantial increase in female representation relative to having no regulatory
action. The data about targets and quotas currently available indicate that having a goal is the
key driver of higher female representation on boards of directors.
Study 3: Demand-side strategies and female representation in legislative bodies
at the country level
In Study 3, we turn our attention to women’s representation in legislative bodies. To
date, 74 countries have established targets or quotas for women in parliaments (see Table S8
in Supplemental Materials). Several characteristics of these countries and their regulatory
actions can be used to examine the representation of women in parliaments and the success of
quota systems to increase female representation in those legislative bodies.
The goal level for female representation varies across countries (e.g., Niger has a goal
of 10%, whereas Panama has a goal of 50%). When a country’s parliament has two houses,
the implementation of the quota system could be operating in both houses (e.g., Belgium and
Colombia) or only in one of them (e.g., Algeria). Also, within countries the goals set can be
different for each house (e.g., Afghanistan has goals of 17% for women in the upper house
and 27% in the lower house). Differences in the levels of the goal established across the
legislative bodies should lead to parallel levels of representation.
The level of the goal set for a target or quota is just one of the features of the goal that
could drive greater female representation. The focus of the goal might lead to different effects
too. In some countries there are goals for the number of seats that are reserved for women in
parliament (e.g., Burundi has a quota of 30% of seats reserved for women in both houses),
whereas in other countries the goal is for the list of candidates nominated for election (e.g., in
East Timor, 1 out of every 3 candidates on electoral lists must be female). Differences in the
focus of the goals are important because, all other things being equal (e.g., enforcement

21
mechanisms and goal level), reserved seats more directly relate to female representation in
parliament. That is, there is no guarantee that women will be voted in from the electoral lists
of nominees for parliament seats.
Some countries with quotas for nominations enforce a placement mandate so that
women are located in a winnable position in the list. This mandate prevents political parties
from placing women at the bottom end of their lists where they would have a lower chance of
winning (Baldez, 2004). However, a study of nomination quotas found that placement
mandates explained no significant variance in the representation of women in parliament
once the level and enforcement of the quota were accounted for (Schwindt-Bayer, 2009).
Beyond the level of the goal, the level of enforcement of the goal might influence the
outcome. Enforcement mechanisms refer to the procedures to guarantee that the goals of
representation of women in parliament or on nomination lists are met. These mechanisms
vary between countries. Some countries stipulate processes to guarantee that the reserved
seats are filled up with women. For example, Iraq has a goal of 25% reserved seats for
women. If not enough women are elected, unelected women with the most votes get allocated
seats until the goal of 25% has been met.
When the goals focus on lists of nominated candidates, enforcement mechanisms
include scrutiny of political parties’ nomination lists and other actions. For instance, in
Guyana there is an independent electoral commission that checks the lists of candidates to
verify that they comply with the required 33% of women. After verification, the commission
communicates with the parties to notify them of any breach, and finally rejects the list if it is
deemed noncompliant. In some countries there are weaker enforcement mechanisms (e.g., a
fine is given to parties that do not meet the quota for nomination, but the party still can
participate in the election); while in other countries there are no enforcement mechanisms
22
whatsoever. It is likely that more rigorous enforcement actions are more effective at
guaranteeing female representation in parliaments.
Similar to the analysis for women on boards of directors, it is expected that the longer
these regulatory mechanisms have been in place, the more likely it is that the countries have
developed proper processes and have set more ambitious goals. For instance, after achieving
more than 30% female representation (IPU, 2015), Mexico has moved from a goal of at least
30% of either gender in lists of candidates in 2002 to a goal of 40% in 2014 with stronger
enforcement mechanisms (Quota Project, 2015). The introduction of quotas might also lead
to a growing acceptance of the nominated female candidates by voters (Beaman,
Chattopadhyay, Duflo, Pande, & Topalova, 2009; Pande & Ford, 2011).
In Study 3 we will analyze the impact of the goal level for the percentage of female
representation, the level of enforcement, focus of the goal, and years since introduction of the
goal, on the representation of women in parliaments.
Method
The description of variables, sources used, and transformations performed follow.
Percentage of women in legislative bodies was the main dependent variable of the
analysis. This was the percentage of women in the lower and upper houses of the parliament
or congress in countries with bicameral systems - or in the single house in the case of
countries with unicameral systems. These data were obtained from the Inter-Parliamentary
Union - IPU (2015) database of female representation in parliaments across the world as of
January 2015.
Goal Level was the percentage of seats reserved for women in legislative bodies or
positions in the list of nominees for elections to legislative bodies. All data related to the
goals (i.e., level, focus, enforcement, period, houses, and number of seats or nominations)
were obtained from The International Institute for Democracy and Electoral Assistance
23
(International IDEA), the IPU and Stockholm University’s Global Database of Quotas for
Women, also known as the Quota Project (Quota Project, 2015). Other sources consulted
included the European Parliament (2011) and the World Economic Forum (2014).
Percentage of women elected relative to the goal level was a measure of how much of
the goal set in the quota was actually achieved in the election. This variable was calculated as
the ratio of the percentage of women elected to the goal level, multiplied by 100. This
variable was only relevant in legislative bodies that had set a target/quota.
Goal focus referred to the stage of the electoral process that targets or quotas were
aimed at. Goals could either be focused on the percentage of reserved seats for women in the
legislative body or the percentage of female candidates in the list of nominees for elections.
Enforcement level referred to the legislated actions taken when quotas for nomination
lists or reserved seats were not met. The enforcement levels were classified in four groups
based on the descriptions of legislations in the Quota Project (2015) and following previous
studies (e.g., Dahlerup & Freidenvall, 2005; Schwindt-Bayer, 2009): (1) No action: countries
that did not have a quota. (2) No enforcement: legislative bodies that did not stipulate any
penalty for parties that did not comply with the nomination list quota and no compensatory
mechanism when the reserved seats for women were not filled. (3) Weak enforcement:
houses that imposed a small penalty on the party for not complying with the quota regulation
(e.g., monetary fines, reduced budget allocated for campaigning or having to explain why
they did not comply with the quota) but that still allowed the party to present the list of
candidates for the election. (4) Strong enforcement: houses that guaranteed that the number of
reserved seats for women in parliament were filled and houses that had independent electoral
bodies to evaluate if the lists of nominees complied with the quota regulations and rejected
the lists of nominees when they did not (i.e., the party was not allowed to run when it did not
comply with the quota of female candidates). Goals with enforcement mechanisms were
24
referred to as “quotas”. Without enforcement mechanisms, quotas effectively became a
recommendation, and were referred to as “targets”.
Regulatory period was the number of years between the date the legislation for targets or
quotas was adopted and the last election since the legislation was adopted. Countries that had
not had an election under quotas were allocated a zero in the number of years.
House was based on whether a country had a bicameral parliamentary system with a
lower and upper houses or a unicameral system with a single house.
Number of seats was the total number of seats contested in the election considered.
Gross National Income (GNI) and OECD were the same indices described in Study 2.
A country was deleted from the analysis when: (1) it did not have a democratically
elected parliament or (2) the current representation of women was not reported in the cited
sources. There were data for 260 legislative bodies, when data for lower and upper houses
were included. When GNI was used in the analyses; missing cases reduced the sample to 255.
Data analysis
The data for this study had a multilevel structure, with legislative bodies (level-1)
nested within countries (level-2). We first computed legislative body-level correlations
between the relevant variables (see Table 4). Country-level correlations are in Table S9 in the
Supplemental Materials. Two sets of full maximum likelihood (FML) multilevel models were
also tested. In the first set of models, the percentage of women elected to parliaments was the
dependent variable. A null or intercept-only model was calculated first to identify the
appropriateness of multilevel analysis, based on the intra-class correlation and the
significance of country-level variance. Model 1 was computed including the control variables
(i.e., legislative body and the number of seats contested in the last election were entered as
level-1 predictors, and the two indicators of the level of development of the country, OECD
membership and log GNI, were entered as level-2 predictors). Model 2 added the main
25
predictors. Goal level, goal focus, enforcement level, and regulatory period were used as
level-1 predictors for the percentage of women in each legislative body. In the second set of
models, the percentage of women elected as a proportion of the goal level was used as the
dependent variable. For these analyses, the null model and Model 1 had the same structure
and variables used to predict the percentage of women in legislative bodies, described above.
However, Model 2 added goal focus, enforcement level, and regulatory period as level-1
predictors. Formulas describing the models are in Table S10 in the Supplemental Materials.
In both sets of multilevel models, null model likelihood ratio tests (LR X2) were used
to assess if Model 1 and Model 2 predicted the dependent variables better than what would be
expected by chance (Tabachnick & Fidell, 2007). Akaike’s Information Criterion, AIC, was
used to compare the models. A lower AIC indicates better fit (Hox, 2010). Finally, we used
the variance explained by the level-1 predictors in the dependent variables (i.e., η2 = σ2 null –
σ2 random / σ2 null) as an effect size measure (Kreft & DeLeeuw, 1998).
Results and discussion
The descriptive data for the 74 countries that had introduced goals for nominations or
seats for women in parliament are in Table S8 in the Supplemental Materials. Only 64 of
these countries have had a parliamentary election after introducing their targets/quotas and
could be analyzed in this study as being under the influence of these demand-side strategies.
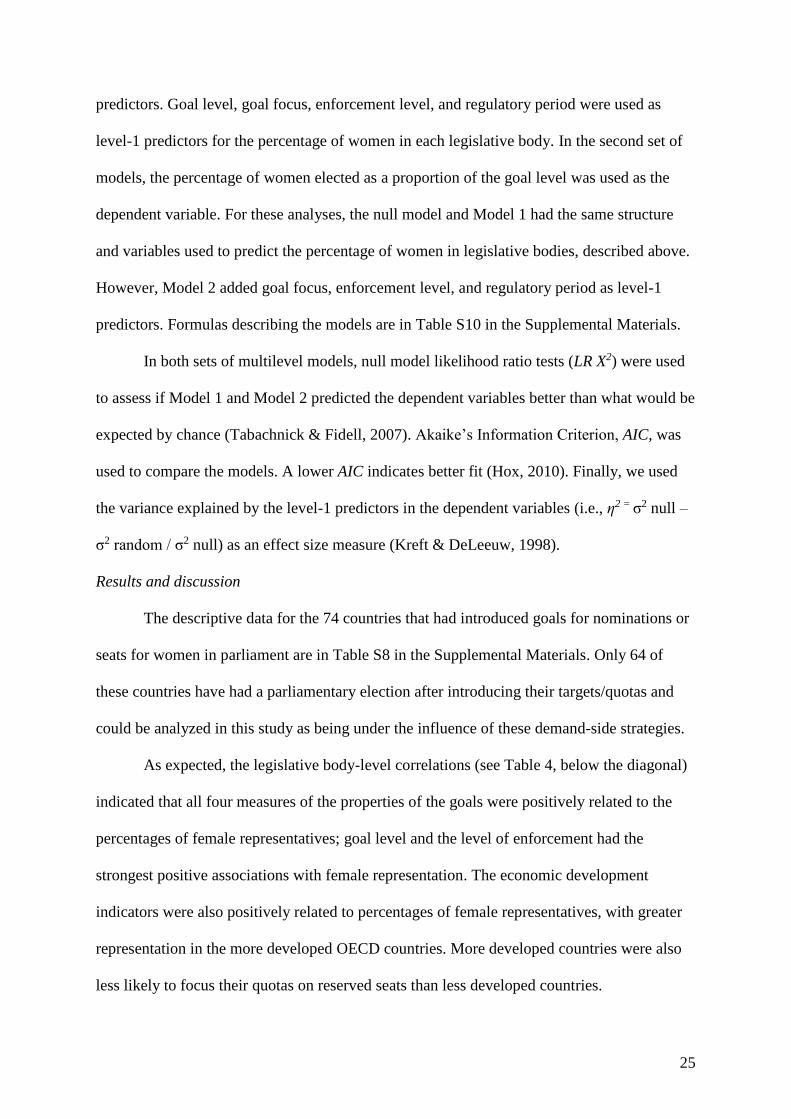
As expected, the legislative body-level correlations (see Table 4, below the diagonal)
indicated that all four measures of the properties of the goals were positively related to the
percentages of female representatives; goal level and the level of enforcement had the
strongest positive associations with female representation. The economic development
indicators were also positively related to percentages of female representatives, with greater
representation in the more developed OECD countries. More developed countries were also
less likely to focus their quotas on reserved seats than less developed countries.
26
(INSERT TABLE 4 ABOUT HERE)
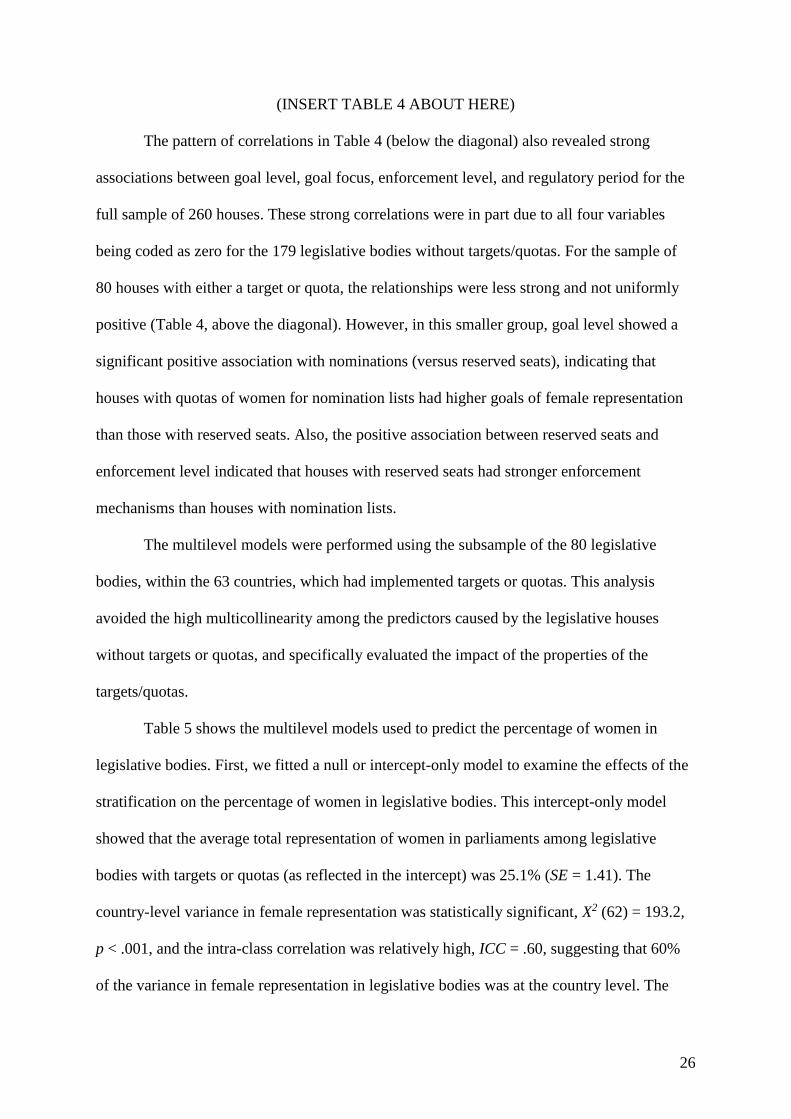
The pattern of correlations in Table 4 (below the diagonal) also revealed strong
associations between goal level, goal focus, enforcement level, and regulatory period for the
full sample of 260 houses. These strong correlations were in part due to all four variables
being coded as zero for the 179 legislative bodies without targets/quotas. For the sample of
80 houses with either a target or quota, the relationships were less strong and not uniformly
positive (Table 4, above the diagonal). However, in this smaller group, goal level showed a
significant positive association with nominations (versus reserved seats), indicating that
houses with quotas of women for nomination lists had higher goals of female representation
than those with reserved seats. Also, the positive association between reserved seats and
enforcement level indicated that houses with reserved seats had stronger enforcement
mechanisms than houses with nomination lists.
The multilevel models were performed using the subsample of the 80 legislative
bodies, within the 63 countries, which had implemented targets or quotas. This analysis
avoided the high multicollinearity among the predictors caused by the legislative houses
without targets or quotas, and specifically evaluated the impact of the properties of the
targets/quotas.
Table 5 shows the multilevel models used to predict the percentage of women in
legislative bodies. First, we fitted a null or intercept-only model to examine the effects of the
stratification on the percentage of women in legislative bodies. This intercept-only model
showed that the average total representation of women in parliaments among legislative
bodies with targets or quotas (as reflected in the intercept) was 25.1% (SE = 1.41). The
country-level variance in female representation was statistically significant, X2 (62) = 193.2,
p < .001, and the intra-class correlation was relatively high, ICC = .60, suggesting that 60%
of the variance in female representation in legislative bodies was at the country level. The

27
ICC and significance of country-level variance indicated that a multilevel approach was
appropriate for the analysis of these data. Model 1, with the control variables, showed that
OECD was the only significant positive predictor; countries in the OECD had more women
in their legislative bodies (see Table 5). The null model likelihood ratio test indicated that
Model 1 did not explain a substantial amount of variance in female representation relative to
the null or intercepts only model, LR X2 (4) = 4.39, p = .36, which is consistent with its η2
close to zero and a AICModel 1 = 620.4, higher than the null model’s AICnull = 616.8.
(INSERT TABLE 5 ABOUT HERE)
Model 2 incorporated the key predictors of interest (see Table 5). Goal level and
enforcement level were the only significant predictors. Legislative bodies with higher goals
in their gender targets or quotas and stronger enforcement mechanisms had higher female
representation. Figure 3 shows the effects for goal levels. Model 2’s AIC = 598.9 is lower
than the AIC for the null model. Similarly, the null model likelihood ratio test indicated that
Model 2 explained a substantial amount of variance in female representation relative to the
null or intercepts only model, LR X2 (8) = 33.97, p < .001. Finally, an η2 = .18 indicated that
18% of the variance in female representation in legislative bodies was explained by the
variables in Model 2.
(INSERT FIGURE 3 ABOUT HERE)
Table 6 presents the multilevel models used to predict the percentage of women in
legislative bodies relative to the goal level in their targets/quotas. The same analytical
procedure described above was followed here. First, the intercept-only model showed that the
average level of achievement of the target/quota of representation of women in parliament as
reflected in the intercept was 84.3% (SE = 4.42). The country-level variance in achievement
of target/quota was statistically significant, X2 (62) = 170.1, p < .001, and the intra-class
correlation was relatively high, ICC = .56, suggesting that 56% of the variance in female
28
representation in legislative bodies was at the country level. The ICC and significance of
country-level variance indicated that a multilevel approach was also appropriate for the
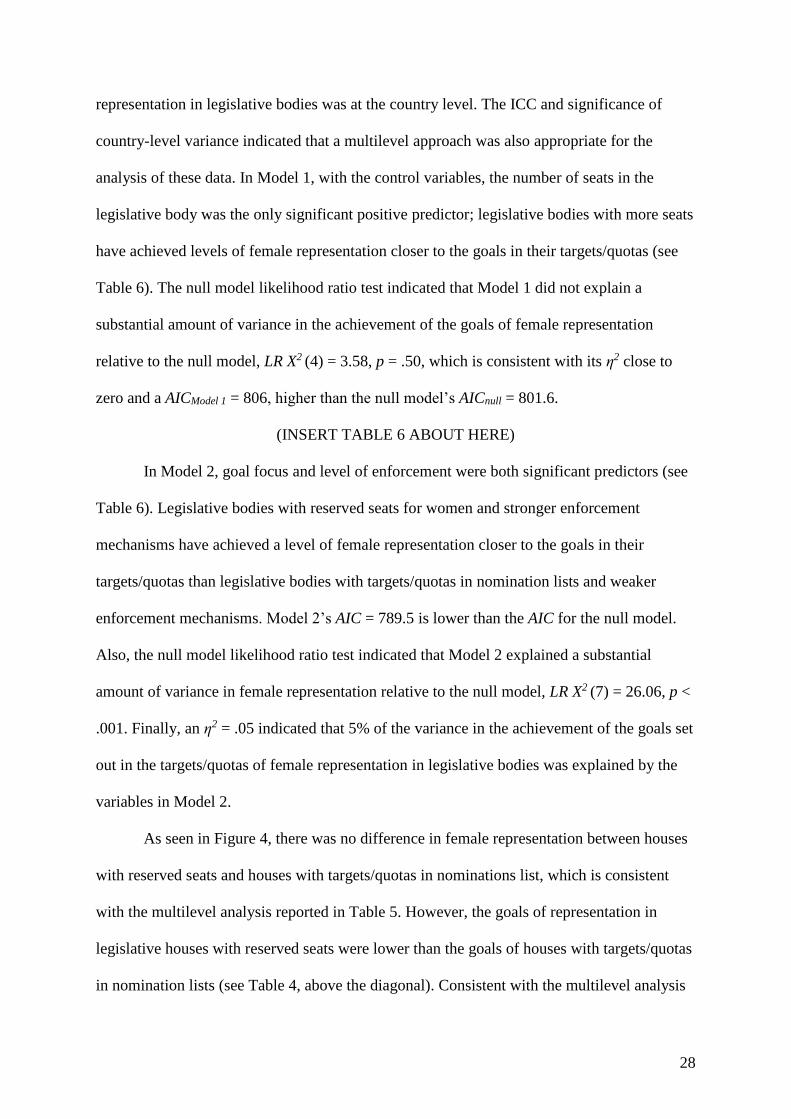
analysis of these data. In Model 1, with the control variables, the number of seats in the
legislative body was the only significant positive predictor; legislative bodies with more seats
have achieved levels of female representation closer to the goals in their targets/quotas (see
Table 6). The null model likelihood ratio test indicated that Model 1 did not explain a
substantial amount of variance in the achievement of the goals of female representation
relative to the null model, LR X2 (4) = 3.58, p = .50, which is consistent with its η2 close to
zero and a AICModel 1 = 806, higher than the null model’s AICnull = 801.6.
(INSERT TABLE 6 ABOUT HERE)
In Model 2, goal focus and level of enforcement were both significant predictors (see
Table 6). Legislative bodies with reserved seats for women and stronger enforcement
mechanisms have achieved a level of female representation closer to the goals in their
targets/quotas than legislative bodies with targets/quotas in nomination lists and weaker
enforcement mechanisms. Model 2’s AIC = 789.5 is lower than the AIC for the null model.
Also, the null model likelihood ratio test indicated that Model 2 explained a substantial
amount of variance in female representation relative to the null model, LR X2 (7) = 26.06, p <
.001. Finally, an η2 = .05 indicated that 5% of the variance in the achievement of the goals set
out in the targets/quotas of female representation in legislative bodies was explained by the
variables in Model 2.
As seen in Figure 4, there was no difference in female representation between houses
with reserved seats and houses with targets/quotas in nominations list, which is consistent
with the multilevel analysis reported in Table 5. However, the goals of representation in
legislative houses with reserved seats were lower than the goals of houses with targets/quotas
in nomination lists (see Table 4, above the diagonal). Consistent with the multilevel analysis

29
reported in Table 6, Figure 4 shows that legislative bodies that reserved seats for female
candidates were more likely to meet or surpass their female representation goal relative to
houses with targets/quotas in nomination lists. Also, legislative bodies with stronger
enforcement mechanisms had levels of female representation closer to their goals than houses
with weak or no enforcement mechanism in place. Figure 4 shows that all the houses with
reserved seats for women in parliaments had strong enforcement mechanisms for their
quotas. Among the houses with targets/quotas for nomination lists, even with similar average
goal levels, those houses with stronger enforcement mechanisms had levels of female
representation closer to their goals. Descriptive statistics of female representation and goal
level by goal focus and enforcement level are in Table S13 in the Supplemental Materials.
(INSERT FIGURE 4 ABOUT HERE)
Summary: The results highlighted the importance of two characteristics of demand-
side strategies to increase female representation in legislative bodies; the level of the goal set
and the strength of the enforcement mechanisms for quotas. Countries with lower goals but
stronger enforcement mechanisms achieved similar levels of female representation to
countries with higher goals but weaker enforcement mechanisms. In particular, reserving
seats for women in parliament was associated with stronger enforcement mechanisms, which
in turn was related to higher female representation. Importantly, these associations were
independent of how long the quota had been in place and the level of development of the
country - both of which were positively related to female representation in parliaments.
General discussion
The focus of the current studies was on the demand-side strategies of reporting
requirements, targets, and quotas and their relationships with levels of female representation
in senior leadership roles. We used three data sets, including one at the company level (Study
1) and two at the country level (Studies 2 and 3). To our knowledge, no previous research has
30
compiled the type and range of industry and country level data on which our analyses were
based. We discuss and qualify the evidence for each of the four hypotheses presented in the
Introduction, followed by a discussion of the limitations of the present studies and directions
for future research.
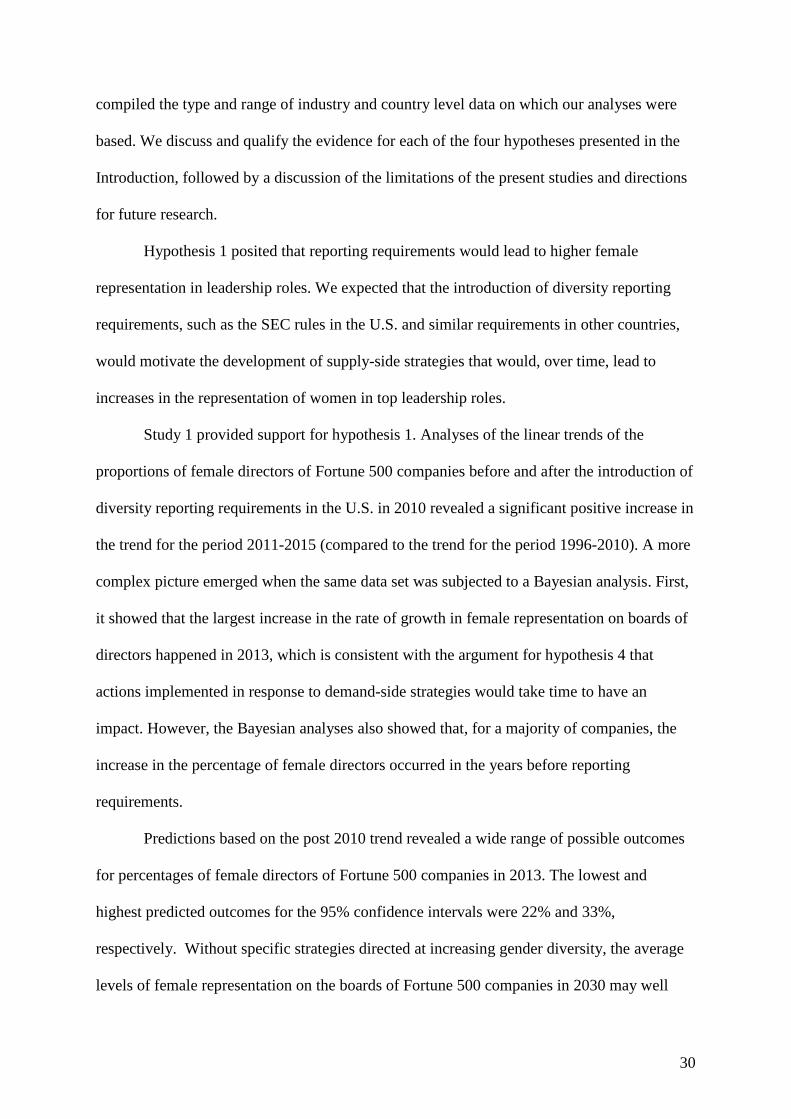
Hypothesis 1 posited that reporting requirements would lead to higher female
representation in leadership roles. We expected that the introduction of diversity reporting
requirements, such as the SEC rules in the U.S. and similar requirements in other countries,
would motivate the development of supply-side strategies that would, over time, lead to
increases in the representation of women in top leadership roles.
Study 1 provided support for hypothesis 1. Analyses of the linear trends of the
proportions of female directors of Fortune 500 companies before and after the introduction of
diversity reporting requirements in the U.S. in 2010 revealed a significant positive increase in
the trend for the period 2011-2015 (compared to the trend for the period 1996-2010). A more
complex picture emerged when the same data set was subjected to a Bayesian analysis. First,
it showed that the largest increase in the rate of growth in female representation on boards of
directors happened in 2013, which is consistent with the argument for hypothesis 4 that
actions implemented in response to demand-side strategies would take time to have an
impact. However, the Bayesian analyses also showed that, for a majority of companies, the
increase in the percentage of female directors occurred in the years before reporting
requirements.
Predictions based on the post 2010 trend revealed a wide range of possible outcomes
for percentages of female directors of Fortune 500 companies in 2013. The lowest and
highest predicted outcomes for the 95% confidence intervals were 22% and 33%,
respectively. Without specific strategies directed at increasing gender diversity, the average
levels of female representation on the boards of Fortune 500 companies in 2030 may well
31
remain at the lower end of the predicted range - particularly if companies impose implicit
quotas of one or two women to satisfy gender diversity requirements, as has been shown for
senior management positions (Dezső, Ross, & Uribe, 2015).
The results of Study 2 showed that the female representation on boards of directors is
not significantly higher for countries with reporting requirements versus countries with no
demand-side strategies. However, in all countries except Denmark, the reporting
requirements have been introduced since 2012. Any company strategies developed in
response to reporting requirements might need more time to have a significant impact.
Reporting can also have indirect, longer-term effects by stimulating discussion and public
debate about strategies for increasing the representation of women in leadership.
Hypothesis 2 indicated that the level of the goal in a target or quota would be related
to the level of female representation on boards of directors and in legislative bodies. This
hypothesis was supported in Studies 2 and 3. Countries with higher goals for women on
boards of directors had a higher proportion of female directors. Higher goals for either
nomination lists or reserved seats in parliaments were related to higher representation of
women in these legislative bodies. These relationships remained after controlling for the level
of economic development and living standards of the country.
Hypothesis 3 predicted that goals for female representation that were accompanied
with clear accountability and enforcement mechanisms (i.e., quotas) would be more effective
in increasing female representation than goals that were set without enforcement mechanisms
(i.e., targets). Hypothesis 3 was not supported for boards of directors (Study 2) but was
supported for parliamentary representation (Study 3). In Study 2, there was not a significant
difference in female representation on boards of directors between countries that had set
gender targets and countries that had set quotas. However, of all the countries that had
implemented quotas, only Norway had reached the deadline for compliance and, therefore,
32
was the only country where enforcement mechanisms had been tested and applied. Limited
evidence for the hypothesis that quotas are more influential than targets comes from Norway
where the introduction of a 40% target in 2003 did not achieve the expected results until after
2005 when the target was converted to a quota through the introduction of stronger
enforcement mechanisms (Teigen, 2011). Another case example was Sweden, where major
increases in the percentages of female directors had occurred with targets, but it has been
argued that the increase was the result of the threat of stronger penalties if companies did not
make efforts to achieve the targets (European Parliament, 2012). Further evidence on the role
of enforcement mechanisms that differentiate targets and quota will be available in 2018
when the deadlines for meeting quotas are reached in several other countries.
Norway is the most often cited case of gender quotas for boards of directors and is,
therefore, worthy of further attention. In Norway, only ASAs (i.e., public limited liability
companies) had to comply with a 40% gender quota for their board of directors by 2008. Of
the 562 companies that were ASAs when the quota legislation was passed, only 179 remained
by 2008 (Bertrand, Black, Jensen, & Lleras-Muney, 2014). ASAs can be listed or non-listed;
the latter being primarily partnerships and companies with small ownership groups, such as
families. The number of non-listed ASAs declined by 56% from 2001 to 2009, while the
number of listed ASAs increased by 6% in the same period of time (Bøhren & Staubo, 2014).
This 56% decline in non-listed ASA companies was due to their transition into ASs (i.e.,
limited liability companies), which do not have to comply with the gender quota and other
government regulations.
The rate of non-listed ASAs transforming into ASs has been interpreted to be driven
by the introduction of the gender quota - particularly because those companies with fewer
women on their boards were more likely to become ASs (Ahern & Dittmar, 2012; Bøhren, &
Staubo, 2014). While the increased female representation of women on boards of directors
33
has been accepted and become normalized in ASA companies, the Norwegian experience
also highlights potential unintended consequences of imposing quotas. Research about
occupational gender discrimination has highlighted how the association between leadership
and masculinity is entrenched in social conventions (Heilman, 2001). Having approximately
half of the public stock companies in a country becoming private limited companies (an
organizational form with fewer government regulations) to avoid compliance appeared as an
unintended consequence of the Norway legislation (Bøhren & Staubo, 2014).
In Study 3 we found that countries that had stronger goal enforcement had higher
female representation in parliaments. Countries where goals for lists of nominations or
reserved seats were strictly enforced had a larger representation of women in parliament than
countries where there was no enforcement when the goal was not reached. Contrary to our
expectation, we found similar levels of female representation in parliaments of countries with
reserved seats and in countries with goals for lists of nominees. However, goal focus was
partially confounded with goal level and enforcement mechanisms in that countries with
reserved seats had lower goal levels but stronger enforcement mechanisms, relative to
countries with quotas for nominations, which had higher goals but weaker enforcement. To
the degree that governments and political parties are willing to set and enforce goals for
female representation in houses of parliaments, the focus on nominated lists of candidates is
more likely to be politically, and perhaps legally, acceptable than reserved seats in most
democracies. Even quotas for nomination lists can face legal challenges, as originally
observed in France and Venezuela (Quota Project, 2015).
Gender quotas, when introduced, are more likely to be focused on nomination lists.
Bjarnegård and Zetterberg (2014) attribute this to the use of gender quotas to integrate
women in the whole political system and allow them to be treated in the same way as their
male counterparts. In contrast, quotas for ethnic minorities are more likely to apply to

34
reserved seats or new constituencies with the aim of giving them more autonomy and self-
determination to protect their group specificity (Bjarnegård & Zetterberg, 2014).
As a closing remark around enforcement mechanisms, it is important to keep in mind
that companies and political parties might employ a range of strategies to avoid complying
with weakly enforced goals. For instance, with weak enforcement mechanisms, political
parties sometimes put women at the bottom of lists on ballot papers or nominate them for
seats that are unlikely to be won by the party (McCann, 2013; Zetterberg, 2008). The lengths
that people might go to avoid goals for female representation is illustrated by the Norwegian
companies that presumably preferred to become private rather than comply with the board
quota (European Parliament, 2012). Targets and quotas often generate negative responses and
efforts to avoid them. If targets and quotas are not effectively enforced or if key stakeholders
are not motivated to comply, the desired female representation is less likely to be achieved.
Hypothesis 4 predicted a positive relationship between the number of years the
demand-side strategy had been in place and the level of female representation in leadership
roles. In Studies 2 and 3, the years since the introduction of the demand-side strategy and
female representation were positively associated, though only when the whole data sets were
analyzed. These associations were non-significant when only countries with demand-side
strategies in place were studied. In Study 3, length of the regulatory period was not a
predictor of female representation once goal level and strength of enforcement were
controlled for. One interpretation is that demand-side strategies can be effective in the short
term with strong enforcement mechanisms - even if they include a challenging goal.
Limitations and future research
The current studies provide a clearer picture of the global roles of reporting
requirements, targets, and quotas than previous country-by-country analyses. However, this is
an evolving picture - particularly in relation to companies, as few countries have reached the

35
deadlines for meeting quotas, and many of the targets have only been in operation for a few
years. Also, few countries have adopted reporting requirements, targets, or quotas. If more
countries were to introduce demand-side strategies, a different picture might emerge.
Several research questions, cutting across different research disciplines, are raised by
the current research. The current studies do not allow strong causal inferences regarding the
direction of observed effects or the ruling out of alternative explanations. One question is:
why do countries adopt targets or quotas? Potential explanations include historical, cultural,
legal, and political factors. Terjesen et al. (2015) have found that quotas for women on boards
of directors are more likely to be implemented in countries with histories of gender equality
initiatives, support for women’s participation in the labor market (e.g., generous parental
leave), and left-leaning partisan government coalitions. For example, in Nordic countries
where there has been greater equality between men and women than most other countries
over a long period of time, female parliamentary representation is around 40%. Many
political parties have set their own quotas, targets, or recommendations for female candidates
(Krook, Lovenduski, & Squires, 2009). Political unrest might also be a catalyst for the
implementation of quotas (Bauer & Burnet, 2013). Targets and quotas for women in
parliament are more common in regions with histories of political unrest in the last half of the
20th century, such as Africa (where 45% of countries have targets or quotas) and Central and
South America (73% of countries), than in more politically stable regions such as North
America and the Caribbean (18% of countries) and Europe (32% of countries).
More research about both intended and unintended outcomes of the use of demand-
side strategies is necessary. For instance, it has been argued that in Norway, the use of quotas
for women on boards has led to the same group of women being appointed to several
different boards (Seierstad & Opsahl, 2011). However, this so-called “Golden Skirts”
phenomenon has not been observed in Italy (Profeta, Aliberti, Casarico, S’Amico, & Puccio,
36
2014). With more countries using demand-side strategies, researchers will have the
opportunity to explore how cultural factors can explain the nature of the demand-side
strategies adopted, the barriers faced, the facilitating factors, the effectiveness, and the
unintended consequences of these strategies.
More longitudinal field studies about how people react to women selected under
targets and quotas are necessary. The experimental research in this area is vast (see Harrison
et al., 2006). However, there are several factors at play in the real world of politics and
business that could moderate the reactions towards women selected under targets or quotas
(e.g., women and men’s educational and professional attainment and performance, political
orientation in the country, history of support for gender equality, and political revolutions).
Also requiring further research, particularly in countries such as the USA where
targets and quotas are unlikely to be adopted, are the processes by which women are
identified and nominated for election to director roles. The Uniform Guidelines in the USA
are not prescribed for the processes by which new directors are identified and nominated for
election by shareholders. Of interest is whether differences in those processes between
companies, and the degree to which they include requirements spelled out in the Uniform
Guidelines, make a difference to the numbers of female directors on boards.
Conclusions
The results of the current set of studies point to the following conclusions. First, there
is some support for the notion that a requirement to report on diversity is related to the
appointment of more women to company directorships. Targets and quotas were more clearly
associated with higher female representation on boards of directors and in parliaments.
Countries, companies, and political parties seeking to increase female representation should
consider quotas or targets with strong enforcement mechanisms and be mindful of the fact
that, as in most areas of endeavor, the level of representation achieved will be directly related
37
to the level of challenge in the goal set and how much the goal has been accepted by the key
stakeholders. In particular, the evidence indicates that to increase the representation of
women in senior leadership it might be necessary to accompany any demand-side strategies
with equal opportunity and supply-side strategies.
References
Ahern, K. R., & Dittmar, A. K. (2012). The changing of the boards: The impact on firm
valuation of mandated female board representation. Quarterly Journal of Economics,
127, 137-197. doi:10.2139/ssrn.1364470
Ashford, S. J., & De Stobbeleir, K. E. M. (2013). Feedback, goal setting, and task
performance revisited. In E. A. Locke & G. P. Latham (Eds.), New directions in goal
setting and task performance (pp. 51-64). San Francisco: Routledge.
Baldez, L. (2004). Elected bodies: The gender quota law for legislative candidates in Mexico.
Legislative Studies Quarterly, 29, 231-258. doi: 10.3162/036298004X201168
Bauer, G., & Burnet, J. E. (2013). Gender quotas, democracy, and women's representation in
Africa: Some insights from democratic Botswana and autocratic Rwanda. Women's
Studies International Forum, 41, 103-112. doi:10.1016/j.wsif.2013.05.012
Beaman, L., Chattopadhyay, R., Duflo, E., Pande, R., & Topalova, P. (2009). Powerful
women: Does exposure reduce bias? The Quarterly Journal of Economics, 124, 1497-
1540. doi:10.1162/qjec.2009.124.4.1497
Bertrand, M., Black, S. E., Jensen, S., & Lleras-Muney, A. (2014). Breaking the glass
ceiling? The effect of board quotas on female labor market outcomes in Norway (No.
w20256). National Bureau of Economic Research. doi: 10.3386/w20256
Bhavnani, R. (2009). Do electoral quotas work after they are withdrawn? Evidence from a
natural experiment in India. American Political Science Review, 103, 23-35.
doi:10.1017/S0003055409090029

38
Bjarnegård, E., & Zetterberg, P. (2014). Why are representational guarantees adopted for
women and minorities? Comparing constituency formation and electoral quota design
within countries. Representation, 50, 307-320. doi:10.1080/00344893.2014.951171
BoardEx. (2015). Gender map. [Data File]. Retrieved from http://www.gender-map.com/
Bobocel, D. R., Son Hing, L. S., Davey, L. M., Stanley, D. J., & Zanna, M. P. (1998).
Justice-based opposition to social policies: Is it genuine? Journal of Personality &
Social Psychology, 75, 653-669. doi: 10.1037/0022-3514.75.3.653a
Bøhren, Ø., & Staubo, S. (2014). Does mandatory gender balance work? Changing
organizational form to avoid board upheaval. Journal of Corporate Finance, 28, 152-
168. doi:10.1016/j.jcorpfin.2013.12.005
Catalyst (2014a). Company level data from Catalyst Census of Women Board Directors of
the Fortune 500 from 1996 to 2013 [Data File and Code Book]. New York: Catalyst.
Catalyst (2014b). Legislative board diversity. Retrieved from the Catalyst website:
http://www.catalyst.org/legislative-board-diversity
Catalyst (2014c). Regulatory board diversity. Retrieved from the Catalyst website:
http://www.catalyst.org/regulatory-board-diversity
Catalyst (2014d). Voluntary board diversity. Retrieved from the Catalyst website:
http://www.catalyst.org/voluntary-board-diversity
Charles, M. (2011). A world of difference: International trends in women’s economic status.
Annual Review of Sociology, 37, 355-371. doi:10.1146/annurev.soc.012809.102548
Cheng, S. (2008). Board size and the variability of corporate performance. Journal of
Financial Economics, 87, 157-176. doi:10.1016/j.jfineco.2006.10.006
Coles, J. L., Daniel, N. D., & Naveen, L. (2008). Boards: Does one size fit all? Journal of
Financial Economics, 87, 329-356. doi:10.1016/j.jfineco.2006.08.008

39
Dahlerup, D., & Freidenvall, L. (2005). Quotas as a ‘fast track’ to equal representation for
women. International Feminist Journal of Politics, 7, 26-48. doi:
10.1080/1461674042000324673
Davies, E. M. (2011). Women on boards. (URN 11/745). Retrieved from the U.K.
Department for Business, Innovation & Skills website: https://www.gov.uk/
government/uploads/system/ uploads/attachment_data/file/31710/11-745-women-on-
boards.pdf
Dawson, J., Kersley, R., & Natella, S. (2014). The CS gender 3000: Women in senior
management. (RCE 1545924). Retrieved from the Credit Suisse website:
http://30percentclub.org/wp-content/uploads/2014/10/2014-09-
23_Research_Institute_Women_in_Business.pdf
Dezső, C. L., Ross, D. G. and Uribe, J. (2015), Is there an implicit quota on women in top
management? A large-sample statistical analysis. Strategic Management Journal.
doi: 10.1002/smj.2461
Dhir, A. (2015). Corporate reporting under the U.S. Securities and Exchange Commission’s
Diversity Disclosure Rule: A mixed-methods content analysis. Challenging
boardroom homogeneity: Corporate law, governance, and diversity. New York:
Cambridge University Press.
Epstein, M., Niemi, R., & Powell, L. (2005). Do women and men state legislators differ?. In
S. Thomas & C. Wilcox (Eds.), Women and elective office: Past, present and
future (2nd ed., pp. 94-109). New York: Oxford University Press.
European Commission (2012). Women in economic decision-making in the EU: Progress
report (DS-32-12-077-EN-C). Retrieved from the European Commission website:
http://ec.europa.eu/justice/gender-equality/files/women-on-boards_en.pdf

40
European Parliament (2011). Electoral gender quota systems and their implementation in
Europe (PE 453.210). Retrieved from:
http://www.europarl.europa.eu/RegData/etudes/etudes/join/2011/ 453210/IPOL-
FEMM_ET%282011%29453210_EN.pdf
European Parliament. (2012). Gender quotas in management boards (PE 462.429). Retrieved
from the European Parliament website: http://www.europarl.europa.eu/document/
activities/cont/201202/20120216ATT38420/20120216ATT38420EN.pdf
Genat, A., Wood, R., & Sojo, V. (2012). Evaluation bias and backlash: Dimensions,
predictors and implications for organisations. Retrieved from: https://cel.edu.au
Gilbert, J. A., & Stead, B. A. (1999). Stigmatization revisited: Does diversity management
make a difference in applicant success? Group & Organization Management, 24, 239-
256. doi:10.1177/1059601199242006
Gillespie, J. Z., & Ryan, A. M. (2012). Gender-based preferential selection: Influences of
perceptions of procedurally unfair advantage on performance and self-evaluations.
Journal of Applied Social Psychology, 42, E150-E179. doi: 10.1111/j.1559-
1816.2012.01016.x
Harrison, D. A., Kravitz, D. A., Mayer, D. M., Leslie, L. M., & Lev-Arey, D. (2006).
Understanding attitudes toward affirmative action programs in employment:
Summary and meta-analysis of 35 years of research. Journal of Applied Psychology,
91, 1013-1036. doi: 10.1037/0021-9010.91.5.1013j
Heilman, M. E. (2001). Description and prescription: How gender stereotypes prevent
women's ascent up the organizational ladder. Journal of Social Issues, 57, 657-674.
doi:10.1111/0022-4537.00234

41
Horstmeyer, D. (2011). Beyond independence: CEO influence and the internal operations of
the board. Retrieved from the University of Southern California website: http://www-
scf.usc.edu/~horstmey/The%20Operational%20Form%20of%20the%20Board.pdf
Hox, J. J. (2010). Multilevel analysis: Techniques and applications. New York: Routledge
Hunt, L., LaRoche, G., Blake-Beard, S., Chin, E., Arroyave, M., & Scully, M. (2009). Cross-
cultural connections: Leveraging social networks for women's advancement. In M.
Barreto, M. K. Ryan, & M. T. Schmitt (Eds.), The glass ceiling in the 21st century:
Understanding barriers to gender equality. (pp. 227-255). Washington DC: American
Psychological Association.
International Bank for Reconstruction and Development/The World Bank (2013). Women,
business and the law 2014: Removing restrictions to enhance gender equality.
Washington DC: Bloomsbury. Retrieved from http://wbl.worldbank.org/~/media/
FPDKM/WBL/ Documents/ Reports/2014/Women-Business-and-the-Law-2014-Key-
Findings.pdf
International Labour Office (2012). Global employment trends for women 2012. Retrieved
from: http://www.ilo.org/wcmsp5/groups/public/---dgreports/---dcomm/documents/
publication/ wcms_195447.pdf
Inter-Parliamentary Union. (2015). Women in national parliaments – January 2015. [Data
File and Code Book]. Retrieved from: http://www.ipu.org/
Jain, H. C., Sloane, P. J., Horwitz, F. M., Taggar, S., & Weiner, N. (2003). Employment
equity and affirmative action: An international comparison. Armonk: M. E. Sharpe.
Klettner, A., Clarke, T., & Boersma, M. (2014). Strategic and regulatory approaches to
increasing women in leadership: Multilevel targets and mandatory quotas as levers for
cultural change. Journal of Business Ethics, 1-25. doi:10.1007/s10551-014-2069-z
42
Kreft, I., & DeLeeuw, J. (1 998). Introducing multilevel modeling. Thousand Oaks, CA: Sage
Publications.
Krook, M. L., Lovenduski, J., & Squires, J. (2009). Gender quotas and models of political
citizenship. British Journal of Political Science, 39, 781-803.
doi:10.1017/S0007123409990123
Leslie, L. M., Mayer, D. M., & Kravitz, D. A. (2014). The stigma of affirmative action: A
stereotyping- based theory and meta-analytic test of the consequences for
performance. Academy of Management Journal, 57, 964-989.
doi:10.5465/amj.2011.0940
Locke, E. A., & Latham, G. P. (2002). Building a practically useful theory of goal setting and
task motivation: A 35-year odyssey. American Psychologist, 57, 705-717.
doi:10.1037/0003-066X.57.9.705
Locke, E. A., & Latham, G. P. (2013). New directions in goal setting and task performance.
San Francisco: Routledge.
McCann, J. (2013). Electoral quotas for women: An international overview. Retrieved from:
http://parlinfo.aph.gov.au/parlInfo/download/library/prspub/2840598/upload_binary/2
840598.pdf;fileType=application/pdf
McDonald, M. L., & Westphal, J. D. (2013). Access denied: Low mentoring of women and
minority first-time directors and its negative effects on appointments to additional
boards. Academy of Management Journal, 56, 1169-1198. doi:10.5465/amj.2011.0230
Meier, P., & Lombardo, E. (2013). Gender quotas, gender mainstreaming and gender
relations in politics. Political Science, 65, 46-62. doi: 10.1177/0032318713488114
Organisation for Economic Co-operation and Development. (2015). Current membership.
Retrieved from: http://www.oecd.org/about/membersandpartners/#d.en.194378

43
Pande, R., & Ford, D. (2011). Gender quotas and female leadership: A review. Background
paper for the World Development Report 2012. Retrieved from:
https://openknowledge.worldbank.org /bitstream/ handle/10986/9120/WDR2012-
0008.pdf?sequence=1
Profeta, P., Aliberti, L. A., Casarico, A., S’Amico, M., & Puccio, A. (2014). Women
directors: The Italian way and beyond. Basingstoke: Palgrave Macmillan.
Quota Project. (2015). Global database of quotas for women [Data File and Code Book].
Retrieved from: http://www.quotaproject.org/
Schwindt-Bayer, L. A. (2009). Making quotas work: the effect of gender quota laws on the
election of women. Legislative Studies Quarterly, 34, 5-28.
doi:10.3162/036298009787500330
Seierstad, C., & Opsahl, T. (2011). For the few not the many? The effects of affirmative
action on presence, prominence, and social capital of women directors in Norway.
Scandinavian Journal of Management, 27, 44-54. doi:10.1016/j.scaman.2010.10.002
Smith, N. (2014). Gender quotas on boards of directors. Aarhus, Denmark & Bonn,
Germany: Aarhus University & IZA. doi:10.15185/izawol.7
Stevenson, B., & Wolfers, J. (2009). The paradox of declining female happiness. American
Economic Journal: Economic Policy, 1, 190-225. doi: 10.1257/pol.1.2.190
Swers, M., & Larson, C. (2005). Women in congress: Do they act as advocates for women’s
issues? In S. Thomas & C. Wilcox (Eds.), Women and elective office: Past, present
and future (2nd ed., pp. 110-128). New York: Oxford University Press.
Tabachnick, B. G., & Fidell, L. S. (2007). Using multivariate statistics. Boston: Pearson.
Teigen, M. (2011). Gender quotas on corporate boards. In K. Niskanen (Ed.) Gender and
power in the Nordic countries - with a focus on politics and business (pp. 87-109).
Oslo: NIKK. Available at: http://www.west-info.eu/files/nordic1.pdf#page=88.

44
Terjesen, S., Aguilera, R., & Lorenz, R. (2015). Legislating a woman’s seat on the board:
institutional factors driving gender quotas for boards of directors. Journal of Business
Ethics, 128, 233-251. doi:10.1007/s10551-014-2083-1.
U. S. Economic Classification Policy Committee. (2012). North American Industry
Classification System (NAICS). Washington, DC: United States Census Bureau.
U. S. Equal Employment Opportunity Commission (2011). Uniform guidelines on employee
selection procedures (1978). Retrieved from: http://www.gpo.gov/fdsys/pkg/CFR-
2011-title29-vol4/xml/CFR-2011-title29-vol4-part1607.xml
U.N. Development Programme (2014a). 2014 Human development statistical tables [Data
file and code book]. Retrieved from: http://hdr.undp.org/en/data
U.N. Development Programme (2014b). Human development report 2014 - sustaining human
progress: reducing vulnerabilities and building resilience [Data file and code book].
Retrieved from: http://hdr.undp.org/en/data
U.S. Securities and Exchange Commission (2009). Proxy Disclosure Enhancements.
Retrieved from: http://www.sec.gov/rules/final/2009/33-9089.pdf
van der Meulen Rodgers, Y. (1999). Protecting women and promoting equality in the labor
market: Theory and evidence. Retrieved from http://www.worldbank.org/gender/prr
Wang, M., & Kelan, E. (2013). The gender quota and female leadership: Effects of the
Norwegian gender quota on board chairs and CEOs. Journal of Business Ethics, 117,
449-466. doi: 10.1007/s10551-012-1546-5
Whelan, J., & Wood, R. (2012). Targets and quotas for women in leadership: A global
review of policy, practice, and psychological research. Retrieved from the Centre for
Ethical Leadership website: https://www.cel.edu.au/our-research/targets-and-quotas-
for-women-in-leadership
45
Wood, R., Whelan, J., Sojo, V., & Wong, M. (2013). Goals, goal orientations, strategies and
performance. In E. A. Locke & G. P. Latham (Eds.). New directions in goal setting
and task performance (pp. 90-114). San Francisco, USA: Routledge.
World Economic Forum (2014). The Global Gender Gap Report 2014. Retrieved from:
http://reports.weforum.org/global-gender-gap-report-2014/
Zetterberg, P. (2008). The downside of gender quotas? Institutional constraints on women in
Mexican state legislatures. Parliamentary Affairs, 61, 442-460.
doi:10.1093/pa/gsn016
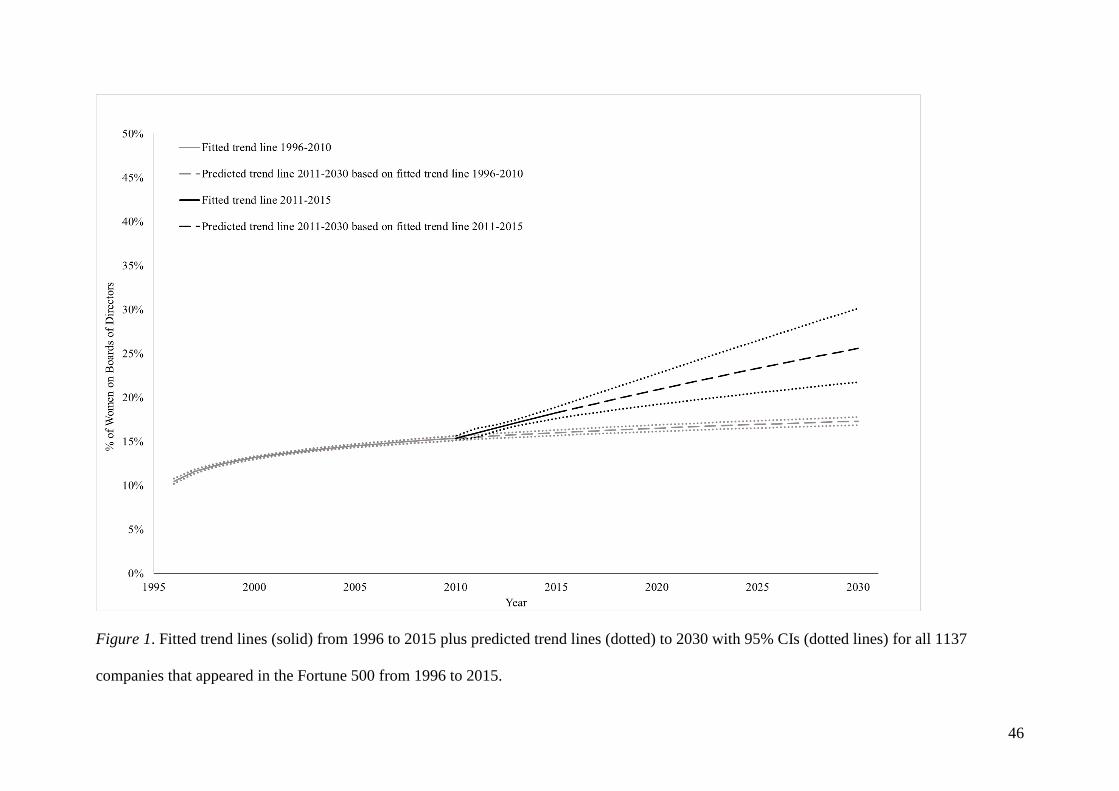
46
Figure 1. Fitted trend lines (solid) from 1996 to 2015 plus predicted trend lines (dotted) to 2030 with 95% CIs (dotted lines) for all 1137
companies that appeared in the Fortune 500 from 1996 to 2015.
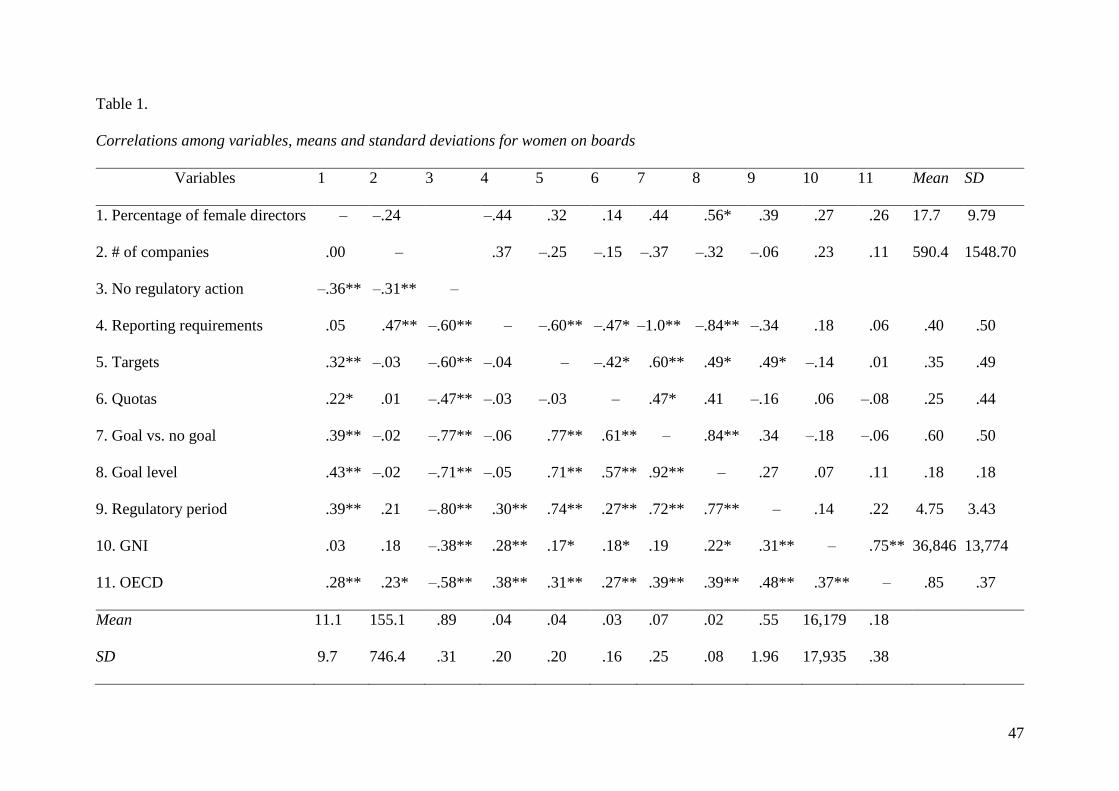
47
Table 1.
Correlations among variables, means and standard deviations for women on boards
Variables 1 2 3 4 5 6 7 8 9 10 11 Mean SD
1. Percentage of female directors – –.24 –.44 .32 .14 .44 .56* .39 .27 .26 17.7 9.79
2. # of companies .00 – .37 –.25 –.15 –.37 –.32 –.06 .23 .11 590.4 1548.70
3. No regulatory action –.36** –.31** –
4. Reporting requirements .05 .47** –.60** – –.60** –.47* –1.0** –.84** –.34 .18 .06 .40 .50
5. Targets .32** –.03 –.60** –.04 – –.42* .60** .49* .49* –.14 .01 .35 .49
6. Quotas .22* .01 –.47** –.03 –.03 – .47* .41 –.16 .06 –.08 .25 .44
7. Goal vs. no goal .39** –.02 –.77** –.06 .77** .61** – .84** .34 –.18 –.06 .60 .50
8. Goal level .43** –.02 –.71** –.05 .71** .57** .92** – .27 .07 .11 .18 .18
9. Regulatory period .39** .21 –.80** .30** .74** .27** .72** .77** – .14 .22 4.75 3.43
10. GNI .03 .18 –.38** .28** .17* .18* .19 .22* .31** – .75** 36,846 13,774
11. OECD .28** .23* –.58** .38** .31** .27** .39** .39** .48** .37** – .85 .37
Mean 11.1 155.1 .89 .04 .04 .03 .07 .02 .55 16,179 .18
SD 9.7 746.4 .31 .20 .20 .16 .25 .08 1.96 17,935 .38

48
Note. Correlations for full sample are below the diagonal; correlations for countries with regulatory actions are above the diagonal. # of
companies: the number of companies that were surveyed in each country to determine the percentage of female directors. No regulatory action:
countries without demand-side strategies = 1, with demand-side strategies = 0. Reporting requirements: countries with reporting requirements =
1, without reporting = 0. Targets: countries with targets = 1, without targets = 0. Quotas: countries with quotas = 1, without quotas = 0. Goal vs.
no goal: countries with goals = 1, without goals = 0. Goal level: percentage of women on boards set in the target or quota. Regulatory period:
years between enactment of regulatory action and 2014. GNI: Log Gross National Income. OECD: Membership in OECD = 1, no membership =
0. * p < .05, ** p < .01.

49
Table 2.
OLS regression analysis for variables predicting the percentage of female directors
Note. # of companies: the number of companies that were surveyed in each country to
determine the percentage of female directors. GNI: Log Gross National Income. OECD:
Membership in OECD = 1, no membership = 0. Reporting: countries with reporting
requirements = 1, without reporting = 0. Targets: countries with targets = 1, without targets =
0. Quotas: countries with quotas = 1, without quotas = 0. **p < .01, *p < .05.
Model 1 Model 2
Variable B SE B β B SE B β
Intercept 20.34 11.11 22.48* 10.69
# of companies .00 .00 –.06 .00 .00 –.05
GNI –2.72 2.72 –.12 –3.34 2.62 –.15
OECD 7.17** 2.46 .35 3.93 2.62 .19
Reporting 2.73 4.11 .08
Targets 11.19** 3.93 .31
Quotas 9.35* 4.44 .22
R2 .09 .19
F overall model 2.91* 3.36**
F change in R2 2.91* 3.56*

50
Table 3.
Comparison of % of women on boards of directors by regulatory action
Panel A % Women on boards
Comparison LSD Hedges’ g
Reporting vs. No action 3.28 0.38
Targets vs. No action 12.54** 1.35
Quotas vs. No action 10.70* 1.16
Reporting vs. Targets –9.26 –1.03
Reporting vs. Quotas –7.42 –.75
Quotas vs. Targets –1.84 –.14
Panel B Countries % Goal level % Women on boards
Regulatory action N % Mean SD Mean SD
No action 73 78.5% 0.0% 0.0% 9.3% 8.9%
Reporting 8 8.6% 0.0% 0.0% 12.6% 3.0%
Targets 7 7.5% 30.3% 13.7% 21.9% 12.0%
Quotas 5 5.4% 30.8% 11.9% 20.0% 8.9%
Total 93 100% 3.9% 11.3% 11.1% 9.7%
Note. No action: countries without demand-side strategies. Reporting: countries with
reporting requirements. Targets: countries with targets. Quotas: countries with quotas.
% Goal level: percentage of women on boards set in the target or quota. For % Goal level and
% Women on boards the Total row represents the means and SDs of those variables across all
countries **p < .01, *p < .05.
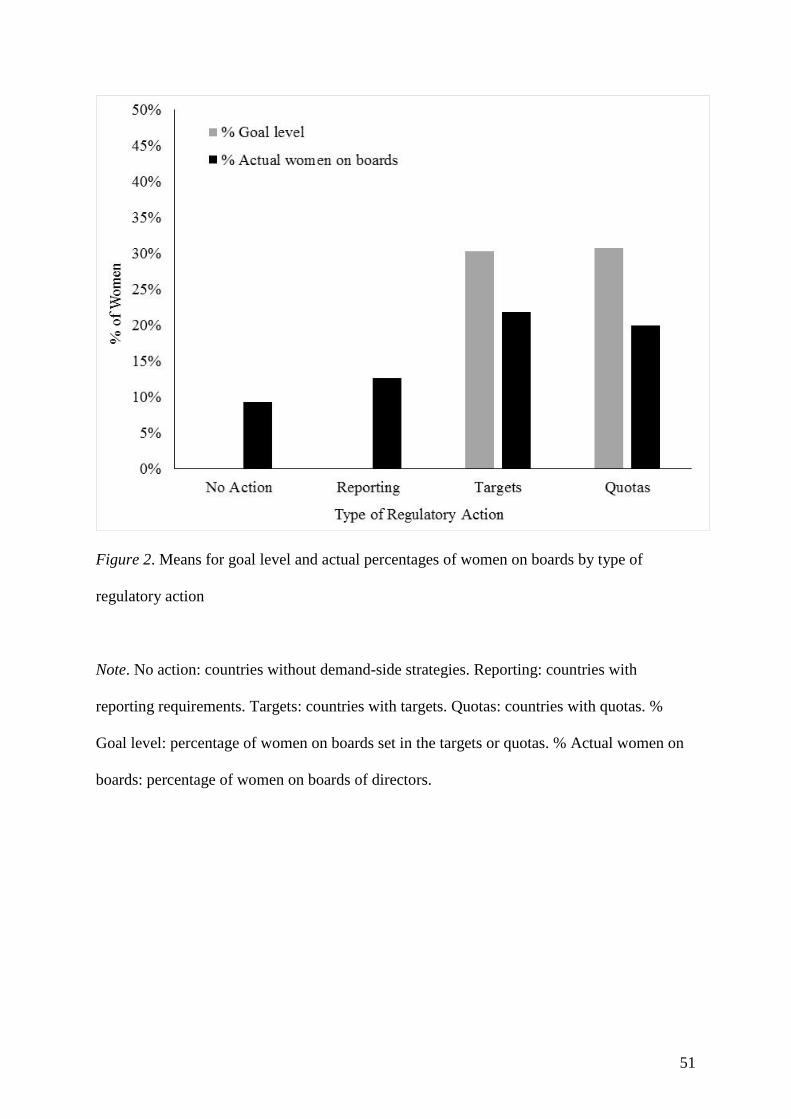
51
Figure 2. Means for goal level and actual percentages of women on boards by type of
regulatory action
Note. No action: countries without demand-side strategies. Reporting: countries with
reporting requirements. Targets: countries with targets. Quotas: countries with quotas. %
Goal level: percentage of women on boards set in the targets or quotas. % Actual women on
boards: percentage of women on boards of directors.

52
Table 4.
Legislative body-level correlations among variables, means and standard deviations for women in parliaments
1 2 3 4 5 6 7 8 9 10 11 12 Mean SD
1. % of women elected – .44** .01 –.01 .31** –.03 .62** –.15 –.02 .02 .25* 25.49 11.94
2. Goal level .35** – –.42** .42** –.05 –.01 –.36** –.08 –.08 .22* .27* 31.87 11.53
3. Reserved seats .14* .30** – –1.0** .32** –.07 .45** –.05 .20 –.48** –.29** .31 .46
4. Nominations .21** .82** –.17** – –.32** .07 –.45 .05 –.20 .48** .29** .69 .46
5. No goal –.28** –.92** –.48** –.78** –
6. Enforcement level .31** .87** .55** .69** –.96** – .16 .38** –.16 .04 .18 .06 1.68 .67
7. Regulatory period .18** .64** .30** .58** –.71** .71** – –.02 –.26* –.03 .23* .13 5.79 4.85
8. % elected/goal – –.09 .08 –.21 .00 84.77 37.28
9. House –.03 .07 .02 .09 –.09 .06 –.03 – .20 –.05 –.11 .79 .41
10. # of seats .09 .11 .22** .02 –.15* .16* .10 .23** – .08 .09 219.94 339.63
11. GNI .14* –.07 –.28** .05 .13* –.10 –.01 .00 .04 – .55** 11,449 10,802
12. OECD .27** –.01 –.16* .06 .05 –.04 .01 –.04 .14* .54** – .16 .37
Mean 20.52 9.93 .10 .22 .69 .83 1.81 .73 168.2 15,788 .19
SD 12.12 16.12 .30 .41 .46 1.30 3.80 .44 228.1 16,821 .39
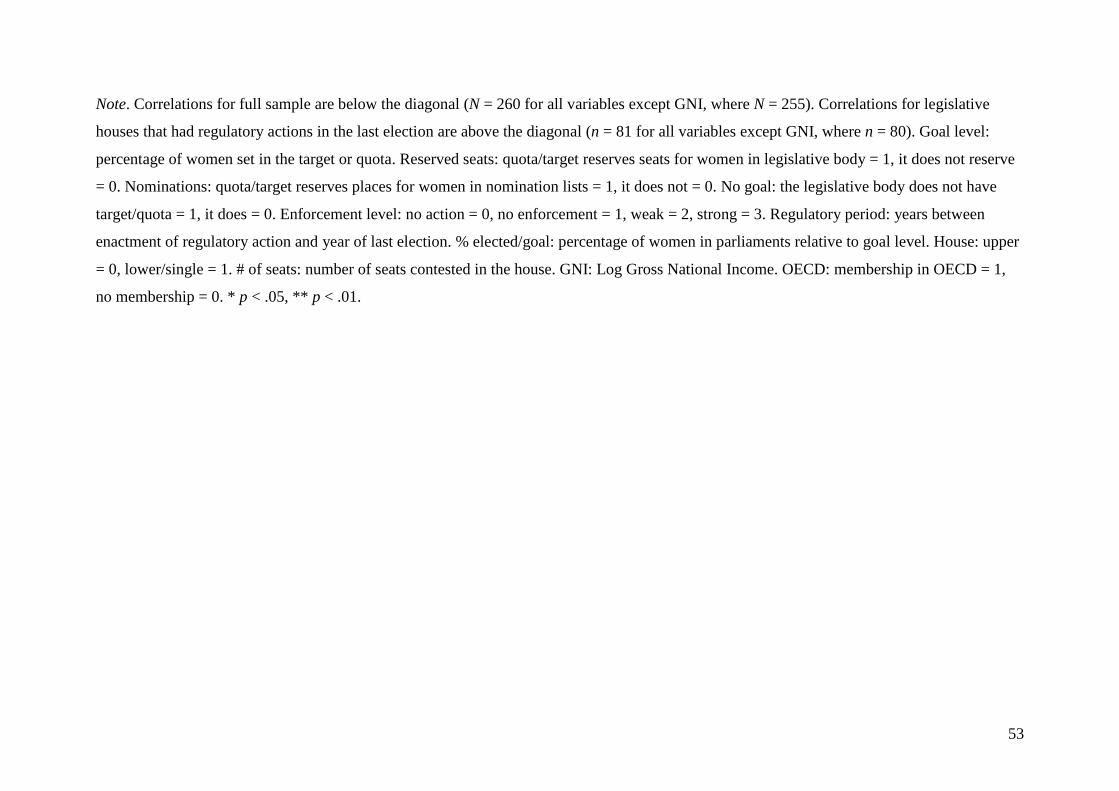
53
Note. Correlations for full sample are below the diagonal (N = 260 for all variables except GNI, where N = 255). Correlations for legislative
houses that had regulatory actions in the last election are above the diagonal (n = 81 for all variables except GNI, where n = 80). Goal level:
percentage of women set in the target or quota. Reserved seats: quota/target reserves seats for women in legislative body = 1, it does not reserve
= 0. Nominations: quota/target reserves places for women in nomination lists = 1, it does not = 0. No goal: the legislative body does not have
target/quota = 1, it does = 0. Enforcement level: no action = 0, no enforcement = 1, weak = 2, strong = 3. Regulatory period: years between
enactment of regulatory action and year of last election. % elected/goal: percentage of women in parliaments relative to goal level. House: upper
= 0, lower/single = 1. # of seats: number of seats contested in the house. GNI: Log Gross National Income. OECD: membership in OECD = 1,
no membership = 0. * p < .05, ** p < .01.
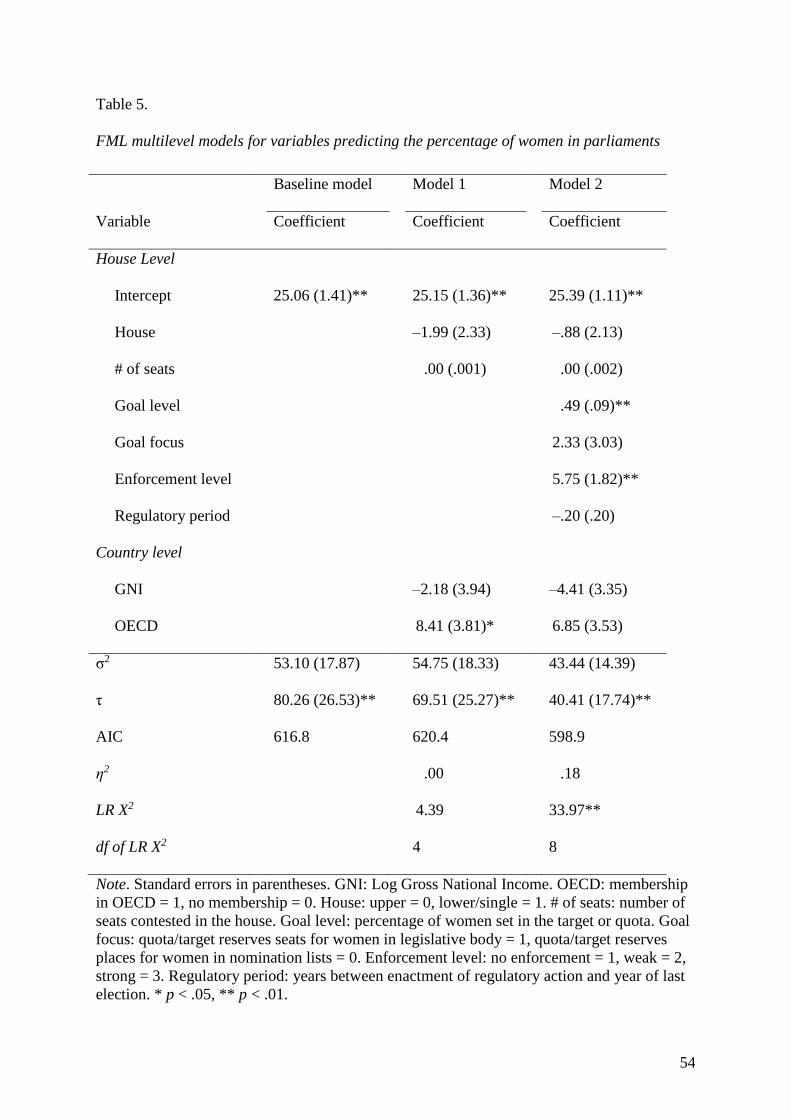
54
Table 5.
FML multilevel models for variables predicting the percentage of women in parliaments
Note. Standard errors in parentheses. GNI: Log Gross National Income. OECD: membership
in OECD = 1, no membership = 0. House: upper = 0, lower/single = 1. # of seats: number of
seats contested in the house. Goal level: percentage of women set in the target or quota. Goal
focus: quota/target reserves seats for women in legislative body = 1, quota/target reserves
places for women in nomination lists = 0. Enforcement level: no enforcement = 1, weak = 2,
strong = 3. Regulatory period: years between enactment of regulatory action and year of last
election. * p < .05, ** p < .01.
Baseline model Model 1 Model 2
Variable Coefficient Coefficient Coefficient
House Level
Intercept 25.06 (1.41)** 25.15 (1.36)** 25.39 (1.11)**
House –1.99 (2.33) –.88 (2.13)
# of seats .00 (.001) .00 (.002)
Goal level .49 (.09)**
Goal focus 2.33 (3.03)
Enforcement level 5.75 (1.82)**
Regulatory period –.20 (.20)
Country level
GNI –2.18 (3.94) –4.41 (3.35)
OECD 8.41 (3.81)* 6.85 (3.53)
σ2 53.10 (17.87) 54.75 (18.33) 43.44 (14.39)
τ 80.26 (26.53)** 69.51 (25.27)** 40.41 (17.74)**
AIC 616.8 620.4 598.9
η2 .00 .18
LR X2 4.39 33.97**
df of LR X2 4 8

55
Figure 3. Mean percentages of women elected to legislative bodies by goal level and
enforcement level. Note. Goal level: percentage of women set in the target or quota.
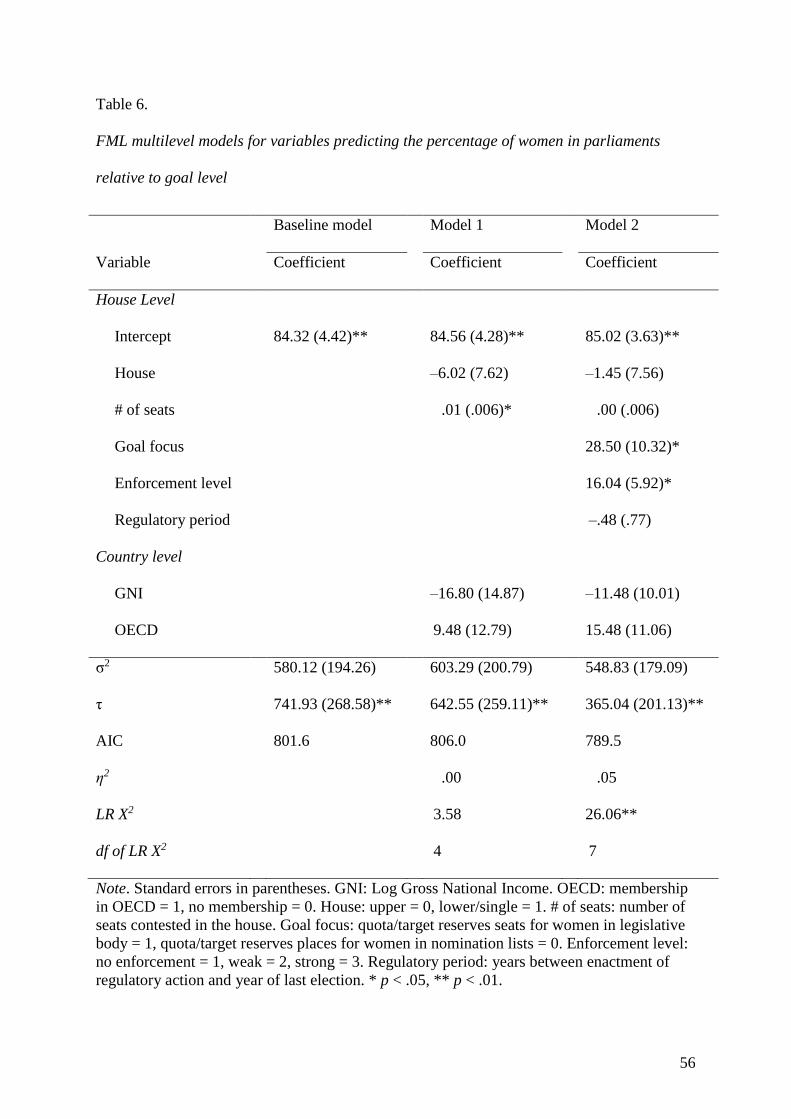
56
Table 6.
FML multilevel models for variables predicting the percentage of women in parliaments
relative to goal level
Note. Standard errors in parentheses. GNI: Log Gross National Income. OECD: membership
in OECD = 1, no membership = 0. House: upper = 0, lower/single = 1. # of seats: number of
seats contested in the house. Goal focus: quota/target reserves seats for women in legislative
body = 1, quota/target reserves places for women in nomination lists = 0. Enforcement level:
no enforcement = 1, weak = 2, strong = 3. Regulatory period: years between enactment of
regulatory action and year of last election. * p < .05, ** p < .01.
Baseline model Model 1 Model 2
Variable Coefficient Coefficient Coefficient
House Level
Intercept 84.32 (4.42)** 84.56 (4.28)** 85.02 (3.63)**
House –6.02 (7.62) –1.45 (7.56)
# of seats .01 (.006)* .00 (.006)
Goal focus 28.50 (10.32)*
Enforcement level 16.04 (5.92)*
Regulatory period –.48 (.77)
Country level
GNI –16.80 (14.87) –11.48 (10.01)
OECD 9.48 (12.79) 15.48 (11.06)
σ2 580.12 (194.26) 603.29 (200.79) 548.83 (179.09)
τ 741.93 (268.58)** 642.55 (259.11)** 365.04 (201.13)**
AIC 801.6 806.0 789.5
η2 .00 .05
LR X2 3.58 26.06**
df of LR X2 4 7
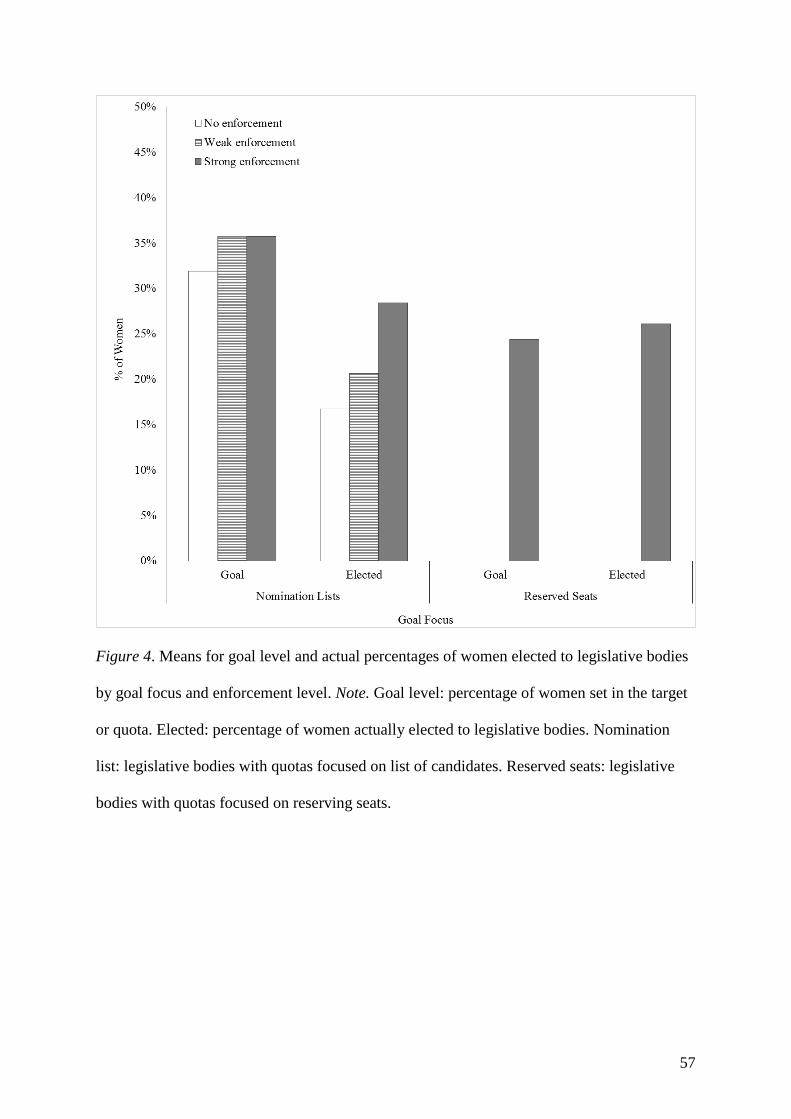
57
Figure 4. Means for goal level and actual percentages of women elected to legislative bodies
by goal focus and enforcement level. Note. Goal level: percentage of women set in the target
or quota. Elected: percentage of women actually elected to legislative bodies. Nomination
list: legislative bodies with quotas focused on list of candidates. Reserved seats: legislative
bodies with quotas focused on reserving seats.

Minerva Access is the Institutional Repository of The University of Melbourne
Author/s:Sojo, VE;Wood, RE;Wood, SA;Wheeler, MA
Title:Reporting requirements, targets, and quotas for women in leadership
Date:2016-01-01
Citation:Sojo, V. E., Wood, R. E., Wood, S. A. & Wheeler, M. A. (2016). Reporting requirements,targets, and quotas for women in leadership. Leadership Quarterly, 27 (3), pp.519-536.https://doi.org/10.1016/j.leaqua.2015.12.003.
Persistent Link:http://hdl.handle.net/11343/127171