reporting period: june 1, 2013 – june 30, 2013
TRANSCRIPT

By Sharon Homan, PhD
Oyinade Akinyede, MPH UNT Health Science Center School of Public Health
Progress Report
Reporting Period: June 1, 2013 – June 30, 2013

Table of Contents
EXECUTIVE SUMMARY...…………………………………………………………………………………………..
4 – 5
Active Sites………………………………………………………………….............................................................. 6 - 7
Newly Implemented…………………………………………………………………………………………….. 8
Statewide County Presence and Overview……………………….…………………………………… 9
Region 1: High Plains - Monthly Report ………………………………………………………………... • Facility Site Maps • Clients and Household Served • Applications Completed • Value of Benefit Sought by Category • Summary of Texas Common Application
o SNAP Eligibility Assessment and Value Summary o Medical Eligibility Assessment Summary o Estimated Value of Health Benefits
• Federal Tax Summary • Site Performance
10 – 16
Region 3: Metroplex - Monthly Report ……………………………..…………………………………….. • Facility Site Maps • Clients and Household Served • Applications Completed • Value of Benefit Sought by Category • Summary of Texas Common Application
o SNAP Eligibility Assessment and Value Summary o Medical Eligibility Assessment Summary o Estimated Value of Health Benefits
• Federal Tax Summary • Site Performance
17 – 22
Region 6: Gulf Coast - Monthly Report ………………………………………….………………………… • Facility Site Maps • Clients and Household Served • Applications Completed • Value of Benefit Sought by Category • Summary of Texas Common Application
o SNAP Eligibility Assessment and Value Summary o Medical Eligibility Assessment Summary o Estimated Value of Health Benefits
• Federal Tax Summary • Site Performance
23 – 28
2

Region 7: Central Texas - Monthly Report ………………………………………………………………
• Facility Site Maps • Clients and Household Served • Applications Completed • Value of Benefit Sought by Category • Summary of Texas Common Application
o SNAP Eligibility Assessment and Value Summary o Medical Eligibility Assessment Summary o Estimated Value of Health Benefits
• Federal Tax Summary • Site Performance
29 – 34
Region 8: Central Texas - Monthly Report ……………………………………………………………… • Clients and Household Served • Applications Completed • Value of Benefit Sought by Category • Summary of Texas Common Application
o SNAP Eligibility Assessment and Value Summary o Medical Eligibility Assessment Summary o Estimated Value of Health Benefits
• Federal Tax Summary • Site Performance
35 – 38
Data and Methodology for Eligibility Assessments and Value Estimations …………… 39
3

EXECUTIVE SUMMARY
Background The Benefit Bank of Texas (TBB-TXTM) is a web-based service that is free to clients and creates a “one-stop-shop” for families who wish to apply for benefits and file income taxes. TBB-TXTM centralizes the process of applying for benefits by providing an eligibility assessment so that families are aware of the federal and state benefits, as well as tax credits for which they are eligible. Through TBB-TXTM, clients are able to determine their eligibility and, subsequently, apply for food benefits (Supplemental Assistance Nutrition Program [SNAP]), medical assistance (Children’s Health Insurance Program [CHIP] and Medicaid), and financial assistance (Temporary Aid to Needy Families [TANF]). State-wide Overview Texas Health Institute has spear-headed the implementation and growth of TBB-TXTM throughout Texas. Since implementation began and the first site opened in Amarillo in October, 2011, TBB-TXTM has grown to 149 operational sites canvassing several regions of Texas. This documents reports implementation results for six distinct regions of Texas within a reporting period of June 1, 2013 – June 30, 2013. As of June 30, 2013, 2,183 clients from 1,931 distinct households have used TBB-TXTM services. The households served by TBB-TXTM include 1,708 children, 2,365 adults, and 212 seniors. From June 1, 2013 to June 30, 2013 TBB-TXTM has experienced the following growth:
• 4 new sites • 60 counselors trained • 134 new clients • 146 households served • 303 household members served
Clients using TBB-TXTM have utilized the full spectrum of services offered. TBB-TXTM services have been well-utilized for filing tax returns, as well as for applying for food benefits, Medicaid/CHIP, and TANF. Specifically, the service has been most utilized for applying for food benefits, with 73 eligible out of 102 total clients applying for SNAP, followed by applications for medical benefits (43 clients). During the month of June, clients have applied for the following benefits:
• 102 clients have applied for food benefits (SNAP) for their household • 43 clients have applied for medical benefits (Medicaid and CHIP) for their household • 18 clients have applied for financial assistance (TANF) for their household
Among clients applying, over three-fifths (72%) were in households eligible for SNAP, and over three-fourths were eligible for Medicaid and/or CHIP (79%). Families using TBB-TXTM have received benefits valued at an estimated $516,390 for the month of June. The breakdown by benefit of number of clients eligible and dollar valuation of benefits is shown in the following table:
Program Households Number of Persons in Households
Dollar Value of Benefits
SNAP 73 73 $234,864 CHIP 34 81 $222,993 Miscellaneous 13 13 $54,110 Tax Assistance 5 5 $4,423 TOTAL 103 167 $516,390
4

Overview by Region Currently, TBB-TXTM has been actively implemented in five regions in Texas: Region 1, the “High Plains Region”, including Amarillo and surrounding areas; Region 3, the “Metroplex Region”, including the Dallas-Fort Worth area; Region 6, the “Gulf Coast Region”, including Houston, Corpus Christi, Galveston and nearby areas; Region 7, the “Central Texas Region”, including Bastrop, Georgetown, and surrounding areas of Central Texas; Region 8, the “Upper South Texas Region,” including San Antonio and surrounding areas; and Region 11, the “Lower South Texas Region,” including Rio Grande Valley and surrounding areas. Region 1, the High Plains region, is home to the first and longest-running sites to-date. Since beginning with three initial sites in October, the number of sites has continued to expand and the number of clients served continues to grow. Some of the newest sites are found in Region 11, the Lower South Texas Region. The regional summary of clients served and value of benefits awarded is shown below:
Region Date of Initial TBB-TXTM site
Opening within Region
Number of Clients Served
June 1 – 30, 2013
Number of Clients Served
to Date
Dollar Value of Client Benefits ** June 1 – 30, 2013
Dollar Value of Client
Benefits ** to Date
Region 1/ High Plains
October, 2011 31 463 $91,404 $1,336,733
Region 3/ Metroplex June, 2012 43 584 $125,741 $1,586,647 Region 6/Gulf Coast March, 2012 70 928 $234,646 $2,801,951 Region 7/Central Texas
May, 2012 19 155 $55,682 $488,294
Region 8/Upper South Texas
January, 2013 4 28 $8,917 $45,301
Region 11/Lower South Texas
May, 2013 0 1 $0 $2,400
TOTAL 167 2,159 $516,390 $6,261,326 **Does not include TANF or TANF-related Medicaid. TANF eligibility is not available to the TBB reporting system. Future Sites Texas Health Institute continues to build TBB-TXTM capacity in communities within regions with currently active sites, as well as within regions that will serve as the home for future sites. Texas Health Institute plans to operationalize new sites within these regions, including the training of counselors, and expansion into additional regions, is in progress.
5

6
Texas Benefit Bank Site Report October 1, 2011 – June 30, 2013
ACTIVE SITES
*Mental Health Mental Retardation
Regi
on 1
AISD Safe Schools/Healthy Students Amarillo College Amarillo College Hereford Campus Amarillo College Moore County Amarillo Public Library Amarillo Wesley Community Center, Inc. Amarillo Independent School District Christian Heritage Church Central Church of Christ Central Plains Center Admission Central Plains Center Intellectual Disabilities Services City Church Outreach Ministries Coalition of Health Services Golden Plains Community Hospital Emerson Elementary School City of Refuge Faith City Ministries Castro County Hospital District Families in Transition Program Dare to Believe Family Support Services Central Plains Center First Presbyterian Church Central Plains Center Mental Health Services Forest Hill Elementary School San Jacinto Elementary School Paramount Baptist Church Crisis Center of the Plains Region 16 Education Service Center Center Plains Center Early Childhood Intervention Sam Houston Middle School Travis Middle School Texas Panhandle Centers Texas Tech University The Salvation Army at Amarillo West Texas Family and Community Services Whittier Elementary School
Will Rogers Elementary School
Regi
on 3
Aging Disability Resource Center MHMR* of Tarrant County CATS MHMR of Tarrant County Christian Community Action Circle Drive MH Clinic MHMR of Tarrant County Stamford Memorial Hospital CRU MHMR of Tarrant County Hemphill Adult MHMR of Tarrant County Hemphill Children's MHMR of Tarrant County
Homeless Outreach MHMR of Tarrant County
Hulen/MCOT MHMR of Tarrant County Jennings Place MHMR of Tarrant County Liberty House MHMR of Tarrant County Mental Health Mental Retardation of Tarrant County City Square- Americorps Galaxy Counseling Center Sante Fe Youth Service MHMR of Tarrant County Ads and Vets Mid-Cities Clinic MHMR of Tarrant County OCR MHMR of Tarrant County Open Enrollment MHMR of Tarrant County Penn Square Clinic MHMR of Tarrant County Pine Street MHMR of Tarrant County Project Rapp MHMR of Tarrant County TYRC - MHMR of Tarrant County Your Texas Benefits MHMR of Tarrant County City Square- Community Life/City Walk City Square- Destination Home City Square- Destination Home (Tyler St) City Square- Homeless Outreach Team City Square- Resource Center City Square- TRAC

7
Active Sites Continued
Regi
on 7
River City Youth Foundation SWIFT San Marcos CISD- Bowie Elem San Marcos CISD- Travis Elem San Marcos CISD-CDC Center San Marcos CISD-Crockett Elem San Marcos CISD-Goodnight MS San Marcos CISD-Miller MS San Marcos CISD-Phoenix San Marcos CISD-San Marcos High San Marcos CSD Central Office Southwest Key Programs St. Vincent de Paul, South Central Region San Marcos CISD-Miller MS San Marcos CISD-Phoenix San Marcos CISD-San Marcos High The Breast Cancer Resource Centers of Texas
Regi
on 8
CareLink, University Health System
Haven for Hope of Bexar County Re
gion
11 Infant and Family Nutrition Agency
South Texas Adult Resource Center
Texas A&M University Corpus Christi
Regi
on 6
Alief Independent School District CDF – Outreach CHIPRA I Children's Defense Fund – Houston Children's Defense Fund - Texas - Rio Grande Valley Christian Life Community Church Corpus Christi Independent School District Debakey High School Delivering Children One Block At a Time Edinburg Consolidated Independent School District Elsik High School Gateway to Care Hastings High School Healing Hands Ranch Houston Independent School District Humble Area Assistance Ministries Jones High School Just Do It Now, Inc. Kerr High School Lee High School Lesbian Health Initiative of Houston, Inc. Memorial High School – Alamo Memorial High School – Houston Next Level Christian Church - Kingdom Life Ministry Northbrook High School PSJA High School PSJA North High School Pharr-San Juan Alamo Independent School District Police and Clergy Team SHOUT-T San Antonio Independent School District Spring Branch Independent School District Spring Woods High School St. Vincent's Episcopal House Stratford High School Sweeny Community Hospital Taylor High School Test Academy Texas A&M University Galveston The Christian Outreach Center The Foundation of Lashaun Dreams The REACH Center Inc. Women Club Association, Inc.
Regi
on 7
Bluebonnet Trails Community Service Center - Round Rock Bluebonnet Trails Community Services – Bastrop Bluebonnet Trails Community Services - Guadalupe Bluebonnet Trails Community Services- Eastern Williamson County Con Mi MADRE ECHO Front Steps, Inc. Helping the Aging, Needy and Disabled (HAND) Hill Country Bible Church-Austin Housing Authority of the City of Georgetown Hutto Community Resource Center

8
NEW SITES IMPLEMENTED IN JUNE 2013
Regi
on 1
Amarillo College Hereford Campus
Texas Tech University
Regi
on 6
Texas A&M University Galveston
Regi
on 7
SWIFT

9
SUMMARY OF ACTIVE SITES AND CLIENTS SERVED STATEWIDE TBB-TXTM COUNTY PRESENCE
Region 1: Panhandle (Amarillo, Lubbock and Surrounding Counties) Region 2: Northwest Texas (Abilene, Wichita Falls and Surrounding Counties) Region 3: North Central Texas (Dallas, Fort Worth and Surrounding Counties) Region 4: Northeast Texas (Tyler, Texarkana and Surrounding Counties) Region 5: Upper Gulf Coast (Nacogdoches, Beaumont and Surrounding Counties) Region 6: Central Gulf Coast (Houston and Surrounding Counties) Region 7: Central Texas (Austin, College Station and Surrounding Counties) Region 8: South Central Texas (San Antonio, Uvalde and Surrounding Counties) Region 9: Permian Basin (Midland/Odessa, San Angelo and Surrounding Counties) Region 10: Far West Texas (El Paso and Surrounding Counties) Region 11: South Texas (Rio Grande Valley and Lower Gulf Coast)
Regi
on 1
Castro County
Deaf Smith County
Hale County
Hall County
Hutchinson County
Lubbock County
Moore County
Potter County
Randall County
Regi
on 3
Dallas County
Denton County
Tarrant County
Regi
on 6
Brazoria County
Galveston County
Harris County Re
gion
7
Bastrop County
Colorado County
Guadalupe County
Travis County
Williamson County
Regi
on 8
Bexar County
Regi
on 1
1 Cameron County
Nueces County
JUNE 1, 2013– JUNE 30, 2013
Total New Active Sites: 4
New Counselors: 60
134 New Clients
146 Households Served
303 Household Members Served

10
Snapshot of High Plains Region 1 TBB-TXTM
Implementation Sites October 1, 2011 – June 30, 2013
HIGH PLAINS REGION 1 FACILITY SITES
*Please note these maps do not include the facility sites implemented in June 2013.

11
*Please note these maps do not include the facility sites implemented in June 2013.

12
REGION 1: HIGH PLAINS - MONTHLY REPORT Data Report Period: June 1, 2013 – June 30, 2013
• 25 Unique Clients Served • 20 Clients Completed 22 applications • 4 new counselors trained this month
Reporting Period Cumulative
June 1 –30, 2013 October* 2011 – June 30, 2013
Clients/ Household Served 23 393 Household Members 48 919 Households where a Member is Disabled 3 53 Households with Children 9 194 Household Members in Households with Children 34 665 Children (under 18) 23 399 Adults (18-59) 20 480 Seniors (60+) 5 40
APPLICATIONS COMPLETED Reporting Period Cumulative
June 1 –30, 2013 October 2011 – June 30, 2013
Application Clients Clients Texas Common Application 20 231 Voter Registration 10 FAFSA 2011-12 1 FAFSA 2012-13 24 FAFSA 2013-14 1 9 Federal TY2008 1040 1 Federal TY2009 1040 1 Federal TY2010 1040 3 Federal TY2011 1040 42 Federal TY2012 1040 1 63 Texas SNAP 164 Texas SNAP, Emergency 164 Texas Common Application, Emergency 164 *Data starting report period reflects the timing of site activation in the Regions and for which data are available through Solutions for Progress.
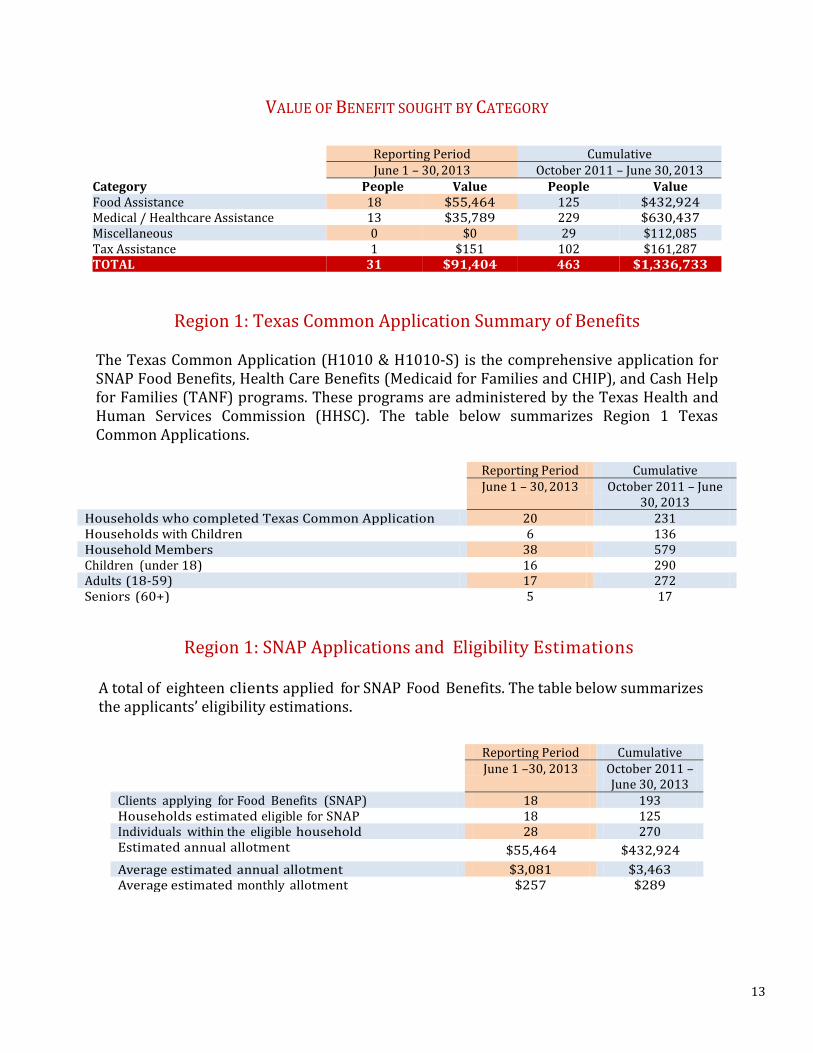
VALUE OF BENEFIT SOUGHT BY CATEGORY
Reporting Period Cumulative June 1 – 30, 2013 October 2011 – June 30, 2013 Category People Value People Value Food Assistance 18 $55,464 125 $432,924 Medical / Healthcare Assistance 13 $35,789 229 $630,437 Miscellaneous 0 $0 29 $112,085 Tax Assistance 1 $151 102 $161,287 TOTAL 31 $91,404 463 $1,336,733
Region 1: Texas Common Application Summary of Benefits
The Texas Common Application (H1010 & H1010-S) is the comprehensive application for SNAP Food Benefits, Health Care Benefits (Medicaid for Families and CHIP), and Cash Help for Families (TANF) programs. These programs are administered by the Texas Health and Human Services Commission (HHSC). The table below summarizes Region 1 Texas Common Applications.
Reporting Period Cumulative June 1 – 30, 2013 October 2011 – June
30, 2013 Households who completed Texas Common Application 20 231 Households with Children 6 136 Household Members 38 579 Children (under 18) 16 290 Adults (18-59) 17 272 Seniors (60+) 5 17
Region 1: SNAP Applications and Eligibility Estimations
A total of eighteen clients applied for SNAP Food Benefits. The table below summarizes the applicants’ eligibility estimations.
Reporting Period Cumulative June 1 –30, 2013 October 2011 –
June 30, 2013 Clients applying for Food Benefits (SNAP) 18 193 Households estimated eligible for SNAP 18 125 Individuals within the eligible household 28 270 Estimated annual allotment $55,464
$432,924 Average estimated annual allotment $3,081 $3,463 Average estimated monthly allotment $257 $289
13

Region 1: Medical Applicants and Eligibility Estimations
Four clients in Region 1 applied for Health Care Benefits (Medicaid for Families and CHIP). The table below illustrates the applicants’ eligibility estimations.
Reporting Period Cumulative June 1 –30, 2013 October 2011- June 30, 2013 Households People Households People Clients applying for Health Care (Medicaid or CHIP)
4 120
Considered eligible for CHIP Program
4 13 105 229
Considered eligible for Medicaid for Children and Pregnant Women
4 12 93 182
Clients applying for Cash Help for Families (TANF)
6 73
Considered eligible for TANF-related Medicaid
0 0 15 40
TOTAL* 4 13 106 236 * Household members may be considered eligible for more than one program. The TOTAL provides a distinct count of people/household members eligible across all programs.
Region 1: Estimated Value of Health Benefits
Reporting Period Cumulative June 1 –30, 2013 October 2011 – June 30, 2013 Program Households People Valuation Households People Valuation SNAP 18 18 $55,464 125 125 $432,924 CHIP 4 13 $35,789 105 229 $630,437 Medicaid for Children and Pregnant Women
TANF-related Medicaid TOTAL 19 31 $91,253 299 463 $1,063,361
*Although a household member may be considered eligible for several programs in the medical eligibility, they are only assigned to a single category for purposes of estimating value of health benefits.

Region 1: June 2013 Federal Tax Summary
TY2012 Federal Tax Summary TY2011 Federal Tax Summary Fed Tax Clients 1 - - - AGI - - - - Refunds 1 $151 - -
Tax Owed - - - -
Earned Income Credit - - - - Child Tax Credit - - - -
Additional Child Tax Credit - - - -
Region 1: Top Site Performers June 1 - 30, 2013
Site
City
Clients Served
Clients with Applications
Texas Panhandle Centers Amarillo 6 6 Whittier Elementary School Amarillo 4 2 Family Support Services Amarillo 4 4 Amarillo Public Library Downtown Amarillo 3 3 Faith City Ministries Amarillo 3 3 Amarillo College Amarillo 2 1 Central Plains Center Plainview 2 1 Central Plains Center Mental Health Services Plainview 1 0
14
15

Region 1: Cumulative Top Site Performers October 1, 2011 – June 30, 2013
Site
City
Clients Served
Clients with Applications
Amarillo College Amarillo 67 55 Family Support Services Amarillo 53 51 Texas Panhandle Centers Amarillo 50 41 Coalition of Health Services Amarillo 37 32 First Presbyterian Church Amarillo 34 31 Region 16 Education Service Center Amarillo 25 23 Amarillo Independent School District Amarillo 21 15 Castro County Hospital District Dimmitt 20 16 Faith City Ministries Amarillo 16 16 Whittier Elementary School Amarillo 14 11 Families in Transition Program Amarillo 13 13 Amarillo Public Library Downtown Amarillo 12 11 Central Plains Center Mental Health Services Plainview 12 10 Central Church of Christ Amarillo 8 8 Central Plains Center Plainview 5 4 City of Refuge Amarillo 4 1 Amarillo College Moore County Dumas 3 1 The Salvation Army at Amarillo Amarillo 3 2 Amarillo Wesley Community Center, Inc. Amarillo 3 1 Dare to Believe Plainview 3 3 West Texas Family and Community Services Amarillo 3 3 Paramount Baptist Church Amarillo 1 0 Crisis Center of the Plains Plainview 1 1 Christian Heritage Church Amarillo 1 0 Central Plains Center Intellectual Disabilities Services Plainview 1 0
16

Snapshot of Metroplex Region 3 TBB-TXTM
Implementation Sites June 1, 2012 – June 30, 2013 METROPLEX REGION 3 FACILITY SITES
*Please note these maps do not include the facility sites implemented in June 2013.
17

REGION 3: METROPLEX - MONTHLY REPORT Data Report Period: June 1, 2013 – June 30, 2013
• 43 Unique Clients Served • 42 Clients Completed 44 Applications • 0 New Counselor
Reporting Period Cumulative June 1 –30, 2013 June 1, 2012* –
June 30, 2013 Clients/ Household Served 43 600 Household Members 62 942 Households where a Member is Disabled 15 183 Households with Children 9 155 Household Members in Households with Children 24 468 Children (under 18) 15 289 Adults (18-59) 44 607 Seniors (60+) 3 46
APPLICATIONS COMPLETED
Reporting Period Cumulative
June 1 –30, 2013 June 1, 2012 – June 30, 2013
Application Clients Clients Texas Common Application 36 543 Voter Registration 6 FAFSA 2011-12 0 FAFSA 2012-13 5 FAFSA 2013-14 5 10 Federal TY2008 1040 2 Federal TY2009 1040 1 5 Federal TY2010 1040 7 Federal TY2011 1040 1 8 Federal TY2012 1040 1 23 Texas SNAP 355 Texas SNAP, Emergency 355 Texas Common Application, Emergency 355
*Data starting report period reflects the timing of site activation in the Regions and for which data are available through Solutions for Progress.
18

VALUE OF BENEFITS SOUGHT BY CATEGORY
Reporting Period Cumulative
June 1 –30, 2013 June 1, 2012- June 30, 2012 Category People Value People Value Food Assistance 25 $69,360 382 $985,152 Medical / Healthcare Assistance 12 $33,036 184 $506,552 Miscellaneous 5 $19,325 15 $57,975 Tax Assistance 2 $4,020 32 $36,968 TOTAL 43 $125,741 584 $1,586,647
Region 3: Texas Common Application Summary
Reporting Period Cumulative
June 1 –30, 2013 June 1, 2012- June 30, 2013
Households who completed Texas Common Application 36 543 Households with Children 8 136 Household Members 51 831 Children (under 18) 14 250 Adults (18-59) 35 540 Seniors (60+) 2 41
Region 3: SNAP Applications and Eligibility Estimations
A total of 34 clients/households applied for SNAP Food Benefits. The table below summarizes the eligibility estimations.
Reporting Period Cumulative June 1 –30, 2013 June 1, 2012 –
June 30, 2013 Clients that applied for Food Benefits (SNAP) 34 514 Considered eligible for SNAP 25 378 Individuals within the eligible household 38 558 Estimated annual allotment $69,360 $977,208 Average estimated annual allotment $2,774 $2,585 Average estimated monthly allotment $231 $215
19

Region 3: Medical Eligibility Estimations
Seven clients applied for Health Care Benefits (Medicaid for Families and CHIP). The table below illustrates the applicants’ eligibility estimations.
Reporting Period Cumulative June 1 –30, 2013 June 1, 2012 – June 30, 2013 Program Households People Households People Clients applying for Health Care (Medicaid or CHIP)
7 114
Considered eligible for CHIP 6 12 97 184 Considered eligible for Medicaid for Children and Pregnant Women
6 12 89 164
Clients applying for Cash Help for Families (TANF)
5 94
Considered eligible for TANF-related Medicaid
0 0 5 13
TOTAL* 6 12 97 186
* Household members may be considered eligible for more than one program. The TOTAL provides a distinct count of people/household members eligible across all programs.
Region 3: Estimated Value of Health Benefits
Reporting Period Cumulative June 1 –30, 2013 June 1, 2012 – June 30, 2013 Program Households People Value Households People Value SNAP 25 25 $69,360 382 382 $985,152 CHIP 6 12 $33,036 97 184 $506,552 Medicaid for Children and Pregnant Women
TANF-related Medicaid TOTAL 31 43 $102,396 441 584 $1,491,704
*Although a household member may be considered eligible for several programs in the medical eligibility, each member is only assigned to a single category for purposes of estimating value of health benefits.
20

Region 3: June 2013 Federal Tax Summary
TY2012 Federal Tax Summary TY2011 Federal Tax Summary Fed Tax Clients 1 - - - AGI - - - - Refunds 1 $3,980 - -
Tax Owed - - - -
Earned Income Credit - - - - Child Tax Credit - - - -
Additional Child Tax Credit - - - -
REGION 3: TOP SITE PERFORMERS JUNE 1 – 30, 2013
Site City Clients Served
Clients with Application
MHMR* of Tarrant County Ft. Worth 21 21 Project Rapp MHMR* of Tarrant County Ft. Worth 7 7 City Square – TRAC Dallas 5 5 CRU Mental Health Mental Retardation of Tarrant County Ft. Worth 3 3 Circle Drive MH Clinic MHMR* of Tarrant County Ft. Worth 2 2 Christian Community Action Lewisville 2 1 Penn Square Clinic MHMR* of Tarrant County Ft. Worth 2 2 MHMR* of Tarrant County Ads and Vets Ft. Worth 1 1 *Mental Health Mental Retardation
21

REGION 3: CUMULATIVE TOP SITE PERFORMERS
JUNE 1, 2012 – JUNE 30, 2013
Site City Clients
Served Clients with Application
MHMR* of Tarrant County Ft. Worth 215 202 Project Rapp MHMR* of Tarrant County Ft. Worth 160 153 Circle Drive MH Clinic MHMR* of Tarrant County Ft. Worth 81 79 Christian Community Action Lewisville 65 57 MHMR* of Tarrant County Ads and Vets Ft. Worth 43 38 CRU MHMR* of Tarrant County Ft. Worth 21 17 Penn Square Clinic MHMR* of Tarrant County Ft. Worth 20 19 City Square-TRAC Dallas 13 12 Hulen/MCOT MHMR* of Tarrant County Ft. Worth 4 3 Open Enrollment MHMR* of Tarrant County Ft. Worth 4 4 Santa Fe Youth Service Ft. Worth 3 1 Hemphill Children’s MHMR* of Tarrant County Ft. Worth 3 2 Mid-Cities Clinic MHMR* of Tarrant County N. Richland Hills 3 3 Your Texas Benefits MHMR* of Tarrant County Ft. Worth 3 1 Homeless Outreach MHMR* of Tarrant County Ft. Worth 2 2 City Square-Americorps Dallas 1 0 City Square-Destination Home Dallas 1 1 Aging Disability Resource Center MHMR* of Tarrant County Ft. Worth 1 0
*Mental Health Mental Retardation
22

Snapshot of Gulf Coast Region 6 TBB-TXTM Implementation Sites March 1, 2012 – June 30, 2013
GULF COAST REGION 6 FACILITY SITES
*Please note these maps do not include the facility sites implemented in June 2013.
23

REGION 6: GULF COAST - MONTHLY REPORT Data Report Period: June 1, 2013 – June 30, 2013
• 62 Unique Clients Served • 57 Clients Completed 60 Applications • 6 New Counselors
Reporting Period
Cumulative
June 1 –30, 2013
March* 1, 2012 – June 30, 2013
Clients/ Households Served 60 681 Household Members 160 1,915 Households where a Member is Disabled 11 82 Households with Children 35 438 Household Members in Households with Children 130 1,593 Children (under 18) 77 866 Adults (18-59) 72 957 Seniors (60+) 11 92
APPLICATIONS COMPLETED
Reporting
Period Cumulative
June 1 –30, 2013
June 1, 2012 – June 30, 2013
Application Clients Clients Texas Common Application 52 626 Voter Registration 1 FAFSA 2011-12 2 FAFSA 2012-13 2 28 FAFSA 2013-14 5 23 Federal TY2008 1040 Federal TY2009 1040 Federal TY2010 1040 1 Federal TY2011 1040 2 Federal TY2012 1040 1 13 Texas SNAP 264 Texas SNAP, Emergency 264 Texas Common Application, Emergency 264
*Data starting report period reflects the timing of site activation in the Regions and for which data are available through Solutions for Progress.
24

VALUE OF BENEFITS SOUGHT BY CATEGORY
Reporting Period Cumulative
June 1 –30, 2013 March 1, 2012- June 30, 2013
Category People Value People Value Food Assistance 19 $77,088 215 $723,156 Medical / Healthcare Assistance 46 $126,638 689 $1,896,817 Miscellaneous 7 $30,920 37 $158,465 Tax Assistance 1 $0 13 $23,513 TOTAL 70 $234,646 928 $2,801,951
Region 6: Texas Common Application Summary
Reporting Period
Cumulative
June 1 –30, 2013
March 1, 2012 – June 30, 2013
Households who completed Texas Common Application 52 626 Households with Children 34 419 Household Members 149 1,806 Children (under 18) 75 838 Adults (18-59) 68 886 Seniors (60+) 6 82
Region 6: SNAP Applications and Eligibility Estimations
A total of 36 clients/households applied for SNAP Food Benefits. The table below summarizes the applicants’ eligibility estimations.
Reporting Period Cumulative
June 1 –30, 2013 March 1, 2012 – June 30, 2013
Clients that applied for Food Benefits (SNAP) 36 380 Households estimated eligible for SNAP 19 214 Individuals within the eligible Household 47 479 Estimated annual allotment $77,088 $721,416 Average estimated annual allotment $4,057 $3,371 Average estimated monthly allotment $338 $281
25

Region 6: Medical Applications and Eligibility Estimations Twenty-seven clients in Region 6: Gulf Coast applied for Health Care Benefits (Medicaid for Families and CHIP). The table below illustrates the applicant’s eligibility estimations.
Reporting Period Cumulative June 1 –30, 2013
March 1, 2012 – June 30,
2013 Program Households People Households People Clients applying for Health Care Benefits (Medicaid or CHIP)
27 400
Considered eligible for CHIP 19 46 334 689 Considered eligible for Medicaid for Children and Pregnant Women
15 35 248 490
Clients applying for Cash Help For Families (TANF)
4 95
Considered eligible for TANF-related Medicaid
2 3 55 152
TOTAL 19 46 335 741 * Household members may be considered eligible for more than one program. The TOTAL provides a distinct count of people/household members eligible across all programs.
Region 6: Estimated Value of Health Benefits
Reporting Period Cumulative June 1 –30, 2013 March 1, 2012 – June 30, 2013 Program Households People Value Households People Value SNAP 19 19 $77,088 215 215 $723,156 CHIP 19 46 $126,638 334 689 $1,896,817 Medicaid for Children and Pregnant Women
TANF-related Medicaid TOTAL 37 70 $203,726 498 928 $2,619,973
*Although a household member may be considered eligible for several programs in the medical eligibility, they are only assigned to a single category for purposes of value of estimates.
26

Region 6: June 2013 Federal Tax Summary
TY2012 Federal Tax Summary TY2011 Federal Tax Summary Fed Tax Clients 1 - 0 - AGI - - - - Refunds - - - -
Tax Owed 1 $724 - -
Earned Income Credit - - - - Child Tax Credit - - - -
Additional Child Tax Credit - - - -
Region 6: Top Site Performers June 1 – 30, 2013
Site City Clients Served
Clients with Applications
Humble Area Assistance Ministries Humble 22 22 St. Vincent’s Episcopal House Galveston 11 10 Sweeny Community Hospital Sweeny 9 9 Corpus Christi Independent School District Corpus Christi 3 3 Houston Independent School District Houston 3 3 Healing Hands Ranch Willis 3 1 Delivering Children One Block at a Time Houston 3 3 The REACH Center Inc. Houston 2 1 Edinburg High School Edinburg 2 2 Elsik High School Edinburg 1 1 Just Do It Now, Inc. Wharton 1 1 Edinburg North High School Edinburg 1 1 Edinburg Consolidated Independent School District Edinburg 1 1
27

Region 6: Cumulative Top Site Performers March 1, 2012 – June 30, 2013
Site City Clients Served
Clients with Applications
Humble Area Assistance Ministries Humble 133 130 St. Vincent’s Episcopal House Galveston 120 111 Corpus Christi Independent School District Corpus Christi 114 111 Alief Independent School District Houston 57 55 Sweeny Community Hospital Sweeny 51 49 Johnny G. Economedes High School Edinburg 24 24 Edinburg High School Edinburg 23 23 Memorial High School-Alamo Alamo 21 20 Spring Branch Independent School District Houston 19 17 Edinburg North High School Edinburg 19 19 Houston Independent School District Houston 17 17 Children’s Defense Fund-Texas-Rio Grande Valley McAllen 15 15 Children’s Defense Fund-Houston Bellaire 12 9 PSJA North High School Pharr 11 10 PSJA High School San Juan 9 8 Delivering Children One Block at a Time Houston 8 8 Healing Hands Ranch Willis 7 6 The REACH Center Inc. Houston 5 3 Just Do It Now, Inc. Wharton 5 4 Next Level Christian Church-Kingdom Life Ministry Columbus 5 5 Lee High School Houston 4 4 Pharr-San Juan Alamo Independent School District Pharr 3 2 Spring Woods High School Houston 2 2 Jones High School Houston 2 2 The Foundation of Lashaun Dreams Rosenberg 2 1
28

Snapshot of Central Texas Region 7 TBB-TXTM Implementation Sites June 1, 2012 – June 30, 2013
CENTRAL TEXAS REGION 7 FACILITY SITES
*Please note these maps do not include the facility sites implemented in June 2013.
29

*Please note these maps do not include the facility sites implemented in June 2013.
30

REGION 7: CENTRAL TEXAS - MONTHLY REPORT Data Report Period: June 1, 2013 – June 30, 2013
• 17 Unique Clients Served • 13 Clients Completed 13 Applications • 49 New Counselors
Reporting Period Cumulative June 1 –30, 2013 May* 1, 2012 –
June 30, 2013 Clients/ Households Served 14 124 Household Members 26 299 Households where a Member is Disabled 6 72 Households with Children 5 54 Household Members in Households with Children 17 204 Children (under 18) 11 118 Adults (18-59) 14 162 Seniors (60+) 1 19
APPLICATIONS COMPLETED
Reporting Period
Cumulative
June 1 –30, 2013
June 1, 2012 – June 30, 2013
Application Clients Clients Texas Common Application 13 101 Voter Registration 1 FAFSA 2011-12 FAFSA 2012-13 FAFSA 2013-14 Federal TY2008 1040 Federal TY2009 1040 Federal TY2010 1040 Federal TY2011 1040 Federal TY2012 1040 1 Texas SNAP 40 Texas SNAP, Emergency 40 Texas Common Application, Emergency 40
*Data starting report period reflects the timing of site activation in the Regions and for which data are available through Solutions for Progress.
31

VALUE OF BENEFITS SOUGHT BY CATEGORY
Reporting Period Cumulative
June 1 –30, 2013 June 1, 2012 – June 30, 2013 Category People Value People Value Food Assistance 9 $28,152 75 $262,548 Medical / Healthcare Assistance 10 $27,530 82 $225,746 Miscellaneous Tax Assistance 1 $0
TOTAL 19 $55,682 155 $488,294
Region 7: Texas Common Application Summary
Reporting Period
Cumulative
June 1 –30, 2013 June 1, 2012 – June 30, 2013
Households who completed Texas Common Application 13 101 Households with Children 5 47 Household Members 25 242 Children (under 18) 11 101 Adults (18-59) 13 128 Seniors (60+) 1 13
Region 7: SNAP Applications and Eligibility Estimations
A total of eleven clients/households applied for SNAP Food Benefits, the table below illustrate the applicants eligibility estimations.
Reporting Period Cumulative June 1 –30, 2013 June 1, 2012 –
June 30, 2013 Clients that applied for Food Benefits (SNAP) 11 91 Households estimated eligible for SNAP 9 75 Individuals within the eligible Household 13 159 Estimated annual allotment $28,152 $262,548 Average estimated annual allotment $3,128 $3,501 Average estimated monthly allotment $261 $292
32

Region 7: Medical Applications and Eligibility Estimations
Five clients in Region 7 applied for Health Care Benefits (Medicaid for Families and CHIP). The table below illustrates the applicant’s eligibility estimations.
Reporting Period Cumulative June 1 –30, 2013 June 1, 2012 – June 30, 2013 Program Households People Households People Clients that applied for Healthcare (Medicaid or CHIP)
5 44
Considered eligible for CHIP 5 10 38 82 Considered eligible for Medicaid for Children and Pregnant Women
4 7 31 66
Clients applying for Cash Help for Families (TANF)
2 29
Eligible for TANF-related Medicaid 1 2 6 24 TOTAL* 5 11 38 88
* Household members may be considered eligible for more than one program. The TOTAL provides a distinct count of people/household members eligible across all programs.
Region 7: Estimated Value of Health Benefits
Reporting Period Cumulative June 1 –30, 2013 June 1, 2012 – June 30, 2013 Program Households People Value Households People Value SNAP 9 9 $28,152 75 75 $262,548 CHIP 5 10 $27,530 38 82 $225,746 Medicaid for Children and Pregnant Women
TANF-related Medicaid TOTAL 12 19 $55,682 90 155 $488,294
*Although a household member may be considered eligible for several programs in the medical eligibility,
they are only assigned to a single category for purposes of value of estimates.
33

Region 7: June 2013 Federal Tax Summary
Federal Tax Summary Data not available for this Region during this reporting period.
REGION 7: TOP SITE PERFORMERS JUNE 1 – 30, 2013
Site City Clients Served
Clients with Applications
Bluebonnet Trails Community Service Center- Round Rock Round Rock 8 7 Bluebonnet Trails Community Services- East Williamson County Taylor 3 2 Front Steps, Inc. Austin 1 1 Southwest Key Programs Austin 1 1 San Marcos CISD-Goodnight MS San Marcos 1 0 ECHO Austin 1 1 Bluebonnet Trails Community Services- Guadalupe Sequin 1 1 San Marcos CSD Central Office San Marcos 1 0
REGION 7: CUMULATIVE TOP SITE PERFORMERS JUNE 1, 2012 – JUNE 30, 2013
Site City Clients Served
Clients with Applications
Bluebonnet Trails Community Service Center- Round Rock Round Rock 45 34 Bluebonnet Trails Community Services- Guadalupe Sequin 18 16 Front Steps, Inc. Austin 12 10 St. Vincent de Paul, South Central Region Bastrop 12 11 Bluebonnet Trails Community Services- Eastern Williamson County Taylor 12 8 Southwest Key Programs Austin 11 11 Hutto Community Resource Center Hutto 5 2 San Marcos CISD-Crockett Elem San Marcos 4 4 ECHO Austin 3 2 San Marcos CISD- Travis Elem San Marcos 2 1 San Marcos CISD-Goodnight MS San Marcos 2 1 Hill Country Bible Church-Austin Austin 1 0 San Marcos CISD-San Marcos High San Marcos 1 1 Housing Authority of the City of Georgetown Georgetown 1 1 Bluebonnet Trails Community Services-Bastrop Bastrop 1 0 San Marcos CSD Central Office San Marcos 1 0
34

REGION 8: UPPER SOUTH TEXAS - MONTHLY REPORT Data Report Period: June 1, 2013 – June 30, 2013
• 6 Unique Clients Served • 6 Clients Completed 6 applications • 0 New Counselors
Reporting Period
Cumulative Period
June 1 – 30, 2013
January 1* – June 30, 2013
Clients/ Household Served 6 37 Household Members 7 40 Households where a Member is Disabled 1 9 Households with Children Household Members in Households with Children Children (under 18) Adults (18-59) 6 32 Seniors (60+) 1 8
APPLICATIONS COMPLETED Reporting
Period Cumulative
June 1 –30, 2013
January 1 – June 30, 2013
Application Clients Clients Texas Common Application 4 25 Voter Registration 1 FAFSA 2011-12 FAFSA 2012-13 FAFSA 2013-14 1 3 Federal TY2008 1040 Federal TY2009 1040 Federal TY2010 1040 Federal TY2011 1040 Federal TY2012 1040 1 7 Texas SNAP Texas SNAP, Emergency Texas Common Application, Emergency
*Data starting report period reflects the timing of site activation in the Regions and for which data are available through Solutions for Progress.
35

VALUE OF BENEFIT SOUGHT BY CATEGORY
Reporting Period Cumulative Period June 1 - 30, 2013 January 1 – June 30, 2013 Category People Value People Value Food Assistance 2 $4,800 18 $32,304 Medical / Healthcare Assistance 0 $0 0 $0 Miscellaneous 1 $3,865 3 $11,595 Tax Assistance 1 $252 7 $1,402 TOTAL 4 $8,917 28 $45,301
Region 8: Texas Common Application Summary of Benefits The Texas Common Application (H1010 & H1010-S) is the comprehensive application for SNAP Food Benefits, Health Care Benefits (Medicaid for Families and CHIP), and Cash Help for Families (TANF) programs. These programs are administered by the Texas Health and Human Services Commission (HHSC). The table below summarizes Region 8 Texas Common Applications.
Reporting Period
Cumulative Period
June 1 - 30, 2013
January 1 – June 30, 2013
Households who completed Texas Common Application 4 25 Households with Children 0 0 Household Members 4 25 Children (under 18) 0 0 Adults (18-59) 3 18 Seniors (60+) 1 7
36

Region 8: SNAP Applications and Eligibility Estimations
A total of three clients applied for SNAP Food Benefits. The table below summarizes the applicants’ eligibility estimations.
Region 8: Medical Applicants and Eligibility Estimations
Zero clients in Region 8 applied for Health Care Benefits (Medicaid for Families and CHIP). The table below illustrates the applicants’ eligibility estimations.
Reporting Period Cumulative Period June 1 - 30, 2013 January 1 – June 30, 2013 Households People Households People Clients applying for Health Care (Medicaid or CHIP)
0 0
Considered eligible for CHIP Program Considered eligible for Medicaid for Children and Pregnant Women
Clients applying for Cash Help for Families (TANF)
1 4
Considered eligible for TANF-related Medicaid TOTAL*
* Household members may be considered eligible for more than one program. The TOTAL provides a distinct count of people/household members eligible across all programs.
Region 8: Estimated Value of Health Benefits
Reporting Period Cumulative Period
June 1 - 31, 2013
January 1 – June 30, 2013
Clients applying for Food Benefits (SNAP) 3 24 Households estimated eligible for SNAP 2 18 Individuals within the eligible Household 2 18 Estimated annual allotment $4,800
$32,304 Average estimated annual allotment $2,400 $1,795 Average estimated monthly allotment $200 $150
37

Reporting Period Cumulative Period June 1 - 31, 2013 January 1 – June 30, 2013 Program Households People Valuation Households People Valuation SNAP 2 2 $4,800 18 18 $32,304 CHIP Medicaid for Children and Pregnant Women
TANF-related Medicaid TOTAL 2 2 $4,800 18 18 $32,304
*Although a household member may be considered eligible for several programs in the medical eligibility, they are only assigned to a single category for purposes of value of estimates.
Region 8: June 2013 Federal Tax Summary
TY2012 Federal Tax Summary TY2011 Federal Tax Summary Fed Tax Clients 1 - - - AGI - - - - Refunds 1 $252 - -
Tax Owed - - - -
Earned Income Credit - - - - Child Tax Credit - - - -
Additional Child Tax Credit - - - -
Region 8: Top Site Performers June 1 - 30, 2013
Region 8: Cumulative Top Site Performers January 1, 2013 – June 30, 2013
Site City Clients
Served Clients with Applications
Haven for Hope of Bexar County CareLink, University Health System
San Antonio San Antonio
40 1
35 0
Site
City
Clients Served
Clients with Applications
Haven for Hope Bexar County San Antonio 6 6
38

DATA AND METHODOLOGY FOR ELIGIBILITY AND VALUE ESTIMATES The data presented in this report for all sections derive from the Texas Benefit Bank Solutions for Progress Web-Based Reporting Platform. The eligibility and value estimates are based on the methodology and reporting used by Solutions for Progress. This methodology is explained below. Eligibility Assessments and Valuations TBB-TXTM provides eligibility assessments for Texas SNAP Food Benefits and for Health Care Benefits (Medicaid for Families and CHIP). TBB-TXTM eligibility assessments are based on Texas Health and Human Services Commission (HHSC) administrative policy but are not eligibility determinations. Only HHSC can make an eligibility determination. HHSC does not share information with Solutions for Progress regarding the outcome of a submitted application when the state makes this data available in aggregate form it will be added to the evaluation reports. TBB-TXTM makes use of Kaiser Family Foundation’s State Health Facts data set (http://www.statehealthfacts.org/) to estimate the valuation of medical benefits. The State Health Facts data set captures the federal government’s Center for Medicare and Medicaid Services reported spending per state per enrollee for adults, children, disabled, and seniors users. Note that since these estimates are based on averages, the actual value of services consumed will vary by enrollee and the particulars of their usage of covered medical services.
39