report to congress dedicated ethanol pipeline feasibility ... · report to congress . dedicated...
TRANSCRIPT

Report to Congress
Dedicated Ethanol Pipeline Feasibility Study
Energy Independence and Security Act of 2007
Section 243
U.S. Department of Energy March 2010

ii
NOTICE
This report was prepared as an account of work sponsored by an agency of the United States government. Neither the United States government nor any agency thereof, nor any of their employees, makes any warranty, express or implied, or assumes any legal liability or responsibility for the accuracy, completeness, or usefulness of any information, apparatus, product, or process disclosed, or represents that its use would not infringe privately owned rights. Reference herein to any specific commercial product, process, or service by trade name, trademark, manufacturer, or otherwise does not necessarily constitute or imply its endorsement, recommendation, or favoring by the United States government or any agency thereof. The views and opinions of authors expressed herein do not necessarily state or reflect those of the United States government or any agency thereof. This report is being disseminated by the Department of Energy. As such, the document was prepared in compliance with Section 515 of the Treasury and General Government Appropriations Act for Fiscal Year 2001 (Public Law 106-554) and information quality guidelines issued by the Department of Energy. Further, this report could be “influential scientific information” as that term is defined in the Office of Management and Budget's Information Quality Bulletin for Peer Review (Bulletin). This report has been peer reviewed pursuant to section II.2 of the Bulletin.
March 2010

Preface This study was prepared by the U.S. Department of Energy (DOE) in response to Section 243 of the Energy Independence and Security Act of 2007 (EISA). Section 243 directs DOE to study the feasibility of constructing and using pipelines dedicated to the transportation of ethanol. It specifically requires DOE to analyze the following:
(a) In General: The Secretary, in coordination with the Secretary of Transportation, shall conduct a study of the feasibility of the construction of pipelines dedicated to the transportation of ethanol. (b) Factors for Consideration: In conducting the study under subsection (a), the Secretary shall take into consideration
(1) the quantity of ethanol production that would make dedicated pipelines economically viable; (2) existing or potential barriers to the construction of pipelines dedicated to the transportation of ethanol, including technical, siting, financing, and regulatory barriers; (3) market risk (including throughput risk) and means of mitigating the risk; (4) regulatory, financing, and siting options that would mitigate the risk and help ensure the construction of 1 or more pipelines dedicated to the transportation of ethanol; (5) financial incentives that may be necessary for the construction of pipelines dedicated to the transportation of ethanol, including the return on equity that sponsors of the initial dedicated ethanol pipelines will require to invest in the pipelines; (6) technical factors that may compromise the safe transportation of ethanol in pipelines, including identification of remedial and preventive measures to ensure pipeline integrity; and (7) such other factors as the Secretary considers to be appropriate.
(c) Report: Not later than 15 months after the date of enactment of this Act, the Secretary shall submit to Congress a report describing the results of the study conducted under this Section.
As directed by the legislation, the study addresses the specified feasibility factors only as they pertain to the construction and use of dedicated pipelines for ethanol. Other options for transporting ethanol through pipelines, including batched piping and piping of blended products, are not addressed. A report by the Biomass Research and Development Board’s Distribution Infrastructure Interagency Working Group will address additional scenarios in a Pipeline Feasibility Analysis.
To facilitate in-depth analysis of the key feasibility parameters, the study focuses on the most likely route of a large, dedicated ethanol pipeline—one connecting the large ethanol-producing region of the Midwest with the large demand centers of the East Coast. This case study approach enables a quantitative analysis of the way in which various scenarios may affect economic feasibility. All barriers, risks, and supporting infrastructure investments represented in this model can be tailored for other dedicated ethanol pipeline projects in other locations.
iii

Executive Summary Dedicated Ethanol Pipelines The United States faces growing imperatives to develop diverse, sustainable, domestic energy resources and mitigate climate impacts from the use of fossil fuels. In the transportation sector, biofuel is the most viable replacement for liquid transportation fuel for the near term and can help achieve national goals for clean, secure, sustainable energy. A major increase in our Nation’s use of some renewable biofuels, such as ethanol, will require an economically viable infrastructure for fuel delivery. Section 243 of the U.S. Energy Independence and Security Act of 2007 (EISA) directs the Department of Energy (DOE) to study the feasibility of constructing and using pipelines dedicated to the transportation of ethanol.
This study considers the economic feasibility of a hypothetical ethanol pipeline linking large East Coast demand centers with a stable supply from the Midwest. Such a pipeline could ease congestion on the railroads, which currently carry more than 60 percent of the ethanol moving along this corridor. Without a dedicated pipeline, these rail lines would likely assume the burden of transporting a large share of the increased volumes of ethanol called for by the new Renewable Fuel Standard (RFS).
This analysis was approached by first assessing regional demand and ethanol production to determine the volume of ethanol that could be carried by a dedicated pipeline serving this corridor. An economic model incorporating factors such as market-based return on equity (ROE), pipeline construction costs, and other industry parameters was then developed and used to simulate various supply and demand scenarios and produce a range of minimum fees, or tariffs, for economical pipeline operation. Comparison of these fees with those charged for alternative transport modes provided an estimate of the minimum ethanol demand required to make the pipeline a competitive option.
In response to EISA requirements, the study also identifies barriers to pipeline construction, market risks, risk-mitigation measures, potential financial incentives, and other feasibility factors. The major findings in this report provide important insights into the factors affecting the feasibility of dedicated ethanol pipeline projects.
Major Findings Ethanol Volume Requirements: Based on current consumption projections, the ethanol volume likely to be transported by a dedicated pipeline from the Midwest to the East Coast was determined to be approximately 2.8 billion gallons per year (bgy) over the asset’s 40-year lifespan. This projection includes demand from low-level ethanol blends (10 percent ethanol, 90 percent gasoline or E10) used in conventional vehicles and high-level ethanol blends (85 percent ethanol, 15 percent gasoline or E85) used in flexible fuel vehicles (FFVs). Even with the financial incentives considered here, this volume is not sufficient to make the pipeline competitive with current modes of distribution (rail, barge, and truck). For the pipeline to be economically viable without major financial incentives, it would need to transport approximately 4.1 billion gallons of ethanol per year—a volume that exceeds projected demand in the target East Coast service area by 1.3 bgy. This level could be achieved in this region with a significant increase in demand for E85 and/or the widespread use of ethanol blends greater than 10 percent if an increase in the percent ethanol allowed for blending in motor gasoline is approved by the Environmental Protection Agency (EPA). Based on the assumed ethanol demand volume (2.8 bgy) and a project construction cost of $4.25 billion, the pipeline would need to charge an average tariff of 28 cents per gallon, substantially more than the current average rate for ethanol transport across current modes (rail, barge, and truck) along the same corridor (19 cents per gallon). Even at a lower pipeline construction cost
iv

($3.75 billion), significant financial incentives would be required to make the pipeline profitable if ethanol blends remain capped at 10 percent and E85 demand is not significantly expanded.
Existing or Potential Barriers to Construction: Prior to pipeline construction, siting issues and environmental impact assessments will constitute the key challenges for investors. Additional barriers identified include lack of financing, difficulties in obtaining permits, technical challenges in moving the ethanol, and delays caused by regulations and public resistance. Market Risks: An economic risk profile for a dedicated ethanol pipeline is subject to many uncertainties involving U.S. goals for fuel efficiency and use mandates. Federal policy is likely to play a pivotal role in the viability of the pipeline throughout its operating life, with the RFS providing the framework for a guaranteed market. Potential market risks include failure of ethanol production to meet RFS goals and/or the availability of non-ethanol biofuels to meet the goal; steadily declining demand for motor gas; inability to prove cellulosic ethanol technology at a commercial scale; and future termination of supportive policies. Credit shortages and unanticipated compliance costs also pose a risk for successful project completion. Risk-Mitigation Options: DOE, the Department of Transportation (DOT), and EPA need to collectively guide the efficient handling of siting and regulatory issues. Financial Incentives: Government financial incentives are vital for a dedicated ethanol pipeline to be able to compete with current rail transportation tariffs. In addition, the Federal Energy Regulatory Commission (FERC) will need to determine petroleum pipeline transportation rates for dedicated ethanol service. Technical Factors: Technical challenges associated with a dedicated ethanol pipeline involve pipeline integrity as well as fuel delivery and consumption issues. Addressing these issues will require continued study of stress corrosion cracking (SCC) to improve pipeline integrity and development of an internal SCC diagnostic tool for pipeline maintenance. The DOT is addressing pipeline safety and integrity threats through a comprehensive research program that will drive new knowledge into industry best practices and consensus standards. Compatibility associated with the potential use of the ethanol pipeline for a variety of non-ethanol biofuels including green gasoline and diesel should also be evaluated as a potential source for additional fuel volumes for transport. In an effort to remove technical barriers to increased market demand, existing fleet vehicle studies are examining system compatibility with blends above E10. Conclusions The study finds that in spite of the documented challenges and risks, a profitable, dedicated ethanol pipeline is feasible under certain scenarios. A pipeline would enhance the fuels delivery infrastructure, reduce congestion of rail, truck, and barge transportation, and would reduce greenhouse gas emissions when compared to current delivery methods. The faster product delivery cycles, more reliable delivery schedules, and increased safety will enhance the flexibility to accommodate any significant expansions in ethanol production and demand in the future.
A dedicated ethanol pipeline can become a competitive option if there is adequate demand for the ethanol (approximately 4.1 bgy for the hypothetical pipeline assessed). Demand for this volume of ethanol can only be generated by opening the market for blends greater than 10 percent ethanol and/or greatly expanding use of E85. A pipeline delivering this volume will be able to charge a competitive market rate and still provide sufficient investor return. In all cases, government financial incentives would likely be needed given current capital market constraints and the dependence on legislation to sustain support for ethanol demand.
v

Continuing stakeholder commitment is required to ensure a pipeline’s long-term viability. In addition to the pipeline itself, integrated infrastructure components, including terminals, gathering pipelines, and collection sites are needed to achieve optimal efficiencies. Research into the impact of blends greater than 10 percent ethanol on the existing vehicle fleet and increased FFV production are also necessary. Though this study focused on the Midwest to East Coast corridor, all of the barriers, risks, and integrated infrastructure investments would apply regardless of location for a dedicated ethanol pipeline.
Successfully integrating ethanol into the national fuels portfolio requires investment throughout the supply chain. For blending operations, both ethanol and gasoline must be at the delivery points in the quantities needed to reliably sustain a continuous supply. Attaining this essential balance requires careful judgment as to where and when to invest in fixed assets such as pipelines, ports, rail facilities, and terminals. These decisions require a reasonable degree of certainty about future patterns of biofuels supply and demand.
vi

Table of Contents
Preface............................................................................................................................................ iii
Executive Summary ....................................................................................................................... iv
Acronyms...................................................................................................................................... vii
1. Introduction.............................................................................................................................. 1 1.1 Industry Background and Context .........................................................................…………...1 1.2 Ethanol Supply Chain ............................................................................................ ...................2 1.3 Ethanol Transportation........................................................................................... ...................4
2. Methodology............................................................................................................................ 6 2.1 Key Assumptions ...................................................................................................…………...6 2.2 Projected Demand Analysis ...................................................................................…………...8
3. Major Findings....................................................................................................................... 10 3.1 Volume Requirements.................................................................................................………….10 3.2 Existing or Potential Barriers to Construction ............................................................………….11 3.3 Market Risks ...............................................................................................................………….12 3.4 Financial Incentives ....................................................................................................………….13
3.4.1 Costs and Capital Structure ......................................................................................................13 3.4.2 Investor-Required Return on Equity.........................................................................................13
3.5 Technical Factors ........................................................................................................………….14 4. Conclusions............................................................................................................................ 15
Endnotes........................................................................................................................................ 17
vii
Acronyms
ADM Archer Daniels Midland DOE U.S. Department of Energy DOT U.S. Department of Transportation EIA Energy Information Administration EISA Energy Independence and Security Act EPA Environmental Protection Agency FERC Federal Energy Regulatory Commission FFV flexible fuel vehicle GHG greenhouse gas MLP master limited partnership MTBE methyl tertiary-butyl ether PADD Petroleum Administration for Defense District PHMSA Pipeline and Hazardous Materials Safety Administration RBOB reformulated blend stock for oxygenate blending RFG reformulated gas market RFS Renewable Fuel Standard ROE return on equity ROW right-of-way RPMG Renewable Products Marketing Group SCC stress corrosion cracking USDA U.S. Department of Agriculture VEETC Volumetric Ethanol Excise Tax Credit
viii

1
1. Introduction This study fulfills the requirements under Section 243 of the Energy Independence and Security Act of 2007 (EISA). The purpose of this analysis is to determine whether or not, and under what circumstances, a dedicated ethanol pipeline is feasible.
Supportive U.S. government policies and the EPA ruling to phase-out methyl tertiary-butyl ether (MTBE) oxygenate in spring 2006 have facilitated ethanol production expansion. The sudden decision on MTBE and rapid expansion of ethanol production placed strains on the existing transportation infrastructure, which was not equipped to efficiently move large volumes of ethanol from the midcontinent producing region to the reformulated gas markets (RFGs) where the blend stock was required. Stress was most keenly felt by the rail industry, which accommodated the majority of cross-country movements. With increased ethanol transportation volumes and inefficiencies in the existing transportation network, evaluating the feasibility of a dedicated ethanol pipeline became a relevant topic to sustain continued expansion of ethanol as a renewable fuel.
Investments in major infrastructure projects are inherently complex decisions requiring rigorous supply/demand analysis under a range of price and operations scenarios. The return to investors, both equity and debt holders, is primarily dependent on the project’s cash flow, which must cover all operations, debt, and other costs over an estimated life of 40+ years. Expected returns on the investment thus rely on the degree of certainty of future cash flows extending over several decades. Given the turbulence in the economy and, more specifically, the fuels markets, investment decisions regarding a dedicated ethanol pipeline become an extraordinarily complex undertaking.
When assessing the long-term viability of a major infrastructure investment, some key fundamental questions need to be addressed:
• What are the risks involved with the project; how can they be managed and at what cost? • Who are the stakeholders, and what current or future alternatives might be financially
viable? • During times of significant financial and technology uncertainty, what should be the
primary drivers for decision making for long-term infrastructure assets?
This study addresses these critical questions and provides insights into the factors that might impede the execution of such a project, as well as mitigation strategies that can increase the feasibility of the ethanol pipeline project. The future of ethanol as a transportation fuel in the U.S. will ultimately be dependent on several convergent factors:
• National energy policy • Technology • Global competition for oil and gas resources • Price of oil • Geopolitical relationships • Climate change / greenhouse gases (GHG) emissions reduction policy
All of these issues impact the long-term viability of a dedicated ethanol pipeline.
2
1.1 Industry Background and Context The U.S. ethanol industry experienced modest but stable production levels throughout the 1980s and 1990s, primarily servicing niche markets, but with the turn of the millennium, industry dynamics dramatically changed. In 2005, Congress adopted the Renewable Fuel Standard (RFS) as part of the Energy Policy Act (EPAct05), mandating 7.5 billion gallons in 2012. In conjunction with the RFS, production legislation, blender tax credits and tariffs on imported ethanol further supported the ethanol industry’s development and shielded it from saturation by less expensive ethanol imports. In the spring of 2006, EPA required the phase out of MTBE as a gasoline oxygenate, opening the door for ethanol’s accelerated growth as the replacement.
In 2007, the RFS was greatly expanded under EISA, doubling the volumes required in 2012 and increasing the mandate to 36 billion gallons in 2022. Though corn ethanol anchors renewable fuel usage standards in the near term, EISA calls for substantial contributions from advanced biofuels beginning in earnest in 2012.
In addition to production mandates and favorable regulatory changes, Congress has also instituted demand-side incentives to ensure that the U.S. motor vehicle fleet is conducive to ethanol use. This has led to the increased production of flexible fuel vehicles (FFVs) that accept E85 fuel and a shift towards an E10 standard in many states.
While the industry recently experienced a period of unprecedented growth and profitability, it currently faces significant growing-pain challenges that are straining producers of all size and scale, challenges which have been compounded by the recession and the credit crisis.
1.2 Ethanol Supply Chain The successful integration of ethanol into the national fuels portfolio at industry scale requires capital investment at each phase of the supply chain. Since gasoline and ethanol are interdependent, both fuels must be present at the delivery point in the quantities needed to reliably sustain a continuous supply. This requires careful judgments about where and when to commit capital to fixed asset infrastructure such as pipelines, ports, rail facilities and fuels terminals as these are long lived assets. These capital expenditure decisions are undertaken weighing costs and benefits and supply and demand dynamics. The ethanol supply chain includes feedstock production and logistics, and biofuels production, distribution and end use. Feedstock is produced at the individual farm level and transportation to the ethanol plant is primarily the farmer’s responsibility, as most sell their product to the plant itself. Trucks currently dominate local transportation of feedstock to ethanol plants, due to their flexibility and smaller capacity. Farms within a 50 miles radius are the traditional feedstock suppliers for biorefineries.1 However, as biorefinery production capacity grows, rail grain shipments, both unit train and manifest, are increasing to meet feedstock demand. Figure 1 shows the locations of the nation’s ethanol production facilities.

3
Figure 1. Current and under-construction biorefineries
Once ethanol is produced, it must be brought to market. Blending and storage terminals play a major role at this stage, as the finished ethanol product must go to a blending terminal where it is blended with gasoline and then delivered to the final distribution points. Ethanol blending and storage terminals tend to exist near large demand destinations or near large waterways for rail to barge transloading. Figure 2 shows existing and currently planned over the projected ethanol production volumes.
Figure 2. Current and under-construction terminals
Under Construction/Planned
1B+ gallons/yr production (2009)
250-950mm gallons/yr production (2009)
Terminal

4
Though terminals are a critical component of the distribution infrastructure, they are most effective when they have the capacity to accept unit-train deliveries. Only 12 of the 19 ethanol receiving terminals that currently exist or are under construction have the capability to accept unit trains which further taxes the distribution network. The industry’s challenge with its current infrastructure is to ensure that pre-existing terminals and terminals under construction add unit-train capabilities in an effort to expedite delivery. Unit trains have the potential to make the transportation process more efficient through faster turn times and priority track access that shorten overall trip times. A dedicated pipeline could potentially provide a similar increase in efficiency in transporting ethanol from the production facilities to the major blending terminals.
Unlike MTBE, ethanol is blended at the terminal, rather than at the refinery. Therefore, refiners have had to transition from shipping a finished product to shipping a product that requires additional handling at blending terminals prior to retail distribution. This also requires that terminal operators have the capacity to receive, store, and blend quantities of ethanol. It is the blender that receives the Volumetric Ethanol Excise Tax Credit (VEETC) of 45 cents.
1.3 Ethanol Transportation In the U.S., most petroleum and petroleum products move through pipelines with the main injection points along the three coasts. The integrated infrastructure has evolved over decades and is safe and efficient in providing optimal use of capital and assets. In contrast, ethanol has been transported almost exclusively by rail and truck. The rapid expansion of ethanol in the fuels market has been dependent on rail infrastructure to deliver product from the Midwest to the major demand centers on the coasts. However in 2008, the U.S. pipeline operator Kinder Morgan commenced commercial pipeline transportation of ethanol batched with gasoline in an existing pipeline in Florida.
Ethanol is currently transported by rail (66%), truck (29%), and barge (5%) with less than 1% now moving via the Florida pipeline. Transporting ethanol is a complex undertaking reflecting the nature of its supply chain. Almost all ethanol is produced in the Midwest, while 80 percent of the U.S. population lives on the coasts.2 Ethanol must be gathered from the multitude of producers and shipped to primary demand centers in the East, West, and Gulf Coast. While the transportation network for conventional fuels shares the same demand centers as the ethanol industry, the production center is different, making it impossible to leverage the existing network for ethanol transportation (see Figures 3 and 4).

5
0 – 3,000
Gasoline Consumption (million gallons)
3,000 – 6,000
9,000 – 12,000
12,000 and above6,000 – 9,000
Gasoline DistributionPipelines – 81.3%Tankers and Barges – 18.7%
Figure 3. Current U.S. gasoline consumption and distribution
0 - 700
Ethanol Production (million gallons)
700 – 1,400
1,400 – 2,100
2,100 – 2,800
2,800 and above
Ethanol DistributionRail – 60%Truck – 30%Barge – 10%
Figure 4. Current U.S. ethanol production and distribution
6
2. Methodology
This feasibility study illustrates the market dynamics underlying investment in a new ethanol pipeline by analyzing a single plausible ethanol pipeline scenario under various market conditions. The most likely viable route would be a corridor originating in the Midwest, the current center of ethanol production, and terminating on the East Coast, a major demand center. For the purpose of this report, a stable ethanol supply is assumed to ensure reliable throughput. This report does not address the potential use of existing pipelines for transporting batched or blended ethanol.
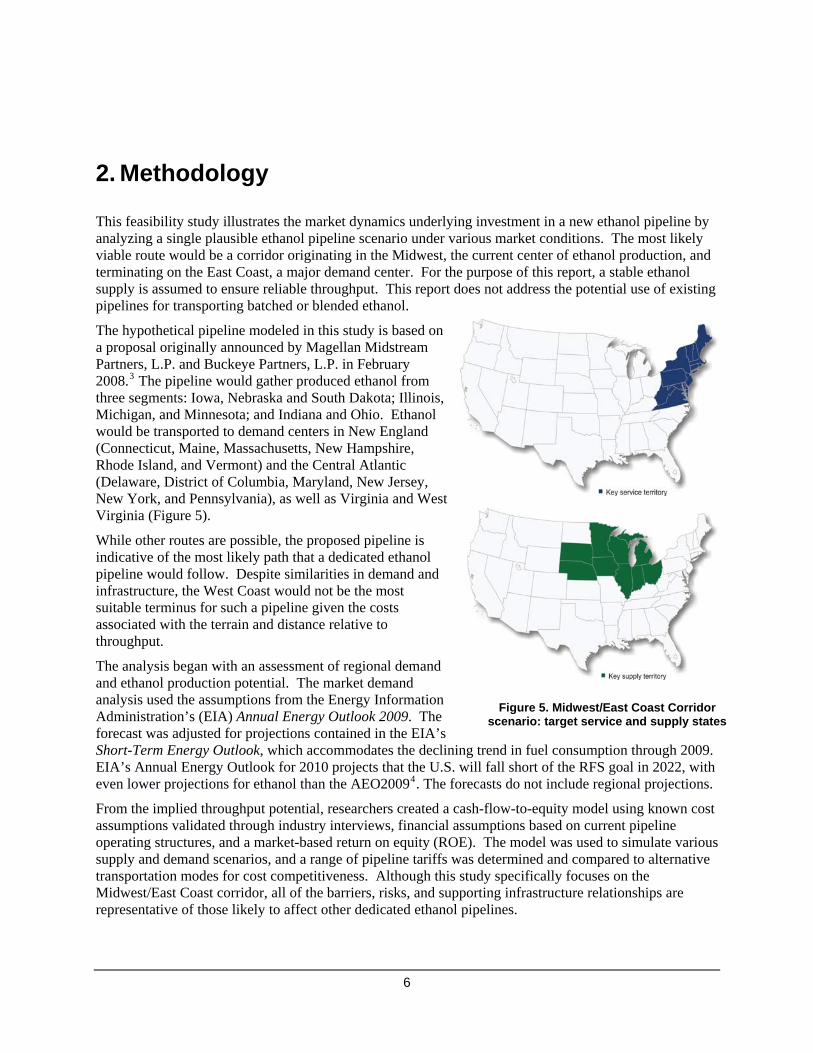
The hypothetical pipeline modeled in this study is based on a proposal originally announced by Magellan Midstream Partners, L.P. and Buckeye Partners, L.P. in February 2008.3 The pipeline would gather produced ethanol from three segments: Iowa, Nebraska and South Dakota; Illinois, Michigan, and Minnesota; and Indiana and Ohio. Ethanol would be transported to demand centers in New England (Connecticut, Maine, Massachusetts, New Hampshire, Rhode Island, and Vermont) and the Central Atlantic (Delaware, District of Columbia, Maryland, New Jersey, New York, and Pennsylvania), as well as Virginia and West Virginia (Figure 5). While other routes are possible, the proposed pipeline is indicative of the most likely path that a dedicated ethanol pipeline would follow. Despite similarities in demand and infrastructure, the West Coast would not be the most suitable terminus for such a pipeline given the costs associated with the terrain and distance relative to throughput.
The analysis began with an assessment of regional demand and ethanol production potential. The market demand analysis used the assumptions from the Energy Information Administration’s (EIA) Annual Energy Outlook 2009. The forecast was adjusted for projections contained in the EIA’s Short-Term Energy Outlook, which accommodates the declining trend in fuel consumption through 2009. EIA’s Annual Energy Outlook for 2010 projects that the U.S. will fall short of the RFS goal in 2022, with even lower projections for ethanol than the AEO20094. The forecasts do not include regional projections.
From the implied throughput potential, researchers created a cash-flow-to-equity model using known cost assumptions validated through industry interviews, financial assumptions based on current pipeline operating structures, and a market-based return on equity (ROE). The model was used to simulate various supply and demand scenarios, and a range of pipeline tariffs was determined and compared to alternative transportation modes for cost competitiveness. Although this study specifically focuses on the Midwest/East Coast corridor, all of the barriers, risks, and supporting infrastructure relationships are representative of those likely to affect other dedicated ethanol pipelines.
Figure 5. Midwest/East Coast Corridor scenario: target service and supply states

7
2.1 Key Assumptions The following is a list of key assumptions used in this study:
• Ethanol from the pipeline would satisfy demand in a service territory comprising Petroleum Administration for Defense District (PADD) Subdistrict I A (New England: Connecticut, Maine, Massachusetts, New Hampshire, Rhode Island, and Vermont) and PADD Subdistrict I B (Central-Atlantic: Delaware, Maryland, District of Columbia, New Jersey, New York, and Pennsylvania), in addition to Virginia and West Virginia. Table 1 lists key information affecting ethanol demand in the defined territory.
Table 1. Key service territory information
Population in the Service Territory
(Million)
Vehicles in the Service Territory
(Million)
2007 Motor Gasoline Demand
(Million Gallons/Day)
2007 E85 FFV Demand (Million
Gallons/Day)
71.6 52.5 75.7 0.006
FFV = flexible-fuel vehicle.
• The pipeline would gather ethanol production from three geographical segments: Iowa, Nebraska, and South Dakota; Illinois, Michigan, Minnesota, and Wisconsin; and Indiana and Ohio. Current average shipping tariffs across modes (i.e. rail, truck and barge) to New York Harbor are 22, 17, and 10 cents, respectively, for each of the three geographical segments. The average tariff across segments is 19 cents.
• Ethanol consumption in the service demand territory is assumed to grow until all blended fuels, excluding E85, are E10. In the analysis, the ratio is extended to blends greater than 10 percent (E10+) for illustrative purposes only.5
• Ethanol consumption in the service demand territory through high-ratio blends (i.e., E85) is estimated to grow according to the projected level of FFV adoption in the region.
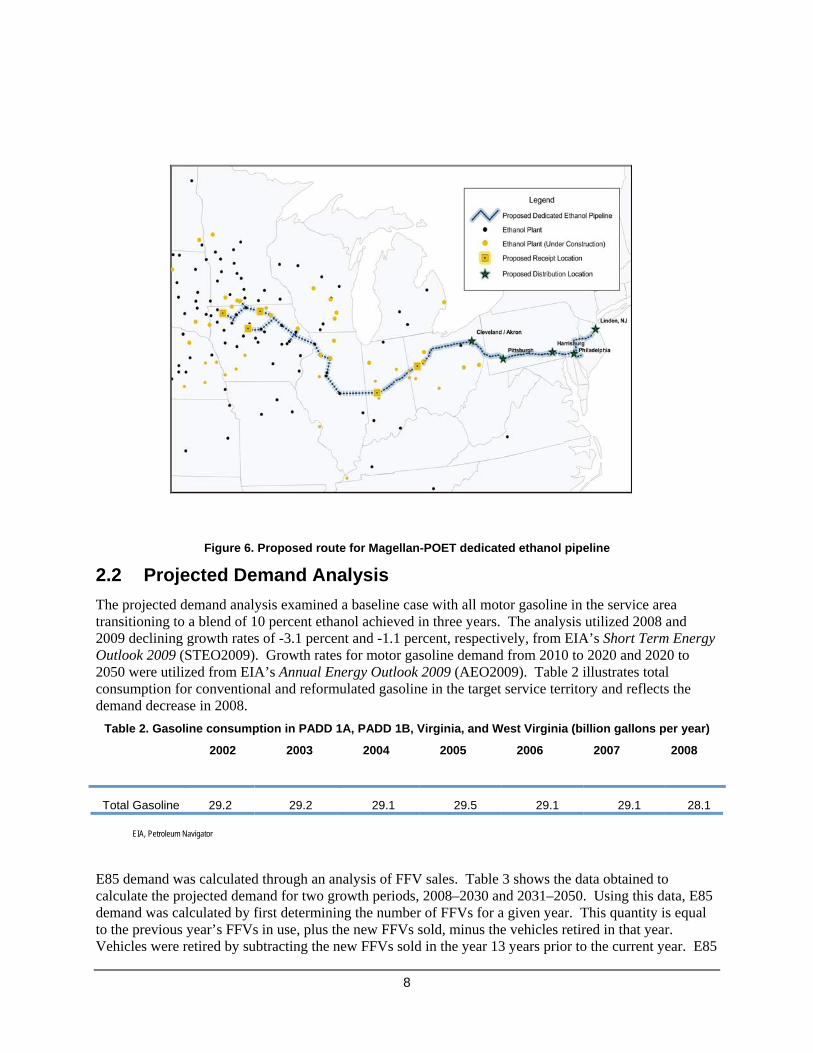
• The pipeline is assumed to be 25 inches in diameter with a maximum capacity of 4.5 bgy or approximately 12 million gallons per day, as proposed by the Magellan-Buckeye project. The route is shown in Figure 6.
• Financing costs for the project resemble those of existing Master Limited Partnerships (MLPs), with adjustments for risk relative to a dedicated ethanol pipeline.6
• The cost is expected to exceed $3 billion for construction of 1,700 miles of pipeline.7 Total project costs were not modeled beyond $4.25 billion.
• The economic life of the pipeline is assumed to be 40 years.
8
Figure 6. Proposed route for Magellan-POET dedicated ethanol pipeline .2 Projected Demand Analysis
ase with all motor gasoline in the service area
rgy
he
ion in PADD 1A, PADD 1B, Virginia, and West Virginia (billion gallons per year)
Total Gasoline 29.2 29.2 29.1 29.5 29.1 29.1 28.1
2The projected demand analysis examined a baseline ctransitioning to a blend of 10 percent ethanol achieved in three years. The analysis utilized 2008 and2009 declining growth rates of -3.1 percent and -1.1 percent, respectively, from EIA’s Short Term EneOutlook 2009 (STEO2009). Growth rates for motor gasoline demand from 2010 to 2020 and 2020 to 2050 were utilized from EIA’s Annual Energy Outlook 2009 (AEO2009). Table 2 illustrates total consumption for conventional and reformulated gasoline in the target service territory and reflects tdemand decrease in 2008.
Table 2. Gasoline consumpt
2002 2003 2004 2005 2006 2007 2008
EIA, Petroleum Navigator
E85 demand was calculated through an analysis of F he data obtained to a, E85
Vehicles were retired by subtracting the new FFVs sold in the year 13 years prior to the current year. E85
FV sales. Table 3 shows tcalculate the projected demand for two growth periods, 2008–2030 and 2031–2050. Using this datdemand was calculated by first determining the number of FFVs for a given year. This quantity is equal to the previous year’s FFVs in use, plus the new FFVs sold, minus the vehicles retired in that year.

9
volumes were calculated by multiplying the FFVs for that year by the average annual mileage of 11,miles, and dividing by the fuel efficiency for that year.
500
Table 3. E85 demand analysis data breakdown
2008 – 2030 2031 – 2050 FFVs in Use as of 2006a New FFV Sales
projected)b
Grow New Sales by 2.0% each year from 2030 Grow Fuel Effici by 1.2% each (projected)b
Fuel Efficiency for FFVs (
ency for FFVsyear
Assump mand tions for E85 De verage annual mileage = 11,500 miles DE, MD, VA, & WV account for 29
Average Vehicle Retirement Age = 13 years Vs using E85 = 1% in 2006 to
A% of the South Percent of FF
Atlantic census region sales 80% by 2030 a Alternative to Traditional Transportation Fuels, Part II b EIA, AEO2009
After analy e, scenarios examining the impact of increasing ethanol blends beyond 10 percent were explored. The scenarios would equate to increasing the demand volume of ethanol content
scenario for 2015, 2020, 2025, and 2030 (billion gallons per year)
Over an
Baseline Case 2.71 2.73 2.82 2.93 2.83
zing the baseline cas
in gasoline to 12 and 15 percent ethanol, respectively. The same data and growth rates were used for both scenarios, however, the calculations allowed for varying the blend ratio of ethanol in motor gasoline. These volumes could also be achieved by accelerating E85 use. Table 4 provides the results of the analysis for each scenario analyzed.
Table 4. Analysis results of each
2015 2020 2025 2030 Average Lifesp
Increased Demand Scenario 1 3.30 3.29 3.37 3.45 3.35
Increased Demand Scenario 2 4.11 4.07 4.12 4.17 4.07

10
3. Major Findings
3.1 Volume Requirements Vehicle fuel consumption in the defined service territory was modeled using historic fuels sales as the basis to develop projections for future consumption of both E10 and E85. The projected ethanol volume available to support a dedicated ethanol pipeline was determined to be approximately 2.8 bgy over the asset’s life, which was assumed to be 40 years. At these volumes, the pipeline would likely require an average tariff in the 28 cents per gallon range at a project cost of $4.25 billion. This cost exceeds both the $3.0 billion estimate provided by Buckeye Partners and Magellan Midstream Partners and subsequent $3.5 billion estimate provided by Magellan and POET. This was deemed to be a reasonable high-end assumption based upon past pipeline projects and provides for a conservative tariff estimate. The 28 cents per gallon average tariff is higher than the current average tariff for transporting ethanol via existing modes. As previously noted, the current average tariff paid by ethanol producers likely to use the pipeline is approximately 19 cents. This cost represents the average cost of transport across current modes (rail, truck, and barge) along the assumed pipeline corridor. Through a combination of increased ethanol volumes and financial incentives (e.g. a federal cost share or loan guarantee), the required average tariff could be reduced to a market-competitive rate (i.e., 19 cents) even under the high-end cost assumption. Table 5 summarizes the sensitivity of the project to different combinations of cost, throughput, and financial incentives to achieve the target ROE. As Table 5 indicates, a tariff of 19 cents or less could potentially be achieved, but only with a substantial increase in demand volume, and in most cases, only with financial incentives.
Table 5. Estimated ethanol pipeline tariffs with and without financial incentives
Estimated Ethanol Pipeline Tariff (cents/gallon)
Construction Cost ($ billion)
Throughput (billion
gallons/year)* $4.25 $4.0 $3.75
2.8 28 27 25
3.4 24 22 21 Without Financial Incentives
4.1 19 18 16
2.8 23 22 20
3.4 19 18 17 With Financial Incentives
4.1 16 15 14
*Throughput beyond 2.8 bgy requires additional delivery infrastructure and expanded FFV availability. Bolded box highlights tariffs for throughput volumes shown in Figure 7.
Figure 7 illustrates projected demand for ethanol in the targeted region and depicts tariffs assuming government financial incentives and a high-end construction cost of $4.25 billion. As shown, if

11
conventional vehicles can only use blends up to E10, the pipeline would effectively need to move every gallon of ethanol demanded in the target region to reach a tariff of 23 cents. Large increases in E85 volumes would also reduce the projected tariff.
Figure 7. Projected ethanol volume with financial incentives at $4.25 billion
Even if the low estimate for pipeline construction costs ($3.75 billion) is assumed, significant incentives would be required to make a pipeline competitive if ethanol blends remain at 10 percent. For the project to be economically viable without major financial incentives, the level of throughput would need to reach approximately 4.1 bgy, a level that could be achieved only with a significant unprecedented increase in demand for E85 and/or the introduction of ethanol blends greater than 10 percent in the service territory. With financial incentives, a throughput of approximately 3.4 bgy would be needed; a level that could only be achieved with a significant increase in demand for E85 in the service territory and/or the introduction of a volume equivalent to all of the gasoline in the service area being blended with 12 percent ethanol. If pipeline costs exceed $4.25 billion, to be competitive with other transport modes, the pipeline would likely require ethanol demand volumes that could only be achieved through widespread use of blends greater than 10 percent ethanol.
3.2 Existing or Potential Barriers to Construction Financial, siting, technical, and/or regulatory barriers associated with the construction of a dedicated ethanol pipeline could pose challenges to both pipeline development and operations.
1. Financial
• The return to investors, both equity and debt holders, depends primarily on the project’s cash flow, which must cover all operations, debt, and other costs over an estimated life of

12
40+ years. Expected returns on investment thus rely on the degree of certainty of future cash flows extending over several decades. Given the recent turbulence in the economy and fuels markets, investment in a dedicated ethanol pipeline is a more complex undertaking than usual. The analysis demonstrates that a pipeline is unlikely to be cost-competitive with other transportation options in the absence of large, guaranteed supply and demand volumes. In addition, the Federal Energy Regulatory Commission (FERC) will need to determine biofuel pipeline transportation rates for dedicated ethanol service. This action would further refine the ROE.
• In today’s constrained capital markets, a dedicated ethanol pipeline is unlikely to find affordable financing. Demand and supply uncertainty, high equity exposure (relative to debt), and the absence of in-place sales agreements would make this a challenging project even during normal times. The government, therefore, would likely need to provide financial support to make a pipeline project feasible.
2. Siting
• Federal oversight for siting of a new pipeline right-of-way (ROW) does not apply to petroleum or hazardous liquid pipelines. To complete the necessary environmental assessments, a proposed pipeline and operator would need to commit to ROW options prior to construction and without Federal oversight. If obtaining ROW proves too costly, the pipeline would be faced with the nearly impossible task of seeking eminent domain provisions at local levels.8
3. Technical
• Internal stress corrosion cracking (SCC) results in hairline fractures that can be caused by ethanol’s molecular corrosiveness. Although SCC has been found in terminal infrastructure, research funded by the pipeline industry and the Pipeline and Hazardous Materials Safety Administration within DOT found that an ethanol pipeline can operate safely and without SCC when appropriate measures are taken. These measures include the replacement of elastomers with ones conducive for ethanol service, the reduction of the dissolved oxygen in ethanol to levels shown not to generate SCC, and the implementation of oxygen monitoring to indicate mitigated SCC operational exposure. Moreover, Kinder Morgan’s multipurpose pipeline in Florida, now batching ethanol, has not encountered any SCC issues to date. Further investigation is underway to better understand the mechanisms behind SCC so that industry best practices and safety based consensus standards are developed. Compatibility associated with the potential use of the ethanol pipeline for a variety of non-ethanol biofuels including green gasoline and diesel should also be evaluated.
4. Regulatory
• Environmental assessments for a dedicated ethanol pipeline could face more than average complications due to its first-of-a-kind nature and a growing public resistance to the ethanol industry. Delays could prove detrimental to pipeline’s economic viability.
In addition to posing potential barriers to pipeline development and operations, these same challenges may make it difficult to attract investors to proposed pipeline construction projects.

13
3.3 Market Risks The economic feasibility of a dedicated ethanol pipeline is only one aspect in evaluating the overall market competitiveness. Policy and regulatory factors also will come into play and could include fuel efficiency requirements and environmental legislation, i.e. related to GHG emissions, or the RFS. Government policy is likely to play an integral role in the commercial viability of the asset throughout its operating life.
• Several supportive policy measures currently help ensure ethanol’s long-term viability, including the RFS mandate, the VEETC, and the current tariff on ethanol imports to the U.S. market. Removal of these legislative measures would pose serious consequences for the feasibility of a dedicated ethanol pipeline.
• While corn ethanol production is expected to keep pace with the RFS mandate, the recent economic downturn has caused some existing ethanol plants to idle production or shutter operations. In the short term, this could decrease the ethanol production volumes originally projected. This could also decrease the amount of ethanol available for throughput in a dedicated pipeline.
• Gasoline demand may decrease with continued economic contraction, oil price volatility, increased fuel efficiency standards, and novel technologies beyond those considered in this analysis. Incremental reduction in motor gas demand would reduce ethanol demand in the pipeline service territory.
• Cellulosic biofuel is among the next generation of biofuels that will be needed in increasingly large quantities to meet future RFS targets. Cellulosic biofuel technology is currently unproven at a commercial scale, and recent credit shortages have inhibited capital expansion. In addition, cellulosic feedstock supply and delivery infrastructure is in the early development stage making locations of biorefineries relative to pipeline origin uncertain.
• The emergence and use of non-ethanol biofuels could create market implications for ethanol pipeline transportation. Non-ethanol biofuels could command an increased market share and create a decrease in the relative demand for ethanol biofuels. However pipelines used for ethanol could potentially be used for multiple products, including other types of biofuels produced in the Midwest and transported to the East Coast.
• A dedicated ethanol pipeline could be impacted by future GHG legislation. The method under which lifecycle impacts are calculated is of particular importance, and future GHG emission rents may affect potential pipeline throughput.
• Certain regulatory compliance issues must be satisfied for a dedicated ethanol pipeline, specifically Pipeline and Hazardous Materials Safety Administration’s (PHMSA) Title 49 Part 194 Response Plans for Onshore Oil Pipelines and Part 195 Transportation of Hazardous Liquids by Pipeline. PHMSA has developed and is sharing a Biofuels Regulatory Checklist with potential pipeline operators, conveying the relevance of its requirements and lowering regulatory uncertainty.
Though the analyzed ethanol pipeline would face significant challenges and carry the aforementioned risks, several mitigation strategies are available, depending on the government’s willingness to support a

14
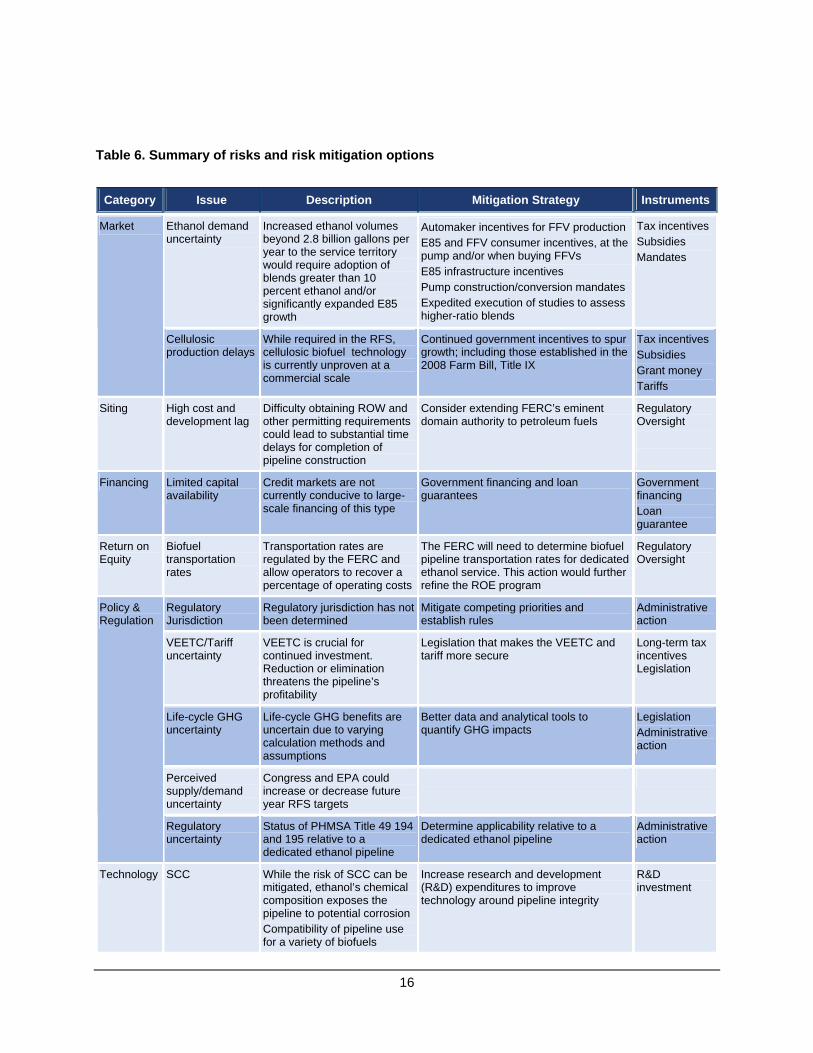
pipeline financially and through other incentives. Table 6 summarizes the key risks and options for mitigating those risks. In addition to the incentives outlined in Table 6, DOE, DOT, and EPA would need to work in concert to support the efficient handling of siting issues and regulatory action.
3.4 Financial Incentives
3.4.1 Costs and Capital Structure Construction costs for a dedicated ethanol pipeline in the hypothetical case could exceed $3.5 billion or approximately $2 million per mile. Given the results of the analysis documented in this report, taking into consideration comparable transportation modes and available throughput, construction costs would have to remain below $2.5 million per mile or approximately $4.3 billion total for the pipeline to be economically feasible with financial incentives. High uncertainty and sensitivity to return make cost control an absolute imperative for project feasibility.
A generally accepted industry rule of thumb estimates pipeline construction costs between $1 million and $5 million per mile. A refined estimate of $4.5 million per mile was developed using recent trends in construction costs for oil and gas pipelines, and considering expected pipeline length and diameter. While it is likely that the hypothetical dedicated ethanol pipeline could cost considerably less than $4.5 million per mile due to the existing ROW and other factors, the $2 million per mile announced by the companies would still be positioned towards the low end of the mean estimation, which seems optimistic when considering the associated technical and financial market challenges.
3.4.2 Investor-Required Return on Equity To attract investors, a dedicated ethanol pipeline would need to provide a relatively high ROE in comparison to existing pipeline infrastructure assets—given the associated risks. FERC has not yet provided an opinion on the ROE for a dedicated ethanol pipeline.
• A sample ROE for existing MLPs is 11.1 percent.9
• Assuming the hypothetical dedicated ethanol pipeline would employ an MLP structure, it was determined that the investor-required ROE for a dedicated ethanol pipeline, given existing technical and other risks, is likely to be approximately 15 percent.10
A federal government loan guarantee could be used to bolster the competitiveness of a dedicated ethanol pipeline. Beyond the loan guarantee, a federal cost-sharing agreement would likely have the greatest additional impact.
• A federal loan guarantee could lower the required tariff by approximately 3 to 5 cents per gallon.
3.5 Technical Factors The following technical factors associated with a dedicated ethanol pipeline have been identified and may warrant further examination:
• Vehicle studies to examine compatibility with blends greater than 10 percent ethanol.11

15
• Studies to expedite the approval of the American Society for Testing and Materials for delivery equipment.
• Expanded SCC studies to provide a definitive opinion on the impact of SCCs.
• An internal SCC diagnostic tool to help accelerate technology for the maintenance of the pipeline.
• Pipeline compatibility for transporting a variety of biofuels.
DOT is addressing pipeline safety and integrity threats through a comprehensive research program that will drive new knowledge into industry best practices and consensus standards. Multiple research efforts are targeting the last three bullets.
16
Table 6. Summary of risks and risk mitigation options
Category Issue Description Mitigation Strategy Instruments
Ethanol demand uncertainty
Increased ethanol volumes beyond 2.8 billion gallons per year to the service territory would require adoption of blends greater than 10 percent ethanol and/or significantly expanded E85 growth
Automaker incentives for FFV production E85 and FFV consumer incentives, at the pump and/or when buying FFVs E85 infrastructure incentives Pump construction/conversion mandates Expedited execution of studies to assess higher-ratio blends
Tax incentives Subsidies Mandates
Market
Cellulosic production delays
While required in the RFS, cellulosic biofuel technology is currently unproven at a commercial scale
Continued government incentives to spur growth; including those established in the 2008 Farm Bill, Title IX
Tax incentives Subsidies Grant money Tariffs
Siting High cost and development lag
Difficulty obtaining ROW and other permitting requirements could lead to substantial time delays for completion of pipeline construction
Consider extending FERC’s eminent domain authority to petroleum fuels
Regulatory Oversight
Financing Limited capital availability
Credit markets are not currently conducive to large-scale financing of this type
Government financing and loan guarantees
Government financing Loan guarantee
Return on Equity
Biofuel transportation rates
Transportation rates are regulated by the FERC and allow operators to recover a percentage of operating costs
The FERC will need to determine biofuel pipeline transportation rates for dedicated ethanol service. This action would further refine the ROE program
Regulatory Oversight
Regulatory Jurisdiction
Regulatory jurisdiction has not been determined
Mitigate competing priorities and establish rules
Administrative action
VEETC/Tariff uncertainty
VEETC is crucial for continued investment. Reduction or elimination threatens the pipeline’s profitability
Legislation that makes the VEETC and tariff more secure
Long-term tax incentives Legislation
Life-cycle GHG uncertainty
Life-cycle GHG benefits are uncertain due to varying calculation methods and assumptions
Better data and analytical tools to quantify GHG impacts
Legislation Administrative action
Perceived supply/demand uncertainty
Congress and EPA could increase or decrease future year RFS targets
Policy & Regulation
Regulatory uncertainty
Status of PHMSA Title 49 194 and 195 relative to a dedicated ethanol pipeline
Determine applicability relative to a dedicated ethanol pipeline
Administrative action
Technology SCC While the risk of SCC can be mitigated, ethanol’s chemical composition exposes the pipeline to potential corrosion Compatibility of pipeline use for a variety of biofuels
Increase research and development (R&D) expenditures to improve technology around pipeline integrity
R&D investment
17
4. Conclusions In spite of the documented challenges and risks, the results of this analysis suggest that a profitable dedicated ethanol pipeline is feasible under certain scenarios. A pipeline would enhance the fuels delivery infrastructure and reduce congestion on rail, truck, and barge and would reduce GHG emissions when compared to current delivery methods. The faster product delivery cycles, more reliable delivery schedules, and increased safety will enhance the flexibility to accommodate any significant expansions in ethanol production and demand in the future.
The sensitivity analyses conducted for this study suggest that, in order to ensure necessary volumes to yield a market competitive rate while providing sufficient investor return, greatly expanded use of E85 and/or the evolution of fuels with greater than 10 percent ethanol would be required. In all scenarios considered, government financial assistance were deemed necessary given current capital market constraints and the project’s dependence on legislation to sustain demand support.
Sustained stakeholder participation and commitment will be required to ensure the pipeline’s long-term viability. In addition to the pipeline itself, substantial integrated infrastructure comprised of terminals, smaller gathering pipelines, and collection locations is needed to facilitate optimal efficiencies. Research into the impact of higher ratio blends greater than 10 percent ethanol on the existing vehicle fleet and FFV production are also fundamental. Though this study specifically focused on the Midwest to East Coast corridor, all of the barriers, risks and integrated infrastructure investments hold true regardless of location for a dedicated ethanol pipeline.
The successful integration of ethanol into the national fuels portfolio at industry scale requires capital investment at each phase of the value chain. Since gasoline and ethanol are interdependent, both fuels must be present at the delivery point in the quantities needed to reliably sustain a continuous supply. This will require careful judgments about where and when to commit capital to fixed asset infrastructure such as pipelines, ports, rail facilities and fuels terminals due to their capital cost and long life. These investment decisions are fundamentally challenged without a reasonable degree of certainty about future patterns of biofuels supply and demand.
While presenting a unique set of challenges, using existing pipelines to transport biofuels in batches or blended with gasoline would confer the same advantages without the major capital infrastructure investment. A report by the Biomass Research and Development Board’s Distribution Infrastructure Interagency Working Group will address additional scenarios in a Pipeline Feasibility Analysis.

18
Endnotes 1U.S. Department of Agriculture. “Ethanol Transportation Backgrounder.” September 2007. 2USDA, “Ethanol Transportation Backgrounder.” September 2007. 3Since the February 2008 announcement, Buckeye has discontinued its role in the study. In March 2009, Magellan and POET signed a joint development agreement to continue assessing the feasibility of a dedicated 1,700 mile pipeline moving ethanol from the Midwest to the major Northeastern markets. Pipeline costs were estimated to exceed $3.5 billion. A revised press release issued in January 2010, increased the estimated length of the pipeline to 1,800 miles and the cost estimate to $4 billion. 4The preliminary release of the AEO2010 forecasts 16.33 billion gallons per year (bgy) of ethanol (2.1 bgy of which is cellulose based) by 2022 and 8.8 bgy non-ethanol biofuels. This represents a slight decrease to the AEO2009 projections used in this analysis. By 2035, EIA projects that the U.S. will exceed the RFS and forecasts 20.11 bgy ethanol (5.11 bgy cellulose based) and 22.54 non-ethanol biofuels. 5Conventional vehicles can only use up to 10-percent ethanol today (E10); however, DOE and others are evaluating the potential impacts of intermediate blends (e.g., E15, E20) to determine whether these fuels can be used in conventional vehicles without modification. 6MLPs offer the tax benefits of a limited partnership with the liquidity of publicly traded securities; the vast majority are pipeline businesses. Existing MLPs were determined to have a cost of debt of 9.38 percent with a 60/40 debt-to-equity ratio. With financing from the federal government and a loan guarantee, the cost of debt was reduced to 5.7 percent and the debt-to-equity ratio was increased to 90/10. ROE was determined to be in the 11 percent range for existing MLPs. A dedicated ethanol pipeline would likely require an ROE in the 15 percent range (see section on financial incentives). 7Magellan Midstream Partners, L.P. “Magellan Midstream Partners and Buckeye Partners Announce Joint Assessment of Dedicated Ethanol Pipeline.” Magellan Midstream Partners website, February 19, 2008. http://www.magellanlp.com/news/2008/20080219_4.htm. (The $3 billion includes full costs of construction along an existing right of way.) 8Finding new rights of way for hundreds of miles through various jurisdictions, residential patterns, and natural settings is considered by many in the industry to be nearly impossible. Liquid pipeline companies do not have access to federal eminent domain as interstate natural gas pipeline companies do. This means that rights of way must be acquired county by county and state by state through voluntary agreements with landowners or through the use of generally less favorable (to the pipeline) state eminent domain laws. This could be changed by law if the Federal Energy Regulatory Commission’s eminent domain authority were expanded to include petroleum and ethanol pipelines. 9Return on equity (ROE) was determined using the Federal Energy Regulatory Commission’s discounted cash flow (DCF) methodology for equity return. The sample MLP set includes: Buckeye Partners, L.P.; Holly Energy Partners; Kinder Morgan Energy Partners; Magellan Midstream Partners, L.P.; Martin Midstream Partners; NuStar Energy; Sunoco Logistics Partners; TEPPCO Partners; and TransMontaigne Partners. 10MLP returns were compared to alternative energy investments to derive a composite return based on the Federal Energy Regulatory Commission’s DCF model. The sample set included Andersons, Inc.; Pacific Ethanol, Inc.; and Aventine. 11DOE is currently managing intermediate-blend studies that could help inform a decision on allowing the use of higher ethanol blends in existing vehicles.