report on long-term guarantees measures and measures on … · an annual report from eiopa on the...
TRANSCRIPT

EIOPA – Westhafen Tower, Westhafenplatz 1 - 60327 Frankfurt – Germany - Tel. + 49 69-951119-20; Fax. + 49 69-951119-19; email: [email protected] site: www.eiopa.europa.eu
EIOPA-BoS-16/279
16 December 2016
Report on long-term guarantees measures
and measures on equity risk
2016

2/145
Table of Contents
Executive Summary ............................................................................................3
I. Introduction ..............................................................................................6 I.1 Review of the LTG measures and measures on equity risk ............................................. 6 I.2 Legal background ..................................................................................................... 7 I.3 Data ....................................................................................................................... 8 I.4 Introduction to Solvency II quantitative requirements ................................................... 8 I.5 Overview of the European insurance market .............................................................. 10
II. Overview of the use and the impact of LTG measures and measures on equity
risk ................................................................................................................ 12 II.1 Use of the measures .............................................................................................. 12 II.2 Impact of the measures on the financial position of undertakings ................................ 16 II.3 Impact on policyholder protection ............................................................................ 28 II.4 Impact on undertakings’ investments ....................................................................... 29 II.5 Impact on consumers and products ......................................................................... 32 II.6 Impact on financial stability .................................................................................... 36
III. Specific analysis for each of the measures .............................................. 37 III.1 Extrapolation of the risk-free interest rates ............................................................. 37 III.2 Matching adjustment ............................................................................................ 39 III.3 Volatility adjustment............................................................................................. 52 III.4 Transitional measure on the risk-free interest rates .................................................. 67 III.5 Transitional measure on technical provisions ........................................................... 69 III.7 Symmetric adjustment to the equity risk charge ...................................................... 86 III.8 Extension of the recovery period ............................................................................ 87
IV. Thematic foci .............................................................................................. 90 VI.1 Approval processes ............................................................................................... 90 IV.2 Technical information on the risk-free interest rates calculated and published by EIOPA 97 IV.3 Technical information on the symmetric adjustment to the equity risk sub-module
calculated and published by EIOPA ............................................................................... 105
Annexes ......................................................................................................... 109 Annex 1 – Overview of the European insurance market ................................................... 109 Annex 2 – Impact on consumers and products ............................................................... 110 Annex 3 - Asset classes ............................................................................................... 112 Annex 4 - Technical information – Risk-free interest rate term structures .......................... 113 Annex 5 - Technical information – Volatility adjustments ................................................. 129 Annex 6 - Questionnaire on approval processes .............................................................. 136 Annex 7 - General questionnaire on LTG measures and measures on equity risk ................ 139

3/145
Executive Summary
The Solvency II Directive requires a review of the long-term guarantees (LTG)
measures and the measures on equity risk until 1 January 2021. As part of this
review, EIOPA will annually report on the impact of the application of the LTG
measures and the measures on equity risk to the European Parliament, the Council
and the Commission. This report on the LTG measures and the measures on equity
risk is the first annual report.
The LTG measures are the extrapolation of risk-free interest rates, the matching
adjustment, the volatility adjustment, the extension recovery period in case of non-
compliance with the Solvency Capital Requirement, the transitional measure on the
risk-free interest rates and the transitional measure on technical provisions. The
equity risk measures are the application of a symmetric adjustment mechanism to the
equity risk charge and the duration-based equity risk sub-module.
The use of the matching adjustment, the volatility adjustment, the two transitional
measures and the duration-based equity risk sub-module are not mandatory for
undertakings. In the European Economic Area (EEA), 901 insurance and reinsurance
undertakings in 24 countries were on 1 January 2016 using at least one of these
measures.
The aggregated amount of technical provisions for the undertakings using the
matching adjustment, the volatility adjustment, the transitional measure on the risk-
free interest rates, the transitional measure on technical provisions and the duration-
based equity risk sub-module amounts to 69% of the technical provisions in the EEA
insurance and reinsurance market. 852 undertakings representing 61% of the overall
amount of technical provisions at EEA level are using the volatility adjustment. The
transitional on technical provisions is the second most used measure, applied by 154
undertakings representing 24% of the overall amount of technical provisions at EEA
level. The matching adjustment is used by 38 undertakings representing 16% of the
overall amount of technical provisions in the EEA. The transitional on risk free rate is
used by 6 undertakings and the duration-based equity risk sub-module by 1
undertaking with a negligible market share in technical provisions in both cases.
In 2016, the first year of application of Solvency II, the reporting of insurance and
reinsurance undertakings to national supervisory authorities has been limited. In
particular, the impact of the measures on the financial position will be reported to
national supervisory authorities for the first time in 2017. EIOPA has collected
information on the impact of the measures matching adjustment, volatility
adjustment, transitional measure on the risk-free interest rates and transitional
measure on technical provisions through EIOPA’s 2016 insurance stress test. This
information relates to the financial position on 1 January 2016 of a sample of mostly
life insurance undertakings from all EEA countries. For those undertakings in this
sample using these measures, removing the measures would result on average in a
reduction of the Solvency Capital Requirement ratio by 73 percentage points; the ratio
with measures is 193% while the ratio without the measures would be 121%. For the
majority of insurance and reinsurance undertakings the impact of the measures on

4/145
the Solvency Capital Requirement ratio is lower than 50 percentage points. Insurance
and reinsurance undertakings comply with the Solvency Capital Requirement if their
Solvency Capital Requirement ratio is at least 100%. For the stress test sample
removing these measures would decrease the amount of eligible own funds to cover
the Solvency Capital Requirement by 107 billion euro to 466 billion euro and increase
the Solvency Capital Requirement by 50 billion euro to 343 billion euro.
The national supervisory authorities of the jurisdictions where the transitional
measure on the risk-free interest rates and the transitional measure on technical
provisions are applied generally expect that the dependency on these measures will
gradually decrease provided that the phasing-in plans for the transitional measures
are fulfilled. This needs to be closely monitored by the national supervisory
authorities. The persistence of low interest rates or future unexpected economic
developments could have an impact on this dependency and could require
undertakings to take additional measures to reduce it.
Removing the symmetric adjustment mechanism to the equity risk charge and the
duration-based equity risk sub-module would have had no impact on the financial
position of undertakings on 1 January 2016. A transitional measure for the calculation
of the capital requirement for equity risk applies during the first six years of Solvency
II, phasing out gradually. Hence, an impact of the equity risk measures is expected
from 2017 onwards.
The feedback from national supervisory authorities indicates that there is no specific
case yet, where undue capital relief was observed for an undertaking due to the
application of the LTG measures or measures on equity risk. It is not possible to
assess any positive or negative impact of the measures on policyholder protection at
this early stage.
It is also still too early to draw any conclusions about the impact of the measures on
the investments of insurance and reinsurance undertakings, either because there is no
observable impact yet or because it is not possible to separate the impact of the
measures from the impact of current market conditions and the introduction of
Solvency II more generally. Furthermore, a great diversity of the composition of
investments of insurance and reinsurance undertakings across countries can be
observed.
No legal definition of “long-term guarantee” exists under Solvency II. The commonly
accepted understanding of “long-term guarantee” differs in the EEA countries and is
mainly linked to the type of guarantees offered or linked to the duration of the
insurance contract. LTG are included in many different types of products, mainly life
insurance products. Products with LTG are available in most of the markets of the
EEA. LTG measures are broadly applied by undertakings selling insurance products
with LTG, but it is still too early to conclude on the impact of the LTG measures on the
availability of these products. So far, the availability of LTG products is mainly stable
or slightly decreasing across the EEA. The main drivers for the decrease in availability
are the low interest rates and the resulting cost of guarantees, which are reflected in
technical provisions and capital requirements under Solvency II. For some countries
an increase of the availability of LTG products was reported.

5/145
With respect to the impact of the measures on financial stability, national supervisory
authorities have not reported any concrete observations for 2016. The impact of the
measures in a double hit scenario, affecting interest rates levels and asset prices, and
in a low yield scenario was analysed in EIOPA’s 2016 insurance stress test. In the case
of the double hit scenario, the LTG measures seem to provide a financial stability
cushion. In the absence of the alleviating effect of the LTG measures, insurers may be
induced to force sales and de-risk reducing their SCR and MCR, possibly pushing
further down asset prices, adding to the market volatility and potentially affecting
financial stability.

6/145
I. Introduction
I.1 Review of the LTG measures and measures on equity risk
The LTG measures were introduced in the Solvency II Directive1 through the Omnibus II Directive2 in order to ensure an appropriate treatment of insurance products that
include LTG. The measures on equity risk should ensure an appropriate measure of equity risk in setting the capital requirement for insurance and reinsurance undertakings in relation to the risks arising from changes in the level of equity prices.
The Solvency II Directive requires a review of the LTG measures and the measures on equity risk by 1 January 2021. The review consists of the following elements:
An annual report from EIOPA on the impact of the application of the LTG measures and the measures on equity risk to the European Parliament, the Council and the Commission.
An EIOPA opinion on the assessment of the application of the LTG measures and the measures on equity risk to the Commission.
Based on the opinion submitted by EIOPA, a report submitted by the Commission on the impact of the LTG measures and the measures on equity risk to the European Parliament and to the Council. The report will be accompanied, if
necessary, by legislative proposals.
The 2016 EIOPA report on the LTG measures and the measures on equity risk is the
first annual report. This report is structured in three main sections. The first section captures the overall impact of the LTG and measures on equity risk on the financial
position of the undertakings, impact on policyholder protection, impact on consumer protection and availability of products, impact on investments and the impact on financial stability.
The second section of the report sets out in more detail the impact of each of the measures.
The third section consists of three thematic foci as follows:
Approval processes for the use of the measures. Technical information on the risk-free interest rates calculated and published by
EIOPA. Technical information on the symmetric adjustment to the equity risk sub-module
calculated and published by EIOPA.
EIOPA will continue to analyse thematic foci on different aspects of the LTG and the equity measures in each annual report. The different thematic foci are being chosen in
accordance with relevant available data, supervisory practices and other developments in the use or perceived impact of the measures. The foci will gradually
cover all aspects which will be required to eventually support EIOPA’s opinion by 2020.
EIOPA plans to submit the opinion on the assessment of the application of the LTG
measures and the measures on equity risk to the Commission in 2020, based on the annual reports submitted by then.
1 Directive 2009/138/EC of 25 November 2009 of the European Parliament and of the Council on the taking-up and
pursuit of the business of Insurance and Reinsurance (Solvency II), OJ L 335, 17.12.2009. 2 Directive 2014/51/EU of the European Parliament and of the Council of 16 April 2014 amending Directives
2003/71/EC and 2009/138/EC and Regulations (EC) No 1060/2009, (EU) No 1094/2010 and (EU) No 1095/2010 in respect of the powers of the European Supervisory Authority (European Insurance and Occupational Pensions Authority) and the European Supervisory Authority (European Securities and Markets Authority), OJ L153, 22.05.2014.

7/145
I.2 Legal background
Article 77(f)(1) of the Solvency II Directive requires EIOPA on an annual basis and until 1 January 2021 to report to the European Parliament, the Council and the Commission about the impact of the application of Articles 77a to 77e and 106, Article
138(4) and Articles 304, 308c and 308d, including the delegated or implementing acts adopted pursuant thereto.
The table below summarises the LTG and the measures on equity risk subject to the review and the relevant articles of the Solvency II Directive.
Articles Name of the measure Abbreviation in this report
77a Extrapolation of the risk-free interest rates -
77b, 77c Matching adjustment MA
77d Volatility adjustment VA
106 Symmetric adjustment mechanism to the equity risk charge
ED3
138(4) Extension of the recovery period ERP
304 Duration-based equity risk sub-module DBER
308c Transitional on the risk-free rate TRFR
308d Transitional on technical provisions TTP
The review also covers Article 77e of the Solvency Directive on technical information
on the risk-free interest rates produced by EIOPA.
Article 77(f)(1) also requires national supervisory authorities (NSAs) to provide the
following information to EIOPA on an annual basis:
the availability of LTG in insurance products in their national markets and the behaviour of insurance and reinsurance undertakings as long-term investors;
the number of insurance and reinsurance undertakings applying the matching adjustment, the volatility adjustment, the extension of the recovery period in
accordance with Article 138(4), the duration-based equity risk sub-module and the transitional measures set out in Articles 308c and 308d;
the impact on the insurance and reinsurance undertakings' financial position of
the matching adjustment, the volatility adjustment, the symmetric adjustment mechanism to the equity capital charge, the duration-based equity risk sub-
module and the transitional measures set out in Articles 308c and 308d, at national level and in anonymised way for each undertaking;
the effect of the matching adjustment, the volatility adjustment, the symmetric
adjustment mechanism to the equity capital charge and the duration-based equity risk sub-module on the investment behaviour of insurance and
reinsurance undertakings and whether they provide undue capital relief;
3 The symmetric adjustment to the equity risk charge is also called equity dampener.

8/145
the effect of any extension of the recovery period in accordance with Article
138(4) on the efforts of insurance and reinsurance undertakings to re-establish the level of eligible own funds covering the Solvency Capital Requirement or to
reduce the risk profile in order to ensure compliance with the Solvency Capital Requirement;
where insurance and reinsurance undertakings apply the transitional measures set out in Articles 308c and 308d, whether they comply with the phasing-in plans referred to in Article 308e of the Solvency II Directive and the prospects
for a reduced dependency on these transitional measures, including measures that have been taken or are expected to be taken by the undertakings and
supervisory authorities, taking into account the regulatory environment of the Member State concerned.
I.3 Data
The data used for this report are taken from the reporting of insurance and
reinsurance undertakings to their NSAs (Solvency II opening balance sheet, usually with reference date 1 January 2016 and information from the first quarterly reporting,
usually with a reference date of 30 March 2016) and from EIOPA’s 2016 insurance stress test.
In particular, the impact on the financial position of the undertakings of using the LTG
measures and the measures on equity risk was based on the data obtained from the stress test because this impact is in 2016, the first year of Solvency II, not included in
the reporting of undertakings to their NSAs. The stress test captures 77 per cent of the EEA life insurance market. This report as a result does not contain the impact of the measures on all insurance and reinsurance undertakings. EIOPA’s 2017 report on
the LTG measures and measures on equity risk will contain the impact of the measures on the financial position of all undertakings.
EIOPA also carried out a questionnaire to ascertain the experience of NSAs with regard to the impact of the LTG measures and the measures on equity risk.
I.4 Introduction to Solvency II quantitative requirements
The main objective of Solvency II is to protect insurance policyholders and beneficiaries. An essential aspect of policyholder protection is the ability of insurance and reinsurance undertakings to fulfil their insurance and reinsurance contracts, even
under adverse circumstances, for example in a financial crisis or when a natural catastrophe occurs. Solvency II includes quantitative requirements on insurance and
reinsurance undertakings to ensure that their financial position allows them to pay the expected insurance benefits and also to bear unexpected losses that they might incur under adverse circumstances.
The quantitative requirements include in particular:
market-consistent valuation of assets and liabilities, economic determination of own funds, risk-based capital requirements.

9/145
Assets and liabilities
Solvency II introduced a valuation of assets and liabilities specifically for supervisory
purposes. Assets and liabilities are valued at the amount for which they could be exchanged between knowledgeable willing parties in an arm’s length transaction.
The assets of an insurance or reinsurance undertaking consist mainly of the investments that insurers make with the insurance premiums they receive. Typically
these investments comprise bonds, equities and real estate, held directly or through investment funds.
The liabilities of an insurance or reinsurance undertaking consist mainly of technical provisions set up for the insurance and reinsurance obligations of the undertaking.
Insurance and reinsurance obligations can be of long duration.
The LTG measures extrapolation, MA, VA, TRFR and TTP relate to the calculation of
technical provisions, the first four of them specifically to the risk-free interest rates.
Own funds and capital requirements
Insurance and reinsurance undertakings have to hold own funds that cover their capital requirements. The own funds are based on the difference between assets and
liabilities.
There are two capital requirements in Solvency II, the Solvency Capital Requirement
(SCR) and the Minimum Capital Requirement (MCR).
The SCR is a risk-based capital requirement. The SCR corresponds to the amount of own funds needed to withstand the worst annual loss expected to occur over the next 200 years. If an insurance or reinsurance undertaking is not complying with the SCR,
it has to take measures to meet the SCR again within six months, for example by increasing its capital or by reducing its risk.
The SCR can be calculated with a standard formula that is specified in the law or with an internal model that was approved by the NSA. It is also possible to calculate a part
of the SCR with an internal model (partial internal model) and the remaining part with the standard formula.
The SCR standard formula consists of modules for the different risks that an insurance and reinsurance undertaking is exposed to (in particular market risks, underwriting
risks, counterparty default risks, operational risks). The risk that relates to the change of equity prices is captured in the equity risk sub-module of the standard formula. The
measures on equity risk relate to the calculation of the equity risk sub-module.
The MCR is usually lower than the SCR. It corresponds to the minimum level of
security that is required under Solvency II. An insurance or reinsurance undertaking not complying with the MCR would expose policyholders and beneficiaries to an
unacceptable level of risk. If an insurer does not cover the MCR with own funds, its authorisation will be withdrawn unless the MCR is covered again within 3 months.
Other than the SCR, the MCR is calculated in a simple manner. The MCR is usually between 25% and 45% of the SCR.
The existence of two capital requirements establishes a “ladder of supervisory intervention”. It allows NSAs and undertakings to take early measures to ensure that
the capital requirements are met.

10/145
The SCR ratio is the ratio of eligible own funds and SCR. If the SCR ratio is 100% or
higher, then the SCR is complied with, otherwise not. The MCR ratio is the ratio of eligible own funds and MCR. If the MCR ratio is 100% or higher, then the MCR is
complied with, otherwise not.
The following figure provides a stylised description of the quantitative requirements of
Solvency II.
I.5 Overview of the European insurance market
In the European insurance market 3050 insurance and reinsurance undertakings are
under supervision according to Solvency II4. The table below shows the number of undertakings split by type of undertakings5 and by the method of SCR calculation
(standard formula, partial internal model or full internal model).
Number of undertakings
Standard
formula
Partial internal
model
Full internal
model
Total
Life undertakings
626 27 28 681
Non-life undertakings
1860 35 44 1939
Undertakings pursuing both
life and non-life activity
395 21 14 430
Total 2881 83 86 3050
4 The number of undertakings, the figures on technical provisions and written premiums shown in this section have
been reported to EIOPA by the NSAs as part of the quantitative questionnaire set out in Annex 7 of this report 5 The classification of life undertakings, non-life undertakings and undertakings pursuing both life and non-life activity
corresponds to the type of undertaking in the Basic Information template (S.01.02) of the Solvency II opening balance sheet reported to NSAs. The classification refers to both insurance and reinsurance undertakings.

11/145
The following diagrams provide an overview of the amount of technical provisions and gross written premiums for all insurance and reinsurance undertakings subject to
Solvency II. The amounts are provided separately for life insurance and for non-life insurance obligations. Additional information with respect to the European insurance
market can be consulted in Annex 1 of this report.

12/145
II. Overview of the use and the impact of LTG measures and measures on equity risk
II.1 Use of the measures
Some of the LTG measures and measures on equity risk are applied by insurance and reinsurance undertakings on an optional basis, while the use of other measures is mandatory.
The application of MA, VA, TRFR, TTP and DBER is optional for undertakings, subject to conditions laid down in the Solvency II Directive and Regulations.
All other measures are an integral part of the Solvency II framework and hence of mandatory application. In particular, the extrapolation of risk-free interest rates is applicable to all undertakings for the calculation of their technical provisions. The
symmetric adjustment mechanism is applicable to all undertakings that use the standard formula to calculate the equity risk sub-module of the SCR, including all
undertaking using a partial internal model not covering that sub-module.
Finally, the ERP in exceptional adverse situations is only applicable to undertakings breaching the SCR after a declaration of such a situation by EIOPA. So far, EIOPA has
not declared an exceptional adverse situation.
All information on the use of the measures set out in this section relates to the
situation as known on 1 January 2016.
Use of MA, VA, TRFR, TTP and DBER
In the EEA, 901 insurance and reinsurance undertakings in 24 countries are using at least one of the optional measures MA, VA, TRFR, TTP or DBER. The aggregated
amount of technical provisions for those undertakings is 69.4% of the technical provisions in the European market.
2149 undertakings, representing 30.6% of the technical provisions in the European market are not using any of the measures MA, VA, TRFR, TTP or DBER. In particular, there are 8 countries where those measures are not applied by any of the national
undertakings (EE, HR, IS, LT, LV, MT, PL and SI – see section III for further explanation).

13/145
Undertakings not
applying any of the
measures
Undertakings applying at
least one measure
both life and
non-life 219 213
non-life 1570 367
life 360 321
Total 2149 901
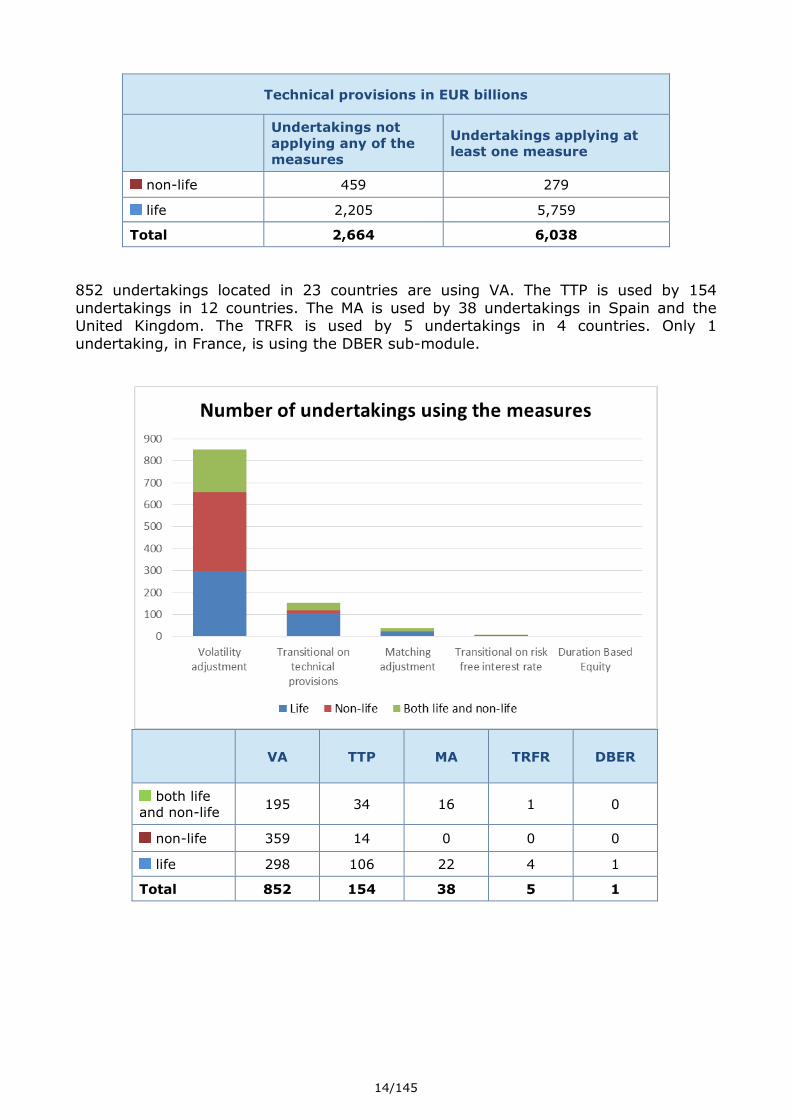
14/145
Technical provisions in EUR billions
Undertakings not
applying any of the
measures
Undertakings applying at
least one measure
non-life 459 279
life 2,205 5,759
Total 2,664 6,038
852 undertakings located in 23 countries are using VA. The TTP is used by 154
undertakings in 12 countries. The MA is used by 38 undertakings in Spain and the United Kingdom. The TRFR is used by 5 undertakings in 4 countries. Only 1
undertaking, in France, is using the DBER sub-module.
VA TTP MA TRFR DBER
both life
and non-life 195 34 16 1 0
non-life 359 14 0 0 0
life 298 106 22 4 1
Total 852 154 38 5 1

15/145
VA TTP MA TRFR DBER
non-life 3.1% 0.1% 0% 0% 0%
life 57.7% 24% 15.8% 0.2% 0%
Total 60.8% 24.1% 15.8% 0.2% 0%
Use of a combination of the measures MA, VA, TRFR, TTP and DBER
According to the Solvency II Directive it is admissible for an insurance or reinsurance undertaking to apply several measures at the same time. Certain combinations of
measures, however, are explicitly excluded:
Undertakings that apply the TTP cannot apply the TRFR (see Articles 308c(4)(b) and 308d(5)(a) of the Solvency II Directive).
Undertakings that apply the TRFR cannot apply the MA to the same insurance and reinsurance obligations (see Article 308c(3) of the Solvency II Directive).
Undertakings that apply the MA to a portfolio of insurance or reinsurance obligations cannot apply the VA to those obligations (see Articles 77b(3) and 77d(5) of the Solvency II Directive).
152 undertakings are applying simultaneously one of the transitional measures and either MA or VA to the same liabilities.
The following table shows the cases where the simultaneous application of two measures with respect to the same liabilities is allowed by the Directive and the number and market share of undertakings at EEA level applying such combinations:

16/145
Combination of measures
Number of undertakings
Market share (technical provisions)
Use of TTP and MA 29 14.4%
Use of TTP and VA 118 14.1%
Use of TRFR and VA 5 0.2%
Total 152 28.7%
II.2 Impact of the measures on the financial position of undertakings
Background on the impact of the measures MA, VA, TRFR and TTP
The LTG measures MA, VA, TRFR and TTP relate to the calculation of technical provisions. But the impact of these measures on the financial position of insurance
and reinsurance undertakings is not restricted to a change in the amount of technical provisions. The change in technical provisions itself can also have an impact on other
items of the balance sheet and on the capital requirements and own funds.
Hereunder is an explanation of how these LTG measures impact the financial position of insurance and reinsurance undertakings. The description is based on the typical
effects and may not be applicable to all undertakings.
Impact on technical provisions
Removing MA, VA and TRFR usually decrease of the relevant risk-free interest rates
used to calculate the technical provisions6 and consequently in most cases increase the technical provisions by means of higher discounting effects7. Apart from the
discounting effect the measures may also impact some assumptions made in the calculation of technical provisions, for example about the amount of future discretionary benefits of insurance with profit participation.
The TTP directly impacts the amount of technical provisions. Removing it typically increases the amount of technical provisions.
Impact on assets and liabilities other than technical provisions
Where removing the measures increase the amount of technical provisions this
increase in liabilities may often be accompanied by a decrease of net deferred tax liabilities.
6 Removing MA, VA and TRFR will in most instances reduce the relevant risk-free term structures. However, under
certain circumstances, the adjustments through these measures can turn negative. In that situation, removing the adjustment would increase the relevant risk-free interest rates. 7 It is possible under Solvency II that the part of technical provisions to which the measures are applied is negative
(for example when the value of expected insurance premiums exceeds the value of expected insurance payments). In that specific case, lower discount rates result in lower technical provisions.

17/145
Impact on SCR and MCR
The measures can impact parts of the SCR and MCR calculation in different directions. Some parts may not at all be affected by the use of the measures, for others an
increase or a decrease of the capital requirements can occur. An increase of the capital requirement after removing the measures may in particular happen where the
technical provisions are used as quantity for the size of risk that the capital requirements aim to capture. The capital requirements may also be increased through a higher loss-absorbing capacity of technical provisions where the removal of the
measures decreased the amount of future discretionary benefits in technical provisions. A similar effect is the increase of the capital requirements through a higher
loss-absorbing capacity of deferred taxes where deferred taxes are decreased by the removal of the measures.
Typically the measures will decrease SCR and MCR.
Impact on own funds
The increase in technical provisions leads to a decrease of own funds. A slight relative
increase of technical provisions may lead to a significant relative reduction of own funds, in particular for life insurance undertakings. For a typical life insurance
undertaking the ratio of own funds and technical provisions is 1/10. Therefore an increase of technical provisions by 1% would lead to a reduction of own funds of 10%. This comparison is only based on the direct impact of changes in technical provisions
on the amount of own funds. The impact may be mitigated by indirect effects, for example a reduction in deferred tax liabilities.
Also the changes to the SCR and MCR caused by the removal of the measures can have an impact on the eligible own funds to cover these capital requirements because there are limits to these own funds that depend on the capital requirements.
Typically removing the measures will reduce the amount of own funds.
Summary of the impacts on the financial position
The following table summarises the typical impact on different items of the financial position. The arrows are upward (resp. downward) if it is more likely than unlikely
that the items concerned will increase (resp. decrease) when the measures are removed.
Items
Typical impact of
removing MA, VA, TRFR and TTP
Technical provisions ↗
Net deferred tax liabilities ↘
Eligible own funds ↘
SCR and MCR ↗
Loss-absorbing capacity of future discretionary benefits and deferred tax
liabilities
↘

18/145
Data availability and reliability for assessing the impact of the measures in
2016
In 2016, the first year of the application of Solvency II, the reporting of insurance and
reinsurance undertakings to NSAs is limited. In particular, the impact of the measures on the financial position will be reported to NSAs for the first time in 2017. Therefore
also the information available to EIOPA about the impact of the measures on the financial position of undertakings is limited.
EIOPA has collected information about the impact of the measures extrapolation, MA,
VA, TRFR, TTP and ED on 1 January 2016 through EIOPA’s 2016 insurance stress test. Mainly life insurance undertakings participated in that stress test.
Only for the measures MA, VA, TRFR and TTP the information collected allows a consistent analysis of their impact. For this reason, the remainder of this section deals with these four measures, but not any of the other measures.
On the extrapolation, the available data related to the impact of changes to the assumptions underlying that measure under insurer-specific scenario calculations that
were collected in the stress test. An overview of these scenarios and the related impact is provided in section III.1.
Removing the ED should have no impact on the capital requirements on 1 January
2016 because of a transitional measure on the equity risk submodule.8
The ERP has by definition no impact on the financial position of undertakings.
At the beginning of 2016 only 1 insurance undertaking was using the DBER. That undertaking did not participate in the stress test. EIOPA has therefore currently no information about the impact of the DBER.
The impact results presented in this section are based on data from EIOPA’s 2016
insurance stress tests. 236 undertakings with a market share of 77 per cent of the
EEA life insurance market participated in that test. Despite the high overall coverage of the stress test, the impacts derived at national level may only be based on a small number of undertakings that apply the measures. The
observations made in this section may therefore not be fully representative of the impact of the measures in the different markets and at EEA level.
In particular it should be noted that mainly life insurance undertakings participated in the stress test. The presented results may therefore not be representative for non-life and reinsurance undertakings.
The presented results relate to the reference date of 1 January 2016.
Impact of the measures MA, VA, TRFR and TTP
The absolute impact of the measures MA, VA, TRFR and TTP on the whole stress test sample is set out in the following table. Removing the measures would increase the amount of technical provisions by 144 billion euro. Eligible own funds to cover the SCR
would reduce by 107 billion euro. The SCR would increase by 50 billion euro.
8 See Article 308b(13) of the Solvency II Directive.

19/145
Amount
with MA,
VA, TRFR and TTP (billion euro)
Impact of removing the measures (billion euro) Amount
without MA, VA,
TRFR, and TTP
(billion
euro)
MA VA TRFR TTP All
measures
Technical provisions 5,194 36 33 0.7 74 144 5,338
Eligible own funds to cover the SCR
573 -29 -23 -0.4 -55 -107 466
SCR 293 22 24 0.1 5 50 343
Eligible own funds to cover the MCR
545 -28 -23 -0.4 -57 -109 437
MCR 102 4 7 0.0 1 13 114
The following graph displays the average impact of the measures MA, VA, TRFR and TTP with regard to the SCR ratio for the whole stress test sample (including both
undertakings using and not using the measures). The impact is shown at EEA and at country level. The graph shows the SCR ratio with (dark blue) and without (light blue)
these measures. No results at country level are shown for Croatia, Estonia, Latvia, Lithuania, Malta, Poland, Romania, Slovenia and Sweden because the stress test participant from these countries do not apply the measures MA, VA, TRFR and TTP.
No results at country level are shown for Bulgaria, Cyprus and Slovakia, due to confidentiality reasons; for the three countries the national average impact of the
measures is below the EEA average impact.
At EEA level, removing the measures results on average in a decrease of the SCR ratio by 60 percentage points. The impact goes up to 127 percentage points at country
level. For several countries the average solvency ratios without the use of the measures are below 100%. Throughout this report average ratios are weighted
averages, where the denominator of the ratios was used as weights.

20/145
The following graphs display the impact of removing the measures MA, VA, TRFR and TTP on the SCR ratio of every undertaking using at least one of those measures. Each
dot in the diagram represents one undertaking.
The horizontal axis relates to the SCR ratio without the measures MA, VA, TRFR and TTP. The solvency ratios with all these measures that undertakings actually apply
(current SCR ratio) are shown on the vertical axis.
The axes cross at 100%, the SCR ratio that undertakings are required to have under
Solvency II. There are no undertakings below the horizontal axis because all stress test participants that apply at least one of the measures have an SCR ratio of at least 100%. The dots left of the vertical axis show that there are undertakings that do not
meet their SCR without application of the measures. Three undertakings have an SCR ratio below 0% without the measures – they have negative own funds.
The black diagonal line corresponds to undertakings without an impact of the measures. Undertakings located on this line have the same SCR ratios with and without measures. The more an undertaking is located away from the diagonal line,
the bigger the impact of the measures.
The dark grey line corresponds to an impact of 50 percentage points on the SCR ratio.
Impacts of points located below this line are lower than 50 basis points. The medium

21/145
grey line corresponds to an impact of 100 percentage points and the light grey line
corresponds to an impact of 200 percentage points on the SCR ratio.
For the majority of the undertaking the impact of removing the measures on the SCR
ratio is lower than 50 percentage points.
The following graph shows the impact of removing the measures MA, VA, TRFR and
TTP on the MCR ratio of every undertaking using at least one of those measures. The axes cross at 100%, the MCR ratio that undertakings are required to have under Solvency II. All undertakings that participated in the stress test have an MCR above
100%. Similar to the SCR ratio, the application of the measures increases the MCR ratio while there is a broad variety in the size of that increase across the participants.

22/145
The following graphs display the overall impact of the measures MA, VA, TRFR and
TTP on the SCR ratio for those undertakings that apply at least one of the measures. The impact is shown at EEA and at country level. The first graphs shows the SCR ratio
with (dark blue) and without (light blue) these measures. The red bars are for the EEA level.
At the EEA level, removing the measures result on average in a decrease of the SCR ratio by 72 percentage points. The impact goes up to 153 percentage points at country level. For several countries the average solvency ratios without the use of the
measures are below 100%.

23/145

24/145
The following graph shows the impact of removing the measures on the SCR (light
blue) and on the eligible own funds to cover the SCR (dark blue). The red bars are for the EEA level. On average, eligible own funds to cover the SCR would decrease by
24%, while the SCR would increases by 22% if the measures were removed.

25/145
Similar graphs show the impact on the MCR ratio, the MCR and the eligible own funds
to cover the MCR.
At the EEA level, removing the measures would result in an average loss of 180
percentage points with regard to the MCR ratio. The average impact goes up to 325% points at country level.
At EEA level, removing the measures would decrease eligible own funds to cover the
MCR 26%, while the MCR would increase by 16%.

26/145

27/145
The following graphs show the impact of removing the measures MA, VA, TRFR and
TTP on technical provisions, eligible own funds to cover the SCR and the SCR per undertaking. The impact is measured relative to the amount with the measures. Each
bar corresponds to one undertaking. The bars are ordered by size in each graph. The graphs demonstrate that there is a wide disparity of the impact.

28/145
II.3 Impact on policyholder protection
The review analyses the effect of the LTG measures and measures on equity risk on policyholder protection. For this purpose, EIOPA has asked NSAs to report
observations on the impact of the measures on policyholder protection and in particular on cases of revocation of the approval to apply one of the measures,
undertakings subject to reorganization or winding-up proceedings and cases of undue capital relief by the LTG measures or measures on equity risk. The reports covered the period until the end of the first quarter of 2016.
NSAs did not report any concrete observations of positive or negative impacts of the measures on policyholder protection. Most NSAs referred to the limited experience
with the measures to explain their lack of observations.
None of the NSAs reported revocations of the approvals to apply MA, VA, TRFR, TTP or DBER. None of those undertakings subject to reorganization measures or winding-up
proceedings applies any optional LTG measure or measures on equity risk.
An undue capital relief would be an unduly low amount of technical provisions or
capital requirement negatively impacting policyholder protection. In order to support NSAs in identifying cases of undue capital relief and facilitate comparability among
NSAs’ assessments, a list of indicators for undue capital relief due to the application of the MA, the VA, the ED or the DBER was proposed9. None of the NSAs has identified any concrete case of undue capital relief for an undertaking applying these measures.
Consequently, no NSA imposed yet a capital add-on based on observed cases of undue capital relief.
NSAs were asked about the existence of insurance guarantee schemes in their jurisdiction that cover insurance products with LTG and their scope and functioning. The implementation of such additional safeguards with respect to products with LTG
could be an indicator for concerns with respect to policyholder protection. None of the NSAs has reported the establishment of dedicated guarantee funds specifically
oriented to cover insurance with LTG as a reaction to the LTG and equity measures being implemented. However, a number of NSAs have reported national guarantee schemes which are in place and cover policyholders with LTG. The nature, scope and
financing of those schemes are quite diverse; in particular with respect to the scope, some national guarantee funds cover only life and/or health insurance products but
some others are also applicable to long-term non-life insurance contracts10.
The feedback from NSAs indicates that there is no specific case yet, where undue
capital relief was observed for an undertaking due to the application of the LTG measures or measures on equity risk. It is not possible to assess any positive or
negative impact of the LTG and measures on equity risk on policyholder protection at this early stage.
9 See Question 5 of the qualitative questionnaire included in Annex 7.
10 An overview of the existing insurance guarantee schemes in the EEA can be found in “EIOPA’s Discussion Paper on
Recovery and Resolution (Nov 2016)”, including an overview of the products which are covered by the insurance guarantee schemes.

29/145
II.4 Impact on undertakings’ investments
Investment allocation of insurers using the measures MA, VA, TRFR or TTP
According to Article 77f(1)(a) and (3) of the Solvency II Directive, the review should
analyse the effect of the LTG measures and measures on equity risk on long term investment strategies. To assess the impact of the measures MA, VA, TRFR or TTP on
the investments of insurance and reinsurance undertakings, EIOPA has analysed the investment allocation of undertakings as reported to NSAs under Solvency II. The data on assets classes were derived from the opening balance sheet for Solvency II.
The data on credit quality and durations of bonds stem from the list of assets reported to NSAs at the end of the first quarter of 2016.
The following graph describes the investment allocation of insurance and reinsurance undertakings on 1 January 2016. The graph shows the average allocation to seven asset classes11 at EEA level and for each country. A great diversity of the allocations at
country level can be observed. These country specificities should be taken into account when analysing the investments of undertakings that apply the LTG measures
and equity risk measures, in particular where the use of a measure is not equally common in all countries.
The following graph shows the average investment allocation on 1 January 2016 of the undertakings that apply the measures MA, VA, TRFR or TTP in comparison with
the average allocation of all EEA undertakings. The undertakings that apply the VA have on average a higher proportion of government debt and a lower proportion of assets held for unit-linked and index-linked products than the whole market. In
11 For a full description of each asset class, refer to Annex 3
0%
10%
20%
30%
40%
50%
60%
70%
80%
90%
100%
EU AT BE BG HR CY CZ DK EE FI FR DE GR HU IS IE IT LV LI LT LU MT NL NO PL PT RO SK SI ES SE UK
Average investment portfolio for all undertakings
Other Assets ParticipationsAssets held for index-linked and unit-linked products PropertyEquities Corporate debtGovernment debt

30/145
contrast, the users of the TTP show on average a lower proportion of government debt
and a higher proportion of assets held for unit-linked and index-linked products than the whole market.
Undertakings applying the MA have a higher proportion of equities and assets held for unit-linked and index-linked products than the whole market. Their investments in
government debt are significantly lower than that of the whole market.
The investments of undertakings that apply the TRFR show a higher proportion of participations and lower proportion of debt and assets held for index-linked and unit-
linked products. In particular with regard to this result it is important to note that the number of undertakings applying the TRFR is very small and that the average
investment portfolio is not representative for each undertaking using that measure.
The following graph illustrates the credit quality of the bond portfolio of the
undertakings applying the measures MA, VA, TRFR or TTP as at 30 March 2016. Credit quality is measured in credit quality steps (CQS). CQS 0 denotes the best credit quality. Investment grade bonds have a CQS between 0 and 3. The undertakings
applying the MA have on average a lower percentage of non-rated assets and a higher proportion of assets with CQS 1 and 3. In contrast, the undertakings applying the VA
have a credit quality distribution that is on average very similar to the whole market. For this measure the most remarkable difference is the higher proportion of CQS 3 assets.
It should be noted that the non-rated class comprehends all assets for which a credit assessment of a credit rating agency is not available to the insurance or reinsurance
undertaking. However, the undertakings might have derived an internal rating for these assets.
Undertakings applying the MA have on average a higher bond duration12 than the
market. Furthermore, undertakings that apply TTP have an slightly higher average
12
Modified duration
0%
10%
20%
30%
40%
50%
60%
70%
80%
90%
100%
VA TTP TRFR MA Allundertakings
Average investment portfolio of undertakings applying the measures
Other Assets
Participations
Assets held for index-linked and unit-linkedproductsProperty
Equities
Corporate debt
Government debt

31/145
bond duration and undertakings that apply the VA a slightly lower average bond
duration than the whole market.
The graph does not include information on the investments of undertakings that apply
the TRFR because the database was incomplete with regard to that measure.
Supervisory observations on the investment behaviour
To collect information about the impact of the LTG measures and measures on equity risk on the investment behaviour of undertakings, EIOPA has addressed four
qualitative questions to all NSAs.
When asked about any observable changes in the asset allocation of undertakings
during the preparatory phase of Solvency II, more than half of the NSAs reported that their market did not experience significant changes in the asset allocation. From the remaining countries, half of them observed an increasing investment in corporate
bonds.
Where changes in the asset allocation had been be observed, the identification of
triggers or drivers for such changes was not straightforward since changes in asset allocation visible in the balance sheet do not only depend on the undertakings’ investment decisions, but also on changes of market prices.
Moreover, according to the statistics of the European Central Bank on the investments of insurance corporations in the euro area13 there has been a steady increase of
investments in funds and bonds between 2008 and 2015, with became steeper in 2011.
NSAs were also asked whether they had observed any relationship between the LTG
measures and measures on equity risk and the investment behaviour of undertakings. The general view among NSAs was that it is still too early to draw any conclusions
since experience with the measures is limited and it is almost impossible to differentiate the impact of the measures from the introduction of Solvency II and the current market conditions.
13
Aggregated balance sheet of euro area insurance corporations. The balance sheet is based on national accounting
standards.
1
2
3
4
5
6
7
8
9
10
11
0%
10%
20%
30%
40%
50%
60%
70%
80%
90%
100%
VA TTP MA All undertakings
Credit quality and duration for undertakings applying the measures
Non Rated
CQS > 3
CQS 3
CQS 2
CQS 1
CQS 0
Averageduration

32/145
With regard to undertakings’ current behaviour as long-term investors almost all NSAs
mentioned that they did not observe any significant changes in their markets, whereas, two NSAs reported a slight decrease in long-term investments due to the
low yield environment and the need for asset-liability matching and one NSA reported an increase in long-term investments due to a growing search for yield.
It is still too early to draw any conclusions about the impact of the LTG measures
and measures on equity risk on the investments of insurance and reinsurance undertakings, either because there is no observable impact yet or because it is not
possible to separate the impact of the measures from the impact of current market conditions and the introduction of Solvency II. Furthermore, a great diversity of the composition of investments of insurance and reinsurance undertakings across
countries can be observed.
At this stage, the average VA user shows a very similar asset mix to the entire
market, the most significant difference being a higher proportion of government bonds and a slightly lower credit quality. In turn, the set of undertakings applying the TTP reported a higher proportion of assets held for unit-linked and index-linked
products, a lower proportion of government bonds and a higher credit quality than the whole market.
Finally, the MA and the TRFR are the measures more significantly connected to a different structure of the asset portfolio, which may be mainly caused by the small
number of undertakings applying the measures or that they are applied in only few countries.
II.5 Impact on consumers and products
According to Article 77f(1)(a) of the Solvency II Directive, the review should analyse the effect of the LTG measures and measures on equity risk on the availability of LTG
in insurance products. As the legal framework for Solvency II does not include a definition of "long-term guarantee", NSAs were asked to report any definition or common use of the term at national level.
Moreover, in order to get an overview about the main types of insurance products with LTG sold in the EEA, NSAs were asked to describe the main characteristics of
such products in terms of guarantees, line of business, duration, number of undertakings offering the products and LTG measures applied. Also enquiry was made as to the current trend regarding the availability of LTG products at national level.
Definition of "long-term guarantee"
The Solvency II regulatory framework does not include a legal definition of "long-term guarantee". NSA reported that also at national level no legal definition of the term was
given. The common use of the term is mainly linked to the type of guarantee offered or the duration of the contract.
NSAs quoted the following types of products as examples of insurance products including LTG that are currently available in their national markets:
Traditional life insurance (e.g. with profit contracts, saving products, whole life,
endowments policies, annuities, “universal life” life insurance)

33/145
Unit-linked policies with guaranteed investment yield or capital protection
Variable annuities Some types of health insurance (e.g. annuities stemming from protection
contracts that offer the policyholder the maintenance of their wages in case of severe illness)
Non-life annuities (e.g. stemming from third party liability insurance) Specific non-life insurance products (e.g. construction risk and borrowers’
insurance)
The Solvency II Delegated Regulation14 defines lines of business for insurance and reinsurance obligations (Annex I of the Delegated Regulation). LTG occur both in life
and non-life insurance obligations. They mainly fall into all the lines of business for life insurance obligations15, but there are also specific products offering LTG (e.g. construction risk and borrowers’ insurance) that fall into lines of business for non-life
insurance obligations like “fire and other damage to property insurance”, “general liability insurance” and “miscellaneous financial loss”.
The most common types of guarantees included in the long-term products mentioned by NSAs are:
Minimum guaranteed interest every year or on every paid premium, usually
fixed at the inception of the contract Guarantee on the sum assured at maturity
Guarantee on the surrender value during the life of the policy
The duration of such guarantees is mainly lifelong or a fixed duration. Among NSAs that provided specific information on this respect, fixed durations not shorter than 6-8
years were mentioned.
LTG products are widespread in most of the national markets, in some cases being
offered by that all the life insurance undertakings of the market. Only five NSAs (IS, PL, IE, LI, MT) reported that LTG products are a minority of the products offered (usually these markets are dominated by unit-linked products with no guarantees),
are offered only in non-life motor insurance or are not offered at all.
The tables below show an indicative distribution of the number of undertakings in
the different countries selling products with LTG. Different buckets were set up according to the share of undertakings in relation to:
the number of life insurance and composite undertakings,
the number of all insurance and reinsurance undertakings (life, non-life and composite) in the market.
Please note that figures are based on NSAs own definition of LTG (which may vary across the national markets), thus the following tables gives only an indicative
overview.
The total number of undertaking selling these products in the EEA is estimated to exceed 700.
14
Commission Delegated Regulation (EU) 2015/35 of 10 October 2014 supplementing Directive 2009/138/EC of the
European Parliament and of the Council on the taking-up and pursuit of the business of insurance and reinsurance (Solvency II). 15
The lines of business for life insurance obligations are “health insurance”, “insurance with-profit participation”,
“index-linked and unit-linked insurance”, “other life insurance”, ”annuities stemming from non-life insurance contracts and relating to health insurance obligations” and “annuities stemming from non-life insurance contracts and relating to insurance obligations other than health insurance obligations”.

34/145
Life insurance and composite undertakings
% of undertakings
selling LTG products
Number of countries
0-25% 2(EE, IE)
25%-50% 2 (FI, LI)
50%-75% 6 (CY, CZ, LU, NL, NO, SI)
75-100% 12 (AT, BE, HR,DE, ES, FR, GR, HU, IT, LV, LT, RO)
For all these countries together, between 50% and 75% of undertakings offer LTG products.
All undertakings (life, non-life and composite)
% of undertakings selling LTG products
Number of countries
0-25% 9 (CY, EE, FI, IE, LV, LU, NL, NO, UK)
25%-50% 10 (BE, CZ, DE, ES, FR, GR, IT, LI, RO, SE)
50%-75% 5 (AT, HR, HU, LT, SI)
75-100% 1 (PT)
For all these countries together, between 25% and 50% of undertakings sell LTG products.
Trend regarding availability of products including LTG
Approximately one third of NSAs interviewed did not observe any significant change regarding the availability of LTG products in their national market. In some cases the reason is that the shift toward other types of product (mainly unit-linked policies) took
already place in the past.
Almost the same number of countries observed a slightly decreasing trend of
availability in terms of number of undertakings offering such products. Only one country (Norway) observed a rapid decrease of such products, not sold any longer in its national market.
In general, both in case of stable and decreasing trends, the following phenomenon was observed by a number of NSAs:
a shift to unit-linked or pure protection products, a decreasing level of financial guarantee included in the contracts or a change
in the type of guarantee offered (i.e. no guarantee in case of surrender, review
of the minimum guaranteed rate annually every year), a decreasing duration of the guarantees.
The main drivers identified for the decreasing trend regarding the availability of LTG products are:
the low interest rate environment (mentioned by 14 NSAs);

35/145
the increased cost of guarantees caused by the low interest rate environment
and the reflection of the cost in the Solvency II requirements, in particular in the calculation of the technical provisions and the SCR (mentioned by 7 NSAs).
In contrast, an increase of LTG products was observed in 3 countries for the following main reason:
the search for yield by consumers (mentioned by 2 NSAs), higher degree of freedom for companies offering market-based products
(mentioned by one NSA),
the overall economic recovery (mentioned by one NSA).
In the EEA countries no legal definition of “long-term guarantee” exists. The
commonly accepted understanding of “long-term guarantee” differs in the EEA countries and is mainly linked to the type of guarantees offered or to the duration
of the insurance contract.
LTG are included in many different types of products, mainly life insurance products. Products with LTG are available in most of the markets of the EEA. Only
5 NSAs (IS, PL, IE, LI, MT) reported that products with LTG are not present or constitute a minority in their national market.
LTG measures are broadly applied by undertakings selling products with LTG, but it is still too early to conclude on the impact of the LTG measures on these
products.
Availability of LTG products is mainly stable or slightly decreasing across the EEA. Main drivers for the decrease in availability are the low interest rates, the resulting
cost of guarantees, which are reflected in technical provisions and capital requirements under Solvency II.

36/145
II.6 Impact on financial stability
According to Article 77f(3)(j) of the Solvency II Directive, the review should analyse the effect of the LTG measures and measures on equity risk on financial stability. For
that purpose EIOPA has asked the NSAs to report any concrete impact of the measures on the financial stability. NSAs have not reported concrete observations in
that respect in 2016.
In its report16 on systemic risks in the European insurance sector of December 2015, the European Systemic Risk Board (ESRB) identified the LTG measures, in particular
the volatility adjustment, the matching adjustment and the ERP, and the symmetric adjustment to the equity risk charge as available measures to address the common
vulnerability of life insurance to a double hit (i.e. prolonged low risk-free rates and suddenly falling asset prices) and pro-cyclicality in asset allocation.
The impact of the measures in a double hit scenario and in a low yield scenario was
analysed in EIOPA’s 2016 insurance stress test. In the case of the double hit scenario, the LTG measures seem to provide a financial stability cushion. In the absence of the
alleviating effect of the LTG measures, insurers may be induced to force sales and de-risk in order to lower their SCR and MCR, possibly pushing further down asset prices,
adding to the market volatility and potentially affecting financial stability. Also in a low yield scenario the LTG measures provide a financial stability cushion, potentially acting in a counter cyclical manner, but supervisory vigilance is required in order to avoid
misestimating of risks due to the longer-term type of concerns implied by the scenario.
16
https://www.esrb.europa.eu/pub/pdf/other/2015-12-16-esrb_report_systemic_risks_EU_insurance_
sector.en.pdf

37/145
III. Specific analysis for each of the measures
III.1 Extrapolation of the risk-free interest rates
Recital 30 of the Omnibus II Directive17 states that the relevant risk-free interest rate term structure should avoid artificial volatility of technical provisions and eligible own
funds and provide an incentive for good risk management. Furthermore, the choice of the starting point of the extrapolation of risk-free interest rates should allow undertakings to match with bonds the cash flows which are discounted with non-
extrapolated interest rates in the calculation of the best estimate.
Article 77a of the Solvency II Directive requires that the determination of the relevant
risk-free interest rate term structure shall make use of, and be consistent with, information derived from relevant financial instruments. According to Article 44 of the Delegated Regulation on Solvency II the relevant financial instruments are interest
rate swaps and government bonds.
According to Article 77a of the Solvency II Directive the determination of the risk-free
interest rate term structure shall take into account relevant financial instruments of those maturities where the markets for those financial instruments as well as for bonds are deep, liquid and transparent. The highest of those maturities is called last
liquid point (LLP).
For maturities where the markets for the relevant financial instruments or for bonds
are no longer deep, liquid and transparent, the relevant risk-free interest rate term structure shall be extrapolated. The extrapolated part of the relevant risk-free interest
rate term structure shall be based on forward rates converging smoothly from one or a set of forward rates in relation to the longest maturities for which the relevant financial instrument and the bonds can be observed in a deep, liquid and transparent
market to an ultimate forward rate (UFR).
Use of the extrapolation
The extrapolation of risk-free interest rates is not an optional measure. It is applicable to all insurance and reinsurance undertakings for the calculation of their technical
provisions.
Impact on the financial position of undertakings
As part of their asset-liability management insurance and reinsurance undertakings need to regularly assess the sensitivity of their technical provisions and eligible own
funds to the assumptions underlying the extrapolation of the relevant risk-free interest rate term structure (Article 44(2a)(a) of the Solvency II Directive).
For this report EIOPA requested the participants of the 2016 insurance stress test to provide the results of their sensitivity assessments, in particular with regard to the LLP, the speed of convergence to the UFR and the UFR itself.
With respect to each scenario, the following information was requested: currency, reference date of the calculation, LLP, UFR, speed of convergence to the UFR,
extrapolation technique, impact on eligible own funds and the impact on technical provisions.
17
Directive 2014/51/EU of the European Parliament and of the Council of 16 April 2014 amending Directives
2003/71/EC and 2009/138/EC and Regulations (EC) No 1060/2009, (EU) No 1094/2010 and (EU) No 1095/2010 in respect of the powers of the European Supervisory Authority (European Insurance and Occupational Pensions Authority) and the European Supervisory Authority (European Securities and Markets Authority), OJ L 153, 22.5.2014

38/145
Since undertakings were asked to submit the results of their individual sensitivity
analysis on extrapolation, reported scenarios differ, in particular on the assumptions regarding the LLP, level of the UFR and convergence period.
Most of the reported scenarios refer to the euro; however, some undertakings have reported scenarios regarding other currencies (CHF, CZK, DKK, GBP, HRK, HUF, NOK
and RON).
The reference date most widely applied for undertakings in the reported scenarios is 31 December 2015 or 1 January 2016; other reference dates used for the calculations
include 31 December 2014 and 31 March, 29 April and 31 May 2016.
With respect to the UFR, the following levels have been tested by undertakings in the
reported scenarios: -2%, 1%, 1.5%, 2%, 2.2%, 3%, 3.2%, 3.5%, 3.6%, 3.7%, 4%, 4.2%, 5.2%, 5% and 6%.
With respect to the LLP, the following assumptions have been tested: 5, 7, 10, 15, 20,
25, 30, 40, 50, 60 and 100 years. LLPs higher than 20 years were mainly analysed with regard to liabilities denoted in euro.
With respect to the convergence period, being the time span between the LLP and the maturity where the forward rate is approximately equal to the UFR, the following assumptions have been tested: 10, 20, 30, 40, 50, 53, 60, 65, 70, 80, 85 and 115
years.
The following table below summarises the result from the sensitivity assessments with
regard to the risk-free interest rates for the euro. Because of the small number of undertakings within the stress test sample that reported the scenarios shown below, the impact calculations only cover a very limited amount of technical provisions
compared to the total amount of technical provisions for the European market; in particular, none of the scenarios covers technical provisions with a market share of
more than 0.01%. The results may therefore not be representative for the whole market.
Number of
under-takings
UFR LLP
(years)
Conver-gence period
(years)
Impact on technical
provisions (increase,
range)
Impact on technical
provisions (increase,
median)
Impact on eligible
own funds
(decrease,
range)
Impact on eligible
own funds
(decrease,
median)
15 2% -
2.2% 20 40
0.21% to
7.56% 1.32%
2.31% to
29.36% 6.04%
10 3% 20 40 0.01% to
1.4% 0.57%
0.06% to
11.32% 4.60%
22 3.2% 20 40 0% to 4.4%
0.47% 0% to
22.75% 2.40%
10 3.5% 20 40 0% to 0.75%
0.33% 0.02% to 5.91%
2.70%
14 3.7% 20 40 0.01% to 1.09%
0.14% 0.09% to 8.20%
0.79%
10 4.0% 20 40 0.02% to 0.26%
0.09% 0% to 2.80%
0.64%
9 4.2% 30 30 0.28% to 8.60%
0.68% 0.63% to 16.46%
4.93%

39/145
III.2 Matching adjustment
According to recital 31 of the Omnibus Directive, where insurance and reinsurance undertakings hold bonds or other assets with similar cash-flow characteristics to
maturity, they are not exposed to the risk of changing spreads on those assets. In order to avoid changes of asset spreads from impacting on the amount of own funds
of those undertakings, they should be allowed to adjust the relevant risk-free interest rate term structure in line with the spread movements of their assets. Insurance and reinsurance undertakings may therefore apply a matching adjustment
(MA) to the relevant risk-free interest rate term structure when they value their life
insurance or reinsurance obligations, including annuities stemming from non-life
insurance.
The MA can only be applied where specific requirements on the insurance and
reinsurance obligations, the assets covering the obligations and the management of these obligations and assets are met (Article 77c of the Solvency II Directive). In particular, the expected asset cash flows must replicate each of the expected cash
flows of the insurance or reinsurance obligations (cash-flow matching, Article 77c(1)(c) of that Directive).
The use of the matching adjustment under the Solvency II regime is subject to prior supervisory approval.
The matching adjustment is derived from the spreads between the interest rate that could be earned from the undertaking’s assets and the basic risk-free interest rates. The matching adjustment is reduced by a fundamental spread that allows for expected
loss from default and downgrade of the undertaking’s assets.
Undertakings calculate the MA themselves, based on their own portfolios of assets.
The fundamental spreads are specified in implementing acts.
Use of the matching adjustment
38 insurance undertakings from Spain (15 undertakings) and the UK (23 undertakings) apply the MA.

40/145
Number of undertakings using the MA
Country both life
and non-life non-life life Total
ES 12 0 3 15
UK 4 0 19 23
EEA 16 0 22 38
The technical provisions of undertakings applying the MA represent 15.8% of the total amount of technical provisions in the EEA. The technical provisions of undertakings
applying the MA in Spain represent 1.2% and in the United Kingdom 14.6% of the overall technical provisions in the EEA. No non-life undertaking is applying the MA.
The following graph displays the market share in terms of technical provisions at
national level for undertakings using the MA. In the UK, undertakings representing 54.9% of the national market are using the MA. In Spain, undertakings representing
53.9% of the national market are using the MA.

41/145
According to the Solvency II Directive it is possible to apply simultaneously TTP and MA to the same liabilities. 8 of 15 undertakings in Spain are using simultaneously TTP and MA to the same liabilities. In UK, 21 of 23 undertakings are using both TTP and
MA to the same liabilities.
Undertakings applying simultaneously TTP and MA to the same liabilities
Number of undertakings %TP EEA %TP national market
ES 8 0.4% 18.9%
UK 21 14.0% 52.6%
EEA 29 14.4% -
NSAs reported different reasons why the MA is not applied in their national market
yet. Six NSAs reported that there is no sufficient exposure to LTG in their national market for the MA to have an impact.
Another reason mentioned is that fulfilling the conditions for MA for small companies is quite a challenge. 15 NSAs reported that currently no products match the legal
requirements for MA set out in Article 77b of the Solvency II Directive.
2 NSAs explicitly mentioned that in the future it may be possible that undertakings will consider using the MA, in particular for new policies issued after the entry of
Solvency II.
One NSA reported that their insurers invest a large part of their assets in government
bonds with low or negative spreads relative to the basic risk free interest rate term the MA is not beneficial. Applying the MA with mortgage loans would be beneficial form a spread perspective, but mortgage loans do not meet the requirements of the
MA as the cash flows are not completely fixed due to the prepayment option.
For another county it was reported that the asset allocation made previous to
Solvency II included assets which are not eligible for the MA portfolio. Application of MA would therefore require changes to the asset allocation.

42/145
Impact on the financial position of undertakings
The impact results presented in this section are based on data from EIOPA’s 2016 insurance stress tests. On the representativeness of the data see section II.2.
As the MA is used in two countries, Spain and United Kingdom, the impact at the EEA level is being driven by the impact in these two countries.
The following graphs show the overall quantitative impact of the use of the MA.

43/145

44/145

45/145

46/145
The following graph shows the overall impact of the use of the MA on the SCR ratio for
the whole stress test sample of the countries where the MA is used. That sample includes both undertakings from those countries using and not using the MA. For this
sample, the MA results on average in an increase of the SCR ratio by 23 percentage points.
The average increase in technical provisions without the MA for those undertakings
applying the measure would be around 3% at EEA level.

47/145

48/145
The following graph shows the impact of the MA on the MCR ratio at country and at
EEA level for undertakings using that measure. Without the MA the MCR ratio would decrease on average by 227 percentage points.

49/145
The following graphs show the impact of removing the MA on technical provisions, eligible own funds to cover the SCR and the SCR per undertaking. The impact is
measured relative to the amount with the measures. Each bar corresponds to one undertaking. The bars are ordered by size in each graph. The graphs demonstrate
that there is a wide disparity of the impact.

50/145

51/145
Impact on undertakings’ investments
The following graphs compare the average asset portfolio of undertakings applying the MA. The first graph is based on the opening balance sheet for Solvency II on 1
January 201618. The second graph is based on information from to the list of assets that undertakings reported to NSAs for the first quarter 2016. Both graphs show that
the undertakings from Spain and from the United Kingdom that use the MA have on average a different average asset portfolio.
18
For a description of the asset classes used in the graphs please refer to Annex 3.

52/145
Impact on consumers and products
With respect to the insurance products offered by insurance undertakings applying the MA in Spain, the following characteristics have been reported by the NSA:
the purpose of the products is saving for retirement, the insurance obligations for the products fall in the Solvency II line of business
“other life insurance”, the products guarantee life annuities or a lump sum payment, the products offer a guaranteed interest rate.
In the United Kingdom, MA-eligible liabilities primarily consist of ‘individual’ annuities
and ‘bulk-purchase’ annuities. At a basic level an annuity is a contract that pays an income to the policyholder in return for an upfront premium, although as with any contract there are variants on this core theme (for example, in some cases the income
stream increases in line with an inflation index). An ‘individual’ annuity is sold to individual policyholders, usually at retirement. ‘Bulk-purchase’ annuities are products
that are generally sold to pension funds, which purchase an annuity-style asset to cover some or all of the liabilities of the pension fund. These products fall under the Solvency II line of business “other life insurance”.
III.3 Volatility adjustment
Recital 32 of the Omnibus II Directive states that in order to prevent pro-cyclical investment behaviour, insurance and reinsurance undertakings should be allowed to
adjust the relevant risk-free interest rate term structure to mitigate the effect of exaggerations of bond spreads.
For that purpose insurance and reinsurance undertakings can apply a volatility
adjustment (VA) to the risk-free interest rate term structure. The VA is based on 65% of the risk-corrected spread between the interest rate that could be earned from a
reference portfolio of assets and the risk-free interest rates without any adjustment. The reference portfolio is representative for the assets which insurance and reinsurance undertakings are invested in to cover their insurance and reinsurance
obligations.
Member States may require prior approval by supervisory authorities for insurance
and reinsurance undertakings to apply a VA.
The VA is derived per currency. It is the same for all insurance and reinsurance obligations of a currency unless a country specific increase applies.
Undertakings that apply a VA to a portfolio of insurance or reinsurance obligations shall not apply a MA to those obligations.
Article 77d(6) of the Solvency Directive states that by way of derogation from Article 101, the SCR shall not cover the risk of loss of basic own funds resulting from changes of the VA.
Use of the volatility adjustment
The VA is used by 852 undertakings in 23 countries (AT, BE, BG, CY, CZ, DK, FI, FR, DE, GR, HU, IE, IT, LI, LU, NL, NO, PT, RO, SK, ES, SE and UK).

53/145
Number of undertakings using the VA
Country both life
and non-life non-life life Total
AT 10 5 4 19
BE 14 16 10 40
BG 6 6 0 12
CY 0 0 2 2
CZ 7 2 1 10
DE 0 25 58 83
DK 0 3 12 15
ES 34 30 22 86
FI 2 3 5 10
FR 69 97 51 217
GR 16 8 2 26
HU 6 1 1 8
IE 0 2 4 6
IT 12 42 38 92
LI 0 2 3 5
LU 4 75 32 111
NL 1 25 27 53
NO 4 3 0 7
PT 0 8 8 16
RO 1 0 0 1
SE 0 0 1 1
SK 3 0 1 4
UK 4 8 16 28
EEA 195 359 298 852

54/145
Insurance and reinsurance undertakings representing 60.8% of the overall amount of
technical provisions at EEA level are using the VA. The technical provisions of undertakings applying the VA in France represent 18.1%, in Germany 10.1% and in
the United Kingdom 9.2% of the overall technical provisions in the EEA.
The following graph displays for each country how widespread the use of the VA is, measured in technical provisions of undertakings that use the VA. In 9 countries (AT,
BE, ES, FI, FR, GR, IT, LU and NL) undertakings with more than 75% of the national amount of technical provisions are using the VA. Most of the technical provisions for
life insurance liabilities are held by undertakings using the VA. In Romania and Bulgaria, also undertakings with a larger part of technical provisions for non-life insurance are using the VA.

55/145
According to the Solvency II Directive it is possible to apply simultaneously the TTP or the TRFR and the VA to the same liabilities.
At EEA level, undertakings with 14.1% of the overall amount of technical provisions
are using the VA and the TTP or the TRFR to the same liabilities. In Finland undertakings with more than half of the national amount of technical provisions are
using the VA and the TTP for the same liabilities.
Undertakings applying simultaneously TTP and VA to the same liabilities
Country Number of
undertakings %TP of TP EU
%TP of national market
AT 2 (*) (*)
DE 48 3.9% 23.8%
ES 19 0.6% 25.4%
FI 7 0.3% 55.4%
FR 7 1.8% 7.5%
NO 3 0.7% 47.4%
PT 10 0.1% 19.5%
UK 17 6.5% 24.4%

56/145
EEA 118 14.1% -
(*) Data from Austria are not disclosed for confidentiality reasons because the number
of undertakings concerned is lower than 3.
The VA is applied by undertakings in most of the EEA countries. Eight NSAs reported that the volatility adjustment is not applied in their country. Five of them reported
that if undertakings can comply with the SCR without the VA they prefer not to apply it, because the impact of the VA on the financial position does not outweigh the
additional reporting burden. In one country undertakings do not have sufficient exposure to LTG to justify an application in relation to the VA.
Impact on the financial position of undertakings
The impact results presented in this section are based on data from EIOPA’s 2016
insurance stress tests. On the representativeness of the data see section II.2.
The impact of the VA should be interpreted in the light of the level of the observed
spreads in the financial markets.
The following graphs show the average impact at EEA level and per country of the VA on the SCR ratio, the SCR and the eligible own funds to cover the SCR. The graphs
are based on impact of the VA for the undertakings that apply the VA.
At EEA level removing the VA results in an average reduction of the SCR ratio of 34
percentage points.
No results at country level are shown for Bulgaria, Cyprus and Slovakia, due to confidentiality reasons; for the three countries the national average impact of the VA
is below the EEA average impact.

57/145

58/145

59/145
The following graph display the overall impact of the use of the VA on the SCR ratio
for the whole stress test sample (including both undertakings using or not using the
measure). At the EEA level, the removal of the VA would result on average in a
reduction of the SCR ratio by 23 percentage points.

60/145
Removing the VA would result in an average increase of technical provisions by 0.8% at EEA level.

61/145
The following graph shows the impact of the VA on the MCR ratio at country and at
EEA level for undertakings using that measure. At the EEA level, the removal of the
VA would result on average in a reduction of the MCR ratio by 72 percentage points.

62/145

63/145
The following graphs show the impact of removing the VA on technical provisions, eligible own funds to cover the SCR and the SCR per undertaking. The impact is measured relative to the amount with the measures. Each bar corresponds to one
undertaking. The bars are ordered by size in each graph. The graphs demonstrate that there is a wide disparity of the impact.
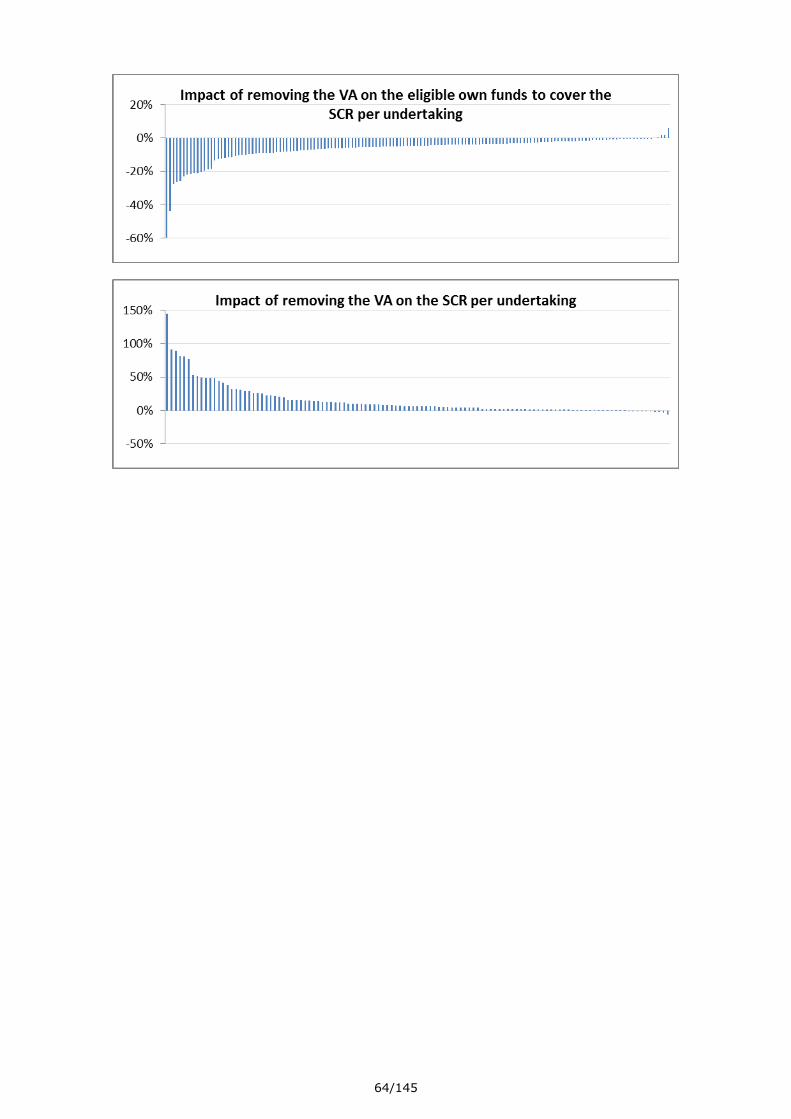
64/145

65/145
Impact on undertakings’ investments
The following graphs compare the average asset portfolio of undertakings applying the
VA. The first graph is based on the opening balance sheet for Solvency II on 1 January 201619. The second graph is based on information from to the list of assets
that undertakings reported to NSAs for the first quarter 2016. Both graphs show that the undertakings that use the VA have a different average asset portfolio, depending on their country.
Since there were less than 3 undertakings in Cyprus, Romania and Sweden applying the VA, these countries were excluded from the graphs in other to ensure the
confidentiality of their undertakings’ data. The second graph does not include information on Austria, Bulgaria and Denmark because for that market data on the credit quality and duration of undertakings applying the TTP were not available.
19
For a description of each asset classes used in the graphs please refer to Annex 3.

66/145
Impact on consumers and products
The following table sets out the share of gross written premiums of undertakings using the VA compared to the total gross premiums written by all undertakings in that
country, for each line of business (columns 1 to 6) and for the total life insurance and life reinsurance business (column 7). The table is based on data reported by
undertakings to NSAs at the end of the first quarter of 2016.
For instance, in Austria 78.6% of the total life insurance and life reinsurance premiums and 83.3% of health insurance premiums are written by undertakings
applying the VA.
Country 1. Health insurance
2. Insurance with profit
partici-pation
3. Index-linked and unit-linked insurance
4. Other life insurance
5. Health reinsurance
6. Life reinsurance
7. Total life insurance
and reinsurance
AT 83,3% 80,1% 73,4% 55,9% 100,0% 94,0% 78,6%
BE 36,0% 92,1% 77,0% 62,4% 0,0% 100,0% 86,2%
BG 56,4% 79,6% 81,2% 85,3% - 100,0% 82,5%
CY (*) (*) (*) (*) (*) (*) (*)
CZ 47,5% 49,7% 68,5% 85,2% 0,0% 0,0% 62,3%
DK 64,0% 42,7% 79,0% 74,2% 100,0% 100,0% 68,7%
FI 100,0% 93,4% 89,4% 53,0% - 100,0% 89,5%
FR 92,7% 68,4% 67,4% 70,8% 34,5% 74,1% 69,3%
DE 27,0% 78,8% 81,8% 88,8% 0,8% 6,8% 53,6%
GR 100,0% 99,8% 100,0% 100,0% - 100,0% 99,9%
HU 81,6% 30,0% 59,4% 62,8% 0,0% - 49,8%
IE 21,9% 0,9% 41,8% 21,8% 0,0% 5,0% 25,0%
IT 99,7% 99,3% 95,9% 97,2% 100,0% 89,6% 98,5%
LI - 1,2% 12,8% 0,0% - - 9,1%
LU 38,6% 87,5% 85,0% 72,8% 0,0% 7,1% 73,4%
NL 95,7% 100,0% 96,5% 97,6% -0,5% 29,0% 93,8%
NO 14,5% 42,3% 85,8% 92,3% - 0,0% 57,6%

67/145
PT 0,0% 65,5% 70,7% 10,4% - 85,1% 41,1%
RO (*) (*) (*) (*) (*) (*) (*)
SK 71,8% 32,7% 53,0% 44,3% 0,0% - 41,8%
ES 54,7% 91,2% 93,5% 82,6% - 4,2% 84,4%
SE (*) (*) (*) (*) (*) (*) (*)
UK 62,4% 21,5% 19,3% 43,3% 42,7% 18,2% 21,6%
EEA 42,7% 77,8% 52,1% 62,7% 13,9% 21,0% 54,6%
(*) Data from this country is not disclosed for confidentiality reasons because the number of undertakings applying the measure is lower than 3.
III.4 Transitional measure on the risk-free interest rates
For a period of 16 years after the start of Solvency II insurance and reinsurance undertakings may apply the transitional measure on the risk-free interest rate. Under
the transitional measure undertakings apply a transitional adjustment to the risk-free interest rate for the valuation of insurance and reinsurance obligations. The
transitional adjustment is based on the difference between the discount rates of Solvency I and the risk-free interest rates. At the beginning of Solvency II the transitional adjustment is 100% of that difference. Over the transitional period of 16
years the transitional adjustment is linearly reduced to zero. The transitional measure applies only to insurance and reinsurance obligations arising from contracts concluded
before the start of Solvency II.
The use of the transitional measure is subject to supervisory approval.
Use of the transitional measure on the risk-free interest rates
5 undertakings in 4 countries are using the TRFR. All of them are life undertakings,
except one Greek undertaking which pursues both life and non-life activity.
The market share in technical provisions of undertakings using the TRFR is negligible both at EEA level and national level except in Greece, where the aggregated market
share of the two undertakings using the TRFR is approximately 10 per cent of the national market.
0
1
2
3
FRDEGRIE
Number of undertakings using the TRFR
Life Non-life Both life and non-life

68/145
According to the Solvency II Directive it is possible to apply simultaneously TRFR and
VA to the same liabilities. Among the 6 European undertakings applying the TRFR, 5 also apply the VA.
Impact on the financial position of undertakings
The impact results presented in this section are based on data from EIOPA’s 2016 insurance stress tests. On the representativeness of the data see section II.2.
With respect to the TRFR, the information extracted from the stress test sample only
contains data from undertakings in Ireland and Greece; therefore, the calculated average impact of the measures at EU level the may not be representative of all the
undertakings applying the measure.
The impact of the TRFR on the SCR ratio for undertakings applying the measure is 52 percentage points. The average SCR ratio with the TRFR is 154% and 102% without
the measure. That improvement of the SCR ratio is due to an average decrease of 7% in the SCR and an average increase of 29% in the eligible own funds.
The impact of the TRFR on the MCR ratio for undertakings applying the measure is 173 percentage points. The average MCR ratio with the TRFR is 521% and 348% without the measure.
The average impact of the TRFR on the technical provisions for undertakings applying the measure is a decrease of 9%.
At national level, the impact of the TRFR for undertakings using the measure both in Greece and Ireland are close to the above mentioned average impacts on technical provisions, SCR and MCR. Nevertheless, the impact of the measure on the eligible own
funds is significantly higher in Greece than in Ireland due to a lower absolute amount of own funds for undertakings applying the TRFR in Greece; consequently the SCR
ratio and MCR ratio in Greece are lower than the ratios in Ireland both with the TRFR and, in particular, without the TRFR.
Information on the phasing-in plans for the TRFR and the prospects for a reduced
dependency on the measures can be found in section III.5.
Impact on undertakings’ investments, consumers and products As only five insurers are applying the TRFR, the data on the impact of this measure on
investments of undertakings, consumers and products are currently limited and do not
provide insight into the impact.

69/145
III.5 Transitional measure on technical provisions
For a period of 16 years after the start of Solvency II insurance and reinsurance undertakings may apply the transitional measure on technical provisions (TTP). Under
the transitional measure undertakings apply a transitional deduction to the technical provisions for their insurance and reinsurance obligations.
The transitional deduction is based on the difference between the technical provisions under Solvency I and the technical provisions under Solvency II. At the beginning of Solvency II the transitional adjustment is 100% of that difference, i.e. the technical
provisions are equal to the technical provisions under Solvency I. Over the transitional period of 16 years the transitional deduction is reduced to zero. The transitional
measure applies only to insurance and reinsurance obligations arising from contracts concluded before the start of Solvency II.
The use of the transitional measure is subject to supervisory approval.
Use of the transitional measure on technical provisions
The TTP is applied by 154 undertakings from 12 countries (AT, BE, BG, DE, ES, FI, FR, GR, LI, NO, PT and UK).
The technical provisions of undertakings applying the TTP represent 24.1% of the total amount of technical provisions in the EEA. The technical provisions of undertakings applying the TTP in UK represent 15.3% and in Germany 4.3% of the overall technical
provisions in the EEA.
Number of undertakings using the TTP
Country both life
and non-life non-life life Total
AT 3 0 1 4
BE 0 0 1 1

70/145
BG 0 1 0 1
DE 0 4 53 57
ES 14 0 8 22
FI 2 2 3 7
FR 1 0 6 7
GR 1 0 0 1
LI 0 0 1 1
NO 4 0 2 6
PT 4 7 8 19
UK 5 0 23 28
EEA 34 14 106 154
The following graph displays the market share in terms of technical provisions at
national level for undertakings using the TTP. In Norway, undertakings representing 87.2% or the national market are using the TTP. In the United Kingdom, Finland and Portugal, undertakings representing more than 50% of the national market are using
the TTP.

71/145
According to the Solvency II Directive it is possible to apply simultaneously TTP and MA or VA to the same liabilities.
Undertakings applying simultaneously TTP and VA to the same
liabilities
Country Number of
undertakings %TP of TP
EU %TP of national
market
AT 2 (*) (*)
FI 7 0.3% 55.4%
FR 7 1.8% 7.5%
DE 48 3.9% 23.8%
NO 3 0.7% 47.4%
PT 10 0.1% 19.5%
ES 19 0.6% 25.4%
UK 17 6.5% 24.4%
EEA 118 14.1% -
(*) Data from Austria are not disclosed for confidentiality reasons because the number of undertakings concerned is lower than 3.

72/145
Undertakings applying simultaneously TTP and MA to the same liabilities
Country Number of undertakings %TP EU
%TP national market
ES 8 0.4% 18.9%
UK 21 14.0% 52.6%
EEA 29 14.4% -
Impact on the financial position of undertakings
The impact results presented in this section are based on data from EIOPA’s 2016
insurance stress tests. On the representativeness of the data see section II.2.
The following graphs show the overall quantitative impact of the use of the TTP. At
EEA level, by removing the TTP the financial position of the insurance and reinsurance undertakings using that measure would show a decrease of the SCR ratio from 183% to 115%. Without the TTP the eligible amount of own funds to cover the SCR
exceeding the regulatory requirements would decrease by 34% while SCR would increase by 5% upon recalculation of the SCR.
The average change in SCR ratios is the highest for undertakings in Germany, France, Belgium and Austria. Usually both components of the SCR ratio (SCR and eligible own funds) are affected by the use of the TTP, but in opposite direction. Typically eligible
own funds decrease while the SCR increases when the TTP is removed. Germany had the largest decrease of eligible own funds, while Belgium accounts for the largest
increase in the SCR.
No results at country level are shown for Austria, Belgium and Greece, due to confidentiality reasons; for Austria and Belgium the national average impact of the
TTP is above the EEA average impact while for Greece the national average impact is slightly below the EEA average impact.

73/145

74/145
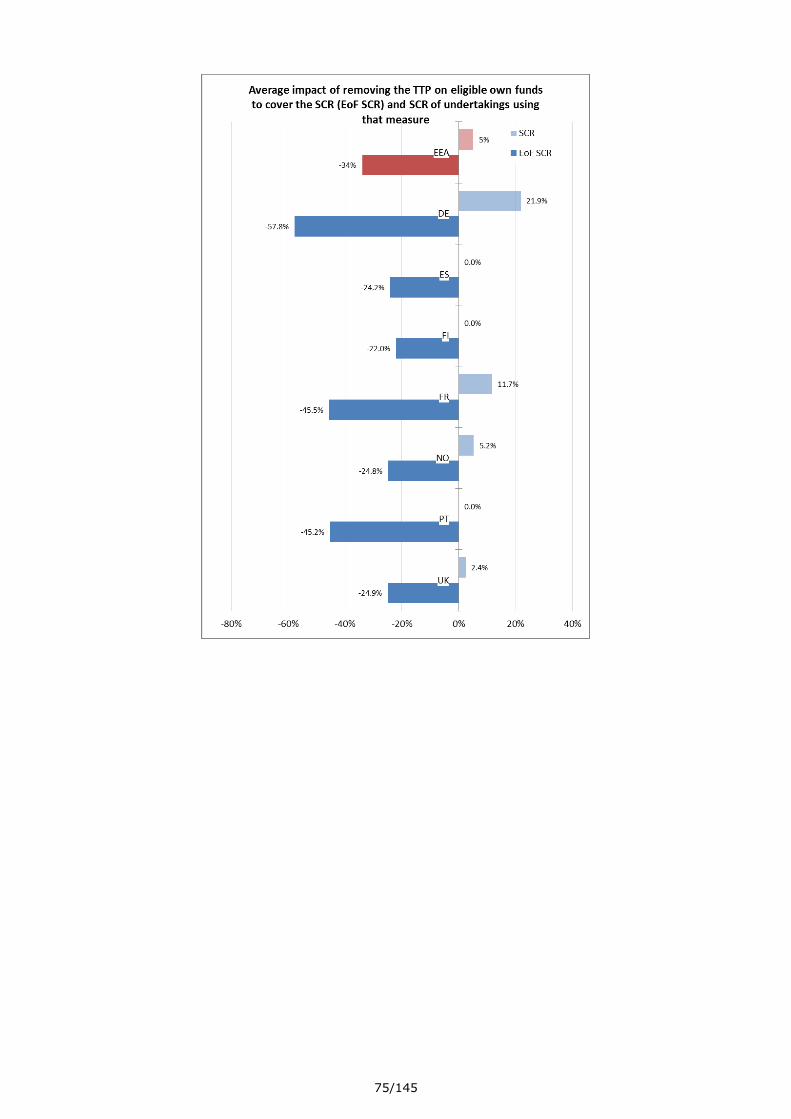
75/145

76/145
The following graph display the overall impact of the TTP on the SCR ratio for the
whole stress test sample (including both undertakings using or not using the
measure). At the EEA level, removing the TTP would result on average in a decrease
of the SCR ratio by 22 percentage points.
The average increase in technical provisions without the TTP would be around 5% at EEA level. At country level, undertakings from Germany would have the highest
average increase due of the application of the TTP.

77/145

78/145
The following graph shows the impact of the TTP on the MCR ratio at country and at
EEA level for undertakings using that measure. Without the TTP the MCR ratio decreases on average by 227 percentage points.
At country level, average MCR solvency ratios are not below 100% without applying
the TTP. As for the effects noted on the SCR, similarly for MCR the analysis shows that
for undertakings from Germany, France and Belgium have the highest average
impact. On average, the impact on the MCR and the MCR ratio may be higher than
shown in the graphs.

79/145

80/145
The following graphs show the impact of removing the TTP on technical provisions,
eligible own funds to cover the SCR and the SCR per undertaking. The impact is measured relative to the amount with the measures. Each bar corresponds to one
undertaking. The bars are ordered by size in each graph. The graphs demonstrate that there is a wide disparity of the impact.

81/145
Phasing-in plans
35 insurance and reinsurance undertakings from four countries were applying the
TRFR or TTP and did not non-comply with the SCR without that transitional measure
on 1 January 2016. The missing eligible own funds to comply with the SCR without the
transitional measures amount for these undertakings to 5.26 billion euro.
All these undertakings have submitted to their NSA a phasing-in plan that sets out the
planned measures to establish the level of eligible own funds covering the SCR or to
reduce its risk profile to ensure compliance with the SCR at the end of the transitional
period (see Article 308e of the Solvency II Directive). According to the submitted
phasing-in plans undertakings plan to take different measures to remedy the
situation, such as:
• raising of new capital,
• reduction of their risk profile through changes in the mix of invested assets, or
through the reduction of insurance and reinsurance business with higher capital
needs,
• change of the product design for new business written by lowering guaranteed
rates or focusing on unit-linked products without guarantee or pure protection
products, for instance
• reduction of their expenses,
• reduction of future discretionary benefits, and of the benefits to policyholders
linked to in-force contracts,
• retention of profits or earnings,
• no payment of dividends.
NSAs reported that they validate and monitor closely the assumptions underlying the
phasing-in plans. They also reported amendments to phasing-in planes for example
when quantitative or qualitative terms of the phasing-in plans were insufficient, or
when key underlying assumptions were not subject to sensitivity analysis.
NSAs need to revoke the approval of the application of the transitional measure where
the compliance with the SCR at the end of the transitional period is unrealistic. No
such case of revocation of the TRFR or the TTP has been reported by NSAs.
The following table provides an overview of the number of undertakings not complying
with the SCR without the transitional measures on 1 January 2016 and the missing
amount of eligible own funds to comply with the SCR without the transitional
measures at that point in time.

82/145
Country
Undertakings not
complying with the SCR without the transitional
measures
Missing amount of eligible
own funds to comply with the SCR without the transitional
measures (billion euro)
DE 16 3.46
ES 4 0.14
GR 3 0.27
PT 12 1.39
Total 35 5.26
Prospects for a reduced dependency on the transitional measures
The NSAs of the jurisdictions where the TRFR and the TTP are applied generally expect
that the dependency on these measures will gradually decrease provided that the
phasing-in plans are fulfilled. This needs to be closely monitored by the NSAs.
Nevertheless, persistence of low interest rates or future unexpected economic
development could have an impact on this dependency and could require undertakings
taking additional measures to reduce it.
Undertakings applying the transitional measures are usually subject to an intensified
supervision. Some NSAs require changes in asset allocation to reduce market risk, the
adaptation of products to the low interest rate environment, or the reduction of
dividend payments and of profit participation.
Impact on the undertakings’ investments
The following graphs compare the average asset portfolio of undertakings applying the TTP. The first graph is based on the opening balance sheet for Solvency II on 1
January 2016. The second graph is based on information from to the list of assets that undertakings reported to NSAs for the first quarter 2016. Both graphs show that the undertakings that use the TTP have a different average asset portfolio, depending on
their country.
Since there were less than 3 undertakings in Cyprus, Romania and Sweden applying
the TTP, these countries were excluded from the graphs in other to ensure the confidentiality of their undertakings’ data. The second graph does not include information on Austria because for that market data on the credit quality and duration
of undertakings applying the TTP were not available.

83/145
Impact on consumers and products
The following table sets out the share of gross written premiums of undertakings
using the TTP compared to the total gross premiums written by all undertakings in that country, for each line of business (columns 1 to 6) and for the total life insurance
and life reinsurance business (column 7). The table is based on data reported by undertakings to NSAs at the end of the first quarter of 2016.
For instance, in Austria 6.7% of the total life insurance and life reinsurance premiums
and that 9.1% of premiums for index-linked and unit-linked business are written by undertakings applying the TTP.

84/145
Country 1. Health insurance
2. Insurance with profit
partici-pation
3. Index-linked and unit-linked insurance
4. Other life
insurance
5. Health reinsurance
6. Life reinsurance
7. Total life insurance
and reinsurance
AT 0,3% 8,7% 9,1% 7,6% 0,0% 0,0% 6,7%
BE (*) (*) (*) (*) (*) (*) (*)
FI 72,7% 74,8% 53,2% 53,0% - 100,0% 56,2%
FR 0,0% 5,8% 7,4% 2,7% 0,0% 34,9% 7,9%
DE 12,3% 37,3% 38,4% 17,3% 0,0% 0,6% 24,3%
GR (*) (*) (*) (*) (*) (*) (*)
NO 8,2% 98,1% 87,0% 80,2% - 0,0% 86,7%
PT 100,0% 61,5% 54,0% 85,1% - 27,4% 70,8%
ES 0,0% 28,9% 35,6% 21,5% - 0,0% 24,4%
UK 74,3% 99,3% 31,8% 72,6% 42,7% 94,5% 74,5%
EEA 12,0% 15,9% 18,2% 32,7% 1,1% 78,4% 31,3%
(*) Data from this country is not disclosed for confidentiality reasons because the number of undertakings applying the measure is lower than 3.
III.6 Duration-based equity risk sub-module
The standard formula for the SCR includes an equity risk sub-module that captures the risk stemming from changes in the level of equity market prices. The equity risk
sub-module is based on risk scenarios that envisage a fall in equity market prices of 39% or 49%, depending on the type of equity.
Instead of that equity risk sub-module, undertakings can use a duration-based equity risk sub-module that is, with regard to certain equity investments, based on a risk scenario that envisages a fall in equity market prices of 22%. The duration-based
equity risk sub-module can only be applied by life insurance undertakings that provide certain occupational retirement provisions or retirement benefits and meet further
requirements, in particular that the average duration of the undertaking’s liabilities exceeds an average of 12 years and that the undertaking is able to hold equity investments at least for 12 years.
The possibility to apply the DBER is a Member State option of the Solvency II Directive (Article 304(1)). The application of the DBER by an insurance undertaking is
subject to supervisory approval.
Use of the duration-based equity risk sub-module
Only one undertaking in France was using the DBER as at 1 January 2016.
11 NSAs reported that the duration-based equity risk submodule is not implemented
in their national legislation (CZ, DK, FI, DE, IS, LT, LV, NL, PL, SK and BG).

85/145
The NSAs of the other countries provided the following explanations why the DBER is
not applied:
The products in the national market do not meet the criteria of Article 304 of the
Solvency II Directive; Undertakings are not or not very active in the pension market;
There is no need or no interest for this sub-module; There is not yet an incentive to apply the DBER because the equity transitional of
Article 308b(13) of the Solvency II Directive currently lowers the capital
requirement for equity investments, but more applications may follow in the course of the phasing out of that transitional measure.
Impact on the financial position of undertakings
According to the equity transitional of Article 308b(13) of the Solvency II Directive the
calculation of the equity risk sub-module on 1 January 2016 should be based on a risk
scenario that envisages a fall in equity market prices of 22%. Therefore the DBER has
no impact on the financial position of undertakings on 1 January 2016. The equity
transitional will phase out during the first six years of Solvency II. An impact of the
DBER is expected from 2017 onwards.
The insurance undertaking that applied the DBER as at 1 January 2016 did not
participate in the 2016 insurance stress test. EIOPA has therefore currently no
information about the impact of the DBER on the financial position without application
of the equity transitional.

86/145
III.7 Symmetric adjustment to the equity risk charge
Introduction
Recital 61 of the Solvency II Directive states that in order to mitigate undue potential
pro-cyclical effects of the financial system and avoid a situation in which insurance and reinsurance undertakings are unduly forced to raise additional capital or sell their
investments as a result of unsustained adverse movements in financial markets, the market risk module of the standard formula for the SCR should include a symmetric adjustment mechanism with respect to changes in the level of equity prices.
The symmetric adjustment is expected to be positive (i.e. the capital requirement is higher) when markets have risen recently, and negative (i.e. the capital requirement
is lower) when equity markets have dropped in the previous months. For more explanations on the symmetric adjustment see the thematic focus on the technical
information on that adjustment calculated and published by EIOPA in section IV.3.
Use of the symmetric adjustment to the equity risk charge
The symmetric adjustment mechanism applies to all undertakings that use the standard formula to calculate the equity risk sub-module of the SCR, including all
undertaking using a partial internal model not covering that submodule.
Impact on the financial position of undertakings
According to the equity transitional of Article 308b(13) of the Solvency II Directive the calculation of the equity risk sub-module on 1 January 2016 should be based on a risk
scenario that envisages a fall in equity market prices of 22%, irrespective of the amount of the symmetric adjustment. Therefore removing the symmetric adjustment
has no impact on the financial position of undertakings on 1 January 2016. The equity transitional will phase out during the first six years of Solvency II. An impact of the symmetric adjustment is expected from 2017 onwards.

87/145
III.8 Extension of the recovery period
Under Solvency II insurance and reinsurance undertakings are required to hold eligible own funds that cover their SCR. When an undertaking is not covering its SCR,
the NSA shall require it to take the necessary measures to achieve, within six months from the observation of non-compliance with the SCR, the re-establishment of the
level of eligible own funds covering the SCR or the reduction of its risk profile to ensure compliance with the SCR. The NSA may, if appropriate, extend that period by three months.20
Article 138(4) of the Solvency II Directive states that supervisory authorities may, under certain circumstances, further extend the recovery period for the re-
establishment of compliance with the SCR as set out in Article 138(2) of that Directive by a maximum period of 7 years.
This power applies in the event of exceptional adverse situations affecting insurance
and reinsurance undertakings that represent a significant share of the market or of the affected lines of business. The condition for an exceptional adverse situation are
on or more of the following:
A fall in financial markets which is unforeseen, sharp and steep;
A persistent low interest rate environment; A high-impact catastrophic event.
This ERP can only be granted after EIOPA has declared the existence of an exceptional
adverse situation. A necessary condition for the declaration is a request by an NSA. Article 288 of the Solvency II Delegated Regulation further states several factors and
criteria that EIOPA shall take into account in assessing the existence of an exceptional adverse situation. Where appropriate EIOPA could consult the ESRB before deciding on the existence of an exceptional adverse situation.
Once EIOPA has declared the existence of an exceptional adverse situation, the NSAs can decide on an extension of the period and determine its length for individual
insurance and reinsurance undertakings. For that purpose the NSAs shall take into account the factors and criteria set out in Article 289 of the Solvency II Delegated Regulation. To ensure a consistent approach in the ERP, EIOPA issued on 14
September 2015 Guidelines on the ERP in exceptional adverse situations.21 The guidelines relate in particular to the decision to grant an extension, the duration of the
extension and the withdrawal and revocation of the extension.
During the extended recovery period the undertakings affected are required to submit every three months a progress report to their NSA setting out the measures taken
and the progress made to meet the SCR; in case of no significant progress, the ERP will be withdrawn.
During 2016, EIOPA has developed the process for declaring an exceptional adverse situation for the purposes of Article 138(4) of the Solvency II Directive, as part of the implementation of EIOPA’s Crisis Management Handbook, which sets out the general
framework to support the role of the Authority regarding crisis prevention and management in accordance to Article 18(1) and Article 31 of EIOPA’s Regulation.
EIOPA’s internal process for declaring an exceptional adverse situation covers the following aspects:
the guiding principles to be considered in declaring such a situation, including
timely action, proportionality, close cooperation between EIOPA and the NSAs
20
See Articles 100 and 138(2) of the Solvency II Directive. 21
See https://eiopa.europa.eu/publications/eiopa-guidelines/guidelines-on-the-extension-of-the-recovery-period.

88/145
concerned, consistency in deciding on exceptional adverse situation and
transparency of the decision process; the description of the decision-making process, including the sequence of actions
and the allocation of roles and responsibilities in the declaration and continuous assessment of such a situation;
practical guidance on the condition, the factors and the criteria upon which EIOPA has to take the decision whether such a situation exists; and
the template to be used by the concerned NSAs in order to make a request to
EIOPA to declare such a situation.
To date EIOPA has not received a request to declare an exceptional adverse situation.
It should be noted that the transitional measure of Article 308b(14) of the Solvency II Directive may apply to cases of non-compliance with the SCR in 2016. According to
that transitional provision, the recovery period for undertakings which comply with Solvency I capital requirements at the end of 2015 but do not comply with the SCR in
the first year of application of Solvency II, may last until 31 December 2017.
Where an insurance or reinsurance undertaking is subject to the SCR transitional measure, it has to submit a progress report to its NSA every three months setting out
the measures taken to re-establish the level of eligible own funds covering the SCR or to reduce the risk profile to ensure compliance with the SCR. The extension has to be
withdrawn where that progress report shows that there was no significant progress in achieving that objective.
The following table shows the number of undertakings breaching the SCR (taking into
account all LTG and equity measures applied) on 1 January 2016 and, among them, the number of undertakings subject to the transitional measure of Article 308b(14) of
the Solvency II Directive.
Country
Undertakings
breaching the SCR
Among them, undertakings under the SCR
transitional
Belgium 2 2
Cyprus 2 1
France 7 5
Germany 3 3
Greece 1 1
Ireland 4 4
Italy 8 1
Liechtenstein 1 1
Luxembourg 16 6
Malta 3 3
Netherlands 1 0
Norway 1 0
Poland 2 0

89/145
Portugal 6 6
Romania 7 0
Spain 4 4
UK 6 4
Total 74 41
The number of undertakings breaching the SCR on 1 January 2016 but not subject to
the transitional measure of Article 308b(14) of the Solvency II Directive refers mainly
to undertakings which have already reached compliance with the SCR during the first
months of 2016 (in particular through raising capital, through de-risking, for example
by means of reinsurance arrangements, or through being merged with another
undertaking) within the ordinary recovery period of 6 to 9 months provided for in
Article 138(2) of the Solvency II Directive. Additionally, some undertakings are
subject to reorganisation measures or winding-up proceedings, including from before
the entry into application of Solvency II.

90/145
IV. Thematic foci
VI.1 Approval processes
For this report, EIOPA has undertaken a review of the approval processes associated with the LTG measures and the measures on equity risk. The review should show how
widely each of the measures is used and how NSAs approve the measures.
Of the eight LTG measures and measures on equity risk, the Solvency II Directive requires a supervisory approval process for four of them (MA, TTP, TRFR and DBE)
and it also gives Member States the option to have a supervisory approval process for the VA. In the following the NSAs responses to an EIOPA questionnaire on those
approval processes are set out. The questionnaire is included in Annex 6. It should be noted that the questionnaire referred to approval processes with respect to applications received before 1 January 2016. The number of approvals granted differs
in some countries from the number of undertakings using the measures shown in sections II and III of this report due to further developments between 1 January 2016
and the date of submission of opening information to NSAs.
Volatility adjustment (VA)
Article 77d of the Solvency II Directive allows Member States to have an approval process in order for undertakings to use the VA to calculate their technical provision
and SCR. 10 countries impose such an approval process (DE, DK, EE, HR, IE, PL, PT, RO, SI, UK).
The table below summarises the number of applications, approvals, rejections, withdrawals and on-going approval processes on 1 January 2016 for these 10 countries. Germany had the highest number of applications and approvals, followed
by the United Kingdom and Denmark.
In one country four applications to use the VA were rejected. The key reason for
rejection was that the business was of short term nature which was considered not to be consistent with the long term objective of the VA. The reasons for withdrawals were that use of the VA was not necessary anymore since the use of the MA had been
approved, or that the applicants’ assessment of the need of the measure or of the ability to fulfill the approval criteria changed.
As at
1 January
2016
Application
received
Granted Rejected Withdrawn Ongoing
DE 80 79 0 0 1
DK 20 15 0 0 5
EE 1 0 0 1 0
IE 10 5 4 0 1
PT 14 0 0 0 14
UK 31 23 0 5 3
Total 156 122 4 6 24
The criteria to approve the VA application differ from one country to another. NSAs reported the use of one or several of the following criteria for approving the VA:

91/145
The undertakings’ investments are sufficiently similar to the representative
portfolio of assets22 that is used in the calculation of the VA.
The undertaking is able to fulfill the prudent person principle for investments23
when it applies the VA.
The undertaking is able to manage the risks that are introduced or affected by
the VA, in particular liquidity risk.
The undertaking is able to earn on its investments an interest that is at least as high as the risk-free interest rate plus the VA.
The use of the VA does not result in or incentivise procyclical investment behaviour of the undertaking.
The use of the VA prevents procyclical investment behaviour of the undertaking.
The risk profile of the undertaking is in line with the assumptions underlying the
VA.
Matching adjustment
Article 77b of the Solvency II Directive stipulates that the use of the MA is subject to approval by the NSA. On 1 January 2016 two countries had insurance and reinsurance
undertakings applying for the use of the MA: Spain and the United Kingdom.
The table below summarises the number of applications, approvals, rejections,
withdrawals and on-going approval processes on 1 January 2016 for these two countries24. One application was rejected because the undertaking did not meet the fixed cash-flow criterion for assets required under Article 77b(h) of the Solvency II
Directive. The withdrawals of applications were due to changes in scope of the applications in order to ensure that the portfolio meets the legal requirements for the
use of the MA.
As at
1 January
2016
Application
received
Granted Rejected Withdrawn Ongoing
ES 17 16 0 1 0
UK 24 20 1 2 1
Total 41 36 1 3 1
EIOPA requested the NSAs to explain how they assess whether there is material
mismatch between the asset and liability cash-flows of the business subject to the MA.25 For that purpose the UK developed a suite of principle-based matching tests and
associated thresholds. These tests are not the only tests that firms can use to demonstrate matching and are not hard tests (i.e. failure of one or more of the tests does not automatically mean a firm is mismatched and therefore breaching MA
22
On the representative portfolio see Article 77d of the Solvency II Directive. 23
On the prudent person principle see Article 132 of the Solvency II Directive. 24
In Spain, the 16 approvals granted relate to 15 undertakings since one undertaking received the MA approval for
two different portfolios. 25
Article 77b(1)(c) of the Solvency II Directive requires that the mismatch between asset and liability cash-flows is
immaterial.

92/145
requirements). Instead they are used to assess the quality of undertakings’ matching
consistently across the industry. The tests consider the extent to which firms are materially under- or over-matched.
The Spanish NSA applies a criterion with regard to negative balances of cash-flows, i.e. expected liability cash-flows that are higher than the expected asset cash-flows at
any future month. In case there is a negative balance, it should not exceed the total payments for that month and the two previous months. Also any negative balance at the end of a year may not exceed 12.5 per cent of the total payments of that year.
EIOPA also asked whether insurance and reinsurance undertakings had any difficulty in meeting any of the legal requirements for the MA. The NSA from the United
Kingdom mentioned that the fixed cash-flow criterion for assets was the most difficult for undertakings to meet as the assets that were considered to be good-fit for annuities under Solvency I do not meet this criteria. Spain did not highlight any
issues.
The NSAs of the two countries where the MA is used have provided guidance or
additional specifications on the legal requirements for the use of that measure. Both NSAs did not believe there is a need for additional regulation in order to ensure harmonisation in their markets. Two other NSAs highlighted that further clarification in
the regulation is required in order to achieve consistent application.
Transitional on the risk-free interest rates
According to Article 308c of the Solvency II Directive the use of the transitional measure on the risk-free interest rates requires supervisory approval. On 1 January
2016 six NSAs had insurance undertakings applying for that transitional measure.
The table below summarises the number of applications, approvals, rejections,
withdrawals and on-going approval processes on 1 January 2016 for the six countries. One application was rejected by an NSA because the undertaking did not require the measure and the approval would have allowed it to take unreasonably high
investment risks. One application was withdrawn as the undertaking applied for the measure incorrectly.
As at
1 January
2016
Application
received Granted Rejected Withdrawn Ongoing
DE 1 1 0 0 0
FI 1 0 1 0 0
FR 1 0 0 0 1
GR 2 2 0 0 0
IE 1 1 0 0 0
UK 1 0 0 1 0
Total 7 4 1 1 1
As part of the review, EIOPA also requested whether NSAs had additional criteria to approve the application. Most countries did not develop additional criteria. Seven
countries did consider additional criteria. In Finland, Slovakia, France and Germany focus is put on the correct application of the transitional measures and detailed

93/145
description of the calculation are required. In Finland, France and Slovakia NSAs
further ask undertakings for information on the impact of the calculation of the transitional measure. The NSAs of Finland and Germany reported that they also put
emphasis on the calculation of the transitional risk-free interest rates during the transitional period. Finland also requires additional analysis of results (sensitivity on
interest rate assumptions, sensitivity on decrease of values of risky investments, sensitivity on longevity risk).
EIOPA also requested whether NSA would allow undertakings to start using the
transitional measure at a later date than 1 January 2016, whether they would allow undertakings to exit from the transitional measure before 2032 and whether they
would allow undertaking to reapply for the transitional after exiting. Of the NSAs that had responded, eight agreed that they would allow undertakings to apply at a later date, while four would not allow that. Most NSAs agreed that they would allow
undertakings to exit the transitional measure earlier than 2032. Several NSAs also agreed that they would allow undertakings to reapply after exiting.
Transitional on the technical provision
Article 308d of the Solvency II Directive requires NSAs to approve the use of the transitional measure on technical provisions. On 1 January 2016 thirteen NSAs had
insurance and reinsurance undertakings applying for the transitional measure on the technical provisions.
The table below summarises the number of applications, approvals, rejections, withdrawals and on-going approval processes on 1 January 2016 for the 13 countries26. The key reason for withdrawal of the application was due to undertakings
reconsidering their strategy.
As at
1 January
2016
Application
received Granted Rejected Withdrawn Ongoing
AT 4 4 0 0 0
BE 1 0 0 0 1
DE 62 60 0 0 2
ES 32 23 0 4 5
FI 9 7 0 0 2
FR 11 8 0 0 3
GR 1 1 0 0 0
IE 1 1 0 0 0
LI 1 1 0 0 0
LU 2 0 0 1 1
NO 8 8 0 0 0
PT 16 0 0 0 16
UK 27 26 0 1 0
Total 175 139 0 6 30
26
One undertaking in Ireland and two undertakings in Norway are not using the TTP in practice although they applied
for, and received, approval to use the measure.

94/145
EIOPA inquired whether the NSAs had additional criteria to approve the measure. 11
NSAs reported additional criteria. The Spanish NSA requires a written policy in relation to the transitional measure on technical provisions and a future plan on solvency and
financial position during transitional period. The NSAs of Finland and Belgium require undertakings to carry out a number of sensitivity testing. Most other NSAs require the
undertakings to provide detailed documentation on the impact of the measure on solvency position, capital management plans and details of the scope of the application.
According to Article 308d(3) of the Solvency II Directive the transitional deduction of the transitional measure on technical provisions may be recalculated upon approval by
the NSA or on its own initiative every 24 months, or more frequently where the risk profile of the undertaking has materially changed. In that context EIOPA also asked the NSAs how often they allow or require undertakings to recalculate the transitional
deduction to their technical provisions. Some NSAs reported no specific policy on the recalculation of the transitional deduction. Other NSAs generally allow or require that
recalculation every 24 months or on a quarterly basis. One NSA suggested that they do not require recalculation unless the risk-profile had material changed.
According to Article 308d(1) of the Solvency II Directive the transitional measure on
technical provisions may be applied at the level of homogeneous risk groups. A homogenous risk group is a part of the undertaking’s insurance and reinsurance
obligations which are homogeneous with respect to their risk profile. EIOPA asked NSAs about the application of this provision and in particular the undertaking’s motivation to apply the transitional measure at the level of homogeneous risk groups
rather than to all technical provisions. According to the responses the transitional measure is usually applied at the level of homogeneous risk groups. Only one NSA
reported that the transitional measure is commonly applied to all technical provisions. The main reasons mentioned for the application at homogeneous risk groups were:
The transitional measure is only applied where it decreases technical provisions
or only where it is most effective, for example to long-term business or to business with higher guaranteed interest rates.
Application at the level of homogeneous risk groups facilitates the management of the transitional measure and reduces the complexity of the calculation of technical provisions.
As for the transitional measure on the risk-free interest rates EIOPA also asked whether NSA would allow undertakings to start using the transitional measure at a
later date than 1 January 2016, whether they would allow undertakings to exit from the transitional measure before 2032 and whether they would allow undertaking
reapply for the transitional after exiting. Of the NSAs that had responded, eight agreed that they would allow undertakings to apply at a later date, while four would not allow that. Most NSAs agreed that they would allow undertakings to exit the
transitional measure earlier than 2032. Several NSAs also agreed that they would allow undertakings to reapply after exiting.
Duration-based equity risk sub-module
Article 304 of the Solvency II Directive gives Member States the option to introduce
the DBE as a measure in their national market. Nine countries allow for the use of the DBE in their national market: Spain, Slovenia, Austria, Cyprus, France, Belgium,
Portugal, Italy and Liechtenstein. Others have not transposed the DBE into national law.

95/145
On 1 January 2016, three NSAs have actually received applications: Spain two
applications, France two applications, and Belgium one application. The Belgian approval processes are still ongoing, the Spanish applications were withdrawn and one
French application was withdrawn and one granted.
As part of the review, EIOPA had inquired whether the NSAs have specific criteria to
test if the assets and liabilities are ring-fenced. Three NSAs responded as follows:
Spain requires information on the composition of the ring-fenced asset portfolio, the investment policy on the portfolio assigned, the decisions taken by the management
board on the portfolio, the description of the liabilities affected by this measure, the proof of the fulfillment of the requirements thereof, and the proof that all assets and
liabilities corresponding to the business are ring-fenced.
Slovenia has adopted a by-law which sets criteria for recognition of ring-fenced funds. Among other, this regulates some specific pension products by imposing their
recognition as ring-fenced funds
France defines ring-fenced funds as specific insurance policies of which assets and
liabilities are managed and organised separately from the other activities of the undertakings. This relies on the recital 39 of the Delegated Regulation on Solvency II. The main implication is that the use of the assets and revenues of the ring-fenced
fund for the benefit of the activities outside of the ring-fenced fund is not allowed, unless there are equivalent compensations for the benefit of the ring-fenced fund.
Furthermore, to be eligible under Article 304 of the Solvency II Directive the policy must include a tax deduction for policyholders or beneficiaries. As a consequence, Article 304 of the Solvency II Directive may apply to institutions for occupational
retirement provision that fall under Article 4 of Directive 2003/41/EC, to other ring-fenced funds carrying out retirement activities which are explicitly identified by the
French law, and to contractual ring-fenced funds, provided that they comply with the requirements set out in that Article 304.
EIOPA also inquired about the criteria NSAs used to assess the solvency and liquidity
position, the strategies, process and reporting procedures of the undertakings to ensure that it is able to hold equity investments for a period which is consistent with
the typical holding period of equity investments for the undertaking concerned (12 years). Only three NSAs responded as follows:
The Spanish NSA analyses the following in order to asset the goodness of the solvency
and liquidity positions, and the possibility to hold equity on a long term horizon:
Calculation of Own Funds, SCR an MCR for two cases: supposing the approval
of the duration equity approach and other measures requested and without the approval thereof;
Report on the sufficiency of the own funds for the last three years;
Projection of the cash in-flows and out-flows of the portfolio under normal and stressed conditions in order to demonstrate that cash in-flows are sufficient to
cover the cash out-flows without relying on equity incomes.
The French NSA requests several types of evidence as part of the approval process, in
particular:
the investment policy relating to the eligible portfolios,
where investments operations are outsourced to an asset manager, the asset
management mandate,
investments decisions taken over the last 12 months by the competent body of
the undertaking,

96/145
for the last five financial years, the amount of written premiums, claims paid,
expenses, investment returns, matured bonds, equity sales, and other cash inflows and outflows,
an assessment of the liquidity risk under stressed conditions.
The NSA of Liechtenstein asks for several scenarios to demonstrate the ability of the
undertaking to fulfil these criteria. Evidence on how long the undertaking has held equity investments in the past is also asked.

97/145
IV.2 Technical information on the risk-free interest rates calculated
and published by EIOPA
Under Solvency II, the assessment of the financial situation of insurance and reinsurance undertakings is based on harmonised principles and methodologies for the valuation of their assets and liabilities. In particular, insurance and reinsurance
liabilities are discounted with risk-free interest rates.
According to Article 77e(1) of the Solvency II Directive, EIOPA is required to derive
and publish technical information on the risk-free interest rates at least on a quarterly basis. That technical information consists of the following items:
relevant risk-free interest rate term structures without any matching adjustment or
volatility adjustment; fundamental spreads for the calculation of the matching adjustments;
volatility adjustments to the relevant risk-free interest rate term structures.
In order to ensure uniform conditions for the valuation of insurance and reinsurance liabilities, the European Commission can make technical information on the risk-free
interest rates binding by setting it out in implementing acts in accordance with Article 77e(2) of the Solvency II Directive. The implementing acts shall to make use of the
technical information published by EIOPA.
During 2014 EIOPA developed a methodology to calculate the technical information on the basis of the Solvency II Directive and Delegated Regulation. EIOPA publicly
consulted on the methodology at the end of 201427 and decided on it in February 2015. Since March 2015 EIOPA has been publishing the technical information on a
monthly basis.28 The period from March to December 2015 was used as a preparatory phase for the calculation and publication of the technical information.29 During that period the information was provided to support the preparation of insurance and
reinsurance undertakings and supervisory authorities in view of the start of Solvency II at the beginning of 2016. The preparatory phase included an external review of
EIOPA’s calculation process for the technical information and of the source code used in the calculation. Independent from the review, EIOPA carried out a crowdsourcing on
the source code with the aim to identify and remove any programming mistakes.
The publication of the technical information takes place on the fifth working day of the month. The process of calculation and publication of the information includes the
following steps:
download of input data from data providers, in particular swap rates, government
bond rates and corporate bond rates, automated calculation of the technical information, validation of input data and calculation results,
internal approval and information of EIOPA’s Board of Supervisors about the results,
publication of the results.
27
For the consultation report, see https://eiopa.europa.eu/Pages/Consultations/CP-14-042-Consultation-paper-on-a-
Technical-document-regarding-the-risk-free-interest-rate-term-structure.aspx. 28
The technical information is published on EIOPA’s website, see https://eiopa.europa.eu/regulation-
supervision/insurance/solvency-ii-technical-information/risk-free-interest-rate-term-structures for the publications since January 2016 and see: https://eiopa.europa.eu/regulation-supervision/insurance/solvency-ii-technical-information/solvency-ii-preparatory-phase-risk-free-interest-rate-term-structures for the publications during the preparatory phase. 29
For the technical information and background documents published during the preparatory phase, see:
https://eiopa.europa.eu/regulation-supervision/insurance/solvency-ii-technical-information/solvency-ii-preparatory-phase-risk-free-interest-rate-term-structures

98/145
The European Commission adopted implementing acts setting out the technical
information published by EIOPA for end of December 2015, March 2016, June 2016 and September 2016.30 The implementing acts made the use of the information
binding for the reporting of insurance and reinsurance undertakings during the following three months.
Transparency
The need for a transparent calculation of the technical information is stated in recital
29 of the Omnibus II Directive and specified in recital 23 of the Solvency II Delegated Regulation. EIOPA aims at ensuring the replicability of its monthly calculation of
technical information. To this end, the calculation methodology is set out in a technical documentation and the source code for the calculation is public.31 Replicability of the calculations allows stakeholders to simulate how EIOPA’s technical information will
change when the input data change and thereby in particular supports the risk-management of insurance and reinsurance undertakings. Moreover, undertakings that
need to report timely about their solvency situation, for example to investors, can anticipate the results of EIOPA’s calculations before their publication. In addition to the technical information set out in Article 77e(1) of the Solvency II Directive, EIOPA
publishes intermediate results in order to promote the transparency of the calculation.
Data limitations
In carrying out the task to derive the technical information, the availability of input data has been a major challenge. Data are in particular scarce where financial
markets are not sufficiently developed. This issue relates in particular to the following data needs:
yields for corporate bond denoted in currencies of less developed markets – these yields are required to calculate volatility adjustments and the fundamental spreads for those currencies;
rates from government bond markets with limited issuances – these government bond rates are needed to calculate volatility adjustments and the fundamental
spreads for those government bonds; overnight indexed swap rates to derive the credit risk adjustment to interest rate
swaps
To overcome these data limitations, proxies based on data from more developed markets are used in the calculation of the technical information.
30
Commission Implementing Regulation (EU) 2016/165 of 5 February 2016 laying down technical information for the
calculation of technical provisions and basic own funds for reporting with reference dates from 1 January until 30 March 2016 in accordance with Directive 2009/138/EC of the European Parliament and of the Council (Solvency II), OJ L 32, 9.2.2016, Commission Implementing Regulation (EU) 2016/869 of 27 May 2016 laying down technical information for the calculation of technical provisions and basic own funds for reporting with reference dates from 31 March until 29 June 2016 in accordance with Directive 2009/138/EC of the European Parliament and of the Council on the taking-up and pursuit of the business of Insurance and Reinsurance, OJ L 147, 3.6.2016, Commission Implementing Regulation 2016/1376 of 8 August 2016 laying down technical information for the calculation of technical provisions and basic own funds for reporting with reference dates from 30 June until 29 September 2016 in accordance with Directive 2009/138/EC of the European Parliament and of the Council on the taking-up and pursuit of the business of Insurance and Reinsurance, OJ L 224, 18.8.2016, Commission Implementing Regulation 2016/1976 of 10 November 2016 laying down technical information for the calculation of technical provisions and basic own funds for reporting with reference dates from 30 September until 30 December 2016 in accordance with Directive 2009/138/EC of the European Parliament and of the Council on the taking-up and pursuit of the business of Insurance and Reinsurance, OJ L 309, 16.11.2016. 31
The technical documentation and the source code are published on EIOPA’s website:
https://eiopa.europa.eu/regulation-supervision/insurance/solvency-ii-technical-information/risk-free-interest-rate-term-structures.

99/145
Data limitations also exist with regard to the assessment whether interest rate swap
markets, government bond markets and general bond markets are deep and liquid. That assessment is needed to determine the relevant financial instruments for the
derivation of the risk-free interest rates. With regard to the swap market, the data availability is expected to significantly improve in 2017 through the Commission
Regulation (EU) No 648/2012 on OTC derivatives, central counterparties and trade repositories (EMIR).
Risk-free interest rate term structures
EIOPA is currently publishing technical information on 33 relevant currencies including
all currencies of EEA countries. The relevance of the currencies was determined with regard to the amount of insurance and reinsurance liabilities of EEA insurance and reinsurance undertakings and insurance groups that are denoted in those currencies.
The risk-free interest rates are derived from the rates of interest rate swaps or government bonds, both adjusted for credit risk. For maturities where financial
markets for interest rate swaps and bonds are not deep, liquid or transparent anymore the risk-free interest rates are extrapolated towards an ultimate forward rate.
According to Article 77a of the Solvency II Directive the risk-free interest rates should make use of, and be consistent with, information derived from relevant financial
instruments. Article 44 of the Solvency II Delegated Regulation specifies that the relevant financial instruments are interest rate swaps, provided they are available from deep, liquid and transparent financial markets. Otherwise government bonds
from deep, liquid and transparent financial markets should be used. The following table sets out the type of relevant financial instrument used by EIOPA to derive the
risk-free interest rates of the relevant currencies.
Relevant financial instruments
Interest rate swaps used
for …
Government bonds used
for …
Euro
Bulgarian lev
Czech Koruna
Danish krone
Pound sterling
Swedish krona
Norwegian krone
Swiss franc
Australian dollar
Canadian dollar
Chilean peso
Colombian peso
Hong Kong dollar
Malaysian ringgit
New Zealand dollar
Renminbi-yuan
Croatian kuna
Hungarian forint
Polish zloty
Romanian leu
Icelandic króna
Brazilian real
Indian rupee
Mexican peso
Taiwan new dollar

100/145
Russian rouble
Singapore dollar
South African rand
South Korean won
Thai baht
Turkish lira
US dollar
Yen
For maturities where financial markets for interest rate swaps and bonds are not
deep, liquid or transparent anymore the risk-free interest rates are extrapolated. The following table sets out for each relevant currency the last maturity where those
markets are still deep, liquid and transparent (last liquid point).
Last liquid point Currencies
50 years Pound sterling, US dollar
30 years Australian dollar, yen
25 years Swiss franc, Canadian dollar32
20 years Euro, Bulgarian lev, Danish krone, South Korean won,
Malaysian ringgit, Mexican peso, New Zealand dollar, Singapore
dollar
15 years Czech koruna, Hungarian forint,
Hong Kong dollar, Thai baht, rand
10 years Croatian kuna, Polish zloty, Romanian leu, Swedish krona, Icelandic króna, Norwegian
krone, Brazilian real, Chilean peso, renminbi-yuan, Colombian
peso, Indian rupee, Russian rouble, Turkish lira, new Taiwan dollar
According to Article 77a of the Solvency II Directive the risk-free interest rates are
extrapolated towards an ultimate forward rate. The extrapolation is currently based on an ultimate forward rate of 4.2% for most countries including the euro. For the Swiss
franc and the yen a UFR of 3.2% and for the Brazilian real, the Indian rupee, the Mexican peso, the Turkish lira and the South African rand a UFR of 5.2% is used. These ultimate forward rates were derived in 2010 and used for quantitative impact
studies during the development of Solvency II. In line with Article 47(1) of the Delegated Regulation EIOPA is currently working on a methodology to derive the
32
For the Canadian dollar the last liquid point will change to 30 years on 31 December 2016.

101/145
ultimate forward rates on an ongoing basis in line with Article 47 of the Delegated
Regulation.33
The following graph shows the risk-free interest rate term structures for the euro for
end of December 2015, March 2016, June 2016 and September 2016. The interest rates do not include a matching or volatility adjustment. The rates up to maturity 20
years are derived from interest rate swaps, the remaining rates are determined by means of extrapolation towards an ultimate forward rate of 4.2%.
The graph shows the risk-free interest rates for integer maturities from 1 to 60 years
Small circles indicate the risk-free interest rates. The small circles are connected to improve readability.
Annex 4 includes graphs with term structures for all 33 currencies for which EIOPA
currently produces technical information.
Fundamental spreads
Fundamental spreads are used by insurance and reinsurance undertakings to calculate their portfolio-specific matching adjustment to the risk-free interest rates, where the
use of the matching adjustment was approved by the supervisory authority. The fundamental spread is also used as the risk correction for the calculation of the
volatility adjustment, see below.
The fundamental spread should reflect the risk of default of the assets and the risk of the loss resulting from downgrading of the assets. The fundamental spreads are stable
over time. They are derived from long-term average spreads of the assets and, for corporate bonds, from long-term default and downgrade statistics.
33
For EIOPA’s consultation proposal on the methodology to derive the ultimate forward rates and its implementation
see https://eiopa.europa.eu/Pages/Consultations/EIOPA-CP-16-003-Consultation-Paper-on-the-methodology-to-derive-the-UFR-and-its-implementation-.aspx.

102/145
EIOPA provides fundamental spreads for government bonds per issuer and maturity
and for corporate bonds per sector of issuer (financial/non-financial), credit quality step and maturity.
The following graph shows the fundamental spreads for government bonds of maturity 10 years at the end of September 2016. The fundamental spread is zero for Germany,
Sweden, the United Kingdom, Liechtenstein, Norway, Australia, Canada, Hong-Kong, Malaysia, New Zealand, Switzerland, Singapore, Thailand and the United States.
The following graph sets out the fundamental spread for euro corporate bonds of maturity 10 years at end of September 2016.
Volatility adjustments
The volatility adjustment is 65% of the spread between the interest rate that could be
earned from assets of a reference portfolio and the risk-free interest rates. The spread is corrected for risk on the basis of the fundamental spread. The reference portfolio is representative of the assets which insurance and reinsurance undertakings are
invested in.

103/145
The following graph sets out the volatility adjustments at the end of September 2016.
Country Volatility
adjustment
Euro 10
Bulgarian lev 8
Croatian kuna 10
Czech koruna 2
Danish krone 56
Hungarian forint 20
Polish zloty 15
Pound sterling 28
Romanian leu -2
Swedish krona 3
Icelandic króna 15
Norwegian krone 26
Swiss franc 4
Australian dollar 9
Canadian dollar 5
Japanese yen 2
US dollar 59
The following graph shows the development of the volatility adjustment for the euro from end of December 2015 to end of September 2016. The graph also shows the decomposition of the volatility adjustment into a government bond component and a
corporate bond component in accordance with Article 50 of the Delegated Regulation.

104/145
The volatility adjustments shown in the graph are relevant for all euro area markets
except Greece. The volatility adjustment for Greece included until 29 September 2016 a national increase according to Article 77d(4) of the Solvency II Directive. Since 30
September 2016 the calculation of the volatility adjustment did not give rise anymore to a national increase for Greece.
Graphs with the development of the volatility adjustment for Greece and currencies other than the euro are set out in Annex 5.

105/145
IV.3 Technical information on the symmetric adjustment to the equity
risk sub-module calculated and published by EIOPA
Insurance and reinsurance undertakings are requested to hold solvency capital that can compensate for possible losses in the value of their equity investments. The standard formula to calculate the SCR includes as part of the market risk module an
equity risk sub-module to quantify the risk of losses on equity investments. In the equity risk sub-module the capital requirement is derived from the impact of a stress
scenario. The stress is a decrease in the value of equity investments which is calculated as a percentage of the market value of those investments.
Recital 61 of the Solvency II Directive states that “in order to mitigate undue potential
pro-cyclical effects of the financial system and avoid a situation in which insurance and reinsurance undertakings are unduly forced to raise additional capital or sell their
investments as a result of unsustained adverse movements in financial markets, the market risk module of the standard formula for the Solvency Capital Requirement should include a symmetric adjustment mechanism with respect to changes in the
level of equity prices”.
In order to prevent pro-cyclical behaviour of undertakings with regard to their equities
exposures, for example “fire sales” in a crash of the equity market, the stress scenario of the equity risk sub-module is subject to an adjustment. The adjustment behaves symmetrically. It is expected to be positive (i.e. the capital requirement is higher)
when markets have risen recently, and negative (i.e. the capital requirement is lower) when equity markets have dropped in the previous months.
The legal requirements on the determination of the symmetric adjustment are set out in Article 106 of the Solvency II Directive, Article 172 of the Solvency II Delegated Regulation and the Commission Implementing Regulation laying down the
implementing technical standards with regard to the equity index for the symmetric adjustment of the standard equity capital charge34.
The symmetric adjustment mechanism is based on a comparison of the current level of an appropriate equity index and an average level of that index.35 The average is
calculated over a period of 36 months.36 The symmetric adjustment increases the equity stress if the current level of the equity index is more than 8% above of the average level of the index. When the current level of the equity index is below of the
average level of the index, the adjustment decreases the equity stress.
In any case, the symmetric adjustment is never lower than -10% or higher than
10%.37
The equity stress scenario before applying the symmetric adjustment is a decrease of equity prices by 39% for non-strategic equity investments listed in regulated markets
in the countries of the EEA or the OECD (type 1 equity). For other non-strategic equity investments (type 2 equity) a decrease of prices by 49% is assumed.38 After
application of the symmetric adjustment the decrease of equity prices is between 29% and 49% for type 1 equity and between 39% and 59% for type 2 equity, depending on the current and past level of the equity index.
In order to ensure that the equity index measures the market price of a diversified portfolio of equities which is representative of the nature of equities typically held by
34 Commission Implementing Regulation (EU) 2015/2016 of 11 November 2015 laying down the implementing technical standards with regard to the equity index for the symmetric adjustment of the standard equity capital charge in accordance with Directive 2009/138/EC of the European Parliament and of the Council, OJ L 295, 12.11.2015 35 See Article 106(2) of the Directive. 36 See Article 172(2) of the Delegated Regulation. 37 See Article 172(2) and (4) of the Delegated Regulation. 38 See Article 169 of the Delegated Regulation.
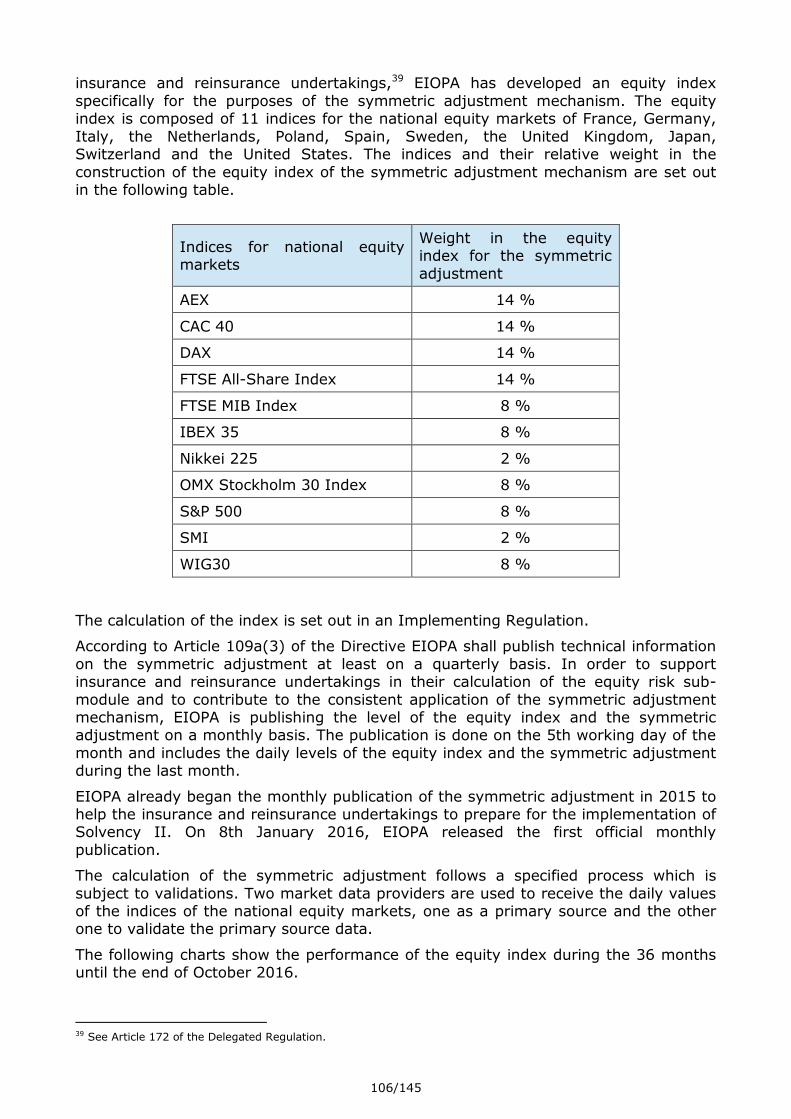
106/145
insurance and reinsurance undertakings,39 EIOPA has developed an equity index
specifically for the purposes of the symmetric adjustment mechanism. The equity index is composed of 11 indices for the national equity markets of France, Germany,
Italy, the Netherlands, Poland, Spain, Sweden, the United Kingdom, Japan, Switzerland and the United States. The indices and their relative weight in the
construction of the equity index of the symmetric adjustment mechanism are set out in the following table.
Indices for national equity markets
Weight in the equity index for the symmetric
adjustment
AEX 14 %
CAC 40 14 %
DAX 14 %
FTSE All-Share Index 14 %
FTSE MIB Index 8 %
IBEX 35 8 %
Nikkei 225 2 %
OMX Stockholm 30 Index 8 %
S&P 500 8 %
SMI 2 %
WIG30 8 %
The calculation of the index is set out in an Implementing Regulation.
According to Article 109a(3) of the Directive EIOPA shall publish technical information
on the symmetric adjustment at least on a quarterly basis. In order to support insurance and reinsurance undertakings in their calculation of the equity risk sub-
module and to contribute to the consistent application of the symmetric adjustment mechanism, EIOPA is publishing the level of the equity index and the symmetric adjustment on a monthly basis. The publication is done on the 5th working day of the
month and includes the daily levels of the equity index and the symmetric adjustment during the last month.
EIOPA already began the monthly publication of the symmetric adjustment in 2015 to help the insurance and reinsurance undertakings to prepare for the implementation of Solvency II. On 8th January 2016, EIOPA released the first official monthly
publication.
The calculation of the symmetric adjustment follows a specified process which is
subject to validations. Two market data providers are used to receive the daily values of the indices of the national equity markets, one as a primary source and the other one to validate the primary source data.
The following charts show the performance of the equity index during the 36 months until the end of October 2016.
39 See Article 172 of the Delegated Regulation.

107/145
The following chart shows the performance of the equity index during 2016 in comparison with its 36-month average of the index.
60%
70%
80%
90%
100%
110%
120%
130%
Equity index for the symmetric adjustment mechanism calculated for end-October 2016
90%
95%
100%
105%
110%
115%
120%
125%
130%
135%
140%
1 Jan 1 Feb 1 Mar 1 Apr 1 May 1 Jun 1 Jul 1 Aug 1 Sep 1 Oct
Equity index for the symmetric adjustment mechanism
January to October 2016
Equity index (last value of daily calculated index)
36-month average of the equity index (of daily calculated index)

108/145
The symmetric adjustments derived from the equity index and the 36-months average
is shown in the following chart. The adjustment is always negative, hence reducing the equity stress because the level of the equity index is never 8% higher than its 36-
month average.
In 2016 the symmetric adjustment was between -2.2% and -10%. The minimum value of -10% occurred on 11 February 2016 after most equity markets had significantly fallen during the first days of February. The symmetric adjustment
increased again after that day in line with the recovery of equity prices. Another downward spike in the symmetric adjustment can be observed after 23 June 2016,
the day of the referendum in the United Kingdom on leaving the European Union. The symmetric adjustment went down to -9.7% (27 June 2016) but increased again afterwards.
An example of the calculation of the equity index and the symmetric adjustment can be found on EIOPA’s website.40
40 See any of the monthly publication files, tab “Example” at https://eiopa.europa.eu/regulation-supervision/insurance/solvency-ii-technical-information/symmetric-adjustment-of-the-equity-capital-charge.
-10%
-8%
-6%
-4%
-2%
0%
2%
4%
6%
8%
10%
1 Jan 1 Feb 1 Mar 1 Apr 1 May 1 Jun 1 Jul 1 Aug 1 Sep 1 Oct
Symmetric adjustment January to October 2016

109/145
Annexes
Annex 1 – Overview of the European insurance market
The following charts show for each EEA country the number of insurance and
reinsurance undertakings and their share of the European insurance market measures in technical provisions and in gross written premiums.

110/145
Annex 2 – Impact on consumers and products
Life insurance and reinsurance business of undertakings using the measures
MA, VA, TRFR and TTP
In order to indicate which type of products are mainly affected by the application of
the different LTG measures, the table below shows the EEA market share per line of
business of the insurance and reinsurance undertakings that apply the measures MA,
VA, TRFR and TTP. The market share is measured in gross written premiums. The
table is based on data that insurance and reinsurance to NSAs with regard to the first
quarter of 2016. The lines of business for annuities stemming from non-life insurance
are not included in the table because usually no premiums are accounted for them.
In particular, the table shows the following:
- 54.6% of the life insurance and reinsurance premiums in the EEA are written by
undertakings applying the VA. The use of the VA is most common for insurance
with profit participation.
- Insurers that use the TTP account for 31.3% of the life insurance and reinsurance
premiums.
- 23.8% of the life insurance and reinsurance premiums are written by undertakings
applying the MA,. The most affected lines of business are life reinsurance and
“other life insurance”;
- The TRFR is applied to life insurance and reinsurance business representing 0.2%
of written premiums.
Undertakings
applying MA
Undertakings
applying VA
Undertakings
applying
TRFR
Undertakings
applying TTP
Health insurance 2.2% 42.7% 0.4% 12.0%
Insurance with profit
participation 4.2% 77.8% 0.3% 15.9%
Index-linked and
unit-linked insurance 7.9% 52.1% 0.3% 18.2%
Other life insurance 36.8% 62.7% 0.0% 32.7%
Health reinsurance 0.0% 13.9% 0.0% 1.1%
Life reinsurance 76.2% 21.0% 0.2% 78.4%
Total life gross
written premiums 23.8% 54.6% 0.2% 31.3%

111/145
The figures in a row may not sum up to 100% because the premiums of undertakings
that do not use any of the measures MA, VA, TRFR or TTP are not included in the
table. It is possible that the sum of the figures in a row exceeds 100% where
undertakings apply more than one measure.
As background information the following table shows the distribution of gross written
premiums for life insurance and reinsurance obligations per lines of business, for all
EEA insurance and reinsurance undertakings, irrespectively of their use of the LTG
measures.
Distribution of gross written premiums to lines of business
Health insurance 7.0%
Insurance with profit participation 35.9%
Index-linked and unit-linked insurance 24.3%
Other life insurance 9.7%
Annuities stemming from non-life insurance contracts
and relating to health insurance obligations
0.2%
Annuities stemming from non-life insurance contracts
and relating to insurance obligations other than health
insurance obligations
0.0%
Health reinsurance 1.0%
Life reinsurance 21.8%
Total life insurance and reinsurance 100%

112/145
Annex 3 - Asset classes
The statistics on investments of insurance and reinsurance undertakings presented in
this report are based on the following asset classification. The asset classes are
specified in terms of the items of the Solvency II balance sheet used for supervisory
reporting (template S.02.01.02).
Asset Class Row of the balance sheet
template
Government debt R0140
Corporate debt R0150, R0170
Equities R0110, R0120
Property R0080
Assets held for index-linked and unit-linked products
R0220
Participations R0090
Other Assets R0160, R0180, R0190, R0200,
R0210, R0410

113/145
Annex 4 - Technical information – Risk-free interest rate term structures
This annex sets out graphs on the risk-free interest rate term structures for the relevant currencies. For each currency the term structures for end of December 2015, March 2016, June 2016 and September 2016 are shown.
The interest rates do not include a matching or volatility adjustment.
The graph shows the risk-free interest rates for integer maturities from 1 to 60 years
(small circles). Small circles are connected to improve readability.

114/145

115/145

116/145

117/145

118/145

119/145

120/145

121/145
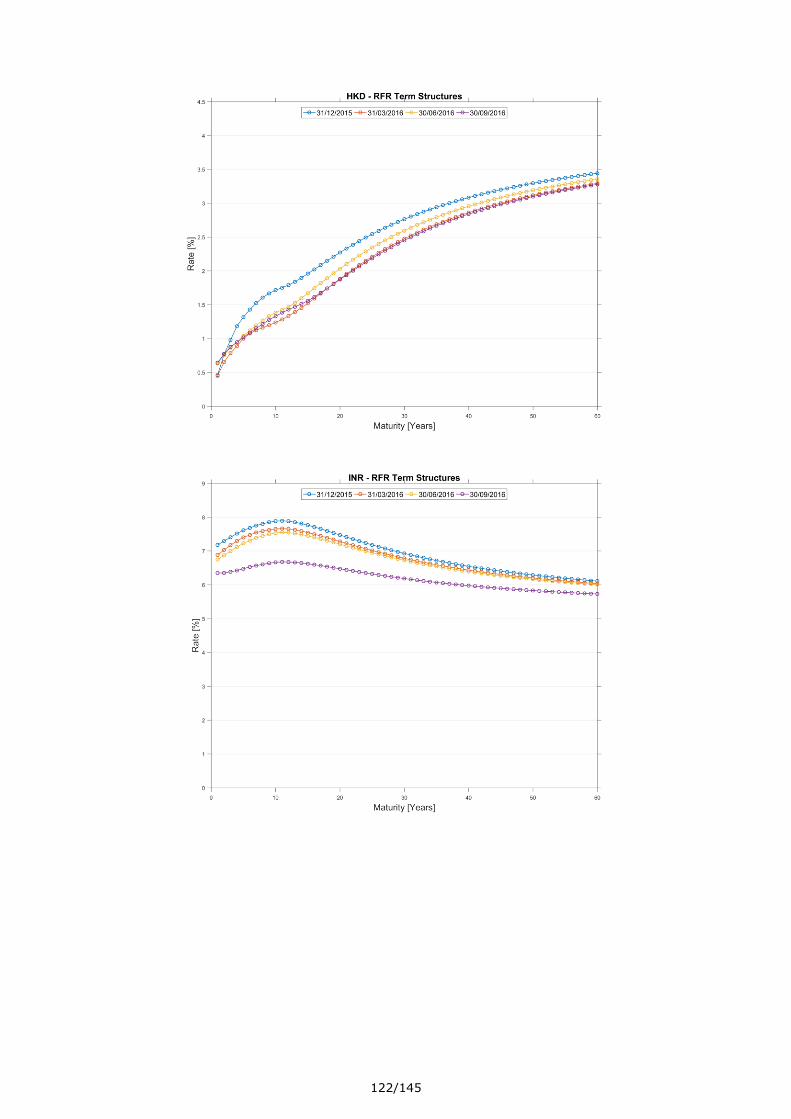
122/145

123/145

124/145

125/145

126/145

127/145

128/145

129/145
Annex 5 - Technical information – Volatility adjustments
This annex sets out graphs on the development of the volatility adjustment for all relevant currencies from end of December 2015 to end of September 2016 (blue
curve, values between months interpolated). The graphs also show the decomposition of the volatility adjustment into a government bond component (light grey) and a
corporate bond component (dark grey) in accordance with Article 50 of the Delegated Regulation.

130/145

131/145

132/145

133/145
Liechtenstein/Switzerland

134/145

135/145

136
Annex 6 - Questionnaire on approval processes
Review of long-term guarantee measures and measures on equity risk 2016: Questionnaire on approval processes
0. Approval processes
0.1
Please complete the table below with the requested information regarding approval
processes for the use of LTG measures and measures on equity risk started before 1
January 2016.
Matching
Adjustment
Volatility
Adjustment **
Duration Based
Equity ***
Transitional on risk
free interest rates
Transitional on
technical provisions
1. Number of applications received before 1 January 2016 *
2. Number of approvals granted before 1 January 2016
3. Number of rejections decided before 1 January 2016
4. Number of applications withdrawn before 1 January 2016
5. Number of ongoing approval procedures at 1 January 2016 (5=1-2-3-4)
0.2 In case of significant changes between 1 January 2016 and the date of submission of
the response to this questionnaire, please provide updated information.
0.3
Please provide a description of any cases in which your authority rejected an
application to use MA, VA, DBER, TRFR or TTP. For each measure, please indicate the
concrete requirements not fulfilled by the applicant undertakings and any other
relevant aspect considered by your authority.
0.4
Please provide a description of the cases where applications to use MA, VA, DBER,
TRFR or TTP have been withdrawn by the applicant undertakings before a formal
decision has been adopted by your authority. For each measure, please indicate the
possible reasons for the withdrawal.
1. Volatility adjustment (VA)
1.1 Is the VA subject to approval in your jurisdiction? Yes/No
1.2If so, what criteria do undertakings have to satisfy to receive approval to use the
VA?
1.3 Do you have any other comments?
Answers
*In case one undertaking have submitted more than one application for the use of a particular measure, the total number of applications (not number of undertakings) should be provided
** In case the volatility adjustment is not subject to supervisory approval in your jurisdiction according to the national law, please indicate “not applicable”
*** In case undertakings in your jurisdiction are not allowed to seek approval to use the duration based equity risk sub-module, please indicate “not allowed”
Questions
Member State
National Competent Authority
Contact person
(name, email, telephone)

137/145
2. Matching adjustment (MA)
2.1Do you consider that the ITS and EIOPA Guidelines on the approval of the MA ensure
full harmonization in your market and across markets?
2.2
Have you introduced additional specifications of the approval procedure, for
example additional criteria for approval? What areas of the approval procedure do
these specifications cover
2.3 Which criteria are the most difficult to comply with for undertakings?Please briefly
explain what are the major problems that occur for these criteria.
2.4 What criteria do you apply for assessing the materiality of the mismatch referred to
in Article 77b(1)(c)?
2.5 Do you have any other comments?
3. Transitional on risk-free interest rates (TRFR)
3.1
Do you approve applications for starting the use of the transitional not on 1 January
2016, but at a later date during the transitional period?Please note that this
question is not about whether undertakings can receive approval after 1 January
2016 to use the transitional retrospectively from 1 January 2016 on.
3.2
Do you allow undertakings to exit from the use of the transitional during the
transitional period even before their technical provisions are run off (for example
after 10 years)? If yes, is it possible for undertakings to use the transitional again
after the exit?
3.3
Have you introduced additional specifications of the approval procedure, for
example additional criteria for approval? What areas of the approval procedure do
these specifications cover?
3.4
In particular, do you require a phasing-in plan if an undertaking does not comply
with MCR without the transitional while it does comply with SCR without the
transitional? This case can be relevant for small undertakings where the MCR is
higher than the SCR because it is determined by the absolute floor.
3.5 Do you have any other comments?
4. Transitional on technical provisions (TTP)
4.1
Do you approve applications for starting the use of the transitional not on 1 January
2016, but at a later date during the transitional period?Please note that this
question is not about whether undertakings can receive approval after 1 January
2016 to use the transitional retrospectively from 1 January 2016 on.
4.2
Do you allow undertaking to exit from the use of the transitional during the
transitional period even before their technical provisions are run off (for example
after 10 years)? If yes, is it possible for undertakings to use the transitional again
after the exit?
4.3
Have you introduced additional specifications of the approval procedure, for
example additional criteria for approval? What areas of the approval procedure do
these specifications cover?
4.4
In particular, do you require a phasing-in plan if an undertaking does not comply
with MCR without the transitional while it does comply with SCR without the
transitional?
4.5
What is your policy on the application of Article 304d(3) of the Solvency II Directive
on the recalculation of the transitional reduction. In particular, do you require or
allow recalculation of the reduction every 24 month or with another specified
frequency? In case applicable, what are your criteria for assessing whether the risk
profile of the undertaking has materially changed?
4.6
How many undertakings have requested to apply the transitional at the level of
homogeneous risk groups? To the extent you are aware, what is the motivation for
the undertakings’ choice of the homogeneous risk groups. What is your supervisory
assessment of the undertakings’ choice of the homogeneous risk groups?
4.7 Do you have any other comments?

138/145
5. Duration based equity risk submodule (DBE)
5.1 Can undertakings seek approval to use the duration-based equity sub module in
your jurisdiction?
5.2
Have you introduced additional specifications of the approval procedure, for
example additional criteria for approval? What areas of the approval procedure do
these specifications cover?
5.3What criteria do you apply, in particular for deciding whether assets and liabilities
are ring-fenced?
5.4
Which criteria do you apply for assessing that the solvency and liquidity position,
the strategies, processes and reporting procedures of the undertaking ensure that it
is able to hold equity investments for a period which is consistent with the typical
holding period of equity investments for the undertaking concerned (12 years)?
5.5 Do you have any other comments?

139/145
Annex 7 - General questionnaire on LTG measures and measures on equity risk
1
Is your authority concerned about the impact of any of the measures on the financial
position of undertakings in your jurisdiction? If so, please describe the reasons for
concern and eventual supervisory action taken or planned.
2
Is there an insurance guarantee scheme in your jurisdiction which covers policyholders
with long-term guarantees? Please describe scope and functioning of the relevant
scheme.
3
Have you observed by now any cases of undue capital relief* due to the application of
the the matching adjustment (MA), the volatility adjustment (VA), the duration-based
equity risk submodule (DBER) or the symmetric adjustment mechanism (Equity
Dampener, ED) ? Please provide detail on the number of cases, the materiality of
affected undertakings, the undue capital relief and the measures adopted.
4 Have you imposed capital add-ons based on observed cases of undue capital relief?
5Have you observed by now any further positive or negative impact of the LTG and
equity risk measures on policyholder protection? Please describe your observation.
Questions
Contact person
(name, email, telephone)
Answers
Review of long-term guarantee measures and measures on equity risk 2016:
Policyholder protection
Impact of the measures on the undertakings' financial position
General questionnaire - qualitative questions
Reporting currency
* In order to support NSAs in identifying cases of undue capital relief and ensure comparability among NSAs, the following indicators are proposed. The list is not exhaustive and not binding for NSAs who can eventually
identify additional indicators or disregard some of the proposed indicators if deemed not to be relevant for specific cases. NSAs will be asked to give evidence of the eventual presence of an undue capital relief, and not of the
result of any single indicator.
Indicators in relation to the MA:
- There are material deviations between the actual money earned on the assets portfolio and the payments to policyholders generated by the liabilities portfolio.
- An undertaking has not earned in the past the risk-free interest rates (including the MA) on the assets of the MA portfolio.
- The discount rates used in practice to value liabilities in a transfer of the insurance portfolio to a third party are lower than the risk-free interest rates (including the MA).
- There are material deviations between stressed fundamental spreads and the reduction factors referred to in Article 181 of the Delegated Regulation.
- A forced sale of assets of the assigned portfolio of assets took place.
Indicators in relation to the VA:
- An undertaking has in the past not earned the risk-free interest rates (including the VA) on its assets (excluding and assets covering technical provisions calculated as a whole and assets from MA portfolios).
- An undertaking’s assets differ significantly from the representative portfolio and in particular the correlation between the yield of the representative portfolio and that of the undertaking’s portfolio is not sufficiently high.
- The discount rates used in practice to value liabilities in a transfer of the insurance portfolio to a third party are lower than the risk-free interest rates (including the VA).
Indicators in relation to the ED:
- An undertaking has incurred over a period of one year a loss on its equity investments that is larger than the capital requirement at the beginning of that year. The indicator should be based on the standard parameters for
equity risk, not the parameters according to the equity transitional of Article 308b(13) of the Directive.
- There is a significant deviation between EIOPA’s index and the actual equity portfolio composition of an undertaking.
Indicators in relation to the DBER:
- An undertaking has incurred over a period of one year a loss on its equity investments that is larger than the capital requirement at the beginning of that year.
- The duration of equity holding not in line with the assumptions leading to the DBER shock.
Member State
National Competent Authority

140/145
6
Please provide a description of the measures provided in their phasing-in plans by
undertakings that apply the TRFR or TTP and do not comply with the SCR on 1 January
2016.
7Please provide a description of eventual cases of amendments to phasing-in plans,
either at undertaking’s own initiative or at supervisory request.
8Please provide a detailed description of any cases in your jurisdiction of revocation of
the approval to apply the TRFR or TTP.
9What is your assessment of the prospect of reduced dependency of undertakings on
the transitional measures?
10
Please provide a description of the relevant measures taken or expected to be taken by
your authority with respect to undertakings using these transitional measures. To
what extend do these measures depend on the regulatory environment of your
Member State?
11Please describe any significant change in the asset allocation of undertakings during
the Solvency II preparatory phase (2014-2015) that you have observed.
12
How would you define the current trend in your national market regarding the
behaviour of undertakings as long-term investors: decreasing/increasing /not
changing significantly?
13Please describe the main drivers for the observed trend in your national market
regarding the behaviour of undertakings as long term investors.
14Please describe the observed impact by now of the MA, VA, ED and DBE on the
investment behaviour of undertakings in your jurisdiction.
15Is there in your jurisdiction a legal definition or a commonly accepted meaning of the
expression "long-term guarantee"? How would you define "long-term guarantees"?
16
What are the main types of insurance products currently available in your national
market which include long-term guarantees? For each type, please describe the most
relevant characteristics, such as:
- line of business,
- type of guarantees offered,
- duration of the guarantees,
- number of undertakings offering the product, and
- use of LTG measures and measures on equity risk by those undertakings.
17How would you define the current trend regarding the availability of such products in
your national market: decreasing/increasing/not changing significantly?
18What are the main drivers for the observed trend regarding the availability of long-
term guarantee products in your national market?
19
Have you observed any positive or negative impact of the measures on financial
stability? In particular, have you observed pro-cyclical effects of the measures and
whether their current design exacerbates the issues in a stressed market situation?
Please describe your observation.
20
Do you apply the cap to the transitional deduction referred in the Article 308d(4) of the
Solvency II Directive?
If you do:
• what are the criteria for deciding on the application of the cap?
• what is your definition for “reduction in financial resource requirements” as referred
to in Article 308d(4)?
Products
Financial stability
Investments
Transitional on Technical Provisions
Compliance with the phasing-in plans and prospect of reduced dependency: transitional measure on the risk-free interest rates (TRFR) and the transitional measure on technical provisions (TTP)

141/145
1
Please complete the table below with the requested information on insurance and
reinsurance undertakings in your jurisdiction at the reference date 1 January 2016
(irrespective of the use of LTG measures and transitionals).
Using standard
formula
Using partial
internal model
Using full internal
modelTotal
1. Number of life undertakings -
2. Number of non-life undertakings -
3. Number of undertakings pursuing both life and non–life activity -
4. Total number of undertakings (4=1+2+3) - - - -
5. Aggregated amount of life gross technical provisions (including index-linked
and unit-linked) -
6. Aggregated amount of non-life gross technical provisions -
7. Total aggregated amount of gross technical provisions (7=5+6) - - - -
8. Aggregated amount of life gross written premiums -
9. Aggregated amount of non-life gross written premiums -
10. Total aggregated amount of gross written premiums (10=8+9) - - - -
Contact person
(name, email, telephone)
Reporting currency
Questions Answers
General information regarding the national market
Rows 1-4 in the table refer to the total number of insurance and reinsurance undertakings in your jurisdiction under Solvency II at the reference date 1 January 2016. The clasiffication of life undertakings, non-life
undertakings and undertakings pursuing both life and non-life activity corresponds to the type of undertaking in row R0040 of the day 1 Basic Information template (S.01.02).
Rows 5-7 refer to the aggregated amount of gross technical provisions corresponding to all undertakings in your jurisdiction, as reported in the day 1 Solvency II Balance sheet (S.02.01) under the column C0010 (Solvency II
Value). It equals the sum of the figures in the following rows of the Solvency II Balance sheet template: R0600 plus R0690 for life (row 5 of the table) and R0510 for non-life (row 6 of the table).
Rows 8-10 refer to the aggregated amount of gross written premiums corresponding to all undertakings in your jurisdiction, as reported in the quantitative reporting template on premiums, claims and expenses by line of
business (S.05.01) for the first quarter 2016.It equals the sum of the figures in the following cells of the template: column C0300 row R1410 for life (row 8 of the table) and column C0200 rows R0110 plus R0120 plus R0130 for
non-life (row 9 of the table).
Columns in the table refer to the classification of undertakings according to the method of calculation of the Solvency Capital requirement (SCR). Column F should be completed with the sum of aggregated amounts in the
three previous columns.
National Competent Authority
Review of long-term guarantee measures and measures on equity risk 2016: General questionnaire - quantitative questions
Member State

142/145
2
Please complete the table below with the requested information on insurance and
reinsurance undertakings in your jurisdiction applying* the matching adjustment
(MA), the volatility adjustment (VA), the duration-based equity risk submodule
(DBER), the transitional measure on the risk-free interest rates (TRFR) and/or the
transitional measure on technical provisions (TTP) and undertakings not applying any
of the referred measures.
Matching
Adjustment
Volatility
Adjustment
Duration Based
Equity
Transitional on risk
free interest rates
Transitional on
technical provisionsNo measure
1. Number of life undertakings applying the measure
2. Number of non-life undertakings applying the measure
3. Number of undertakings pursuing both life and non–life activity applying the
measure
4. Total number of undertakings applying the measure (4=1+2+3)- - - - - -
5. Aggregated amount of life gross technical provisions (including index-linked
and unit-linked) for undertakings applying the measure
6. Aggregated amount of non-life gross technical provisions for undertakings
applying the measure
7. Total aggregated amount of gross technical provisions for undertakings using
the measure (7=5+6) - - - - - -
8. Aggregated amount of life gross written premiums for undertakings applying
the measure
9. Aggregated amount of non-life gross written premiums for undertakings
applying the measure
10. Total aggregated amount of gross written premiums for undertakings using the
measure (10=8+9) - - - - - -
3
Please complete the table below with the requested information on insurance and
reinsurance undertakings in your jurisdiction applying the standard formula equity risk
sub-module (and hence applying the symmetric adjustment mechanism) at the
reference date 1 January 2016.
1. Number of undertakings applying the symmetric adjustment*
2. Aggregated amount of technical provisions for undertakings applying the
symmetric adjustment
3. Aggregated amount of equity investments for undertakings applying the
symmetric adjustment
Row 1 in the table refer to the total number of insurance and reinsurance undertakings in your jurisdiction applying the symmetric adjustment mechanism at the reference date 1 January 2016. It equals the number of
standard formula users or undertakings using partial internal models not covering the equity risk sub-module.
Rows 2 refer to the aggregated amount of Solvency II values of gross technical provisions (life and non-life) corresponding to undertakings counted in row 1, as reported in the day 1 the Solvency II Balance sheet (S.02.01). It
equals the sum of the figures in the following rows of the Solvency II Balance sheet template (R0510, R0600 and R0690).
Rows 3 refer to the aggregated amount of Solvency II values of equities (listed and unlisted) corresponding to undertakings counted in row 1, as reported in the day 1 the Solvency II Balance sheet (S.02.01). It equals to the
figures in row R0100 of the Solvency II Balance sheet template.
*The expression “applying” is used following the wording of Article 77f(1); it is referred to undertakings using the measures. Please note that it does not refer to the number of applications received.
Rows 1-4 in the table refer to number of insurance and reinsurance undertakings in your jurisdiction applying each of the analysed measured (or not applying any of the measures) at the reference date 1 January 2016. The
clasiffication of life undertakings, non life undertakings and undertakings pursuing both life and non-life activity corresponds to the type of undertaking in row R0040 of the day 1 Basic Information template (S.01.02).
Rows 5-7 refer to the aggregated amount of gross technical provisions corresponding to undertakings applying each of the analysed measured (or not applying any of the measures), as reported in the day 1 the Solvency II
Balance sheet (S.02.01) under the column C0010 (Solvency II Value). It equals the sum of the figures in the following rows of the Solvency II Balance sheet template: R0600 plus R0690 for life (row 5 of the table) and R0510 for
non-life (row 6 of the table).
Rows 8-10 refer to the aggregated amount of gross written premiums corresponding to undertakings applying each of the analysed measured (or not applying any of the measures)as reported by undertakings in your
jurisdiction in the quantitative reporting template on premiums, claims and expenses by line of business (S.05.01) for the first quarter 2016.It equals the sum of the figures in the following cells of the template: column C0300
row R1410 for life (row 8 of the table) and column C0200 rows R0110 plus R0120 plus R0130 for non-life (row 9 of the table).
Columns in the table refer to the measures subject to analysis; columns C-G should be completed with the aggregated amounts corresponding to undertakings in your jurisdiction applying each of the measures. Please note
that the figures related to one particular undertaking may be included in one or more columns (e.g. In case an undertaking applies MA and TTP, the amount of assets need to be included in columns C and G). Column H (no
measure) refers to undertakings in your jurisdiction not applying any of the measures; figures related to undertakings which have been included in one or more of the previous columns should not be considered under this
last column.
Number of undertakings applying the measures

143/145
4
Please complete the table below with the requested information regarding the
combined use of LTG measures by insurance and reinsurance undertakings in your
jurisdiction at the reference date 1 January 2016.
Number of
undertakings
Aggregate amount
of technical
provisions
1. Undertakings applying simultaneously TTP and MA to the same liabilities
2. Undertakings applying simultaneously TTP and VA to the same liabilities
3. Undertakings applying simultaneously TRFR and VA to the same liabilities
5Please provide the number and detailed description of cases of revocation of the
approval to apply MA, VA or DBER, until the end of the first quarter 2016.
6
Please provide the number of undertakings currently subject to reorganisation
measures or winding-up proceedings (as defined in Article 268(1) of the Solvency II
Directive) and which of the LTG and equity risk measures they applied. Please describe
the role of the LTG and equity risk measures in the economic decline of the concerned
undertakings.
7Please provide the number of undertakings breaching the SCR (taking into account all
LTG and equity measures it applies) at the reference date 1 January 2016.
8Among them, please provide the number of undertakings in progress to comply by 31
December 2017 following the transitional measure of Article 308b(14).
9
Please complete the table below with the requested information related to
undertakings that apply the TRFR or TTP and do not comply with the SCR on 1 January
2016.
1. Number of cases of non-compliance with the SCR without the transitional
measures at the reference date 1 January 2016
2. Missing amount of eligible own funds to comply with the SCR without the
transitional measures at the reference date 1 January 2016
3. Number of undertakings failing to submit the requested phasing-in plan
4. Number of undertakings under a phasing-in plan
5. Number of undertakings not complying with the phasing-in plan
6. Cases of revocation of the TRFR
7. Cases of revocation of the TTP
Rows in the table below refer to selected cases of combination of measures to the same liabilities. One particular undertaking could be counted in one or more rows (e.g. an undertaking applying the TTP to the whole
portfolio and MA and VA to different groups of liabilities should be counted in rows 1 and 2).
Column 1 refers to the number of undertakings applying each combination of measures to the same liabilities. NSAs are expected to identify the concerned undertakings based on the information available from the
corresponding approval processes.
Column 2 refers to the aggregated amount of technical provisions of undertakings counted in column 1. It equals the sum of the figures in the following rows of the Solvency II Balance sheet template (S.02.01): R0510 for non-
life and R0600 plus R0690 for life.
Policyholder protection
Effect of the extension of the recovery period
Compliance with the phasing-in plans and prospect of reduced dependency: TRFR and TTP

144/145
10
Please complete the table below with the requested information on asset allocation
according to the undertakings' Solvency II Balance sheet (for all undertakings and
undertakings with LTG measures)
All undertakingsUndertakings
applying MA
Undertakings
applying VA
Undertakings
applying DBER
Undertakings
applying TRFR
Undertakings
applying TTP
1. Investments - Property (other than for own use)(R0080)
2. Investments - Holdings in related undertakings, including participations (R0090)
3. Investments - Equities listed (R0110)
4. Investments - Equities unlisted (R0120)
5. Investments - Government Bonds (R0140)
6. Investments - Corporate Bonds (R0150)
7. Investments - Structured notes (R0160)
8. Investments - Collateralised securities(R0170)
9. Investments - Collective Investments Undertakings (R0180)
10. Investments - Derivatives (R0190)
11. Investments - Deposits other than cash equivalents (R0200)
12. Investments - Other investments (R0210)
13. Assets held for index-linked and unit-linked contracts (R0220)
14. Cash and cash equivalents(R0410)
15. Total assets (R0500)
11Please complete the table below with the requested information on the amounts of
assets per credit quality step (for all undertakings and undertakings with LTG measures)
All undertakingsUndertakings
applying MA
Undertakings
applying VA
Undertakings
applying DBER
Undertakings
applying TRFR
Undertakings
applying TTP
0. Credit quality step 0
1. Credit quality step 1
2. Credit quality step 2
3. Credit quality step 3
4. Credit quality step 4
5. Credit quality step 5
6. Credit quality step 6
7. No rating available
Rows in the table refer to selected rows (in brackets) of the Solvency II Balance sheet (S.02.01). They should be completed with the aggregated amounts of Solvency II values of the selected items, as reported by undertakings
in your jurisdiction in the day 1 Solvency II Balance sheet.
Columns in the table refer to different categories of undertakings: the first column should be completed with the aggregated amounts corresponding to all undertakings in your jurisdiction (regardless the use of LTG
measures and measures on equity); the subsequent columns should be completed with the aggregated amounts corresponding to undertakings in your jurisdiction applying each of the measures. Please note that the figures
related to one particular undertaking may be included in two or more columns (e.g. In case an undertaking applies MA and TTP, the amount of assets need to be included in columns C, D and H)
Rows in the table refer to the credit quality step attributed to the assets held by undertakings, as defined by Article 109a(1) of the Solvency II Directive. Each row should be completed with the aggregated amounts of Solvency
II values of assets corresponding to that credit quality step, as reported by undertakings in your jurisdiction in the quantitative reporting template on the list of assets (S.06.02) for the first quarter 2016.
Columns in the table refer to different categories of undertakings: the first column should be completed with the aggregated amounts corresponding to all undertakings in your jurisdiction (regardless the use of LTG
measures and measures on equity); the subsequent columns should be completed with the aggregated amounts corresponding to undertakings in your jurisdiction applying each of the measures. Please note that the figures
related to one particular undertaking may be included in two or more columns (e.g. In case an undertaking applies MA and TTP, the amount of assets need to be included in columns C, D and H)
Investments

145/145
12Please complete the table below with the requested information on the duration of
assets (for all undertakings and undertakings with LTG measures)
All undertakingsUndertakings
applying MA
Undertakings
applying VA
Undertakings
applying DBER
Undertakings
applying TRFR
Undertakings
applying TTP
1. Total SII amount for assets with duration
2. Total SII amount for assets with duration weighted per duration
3. Average duration (3=2/1)
13
Please complete the table below with the requested information on gross written
premiums for life insurance obligations per type of insurance product (for all
undertakings and undertakings with LTG measures)
All undertakingsUndertakings
applying MA
Undertakings
applying VA
Undertakings
applying DBER
Undertakings
applying TRFR
Undertakings
applying TTP
1. Health insurance
2. Insurance with profit participation
3. Index-linked and unit-linked insurance
4. Other life insurance
5. Annuities stemming from non-life insurance contracts and relating to health
insurance obligations
6. Annuities stemming from non-life insurance contracts and relating to insurance
obligations other than health insurance obligations
7. Health reinsurance
8. Life reinsurance
9. Total life gross written premiums
Row 1 in the table should be completed with the aggregated amounts of Solvency II values for assets with duration held by undertakings.
Row 2 should be completed with the aggregated amounts of Solvency II values weighted per duration for the same assets considered in Row 1.
Row 3 refers to the average duration resulting from the aggregated figure in Row 2 divided by the aggregated figure in Row 1. Rows 1 and 2 refer to information reported by undertakings in your jurisdiction in the
quantitative reporting template on the list of assets (S.06.02) for the first quarter 2016.
Columns in the table refer to different categories of undertakings: the first column should be completed with the aggregated amounts corresponding to all undertakings in your jurisdiction (regardless the use of LTG
measures and measures on equity); the subsequent columns should be completed with the aggregated amounts corresponding to undertakings in your jurisdiction applying each of the measures. Please note that the figures
related to one particular undertaking may be included in two or more columns (e.g. In case an undertaking applies MA and TTP, the amount of assets need to be included in columns C, D and H)
Products
Rows in the table refer to gross written premiums for life (re)insurance obligations split by lines of business, as reported by undertakings in your jurisdiction in the quantitative reporting template on premiums, claims and
expenses by line of business (S.05.01) for the first quarter 2016.
Columns in the table refer to different categories of undertakings: the first column should be completed with the aggregated amounts corresponding to all undertakings in your jurisdiction (regardless the use of LTG
measures and measures on equity); the subsequent columns should be completed with the aggregated amounts corresponding to undertakings in your jurisdiction applying each of the measures. Please note that the figures
related to one particular undertaking may be included in two or more columns (e.g. In case an undertaking applies MA and TTP, the amount of assets need to be included in columns C, D and H)