report on case study of working conditions and career
TRANSCRIPT

Working conditions and career paths of early ca-
reer researchers - Cross-Country Report
(WP3)
Prepared for:
European Commission
Research Directorate-General
Directorate C – European Research Area
Universities and Researchers
IDEA Consult
in consortium with:
- Austrian Institute of Economic Research,
WIFO
- iFQ, Institute for Research Information
and Quality Assurance
- CHEPS, Center for Higher Education Policy
Studies, University of Twente
- LaSapienza - University of Rome
- CFA, Danish Center for Research and Re-
search Policy, Aarhus University
and its subcontractors:
- University of Wolverhampton
- Loft33
- CheckMarket
- Interago
Brussels, June 2013
Support for continued da-
ta collection and analysis
concerning mobility pat-
terns and career paths of
researchers


MORE2 – Career paths Cross-Country Report
April 2013 3
TABLE OF CONTENTS
TABLE OF CONTENTS 3
LIST OF FIGURES 5
LIST OF TABLES 6
0 EXECUTIVE SUMMARY 10
1 INTRODUCTION 14
1.1 Objectives _______________________________________ 14
2 DATA COLLECTION 15
3 ANALYSIS OF RESEARCHER CAREERS 17
3.1 Methodological approach ____________________________ 18
3.1.1 Institutional context of academic careers ....................................... 19
3.1.2 Five sets of rules influencing sequence, timing and likelihood of major career events .................................................................... 20
3.1.3 Data collection and coding ........................................................... 23
3.1.4 Strategy for analyses .................................................................. 24
3.2 Country comparison – the R&D system _________________ 36
3.2.1 The countries’ R&D intensity, sectors of R&D performance and human resources in research ....................................................... 37
3.2.2 Attractiveness of sectors for pursuing researcher careers ................ 44
3.2.3 The Higher Education Sector (HES) ............................................... 45
3.3 General description of career paths and working conditions _ 50
3.4 Country classification for each career stage _____________ 60
3.4.1 Analysis for each career stage ...................................................... 61
3.4.2 Synthesis across all career stages ................................................. 66
3.5 Country classification _______________________________ 69
4 SUMMARY 74
4.1.1 Country comparison – the R&D system ......................................... 74
4.1.2 Career paths and working conditions – general description .............. 75
4.1.3 Results of the country classification for each career stage ................ 76
4.1.4 Results of the country classification of academic career systems ...... 77
4.2 Methodology limitations, caveats and lessons learned for
future studies _____________________________________ 77
5 REFERENCES 79
6 COUNTRY FICHES 83
Country fiches were made available via Dropbox. They can be
downloaded via: ___________________________________ 83

MORE2 – Career paths Cross-Country Report
April 2013 4
7 APPENDIX: DESCRIPTIVE STATISTICS FOR CLUSTER SOLUTIONS IN SECTION 3.4
AND 3.5 84
7.1 Descriptive statistics for cluster solutions per career stage
(section 3.4) ______________________________________ 84
7.1.1 R1 career stage: Statistics on cluster solution ................................ 84
7.1.2 R2 career stage: Statistics on cluster solution ................................ 87
7.1.3 R3 career stage: Statistics on cluster solution ................................ 90
7.1.4 R4 career stage: Statistics on cluster solution ................................ 93
7.2 Descriptive statistics for the country classification of
academic career systems (section 3.5) _________________ 96
7.2.1 Academics’ employment .............................................................. 96
7.2.2 Credentials .............................................................................. 102
7.2.3 Intra-organizational practices ..................................................... 104
7.2.4 Inter-organizational practices ..................................................... 106
7.2.5 Academic disciplines ................................................................. 109

MORE2 – Career paths Cross-Country Report
April 2013 5
LIST OF FIGURES
Figure 3.2.1: GERD as Percentage of GDP – Total (2010 or latest year available) .................................................................................. 38
Figure 3.2.2: GERD as Percentage of GDP by Sector of Performance – Higher Education Sector (2010 or latest year available) ............................. 38
Figure 3.2.3: GERD as Percentage of GDP by Sector of Performance – Government Sector (2010 or latest year available) ......................... 38
Figure 3.2.4: GERD as Percentage of GDP by Sector of Performance – Business Enterprise Sector (2010 or latest year available) ............... 38
Figure 3.2.5: Researchers as Percentage of Total Employment (2010 or latest year available) ........................................................................... 41
Figure 3.2.6: Percentage of Female Researchers (FTE) – Total Researchers (2009 or latest year available) ..................................................... 42
Figure 3.2.7: Percentage of Female Researchers (FTE) – Higher Education Sector (2009 or latest year available) ........................................... 42
Figure 3.2.8: Percentage of Female Researchers (FTE) – Government Sector (2009 or latest year available) ..................................................... 42
Figure 3.2.9: Percentage of Female Researchers (FTE) – Business Enterprise Sector (2009 or latest year available) ........................................... 43
Figure 3.2.10: Share of female researchers (FTE) in total researchers and GERD as % of GDP ..................................................................... 43
Figure 3.2.11: Graduates (ISCED 6) aged 25-34 per 1 000 of the corresponding age population - doctorates awarded (2010 or latest year available) ........................................................................... 44
Figure 3.2.12: Doctoral students - percentage of the population aged 25-29 (2010 or latest year available) ..................................................... 44
Figure 3.2.13: Implementation of structured PhD training programs ................. 49
Figure 3.3.1: Length of contracts offered by career stage (% of all positions within a career stage across all countries) ..................................... 52
Figure 3.3.2: Status of individuals holding a position by career stage (% of all options offered with the positions available25) ................................ 53
Figure 3.3.3: Share of positions offering tenure track by career stage (% of all positions named25) ..................................................................... 54
Figure 3.3.4: Autonomy in four dimensions granted to researchers by career stage25 ...................................................................................... 56
MORE2 – Career paths Cross-Country Report
April 2013 6
LIST OF TABLES
Table 3.1.1: Variables used to generate country classifications for each career stage ........................................................................................ 26
Table 3.1.2: Academics‘ employment. Variables used to generate country classifications ............................................................................. 29
Table 3.1.3: Credentials. Variables used to generate country classifications ....... 31
Table 3.1.4: Intra-organizational governance. Variables used to generate country classifications ................................................................. 31
Table 3.1.5: Inter-organizational relationships. Variables used to generate country classifications ................................................................. 33
Table 3.1.6: Academic disciplines. Variables used to generate country classifications ............................................................................. 35
Table 3.2.1: Full Time Researchers by Sector of Performance (2010 or latest year available) ........................................................................... 40
Table 3.2.2: Share of countries and their rating for attractiveness of sectors for pursuing a researcher career (N=47 countries) ......................... 45
Table 3.2.3: Share of countries and their rating for long-term attractiveness of sectors for pursuing a researcher career (N=47 countries20) ............ 45
Table 3.2.4: Relevant issues to be considered for assessing the four basic HEI autonomy categories................................................................... 46
Table 3.2.5: Share of countries and their rating by autonomy dimension (N=47 countries20) ..................................................................... 46
Table 3.2.6: Institutional differentiation of HEI within countries ....................... 47
Table 3.2.7: Institutional models of HEI within countries ................................. 47
Table 3.2.8: Countries where other institutions besides universities are granting academic degrees / qualifications..................................... 48
Table 3.2.9: Countries with consecutive academic degrees beyond the doctorate ................................................................................... 49
Table 3.2.10: Relevance of structured PhD training programs (N=47) ............... 49
Table 3.2.11: Average age range for obtaining a PhD ..................................... 50
Table 3.3.1: Type of contract awarded by career stage (total N=47 countries20) ............................................................................... 50
Table 3.3.2: Source of financing for positions by career stage (N=4720) ........... 53
Table 3.3.3: Positions offering tenure track options or are permanent at the R3 and the R4 level (% of positions across countries25) ................... 55
Table 3.3.4: Age at which a position in the respective career stage is typically reached (% of countries) (N=4720) ............................................... 57
Table 3.3.5: Typical age at which a position in respective career stage is obtained by country .................................................................... 58
Table 3.3.6: Channels for advertising researcher positions .............................. 59
Table 3.3.7: Is International mobility a prerequisite for pursuing a researcher career?...................................................................................... 60
Table 3.3.8: Countries where International mobility is a pre-requisite for a researcher’s career ..................................................................... 60

MORE2 – Career paths Cross-Country Report
April 2013 7
Table 3.4.1: Short description of R1-career stage cluster solution ................... 62
Table 3.4.2: Short description of R2-career stage cluster solution .................... 63
Table 3.4.3: Short description of R3-career stage cluster solution .................... 65
Table 3.4.4: Short description of R4-career stage cluster solution .................... 66
Table 3.4.5: Career stage with stable employment conditions .......................... 67
Table 3.4.6: Age range of first permanent position by career stage with stable working conditions ...................................................................... 68
Table 3.4.7: Career stage with own research agenda by career stage with stable working conditions ............................................................ 68
Table 3.4.8: Attractiveness of higher education sector compared to other sectors by career stage with stable working conditions .................... 69
Table 3.5.1: Academic career systems’ cluster characterization ........................ 72
Table 7.1.1: Normal age when position in career stage R1 is obtained by country clusters in career stage R1 ............................................... 84
Table 7.1.2: Type of contract in career stage R1 by Country clusters in career stage R1 .................................................................................... 84
Table 7.1.3: Research/teaching nexus: R1 positions by Country clusters in career stage R1 .......................................................................... 85
Table 7.1.4: Level of researchers' autonomy in R1 by Country clusters in career stage R1 .......................................................................... 85
Table 7.1.5: Type of funding: Majority of R1 positions by Country clusters in career stage R1 .......................................................................... 86
Table 7.1.6: Tenure-track option available in R1 by Country clusters in career stage R1 .................................................................................... 86
Table 7.1.7: Normal age when position in career stage R2 is obtained by Country clusters in career stage R2 .............................................. 87
Table 7.1.8: Type of contract in career stage R2 by Country clusters in career stage R2 .................................................................................... 87
Table 7.1.9: Research/teaching nexus: R2 positions by Country clusters in career stage R2 .......................................................................... 88
Table 7.1.10: Level of researchers' autonomy in R2 by Country clusters in career stage R2 .......................................................................... 88
Table 7.1.11: Type of funding: Majority of R2 positions by Country clusters in career stage R2 .......................................................................... 89
Table 7.1.12: Tenure-track option available in R2 by Country clusters in career stage R2 .......................................................................... 89
Table 7.1.13: Normal age when position in career stage R3 is obtained by Country clusters in career stage R3 .............................................. 90
Table 7.1.14: Type of contract in career stage R3 by Country clusters in career stage R3 .......................................................................... 90
Table 7.1.15: Research/teaching nexus: R3 positions by Country clusters in career stage R3 .......................................................................... 91
Table 7.1.16: Level of researchers' autonomy in R3 by Country clusters in career stage R3 .......................................................................... 91

MORE2 – Career paths Cross-Country Report
April 2013 8
Table 7.1.17: Type of funding: Majority of R3 positions by Country clusters in career stage R3 .......................................................................... 92
Table 7.1.18: Tenure-track option available in R3 by Country clusters in career stage R3 .......................................................................... 92
Table 7.1.19: Normal age when position in career stage R4 is obtained by Country clusters in career stage R4 .............................................. 93
Table 7.1.20: Type of contract in career stage R4 by Country clusters in career stage R4 .......................................................................... 93
Table 7.1.21: Research/teaching nexus: R4 positions by Country clusters in career stage R4 .......................................................................... 94
Table 7.1.22: Level of researchers' autonomy in R4 by Country clusters in career stage R4 .......................................................................... 94
Table 7.1.23: Type of funding: Majority of R4 positions by Country clusters in career stage R4 .......................................................................... 95
Table 7.1.24: Tenure-track option available in R4 by Country clusters in career stage R4 .......................................................................... 95
Table 7.2.1: Vertical differentiation of staff structure by academic career systems’ country clusters ............................................................ 96
Table 7.2.2: Majority of researchers in R1+R2 by academic career systems’ country clusters ......................................................................... 96
Table 7.2.3: Career stage with own research agenda by academic career systems’ country clusters ............................................................ 97
Table 7.2.4: All Contracts in R1+R2 positions are shorter than 2 years by academic career systems’ country clusters .................................... 97
Table 7.2.5: Age range of first permanent position by academic career systems’ country clusters ............................................................ 98
Table 7.2.6: Rank at which first permanent position can be obtained by academic career systems’ country clusters .................................... 98
Table 7.2.7: Importance of performance in career advancement (most common among positions) by academic career systems’ country clusters ..................................................................................... 99
Table 7.2.8: Selection criteria provided by law by academic career systems’ country clusters ......................................................................... 99
Table 7.2.9: International mobility as prerequisite of an academic career by academic career systems’ country clusters .................................. 100
Table 7.2.10: Schemes to enhance international mobility by academic career systems’ country clusters .......................................................... 100
Table 7.2.11: Financial reward of R4 against R3 position by academic career systems’ country clusters .......................................................... 101
Table 7.2.12: Financial reward of R3 against R2 position by academic career systems’ country clusters .......................................................... 101
Table 7.2.13: Financial reward of R4 against R1 position by academic career systems’ country clusters .......................................................... 101
Table 7.2.14: Social security level by academic career systems’ country clusters ................................................................................... 102

MORE2 – Career paths Cross-Country Report
April 2013 9
Table 7.2.15: Characteristics of doctoral training by academic career systems’ country clusters ....................................................................... 102
Table 7.2.16: Second degree needed by academic career systems’ country clusters ................................................................................... 103
Table 7.2.17: Doctorate awarding institution by academic career systems’ country clusters ....................................................................... 103
Table 7.2.18: Site where positions are mainly advertised by academic career systems’ country clusters .......................................................... 104
Table 7.2.19: Main source of funding in R3 positions by academic career systems’ country clusters .......................................................... 104
Table 7.2.20: Level of HEI autonomy by academic career systems’ country clusters ................................................................................... 105
Table 7.2.21: Country-wide or institutional selection procedures by academic career systems’ country clusters ................................................. 106
Table 7.2.22: Degree of sectoral differentiation by academic career systems’ country clusters ....................................................................... 106
Table 7.2.23: Intersectoral mobility as a prerequisite of a particular career path by academic career systems’ country clusters ....................... 107
Table 7.2.24: Vertical differentiation of HE sector by academic career systems’ country clusters ....................................................................... 107
Table 7.2.25: Attractiveness of higher education compared to other sectors by academic career systems’ country clusters .................................. 108
Table 7.2.26: Competition by universities by academic career systems’ country clusters ....................................................................... 108
Table 7.2.27: Discipline-specific conditions during career by academic career systems’ country clusters .......................................................... 109

MORE2 – Career paths Cross-Country Report
April 2013 10
0 EXECUTIVE SUMMARY
Approach
This report reflects the results of work packages 3, the case studies on working conditions and career paths of early career researchers (WP3) in selected coun-tries of the MORE2 study on “support for continued data collection and analysis concerning mobility patterns and career paths of researchers”. It provides an overview on the working conditions and career paths of early career researchers for the countries under investigation. The analysis is based on data and infor-mation provided by an extensive network of national experts. The data collection for WP3 was undertaken in close collaboration with WP4. A uniform set of three instruments was developed and used ensuring coherence of the information and data given by the experts. For the data collection for WP3, a template was used specifically, which was completed by all country correspondents.
Key Findings
Country comparison of the working conditions and careers of early career
researchers
In the majority of countries, the higher education sector is seen as an attractive sector for pursuing a researcher career.
Higher education institutions in most countries have a high degree of autonomy regarding academic, organizational and staffing issues, while they are more lim-ited with regard to financial autonomy. While there are differences among coun-tries and groups of countries regarding the degree of autonomy of higher educa-tion institutions these differences cannot be explained by regional affiliation.
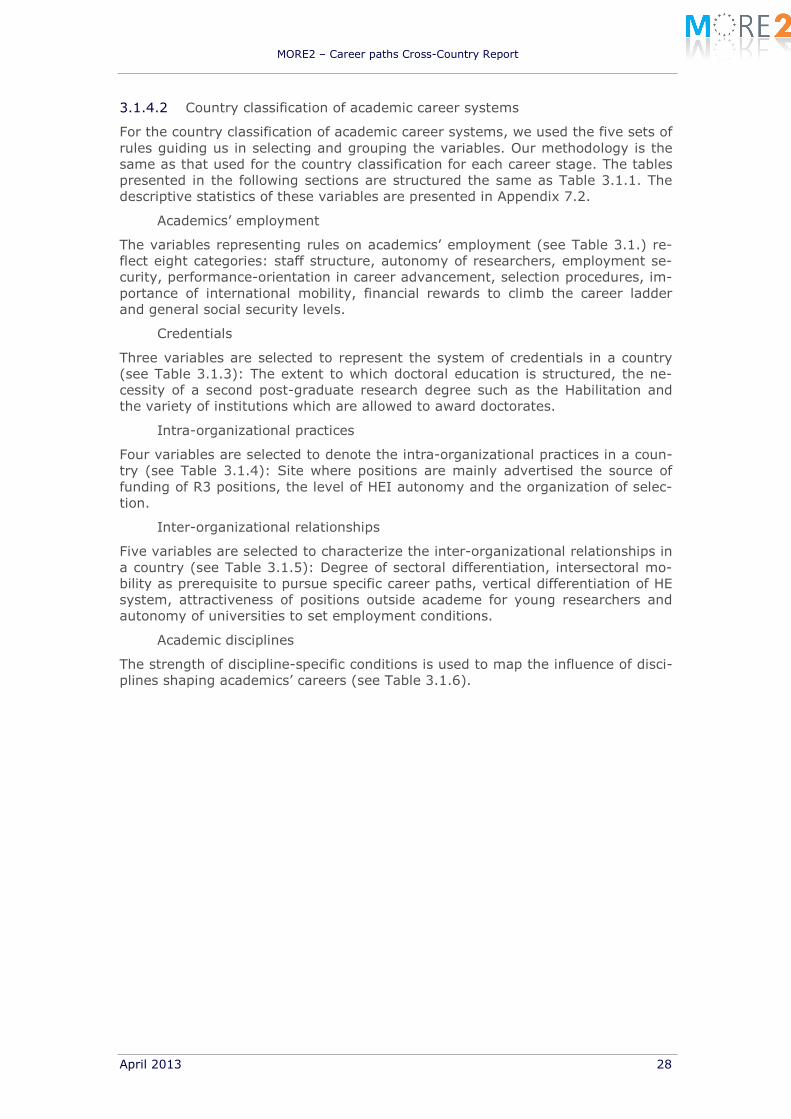
In most countries, higher education institutions are meant to pursue research and teaching. Only a few countries distinguish explicitly between teaching-only institu-tions and research-and-teaching institutions e.g. Belgium, Italy, the Netherlands, Australia and Japan.
The department model, as opposed to the chair model, is implemented in HEI in the majority of countries. The institute / chair model is implemented in Austria, Belgium, Germany, Hungary, Slovenia, China and South Korea, for instance.
In most countries, only universities award doctorates and consecutive academic degrees such as the habilitation, though the latter are mandatory only in very few countries such as Russia, Bulgaria and Spain.
While structured doctoral training is not necessarily mandatory, it is nevertheless the predominant way to gain a PhD in the majority of countries. Countries where structured doctoral training is not mandatory but dominant are, for instance, Fin-land, Italy, the Netherlands, Poland, Portugal and Switzerland.
While there are some differences with regard to the age when a PhD is typically awarded, in the majority of countries a doctorate is earned before the research-er’s 35th birthday. Particularly young (≤30) are those PhD candidates receiving their degree in Belgium, Cyprus, Ireland, Lithuania, Luxembourg, Serbia and the United Kingdom, particularly old are their counterparts in Brazil, Israel and South Korea (≥ 38 years).
Most positions, no matter at which career stage, are potentially “employee” posi-tions. In R1 career stage, (doctoral) student and grant holder positions are nearly as frequently awarded. In the vast majority of the countries, researchers’ careers start with temporary contracts, which, depending on the career stage, differ in terms of their length. R1 and R2 positions, in particular, are more often based on

MORE2 – Career paths Cross-Country Report
April 2013 11
shorter contracts. Tenure options are the exception rather than the rule in early stages of the career. The share of positions offering tenure track significantly in-creases at the R3 stage. The share of permanent positions also increases signifi-cantly when moving to the R3 stage. Already here, the majority of positions offer permanent contracts. Again, this share increases significantly when moving from R3 to R4.
In most countries, funding for the majority of researchers at all career stages comes from block funding. The share of positions funded by competitive funding is highest at the R2 stage, lowest at the R4 stage. Positions with competitive funding within career stages are dominant in only a few countries (e.g. Portugal and Australia in R1, Belgium and UK in R2, Sweden in R3 and Netherlands in R4).
Conditions at the various career stages vary with regard to the autonomy which researchers are given. Generally, the degree of freedom is highest with regard to academic autonomy and lowest when it comes to financial factors. Autonomy in-creases along the career path. In particular, moving from R2 to R3 is accompa-nied with increasing autonomy. And again, the move from R3 and R4 leads to more degrees of freedom, and here a significant increase towards the highest de-gree of autonomy can be found.
The “speed” of progressing along the career path differs between countries. In the majority of countries, researchers enter the R1 stage before the age of 30. Differences among countries seem to exist with regard to the time a researcher remains at a certain level. “Delays”,1 can be identified at the various stages: for example it takes longer to progress from an R1 to an R2 position in Finland, Por-tugal and Spain, from R2 to R3 in Austria, Italy, Netherlands, Switzerland, United Kingdom and USA and from R3 to R4 in Lithuania and Portugal. In general, the countries under investigation are rather similar with regard to the age at which a specific career stage can typically be obtained. In most countries, R1-positions are obtained when researchers are under 30 years of age. In most countries (where respective information is available), R2-positions are obtained before the 36th birthday and R3-positions before the 41st birthday. In the vast majority of countries (with information available), R4-positions are obtained before the 51st birthday including a large group of countries in which these positions are obtained already before the 46th birthday. However, particularly early to reach the highest career stage (R4) are researchers in Serbia and Turkey, while in Brazil and Russia these positions are awarded significantly later.
Differences among countries exist with regard to the channels used for advertis-ing positions. In the majority of countries they are advertised at least nationally: internationally advertising researchers’ positions is not a required standard pro-cedure. Austria, Belgium, Iceland, Ireland, Norway and the United Kingdom, among others, advertise positions internationally. In Poland, following the Educa-tion Act (2011)2, jobs are now advertised via EURAXESS too.
In the majority of countries, career progression depends, at least to some degree, on the performance of researchers.
International mobility is a prerequisite in more than a third of the countries e.g. in Germany, Hungary, Spain, Turkey and China; in an additional 17% of the countries this is true for at least selected areas. In terms of schemes to support and enhance international mobility, the countries are split into two groups of the
1 Career delay is seen as entering the next career stage not at an age falling in the directly suc-cessive age group.
2 See Deloitte (2012): The Researchers Report 2012. Country Profile: Poland. http://ec.europa.eu/euraxess/pdf/research_policies/country_files/Poland_CountryFile_2012_FINAL.pdf

MORE2 – Career paths Cross-Country Report
April 2013 12
same size: one group has implemented national schemes whereas the other group does not have them but, rather, relies on the European initiatives.
Similarities of career stages - classification of countries
Within career stages R1, R2 and R4, the countries analyzed show very similar characteristics - only in a minority of countries differing academic career paths have been implemented at these stages. The major dividing line within all career stages is the provision of temporary vs. permanent contracts and the offer of tenure-track-options.
Typical for career stage R1 are the following characteristics: young researchers aged 30 years or even younger are employed based on block-funded mainly tem-porary contracts. Their autonomy is rather low and tenure-track options hardly exist. Differentiation among countries is based on the tasks which researchers fulfill. Southern European countries, in particular, tend to employ researchers for research-only tasks, with Greece being an exception. There are however, groups of countries diverging from these general patterns with regard to the type of con-tract offered, e.g. Bosnia and Herzegovina, Cyprus, Estonia, Hungary, Nether-lands, Serbia offer permanent contracts to early career researchers even at the R1 level. Another group of countries (Russia, Israel, Brazil) makes tenure track options available to researchers at the R1 level.
R2 positions are typically described as follows: mainly researchers in their early 30s, who are employed on block-funded temporary contracts, engaged in both teaching and research tasks, having a low level of autonomy.
One group of seven countries, Croatia, Finland, Iceland, Lithuania, Sweden, Unit-ed Kingdom, South Korea, differs from these main characteristics with regard to the age, the funding regime and the task division: researchers are older, they are more frequently exposed to competitive funding and focusing on either teaching or research.
The transition from career stage R2 to R3 is, in most countries, a transition from dependence to increasing independence, which includes stable working condi-tions. Still, a large group of countries seems to grant independence only at the R4 career stage. The R3 career stage is the most diverse career stage. While there is a dividing line between countries regarding type of contract, task division and level of researchers’ autonomy, the picture is rather scattered with regard to combinations of the characteristics and thus, there are no main features charac-terizing this career stage and no general description can be outlined. However, stable working conditions - which we define by the availability of permanent con-tracts and block funded positions - are available in 28 of the 47 countries at the R3 career stage at latest. Only Estonia, Macedonia, Latvia and Russia do not offer stable employment conditions at any career stage.
Career stage R4 is characterized by researchers who secure these positions in their 40s, are employed on block-funded permanent contracts and engage in re-search and teaching. We did not find any notable concentration of regions when it comes to countries being assigned to the cluster. Differentiating factors between groups, are again, whether tenure track options are available or not and level of autonomy. The group which is most distinct from the more general features of the R4 stage with mainly temporary contracts, specialised tasks (either research or teaching) and only medium level of autonomy for Croatia, Estonia, Macedonia, Serbia, and China.
In general - not surprisingly in countries where stable working conditions can be obtained at an earlier career stage - researchers tend to be younger when they obtain their first permanent contract.

MORE2 – Career paths Cross-Country Report
April 2013 13
In almost all countries researchers are granted research independence, at the lat-est, at R3, even in those countries where stable working conditions are only found at R4.
The relative attractiveness of higher education is not dependent on whether or not stable working conditions can be obtained an earlier career stage.
Country classification of academic career systems
We identified four different groups of countries with similar academic career sys-tems.
• Cluster 1 includes a unique characteristic in terms of HEI autonomy (high), international mobility (prerequisite but not supported by national schemes) and type of contracts (mostly temporary): Estonia, Luxembourg, Russia, China, Singapore
• Clusters 2 and 3 are unique in terms of the career stage at which a certain level of research independence is reached. In Cluster 2 research inde-pendence is reached at R3 and in most cases this involves stable working conditions: Austria, Bosnia and Herzegovina, Denmark, Finland, Ireland, Montenegro, Switzerland, Australia, Canada
• Countries in Cluster 3 tend to grant research independence earlier to their academics: Albania, Czech Republic, Macedonia, France, Iceland, Italy, Latvia, Liechtenstein, Norway, Romania, Spain, Sweden, United Kingdom
• Cluster 4 can be seen as the standard cluster. Common characteristics of academic career systems in countries belonging to this standard cluster compared to the other clusters are: international and intersectoral mobility are prerequisite for certain careers, HEI have a medium to low level of au-tonomy, social security is rather high and career conditions vary not signif-icantly between disciplines: Belgium, Bulgaria, Croatia, Cyprus, Germany, Greece, Hungary, Lithuania, Netherlands, Poland, Portugal, Serbia, Slove-nia, Turkey, Faroe Islands, Israel, Brazil, Japan, South Korea, USA.
Geographic location of the countries is not a component that explains cluster affil-iation.

MORE2 – Career paths Cross-Country Report
April 2013 14
1 INTRODUCTION
1.1 Objectives
The main objective of the study “support for continued data collection and analysis concerning mobility patterns and career paths of researchers” (MORE2) is (as mentioned in the Terms of Reference):
“To provide internationally comparable data, indicators and analysis in
order to support further evidence-based policy development on the re-
search profession at European and national level.”
In order to realize this overall objective, the study builds on the MORE1 results and methodologies, which will be improved, fine-tuned and expanded, where re-quired, both methodologically and conceptually.
More precisely, MORE2 sets out to:
I. Conduct a survey of researchers currently working in Europe in higher edu-cation institutions (HEI) regarding their mobility patterns, career paths and work-ing condition (WP1);
II. Conduct a survey of researchers currently working outside Europe regard-ing their mobility patterns, career paths and working conditions (WP2);
III. Carry out a case study on the working conditions and career paths of early career researchers in selected countries (WP3);
IV. Carry out a case study on the remuneration of researchers in selected countries (WP4);
V. Develop and produce a set of internationally-comparable indicators on stocks, flows, working conditions and career paths of European researchers (WP5);
VI. Draft a final report that provides a comparative, policy-relevant analysis of the mobility patterns, working conditions and career paths of European research-ers (WP6).
This report is part of delivery D4, and its focus is on the results obtained in work package 3, the case studies on working conditions and career paths of early ca-reer researchers (WP3) in selected countries. Thus, this report provides infor-mation, data and analysis based on the country fiches for the countries under in-vestigation, which were compiled by an extensive network of national experts. D4 consists of two additional reports: the technical report outlining the methodology applied in the two interrelated work packages WP3 and WP4 (IDEA Consult et al, 2013a) and the report on the results obtained by work package 4, the remunera-tion of researchers in selected countries (IDEA Consult et al, 2013b). Data collec-tion for WP3 and WP4 was jointly collected. The methodology used for both work packages is briefly described in chapter 2; details are laid out in the common technical report mentioned above (IDEA Consult et al, 2013a).

MORE2 – Career paths Cross-Country Report
April 2013 15
2 DATA COLLECTION
The objective of work packages 3 and 4 is to provide detailed descriptions and an analysis of the working conditions, career paths and remuneration for (early ca-reer) researchers for 40 European countries, the USA, Canada, Japan, China, In-dia, South Korea, Singapore, Australia, Brazil and Russia. In order to fulfill this task we used an extensive network of national experts (country correspondents). For each country, one national expert was appointed to collect the data as input for the WP3 and WP4 analysis and report. The national experts gathered the re-quired country specific empirical information and data bases on which they com-piled and provided country reports. In order to ensure coherence of the infor-mation and data, a common approach was used. Country correspondents were provided with a set of instruments3 serving as the basis for collecting the data on working conditions and remuneration of researchers. This set of instruments con-sisted of:
• a country correspondents’ template, • an university questionnaire and • a RPO (research performing organization) questionnaire.
The template and the questionnaires were developed by the project team. These instruments were discussed and agreed upon with the representatives of the Eu-ropean Commission before they were made available to the country correspond-ents via a common web based platform. Together with the template the country correspondents were provided with a) guiding material explaining how to fill in the template, b) a pilot study to provide additional guidance on the content we ex-pected in the various sections of the template and c) an agreed upon set of statis-tical data for each country4. In addition, correspondents have been provided with links to the OECD Main Science and Technology Indicators online statistics5 and to the European University Institutes Career descriptions6. Moreover, selected litera-ture was stored on the web based platform providing relevant background infor-mation to the country correspondents. Details on the data collection and the set of instruments used can be found in the technical report for WP3 and WP4 (IDEA Consult et al, 2013a).
It was agreed with the European Commission that the focus would be on the uni-versity system in the countries under investigation and to a lesser extent on RPOs7. Information on the business sector was to be gathered only very selective-ly. Therefore, a small number of semi-structured interviews were carried out in three selected countries: Austria, Germany and Denmark. For these interviews an interview guideline8 was developed and the interviews were carried out by mem-bers of the project team. Due to the reduced regional focus and the limited num-ber of interviews, the information gathered by these interviews can only provide anecdotal evidence and cannot necessarily be considered as conclusive for the business enterprises sector as a whole. Complementing the interview approach and in order to enrich the conclusions drawn from the interviews, descriptive
3 For the instrument used for data collection and the guidelines on how to use them see the tech-nical report for WP3 and WP4 (IDEA Consult et al, 2013a).
4 Depending on coverage and availability. We provided EUROSTAT data, thus no data was provid-ed for countries not covered by the respective sources.
5 http://stats.oecd.org/Index.aspx?DataSetCode=MSTI_PUB 6 http://www.eui.eu/ProgrammesAndFellowships/AcademicCareersObservatory/
AcademicCareersbyCountry/Index.aspx 7 This work package mainly focused on the higher education sector. In order to extent the picture
RPOs have been included. 8 For the instruments used for data collection see IDEA Consult et al, 2013a.

MORE2 – Career paths Cross-Country Report
April 2013 16
analyses on gross annual earnings and average hourly wages of researchers in companies using the Structure of Earnings Survey (SES) from Eurostat for 17 EU-countries were carried out.
MORE2 – Career paths Cross-Country Report
April 2013 17
3 ANALYSIS OF RESEARCHER CAREERS
While the main focus is on early career researchers, the attractiveness of pursu-ing a research career can only be assessed based on the overall layout of poten-tial career pathways. Therefore, the various stages of a research career were ad-dressed and data was gathered covering the overall research career path, starting from doctoral education (i.e. doctoral candidates) up to the highest achievable position in terms of the higher education system (i.e. the professorship).
For the higher education / university sector detailed information on positions available along this career path was gathered. In order to allow for country com-parisons, an intermediate layer – namely specific career stages – has been intro-duced and country correspondents were asked to assign all positions to one of four career stages outlined and defined in the European Commission’s communi-cation “Towards a European Framework for Research Careers” (European Com-mission 2011, p. 2). These four career stages are:
R1: First Stage Researcher (up to the point of PhD), R2: Recognized Researcher (PhD holders or equivalent who are not yet fully independent), R3: Established Researcher (researchers who have developed a level of inde-pendence) and R4: Leading Researcher (researchers leading their research area or field).
According to the definitions given in the EC’s communication, the different stages are characterized as follows:
A first stage researcher (R1) will:
• “Carry out research under supervision; • Have the ambition to develop knowledge of research methodologies and
discipline; • Have demonstrated a good understanding of a field of study; • Have demonstrated the ability to produce data under supervision; • Be capable of critical analysis, evaluation and synthesis of new and com-
plex ideas and • Be able to explain the outcome of research and value thereof to research
colleagues.” (see European Commission 2011, p. 7)
Recognized researchers (R2) are PhD holders or researchers with an equivalent level of experience and competence who have not yet established a significant level of independence. In addition to the characteristics assigned to the profile of a first stage researcher, a recognized researcher:
• “Has demonstrated a systematic understanding of a field of study and mas-tery of research associated with that field
• Has demonstrated the ability to conceive, design, implement and adapt a substantial program of research with integrity
• Has made a contribution through original research that extends the frontier of knowledge by developing a substantial body of work, innovation or ap-plication. This could merit national or international refereed publication or patent.
• Demonstrates critical analysis, evaluation and synthesis of new and com-plex ideas.
• Can communicate with his peers - be able to explain the outcome of his re-search and value thereof to the research community.

MORE2 – Career paths Cross-Country Report
April 2013 18
• Takes ownership for and manages own career progression, sets realistic and achievable career goals, identifies and develops ways to improve em-ployability.
• Co-authors papers at workshop and conferences.” (see European Commission 2011, p. 8)
An established Researcher (R3) has developed a level of independence and, in addition to the characteristics assigned to the profile of a recognized researcher:
• “Has an established reputation based on research excellence in his field. • Makes a positive contribution to the development of knowledge, research
and development through co-operations and collaborations. • Identifies research problems and opportunities within his area of expertise
Identifies appropriate research methodologies and approaches. • Conducts research independently which advances a research agenda. • Can take the lead in executing collaborative research projects in coopera-
tion with colleagues and project partners. • Publishes papers as lead author, organizes workshops or conference ses-
sions.” (see European Commission 2011, p. 10)
A leading researcher (R4) leads research in his area or field. He or she leads a team or a research group or is head of an industry R&D laboratory. “In particular disciplines as an exception, leading researchers may include individuals who op-erate as lone researchers.” (European Commission 2011, p. 11) A leading re-searcher, in addition to the characteristics assigned to the profile of an estab-lished researcher:
• “Has an international reputation based on research excellence in their field. • Demonstrates critical judgment in the identification and execution of re-
search activities. • Makes a substantial contribution (breakthroughs) to their research field or
spanning multiple areas. • Develops a strategic vision on the future of the research field. • Recognizes the broader implications and applications of their research. • Publishes and presents influential papers and books, serves on workshop
and conference organizing committees and delivers invited talks” (see European Commission 2011, p. 11)
For selected countries, career maps following a respective four-stage model, which focuses specifically on academic careers, are provided by LERU9. Country correspondents were made aware of these existing descriptions and they provid-ed with the respective links allowing them to access the relevant information.
In the following chapter the information and data from the country specific case studies will be presented. We will start with a descriptive overview regarding im-portant issues tackled in the country correspondents’ template complemented by some statistical data. This will be followed by the statistical analysis of the data provided. The individual country fiches which were provided by the country corre-spondents can be found in the annex.
3.1 Methodological approach
Our comparative analysis of academic careers is based on ideas developed by Kaulisch and Salerno (2009) which have been further developed and elaborated
9 http://www.leru.org/index.php/public/extra/careermapseurope/

MORE2 – Career paths Cross-Country Report
April 2013 19
throughout the course of the MORE2 project. In our analysis we tried to deploy a more holistic approach for evaluating different overlapping contexts in which aca-demics’ careers unfold and to provide a better – comparative - understanding of how the sequence, timing and likelihood of major events in academic careers de-velop.
In our analysis we are broadening the focus of academic careers beyond the usual perspective on organizational aspects (e.g., moving up the hierarchical ladder) or employment conditions (e.g., permanent vs. temporary employment) of careers. Relevant research fields, particularly in life course research and career research, commonly use respective approaches when investigating careers (e.g., Hall, 2002; Steyrer, Mayrhofer, & Meyer, 2005; Mayer 2004).
3.1.1 Institutional context of academic careers
Academic careers are particularly shaped by three overlapping contexts: 1) scien-tific, 2) societal, and 3) higher educational (Enders, 1996; Gläser, 2001; Kaulisch & Enders, 2005).
In many ways, each context possesses a “logic” that not only creates overlap but in some cases, conflicting behavior or expectations. Together, these overlapping contexts create specific conditions that invariably shape academics’ working con-ditions, work roles, career stages and expectations. Gläser (2001) suggests that, “career problem's complexity is caused by the fact that scientists act simultane-ously in several social contexts” (Gläser, 2001, p. 700).
The science context is dominated by knowledge production and its measurement as a performance yardstick. The gradual differentiation of knowledge into disci-plines and sub-disciplines over the past 200 years has laid the framework for the source of today’s knowledge acquisition structure. It is in this domain that scien-tists formulate research problems, ply their discipline’s paradigms and test hy-potheses. Not surprisingly, the academic’s devotion to accumulating knowledge in a narrow area of expertise over a long period of time, the acquisition of prestige through peer review and the relatively flat organizational structure of the con-temporary higher education institution have all worked to bind academics more to their area of study than to their institution (Alpert, 1985). Importantly, the main rewards academics receive are usually bestowed through the science system and guided by borderless evaluation from one’s peers.
The societal context captures, “the institutionalized patterns of life course…included in a system of social stratification” (Gläser, 2001, p. 704). Sys-tems of education, certification, employment and social security fall under this heading and shape academic work roles and careers in specific ways. National la-bor markets set specific conditions on earnings, employment regulations and po-sitions available outside academe. This context also defines the extent to which organizations are responsible for both funding and the arrangements behind teaching and research activities.10
The higher education context includes those institutions governing academic ca-reers through the rules on tasks and qualification requirements, work roles, work-ing conditions, staff structures and career ladders. Colleges and universities’ for-mal frameworks also shape intra- and inter-organizational mobility, mediate re-source flows and influence academics’ expectations about their contributions and performance. In essence, the institution as employer provides a parameterized
10 Universities’ autonomy in generating and spending funds depends on the governance pattern between state and universities. In similar respects, state-regulations enable and restrict uni-versities in their autonomy to design study courses as well as to decide on the extent of ac-ademics’ tasks in research and teaching.

MORE2 – Career paths Cross-Country Report
April 2013 20
environment for scattered professionals to coordinate for the institution’s greater benefit. On a more pragmatic level, this context is defined by specific degrees of freedom allotted to different individuals, the establishment of working conditions, and the design of internal staff structures and promotion ladders.
Clearly these three contexts overlap in myriad ways. The formal and informal rules in the science context influence and are influenced by the contextual nature of the specific types of institution one works in. Higher education institutions’ reg-ulations are shaped by societal rules. Resource allocations are defined, in part, by the confluence of all three. What is not so clear, though, is that the overlap be-tween the contexts sometimes can also produce conflicting expectations and con-flicts. Faculty members, for example, are expected to teach and undertake re-search and their performance is judged, at least in part, on how they do at both. At the same time while efforts towards teaching are beneficial in the higher edu-cation context, the time spent is detrimental in the science context.
3.1.2 Five sets of rules influencing sequence, timing and likelihood of major career events
Academics’ career paths are guided by the formal and informal rules that emerge from these three institutional contexts. By themselves each of the three is overly broad and this makes it difficult to precisely characterize the sequence, timing and likelihood of major career events: a critical aspect for comparing and con-trasting different countries’ “academic career systems.” Sequence and timing cap-ture the inter-temporal nature of careers as an “evolving sequence of a person's work experiences over time” (Arthur, Hall, & Lawrence, 1989, p. 8), while incor-porating the likelihood of major career events provides useful markers for de-scribing academics' motivations, career aspirations and opportunities to reach particular goals.11
If career systems are treated as “collections of policies, priorities and actions the organization uses to manage the flow of their members into, through and out of the organization over time” (Sonnenfeld & Peiperl, 1988, p. 588), then careers can be examined according to the organizational practices that deal with employ-ees' entry, development and exit. Focusing on national career systems is im-portant because academic careers and labor markets are heavily influenced by national regulations and traditions rooted in the history and organization of higher education systems. In national systems, inter-organizational relationships play an important role in determining the likelihood of major career events.12 Selecting, hiring and promoting academic staff depends not only on the criteria established by one’s discipline but is also shaped by the timing of academic careers. When an individual completes a degree and where they do it (credentialing) influences fu-ture career opportunities (Burris, 2004; Caplow & McGee, [1958] 2001; Miller, Glick, & Cardinal, 2005).
The discussion, to this point, has identified numerous factors shaping academics’ careers and career options. In an effort to systematize this wealth of information and use it for constructing an analysis, we focus on the common denominator shared by all: formal and informal rules.
More specifically, we collapse these rules into five basic sets that arguably cap-ture the different contextual patterns and overlapping dynamics identified above:
11 Sørensen (1992), for example, argues that these are important because of their influence on academics' productivity and relationship to the science system.
12 The influence of inter-organizational prestige hierarchies is described later. One is more likely to get a position at a good university if they have a degree from a prestigious university.

MORE2 – Career paths Cross-Country Report
April 2013 21
1) academics' employment, 2) credentials, 3) intra-organizational13 practices, 4) inter-organizational relationships and 5) academic disciplines. We briefly lay out these five basic sets in the following sections. The variables used to reflect these five sets will be introduced at a later stage. The tables used to describe the varia-bles and how we utilized them are organized in these five categories.
3.1.2.1 Academics' employment
Employment rules address the basic timing and sequence of academics’ careers. They include and involve rules related to staff structures and career ladders as well as positional rewards and organizational hierarchies, four concepts that are strongly interrelated. Staff structures heavily influence staffing procedures and lay the foundation for power hierarchies between different levels within universi-ties; one can think, for example, of the different administration, faculty and de-partment relationships in top-down or bottom-up organizations.
Neave and Rhoades (1987) distinguish between two academic staff structures: the chair- and department-models. Chair-models are mainly found in Continental Europe and departmental-models are more representative of places like the Unit-ed Kingdom and United States. The former is characterized by a high concentra-tion of power and authority in the hands of individual professors who manage the administrative and scientific work of their institute, allocate resources and often negotiate directly with state ministries. Chairs have the power to decide who will be employed in their institute as well as their subordinates' degrees of scientific freedom. In contrast, the department-model focuses more on inter-rank collegi-ality. Although the British higher education system maintains chair positions, its power is notably diluted in comparison to places like France or Germany. And while, in the departmental model, non-professorial staff are far from equal to full professors they are less dependent than their Continental European counterparts and more actively involved in departmental decision-making.
These staff structure types influence career ladders to the extent that they create different degrees of “steepness” at various points in an academic career (Søren-sen 1992). The promotion from a non-professorial to a professorial position is a much greater step in the chair- rather than departmental-system. In this sense the American and British higher education systems have more recognizable ca-reer ladders, in sense of career progressions within an organization, than the chair-models in Germany and France, where career progression is based more on credentials, state control or chairholders' goodwill. Higher education systems with a departmental-model of staff structure tend to stress organizational careers and, thereby, securing permanent positions (which tend to occur relatively early in an academic career) based on organizational decisions.
3.1.2.2 Credentials
The second set of rules relate to credentials awarded. Similar to other profes-sions, specific qualifications and certificates are required to obtain an academic position or advance to a higher career stage. Academic career systems vary in their use and design of credentials. In general, credentials are primarily used to evaluate job candidates’ suitability and potential future performance (Sørensen, 1992).
Entry into academia as a researcher usually requires some form of post-graduate training; typically a doctoral degree is needed. Even in countries where research-ers without a doctoral degree can obtain permanent positions (such as was tradi-
13 In this theoretical framework, we use the term ‘organization’ to distinguish it from the theoreti-cal term ‘institution’ and to emphasize the organizational nature of the topics at hand. Later in the empirical part, higher education institutions (HEI) are used as a technical and widely used term. The term ‘institutions’, in this sense, describe higher education organizations.

MORE2 – Career paths Cross-Country Report
April 2013 22
tionally the case in the Netherlands or the United Kingdom) chances for promo-tion are severely limited without it. In some countries and certain academic fields, post-doctoral credentials may also be needed. Sometimes a second post-graduate degree is also needed to advance to the highest available academic positions.
3.1.2.3 Intra-organizational practices
The third set of rules reflects organizations' hiring and promotion practices. The freedom or flexibility to hire staff is an important facet with regard to the func-tioning of the internal labor market. The extent to which different institutions and systems possess such flexibility differs by country. In the UK and the US for in-stance, universities have considerable autonomy over such matters while in other countries the decision is remanded to the state.14 If the universities have control over the selection process then internal governance plays a much greater role by balancing administrators’ and academics’ power to select and promote staff and selection procedures become a relatively unique process in each university and department.
3.1.2.4 Inter-organizational relationships
The fourth set of rules deals with inter-organizational relationships. In particular, in this set of rules, two main points stand out: the prestige hierarchies between universities and the openness of systems to inter-organizational and intersectoral job mobility.
The first point refers to the extent to which prestige hierarchies influence aca-demics’ career decisions. In some countries there are very steep institutional hi-erarchies and where an individual completes his / her doctorate strongly influ-ences future job opportunities.15 In other countries such a steep hierarchy does not exist; and in principle all universities are considered equal. Here, prestige is attached more to the individual than to the university. According to Neave and Rhoades (1987), this equality among universities is due to states' involvement because the state promotes universal criteria on assessments of universities, quality of study courses and funding.
Countries also differ in the number of formal and informal job changes faculty members make between universities. For the sake of scientific development, aca-demics' job mobility is mostly appreciated because it forms a type of cognitive career (Gläser, 2001) by which academics exchange their knowledge with col-leagues at different places, leading to new scientific ideas. In some countries, regulations prohibit internal - meaning within the same organization - promotion to a professorial position whereas in others internal progression or promotion may be the only route to a permanent position. Thus, job mobility is influenced by the mixture of permanent and temporary employment in the system. Where a large proportion of permanent positions exist, inter-organizational job mobility is as-sumed to be relatively low; the converse of course is that greater job mobility is associated with greater use of non-tenured employment.
Both approaches have positive and negative effects. Temporary employment al-lows universities to more frequently select suitable candidates and more easily respond to changing funding conditions. On the other hand, universities may lose
14 This is not always the case. In chair-systems professors often select candidates for non-professorial positions without a formal procedure and even in formal procedures professors' protégés have a high chance of obtaining the job. State supervision can have a direct influ-ence on whom a university appoints, the ranking of candidates or the funding of the posi-tion.
15 As Caplow and McGee ([1958] 2001) have shown, the prestige of a supervisor and the prestige of journals in which candidates have published heavily influence the decision-making-process about candidates.

MORE2 – Career paths Cross-Country Report
April 2013 23
both prestige and capacity if academics leave for another university or to other employment sectors. Furthermore, continuous employment insecurity may act as a disincentive and increase academics’ efforts to search for more secure positions instead of concentrating on the current position (House of Commons. Science and Technology Committee, 2002).
Additionally, nowadays the intersectoral mobility of researchers is considered to be as significant for research developments both in and outside of the higher edu-cation sector, as are academics’ job mobility inside the higher education system.
3.1.2.5 Academic disciplines
The last set of rules relates to those facets unique to the various academic disci-plines. Disciplines vary with regard to the implicit and explicit criteria for organiz-ing, judging and rewarding academic work they undertake. Communication in some fields is primarily driven by conference presentations while in others refer-eed journals are the norm. In the humanities, where books are considered the typical research output, per-year productivity expectations are much lower than in journal-oriented fields. Also the organization of knowledge production differs. Much of the research done in the physical and biological sciences tends to be conducted in large, multi-institution teams, contrasted with the stereotypical lonely historian. Clearly, such structures influence the organization of academic units, faculty members’ relationships with their colleagues and a host of other factors.
These five sets of factors have been addressed in the country templates used for collecting the data at country level (see IDEA Consult et al (2013a) for the coun-try template used for data collection, the country specific case studies provided the raw data). As outlined in chapter 2 individual country fiches were assembled by an extensive network of country correspondents. This data formed the basis for further analyses. From theses fiches we retrieved the information to be opera-tionalized as variables for further analyses (see section 3.1.3). In section 3.1.4 the analytical approaches and the variables used for comparative analyses will be described.
3.1.3 Data collection and coding
Our analyses are based on the data provided by 47 country correspondents who answered the country correspondents’ template (details about the data collection and for the country correspondents’ template see chapter 2 and the technical re-port for WP3 and WP 4, IDEA Consult et al (2013a)).
After the country correspondents filled in the templates, the data was transmitted in an Excel-file and one Word-file per country.
While the Excel-file builds the base for data management, the Word-files were essential as the basis for the further analysis. They contained all answers to the questions asked and formed the basis for transferring the information into varia-bles as open-ended questions that had to be coded. The coding of all open-ended questions was done with the help of MaxQDA16 software. The data coded in MaxQDA was afterwards imported into Stata17, the statistical package we used for managing the data for performing the statistical analyses. Most of the information was provided in a rather unstructured way and thus, extensive efforts were put into data cleaning and coding of variables. Furthermore, if necessary, and as part of the quality assurance process, country correspondents were contacted after
16 We used MaxQDA version 10 from Udo Kuckartz with the release date of 25th April 2012. 17 We used Stata version 12.1 from StataCorp at each stage of analysis with the latest available
version.

MORE2 – Career paths Cross-Country Report
April 2013 24
they delivered their completed templates and they were asked for some clarifica-tion or additional data, which led to last minute changes with regard to the an-swers provided and information given requiring adjusting also the data to be used for further analyses (e.g., Spain changed the assignment of a position from R4 to R3 after being asked for some clarification).
3.1.4 Strategy for analyses
The goal of our analysis is to identify groups of countries with similar academic career systems, focusing on the employment conditions and career paths of early career researchers.
We approached this goal using a two-step process: In the first step, we focused on each of the four careers stages introduced by the European Framework for Re-search Careers (European Commission 2011, p. 2). The European Framework for Research Careers describes the career stages at a universal unifying level. Our intention in this first analytical step is to identify how far the career stages are coherent among countries in terms of employment and working conditions. We furthermore try to generate major dividing lines between the countries observed.
In a second step, we compared the career systems as such and identify groups of countries where these systems are characterized by similar features. In this step, the theoretical framework introduced in section 3.1.2 has been applied.
In both steps, we used the same methods to generate a country classification. We applied a sequence analysis that calculates the (dis-)similarity between countries. A cluster analysis was then used to identify groups of similar countries. The se-quence analysis is used to determine the (dis-)similarity of country because we intend to group a limited number of countries with a rather large set of varia-bles18. The advantage of the sequence analysis is its handling of missing values19. Furthermore sequence analysis treats different values in a variable as equally dif-ferent20. In the sequence analysis, each country is represented by a sequence of values for the variables used (see sections 3.1.4.1 and 3.1.4.2).
Sequences may look like the following constructed examples:
Country Sequences constructed based on the values of variables
age range, type of contract, research and teaching nexus, lev-el of researchers’ autonomy, type of funding, tenure-track op-tion
A 1 1 1 8 1 1
B 0 1 1 2 1 0
C 1 0 1 4 0 1
18 In the country classification of career systems 27 variables are used to group 47 countries. 19 In cluster analysis cases with missing values are excluded from analysis whereas in sequence
analysis a value given for missing value is treated as similarly differentiating two countries as if they had two different codes in this item.
20 In cluster analysis, values that are closer to each other such as 0 and 1 compared to 0 and 3 are more commonly grouped together. But in our analysis we deal with nominal data where the meaning of the difference between value 0 and 1 is equal to the difference between val-ues 0 and 3.

MORE2 – Career paths Cross-Country Report
April 2013 25
3.1.4.1 Country classification with regard to each career stage
For the country classification based on the different career stages, the selection of variables is oriented along the criteria which have an influence on the sequence, timing and likelihood of academic careers. We use the following set of variables to characterize the career stages and to identify their coherence. For each career stage we focused on:
- the age range at which positions are obtained, - the typical type of contract awarded, - the task division between research and teaching, - the level of researchers’ autonomy, - the type of funding typically associated with positions at the stage and - whether tenure-track options are available at this career stage.
The variables used are described in more detailed in Table 3.1.1. Table 3.1.2 to Table 3.1.6 provide an overview of the variables used for the comparison of coun-tries with regard to the overall career systems. The tables are organized by the five sets of rules outlined in section 3.1.2. The tables contain the following infor-mation: internal Topic ID, a short description of the topic, the question(s) from the country correspondents templates used as basis to operationalize the varia-ble, the potential values of the variable and a description how the operationaliza-tion of the variable has been implemented including comments on data quality.

MORE2 – Career paths Cross-Country Report
April 2013 26
Table 3.1.1: Variables used to generate country classifications for each career stage
Topic ID Topic Question Values Operationalization
1.1 Age obtaining the career stage
C05d Age ranges: -30, 31-35, 36-40, 41-45, 46-50, 51-55, 56-60, 61-
The type of contract is well coded (Question C05e) but the data on age per position (C05d) was difficult to handle because an exact date or even date range is rarely given. We coded it very carefully. If an age range given by a country correspondent stretching across two age ranges category, then the younger age range was chosen. If two or more unique positions per career stage were provided, then age categories of all positions in a career stage were averaged and then again categorized into age ranges. The variable values representing the age ranges are used for this calculation (e.g. age range -30 is coded as 1; 31-35 is cod-ed as 2). If the average values is decimal then the cut point x.5. E.g., if two positions in R1 are categorized in age ranges 1 and 2, then the average is 1.5. As the cut point is set at .5 the resulting category is 2 (31-35 years of age). In addition, we used the information about the age at first tenured position (question C.0.9) and the age at first professorial position (question C.0.10) to fill out missing information on R4 (professorial positions) and R3 position. In the latter case only if a R3-position was indicated as one with permanent contracts.
1.2 Type of contract C05e
Only positions with permanent contracts positions both with temporary and permanent contracts only positions with temporary con-tracts
The type of contract is well coded (Question C05e). The basic values are averaged over all positions in a career stage. If mean is neither temporary only (value 0) or permanent only (value 1), then a third category “positions both with temporary and permanent positions” is chosen.
1.3 Research and teaching nexus: are positions in this career stage predom-inantly involved in re-search or teaching
C05k
Research-oriented Teaching-oriented Research-and-teaching-oriented Research-or-teaching-oriented
In general, it was difficult to recode answers in a meaningful way because correspondents’ answers are by no means really clear cut. And it seems that even within positions a wide range of task divisions are enforced. We calculated the number of positions per career stage as being research-oriented, teaching-oriented or research-and-teaching-oriented. Only if more than half of the positions are with a certain category, this category is taken for the career stage. If no category has a majority and one position was coded as research-and-teaching-oriented, then this category was chosen. If only teaching- or research-only positions are named, then a fourth category was taken: research-or-teaching-oriented.

MORE2 – Career paths Cross-Country Report
April 2013 27
Topic ID Topic Question Values Operationalization
1.4 Level of researchers’ au-tonomy
C05l Four items: academic, financial, organizational and staffing decisions
Low level of autonomy Middle level of autonomy High level of autonomy
Level of autonomy is judged on a five-point-scale ranging from very low (1) to very high (5). Answers indicating no autonomy or not applicable are cod-ed as very low. Per position an averaged value is calculated over the four items used to identify researchers’ autonomy. This average value per position is again av-eraged over all positions per career stage. Finally, the average value per career stage is categorized: if average is up to 2.5 it is considered as low level of autonomy, average between 2.51 and 3.5 is considered as middle level of autonomy and a value between 3.51 and 5 is considered as high level of autonomy
1.5 Majority of researchers are funded by block fund-ing?
C05m Basic/block funding Competitive funding Basic/block funding and competi-tive funding Basic/block funding or competitive funding
Calculated the number of positions per career stage with either basic/block funding, competitive funding, basic/block-funding-and-competitive-funding. Only if more than half of the positions are with a certain category, this cate-gory is taken for the career stage. If no category has a majority and one position was coded as basic/block-funding-and-competitive-funding, then this category was chosen. If only basic/block- and competitive funding are named, then a fourth category was taken: basic/block-funding-or-competitive-funding.
1.6 Tenure-track option available
C05g Yes, tenure-track option is availa-ble No, tenure-track option is not available
Summed up all values over positions in career stage (tenure-track option is coded as value 1). If the sum of all positions in a career stage is 1 or greater then Yes, tenure is possible within career stage. If sum is 0 no tenure-track option in career stage available.
MORE2 – Career paths Cross-Country Report
April 2013 28
3.1.4.2 Country classification of academic career systems
For the country classification of academic career systems, we used the five sets of rules guiding us in selecting and grouping the variables. Our methodology is the same as that used for the country classification for each career stage. The tables presented in the following sections are structured the same as Table 3.1.1. The descriptive statistics of these variables are presented in Appendix 7.2.
Academics’ employment
The variables representing rules on academics’ employment (see Table 3.1.) re-flect eight categories: staff structure, autonomy of researchers, employment se-curity, performance-orientation in career advancement, selection procedures, im-portance of international mobility, financial rewards to climb the career ladder and general social security levels.
Credentials
Three variables are selected to represent the system of credentials in a country (see Table 3.1.3): The extent to which doctoral education is structured, the ne-cessity of a second post-graduate research degree such as the Habilitation and the variety of institutions which are allowed to award doctorates.
Intra-organizational practices
Four variables are selected to denote the intra-organizational practices in a coun-try (see Table 3.1.4): Site where positions are mainly advertised the source of funding of R3 positions, the level of HEI autonomy and the organization of selec-tion.
Inter-organizational relationships
Five variables are selected to characterize the inter-organizational relationships in a country (see Table 3.1.5): Degree of sectoral differentiation, intersectoral mo-bility as prerequisite to pursue specific career paths, vertical differentiation of HE system, attractiveness of positions outside academe for young researchers and autonomy of universities to set employment conditions.
Academic disciplines
The strength of discipline-specific conditions is used to map the influence of disci-plines shaping academics’ careers (see Table 3.1.6).

MORE2 – Career paths Cross-Country Report
April 2013 29
Table 3.1.2: Academics‘ employment. Variables used to generate country classifications
Topic ID Topic Derived from question
Categories Operationalization
2.1 Vertical differentiation within staff structured
B04 chair model department model no answer/missing
Straight forward coding into these two categories.
2.2 R1+R2 are the majority of researchers
C07 Yes No No answer/missing
Difficult coding process due to lack of data and/or calculations used from administrative data that does not necessarily reflect the R1-R4 typology. Additionally it is not always clear whether doctoral students are always counted as R1-researchers. Total percentage of researchers per country by summing up the values for R1+R2 und R3+R4. If sum of R1+R2 is higher than half of the total it is coded as 1 and if the sum of R3+R4 is higher than the half of the total it is coded as 0.
2.3 Career stage at which own research agenda can be pur-sued
C011a R1, R2, R3, R4 If more than one career stage is reported, then lowest possible career stage is taken where high levels of autonomy can be assumed. Any indi-cations that a career stage does not give full rights in setting own re-search agenda, the higher career stage with full rights is taken. (e.g., Germany (R3)/R4 will be coded into R4 because R3 has no full rights indicated by parentheses).
2.4 Length of contracts: Con-tracts in R1+R2 position are shorter than 2 years
D05 E05
Yes, no
In most cases the coding was given by the answers of the country ex-perts. The other answers were coded. Temporary contracts with a pre-set evaluation date by which a contract will be prolonged (or not), it is coded as the period until the evaluation date. E.g. An answer suggesting 3+3 contracts are coded as 2-4 years period.
2.5 Age of first permanent posi-tion
C05d C05e
Age ranges: -30, 31-35, 36-40, 41-45, 46-50, 51-55, 56-60, 61-
See Topic ID 1.1 (in Table 3.1.1) for a general comment on coding age ranges. For this topic, the age range of the position with the youngest age and a permanent position was chosen.
2.6 Stage at which permanent position can be obtained
C05e R1, R2, R3, R4 The lowest career stage providing a position with a permanent position was chosen.

MORE2 – Career paths Cross-Country Report
April 2013 30
Topic ID Topic Derived from question
Categories Operationalization
2.7 Importance of performance in career advancement
C05c No strong performance orienta-tion Some performance-orientation Performance-oriented categories are equally distributed among positions
The performance-orientation per position is given when performance criteria are named as “major” or even “only” criteria, the mixed value is taken when performance criteria are described as equally important as non-performance-based criteria. The absence or weak presence of per-formance criteria with regard to a position are coded as no strong per-formance orientation. The position-based coding was transferred into the country-wide catego-rization by counting the number of occurrences per category in a coun-try and chosen the country-characterizing category when it occurs in at least half or more of all positions. If none of the categories accounted for more than 50 per cent of all positions, then the category “categories are equally distributed among positions” is chosen.
2.8 Transparent selection criteria C04 Criteria for selection criteria to R4 positions provided by law / other state regulations (1) Criteria for selection criteria to R4 positions NOT provided by law / other state regulations (0)
Coding of the variable (question C04) was difficult, because not all an-swers cover all aspects of the question. Thus, we decided to use the criteria whether state regulations or law provide rules on selection criteria.
2.10 International mobility a pre-requisite of an academic ca-reer
C013b Yes (2) In some cases (1) No (0)
We coded “yes” if the country correspondent stated that international mobility is a prerequisite or strong enhancer for R3 or R4 positions which might also occur at the post-doctoral level. In some cases correspond-ents stated that international mobility is only important for certain disci-plines or subgroups of academics. Then it is coded as “in some cases”.
2.11 Schemes to enhance interna-tional mobility
C013 National initiatives that go be-yond standard European initia-tives (1) Only European initiatives men-tioned/or none (for non-European countries) (0)
We basically distinguish between countries that do have national schemes to enhance international mobility and do not only rely on Euro-pean initiatives only.
2.13 Financial reward of R4 against R3 position
D02 E02_can
Up to 20% 21-40% 41-200%
A detailed report on the construction of the three financial reward topics is given in section 3.1.4.3.
2.14 Financial reward of R3 against R2 position
D02 E02_can
Up to 20% 21-40% 41-200%
2.15 Financial reward of R4 against R1 position
D02 E02_can
Up to 100% 101-200% 201% and more

MORE2 – Career paths Cross-Country Report
April 2013 31
Topic ID Topic Derived from question
Categories Operationalization
2.16 Social security level D04 E04_can E04_hold
Low Middle High
The questions D04 and E04 provide information whether a position in-cludes health care insurance, unemployment insurance and retirement insurance. We totaled the number of items per country and divided it by the number of positions per country. The average social security items per position were then categorized into three levels of social security: low up to an average of 1.75 items; middle between 1.76 and 2.75 items; high between 2.76 and 3 items.
Table 3.1.3: Credentials. Variables used to generate country classifications
Topic ID Topic Question Values Operationalization
3.1 Doctoral education C02 Yes/Yes Yes/No No/Yes No/No
Straight forward coding based on entries from the templates.
3.2 Second degree needed C03 Yes No but tradition No
Straight forward coding based on entries from the templates.
3.3 Who awards doctorates? B01 3 Universities university plus others
Straight forward coding based on entries from the templates.
Table 3.1.4: Intra-organizational governance. Variables used to generate country classifications
Topic ID Topic Question Values Operationalization
4.1 Site where positions are mainly advertised
C04 International National Institutional
In principle, this information was provided by country correspondents effectively. But as advertisements of positions also depend on the posi-tion and the career stage affected, the coding needed some judgment calls. We decided that the next higher value (international/national) is taken if it is mentioned to be a common practice even if not all positions are advertised internationally or nationally.

MORE2 – Career paths Cross-Country Report
April 2013 32
Topic ID Topic Question Values Operationalization
4.2 Source of funding of R3 po-sitions
C05m Basic/block funding Competitive funding Basic/block funding and competi-tive funding Basic/block funding or competi-tive funding
For the coding of this item please see Topic ID 1.5 in Table 3.1.1.
4.3 Level of HEI autonomy B03_aca B03_fin B03_org B03_sta
High Middle Low
The average score (Scale 1 very low to 5 very high) of these four items in Question B03 was calculated. The outcome was categorized into three levels of autonomy: low if the average score was below 2.75; middle is the average score was between 2.76 and 3.75; high if the average score was above 3.76.
4.4 Organization of selection C04 Country-wide competitions Institution-based competitions
Similar to the other items derived from question C04, it was difficult to construct a meaningful variable about the organization of selection be-cause the information varied widely between countries. The best possi-ble way was to see whether selection was organized on a country level or is done within the institution.

MORE2 – Career paths Cross-Country Report
April 2013 33
Table 3.1.5: Inter-organizational relationships. Variables used to generate country classifications
Topic ID Topic Question Values Operationalization
5.1 Degree of sectoral differen-tiation
R&D performed by business sec-tor R&D performed by business and HE sectors R&D performed by business and government sectors R&D dominated by business sec-tor but other sector are also rele-vant R&D performed by all sectors on a relevant scale
The data used to calculate the sectoral differentiation was taken from Eurostat and OECD data on percentage of GERD performed by a sector (see section 3.2.1). We concentrated our analysis on percentage of GERD from higher education, business and government sector because the private non-profit sector is very small in nearly all countries (excep-tions are: Portugal and Cyprus). Rules to categorize countries are:
• Percentage of GERD in business sector above 66% and in both higher education and government sector below 20%: R&D per-formed by business sector
• Combined percentage of GERD in business and higher education sector above 80% and percentage of higher education sector above 20%: R&D performed by business and HE sectors
• Combined percentage of GERD in business and government sector above 80% and percentage of government sector above 20%: R&D performed by business and government sectors
• Percentage of GERD in business above 50% and both higher education and government sectors above 14%: R&D dominated by business sector but other sector are also relevant
• All sectors perform more than 20% of the GERD: R&D per-formed by all sectors on a relevant scale
5.2 Inter-sectoral mobility as
prerequisite to pursue spe-cific career paths
C012 d+e Yes No Cannot be typified
In general, intersectoral mobility is not a prerequisite to perform an aca-demic career. But in some tracks of the academic career intersectoral mobility is a prerequisite. If those special cases were provided in ques-tion C012d+e, then “Yes, intersectoral mobility is a prerequisite” was coded.
5.3 Vertical differentiation of HE system
B01 2 c+d Teaching-only type of HEI No teaching-only type of HEI
Straight forward coding based on entries from the templates.

MORE2 – Career paths Cross-Country Report
April 2013 34
Topic ID Topic Question Values Operationalization
5.4 Attractiveness of positions outside academia for young researchers
C015 Higher education sector is: less attractive similarly attractive more attractive
We calculated the average score of higher education sector and the av-erage scores of all other sectors in question C015 that is coded on a scale 1 (very poor) to 5 (excellent). Do not know and sector not relevant are treated as missing values. The difference between the scores for higher education and the other sectors are then used to categorize the countries into: less attractive if the difference is minus 0.41 to minus 4 similarly attractive if the difference is minus 0.4 to plus 0.4 more attractive if the difference is plus 0.41 to plus 4
5.5 Autonomy of universities to set employment conditions
B03_org B03_sta F01 H01
Variables from all three basic questions (B03, F01, H01) that do indicate whether HEI have autonomy to set employment conditions are taken. For each basic question a categorization into low, middle and high au-tonomy is performed. Then, the sum of all three variables is taken to finally categorize the variable into low, middle and high level of autono-my. The operationalization of the B03 criteria is described above in Topic ID 4.3 (see Table 3.1.4). Question F01: All items are counted that were ticked to be an issue of individual or institutional negotiations. If four or more items apply high autonomy is coded. If one to three items apply middle autonomy is coded. If no item applies, low autonomy is coded. Question H01: If the provision of health care and retirement funds de-pends on university then high level of autonomy is coded. If the provi-sion of health care or retirement funds depends on university then mid-dle level of autonomy is coded. If both do not apply on university level, then low level of autonomy is coded. If a country scores fully in two of the three questions, then high level of autonomy is coded. If a country scores in all variables on a middle level or in one high and in another a middle level, then middle level of auton-omy is coded. If a country scores only in two of the three variables in a middle level and in the other low (or it scores even less), then a low level of autonomy is coded.

MORE2 – Career paths Cross-Country Report
April 2013 35
Table 3.1.6: Academic disciplines. Variables used to generate country classifications
Topic ID Topic Question Values Operationalization
6.1 Strength of discipline-specific conditions
C05n yes, disciplines vary strongly in their conditions no disciplines most researchers experience the same conditions
Straight forward coding based on entries from the templates.

MORE2 – Career paths Cross-Country Report
April 2013 36
3.1.4.3 Excursus: Construction of financial reward variables
(Topic IDs 2.13 – 2.15 in Table 3.1.)
We used the following steps to generate income data and to categorize the finan-cial rewards delivered with regard to career progression within a country:
1. D.0.2 (referring to question D.0.2 in the country correspondents’ tem-plate) income data per position is taken as base. a. For R1-grant holder positions, E.0.2 data (doctoral candidate sti-
pends, question E.0.2 in the country correspondents’ template) is used.
2. Types of income data were not provided by country correspondents from all countries. Some provided only minimum and maximum per positions, others only the average and so forth. In this step, we identi-fied the type of income data that is available for all career stages. a. If all types of income are available, average data on income per po-
sition is taken. If not average but minimum income data was pro-vided, than minimum income data is used. If only maximum in-come data was provided on all positions, then this is taken as the last possible option.
b. The following calculations are based on the type of income chosen for a country.
3. The minimum, average and maximum of the chosen type of income over all positions within a career stage is calculated.
4. The income differentials between ranks are calculated for the min-imum, average and maximum income of all positions within a career stage. a. The differentials are calculated as follows:
i. Example: average differential between R4 and R3 career stage: ((inc_mean_R4/inc_mean_R3)*100)-100
5. The resulting income differential is calculated as the average of these minimum, average and maximum differentials between ranks.
6. The averaged differentials are then classified into three categories. The differentials are categorized as follows:
The income differentials between two ranks (R3 to R4 and R2 to R3) get the same categories: Up to 20%; 21-40%; 41-200%
As the span between R1 and R4 is wider, the income differentials are as well. So we identified the following categories: Up to 100%, 101-200%, 201% and more
3.2 Country comparison – the R&D system
The Innovation Competitiveness Report (European Commission 2011a) provides rich and illustrative data and analysis comparing the performance and competi-tiveness of the European Union and its member states against its global competi-tors. Furthermore, the Innovation Union Scoreboard regularly provides bench-marking information on EU member states and their competitors. These reports provide a wide range of data and indicators reflecting the overall set up and per-formance of national systems of innovation and thus also provide an extensive insight into the general framework conditions under which researchers can pursue their careers.
In this section we provide a more focused overview using a small set of indicators to provide an insight into general working conditions. We focus on the most rele-vant sectors where research careers can be pursued in the countries under inves-

MORE2 – Career paths Cross-Country Report
April 2013 37
tigation; the financial resources available to undertake research in these sectors and the human resources, specifically the researchers engaged in performing re-search in these sectors. Data is provided – depending on availability – for the countries under investigation, which also highlighting the structural diversity among these countries and thus the variances when it comes to the conditions under which research careers can be pursued. The statistical data presented here was also provided to the country correspondents as input for their work when compiling their country cases. After a discussion of selected indicators retrieved from EUROSTAT and OECD statistics, data from the country templates will be pre-sented comparatively. In this section, comparisons are mainly descriptive.
3.2.1 The countries’ R&D intensity, sectors of R&D performance and human resources in research
R&D intensity in the EU increased over the last years (European Commission 2011a, p. 20) but, in most member states the 3%-target set in 2005 has not yet been reached. Consequently the average value for the EU 27 also remains below this target (see Figure 3.2.1). As outlined in the Innovation Union Competitive-ness report, R&D intensity grew significantly stronger in the Asian countries, Ja-pan, South Korea and China (European Commission 2011a, p. 21). With regard to R&D intensity Japan and South Korea are among the leading countries, also China is closing the gap to the EU 27 average. Particularly low is the R&D intensity in most south and eastern European countries.
In the context of the EU 2020 strategy, in 2010, most countries renewed the tar-gets to be achieved, retaining the 3% mark for the EU as a whole, but with signif-icant differences when it comes to the individual countries. Some competitors, e.g. South Korea (5%) and Japan (4%), are aiming for higher R&D intensities in the same period; China is aiming for the 2.5% mark. The US, like Europe, is aim-ing for an R&D intensity of 3%21.
Apart from the differences with regard to the R&D intensity as such, we also ob-serve rather large structural difference among the EU member states – referring to the relevance of the sectors in which research is actually performed (see Figure 3.2.2 to Figure 3.2.4).
The relevance of the different sectors as research performers varies between countries. In a large number of EU countries the higher education sector is – in terms of the share of GERD performed by the sector – relatively more important than in China, Russia, South Korea, Japan and the United States. In China and Russia only approximately 8%, in South Korea 11% and in Japan and the US ap-proximately 13% of GERD are undertaken in the Higher Education Sector; in Cy-prus, Greece and Lithuania - on the other hand - this share amounts to approxi-mately 50%. On average, in the EU 27 24% of GERD are undertaken in the High-er Education Sector (Data: Eurostat and OECD). More generally, in a number of EU countries, research is performed to a higher extent in the public sector, par-ticularly in the southern and eastern European countries, than in the United States, South Korea, China, and Japan.
21 http://ec.europa.eu/europe2020/pdf/themes/12_research__development.pdf

MORE2 – Career paths Cross-Country Report
April 2013 38
Figure 3.2.1: GERD as Percentage of GDP – Total (2010 or latest year available)
Figure 3.2.2: GERD as Percentage of GDP by Sector of Performance – Higher Education
Sector (2010 or latest year available)
Figure 3.2.3: GERD as Percentage of GDP by Sector of Performance – Government
Sector (2010 or latest year available)
Figure 3.2.4: GERD as Percentage of GDP by Sector of Performance – Business Enter-
prise Sector (2010 or latest year available)
Data for Figure 3.2.1 to Figure 3.2.4: Eurostat. Countries with * OECD
0.0
1.0
2.0
3.0
4.0
5.0
Isra
el*
Fin
lan
d
Jap
an
Sw
ed
en
So
uth
Ko
rea
Ice
lan
d
De
nm
ark
Sw
itze
rla
nd
Ge
rma
ny
Un
ite
d S
tate
s
Au
stri
a
Fra
nce
Au
stra
lia
*
Slo
ve
nia
Sin
ga
po
re*
EU
27
Be
lgiu
m
Ne
the
rla
nd
s
Ca
na
da
*
Ire
lan
d
Ch
ina
Un
ite
d K
ing
do
m
No
rwa
y
Luxe
mb
ou
rg
Est
on
ia
Po
rtu
ga
l
Cze
ch R
ep
ub
lic
Sp
ain
Ita
ly
Hu
ng
ary
Ru
ssia
Tu
rke
y*
Lith
ua
nia
Po
lan
d
Cro
ati
a
Ma
lta
Slo
va
kia
Bu
lga
ria
Gre
ece
Latv
ia
Cyp
rus
Ro
ma
nia
0.0
0.2
0.4
0.6
0.8
1.0
De
nm
ark
Sw
ed
en
Fin
lan
d
Ice
lan
d
Ne
the
rla
nd
s
Au
stri
a
Sw
itze
rla
nd
Ca
na
da
*
Est
on
ia
Sin
ga
po
re*
Po
rtu
ga
l
Isra
el*
No
rwa
y
Au
stra
lia
*
Ge
rma
ny
Ire
lan
d
EU
27
Fra
nce
Un
ite
d K
ing
do
m
Be
lgiu
m
Lith
ua
nia
Jap
an
Tu
rke
y*
Sp
ain
So
uth
Ko
rea
Ita
ly
Un
ite
d S
tate
s
Gre
ece
Slo
ve
nia
Cze
ch R
ep
ub
lic
Po
lan
d
Cyp
rus
Latv
ia
Hu
ng
ary
Ma
lta
Cro
ati
a
Luxe
mb
ou
rg
Slo
va
kia
Ch
ina
Ro
ma
nia
Ru
ssia
Bu
lga
ria
0.0
0.2
0.4
0.6
0.8
Ice
lan
d
Ge
rma
ny
So
uth
Ko
rea
Slo
ve
nia
Fra
nce
Fin
lan
d
Ru
ssia
Cze
ch R
ep
ub
lic
Un
ite
d S
tate
s
Jap
an
Luxe
mb
ou
rg
No
rwa
y
Sp
ain
Au
stra
lia
*
Ch
ina
EU
27
Po
lan
d
Bu
lga
ria
Ne
the
rla
nd
s
Sin
ga
po
re*
Hu
ng
ary
Cro
ati
a
Ca
na
da
*
Be
lgiu
m
Slo
va
kia
Ita
ly
Isra
el*
Est
on
ia
Ro
ma
nia
Sw
ed
en
Un
ite
d K
ing
do
m
Au
stri
a
Latv
ia
Lith
ua
nia
Gre
ece
Po
rtu
ga
l
Tu
rke
y*
Cyp
rus
De
nm
ark
Ire
lan
d
Ma
lta
Sw
itze
rla
nd
0.0
1.0
2.0
3.0
4.0
Isra
el*
Jap
an
Fin
lan
d
So
uth
Ko
rea
Sw
ed
en
Sw
itze
rla
nd
De
nm
ark
Un
ite
d S
tate
s
Ge
rma
ny
Au
stri
a
Ice
lan
d
Slo
ve
nia
Fra
nce
Au
stra
lia
*
Be
lgiu
m
Sin
ga
po
re*
EU
27
Ire
lan
d
Luxe
mb
ou
rg
Ch
ina
Un
ite
d K
ing
do
m
Cze
ch R
ep
ub
lic
Ca
na
da
*
No
rwa
y
Ne
the
rla
nd
s
Est
on
ia
Po
rtu
ga
l
Sp
ain
Hu
ng
ary
Ita
ly
Ru
ssia
Ma
lta
Tu
rke
y*
Cro
ati
a
Bu
lga
ria
Slo
va
kia
Lith
ua
nia
Latv
ia
Po
lan
d
Ro
ma
nia
Gre
ece
Cyp
rus

MORE2 – Career paths Cross-Country Report
April 2013 39
More than 1.5 million researchers are employed in the EU (see Table 3.2.1). Only China employs more researchers. In line with what has been said about the rele-vance of the sectors performing R&D from a financial view point, the significance lies in the distribution of researchers working in these sectors. Thus, the share of researchers employed in the public sector in EU countries is comparatively high. However, differences exist among various countries. Particularly high is the share of researchers employed in the public sector in Slovakia, Bulgaria, Lithuania, Lat-via, Croatia, and Poland. In these countries more than 80% of the researchers are employed in the public sector. In Romania, Cyprus, Greece, Portugal and Es-tonia this share still exceeds two thirds of the researchers. By way of contrast, this is the situation found in the competitor countries. In China, Japan, South Ko-rea and the US, between 69% and 80% of the researchers are employed in the business enterprises sector.
While the overall number of researchers employed in China is the highest world-wide, in relative terms, researcher employment China is still lagging behind. The Nordic countries have the highest researcher employment rates, followed by Ja-pan, South Korea and the US. The lowest rates - apart from China - can be found in the southern and eastern European countries (see Figure 3.2.5).

MORE2 – Career paths Cross-Country Report
April 2013 40
Table 3.2.1: Full Time Researchers by Sector of Performance (2010 or latest year
available)
Researchers
(FTE) - Total
Researchers
(FTE) - Business
Enterprise Sec-
tor
Researchers
(FTE) -
Higher Edu-
cation Sec-
tor
Research-
ers (FTE) –
Govern-
ment Sec-
tor
China 1.592.420 1.092.213 261.237 238.970
EU 27 1.564.770 708.345 640.276 198.555
United
States
1.412.639 1.130.500
Japan 656.032 492.805 123.549 32.050
Russia 442.071 211.214 84.359 145.056
Germany 327.500 187.000 89.600 50.900
South Korea 236.137 182.901 34.773 15.552
United King-
dom
235.373 80.561 142.727 8.135
France 234.201 133.536 68.696 28.702
Canada* 146.324 86.964 49.850 9.170
Spain 134.653 45.377 64.590 24.377
Italy 105.846 41.674 43.470 16.672
Australia* 92.379 29.085 53.340 8.285
Poland 64.511 11.729 39.170 13.553
Turkey* 57.759 21.019 31.037 5.703
Netherlands 52.066 24.907 20.200 6.959
Sweden 49.312 30.440 16.959 1.892
Portugal 45.916 10.363 28.830 2.526
Finland 41.425 22.904 13.548 4.551
Belgium 38.168 17.610 17.264 3.008
Austria 35.942 22.396 11.677 1.617
Denmark 35.326 21.481 12.535 1.133
Singapore* 32.031 16.508 13.766 1.757
Czech Re-
public
29.228 12.661 10.115 6.244
Norway 26.537 12.588 9.470 4.479
Switzerland 25.142 10.332 14.322 488
Hungary 21.342 10.274 6.041 5.027
Greece 21.013 6.286 12.382 2.201
Romania 19.780 5.853 8.245 5.590
Slovakia 15.183 1.928 10.203 2.999
Ireland 14.437 7.884 6.106 447
Bulgaria 10.932 1.491 3.608 5.757
Lithuania 8.387 1.242 5.677 1.468
Slovenia 7.703 3.389 2.262 2.036
Croatia 7.104 1.281 3.716 2.097

MORE2 – Career paths Cross-Country Report
April 2013 41
Researchers
(FTE) - Total
Researchers
(FTE) - Business
Enterprise Sec-
tor
Researchers
(FTE) -
Higher Edu-
cation Sec-
tor
Research-
ers (FTE) –
Govern-
ment Sec-
tor
Estonia 4.069 1.274 2.179 548
Latvia 3.807 611 2.629 567
Iceland 2.861 1.126 1.125 547
Luxembourg 2.536 1.360 518 658
Cyprus 895 190 530 95
Malta 588 336 224 29
Albania n.a. n.a. n.a. n.a.
Bosnia and
Herzegovina
n.a. n.a. n.a. n.a.
Faroe Is-
lands
n.a. n.a. n.a. n.a.
Israel* n.a. n.a. n.a. n.a.
Liechten-
stein
n.a. n.a. n.a. n.a.
Macedonia n.a. n.a. n.a. n.a.
Montenegro n.a. n.a. n.a. n.a.
Serbia n.a. n.a. n.a. n.a.
Data: Eurostat. Countries with * OECD
Figure 3.2.5: Researchers as Percentage of Total Employment (2010 or latest year
available)
Data: Eurostat. Countries with * OECD
Differences can be observed regarding the share of female researchers among the total researcher population employed (see Figure 3.2.6). These differences con-cern the proportions that can be found when comparing countries generally, but can also be seen more specifically when analyzing the shares of female research-ers across the different sectors in these countries (see Figure 3.2.7 to Figure 3.2.9). The highest share of female researchers are typically found in countries with a comparatively low R&D expenditure (GERD as % of GDP) (see Figure 3.2.10) and with a high share of researchers employed in the public sector (high-er education and government sectors). In general, the share of female research-ers in the public sector is higher than in the business enterprise sector.
0.0
0.5
1.0
1.5
2.0
Ice
lan
d
Fin
lan
d
De
nm
ark
Luxe
mb
ou
rg
Sw
ed
en
No
rwa
y
Jap
an
So
uth
Ko
rea
Un
ite
d S
tate
s
Po
rtu
ga
l
Fra
nce
Au
stri
a
Ca
na
da
*
Au
stra
lia
*
Be
lgiu
m
Ge
rma
ny
Un
ite
d K
ing
do
m
Slo
ve
nia
Ire
lan
d
Sp
ain
EU
27
Est
on
ia
Slo
va
kia
Ru
ssia
Lith
ua
nia
Ne
the
rla
nd
s
Cze
ch R
ep
ub
lic
Sw
itze
rla
nd
Hu
ng
ary
Gre
ece
Cro
ati
a
Ita
ly
Latv
ia
Po
lan
d
Bu
lga
ria
Ma
lta
Tu
rke
y
Cyp
rus
Ro
ma
nia
Ch
ina

MORE2 – Career paths Cross-Country Report
April 2013 42
Figure 3.2.6: Percentage of Female Researchers (FTE) – Total Researchers (2009 or
latest year available)
Figure 3.2.7: Percentage of Female Researchers (FTE) – Higher Education Sector (2009 or latest year available)
Figure 3.2.8: Percentage of Female Researchers (FTE) – Government Sector (2009 or
latest year available)
0.010.020.030.040.050.060.0
Lith
ua
nia
Latv
ia
Cro
ati
a
Bu
lga
ria
Po
rtu
ga
l
Ro
ma
nia
Slo
va
kia
Est
on
ia
Sp
ain
Po
lan
d
Ice
lan
d
Cy
pru
s
Ita
ly
Slo
ve
nia
Tu
rke
y*
Ire
lan
d
Gre
ece
Be
lgiu
m
Hu
ng
ary
EU
27
De
nm
ark
Sw
ed
en
Ma
lta
Cze
ch R
ep
ub
lic
Au
stri
a
Luxe
mb
ou
rg
Ge
rma
ny
0.0
10.0
20.0
30.0
40.0
50.0
60.0
Lith
ua
nia
Po
rtu
ga
l
Latv
ia
Cro
ati
a
Ro
ma
nia
Slo
va
kia
Est
on
ia
Ice
lan
d
Slo
ve
nia
Bu
lga
ria
Be
lgiu
m
Po
lan
d
Sp
ain
Ita
ly
Tu
rke
y*
Luxe
mb
ou
rg
De
nm
ark
EU
27
Ire
lan
d
Cy
pru
s
Gre
ece
Sw
ed
en
Ne
the
rla
nd
s
Hu
ng
ary
Au
stri
a
Cze
ch R
ep
ub
lic
Ge
rma
ny
Ma
lta
0.010.020.030.040.050.060.070.0
Est
on
ia
Po
rtu
ga
l
Cro
ati
a
Bu
lga
ria
Lith
ua
nia
Latv
ia
Ro
ma
nia
Sp
ain
Cy
pru
s
Ma
lta
Slo
va
kia
Ita
ly
Slo
ve
nia
Ice
lan
d
Po
lan
d
Hu
ng
ary
Ire
lan
d
Au
stri
a
EU
27
De
nm
ark
Cze
ch R
ep
ub
lic
Gre
ece
Luxe
mb
ou
rg
Sw
ed
en
Un
ite
d K
ing
do
m
Be
lgiu
m
Ge
rma
ny
Tu
rke
y*

MORE2 – Career paths Cross-Country Report
April 2013 43
Figure 3.2.9: Percentage of Female Researchers (FTE) – Business Enterprise Sector
(2009 or latest year available)
Data for Figure 3.2.6 to Figure 3.2.9: Eurostat. Countries with * OECD
Figure 3.2.10: Share of female researchers (FTE) in total researchers and GERD as %
of GDP
Data: Eurostat. Countries with * OECD
Highly qualified staff is an indispensable precondition for successfully improving Europe’s performance in R&D and its competitiveness. In the EU, approximately 111,000 doctorates are awarded per year, almost twice as many as in the United States (European Commission 20011a, p. 5). Relatively speaking and taking into account the relevant age group, the share of doctoral graduates among individu-als of the corresponding age group varies across countries. It is highest in Swit-
0.010.020.030.040.050.060.070.0
Latv
ia
Bu
lga
ria
Cro
ati
a
Ro
ma
nia
Lith
ua
nia
Ice
lan
d
Cy
pru
s
Sp
ain
Po
rtu
ga
l
Est
on
ia
Ire
lan
d
Ma
lta
Sw
ed
en
De
nm
ark
Tu
rke
y*
Po
lan
d
Gre
ece
Slo
ve
nia
Hu
ng
ary
Slo
va
kia
Be
lgiu
m
Ita
ly
Fra
nce
EU
27
Au
stri
a
Cze
ch R
ep
ub
lic
Ge
rma
ny
Luxe
mb
ou
rg

MORE2 – Career paths Cross-Country Report
April 2013 44
zerland (2.7%) and lowest in Malta (0.1%) (see Figure 3.2.11). Similar variations can be observed for the share of doctoral students among the most relevant age group (see Figure 3.2.12). Finland has the highest share of doctoral students. The obvious difference between the share of doctoral students and the share of grad-uates in Finland can be explained by the fact that in Finland (see Table 3.2.11) the average graduation age for doctoral students is between 35 and 37 and thus beyond the age group we are looking at when taking the Eurostat data as a refer-ence.
Figure 3.2.11: Graduates (ISCED 6) aged 25-34 per 1 000 of the corresponding age
population - doctorates awarded (2010 or latest year available)
Figure 3.2.12: Doctoral students - percentage of the population aged 25-29 (2010 or
latest year available)
Data for Figure 3.2.11 and Figure 3.2.12: Eurostat. Countries with * OECD
Let us now turn to the data gathered in the MORE2 study. Comparative infor-mation is provided in this chapter. All information is based on the country fiches compiled by the country correspondents.
3.2.2 Attractiveness of sectors for pursuing researcher careers
The relevance of various sectors to researchers’ careers - based on the relevance of the sectors as research performing sectors - is illustrated above. To comple-ment this approach, we asked the country correspondents for an assessment of the attractiveness of each sector. The results of these assessments across coun-tries are provided in Table 3.2.2 and Table 3.2.3.
It should be taken into account that the assessment was provided by the individ-ual country correspondents and is therefore highly subjective in nature. In addi-tion, other than providing the country correspondents with brief guidelines about
0.0
0.5
1.0
1.5
2.0
2.5
3.0
Sw
itze
rlan
d
Ge
rma
ny
Lie
chte
nste
in
Slo
va
kia
Au
str
ia
Sw
ed
en
Un
ite
d K
ing
do
m
De
nm
ark
Be
lgiu
m
Fin
land
Ire
lan
d
Slo
ve
nia
Czech
Rep
ublic
Italy
No
rwa
y
Po
rtug
al
Ro
ma
nia
Sp
ain
Lith
uan
ia
Luxe
mb
ourg
Esto
nia
Gre
ece
Hu
nga
ry
Cro
atia
Ice
lan
d
Tu
rke
y*
Bu
lga
ria
Latv
ia
Cypru
s
Ma
ced
on
ia
Ma
lta
0.01.02.03.04.05.06.07.0
Fin
lan
d
Au
stri
a
Sw
itze
rla
nd
Sw
ed
en
Cze
ch R
ep
ub
lic
Gre
ece
Est
on
ia
De
nm
ark
Slo
va
kia
No
rwa
y
Slo
ve
nia
Po
rtu
ga
l
Sp
ain
Ire
lan
d
Un
ite
d K
ing
do
m
Be
lgiu
m
Fra
nce
Ro
ma
nia
EU
27
Ice
lan
d
Lith
ua
nia
Cro
ati
a
Latv
ia
Po
lan
d
Ita
ly
Luxe
mb
ou
rg
Hu
ng
ary
Bu
lga
ria
Ne
the
rla
nd
s
Tu
rke
y*
Cy
pru
s
Ma
lta
Ma
ced
on
ia

MORE2 – Career paths Cross-Country Report
April 2013 45
which factors should be taken into account in their assessment, there was no at-tempt made to harmonize these assessments across countries.
Table 3.2.2: Share of countries and their rating for attractiveness of sectors for pursu-
ing a researcher career (N=47 countries22)
HES (N=43) GOV (N=41) BES (N=44) PNP (N=36)
Excellent 12% 4% 9% 0%
Good 67% 49% 49% 38%
Poor 21% 30% 32% 28%
Very Poor 0% 4% 4% 11%
Source: country fiches provided by country correspondents (Please note: country assessments are based on the view of individual country correspondents, no attempt has been made to harmonize answers for cross country comparisons); HES – Higher Education Sector, GOV – Government Sector, BES – Business Enterprise Sector, PNP – Private Non-Profit
According to Table 3.2.2, in the majority of countries the attractiveness of the HES, BES and the GOV sector for pursuing a researcher career is good, and in some countries, excellent. In general, the assessment between overall attractive-ness of the sectors and their long-term attractiveness for pursuing a researcher career (see Table 3.2.3) seem to coincide. However, some differences can be ob-served. While the assessment of the actual attractiveness of the HES sector is “good”, and in parts “excellent” for the majority of countries, the share of “good” and “excellent” values drop slightly and the “poor” ratings increase accordingly.
Table 3.2.3: Share of countries and their rating for long-term attractiveness of sectors
for pursuing a researcher career (N=47 countries20)
HES (N=44) GOV (N=40) BES (N=42) PNP (N=37)
Excellent 14% 5% 10% 3%
Good 57% 43% 55% 38%
Poor 30% 45% 33% 43%
Very Poor 0% 8% 2% 16%
Source: country fiches provided by country correspondents (Please note: country assessments are based on the view of individual country correspondents, no attempt has been made to harmonize answers for cross country comparisons)
3.2.3 The Higher Education Sector (HES)
3.2.3.1 Autonomy and organization of Higher Education Institutions (HEI)
In the various ministerial declarations relating to the Bologna process, academic freedom and autonomy and accountability of higher education institutions are un-derlined as principles of the European Higher Education Area (EHEA). Here, we used a framework introduced by Estermann et al. (2011) which is based on dif-ferentiating between four basic dimensions of autonomy which were introduced by the European University Association (EUA) in 2007: academic autonomy; fi-nancial autonomy; organizational autonomy and staffing autonomy23. Table 3.2.4 provides an overview of the issues in each of these four dimensions which should be considered when assessing HEIs’ degree of autonomy.
22 Please note: not all country correspondents provided the requested information. In each col-
umn the number of countries for which data is available is given. The shares are calculated not taking into account missing data.
23 EUA (2007): Lisbon declaration. Europe’s Universities beyond 2010: Diversity with a common purpose. http://www.eua.be/fileadmin/user_upload/files/Lisbon_Convention/Lisbon_Declaration.pdf

MORE2 – Career paths Cross-Country Report
April 2013 46
Table 3.2.4: Relevant issues to be considered for assessing the four basic HEI autono-
my categories
Organizational auton-omy
Financial autonomy Staffing autonomy Academic autonomy
− Selection procedure for the executive head
− Selection criteria for the executive head
− Dismissal of the exec-utive head
− Term of office of the executive head
− Inclusion and selec-tion of external members in govern-ing bodies
− Capacity to decide on academic structures
− Capacity to create legal entities
− Length and type of public funding
− Ability to keep surplus − Ability to borrow money
− Ability to own build-ings
− Ability to charge tui-tion fees for nation-al/EU students (BA, MA, PhD)
− Ability to charge tui-tion fees for non-EU students (BA, MA, PhD)
− Capacity to decide on recruitment proce-dures (senior academ-ic/senior administra-tive staff)
− Capacity to decide on salaries (senior aca-demic/ senior admin-istrative staff)
− Capacity to decide on dismissals (senior ac-ademic/senior admin-istrative staff)
− Capacity to decide on promotions (senior academic/senior ad-ministrative staff)
− Capacity to decide on overall student num-bers
− Capacity to select students (BA, MA)
− Capacity to introduce programmes (BA, MA, PhD)
− Capacity to terminate programmes
− Capacity to choose the language of in-struction (BA, MA)
− Capacity to select quality assurance mechanisms and pro-viders
− Capacity to design content of degree programmes
Source: Estermann et al. 2011, p. 20
Agreement seems to exist, to the greatest extent, with regard to the academic autonomy granted to the HEI. In more than a quarter of all countries included in our analysis, academic autonomy is “very high” and, in addition “high” in half of the countries (see Table 3.2.5). Moreover, staffing decisions are mainly at the discretion of the HEI; more than half of the countries grant” high” or “very high” autonomy in this regard. More restrictions seem to apply with regard to financial autonomy. Here, the share of countries granting “high” or even “very high” au-tonomy to their HEI is smallest. In the majority of the countries (almost half of all countries included), the degree of financial autonomy has been assessed as “mixed”. Organizational autonomy in almost half of the countries is either “high” or “very high”. Only very few countries seem to severely limit the decision-making power of their HEI in this respect, with the degree of autonomy being as-sessed as “low”.
Table 3.2.5: Share of countries and their rating by autonomy dimension (N=47 coun-
tries20)
Academic Au-tonomy (N=46)
Financial Au-tonomy (N=46)
Organizational Autonomy (N=47)
Staffing Au-tonomy (N=45)
Very High 28% 7% 19% 29%
High 50% 17% 30% 24%
Mixed 20% 48% 43% 31%
Low 2% 22% 6% 16%
Very Low 0% 7% 2% 0%
Source: country fiches provided by country correspondents, assessment by the individual country correspondents
With regard to the differentiation of HEI, we looked at two different dimensions: 1) the different forms of HEI across countries, regarding the tasks that the HEI fulfill; i.e. we differentiated between “teaching only institutions” and “teaching plus research institutions”;
2) the different internal organization models; i.e. the institute model (relatively few chair holders with many hierarchically subordinated assistants) or the de-partment model (high number of professors at different levels). In the majority of
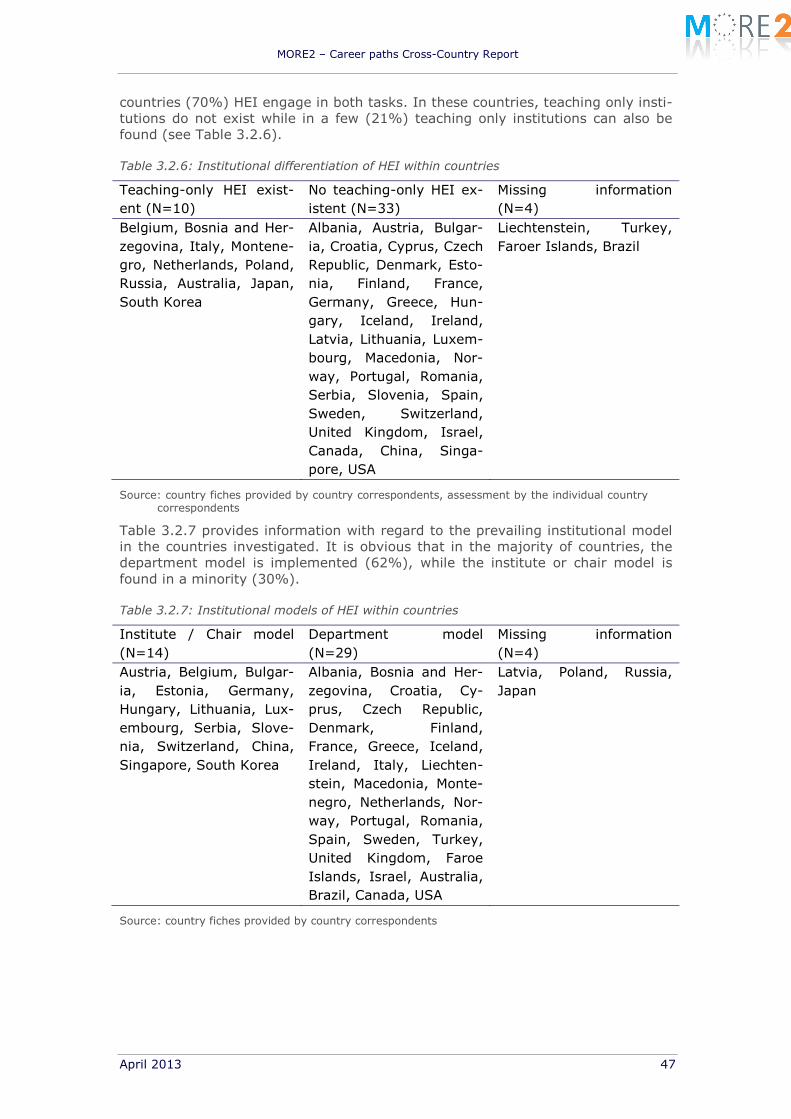
MORE2 – Career paths Cross-Country Report
April 2013 47
countries (70%) HEI engage in both tasks. In these countries, teaching only insti-tutions do not exist while in a few (21%) teaching only institutions can also be found (see Table 3.2.6).
Table 3.2.6: Institutional differentiation of HEI within countries
Teaching-only HEI exist-
ent (N=10)
No teaching-only HEI ex-
istent (N=33)
Missing information
(N=4)
Belgium, Bosnia and Her-
zegovina, Italy, Montene-
gro, Netherlands, Poland,
Russia, Australia, Japan,
South Korea
Albania, Austria, Bulgar-
ia, Croatia, Cyprus, Czech
Republic, Denmark, Esto-
nia, Finland, France,
Germany, Greece, Hun-
gary, Iceland, Ireland,
Latvia, Lithuania, Luxem-
bourg, Macedonia, Nor-
way, Portugal, Romania,
Serbia, Slovenia, Spain,
Sweden, Switzerland,
United Kingdom, Israel,
Canada, China, Singa-
pore, USA
Liechtenstein, Turkey,
Faroer Islands, Brazil
Source: country fiches provided by country correspondents, assessment by the individual country correspondents
Table 3.2.7 provides information with regard to the prevailing institutional model in the countries investigated. It is obvious that in the majority of countries, the department model is implemented (62%), while the institute or chair model is found in a minority (30%).
Table 3.2.7: Institutional models of HEI within countries
Institute / Chair model
(N=14)
Department model
(N=29)
Missing information
(N=4)
Austria, Belgium, Bulgar-
ia, Estonia, Germany,
Hungary, Lithuania, Lux-
embourg, Serbia, Slove-
nia, Switzerland, China,
Singapore, South Korea
Albania, Bosnia and Her-
zegovina, Croatia, Cy-
prus, Czech Republic,
Denmark, Finland,
France, Greece, Iceland,
Ireland, Italy, Liechten-
stein, Macedonia, Monte-
negro, Netherlands, Nor-
way, Portugal, Romania,
Spain, Sweden, Turkey,
United Kingdom, Faroe
Islands, Israel, Australia,
Brazil, Canada, USA
Latvia, Poland, Russia,
Japan
Source: country fiches provided by country correspondents

MORE2 – Career paths Cross-Country Report
April 2013 48
3.2.3.2 Training and qualification
With the Bologna declaration24 in 1999, the Bologna process aimed to modernize European higher education. In 2010, the European Higher Education Area was officially launched25. With the aim of improving the competitiveness of European Higher Education, a transparent and comparable system of academic degrees was to be introduced; the mobility of students and researchers to be promoted; and high quality training to be ensured (Bologna declaration 1999). The progress made and problems faced in this process have been analyzed and documented in various reports. It has been shown that the degree of implementation varies in the individual countries (see Budapest-Vienna declaration 2010). As regards doc-toral training, differences are still obvious. Within the context of the MORE2 study, we asked the country correspondents to provide information concerning PhD training. In particular, we asked which institutions provide respective training and award doctoral degrees and – if existent - further academic degrees and to what extent structural PhD programs have been introduced. In addition and with regard to career progression we asked at what age on average a) PhD candidates graduate, b) researchers obtain their first permanent position, c) obtain tenure and d) obtain a professorial position.
Universities are the predominant institutions awarding academic degrees. In more than two thirds of the countries only universities award doctoral degrees, and if required, consecutive degrees and / or qualifications. In 10 countries (see Table 3.2.8) other kinds of institutions universities are granting doctorate degrees.
Table 3.2.8: Countries where other institutions besides universities are granting aca-
demic degrees / qualifications
Countries where also non-university institutions are granting academic degrees / qualifications
Doctorates Consecutive degrees / qualifications Belgium, Bosnia and Herzegovina, Denmark, Ireland, Luxembourg, Roma-nia, Russia, Switzerland, Brazil, China
Bulgaria, Russia, Spain
Source: country fiches provided by country correspondents
In the majority of countries (33 out of 47 countries, 70%), academic degrees or qualifications beyond the doctorate are not a required precondition for pursuing a researcher career. However, in four countries - while not mandatory - the tradi-tion to pursue this kind of further qualification (such as the habilitation in Germa-ny) still exists (see Table 3.2.9). In 28% of the countries (13 out of 47, see Table 3.2.9) it is a mandatory precondition26. Again, it is primarily universities which are awarding these degrees / qualifications (see Table 3.2.9 for countries where also non-university institutions grant academic degrees / qualifications).
24 http://www.bologna-bergen2005.no/Docs/00-Main_doc/990719BOLOGNA_DECLARATION.PDF 25 http://www.ehea.info/Uploads/news/Budapest-Vienna_Declaration.pdf 26 Information on one country (2.2%) the information is not specified.

MORE2 – Career paths Cross-Country Report
April 2013 49
Table 3.2.9: Countries with consecutive academic degrees beyond the doctorate
Consecutive degree / qualification re-quired
Consecutive degree / qualification not required but tradition
Bulgaria, Czech Republic, France, Hun-gary, Italy, Liechtenstein, Lithuania, Poland, Romania, Russia, Slovenia, Spain, Switzerland
Austria, Germany, Sweden, Brazil
Source: country fiches provided by country correspondents
The picture across countries with regard to the form in which doctoral education is offered is ambiguous and, not only in Europe. Doctoral training is provided ei-ther in structured programs or as individually supervised doctorate. In the majori-ty of countries structural PhD training is not mandatory (see Figure 3.2.13). How-ever, often it is the predominant form doctoral education takes (see Table 3.2.10).
Table 3.2.10: Relevance of structured PhD training programs (N=47)
Share of countries where structured PhD training programs are mandatory
Share of countries where structured PhD training programs are predominant
43% 66%
Source: country fiches provided by country correspondents
Figure 3.2.13: Implementation of structured PhD training programs
Data: based on country fiches provided by MORE2 network of national experts

MORE2 – Career paths Cross-Country Report
April 2013 50
Also with regard to the age at which a doctorate is obtained, we observe varia-tions across countries. Graduating at an average age of 30 years or younger is the exception (see Table 3.2.11). In most countries, graduates are on average between 31 and 34 years old. Particularly in the Nordic countries, the doctorate is obtained somewhat later, on average between the ages of 35 and 37. In Brazil, Israel and South Korea PhD graduates are, on average, older than 38 years.
Table 3.2.11: Average age range for obtaining a PhD
≤30 year 31-34 35-37 ≥38 year
Belgium, Cyprus,
Ireland, Lithuania,
Luxembourg, Ser-
bia, United King-
dom
Albania, Australia,
Austria, Bulgaria,
Canada, China,
Czech Republic,
Denmark, France,
Germany, Greece,
Italy, Japan, Neth-
erlands, Poland,
Spain, Switzer-
land, Turkey, USA
Croatia, Estonia,
Finland, Hungary,
Iceland, Montene-
gro, Norway, Por-
tugal, Romania,
Slovenia, Sweden
Brazil, Israel,
South Korea
Data: based on country fiches provided by MORE2 network of national experts
3.3 General description of career paths and working
conditions
In this section general features, which are characteristic for the various positions available, will be described. In particular the focus will be on: the type and length of contracts, the status and the degree of autonomy granted to the individuals holding a position. In addition, the relevance of mobility for researcher careers will be tackled as well as the extent to which performance assessments are im-plemented in the decision-making process regarding career progression.
Not surprisingly, as career stages progress, the share of countries awarding per-manent positions to the holders of the respective positions is also increasing (see Table 3.3.1). In the vast majority of the countries, researchers at the beginning of their careers are offered only temporary contracts, while researchers holding positions in the R4 career stage are primarily awarded permanent positions.
Table 3.3.1: Type of contract awarded by career stage (total N=47 countries20)
Career stage Temporary con-
tracts only
Permanent con-
tracts only
Either permanent
or temporary
contracts
R1 (N=46) 91% 9% 0%
R2 (N=44) 80% 16% 5%
R3 (N=45) 33% 53% 13%
R4 (N=43) 16% 77% 7%
Data: based on country fiches provided by MORE2 network of national experts

MORE2 – Career paths Cross-Country Report
April 2013 51
Temporary contracts differ in terms of their length. We asked for the average du-ration of these contracts, differentiating by career stage and between four differ-ent duration ranges.
Methodological Remark
Country correspondents were asked to provide information on all positions that
are available in the academic system at each of the career stages. In general,
there is more than just one position assigned to a career stage. Across all coun-
tries and career stages information has been provided on 246 positions (R1=62
positions; R2=67 positions; R3=63 positions; R4=54 positions). When calculating
shares, the basis for calculation is not the number of countries but the number of
different positions, employment status etc. identified. Still, due to lacking data
about the number of researchers per position and per career stage, this proce-
dure does not allow an estimation as regards the number of researchers holding
these positions or positions with a specific characteristic (such as employment
status). In addition, not all information requested was provided for each position.
When calculating shares, the missing data was disregarded but, in any, case the
total number of positions taken into account when calculating shares is provided
(N=…) in the tables or graphs.
Based on the analysis of all positions related to the four career stages that were identified, we can see that not only the share of permanent positions is increasing along the career path but, also, that increasingly longer lasting contracts are pro-vided (see Figure 3.3.1). In particular, R1 and R2 positions are based on rather short running contracts to a significant extent (i.e. contracts of more than one quarter of these positions lasts only up to two years). R1 positions also involve a significant share of contracts lasting between 2 and 4 years and thus, could last approximately for the expected average length of the PhD phase.

MORE2 – Career paths Cross-Country Report
April 2013 52
Figure 3.3.1: Length of contracts offered by career stage (% of all positions within a
career stage across all countries27)
Data: based on country fiches provided by MORE2 network of national experts
Figure 3.3.2 reflects the employment status related to the positions held by re-searchers. Again, the calculation is based on the number of different options re-lated to the various positions named by the country correspondent and multiple employment options can be assigned to a position. Also in this context, progres-sion along the career path becomes obvious. Most positions, no matter at which career stage, are potentially employee positions, as shown before, with different conditions as regards length of contracts. The share of positions that can be granted civil servant status increases by career stage and is highest at the R4 level. Grant holders can be found across all career stages. Also at the R1 level the majority of researcher positions can be granted as employee positions - here ap-prox. 27% of the positions are assigned student status, and 13% are grant holder positions. Student positions can still be found at the R2 level, but to a lesser ex-tent, while the share of grant holder positions remains at the same level.
27 Please note: missing data has been disregarded for calculating shares reflected in the graph.
Total N gives the information on positions for which data has been provided by the country correspondents.
17
5 5
17
25
2
11
39
30
9
20
19
25
35
12
23
915
53
84
39
0 2 2 1
0%
10%
20%
30%
40%
50%
60%
70%
80%
90%
100%
R1 (N=54) R2 (N=60) R3 (N=57) R4 (N=49) Total (N=220)
Fixed <1 year Fixed 1-2 years Fixed 2-4 years Fixed >4 years Permanent Other

MORE2 – Career paths Cross-Country Report
April 2013 53
Figure 3.3.2: Status of individuals holding a position by career stage (% of all options
offered with the positions available25)
Data: based on country fiches provided by MORE2 network of national experts
In most countries, funding for the majority of researchers at all career stages comes from block funding (see Table 3.3.2). This share is highest for positions at the R4 level and lowest at the R2 level.
Table 3.3.2: Source of financing for positions by career stage (N=4720)
R1 (N=44) R2 (N=46) R3 (N=47) R4 (N=47)
Majority funded by
block funding
27
(61%)
26
(57%)
34
(72%)
36
(77%)
Majority funded by
competitive funding
4
(9%)
5
(11%)
2
(4%)
1
(2%)
Balance between
block and competitive
funding
7
(16%)
6
(13%)
4
(9%)
3
(6%)
Either block or com-
petitive funding
2
(5%)
3
(7%)
2
(4%)
0
(0%)
Not specified 4
(9%)
6
(13%)
5
(11%)
7
(15%)
Data: based on country fiches provided by MORE2 network of national experts
There are, however, a few countries where the majority of researchers at each career stage are financed by competitive funding:
At the R1 level: Albania, Australia, Iceland, Portugal,
at the R2 level: Belgium, Iceland, Ireland, Romania, United Kingdom,
at the R3 level: Albania, Sweden and
1121
3342
25
49
60
6054
55
13
13
7 5
1027
7 101 0
0%
10%
20%
30%
40%
50%
60%
70%
80%
90%
100%
R1 (N=94) R2 (N=88) R3 (N=76) R4 (N=65) Total (N=323)
Civil servant Employee Grant holder Student Other

MORE2 – Career paths Cross-Country Report
April 2013 54
at the R4 level: Netherlands.
While tenure track options are already provided for positions available at the R1 and R2 level, these become more common at the R3 and R4 level (see Figure 3.3.3). Here, the majority of the positions provided (more than 70 percent) offer tenure track options. At first sight, it might be surprising that at the R4 level the share of positions providing tenure track options is not considerably higher than is the case at the R3 level. But when looking at the issue of career reliability, the information about permanent positions also needs to be taken into account and their share is higher at the R4 level (see Table 3.3.3). While also at the R3 level the majority of positions are either permanent or with tenure track option, the higher share of the latter taken together with the higher share of temporary posi-tions that do not offer tenure track options, inherently includes a higher risk with regard to whether or not a career can be sustainably pursued in academia.
Figure 3.3.3: Share of positions offering tenure track by career stage (% of all posi-
tions named25)
Data: based on country fiches provided by MORE2 network of national experts
77
63
27 26
50
23
37
73 74
50
0%
10%
20%
30%
40%
50%
60%
70%
80%
90%
100%
R1 (N=60) R2 (N=65) R3 (N=59) R4 (N=47) Total (N=231)
No Yes
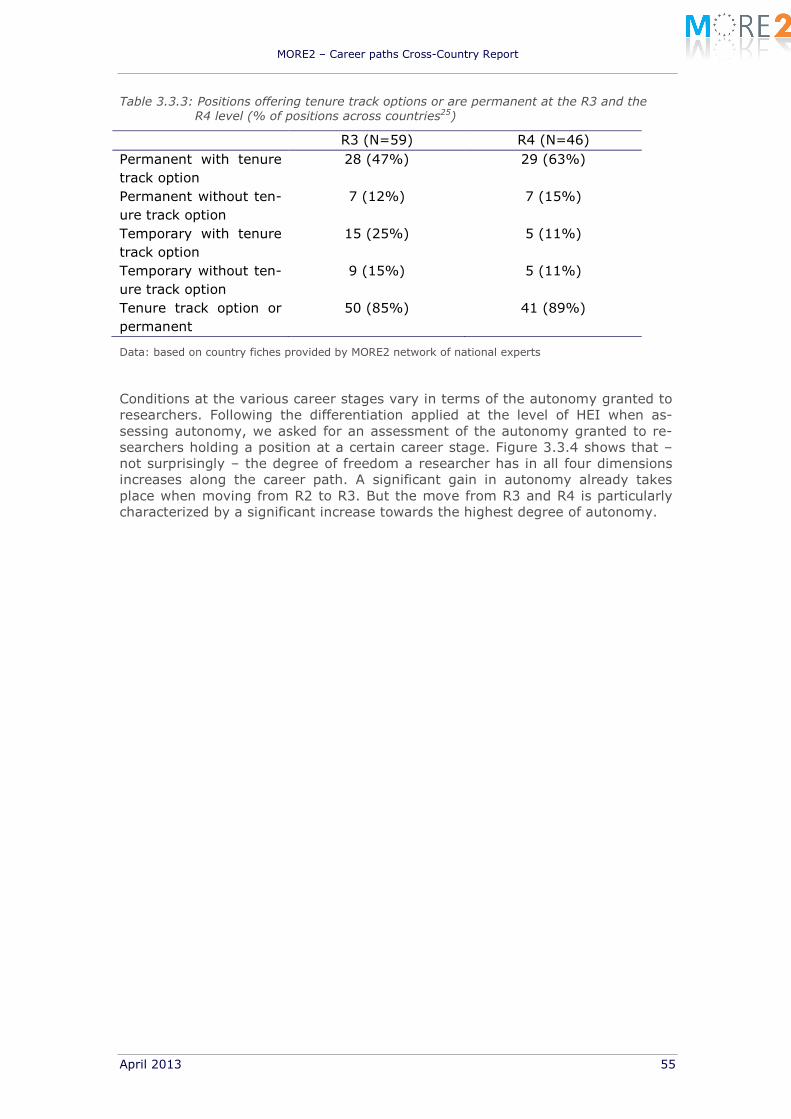
MORE2 – Career paths Cross-Country Report
April 2013 55
Table 3.3.3: Positions offering tenure track options or are permanent at the R3 and the
R4 level (% of positions across countries25)
R3 (N=59) R4 (N=46)
Permanent with tenure
track option
28 (47%) 29 (63%)
Permanent without ten-
ure track option
7 (12%) 7 (15%)
Temporary with tenure
track option
15 (25%) 5 (11%)
Temporary without ten-
ure track option
9 (15%) 5 (11%)
Tenure track option or
permanent
50 (85%) 41 (89%)
Data: based on country fiches provided by MORE2 network of national experts
Conditions at the various career stages vary in terms of the autonomy granted to researchers. Following the differentiation applied at the level of HEI when as-sessing autonomy, we asked for an assessment of the autonomy granted to re-searchers holding a position at a certain career stage. Figure 3.3.4 shows that – not surprisingly – the degree of freedom a researcher has in all four dimensions increases along the career path. A significant gain in autonomy already takes place when moving from R2 to R3. But the move from R3 and R4 is particularly characterized by a significant increase towards the highest degree of autonomy.

MORE2 – Career paths Cross-Country Report
April 2013 56
Figure 3.3.4: Autonomy in four dimensions granted to researchers by career stage25
Source: country fiches provided by country correspondent
45
17
84
61
20
8
85
67
136
86
67
17
4
32
17
2
11
7
7
2
9
9
13
2
9
11
9
8
17
38
30
8
5
28
45
27
6
16
48
39
5
17
47
35
3
22
48
48
03
21
33
0
7
20
29
3
21
27
3 6
22
42
27
29
26
24
27
27
0%
10%
20%
30%
40%
50%
60%
70%
80%
90%
100%
R 1
(N=54)
R 2
(N=57)
R 3
(N=54)
R4
(N=49)
R 1
(N=54)
R 2
(N=57)
R 3
(N=54)
R4
(N=49)
R 1
(N=54)
R 2
(N=57)
R 3
(N=54)
R4
(N=49)
R 1
(N=54)
R 2
(N=57)
R 3
(N=54)
R4
(N=49)
acdemic financial organisational staffing
very low low mixed high very high

MORE2 – Career paths Cross-Country Report
April 2013 57
At what age is a specific career stage is typically obtained? And how fast can a researcher progress across the four career stages? Table 3.3.4 and Table 3.3.5, respectively, provide aggregated information across countries and country specific information. Table 3.3.5 highlights typical career progression by country. In more than half of the countries considered, researchers enter the R1 stage before the age of 30, another quarter at the mid-thirties. The “speed” of progressing along the career path differs between countries. Career progression can be particularly fast and starts at an early age in Serbia and Turkey. In contrary, in Israel and Brazil, researchers start at a comparatively advanced age and, thus, enter the following career levels with a respective “age delay”. Differences among countries also seem to exist with regard to the time a researcher remains at a certain level. Delays can occur moving between any of the four age groups: between R1 and the R2 (Bosnia and Herzegovina, Croatia, Finland, Portugal, Spain), between R2 and R3 (Austria, Bulgaria, Ireland, Italy, Netherlands, Switzerland, United King-dom, USA) and between R3 and R4 (Cyprus, Lithuania, Portugal) (delay here seen as a entering the next level not at an age falling in the directly successive age group).
Table 3.3.4: Age at which a position in the respective career stage is typically reached
(% of countries) (N=4720)
R1 (N=39) R2 (N=37) R3 (N=34) R4 (N=35)
<30 64% 16% 0% 0%
31-35 28% 49% 15% 0%
36-40 3% 30% 44% 6%
41-45 5% 3% 35% 29%
46-50 0% 3% 3% 46%
51-55 0% 0% 3% 14%
56-60 0% 0% 0% 6%
Data: based on country fiches provided by MORE2 network of national experts

MORE2 – Career paths Cross-Country Report
April 2013 58
Table 3.3.5: Typical age at which a position in respective career stage is obtained by country
Age range R1 R2 R3 R4
≤30 year Australia, Austria, Belgium, Bosnia
and Herzegovina, Croatia, Canada,
Cyprus, Czech Republic, Denmark,
Estonia, Finland, Germany, Hungary,
Ireland, Italy, Latvia, Lithuania,
Netherlands, Portugal, Serbia,
Spain, Switzerland, Turkey, United
Kingdom, USA
Belgium, Cyprus, Ireland, Lithuania,
Netherlands, United Kingdom
31-35 Albania, Bulgaria, Iceland, Japan,
Luxembourg, Montenegro, Norway,
Poland, Slovenia, South Korea,
Sweden,
Australia, Austria, Bulgaria, Canada,
China, Czech Republic, Denmark,
Estonia, France, Germany, Hungary,
Italy, Luxembourg, Serbia, Slovenia,
Switzerland, Turkey, USA
Canada, Cyprus, France, Lithuania,
Turkey
36-40 Romania Bosnia and Herzegovina, Croatia,
Finland, Iceland, Japan, Montene-
gro, Poland, Portugal, South Korea,
Spain, Sweden,
Albania, Australia, Bosnia and Her-
zegovina, Czech Republic, Denmark,
Estonia, Germany, Ireland, Japan,
Netherlands, Serbia, Slovenia, South
Korea, Spain, United Kingdom
Serbia, Turkey
41-45 Brazil, Israel, Israel Austria, Bulgaria, Croatia, Finland,
Hungary, Italy, Luxembourg, Mon-
tenegro, Portugal, Sweden, Switzer-
land, USA
Australia, Cyprus, Estonia, France,
Germany, Hungary, Ireland, Luxem-
bourg, Slovenia, United Kingdom
46-50 Brazil Israel Bosnia and Herzegovina, Bulgaria,
China, Czech Republic, Denmark,
Finland, Japan, Latvia, Lithuania,
Montenegro, Netherlands, Romania,
Spain, South Korea, Sweden, USA
51-55 Brazil Croatia, Israel, Italy, Poland, Portu-
gal,
56-60 Brazil, Russia
Data: based on country fiches provided by MORE2 network of national experts

MORE2 – Career paths Cross-Country Report
April 2013 59
We also asked the country correspondents about selection procedures for filling researcher positions. In general terms, researcher positions are advertised, but the level at which this is done differs, however, between countries (see Table 3.3.6). While in a number of countries positions have to be advertised at least at the institutional level, in the majority of countries they are advertised at least na-tionally. Internationally advertising researchers’ positions is not yet a required standard procedure.
Table 3.3.6: Channels for advertising researcher positions
Institutional National International
Albania, Canada, Cyprus,
Denmark, Estonia, Faroe
Islands, Finland, Germa-
ny, Greece, Liechten-
stein, Romania, Russia,
Singapore, Slovenia,
Sweden, USA
Australia, Bosnia and
Herzegovina, Brazil, Bul-
garia, China, Croatia,
Czech Republic, France,
Hungary, Israel, Italy,
Japan, Latvia, Lithuania,
Luxembourg, Macedonia,
Montenegro, Netherlands,
Poland, Portugal, Serbia,
South Korea, Spain,
Switzerland
Austria, Belgium, Iceland,
Ireland, Norway, United
Kingdom
Data: based on country fiches provided by MORE2 network of national experts
While in the majority of countries this is not the case, in Austria, Bulgaria, Czech Republic, Greece, Hungary, Italy, Romania, Serbia, Brazil, Canada selection crite-ria for selecting researchers are legally predefined.
In the majority of countries, career progression depends on researchers’ perfor-mance. The extent to which performance influences career progression differs among countries. While in Albania, Bosnia and Herzegovina, Bulgaria, Canada, France, Germany, Greece, Italy the system is characterized by at least “some performance orientation”. In the majority of countries (Austria, Belgium, Cyprus, Czech Republic, Denmark, Estonia, Faroe Islands, Finland, Iceland, Ireland, Isra-el, Japan, Latvia, Liechtenstein, Macedonia, Montenegro, Netherlands, Norway, Poland, Portugal, Serbia, Singapore, Slovenia, South Korea, Spain, Switzerland, Turkey, United Kingdom, USA) career progression is particularly dependent on the researchers’ performance.
In more than one third of the countries, international mobility meanwhile is a pre-requisite for pursuing an academic career. In additionally 17% of the countries this is at least the case in selected areas. In approximately one quarter of coun-tries, international mobility is not a required feature for pursuing a researcher ca-reer (see Table 3.3.7). National schemes to support and enhance international mobility have been introduced in 45% of the countries investigated (see Table 3.3.8 for the countries). In approx. as many countries, no specific national schemes exist but the support for international mobility depends on the schemes implemented at the European level.

MORE2 – Career paths Cross-Country Report
April 2013 60
Table 3.3.7: Is International mobility a prerequisite for pursuing a research career?
Yes 16
(34%)
No 13
(28%)
In certain areas 8
(17%)
Missing 10
(21%)
Data: based on country fiches provided by MORE2 network of national experts
Table 3.3.8: Countries where International mobility is a pre-requisite for a researcher’s
career
International mobility is a pre-requisite for a researcher’s career:
Yes In certain areas No
Albania, Austria, Bulgar-
ia, Denmark, Macedonia,
Germany, Hungary, Lux-
embourg, Slovenia,
Spain, Switzerland, Tur-
key, Faroe Islands, Isra-
el, China, South Korea
Belgium, Croatia, France,
Greece, Italy, Montene-
gro, Netherlands, Russia
Belgium, Croatia, Cyprus,
Czech Republic, Estonia,
France, Greece, Italy,
Liechtenstein, Lithuania,
Montenegro, Netherlands,
Poland, Portugal, Roma-
nia, Russia, United King-
dom, Canada, Japan,
Singapore, USA
Based on the data presented so far, at first sight, the general picture across countries with regard to the conditions for pursuing research careers appears to be rather scattered. We will address in the following sections whether we can identify groups of countries with commonalities in terms of working conditions
3.4 Country classification for each career stage
Academic careers develop in stages, but do these career stages mean the same for all academics around the world? We can raise doubts about this assumption because already at the first career stage we know that doctoral education or early research training phases are organized differently in different countries. Our aim with the analysis per career stage is threefold: 1) to group countries according to their characteristics per career stages, 2) to identify factors that present the main dividing line between countries and 3) to generate a perspective on the sequence, timing and likelihood of academic careers by covering all career stages.
In section 3.4.1, we present the country comparisons for each career stage and in section 3.4.2 an overall perspective on all four career stages is derived. The methods used to generate the cluster solutions are described in section 3.1.4.

MORE2 – Career paths Cross-Country Report
April 2013 61
3.4.1 Analysis for each career stage
3.4.1.1 Career stage R1
The main features of career stage R1 can be described as follows: In general, at this stage we find young researchers aged 30 years or even younger who are employed based on block-funded temporary contracts. Their autonomy is rather low and tenure-track options hardly exist.
The cluster analysis resulted in a five cluster solution that provides the best fit when we distinguish between the countries on the basis of the conditions granted to researchers at this stage (see Table 3.4.1)28. In the following, the specificities reflected will be briefly discussed.
Cluster R1.1 contains 19 countries and the basic conditions for researchers fit the general characteristics described above. Typical for countries in this cluster is that researchers have both teaching and research obligations.
Cluster R1.2 covers 14 countries; again the main characteristics correspond to those outlined above. In contrast to cluster R1.1 researchers in these countries primarily engage in research only activities rather than in both types of academic activities.
Cluster R1.3 comprises six countries. The general characteristics are again in line with those described above. However, the distinguishing characteristic is that re-searchers may be already granted a tenure track-option.
Five countries are included in cluster R1.4. Unfortunately, the common feature for these countries is that important information allowing these countries to be as-signed to any of the other clusters is missing. Thus, this cluster does not reveal any additional distinctive category of countries.
Cluster R1.5 contains three countries and the distinguishing factor is the type of contract which is offered to the researchers at this stage. In these countries, R1-stage researchers already have permanent contracts. Furthermore, the research-ers are comparably old (41-45 years of age), they engage in teaching and re-search activities, and their positions are, as was already described as a main fea-ture for the R1 stage, funded by block funding.
Our five clusters point to few specific characteristics that differentiate the groups of countries. Moreover, three of the five clusters (clusters R1.3-R1.5) contain ra-ther small numbers of countries. It can be concluded that the main features of the R1 level are rather similar: a limited number of countries differ with regard to a limited number of characteristics.
The classification of countries into a cluster does not correspond with countries’ belonging to certain world region or other possible traditional influences such as Commonwealth membership. Non-European countries are not more prominent in one of these clusters. Within Europe one pattern may be worth noting however: Southern European countries such as France, Spain, Italy and Portugal are classi-fied in cluster 2, thus, researchers at the R1 level in these countries are focusing more prominently on research-only tasks. The only exception among the South-ern European countries is Greece, which belongs to cluster R1.1.
The assignment of countries to the five clusters is given in Table 3.4.1.
28 The process to determine the number of clusters suitable for a career stage contains two stag-es: 1) we identify the best solutions suggested in statistical terms by the Calinski/Harabasz pseudo-F parameter. 2) We verify that this solution provides us with meaningful differences between clusters and that the number does not exceed the number of variables chosen.

MORE2 – Career paths Cross-Country Report
April 2013 62
Table 3.4.1: Short description of R1-career stage cluster solution29
Cluster Characteristics Number of countries
Countries
R1.1
under 30 -35 years, tempo-rary contracts, mostly re-search and teaching orient-ed, low level of autonomy, mostly block funded, no tenure-track option
19 Albania, Bulgaria, Czech Republic, Denmark, Germany, Greece, Iceland, Ireland, Latvia, Lithuania, Luxem-bourg, Poland, Slovenia, Sweden, Switzerland, United Kingdom, Cana-da, Singapore, USA
R1.2
mostly under 30 years, temporary contracts, re-search oriented, low level of autonomy, mostly block funded, no tenure-track option
14 Austria, Belgium, Croatia, Finland, France, Italy, Montenegro, Norway, Portugal, Spain, Turkey, Australia, Japan, South Korea
R1.3
under 30 years, temporary contracts, research and/or teaching oriented (equally distributed), low level of autonomy, block funded, tenure-track option
6 Bosnia and Herzegovina, Cyprus, Es-tonia, Hungary, Netherlands, Serbia
R1.4 Missing information 5 Macedonia, Liechtenstein, Russia, Faroe Islands, China
R1.5
36-45 years, permanent contracts, research and teaching oriented, low to middle level of autonomy, mostly block funded, ten-ure-track option
3 Romania, Israel, Brazil
3.4.1.2 Career stage R2
The main features of career stage R2 can be described as follows: mainly re-searchers in their early 30s who are employed on block-funded temporary con-tracts, engaged in both teaching and research tasks and having a low level of au-tonomy.
At career stage R2 a five cluster solution also provides the best fit for distinguish-ing between the countries’ conditions of researchers in this stage (see Table 3.4.2)30. In the following, the corresponding specificities will be briefly discussed.
Cluster R2.1 contains 16 countries; R2-researchers fit the general R2-stage char-acteristics described above. In addition the common feature for these countries is that researchers at the R2 stage are not offered a tenure-track option.
Cluster R2.2 includes 13 countries; R2-researchers possess the general R2-stage characteristics described above. In contrast to the Cluster R.2.1 in these countries R2-researchers are offered a tenure-track option31.
Cluster R2.3 includes seven countries; R2-researchers differ from the general R2-stage characteristics in terms of their age, funding regime and task division. Re-searchers in these countries obtain a position at the R2 stage comparatively late, namely in their mid to late 30s, they are more frequently exposed to competitive
29 The descriptive statistics for each cluster by variable used to classify countries are presented in the appendix 7.1.1.
30 The process to determine the number of clusters suitable for a career stage contains two stag-es: 1) We identify the best solutions suggested in statistical terms by the Calinski/Harabasz pseudo-F parameter. 2) We verify that this solution provides us with meaningful differences between clusters and that the number does not exceed the number of variables chosen.
31 Three countries classified into this Cluster R2.2 do not provide a tenure-track option at this career stage.
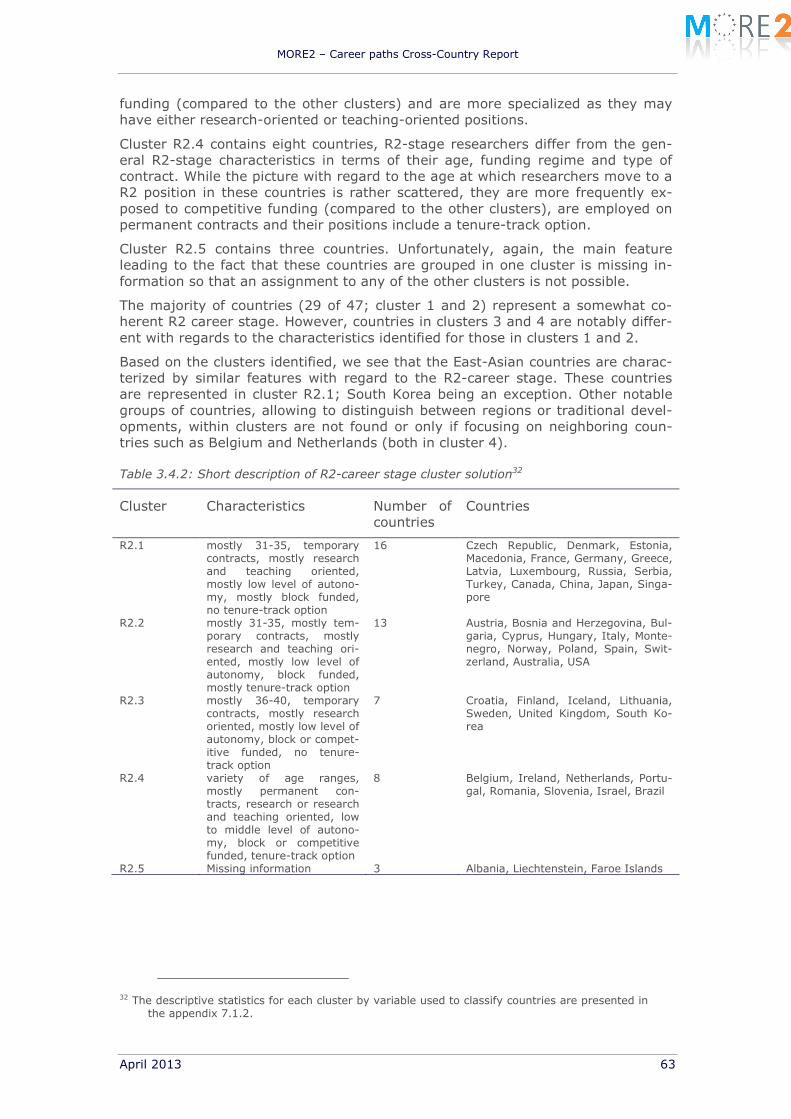
MORE2 – Career paths Cross-Country Report
April 2013 63
funding (compared to the other clusters) and are more specialized as they may have either research-oriented or teaching-oriented positions.
Cluster R2.4 contains eight countries, R2-stage researchers differ from the gen-eral R2-stage characteristics in terms of their age, funding regime and type of contract. While the picture with regard to the age at which researchers move to a R2 position in these countries is rather scattered, they are more frequently ex-posed to competitive funding (compared to the other clusters), are employed on permanent contracts and their positions include a tenure-track option.
Cluster R2.5 contains three countries. Unfortunately, again, the main feature leading to the fact that these countries are grouped in one cluster is missing in-formation so that an assignment to any of the other clusters is not possible.
The majority of countries (29 of 47; cluster 1 and 2) represent a somewhat co-herent R2 career stage. However, countries in clusters 3 and 4 are notably differ-ent with regards to the characteristics identified for those in clusters 1 and 2.
Based on the clusters identified, we see that the East-Asian countries are charac-terized by similar features with regard to the R2-career stage. These countries are represented in cluster R2.1; South Korea being an exception. Other notable groups of countries, allowing to distinguish between regions or traditional devel-opments, within clusters are not found or only if focusing on neighboring coun-tries such as Belgium and Netherlands (both in cluster 4).
Table 3.4.2: Short description of R2-career stage cluster solution32
Cluster Characteristics Number of countries
Countries
R2.1
mostly 31-35, temporary contracts, mostly research and teaching oriented, mostly low level of autono-my, mostly block funded, no tenure-track option
16 Czech Republic, Denmark, Estonia, Macedonia, France, Germany, Greece, Latvia, Luxembourg, Russia, Serbia, Turkey, Canada, China, Japan, Singa-pore
R2.2
mostly 31-35, mostly tem-porary contracts, mostly research and teaching ori-ented, mostly low level of autonomy, block funded, mostly tenure-track option
13 Austria, Bosnia and Herzegovina, Bul-garia, Cyprus, Hungary, Italy, Monte-negro, Norway, Poland, Spain, Swit-zerland, Australia, USA
R2.3
mostly 36-40, temporary contracts, mostly research oriented, mostly low level of autonomy, block or compet-itive funded, no tenure-track option
7 Croatia, Finland, Iceland, Lithuania, Sweden, United Kingdom, South Ko-rea
R2.4
variety of age ranges, mostly permanent con-tracts, research or research and teaching oriented, low to middle level of autono-my, block or competitive funded, tenure-track option
8 Belgium, Ireland, Netherlands, Portu-gal, Romania, Slovenia, Israel, Brazil
R2.5 Missing information 3 Albania, Liechtenstein, Faroe Islands
32 The descriptive statistics for each cluster by variable used to classify countries are presented in
the appendix 7.1.2.

MORE2 – Career paths Cross-Country Report
April 2013 64
3.4.1.3 Career stage R3
In career stage R3, we identify a clear dividing line between countries regarding type of contract, task division and level of researchers’ autonomy (see Table 3.4.3)33. As such, there are no main features characterizing this career stage and no general description can be outlined. The cluster analysis leads to a four cluster solution, with one cluster again being formed due to missing data (Cluster R3.2). A dividing line is drawn between cluster R3.1 on the one side and clusters R3.3 and R3.4 on the other side.
In cluster R3.1, we find 15 countries where the R3-career stage is characterized by block funded temporary contracts34, low levels of researcher autonomy, and positions focusing either on research or teaching. With regard to whether or not the positions offer tenure track-options, the picture is inconsistent, as some coun-tries in this cluster do offer a tenure-track option35 but others do not36.
Cluster R3.3, contains 16 countries where the R3-career stage is characterized by (in most cases) block-funded contracts, mostly with tenure-track options, middle to high level of researchers’ autonomy and in most countries researchers engage in research as well as teaching. This cluster is not consistent regarding the type of contract: In five countries of R3.3 cluster positions appointed with temporary con-tracts37, in four countries positions with either temporary or permanent contracts can be found38 and in seven countries these positions offer permanent con-tracts39.
Cluster R3.4, contains 12 countries where the R3-career stage is characterized by block-funded permanent contracts, middle to high levels of researcher autonomy and researchers engaging in research and teaching. The major differences to cluster R3.3 is that in cluster R3.4 all countries provide permanent contracts to their R3 career stage researchers. Moreover, these positions tend to be obtained slightly later, namely when researchers are already in their early forties whereas in cluster R3.3 researchers tend to gain these positions in their late thirties.
Cluster R3.1 contains many countries from the former Republic of Yugoslavia, with the exception of Slovenia and other Eastern European countries such as Rus-sia, Albania and Estonia. In addition, three of the four Eastern Asian countries be-long to cluster R3.1. Other notable groups of countries which could allow us to distinguish between regions or traditional developments, were not identified.
33 The process to determine the number of clusters suitable for a career stage contains two stag-
es: 1) We identify the best solutions suggested in statistical terms by the Calinski/Harabasz pseudo-F parameter. 2) We verify that this solution provides us with meaningful differences between clusters and that the number does not exceed the number of variables chosen.
34 In Albania, Liechtenstein, Romania and United Kingdom R3-career stage researchers have per-manent contracts.
35 These countries are: Bosnia and Herzegovina, Croatia, Liechtenstein, Montenegro, Romania, Serbia, Israel and Singapore.
36 These countries do not offer a tenure-track option: Albania, Estonia, Former Yugoslav Republic of Macedonia, Russia, United Kingdom, China and South Korea.
37 The countries in cluster R3.3 with temporary contracts are: Cyprus, Germany, Lithuania, Aus-tralia and Japan.
38 The countries in cluster R3.3 with positions with temporary or permanent contracts are: Ire-land, Sweden, Canada and USA.
39 The countries in cluster R3.3 with permanent contracts are: Czech Republic, Denmark, Nether-lands, Slovenia, Spain, Turkey and Brazil.

MORE2 – Career paths Cross-Country Report
April 2013 65
Table 3.4.3: Short description of R3-career stage cluster solution40
Cluster Characteristics Number of countries
Countries
R3.1
majority is between 36 and 45 years old, mostly tempo-rary contracts; research or teaching; mostly low level of autonomy; tenure-track option and no tenure-track option, block funding
15 Albania, Bosnia and Herzegovina, Croatia, Estonia, Macedonia, Liech-tenstein, Montenegro, Romania, Rus-sia, Serbia, United Kingdom, Israel, China, Singapore, South Korea
R3.2 Missing information 4 Greece, Latvia, Norway, Faroe Islands R3.3 mostly 31-40 years old,
temporary and permanent contracts are equally dis-tributed, mostly research and teaching oriented, mid-dle to high level of autono-my, mostly tenure-track option, mostly block funding
16 Cyprus, Czech Republic, Denmark, Germany, Ireland, Lithuania, Nether-lands, Slovenia, Spain, Sweden, Tur-key, Australia, Brazil, Canada, Japan, USA
R3.4 mostly 41-45 years old, permanent contracts, re-search and teaching orient-ed, middle to high level of autonomy, tenure-track option and no tenure-track option, block funding
12 Austria, Belgium, Bulgaria, Finland, France, Hungary, Iceland, Italy, , Luxembourg, Poland, Portugal, Switzerland
3.4.1.4 Career stage R4
In general, the career stage R4 is characterized by researchers who obtain these positions in their 40s, are employed on block-funded permanent contracts and engage in research and teaching.
For R4, we found a five cluster solution as the best fit to distinguish between the countries’ conditions of researchers in this career stage (see Table 3.4.4)41. In the following, the specificities reflected will be briefly discussed. In this solution the cluster R4.2 and R4.3 represent the majority of countries, they contain 36 out of the 47 countries.
Cluster R4.1 contains eight countries, with R4-stage researchers fitting the gen-eral characterization described above. In contrast to cluster R4.2 and R4.3, these researchers are not offered a tenure-track option.
Cluster R4.2 includes 17 countries fitting the general characterization of the R4 stage described above. In contrast to clusters R4.1 and R4.3 R4-researchers in these countries are mostly offered a tenure-track option and are granted a high level of autonomy.
Cluster R4.3 contains eleven countries, in which R4-stage researchers fit the gen-eral characterization described above. In addition, these positions offer a tenure-track option but (in contrast to R4.2) are only granted a medium level of autono-my.
Cluster R4.4 contains five countries where R4-researchers are facing conditions that differ from those in other countries regarding the type of contract, the tasks
40 The descriptive statistics for each cluster by variable used to classify countries are presented in the appendix 7.1.3.
41 The process to determine the number of clusters suitable for a career stage contains two stag-es: 1) We identify the best solutions suggested in statistical terms by the Calinski/Harabasz pseudo-F parameter. 2) We verify that this solution provides us with meaningful differences between clusters and that the number does not exceed the number of variables chosen.

MORE2 – Career paths Cross-Country Report
April 2013 66
they have to engage in and their level of autonomy. The R4 positions in these countries are temporary, specialized in teaching or research and provide only a medium level of autonomy.
Cluster R4.5 includes six countries, with the main feature again being missing in-formation, thus preventing any meaningful assignment of these countries to any of the other clusters.
The majority of countries (36 of 47 – clusters R4.1, R4.2 and R4.3) represent a rather coherent R4 career stage; the distinguishing feature however is whether the positions offer a tenure-track option and the level of autonomy a researcher is granted. In the R4-stage, we identified cluster R4.4 as being notably different as compared to the other clusters, regarding type of contract and the research and teaching nexus.
Notable groups of countries allowing distinguish regions or traditional develop-ments, are not found within any cluster.
Table 3.4.4: Short description of R4-career stage cluster solution42
Cluster Characteristics Number of countries
Countries
R4.1
mostly 46-50 years old, mostly permanent con-tracts, mostly research and teaching oriented, middle to high level of autonomy, no tenure-track option, block funding
8 Bosnia and Herzegovina, Denmark, Latvia, Lithuania, Montenegro, Russia, Spain, Sweden
R4.2
36-55 years old, permanent contracts, research and teaching oriented, mostly high level of autonomy, mostly tenure-track option, block funding
17 Austria, Belgium, Bulgaria, Cyprus, France, Germany, Hungary, Iceland, Italy, Luxembourg, , Norway, Poland, Portugal, Turkey, United Kingdom, Israel
R4.3
mostly 41-50 years old, mostly permanent con-tracts, research and teach-ing oriented, mostly middle level of autonomy, tenure-track option, block funding
11 Czech Republic, Finland, Ireland, Netherlands, Romania, Australia, Bra-zil, Japan, South Korea, USA
R4.4
temporary contracts, re-search oriented, mostly middle level of autonomy, yes and no tenure-track option, block funding
5 Croatia, Estonia, Macedonia, Serbia, China
R4.5
Missing information 6 Albania, Greece, Liechtenstein, Swit-zerland, Canada
3.4.2 Synthesis across all career stages
The analysis aimed at identifying common features and differences among coun-tries with regard to employment conditions for researchers by career stages, to identify those factors which constitute the main dividing line between countries and to generate a perspective on the sequence, timing and likelihood of academic careers by covering all career stages.
The differences between countries within career stages have been outlined in sec-tion 3.4.1. In this section we now focus on the main dividing lines and the per-spective on the employment conditions of academic careers. In all four career
42 The descriptive statistics for each cluster by variable used to classify countries are presented in
the appendix 7.1.4.

MORE2 – Career paths Cross-Country Report
April 2013 67
stages, the type of contract and whether or not positions are provided with a ten-ure-track option are the dividing line between clusters.
As Sorensen (1992) pointed out, in academia it takes longer to qualify for a per-manent position than is the case in other sectors, because the performance and productivity of a candidate are more difficult to measure and to judge. Following this idea, an early career researcher becomes a permanent member of the aca-demic profession if he or she is evaluated to be a person who has the potential to be highly productive and a high performer in the future. However, countries differ in how they organize this evaluation process. But as a general rule, we assume that academics with a positive evaluation will secure a position with permanent contract and/or a tenure-track-option and that this position is not challenged by dependency on competitive funding.
From the perspective of an early career researcher, we would like to synthesize the results gained from our cluster analysis and group countries according to whether they offer positions with permanent contract, and/or a tenure-track-option and basic/block funding at a certain career stage. In the following we label these positions as positions with stable employment conditions.
As can be seen in Table 3.4.5, only very few countries offer stable employment conditions (as defined above) for early career researchers. These rather excep-tional countries are Poland, Romania, Brazil, Bulgaria, Ireland, Norway, Portugal and Slovenia. Most countries in our sample offer stable working conditions for re-searchers from R3 career stage onwards. Only Estonia (tenure-track option in R1+2), Macedonia, Latvia and Russia do not offer stable employment conditions at any career stage. For two countries, Israel and Croatia, the information provid-ed does not allow a categorization due to changing conditions along the career stages. For two countries, Liechtenstein and China, the required information al-lowing categorizing them, is missing.
Table 3.4.5: Career stage with stable employment conditions
Career stage with stable working conditions
Number of countries
Countries
R1 3 Poland, Romania, Brazil R2 5 Bulgaria, Ireland, Norway, Portugal, Slovenia R3 21 Albania, Austria, Belgium, Czech Republic, Denmark,
Finland, France, Hungary, Iceland, Italy, Luxembourg, Netherlands, Serbia, Spain, Sweden, Switzerland, Tur-key, United Kingdom, Faroe Islands, Canada, USA
R4 10 Bosnia, Cyprus, Germany, Greece, Lithuania, Montene-gro, Australia, Japan, Singapore, South Korea
No career stage provides stable working conditions
4 Estonia, Macedonia, Latvia, Russia
Miscellaneous 2 Israel, Croatia, Missing information 2 Liechtenstein, China
In a next step, we analyze if the stage where stable employment conditions are granted for the first time can be related to other elements of an academic career:
1) We investigate whether the age at which the first permanent position is ob-tained is related to the career stage with stable employment conditions.
2) We discuss whether stable employment conditions are related to the stage when autonomy to pursue ones’ own research agenda is reached.
3) We discuss whether early stable working conditions lead the HE sector to be-come more attractive when compared to other sectors.

MORE2 – Career paths Cross-Country Report
April 2013 68
3.4.2.1 Age when first permanent position is obtained
In terms of a life span perspective, the age when a permanent position can be obtained is important because a permanent position offers a certain degree of employment security that, for example, influences family planning. Thus we want to check whether permanent positions in earlier career stages are related to a younger age at these positions.
Indeed, our results show that the age and stage when first permanent position can be obtained are highly related (see Table 3.4.6): In countries where stable working conditions can be obtained at an earlier career stage, researchers tend to be younger when they obtain their first permanent position. This sounds like a trivial result, but it rejects hypotheses that career systems might have imple-mented longer qualification periods prior to the career stage with stable working conditions.
Table 3.4.6: Age range of first permanent position by career stage with stable working
conditions
Career stage with stable working condi-tions
Age range of first permanent position no rank with permanent contract
-30 31-35 36-40 41-45 46-50 Missing Total
% N % N % N % N % N % N % N % N R1 0 0 0 0 33 1 67 2 0 0 0 0 0 0 100 3 R2 0 0 20 1 40 2 20 1 0 0 0 0 20 1 100 5 R3 0 0 0 0 14 3 43 9 29 6 0 0 14 3 100 21 R4 0 0 0 0 0 0 10 1 10 1 60 6 20 2 100 10 No career stage 100 4 0 0 0 0 0 0 0 0 0 0 0 0 100 4 Missing infor-mation
25 1 0 0 0 0 25 1 25 1 0 0 25 1 100 4
Total 11 5 2 1 13 6 30 14 17 8 13 6 15 7 100 47
3.4.2.2 Researchers’ autonomy to pursue their own research agenda
We assume that when researchers are granted a permanent position, they are also trusted to follow their own research agenda. The results show that this rela-tionship can be found in most countries: In 31 out of the 47 countries researchers can pursue their own research agenda in career stage R2 or R3 (see Table 3.4.7). In the majority of these countries (18 out of 31) researchers have stable em-ployment conditions at these career stages.
Furthermore, as shown above, pursuing one’s own research agenda is detached from the highest career stage. Even in eight out of ten countries which offer sta-ble employment conditions at only R4 career stage, researchers can more promi-nently pursue their own research agenda already at R2 or R3 career stage.
Table 3.4.7: Career stage with own research agenda by career stage with stable work-
ing conditions
Career stage with stable work-ing conditions
Career stage with own research agenda
never R1 R2 R3 R4 Missing Total % N % N % N % N % N % N % N R1 0 0 33 1 33 1 33 1 0 0 0 0 100 3 R2 0 0 20 1 20 1 40 2 0 0 20 1 100 5 R3 0 0 5 1 33 7 38 8 10 2 14 3 100 21 R4 0 0 10 1 30 3 40 4 20 2 0 0 100 10 No career stage 25 1 0 0 50 2 0 0 25 1 0 0 100 4 Missing information 0 0 25 1 25 1 25 1 0 0 25 1 100 4 Total 2 1 11 5 32 15 34 16 11 5 11 5 100 47
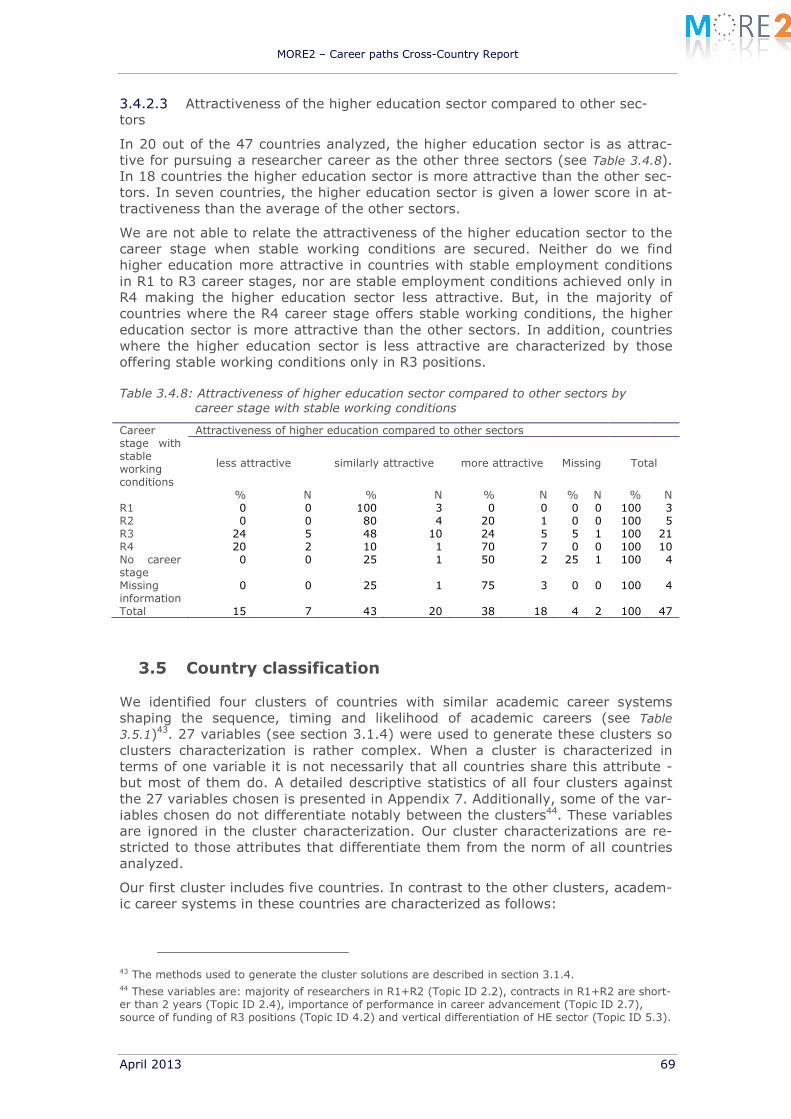
MORE2 – Career paths Cross-Country Report
April 2013 69
3.4.2.3 Attractiveness of the higher education sector compared to other sec-tors
In 20 out of the 47 countries analyzed, the higher education sector is as attrac-tive for pursuing a researcher career as the other three sectors (see Table 3.4.8). In 18 countries the higher education sector is more attractive than the other sec-tors. In seven countries, the higher education sector is given a lower score in at-tractiveness than the average of the other sectors.
We are not able to relate the attractiveness of the higher education sector to the career stage when stable working conditions are secured. Neither do we find higher education more attractive in countries with stable employment conditions in R1 to R3 career stages, nor are stable employment conditions achieved only in R4 making the higher education sector less attractive. But, in the majority of countries where the R4 career stage offers stable working conditions, the higher education sector is more attractive than the other sectors. In addition, countries where the higher education sector is less attractive are characterized by those offering stable working conditions only in R3 positions.
Table 3.4.8: Attractiveness of higher education sector compared to other sectors by
career stage with stable working conditions
Career stage with stable working conditions
Attractiveness of higher education compared to other sectors
less attractive similarly attractive more attractive Missing Total
% N % N % N % N % N R1 0 0 100 3 0 0 0 0 100 3 R2 0 0 80 4 20 1 0 0 100 5 R3 24 5 48 10 24 5 5 1 100 21 R4 20 2 10 1 70 7 0 0 100 10 No career stage
0 0 25 1 50 2 25 1 100 4
Missing information
0 0 25 1 75 3 0 0 100 4
Total 15 7 43 20 38 18 4 2 100 47
3.5 Country classification
We identified four clusters of countries with similar academic career systems shaping the sequence, timing and likelihood of academic careers (see Table 3.5.1)43. 27 variables (see section 3.1.4) were used to generate these clusters so clusters characterization is rather complex. When a cluster is characterized in terms of one variable it is not necessarily that all countries share this attribute -but most of them do. A detailed descriptive statistics of all four clusters against the 27 variables chosen is presented in Appendix 7. Additionally, some of the var-iables chosen do not differentiate notably between the clusters44. These variables are ignored in the cluster characterization. Our cluster characterizations are re-stricted to those attributes that differentiate them from the norm of all countries analyzed.
Our first cluster includes five countries. In contrast to the other clusters, academ-ic career systems in these countries are characterized as follows:
43 The methods used to generate the cluster solutions are described in section 3.1.4. 44 These variables are: majority of researchers in R1+R2 (Topic ID 2.2), contracts in R1+R2 are short-er than 2 years (Topic ID 2.4), importance of performance in career advancement (Topic ID 2.7), source of funding of R3 positions (Topic ID 4.2) and vertical differentiation of HE sector (Topic ID 5.3).

MORE2 – Career paths Cross-Country Report
April 2013 70
• a career ladder based on temporary contracts, • a high level of HEI autonomy, • other institutions then universities are allowed to award doctorates, • staff selection criteria are not predefined by law and • national schemes encouraging international mobility are not in place alt-
hough international mobility tends to be a prerequisite to pursue an aca-demic career this cluster45.
Our second cluster includes nine countries. In contrast to the other clusters, aca-demic career systems in these countries are characterized as follows:
• independence with regard to the freedom to pursue one’s own research agenda is reached at R3; and mainly R2 and R3 offer first permanent posi-tions,
• low to medium level of social security, • high to medium level of HEI autonomy combined with a medium level of
university’ autonomy to set employment conditions and • strong disciplinary differences in career conditions.
Our third cluster includes 13 countries. In contrast to the other clusters, academic career systems in these countries are characterized as follows:
• independence with regard to the freedom to pursue one’s own research agenda is reached at R2 and R3 and first permanent positions are granted in R1, R2 and R3,
• structured doctoral programs are mandatory and dominate doctoral train-ing,
• a consecutive academic degree is needed and • medium to high degree of HEI autonomy combined with a medium to low
level of university’ autonomy to set employment conditions.
Our fourth cluster includes 20 countries. In contrast to the other clusters, aca-demic career systems in these countries are characterized as follows:
• international mobility is a prerequisite for an academic career, national schemes to promote international mobility exist,
• medium level of financial rewards are gained when climbing the academic career ladder (compared to the other clusters),
• high to medium level of social security, • medium to low level of HEI autonomy combined with a low level of univer-
sity autonomy to set employment conditions, • intersectoral mobility is a prerequisite for certain careers and • no significant disciplinary differences in careers.
Our country classification of academic career systems shows that the dividing lines presented do not work universally throughout the variables. A notable varia-tion among the clusters is the degree of HEI autonomy in combination with the university autonomy to set employment conditions (clusters 2, 3 and 4). Another notable difference between the clusters are the predominant career stages at which an independence in terms of pursuing ones’ own research agenda and em-ployment security is reached (clusters 2 and 3). Clusters 2 and 4 are not only dif-ferent in terms of the employment conditions and financial rewards offered to climb the career ladder, but also in terms of the level of HEI autonomy and the different impact of disciplinary conditions. Cluster 4 contains the largest group of
45 In this cluster, academic careers are enhanced by international mobility in five countries.

MORE2 – Career paths Cross-Country Report
April 2013 71
countries with rather specific common characteristics. Cluster 4 could be marked as the standard cluster.
Do we expect the characteristics typical to the identified clusters to have a bear-ing on the sequence, timing and likelihood of academic careers? Our basic as-sumption was that yes, these differences have an impact on academic careers. Based on the empirical data we provide we now try to provide an answer to this question:
• Academic careers in countries in cluster 1 can be expected to be more di-verse within a country because HEI have a high level of autonomy, other institutions than universities are allowed to award doctorates, international mobility is a prerequisite without supported by national schemes and a low level of employment security.
• Academic careers in countries of cluster 2 show high levels of independ-ence at mid-term career. Progressing into the R3 career stage allows them to define their own research agenda independently and provides high em-ployment security. Researchers’ careers depend on disciplinary develop-ments and institutional practices due to high HEI autonomy.
• Academic careers in countries of cluster 3 are characterized by early ca-reer independence. In these countries, academic independence and em-ployment security tend to be granted earlier than in other countries.
• Academic careers in countries of cluster 4 might show a higher degree of mobility because international mobility is a prerequisite and is encouraged by national schemes; intersectoral mobility is also a prerequisite in certain areas. Researchers are exposed to more unified conditions within these countries due to a lower HEI autonomy and not very significant disciplinary differences.
The geographic locations of the countries classified in the clusters do not show any meaningful pattern (see Table 3.5.1).
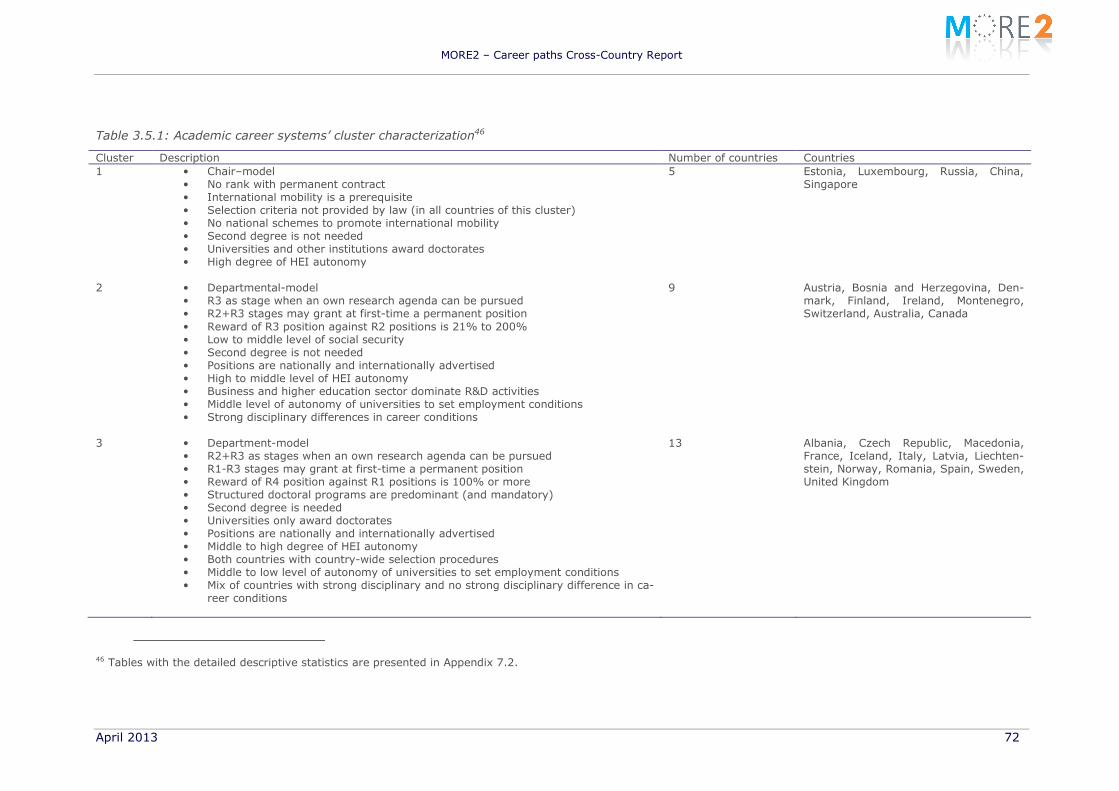
MORE2 – Career paths Cross-Country Report
April 2013 72
Table 3.5.1: Academic career systems’ cluster characterization46
Cluster Description Number of countries Countries 1
• Chair–model • No rank with permanent contract • International mobility is a prerequisite • Selection criteria not provided by law (in all countries of this cluster) • No national schemes to promote international mobility • Second degree is not needed • Universities and other institutions award doctorates • High degree of HEI autonomy
5 Estonia, Luxembourg, Russia, China, Singapore
2
• Departmental-model • R3 as stage when an own research agenda can be pursued • R2+R3 stages may grant at first-time a permanent position • Reward of R3 position against R2 positions is 21% to 200% • Low to middle level of social security • Second degree is not needed • Positions are nationally and internationally advertised • High to middle level of HEI autonomy • Business and higher education sector dominate R&D activities • Middle level of autonomy of universities to set employment conditions • Strong disciplinary differences in career conditions
9 Austria, Bosnia and Herzegovina, Den-mark, Finland, Ireland, Montenegro, Switzerland, Australia, Canada
3
• Department-model • R2+R3 as stages when an own research agenda can be pursued • R1-R3 stages may grant at first-time a permanent position • Reward of R4 position against R1 positions is 100% or more • Structured doctoral programs are predominant (and mandatory) • Second degree is needed • Universities only award doctorates • Positions are nationally and internationally advertised • Middle to high degree of HEI autonomy • Both countries with country-wide selection procedures • Middle to low level of autonomy of universities to set employment conditions • Mix of countries with strong disciplinary and no strong disciplinary difference in ca-
reer conditions
13 Albania, Czech Republic, Macedonia, France, Iceland, Italy, Latvia, Liechten-stein, Norway, Romania, Spain, Sweden, United Kingdom
46 Tables with the detailed descriptive statistics are presented in Appendix 7.2.

MORE2 – Career paths Cross-Country Report
April 2013 73
4
• Chair- and department-model • International mobility is a prerequisite • National schemes to promote international mobility are in place • Reward of R4 position against R3 positions is 21% to 200% • Reward of R3 position against R2 positions is up to 40% • Reward of R4 position against R1 positions is up to 200% • High to middle level of social security • Structured doctoral programs are predominant (but not necessarily mandatory) • Universities only award doctorates • Positions are nationally advertised • Middle to low level of HEI autonomy • Business sector dominates R&D activities • Intersectoral mobility a prerequisite of certain careers (35% of this cluster, but all
countries with this feature are in this cluster) • Higher education is considerably less attractive compared to other sectors (25% of
this cluster, but five out of seven countries with this feature are in this cluster) • Low level of autonomy of universities to set employment conditions • No disciplinary differences in careers
20 Belgium, Bulgaria, Croatia, Cyprus, Germany, Greece, Hungary, Lithuania, Netherlands, Poland, Portugal, Serbia, Slovenia, Turkey, Faroe Islands, Israel, Brazil, Japan, South Korea, USA

MORE2 – Career paths Cross-Country Report
April 2013 74
4 SUMMARY
This report provided the results of work packages 3, the case studies on working conditions and career paths of early career researchers (WP3) in selected coun-tries of the MORE2 study on “support for continued data collection and analysis concerning mobility patterns and career paths of researchers”. It provides an overview of working conditions and career paths of early career researchers for the countries under investigation. The analysis is based on data and information provided by an extensive network of national experts. The data collection for WP3 was undertaken in close collaboration with WP4. A uniform set of three instru-ments was developed and used ensuring coherence of the information and data given by the experts. For the data collection for WP3, a template was used specifi-cally, which was filled-in by all country correspondents.
The aim of the WP is to deliver comparable data on working conditions and career paths of early career researchers. Countries are compared regarding their R&D systems, career paths and working conditions. The analysis includes a classifica-tion of countries based on the characteristics of their academic career systems. The analysis is mainly based on data and information contained in the templates which was coded to create variable to be used in the statistical analysis. The clas-sification of countries uses the four career stages model as a starting point, which was outlined by the European Commission (2011) in their communication “To-wards a European Framework for Research Careers”. Additionally, we apply a framework developed by Kaulisch and Salerno (2009) to identify characteristics of academic careers systems that shape the sequence, timing and likelihood of re-searcher careers. The focus here is primarily on careers in the higher education sector.
The framework developed by Kaulisch and Salerno (2009) includes five sets of rules influencing the sequence, timing and likelihood of academic careers and which constitute an academic career system. These sets of rules are academics’ employment, credentials, intra-organizational practices, inter-organizational rela-tionships and academic disciplines. For each of these sets of rules we constructed variables derived from the country correspondent template. In total, 27 variables are used to characterize an academic career system. Additionally, our compara-tive analyses of the four career stages are undertaken with six variables describ-ing the employment conditions within a career stage.
The country classification is derived from a two-step-process. First, the (dis-) similarity of countries is calculated based on sequence analyses of the country characteristics. A string of values, per variable one value, is constructed as a se-quence of a country. Second, cluster analyses are run to classify most similar countries together. The cluster solution suggested by a statistical test is contested by its meaningfulness. The solution is taken that meats both criteria.
4.1.1 Country comparison – the R&D system
Countries differ regarding their R&D intensity and the sectors where R&D is pri-marily conducted. In a number of EU countries, particularly southern and eastern European countries, research is performed to a higher extent in the public sector (higher education and government sector) than it is the case in United States, South Korea, China and Japan. The higher education sector is - if it comes to the share of GERD performed by the sector - more relevant especially in the EU-15 countries, compared to countries such as China, Russia, South Korea, Japan and the United States and most EU-12 countries. In general, the share of researchers employed by the sectors is in line with sectors’ share of GERD. Thus, European countries tend to employ more researchers in the public sector compared to Chi-

MORE2 – Career paths Cross-Country Report
April 2013 75
na, Japan, South Korea and the United States. The share of female researchers is higher in countries with comparable low GERD (as % of GDP). In addition, the share of female researchers is higher in the public sector than in the business en-terprise sector.
The country correspondents were requested to judge the overall and long-term attractiveness of the four sectors sector for pursuing a research career47. The share of countries where the attractiveness of the higher education sector was assessed as “good” or even “excellent” exceeds respective assessments for the other sectors. Still, in the majority of countries the attractiveness of the govern-ment sector and the business enterprise sector for pursuing a researcher’s career was also rated “good” or “excellent”.
In most countries, higher education institutions have a high degree of autonomy regarding academic, organizational and staffing issues. What differs is the situa-tion regarding financial autonomy - here the higher education institutions face more limitations. No regional differences regarding the degree of autonomy of higher education were found; meaning the degree of autonomy is not particularly high or low in the countries of certain (world) regions.
In most countries, higher education institutions pursue research and teaching. Teaching-only institutions can be found in very few countries. With regard to the institutions’ organization, we find the department model being implemented in the majority of HEI. Universities are, in most countries, the only institutions awarding doctorates and a degree beyond the doctorate is not mandatory. While structured doctoral training is not necessarily mandatory it is meanwhile the pre-dominant way to gain a PhD in the majority of countries. While there are some differences with regard to the age when a PhD is typically awarded, in the majori-ty of countries the doctorate is earned before the 35th birthday.
4.1.2 Career paths and working conditions – general description
Throughout the career stages most positions are funded by block funding. In most countries, researchers start their career (R1) on temporary contracts. The majority of positions are also based on temporary contracts at the R2 career stage. Only a few countries offer permanent positions already at this career stage. The situation only changes when moving to career stage R3: here the ma-jority of positions grant permanent contracts. With a career progression to the R3 stage it is not only the typical type of contract which changes but also the length of the temporary contracts. Temporary contracts are more likely to extend over a longer period (>4 years) at higher career stages than in earlier career stages. Tenure-track options are available to the majority of positions in career stage R3 and R4. Furthermore, not surprisingly, career progression is also characterized by increasing researcher autonomy. Significant gains in autonomy take place when researchers move from R2 to R3 and from R3 to R4 career stage.
The countries under investigation are rather similar with regard to the age at which a specific career stage can typically be obtained. In most countries, R1-positions are obtained when researchers are younger than 30 years of age. In most countries (with information available), R2-positions are obtained before the 36th birthday and R3-positions before the 41st birthday. In the vast majority of countries (with information available), R4-positions are obtained before the 51st birthday including a large group of countries in which these positions are obtained already before the 46th birthday.
47 Please note that these assessments are the view of the individual country correspondents. No
attempt has been made to harmonize the assessments across countries.

MORE2 – Career paths Cross-Country Report
April 2013 76
In most countries, positions are advertised nationally and rarely worldwide, and career progression depends on the performance of the researcher and interna-tional mobility is a prerequisite for a career or at least in certain areas. In terms of schemes to support and enhance international mobility, the countries are split in two groups of the same size: one group has implemented national schemes whereas the other group does not have them but rather relies on the European initiatives.
4.1.3 Results of the country classification for each career stage
Our aim for this section is to group countries around their characteristics per ca-reer stage, to identify factors that present the main dividing line between coun-tries and to generate a perspective on the sequence, timing and likelihood of aca-demic careers. In R1-, R2- and R4-career stages we group the countries into five clusters and in R3 career stage we find a four cluster solution. In each career stage one cluster includes all those countries where most of the information is missing.
In all career stages except R3 we identify a general description of the respective career stage into which most countries can be grouped. This result suggests that career stages are rather homogenous within the countries observed. Additionally, countries from certain (world) regions are not necessarily found in the same clus-ters per career stage. Nonetheless, some groups of countries are classified into the same clusters.
• Characterization of R1 career stage in most countries: young researchers
at the age of 30 years or even younger, they are employed based on
block-funded temporary contracts and they have only a low level of auton-
omy and no tenure-track option.
• Characterization of R2 career stage in most countries: mainly researchers
in their early 30s, who are employed on block-funded temporary contracts,
engaged in both teaching and research tasks, having a low level of auton-
omy.
• In R3 career stage, two groups of countries (Cluster R3.1 vs. R3.3 + R3.4)
are divided in terms of type of contract, research/teaching nexus and level
of researchers’ autonomy.
• Characterization of R4 career stage in most countries: researchers who
obtain these positions in their 40s, are employed on block-funded perma-
nent contracts, undertake both teaching and research tasks and have a
high level of autonomy.
In R1 career stage, we find that Southern European countries tend to employ re-searchers for research tasks only (an exception is Greece). In R2 career stage, we show that East-Asian countries are grouped into one cluster (an exception is South Korea). In R3 career stage, we show that the cluster R3.1 with temporary contracts, block-funding, research or teaching and tenure-track option (yes and no) is dominated by countries from the Former Yugoslav Republic (without Slove-nia), other Eastern European countries such as Russia, Albania and Estonia, three of the four East-Asian countries and Israel and United Kingdom. The other R3.3+R3.4 clusters is common among Northern, Western and Central European countries plus Bulgaria, hence most EU-27 countries are in these clusters. In R4 cluster, we cannot show any notable concentration of regions in one cluster or two clusters with similar pattern.
In all four career stages the main dividing line between countries are the type of contract and whether or not a position was provided with a tenure-track option.

MORE2 – Career paths Cross-Country Report
April 2013 77
We conclude that stable employment conditions are reached in most countries at the latest, at R3 career stage. Only Estonia, Macedonia, Latvia and Russia are re-ported to not offer stable employment conditions at any career stage. Further analyses show that:
• in countries where stable employment conditions can be obtained at earli-
er career stage, researchers tend to be younger when they obtain their
first permanent position;
• in most countries, researchers having positions with stable employment
conditions are trusted to pursue their own research agenda and
• the attractiveness of the higher education sector compared to other sec-
tors is not higher if countries provide stable employment conditions at an
earlier career stage.
4.1.4 Results of the country classification of academic career systems
We identified four different groups of countries with similar academic career sys-tems. Our country classification of academic career systems shows that the divid-ing lines between the groups of countries are subject to only certain parts of our variables chosen. Clusters 2 and 3 are different in terms of the career stage at which a certain level of research independence is reached. In Cluster 2 research independence is reached at R3 career stage and, in most cases, this involves sta-ble working conditions. Countries in Cluster 3 tend to grant research independ-ence earlier to their academics. Cluster 1 is different in terms of HEI autonomy, international mobility and type of contract. On the other side, Cluster 4 includes the largest group of countries that do, on aggregate, show rather specific com-mon characteristics compared to the others. Cluster 4 could be marked as the standard cluster. The geographic location of the countries classified in the clusters does not show any meaningful pattern.
Whereas our country classification of each career stage shows rather homogenous characteristics for each career stage, our country classification of academic career systems suggests diversity of systems worldwide – although limited to certain sets of rules. A next step in the analysis should investigate whether we can iden-tify relationships between academic career systems and characteristics of career stages.
4.2 Methodology limitations, caveats and lessons learned for future studies
Finally, we discuss the lessons learned during the inception phase of preparing the questionnaires and templates, the data collection and the preparation of this report. First of all we would like to highlight the extensive workload required to collect data for about 50 countries via a network of country experts. In order to collect valid and reliable data, experts have to be closely accompanied during the data collection process. Closer contact with the experts and excellent network management lead to the best results. This required checks of the data during the field phase and frequent follow up calls whenever the collected data are question-able or ambiguous. We therefore highlight the importance of setting up a well-functioning network management system in order to guarantee the success of such a project.
Furthermore, in this project it was possible only to assign one expert per country. Making use of more than one expert per country would be preferable in order to improve the quality and the validity of the data. Personal biases in the perception

MORE2 – Career paths Cross-Country Report
April 2013 78
of qualitative information can be better avoided and data gaps can be filled more easily in case one of the experts in charge does not have access to required data or is not able to fill in the needed information for other reasons. Given the focus of this study in surveying a large set of countries (i.e. requiring a large number of experts) and including both the academic and non-academic sector (i.e. increas-ing the workload for the experts), and considering the budget constraints, it was not possible to make use of more than one expert per country.
Second, the collection of a huge amount of data - as in this study - requires time consuming data cleaning before it is possible to start the analysis. The quality of data cleaning is crucial in order to obtain plausible results. The amount of time required to clean the data is difficult to foresee and was critical in this study.

MORE2 – Career paths Cross-Country Report
April 2013 79
5 REFERENCES
Academic careers observatory (European University Institute): http://www.eui.eu/ProgrammesAndFellowships/AcademicCareersObservatory/About.aspx
Alpert, D. (1985): Performance and Paralysis. The Organizational Con-text of the American Research University. Journal of Higher Educa-tion, 56 (3), 241-281.
Altbach, P.G./Pacheco, I.F./Rumbley, L.E. (2008): International Compar-ison of Academic Salaries. An Explanatory Study. Boston College Center of International Higher Education.
Arthur, M. B. / Hall, D. T. / Lawrence, B. S. (1989): Generating new di-rections in career theory: the case for a transdisciplinary approach, in Arthur, M. B. / Hall, D. T. / Lawrence, B. S. (Eds.), Handbook of career theory. Cambridge: Cambridge University Press, 7-25.
Ates, G., Brechelmacher A. (2012): Academic Career Paths, in Teichler, U. and Höhle, E.A., Eds. Work Situation, Views and Activities of the Academic Professions: Findings of a Survey in Twelve European Countries, Dortrecht: Springer (forthcoming)
Borjas, G.J. (1999): The economic analysis of immigration. in Ash-enfelter O./ Cord D., (Eds.) Handbook of Labor Economics. Am-sterdam: Elsevier Science Publishers BV, 1697–1760.
Burris, V. (2004): The Academic Caste System: Prestige Hierarchies in PhD Exchange Networks. American Sociological Review, 69(2), 239-264.
Caplow, T. / McGee, R. J. ([1958] 2001): The Academic Marketplace. New Brunswick, London: Transaction Publishers.
CHERI, (2012): Changing Academic Profession (CAP). Available at: http://www.open.ac.uk/cheri/pages/CHERI-Projects-CAP.shtml [retrieved on February 16th, 2012].
Coates, H. u. a., (2009): The attractiveness of the Australian academic profession: A comparative analysis.
Deloitte (2008): University Staff Academic Salaries & Remuneration. A Comparison of New Zealand and Selected International (Australia, Canada, England, USA) Data.
Ehrenberg, E. (2010): Rethinking the Professoriate. Cornell University Working Papers, (117).
Enders, J. (1996): Die wissenschaftlichen Mitarbeiter. Ausbildung, Beschäftigung und Karriere der Nachwuchswissenschaftler und Mittelbauangehörigen an den Universitäten. Frankfurt a. M., New York: Campus.
European Commission (2011a): Innovation Union Competiveness report. 2011 edition. Luxembourg, Publications Office of the European Un-ion.
European Commission (2011): Towards a European Framework for Re-search Careers. Brussels.

MORE2 – Career paths Cross-Country Report
April 2013 80
European Commission (2007): Remuneration of Researchers in the Pub-lic and Private Sectors, Brussels: European Commission, DG Re-search, Directorate C.
European University Institute (2012): Academic Careers Observatory, ACO - Salary Comparisons. Available at: http://www.eui.eu/ProgrammesAndFellowships/AcademicCareersObservatory/CareerComparisons/SalaryComparisons.aspx [retrieved on February 16, 2012].
Eurostat, Structure of Earnings Survey (2006): Eurostat’s arrangements for implementing the Council Regulation 530/1999, the Commis-sion Regulations 1916/2000 and 1738/2005, European Commis-sion, Luxembourg, 2006.
Gläser, J. (2001): Macrostructures, careers and knowledge production: a neoinstitutionalist approach. International Journal of Technology Management, 22(7/8), 698-715.
Hall, D. T. (2002): Careers In and Out of Organizations. Thousand Oaks et al.: Sage Publications.
Hollanders, H. (2007): Innovation Modes: Evidence at the Sector Level, Europe Innova Sectoral Innovation Watch deliverable WP4, Euro-pean Commission, Brussels.
Horsley, M./Martin, G./ Woodburne, G. (2005): Salary relativities and the academic labor market.
House of Commons. Science and Technology Committee (2002): Short-Term Research Contracts in Science and Engineering. Eigth Report of Session 2001-02 (No. HC 1046). London.
Huber, P./Reinstaller, A./Unterlass, F./Ebersberger, B. (2010): Industrial researcher mobility study, MORE Technical Report 2 – Part II, Eu-ropean Commission - DG Research, Brussels.
IDEA Consult et al (2013a): MORE2 - Support for continued data collec-tion and analysis concerning mobility patterns and career paths of researchers, Technical Report Career paths and Remuneration (WP3 & WP4). European Commission, DG Research and Innova-tion.
IDEA Consult et al (2013b): MORE2 - Support for continued data collec-tion and analysis concerning mobility patterns and career paths of researchers, Remuneration Cross-Country Report (WP4). European Commission, DG Research and Innovation.
Johnson, W.R./Turner, S. (2009): Faculty Without Students: Resource Allocation in Higher Education. Journal of Economic Perspectives, 23(2), 169–189.
Kalpazidou Schmidt, E. (2008): Research management and policy: in-centives and obstacles to a better public-private interaction. Inter-national Journal of Public Sector Management, 2008, 21(6), 623–636.
Kaulisch, M./Enders, J. (2005): Careers in overlapping institutional con-texts: The case of academe. Career Development International, 10(2), 130-144.
Kaulisch, M./Salerno, C. (2009): Conceptual framework to study aca-demic career systems. iQ. Retrieved from

MORE2 – Career paths Cross-Country Report
April 2013 81
http://www.forschungsinfo.de/iq/agora/career_systems/career_system.html
Kubler, J./Lennon, M.C. (2007): Academic Staff Salary Survey 2006-07, London: Association of Commonwealth Universities - Policy Re-search Unit.
Malerba, F. (2004): Sectoral systems of innovation. Concepts, issues and analyses of six major sectors in Europe, Cambridge University Press, Cambridge.
Mayer, K. U. (2004): Whose Lives?: How History, Societies and Institu-tions Define and Shape Life Courses. Research in Human Devel-opment, 1(3), 161–187. Retrieved from http://www.mpib-ber-lin.mpg.de/en/institut/dok/full/Mayer/whoselif/s15427617rhd0103_3.pdf
Miller, C. C. / Glick, W. H. / Cardinal, L. B. (2005): The allocation of prestigious positions in organizational science: accumulative ad-vantage, sponsored mobility, and contest mobility. Journal of Or-ganizational Behavior, 26(5), 489-516.
Neave, G. / Rhoades, G. (1987): The Academic Estate in Western Eu-rope, in B. R. Clark (Ed.), The Academic Profession. National, Dis-ciplinary, and Institutional Settings. Berkeley, Los Angeles, Lon-don: University of California Press, 211-270.
OECD (2008): The global competition for talent. Mobility of the highly skilled, Paris: OECD.
OECD, Frascati Manual 2002: Proposed Standard Practice for Surveys on Research and Experimental Development, OECD, Paris, 2002.
Peneder, M. (2007): Entrepreneurship and Technological Innovation. An Integrated Taxonomy of Firms and Sectors, Europe Innova Sec-toral Innovation Watch deliverable WP4, European Commission, Brussels.
Ranguelov, S. u. a. (2009): Key data on Education in Europe 2009. Eu-rydice, European Commission.
Ranguelov, S. / Pejnovic, S. (2011): Teachers’ and School Heads’ Sala-ries and Allowances in Europe, 2009/10. Eurydice, European Commission.
Robinson, D. (2006): The Status of Higher Education Teaching Personnel in Australia, Canada, New Zealand, the United Kingdom, and the United States.
Russo, G. (2010): For love and money. Nature, 465(7301), 1104–1107.
Scott, C.S. / Siegfried, J.J. (2011): American Economic Association Uni-versal Academic Questionnaire Summary Statistics. American Eco-nomic Review: Papers & Proceedings, 101, 664–667.
Sonnenfeld, J. A. / Peiperl, M. A. (1988): Staffing Policy as a Strategic Response. A Typology of Career Systems. The Academy of Man-agement Review, 13(4), 588-600.
Sørensen, A. B. (1992): Wissenschaftliche Werdegänge und akademische Arbeitsmärkte, in K. U. Mayer (Ed.), Generationsdynamik in der Forschung. Frankfurt a.M., New York: Campus, 83-109.

MORE2 – Career paths Cross-Country Report
April 2013 82
Steyrer, J. / Mayrhofer, W. / Meyer, M. (2005): Karrieren. Eine Einführung, in W. Mayrhofer, M. Meyer & J. Steyrer (Eds.), Macht? Erfolg? Reich? Glücklich? Einflussfaktoren auf Karrieren. Wien: Linde Verlag, 12-24.

MORE2 – Career paths Cross-Country Report
April 2013 83
6 COUNTRY FICHES
Country fiches were made available via Dropbox. They can be downloaded via:

MORE2 – Career paths Cross-Country Report
April 2013 84
7 APPENDIX: DESCRIPTIVE STATISTICS FOR CLUSTER SOLUTIONS IN SECTION 3.4 AND 3.5
7.1 Descriptive statistics for cluster solutions per career stage (section 3.4)
7.1.1 R1 career stage: Statistics on cluster solution
Table 7.1.1: Normal age when position in career stage R1 is obtained by country clusters in career stage R1
Country clusters in career stage R1
Normal age when position in career stage R1 is obtained -30 -30 31-35 31-35 36-40 36-40 41-45 41-45 Missing Missing Total Total
% N % N % N % N % N % N 1 53 10 37 7 0 0 0 0 11 2 100 19 2 64 9 29 4 0 0 0 0 7 1 100 14 3 100 6 0 0 0 0 0 0 0 0 100 6 4 0 0 0 0 0 0 0 0 100 5 100 5 5 0 0 0 0 33 1 67 2 0 0 100 3 Total 53 25 23 11 2 1 4 2 17 8 100 47
Table 7.1.2: Type of contract in career stage R1 by Country clusters in career stage R1
Type of contract in career stage R1
Country clusters in career stage R1
only positions with temporary contracts
only positions with temporary contracts
only positions with permanent contracts
only positions with permanent contracts
Missing Missing Total Total
% N % N % N % N 1 95 18 5 1 0 0 100 19 2 100 14 0 0 0 0 100 14 3 100 6 0 0 0 0 100 6 4 80 4 0 0 20 1 100 5 5 0 0 100 3 0 0 100 3 Total 89 42 9 4 2 1 100 47
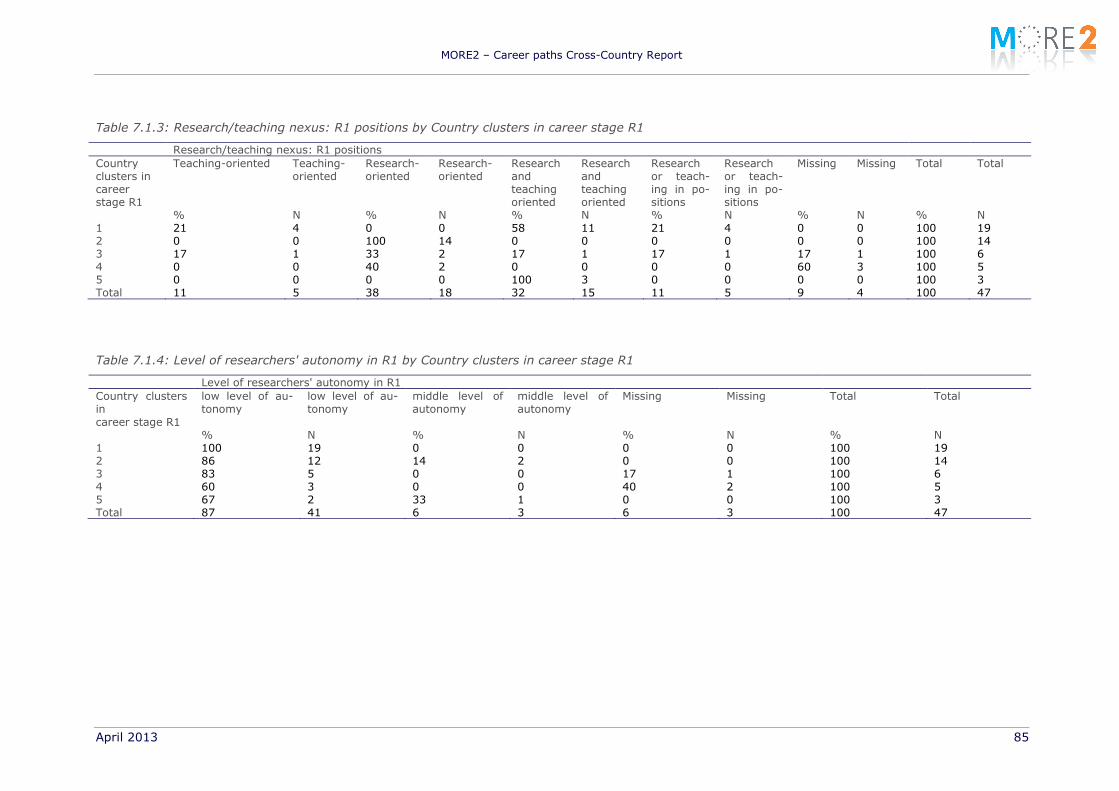
MORE2 – Career paths Cross-Country Report
April 2013 85
Table 7.1.3: Research/teaching nexus: R1 positions by Country clusters in career stage R1
Research/teaching nexus: R1 positions Country clusters in career stage R1
Teaching-oriented Teaching-oriented
Research-oriented
Research-oriented
Research and teaching oriented
Research and teaching oriented
Research or teach-ing in po-sitions
Research or teach-ing in po-sitions
Missing Missing Total Total
% N % N % N % N % N % N 1 21 4 0 0 58 11 21 4 0 0 100 19 2 0 0 100 14 0 0 0 0 0 0 100 14 3 17 1 33 2 17 1 17 1 17 1 100 6 4 0 0 40 2 0 0 0 0 60 3 100 5 5 0 0 0 0 100 3 0 0 0 0 100 3 Total 11 5 38 18 32 15 11 5 9 4 100 47
Table 7.1.4: Level of researchers' autonomy in R1 by Country clusters in career stage R1
Level of researchers' autonomy in R1 Country clusters in career stage R1
low level of au-tonomy
low level of au-tonomy
middle level of autonomy
middle level of autonomy
Missing Missing Total Total
% N % N % N % N 1 100 19 0 0 0 0 100 19 2 86 12 14 2 0 0 100 14 3 83 5 0 0 17 1 100 6 4 60 3 0 0 40 2 100 5 5 67 2 33 1 0 0 100 3 Total 87 41 6 3 6 3 100 47

MORE2 – Career paths Cross-Country Report
April 2013 86
Table 7.1.5: Type of funding: Majority of R1 positions by Country clusters in career stage R1
Type of funding: Majority of R1 positions Country clusters in career stage R1
majority funded by block funding
majority funded by block funding
majority funded by competitive funding
majority funded by competitive funding
balance be-tween block and com-petitive funding
balance be-tween block and com-petitive funding
block or competitive funding
block or competitive funding
Missing Missing Total Total
% N % N % N % N % N % N 1 47 9 11 2 26 5 0 0 16 3 100 19 2 57 8 14 2 14 2 7 1 7 1 100 14 3 83 5 0 0 0 0 17 1 0 0 100 6 4 40 2 0 0 0 0 0 0 60 3 100 5 5 100 3 0 0 0 0 0 0 0 0 100 3 Total 57 27 9 4 15 7 4 2 15 7 100 47
Table 7.1.6: Tenure-track option available in R1 by Country clusters in career stage R1
Tenure-track option available in R1 Country clusters in career stage R1
No No Yes Yes Missing Missing Total Total
% N % N % N % N 1 100 19 0 0 0 0 100 19 2 100 14 0 0 0 0 100 14 3 17 1 83 5 0 0 100 6 4 80 4 0 0 20 1 100 5 5 0 0 100 3 0 0 100 3 Total 81 38 17 8 2 1 100 47

MORE2 – Career paths Cross-Country Report
April 2013 87
7.1.2 R2 career stage: Statistics on cluster solution
Table 7.1.7: Normal age when position in career stage R2 is obtained by Country clusters in career stage R2
Normal age when position in career stage R2 is obtained Country clusters in career stage R2
-30 -30 31-35 31-35 36-40 36-40 41-45 41-45 46-50 46-50 Missing Missing Total Total
% N % N % N % N % N % N % N 1 0 0 63 10 6 1 0 0 0 0 31 5 100 16 2 8 1 54 7 31 4 0 0 0 0 8 1 100 13 3 29 2 0 0 71 5 0 0 0 0 0 0 100 7 4 38 3 13 1 13 1 13 1 13 1 13 1 100 8 5 0 0 0 0 0 0 0 0 0 0 100 3 100 3 Total 13 6 38 18 23 11 2 1 2 1 21 10 100 47
Table 7.1.8: Type of contract in career stage R2 by Country clusters in career stage R2
Type of contract in career stage R2 Country clus-ters in career stage R2
only posi-tions with temporary contracts
only posi-tions with temporary contracts
positions both with temporary and perma-nent con-tracts
positions both with temporary and perma-nent con-tracts
only posi-tions with permanent contracts
only posi-tions with permanent contracts
Missing Missing Total Total
% N % N % N % N % N 1 100 16 0 0 0 0 0 0 100 16 2 77 10 0 0 23 3 0 0 100 13 3 100 7 0 0 0 0 0 0 100 7 4 25 2 25 2 50 4 0 0 100 8 5 0 0 0 0 0 0 100 3 100 3 Total 74 35 4 2 15 7 6 3 100 47

MORE2 – Career paths Cross-Country Report
April 2013 88
Table 7.1.9: Research/teaching nexus: R2 positions by Country clusters in career stage R2
Research/teaching nexus: R2 positions Country clusters in career stage R2
Teaching-oriented Teaching-oriented
Research-oriented
Research-oriented
Research and teaching oriented
Research and teaching oriented
Research or teach-ing in po-sitions
Research or teach-ing in po-sitions
Missing Missing Total Total
% N % N % N % N % N % N 1 13 2 25 4 44 7 0 0 19 3 100 16 2 8 1 8 1 85 11 0 0 0 0 100 13 3 14 1 57 4 14 1 14 1 0 0 100 7 4 0 0 38 3 50 4 13 1 0 0 100 8 5 0 0 0 0 0 0 0 0 100 3 100 3 Total 9 4 26 12 49 23 4 2 13 6 100 47
Table 7.1.10: Level of researchers' autonomy in R2 by Country clusters in career stage R2
Level of researchers' autonomy in R2 Country clus-ters in career stage R2
low level of autonomy
low level of autonomy
middle level of autonomy
middle level of autonomy
high level of autonomy
high level of autonomy
Missing Missing Total Total
% N % N % N % N % N 1 63 10 31 5 0 0 6 1 100 16 2 77 10 8 1 15 2 0 0 100 13 3 71 5 29 2 0 0 0 0 100 7 4 63 5 38 3 0 0 0 0 100 8 5 0 0 0 0 0 0 100 3 100 3 Total 64 30 23 11 4 2 9 4 100 47

MORE2 – Career paths Cross-Country Report
April 2013 89
Table 7.1.11: Type of funding: Majority of R2 positions by Country clusters in career stage R2
Type of funding: Majority of R2 positions Country clusters in career stage R2
majority funded by block funding
majority funded by block funding
majority funded by competitive funding
majority funded by competitive funding
balance be-tween block and com-petitive funding
balance be-tween block and com-petitive funding
block or competitive funding
block or competitive funding
Missing Missing Total Total
% N % N % N % N % N % N 1 56 9 0 0 25 4 0 0 19 3 100 16 2 85 11 0 0 8 1 8 1 0 0 100 13 3 43 3 29 2 0 0 14 1 14 1 100 7 4 38 3 38 3 13 1 13 1 0 0 100 8 5 0 0 0 0 0 0 0 0 100 3 100 3 Total 55 26 11 5 13 6 6 3 15 7 100 47
Table 7.1.12: Tenure-track option available in R2 by Country clusters in career stage R2
Tenure-track option available in R2
Country clusters in career stage R2
No No Yes Yes Missing Missing Total Total
% N % N % N % N 1 94 15 6 1 0 0 100 16 2 23 3 77 10 0 0 100 13 3 100 7 0 0 0 0 100 7 4 0 0 100 8 0 0 100 8 5 0 0 0 0 100 3 100 3 Total 53 25 40 19 6 3 100 47

MORE2 – Career paths Cross-Country Report
April 2013 90
7.1.3 R3 career stage: Statistics on cluster solution
Table 7.1.13: Normal age when position in career stage R3 is obtained by Country clusters in career stage R3
Normal age when position in career stage R3 is obtained Country clusters in career stage R3
31-35 31-35 36-40 36-40 41-45 41-45 46-50 46-50 51-55 51-55 Missing Missing Total Total
% N % N % N % N % N % N % N 1 0 0 40 6 13 2 7 1 0 0 40 6 100 15 2 0 0 0 0 0 0 0 0 0 0 100 4 100 4 3 25 4 56 9 13 2 0 0 6 1 0 0 100 16 4 8 1 0 0 67 8 0 0 0 0 25 3 100 12 Total 11 5 32 15 26 12 2 1 2 1 28 13 100 47
Table 7.1.14: Type of contract in career stage R3 by Country clusters in career stage R3
Type of contract in career stage R3 Country clusters in career stage R3
only positions with temporary contracts
only positions with temporary contracts
positions both with temporary and permanent contracts
positions both with temporary and permanent contracts
only positions with perma-nent contracts
only positions with perma-nent contracts
Missing Missing Total Total
% N % N % N % N % N 1 60 9 13 2 27 4 0 0 100 15 2 25 1 0 0 25 1 50 2 100 4 3 31 5 25 4 44 7 0 0 100 16 4 0 0 0 0 100 12 0 0 100 12 Total 32 15 13 6 51 24 4 2 100 47

MORE2 – Career paths Cross-Country Report
April 2013 91
Table 7.1.15: Research/teaching nexus: R3 positions by Country clusters in career stage R3
Research/teaching nexus: R3 positions Country clusters in career stage R3
Teaching-oriented Teaching-oriented
Research-oriented
Research-oriented
Research and teaching oriented
Research and teaching oriented
Research or teaching in positions
Research or teaching in positions
Missing Missing Total Total
% N % N % N % N % N % N 1 33 5 40 6 20 3 0 0 7 1 100 15 2 0 0 0 0 0 0 0 0 100 4 100 4 3 0 0 13 2 69 11 19 3 0 0 100 16 4 0 0 0 0 92 11 0 0 8 1 100 12 Total 11 5 17 8 53 25 6 3 13 6 100 47
Table 7.1.16: Level of researchers' autonomy in R3 by Country clusters in career stage R3
Level of researchers' autonomy in R3 Country clusters in career stage R3
low level of auton-omy
low level of autonomy
middle level of autonomy
middle level of autonomy
high level of autonomy
high level of autonomy
Missing Missing Total Total
% N % N % N % N % N 1 73 11 13 2 7 1 7 1 100 15 2 0 0 25 1 0 0 75 3 100 4 3 6 1 63 10 31 5 0 0 100 16 4 8 1 42 5 50 6 0 0 100 12 Total 28 13 38 18 26 12 9 4 100 47

MORE2 – Career paths Cross-Country Report
April 2013 92
Table 7.1.17: Type of funding: Majority of R3 positions by Country clusters in career stage R3
Type of funding: Majority of R3 positions Country clusters in career stage R3
majority funded by block funding
majority funded by block funding
majority funded by competitive funding
majority funded by competitive funding
balance be-tween block and competi-tive funding
balance be-tween block and competi-tive funding
block or competitive funding
block or competitive funding
Missing Missing Total Total
% N % N % N % N % N % N 1 87 13 7 1 0 0 0 0 7 1 100 15 2 25 1 0 0 0 0 0 0 75 3 100 4 3 50 8 6 1 25 4 13 2 6 1 100 16 4 100 12 0 0 0 0 0 0 0 0 100 12 Total 72 34 4 2 9 4 4 2 11 5 100 47
Table 7.1.18: Tenure-track option available in R3 by Country clusters in career stage R3
Tenure-track option available in R3 Country clusters in career stage R3
No No Yes Yes Missing Missing Total Total
% N % N % N % N 1 47 7 53 8 0 0 100 15 2 25 1 25 1 50 2 100 4 3 13 2 88 14 0 0 100 16 4 33 4 67 8 0 0 100 12 Total 30 14 66 31 4 2 100 47
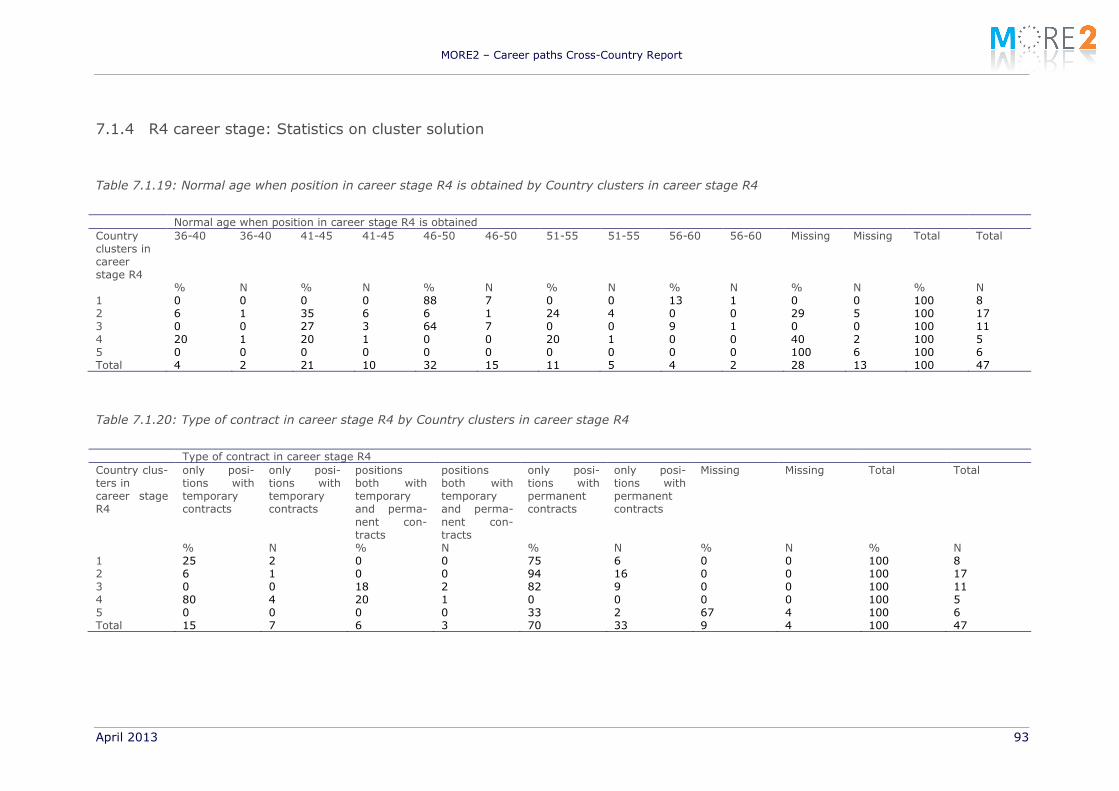
MORE2 – Career paths Cross-Country Report
April 2013 93
7.1.4 R4 career stage: Statistics on cluster solution
Table 7.1.19: Normal age when position in career stage R4 is obtained by Country clusters in career stage R4
Normal age when position in career stage R4 is obtained Country clusters in career stage R4
36-40 36-40 41-45 41-45 46-50 46-50 51-55 51-55 56-60 56-60 Missing Missing Total Total
% N % N % N % N % N % N % N 1 0 0 0 0 88 7 0 0 13 1 0 0 100 8 2 6 1 35 6 6 1 24 4 0 0 29 5 100 17 3 0 0 27 3 64 7 0 0 9 1 0 0 100 11 4 20 1 20 1 0 0 20 1 0 0 40 2 100 5 5 0 0 0 0 0 0 0 0 0 0 100 6 100 6 Total 4 2 21 10 32 15 11 5 4 2 28 13 100 47
Table 7.1.20: Type of contract in career stage R4 by Country clusters in career stage R4
Type of contract in career stage R4 Country clus-ters in career stage R4
only posi-tions with temporary contracts
only posi-tions with temporary contracts
positions both with temporary and perma-nent con-tracts
positions both with temporary and perma-nent con-tracts
only posi-tions with permanent contracts
only posi-tions with permanent contracts
Missing Missing Total Total
% N % N % N % N % N 1 25 2 0 0 75 6 0 0 100 8 2 6 1 0 0 94 16 0 0 100 17 3 0 0 18 2 82 9 0 0 100 11 4 80 4 20 1 0 0 0 0 100 5 5 0 0 0 0 33 2 67 4 100 6 Total 15 7 6 3 70 33 9 4 100 47

MORE2 – Career paths Cross-Country Report
April 2013 94
Table 7.1.21: Research/teaching nexus: R4 positions by Country clusters in career stage R4
Research/teaching nexus: R4 positions Country clusters in career stage R4
Teaching-oriented Teaching-oriented
Research-oriented
Research-oriented
Research and teach-ing oriented
Research and teach-ing oriented
Missing Missing Total Total
% N % N % N % N % N 1 25 2 13 1 63 5 0 0 100 8 2 6 1 6 1 82 14 6 1 100 17 3 9 1 0 0 91 10 0 0 100 11 4 20 1 40 2 0 0 40 2 100 5 5 0 0 0 0 0 0 100 6 100 6 Total 11 5 9 4 62 29 19 9 100 47
Table 7.1.22: Level of researchers' autonomy in R4 by Country clusters in career stage R4
Level of researchers' autonomy in R4 Country clus-ters in career stage R4
low level of autonomy
low level of autonomy
middle level of autonomy
middle level of autonomy
high level of autonomy
high level of autonomy
Missing Missing Total Total
% N % N % N % N % N 1 13 1 38 3 50 4 0 0 100 8 2 6 1 12 2 82 14 0 0 100 17 3 0 0 73 8 27 3 0 0 100 11 4 0 0 60 3 20 1 20 1 100 5 5 0 0 17 1 0 0 83 5 100 6 Total 4 2 36 17 47 22 13 6 100 47

MORE2 – Career paths Cross-Country Report
April 2013 95
Table 7.1.23: Type of funding: Majority of R4 positions by Country clusters in career stage R4
Type of funding: Majority of R4 positions Country clus-ters in career stage R4
majority funded by block fund-ing
majority funded by block fund-ing
majority funded by competitive funding
majority funded by competitive funding
balance be-tween block and competi-tive funding
balance be-tween block and competi-tive funding
Missing Missing Total Total
% N % N % N % N % N 1 88 7 0 0 13 1 0 0 100 8 2 94 16 0 0 0 0 6 1 100 17 3 73 8 9 1 18 2 0 0 100 11 4 80 4 0 0 0 0 20 1 100 5 5 17 1 0 0 0 0 83 5 100 6 Total 77 36 2 1 6 3 15 7 100 47
Table 7.1.24: Tenure-track option available in R4 by Country clusters in career stage R4
Tenure-track option available in R4 Country clusters in career stage R4
No No Yes Yes Missing Missing Total Total
% N % N % N % N 1 88 7 13 1 0 0 100 8 2 29 5 71 12 0 0 100 17 3 0 0 100 11 0 0 100 11 4 60 3 40 2 0 0 100 5 5 17 1 17 1 67 4 100 6 Total 34 16 57 27 9 4 100 47

MORE2 – Career paths Cross-Country Report
April 2013 96
7.2 Descriptive statistics for the country classification of academic career systems (section 3.5)
7.2.1 Academics’ employment
Table 7.2.1: Vertical differentiation of staff structure by academic career systems’ country clusters
Academic career systems’ country clusters
Vertical differentiation of staff structure chair-model chair-model department-model department-model Missing Missing Total Total
% N % N % N % N 1 80 4 0 0 20 1 100 5 2 22 2 78 7 0 0 100 9 3 0 0 92 12 8 1 100 13 4 40 8 50 10 10 2 100 20 Total 30 14 62 29 9 4 100 47
Table 7.2.2: Majority of researchers in R1+R2 by academic career systems’ country clusters
Majority of researchers in R1+R2 Academic ca-reer systems’ country clus-ters
Most researchers in R3+R4
Most researchers in R3+R4
Most researchers in R1+R2
Most researchers in R1+R2
Missing Missing Total Total
% N % N % N % N 1 20 1 40 2 40 2 100 5 2 33 3 56 5 11 1 100 9 3 15 2 23 3 62 8 100 13 4 25 5 45 9 30 6 100 20 Total 23 11 40 19 36 17 100 47

MORE2 – Career paths Cross-Country Report
April 2013 97
Table 7.2.3: Career stage with own research agenda by academic career systems’ country clusters
Career stage with own research agenda Academic ca-reer systems’ country clus-ters
never never R1 R1 R2 R2 R3 R3 R4 R4 Missing Missing Total Total
% N % N % N % N % N % N % N 1 20 1 0 0 20 1 40 2 20 1 0 0 100 5 2 0 0 0 0 0 0 89 8 11 1 0 0 100 9 3 0 0 8 1 46 6 23 3 0 0 23 3 100 13 4 0 0 20 4 40 8 15 3 15 3 10 2 100 20 Total 2 1 11 5 32 15 34 16 11 5 11 5 100 47
Table 7.2.4: All Contracts in R1+R2 positions are shorter than 2 years by academic career systems’ country clusters
All Contracts in R1+R2 positions are shorter than 2 years Academic career systems’ country clusters
No No Yes Yes Missing Missing Total Total
% N % N % N % N 1 80 4 20 1 0 0 100 5 2 89 8 11 1 0 0 100 9 3 92 12 0 0 8 1 100 13 4 80 16 15 3 5 1 100 20 Total 85 40 11 5 4 2 100 47

MORE2 – Career paths Cross-Country Report
April 2013 98
Table 7.2.5: Age range of first permanent position by academic career systems’ country clusters
Age range of first permanent position Academic career sys-tems’ coun-try clusters
no rank with permanent contract
no rank with permanent contract
-30 -30 31-35 31-35
36-40 36-40
41-45 41-45
46-50 46-50
Missing Missing Total Total
% N % N % N % N % N % N % N % N 1 60 3 0 0 0 0 0 0 20 1 0 0 20 1 100 5 2 0 0 11 1 11 1 22 2 22 2 33 3 0 0 100 9 3 15 2 0 0 8 1 46 6 8 1 0 0 23 3 100 13 4 0 0 0 0 20 4 30 6 20 4 15 3 15 3 100 20 Total 11 5 2 1 13 6 30 14 17 8 13 6 15 7 100 47
Table 7.2.6: Rank at which first permanent position can be obtained by academic career systems’ country clusters
Rank at which first permanent position can be obtained Academic ca-reer systems’ country clusters
no rank with permanent con-tract
no rank with permanent con-tract
R1 R1 R2 R2 R3 R3 R4 R4 Total Total
% N % N % N % N % N % N 1 60 3 0 0 0 0 20 1 20 1 100 5 2 0 0 0 0 11 1 56 5 33 3 100 9 3 15 2 8 1 8 1 69 9 0 0 100 13 4 0 0 15 3 15 3 40 8 30 6 100 20 Total 11 5 9 4 11 5 49 23 21 10 100 47

MORE2 – Career paths Cross-Country Report
April 2013 99
Table 7.2.7: Importance of performance in career advancement (most common among positions) by academic career systems’ country clusters
Importance of performance in career advancement (most common among positions) Academic career systems’ country clusters
no perfor-mance-orientation
no perfor-mance-orientation
some perfor-mance orien-tation
some perfor-mance orien-tation
performance orientation
performance orientation
categories are equally dis-tributed among posi-tions
categories are equally dis-tributed among posi-tions
Total Total
% N % N % N % N % N 1 60 3 0 0 40 2 0 0 100 5 2 0 0 22 2 67 6 11 1 100 9 3 15 2 23 3 62 8 0 0 100 13 4 10 2 15 3 65 13 10 2 100 20 Total 15 7 17 8 62 29 6 3 100 47
Table 7.2.8: Selection criteria provided by law by academic career systems’ country clusters
Selection criteria provided by law Academic career systems’ coun-try clusters
selection criteria not in law
selection criteria not in law
selection criteria by law
selection criteria by law
Missing Missing Total Total
% N % N % N % N 1 100 5 0 0 0 0 100 5 2 56 5 22 2 22 2 100 9 3 62 8 23 3 15 2 100 13 4 50 10 25 5 25 5 100 20 Total 60 28 21 10 19 9 100 47

MORE2 – Career paths Cross-Country Report
April 2013 100
Table 7.2.9: International mobility as prerequisite of an academic career by academic career systems’ country clusters
International mobility a prerequisite of an academic career? Academic ca-reer systems’ country clus-ters
no no in certain areas only
in certain areas only
yes yes Missing Missing Total Total
% N % N % N % N % N 1 40 2 20 1 40 2 0 0 100 5 2 11 1 11 1 33 3 44 4 100 9 3 31 4 15 2 23 3 31 4 100 13 4 30 6 20 4 40 8 10 2 100 20 Total 28 13 17 8 34 16 21 10 100 47
Table 7.2.10: Schemes to enhance international mobility by academic career systems’ country clusters
Schemes to enhance international mobility Academic ca-reer systems’ country clus-ters
None/only European None/only Euro-pean
National initiatives National initiatives Missing Missing Total Total
% N % N % N % N 1 80 4 20 1 0 0 100 5 2 56 5 44 4 0 0 100 9 3 46 6 31 4 23 3 100 13 4 35 7 60 12 5 1 100 20 Total 47 22 45 21 9 4 100 47

MORE2 – Career paths Cross-Country Report
April 2013 101
Table 7.2.11: Financial reward of R4 against R3 position by academic career systems’ country clusters
Financial reward of R4 against R3 position Academic career systems’ coun-try clusters
missing missing Up to 20% more in-come in R4
Up to 20% more in-come in R4
21-40% more in-come in R4
21-40% more in-come in R4
41-200% more in-come in R4
41-200% more in-come in R4
Total Total
% N % N % N % N % N 1 60 3 0 0 40 2 0 0 100 5 2 33 3 11 1 44 4 11 1 100 9 3 31 4 0 0 31 4 38 5 100 13 4 0 0 40 8 35 7 25 5 100 20 Total 21 10 19 9 36 17 23 11 100 47
Table 7.2.12: Financial reward of R3 against R2 position by academic career systems’ country clusters
Financial reward of R3 against R2 position Academic career systems’ coun-try clusters
missing missing Up to 20% more in-come in R3
Up to 20% more in-come in R3
21-40% more in-come in R3
21-40% more in-come in R3
41-200% more in-come in R3
41-200% more in-come in R3
Total Total
% N % N % N % N % N 1 60 3 20 1 20 1 0 0 100 5 2 11 1 11 1 56 5 22 2 100 9 3 31 4 15 2 31 4 23 3 100 13 4 5 1 60 12 25 5 10 2 100 20 Total 19 9 34 16 32 15 15 7 100 47
Table 7.2.13: Financial reward of R4 against R1 position by academic career systems’ country clusters
Financial reward of R4 against R1 position Academic career systems’ coun-try clusters
missing missing Up to 100% more in-come in R4
Up to 100% more in-come in R4
100-200% more in-come in R4
100-200% more in-come in R4
201 or more income in R4
201 or more income in R4
Total Total
% N % N % N % N % N 1 100 5 0 0 0 0 0 0 100 5 2 56 5 33 3 0 0 11 1 100 9 3 15 2 23 3 38 5 23 3 100 13 4 0 0 45 9 35 7 20 4 100 20 Total 26 12 32 15 26 12 17 8 100 47

MORE2 – Career paths Cross-Country Report
April 2013 102
Table 7.2.14: Social security level by academic career systems’ country clusters
Social security level Academic ca-reer systems’ country clus-ters
low level of so-cial security
low level of social security
middle level of social security
middle level of social security
high level of social security
high level of social security
Missing Missing Total Total
% N % N % N % N % N 1 40 2 0 0 60 3 100 5 40 2 2 56 5 22 2 22 2 100 9 56 5 3 31 4 31 4 38 5 100 13 31 4 4 20 4 30 6 50 10 100 20 20 4 Total 32 15 26 12 43 20 100 47 32 15
7.2.2 Credentials
Table 7.2.15: Characteristics of doctoral training by academic career systems’ country clusters
Characteristics of doctoral training
Academic career systems’ country clusters
Structured doctoral programs not predom-inant and not manda-tory
Structured doctoral programs not predom-inant and not manda-tory
Structured doctoral programs not predom-inant but mandatory
Structured doctoral programs not predom-inant but mandatory
Structured doctoral programs predominant but not mandatory
Structured doctoral programs predominant but not mandatory
Structured doctoral programs predominant and manda-tory
Structured doctoral programs predominant and manda-tory
Missing Missing Total Total
% N % N % N % N % N % N 1 60 3 0 0 40 2 100 5 60 3 0 0 2 44 4 33 3 22 2 100 9 44 4 33 3 3 23 3 23 3 54 7 100 13 23 3 23 3 4 30 6 25 5 45 9 100 20 30 6 25 5 Total 34 16 23 11 43 20 100 47 34 16 23 11

MORE2 – Career paths Cross-Country Report
April 2013 103
Table 7.2.16: Second degree needed by academic career systems’ country clusters
Second degree needed Academic ca-reer systems’ country clus-ters
no no no, but tradition no, but tradition yes yes Missing Missing Total Total
% N % N % N % N % N 1 80 4 0 0 20 1 0 0 100 5 2 78 7 11 1 11 1 0 0 100 9 3 46 6 8 1 46 6 0 0 100 13 4 60 12 10 2 25 5 5 1 100 20 Total 62 29 9 4 28 13 2 1 100 47
Table 7.2.17: Doctorate awarding institution by academic career systems’ country clusters
Doctorate awarding institution Academic ca-reer systems’ country clus-ters
Universities plus oth-ers
Universities plus oth-ers
Universities Universities Missing Missing Total Total
% N % N % N % N 1 60 3 20 1 20 1 100 5 2 44 4 56 5 0 0 100 9 3 8 1 77 10 15 2 100 13 4 10 2 80 16 10 2 100 20 Total 21 10 68 32 11 5 100 47

MORE2 – Career paths Cross-Country Report
April 2013 104
7.2.3 Intra-organizational practices
Table 7.2.18: Site where positions are mainly advertised by academic career systems’ country clusters
Where are positions mainly advertised?
Academic career sys-tems’ country clusters
Institutional Institutional National National International International Missing Missing Total Total
% N % N % N % N % N 1 60 3 40 2 0 0 0 0 100 5 2 33 3 44 4 22 2 0 0 100 9 3 31 4 46 6 23 3 0 0 100 13 4 30 6 60 12 5 1 5 1 100 20 Total 34 16 51 24 13 6 2 1 100 47
Table 7.2.19: Main source of funding in R3 positions by academic career systems’ country clusters
Main source of funding in R3 positions Academic ca-reer systems’ country clus-ters
block funding block fund-ing
competitive funding competitive funding block or competi-tive funding
block or competi-tive funding
Total Total
% N % N % N % N 1 80 4 0 0 20 1 100 5 2 78 7 0 0 22 2 100 9 3 62 8 15 2 23 3 100 13 4 80 16 0 0 20 4 100 20 Total 74 35 4 2 21 10 100 47

MORE2 – Career paths Cross-Country Report
April 2013 105
Table 7.2.20: Level of HEI autonomy by academic career systems’ country clusters
Level of HEI autonomy Academic career systems’ country clusters
low level low level middle level middle level high level high level Total Total
% N % N % N % N 1 0 0 20 1 80 4 100 5 2 0 0 44 4 56 5 100 9 3 23 3 54 7 23 3 100 13 4 30 6 55 11 15 3 100 20 Total 19 9 49 23 32 15 100 47

MORE2 – Career paths Cross-Country Report
April 2013 106
Table 7.2.21: Country-wide or institutional selection procedures by academic career systems’ country clusters
Country-wide or institutional selection procedures Academic ca-reer systems’ country clusters
institution-based institution-based country-wide country-wide Missing Missing Total Total
% N % N % N % N 1 100 5 0 0 0 0 100 5 2 100 9 0 0 0 0 100 9 3 77 10 15 2 8 1 100 13 4 100 20 0 0 0 0 100 20 Total 94 44 4 2 2 1 100 47
7.2.4 Inter-organizational practices
Table 7.2.22: Degree of sectoral differentiation by academic career systems’ country clusters
Degree of sectoral differentiation
Academ-ic career systems’ country clusters
R&D per-formed by busi-ness sec-tor
R&D per-formed by busi-ness sec-tor
R&D per-formed by busi-ness and HE sec-tors
R&D per-formed by busi-ness and HE sec-tors
R&D per-formed by business and gov-ernment sectors
R&D per-formed by business and gov-ernment sectors
R&D dominat-ed by business sector but other sector are also rele-vant
R&D dominat-ed by business sector but other sector are also rele-vant
R&D per-formed by all sectors on a rel-evant scale
R&D per-formed by all sectors on a rel-evant scale
Miss-ing
Miss-ing
To-tal
To-tal
% N % N % N % N % N % N % N 1 40 2 40 2 20 1 0 0 0 0 0 0 100 5 2 0 0 78 7 0 0 0 0 0 0 22 2 100 9 3 0 0 38 5 0 0 15 2 23 3 23 3 100 13 4 30 6 25 5 5 1 5 1 20 4 15 3 100 20 Total 17 8 40 19 4 2 6 3 15 7 17 8 100 47

MORE2 – Career paths Cross-Country Report
April 2013 107
Table 7.2.23: Intersectoral mobility as a prerequisite of a particular career path by academic career systems’ country clusters
Intersectoral mobility as a prerequisite of a particular career path Academic career systems’ country clusters
yes yes no no Missing Missing Total Total
% N % N % N % N 1 0 0 100 5 0 0 100 5 2 0 0 100 9 0 0 100 9 3 0 0 100 13 0 0 100 13 4 35 7 60 12 5 1 100 20 Total 15 7 83 39 2 1 100 47
Table 7.2.24: Vertical differentiation of HE sector by academic career systems’ country clusters
Vertical differentiation of HE sector Academic ca-reer systems’ country clus-ters
teaching-only type of HEI teaching-only type of HEI
no teaching-only type of HEI
no teaching-only type of HEI
Missing Missing Total Total
% N % N % N % N 1 20 1 80 4 0 0 100 5 2 33 3 67 6 0 0 100 9 3 8 1 85 11 8 1 100 13 4 25 5 60 12 15 3 100 20 Total 21 10 70 33 9 4 100 47

MORE2 – Career paths Cross-Country Report
April 2013 108
Table 7.2.25: Attractiveness of higher education compared to other sectors by academic career systems’ country clusters
Attractiveness of higher education compared to other sectors Academic career sys-tems’ coun-try clusters
less attractive less attractive similarly at-tractive
similarly at-tractive
more attrac-tive
more attrac-tive
Missing Missing Total Total
% N % N % N % N % N 1 0 0 40 2 40 2 20 1 100 5 2 0 0 44 4 56 5 0 0 100 9 3 15 2 69 9 15 2 0 0 100 13 4 25 5 25 5 45 9 5 1 100 20 Total 15 7 43 20 38 18 4 2 100 47
Table 7.2.26: Competition by universities by academic career systems’ country clusters
Competition by universities Academic career sys-tems’ country clusters
low level of compe-tition
low level of com-petition
middle level of competition
middle level of competition
high level of com-petition
high level of com-petition
Total Total
% N % N % N % N 1 0 0 80 4 20 1 100 5 2 0 0 100 9 0 0 100 9 3 46 6 54 7 0 0 100 13 4 75 15 25 5 0 0 100 20 Total 45 21 53 25 2 1 100 47
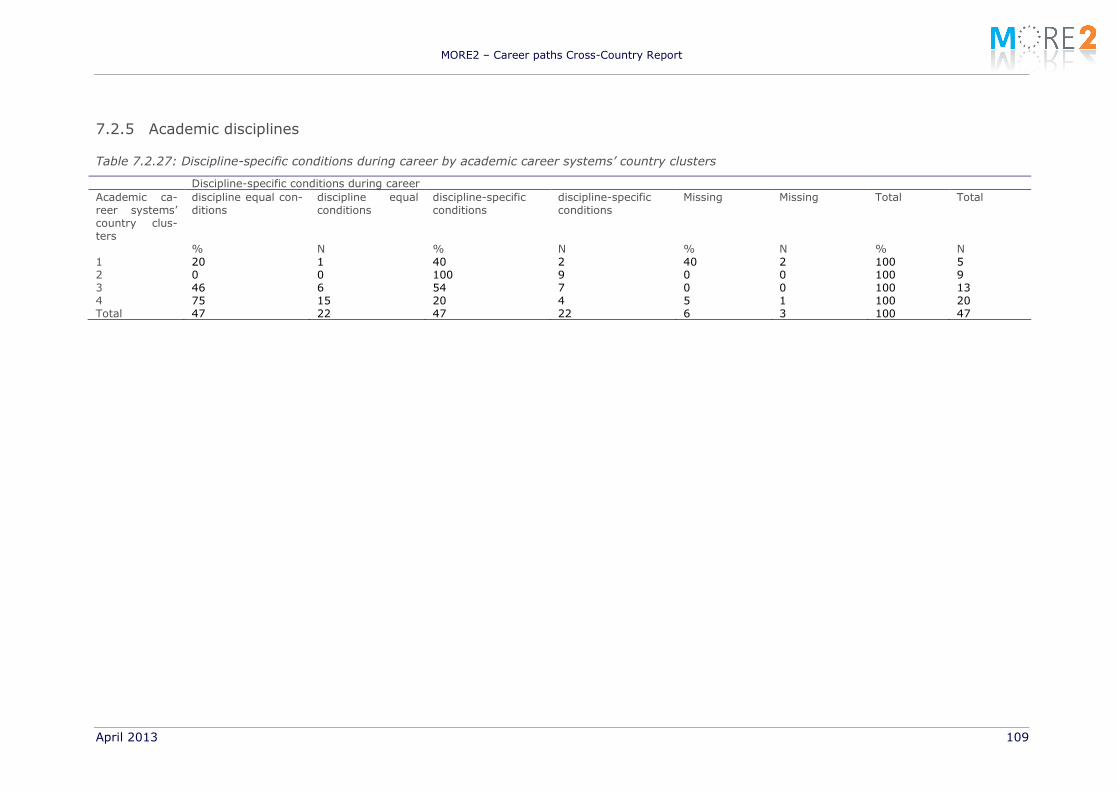
MORE2 – Career paths Cross-Country Report
April 2013 109
7.2.5 Academic disciplines
Table 7.2.27: Discipline-specific conditions during career by academic career systems’ country clusters
Discipline-specific conditions during career
Academic ca-reer systems’ country clus-ters
discipline equal con-ditions
discipline equal conditions
discipline-specific conditions
discipline-specific conditions
Missing Missing Total Total
% N % N % N % N 1 20 1 40 2 40 2 100 5 2 0 0 100 9 0 0 100 9 3 46 6 54 7 0 0 100 13 4 75 15 20 4 5 1 100 20 Total 47 22 47 22 6 3 100 47