fourth european working conditions survey
TRANSCRIPT

Fourth European WorkingConditions Survey

Fourth European Working Conditions Survey

Authors: Agnès Parent-Thirion, Enrique Fernández Macías, John Hurley, Greet VermeylenResearch institute: European Foundation for the Improvement of Living and Working Conditions, DublinResearch managers: Agnès Parent-Thirion, Enrique Fernández Macías, John Hurley, Greet Vermeylen Research project: European survey on working conditions

Fourth European Working Conditions Survey
Wyattville Road, Loughlinstown, Dublin 18, Ireland - Tel: (+353 1) 204 31 00 - Fax: (+353 1) 282 42 09 / 282 64 56 email: [email protected] - website: www.eurofound.europa.eu

Cataloguing data can be found at the end of this publication.
Luxembourg: Office for Official Publications of the European Communities, 2007
ISBN 92-897-0974-X
© European Foundation for the Improvement of Living and Working Conditions, 2007
For rights of translation or reproduction, applications should be made to the Director, European Foundation for the Improvement ofLiving and Working Conditions, Wyattville Road, Loughlinstown, Dublin 18, Ireland.
The European Foundation for the Improvement of Living and Working Conditions is an autonomous body of the European Union, created to assist in the formulation of future policy on social and work-related matters. Further information can be found on theFoundation website at www.eurofound.europa.eu
European Foundation for the Improvement of Living and Working ConditionsWyattville RoadLoughlinstownDublin 18IrelandTelephone: (+353 1) 204 31 00Fax: (+353 1) 282 42 09 / 282 64 56Email: [email protected]
Printed in Denmark
The paper used in this book is chlorine-free and comes from managed forests in northern Europe. For every tree felled, at least one new tree is planted.

As the European Union continues to expand its borders, the differing norms in terms of both working and livingconditions across the continent become increasingly apparent. For Europe’s policymakers, such differencespresent serious challenges as they seek to increase productivity, boost employment and improve quality of work.In this context, understanding the conditions of work across the different EU Member States and other Europeancountries is of fundamental importance. Equally, tracking the changes in these areas of quality of work is key toidentifying trends which might influence future developments in this sphere.
In this report on the fourth European Working Conditions Survey, the Foundation provides a comprehensiveoverview of the state of working conditions across 31 countries in Europe. Reflecting workers’ responses on a widerange of issues such as work organisation, working time, equal opportunities, training, health and well-being andjob satisfaction, the report presents a very valuable insight into how European workers experience and assess theirworking lives and working conditions. Moreover, the five-year cycle of the survey provides an effective means oftracking the impact on working conditions of critical factors and events over a period of time.
As the European Union moves towards implementing the Lisbon objectives in an environment of increasingglobal competition and demands, we trust this report will contribute to a better understanding of what is requiredto shape Europe’s working environment into the future.
Jorma Karppinen Willy BuschakDirector Deputy Director
Foreword
v

Foreword v
Introduction 1
1 Context and structural data 3
2 Working time 17
3 Physical risk factors 29
4 Violence, harassment and discrimination in the workplace 35
5 Nature of work 41
6 Work organisation 51
7 Impact of work on health 61
8 Management and communication structures 67
9 Work and non-working life 71
10 Satisfaction with working conditions 77
11 Income and payment systems 83
12 Conclusions 91
Annex 1: Survey methodology 93
Annex 2: Calculation of income deciles 99
Annex 3: Statistical tables 101
Annex 4: Expert questionnaire development group 105
Annex 5: Network of fieldwork institutes 107
Annex 6: Survey questionnaire 109
Contents
vii

viii
Abbreviations used in the report
EWCS European Working Conditions Survey ISCO International Standard Classification of OccupationsLFS Labour Force Survey (Eurostat)NACE Nomenclature générale des activités économiques dans les Communautés européennes (General
industrial classification of economic activities within the European Communities) NUTS Nomenclature des unités territoriales statistiques (Nomenclature of territorial units for statistics)ILO International Labour OrganisationOECD Organisation for Economic Cooperation and Development
Country codes
EU15 15 EU Member States prior to enlargement in 2004NMS 10 new Member States that joined in 2004EU25 15 EU Member States, plus the 10 NMSEU27 25 EU Member States, plus the AC2AC2 Two countries that joined the European Union in 2007: Bulgaria and RomaniaCC2 Two candidate countries for membership of the EU: Croatia and Turkey
Country groups
Continental countries: AT, BE, DE, FR, LU Ireland and the United Kingdom: IE, UK Eastern European countries: CZ, EE, HU, LT, LV, PL, SI, SK Southern European countries: CY, EL, ES, IT, MT, PT Scandinavian countries and the Netherlands: DK, FI, NL, SE Acceding countries: BG, ROCandidate countries: HR, TR EFTA (European Free Trade Association): CH, NO
Typology adapted from Esping-Andersen
AT AustriaBE BelgiumBG BulgariaCY CyprusCZ Czech RepublicDK DenmarkEE EstoniaFI FinlandFR FranceDE GermanyEL GreeceHU HungaryIE IrelandIT ItalyLV LatviaLT Lithuania
LU LuxembourgMT MaltaNL NetherlandsPL PolandPT PortugalRO RomaniaSK SlovakiaSI SloveniaES SpainSE SwedenUK United Kingdom
HR CroatiaNO NorwayCH SwitzerlandTR Turkey

Promoting employment, and improving living and workingconditions, are amongst the primary objectives of theEuropean Union and its Member States, as stipulated inArticle 136 of the Treaty of Rome; in order to achieve thisaim, it is necessary to be able to monitor and assessprogress in this field. To measure working conditions, it isimportant to consider a range of different aspects related tojob characteristics and employment conditions, health andsafety, work organisation, learning and developmentopportunities and the balance between working and non-working life.
Several tools attempt to address elements of quality of workin Europe. Eurostat labour force surveys provide a regularsource of information on European labour markets;however, they give little information on working conditions,with the exception of some of the ad hoc modules. Statisticsare collected at European level on occupational diseases(EODS) as well as on accidents at work (ESAW). They areprimarily based on harmonised national administrativesources. Furthermore, while several countries carry outsurveys on the quality of work, the data from differentcountries are not harmonised.
It was against this background and with the aim ofimproving quality of work in Europe that the Foundationlaunched its first survey on working conditions at thebeginning of the 1990s, to cover the then 12 Member States.The survey has since been repeated in 1995/1996, toinclude the EU15, and again in 2000 when it includedNorway. The 2000 survey was extended in 2001 to includethe 10 new Member States (the then acceding countries) aswell as Bulgaria, Romania and Turkey (at that time, thecandidate countries). In 2005, the fourth European Working
Conditions Survey was carried out simultaneously in 31countries: the EU25; the two acceding countries, Bulgariaand Romania; the two candidate countries, Croatia andTurkey; and Norway and Switzerland, which financed theirown participation in the survey.
The initial aims of the survey remain valid: identifyingpriorities and measuring results; monitoring trends andchanges over the years; and highlighting the possiblecontribution of the survey to policymaking. Over the 15years in which it has run, the survey has provided acomplex and multifaceted portrait of work and workingconditions in an enlarged Europe. It has also stimulatednew research in order to better understand, interpret andcontextualise the data.
This new edition of the European Working ConditionsSurvey has benefited from much valued inputs fromnational and European experts on working conditions anddata collection through a series of meetings aimed atreviewing the questionnaire. In parallel, a critical analysisof the production of the data took place with a view toimproving and ensuring the quality of the data collected. Inaddition, a qualitative post test is being carried out in fiveMember States; it will contribute to better understandingthe influence of (national) cultures and institutionalframeworks.
This report gives a straightforward presentation of the keyresults of the fourth European Working Conditions Survey.More detailed statistical results are available on theFoundation’s website and further in-depth analysis willfocus on some of the key policy issues in greater detail.
1
Introduction

This chapter provides an overview of the employmentstructure across the 31 countries that were included in thefourth European Working Conditions Survey, using tablesand figures to illustrate the data. It gives a breakdown ofthe workforce first by job-related characteristics, then looksat employment status and contract and examines someindividual characteristics of European workers. Finally, thechapter documents the nature and extent of gendersegregation in Europe. It aims to provide backgroundinformation on key characteristics of the Europeanworkforce for the report as a whole. In the general overviewof structural factors in the context of the Europe-widelabour market, all 31 countries are included in the analysis;in the focus on gender segregation, the point of reference isthe EU27.
Wherever possible, the chapter outlines trends for the 15-year period over which the survey has been running (atleast for those variables that have remained the same). Foreach of these variables, conditions in the European Unionat the time of each survey are compared, based on thenumber of Member States at that time. Therefore, theobserved cumulative changes reflect real changes inworking conditions over the period as well as the history ofEuropean integration. (Unless otherwise stated, this chapterconsists of a description of the fourth European WorkingConditions Survey.1 Readers are advised to revert to theLabour Force Survey to quantify precisely some groups inthe European workforce.)
Country groups
In the report, countries are presented in groups according toan adapted Esping-Andersen2 typology, which has beenexpanded to include all countries covered by the survey.The need to use a typology comes from the practicaldifficulties of analysing and reporting data for a largenumber of countries. The reasoning behind the selection ofthis typology was that these groups are familiar to Europeanpolicymakers; moreover, the typology appears to ‘fit’ at leasta superficial description of working conditions issues. Thecountries that took part in the fourth European WorkingConditions Survey are divided into eight groups as follows:
• continental countries: AT, BE, DE, FR, LU3
• Ireland and the United Kingdom: IE, UK
• eastern European countries: CZ, EE, HU, LT, LV, PL, SI,SK
• southern European countries: CY, EL, ES, IT, MT, PT
• Scandinavian countries and the Netherlands4: DK, FI,NL, SE
• acceding countries: BG, RO5
• candidate countries: HR, TR
• EFTA6: CH, NO
This typology will be used throughout the report to highlightdifferences between country groups.
Employment situation in Europe
At the time the survey was carried out, about 235 millionpeople were employed in the 31 countries included in thesurvey. Table 1.1 presents key labour-market indicators foreach country.
These indicators highlight the following divergencesbetween countries:
• the high weighting of a number of countries compared tothe averages: when considering the EU27, 50% ofworkers are concentrated in five countries – Germany(17%), UK (14%), France (12%), Italy (11%) and Spain(9%);
• the varying performances in employment andunemployment rates: for example, there is a differenceof over 20 percentage points between Poland (52%) andDenmark (over 75%) regarding employment rates; ninecountries covered by the survey have an unemploymentrate of more than 10%, while in nine other countries it isbelow 6%;
• the different participation rates of women in theworkforce: there is a gender employment gap of less than10 percentage points in eight countries; in seven othercountries, conversely, there is a gap of more than 20percentage points;
• the different levels of use of temporary contracts;
• divergences in the use of part-time work: in seven of thesurvey countries, more than one out of five workersworks part time; in 13 other countries, fewer than one in10 works part time. In 12 countries, more than onewoman in three works part time, while in seven countriesthe equivalent figure is less than one in 10.
These differences in labour market indicators are likely toimpact on working conditions. Along with legal, social,
1 Quality Report of the 4th European Working Conditions Survey. (http:www.eurofound.europa.eu/ewco/surveys/EWCS2005/qualityassurance.htm) documentsthe coherence of variables from the survey with similar variables from other surveys.
2 Esping-Andersen, G., The three worlds of welfare capitalism, Cambridge, Polity Press, 1990.3 An explanation of the country codes is given on page viii at the beginning of the report.4 Due to increased similarities between Scandinavian countries and the Netherlands, the latter has been added to the group.5 Bulgaria and Romania became EU Member States on 1 January 2007. 6 European Free Trade Association
Context and structural data 1
3

economic and cultural differences, they are worth keepingin mind when reading and interpreting results.
Sectoral distribution
In the EU27, more than 66% of the workforce is employedin the services industry (codes G to Q in the NACEclassification); 29% work in manufacturing (codes C to F)and 5% work in agriculture (codes A and B). The biggest
employers in the EU27 are the manufacturing industry(employing 19% of European workers), the wholesale andretail trade (16%), as well as health (10%) and education(7%).7
Since 1991, the trend towards declining employment inagriculture and manufacturing has continued, as has thetrend of a corresponding increase in employment in
4
Fourth European Working Conditions Survey
Table 1.1: Key labour market indicators in Europe
Employment Employment Unemploy- Male Female Gender Temporary Part-time Part-time (000s) rate, % ment employment employment employment contracts, work, work, % of
rate, % rate, % rate, % gap, percent- % of % of femaleage points workforce workforce workforce
BE 4,134 60.6 8.4 67.9 53.3 14.6 8.6 21.5 40.5
DE 35,811 65.9 10.1 71.6 60.1 11.5 12.4 22.3 41.6
FR 24,048 62.9 9.5 68.5 57.3 11.2 12.6 16.9 30.3
LU 186 61.6 4.8 72.4 50.6 21.8 4.9 17.8 40.2
AT 3,745 68.1 5 75.2 61 14.2 8.7 19.7 38
EL 4,250 59.6 10.5 73.8 45.5 28.3 11.7 4.6 8.5
ES 18,181 61.8 10.6 74.2 49.2 25 32.9 8.7 17.7
IT 22,286 58 8.3 70.2 45.9 24.3 12 12.8 25.2
CY 332 68.8 5.2 79.8 58.6 21.2 12.6 8.5 13.4
MT 147 54.0 7 74.3 33.5 40.8 5.1 8.9 20.6
PT 4,821 67.8 7.5 73.8 62 11.8 19.4 11.5 16.5
DK 2,691 75.6 5.1 79.4 71.6 7.8 8.8 22.1 33.2
NL 8,022 73.1 4.6 80 66.1 13.9 15.1 45.8 74.6
FI 2,327 67.1 8 69 65.1 3.9 14.7 14.4 19.7
SE 4,195 71.5 6.2 73.1 69.9 3.2 15.2 24 36.7
IE 1,859 66.7 4.5 76 57.2 18.8 3.6 16.7 31.4
UK 27,614 71.8 4.7 78 65.7 12.3 6 25.3 42.9
CZ 4,672 64.5 8.2 72.8 56.1 16.7 9.1 4.8 8.3
EE 577 63.4 8.7 67.9 59.4 8.5 2.4 7.7 9.4
LT 1,423 61.4 10.7 64.9 58.1 6.8 5.8 8 10.1
LV 987 62.2 10.3 65.9 58.7 7.2 8.9 11.1 14.1
HU 3,884 57 6.3 63.3 51 12.3 7.1 4.7 6.4
PL 13,731 52.4 18.3 58.4 46.5 11.9 24 11.1 14.5
SI 911 64.9 6.6 70.1 59.5 10.6 17.7 8.8 10.3
SK 2,189 57.5 17.3 64 51.1 12.9 5.7 2.6 4.2
BG 2,871 54.1 12 58 50.3 7.7 6.9 1.9 2.2
RO 8,592 57.4 8.5 63.2 51.6 11.6 2 9.2 9.5
HR 1,333† 54.9 14.1 62.3 47.8 14.5 12.4 8.7 11.1
TR 21,791 43.7 10.3 73.5 26.5 47 No data 16.6* 30.8*
NO 2,226 75.3 3.9 78.1 72.5 5.6 10.1 29.4 45.7
CH 3,959 67.3 4.3 76 59.1 16.9 No data 31.7* 56.9
Source: EU data: Labour Force Survey, Statistics in Focus, 6/2005 (labour market trends for fourth quarter 2004); Turkey: national statistics, 2004; Switzerland:
Enquête suisse sur la population active (ESPA) Office fédéral de la statistique, 2004; Croatia: From the LFS 3rd quarter 2005 and the Croatian Statistical Office
website (†); * Foundation’s own calculations.
7 Data have been weighted against the Labour Force Survey (LFS) for sectors, occupations, age, sex and region.

services, particularly in real estate, and health and socialwork. This trend has, however, halted slightly since the lastwave of enlargement in 2004.
Country differences in the distribution of sectoralemployment are important. In particular, the importance ofagriculture as an employer varies considerably betweencountries: just 1% of the workforce is employed in agricul -ture in Cyprus, while it employs more than 10% of the
workforce in Greece, Latvia, Lithuania and Poland, and
more than 30% of the workforce in Romania and Turkey.
The specific nature of working conditions in agriculture is
likely to impact on general working conditions in these
countries: agricultural workers, by comparison with those
in other sectors, are particularly exposed to physical risks
and long and non-standard working hours; however, they
also have greater latitude for decision-making.8 Similarly,
manufacturing employs a higher percentage of the
5
Context and structural data
Figure 1.1: Distribution of employment, by sector (%)
TR
RO
PL
LT
EL
LV
BG
EE
IE
ES
SI
EU27
CZ
HR
AT
HU
SK
FI
CH
NL
BE
PT
NO
SE
MT
LU
UK
IT
DK
FR
DE
CY
agriculture
manufacturing
electricity, gas and water
construction
wholesale and retail trade
hotels and restaurants
transport and communication
financial intermediation
real estate
public administration and defence
education
health
other services
0 10 20 30 40 50 60 70 80 90 100
8 See, for example, the Foundation study, Sectoral profiles of working conditions, http://www.eurofound.europa.eu/pubdocs/2002/75/en/1/ef0275en.pdf
Figure 1.2: Distribution of types of occupation, bycountry (%)
LU
NL
SE
CH
DK
NO
BE
DE
UK
EE
AT
FR
IE
EU27
SI
MT
SK
CZ
LV
HU
LT
EL
ES
BG
HR
CY
PT
PL
RO
TR
high-skilled white-collar low-skilled white-collar
high-skilled blue-collar low-skilled blue-collar
FI
IT
0 10 20 30 40 50 60 70 80 90 100

workforce in the eastern European countries; depending onthe types of manufacturing being carried out, this will alsoimpact on general working conditions in these countries.
Occupational distribution
The occupational structure of the employed population inthe EU27 is composed of high-skilled white-collaroccupations (37%), low-skilled white-collar occupations(25%), high-skilled blue-collar occupations (18%), and low-skilled blue-collar occupations (20%).9 In nine Member
States, high-skilled white-collar jobs now account for morethan 40% of employment.
Figure 1.2 shows the distribution of workers in terms ofoccupation type in the 31 countries covered by the survey.
Figure 1.3 presents a detailed breakdown of the distributionof employment by occupation. Across the EU27 as a whole,more than 50% of the workforce is employed in fouroccupational categories: professionals (15%), skilledworkers (14%), technicians (13%), and service and salesworkers (13%).
Company size and type
Most workers in Europe work in small companies: 10% inone-person companies, 28% in micro enterprises (up tonine workers), 28% in small enterprises (between 10 and49 workers), 19% in medium-sized enterprises (between 50and 249 workers) and 15% in large enterprises (250employees and over).
Nearly seven out of every 10 workers are employed in theprivate sector; a quarter (25%) works in the public sectorand 6% work in joint private-public organisations or non-governmental bodies. The lowest percentage of public-sector employment is to be found in the acceding andcandidate countries, southern European and continentalcountries.
Employment status
Increased flexibility in recent years has contributed to agreater diversification of employment status, resulting in an
6
Fourth European Working Conditions Survey
Figure 1.3: Occupational distribution of employment,by country (%)
IE
IT
UK
AT
BE
EL
LV
LT
NL
EU27
PT
MT
EE
TR
FR
HU
DK
FI
ES
CY
LU
NO
BG
CH
SK
SE
DE
HR
CZ
PL
SI
RO
senior managers professionals technicians
clerical workers service and sales workersagricultural and fishery workers
skilled workers machine operators unskilled workers
0 10 20 30 40 50 60 70 80 90 100
Figure 1.4: Distribution of employment, by companysize and country group (%)
one-person company micro enterprise (2–9 employees)
small enterprise (10–49 employees) medium enterprise (50–249 employees)
large enterprise (250+ employees)
IE, UK
BE, DE,FR, LU, AT
DK, NL,FI, SE
CZ, EE,LV, LT, HU,
PL, SI, SK
EU27
EL, ES, IT,CY, MT, PT
Non-EU:CH+NO
CC2: TR, HR
AC2: BG, RO
0 10 20 30 40 50 60 70 80 90 100
9 The blue-collar/white-collar worker division is based on assigning ISCO 1-digit categories 1–5 to white collar and ISCO 1-digit categories 6–9 to blue collar(armed forces excluded).

increase in non-permanent, non full-time forms ofemployment.
Self-employment
The survey examined the extent of self-employment acrossEurope, looking in detail at persons who are self-employedon their own (11%), and those who are self-employed withemployees (5%). A higher proportion of men than womenare self-employed: of those who are self-employed withoutemployees, 63% are men while only 37% are women. Theequivalent percentages of men and women who are self-employed and have employees are 73% and 28%respectively.
The percentage of the workforce that is self-employed ishighest in the candidate countries (44% without employees,and 8% with employees) and in the southern Europeancountries (20% and 3% respectively). It is lowest in theScandinavian countries and the Netherlands (7% withoutemployees, and 3% with employees). Across Europe, thereis a great variation in the nature of self-employed work,encompassing entrepreneurs, economically dependantworkers and farmers.
In the EU27, self-employment is most concentrated inagriculture (48% of workers in agriculture are self-employedwithout employees and 7% are self-employed withemployees). It is also quite prevalent in construction, hotelsand restaurants, the wholesale and retail trade, real estateand other services (averaging in these sectors around 14%
of self-employed without employees and between 5% and10% of self-employed with employees).
Of those who are self-employed without employees, 61%are agricultural and fishery workers. The typical self-employed person is an older, male worker who is less skilledthan the rest of the workforce; however, this is less the casewhen self-employed individuals working in the agriculturesector are excluded.
Part-time work
17% of all jobs in the EU27 are part-time jobs and these aremainly held by women: 29% work part time compared to7% of men. The incidence of part-time work is mostprevalent in Ireland and the UK (28%) and in theScandinavian countries and the Netherlands (26%), andleast prevalent in eastern European countries (11%) andsouthern European countries (13%) (see Figure 1.7). Interms of individual countries, it is most common in theNetherlands (where 34% of the workforce works part time)and the UK (29%); overall the proportion of part-timeworkers is above or just reaching the European average innine countries (Belgium, Denmark, Luxembourg,Netherlands, Sweden and the UK). Part-time work is leastcommon in Cyprus, Latvia, Slovakia, Slovenia and Portugal(less than 7%). Over half of all part-time workers (57%)declare they are satisfied with their working hours, 22% saythey would prefer to work full time (the highest proportionsin this respect are reported in eastern European andacceding countries) and 15% say they would like to worklonger hours.
In the EU, part-time work is associated more withemployees and with self-employed workers who have no
7
Context and structural data
Figure 1.5: Non-standard employment in the EuropeanUnion, 1991–2005 (%)
Source: Labour Force Survey.
Note: ‘Temporary employment’ refers to workers on fixed-term contracts and
those on temporary agency contracts.
Self-employment
Part-time work
Temporaryemployment
Second job
10 12 14 16 18 200 2 4 6 8
1991 (EU12) 1995 (EU15) 2000 (EU15) 2005 (EU25)
15–29
15–29
30–49
30–49
self-employed without employees self-employed with employees
employed other
50+
0 10 20 30 40 50 60 70 80 90 100
Men
Women
Men
Women
Men 50+
Women
Figure 1.6: Employment status, by sex and age group,EU27 (%)

employees (17% of the latter work part time, compared toonly 8% of self-employed workers with employees). Part-time work is also more often associated with temporarywork: 25% of workers with a fixed-term contract and 37% oftemporary agency workers work part time; in contrast, only14% of workers on indefinite-term contracts do so.
As regards the sectoral distribution, part-time work is mostprevalent in other services (30%) and health (28%), hotelsand restaurants (27%), and in education and the wholesaleand retail trade (24% and 23% respectively). A significantproportion of unskilled workers (29%), service and salesworkers (28%), and clerical workers (24%) work part time;part-time work is considerably less common for skilledworkers (5%), machine operators (6%) and senior managers(7%).
As Figure 1.8 illustrates, part-time work for womenincreases with age, whereas part-time work is most commonamong the younger (14%) and older (10%) age categories ofmen.
Type of employment contract
Indefinite-term contract On average in the EU27, 78% of employees report holdinga contract of indefinite term; however, substantialdifferences exist between countries: twice as manyrespondents in Luxembourg and Belgium (90% and 89%respectively) hold indefinite contracts as in Cyprus andMalta (46% and 50% respectively). In terms of countrygroups, a higher-than-average proportion of respondents incontinental countries (85%) hold indefinite contracts, whilethe lowest proportion is found in Ireland and the UK andsouthern European countries: 68% and 70%, respectively.In the candidate countries, the majority of employees haveno employment contract (60%), while 28% of them have anindefinite-term contract.
In general, workers with a higher level of education aremore likely to hold an indefinite employment contract: 83%of those with a third-level education hold an indefinite termcontract, as compared to 66% of those with only primarylevel education. Slightly more men (79%) than women(76%) hold an indefinite-term contract. Lower-than-averagepercentages of unskilled workers and skilled agriculturalworkers hold indefinite-term contracts (65% and 58%respectively).
Fixed-term contractOn average in the EU27, 12% of employees work underfixed-term contracts; in this respect, however, there are
8
Fourth European Working Conditions Survey
Figure 1.7: Distribution of part-time and full-time work,by country group (%)
Figure 1.8: Distribution of part-time work, by age andsex, 31 European countries (%)
CZ, EE, LV, LT, HU, PL, SI, SK
EL, ES, IT, CY, MT, PT
AC2: BG, RO
CC2: TR, HR
BE, DE, FR, LU, AT
EU27
DK, NL, FI, SE
IE, UK
Non-EU: CH+NO
part-time full-time
0 10 20 30 40 50 60 70 80 90 100
Men 15–29 Men 30–49 Men 50+ EU27 Women15–29
Women30–49
Women50+
010
30
50
70
90
20
40
60
80
100
part-time full-time
Figure 1.9: Distribution of employment contracts, bycountry group, EU27 (%)
Note: Figures apply to employees only
0 10 20 30 40 50 60 70 80 90 100
indefinite-term contract fixed-term contract temporary employmentagency contract
apprenticeship or othertraining scheme
no contract other
Non-EU: CH+NO
BE, DE, FR, LU, AT
AC2: BG, RO
DK, NL, FI, SE
EU27
CZ, EE, LV, LT,HU, PL, SI, SK
EL, ES, IT,CY, MT, PT
IE, UK
CC2: TR, HR

notable differences between individual countries. Fixed-term contracts are most prevalent in Poland (22% ofemployees), Spain (21%), Bulgaria (19%) and theNetherlands (16%).
Differences also exist between country groups: easternEuropean countries have the highest proportion of fixed-term contracts (17%) – 10 percentage points higher than thecontinental and EFTA countries, which have the lowestproportion (7%).
In the EU27, fixed-term contracts are most common in thehotels and restaurants sector (21%), education (16%),agriculture (15%), health and the wholesale and retail trade(14% in both sectors). Across all age groups, a higherproportion of women than men hold fixed-term contracts(14% compared to 10%). Higher-than-average proportionsof unskilled workers and service and sales workers holdfixed-term contracts (15% and 14% respectively).
On average, the majority (58%) of workers on fixed-termcontracts have a contract of one year’s duration or less,while 20% have a contract with no specified duration.Ireland and the UK are, however, markedly different fromthe average: 21% of workers on fixed-term contracts havecontracts of one year or less and 56% have contracts withno specified duration.
Temporary-agency contract
On average, only 2% of employees hold temporary-agencycontracts: such contracts are most commonly held byemployees in the hotels and restaurants sector and byunskilled workers (4% for both groups). Apprenticeship andtraining contracts are very scarce, being held by only 1% ofemployees.
Lack of employment contract
On average in the EU27, 7% of employees report having noemployment contract; Cyprus has the highest proportion ofsuch employees (42%), followed by Malta (39%), the UK(15%) and Slovenia (10%). The sectors that have the mostemployees without contracts are agriculture (24%) andhotels and restaurants (20%). In terms of occupationalcategories, agricultural workers and unskilled workersreport the highest incidence of being without a contract(24% and 14% respectively).
Labour market entrants
Most of the new entrants to the labour market (those whohave spent fewer than four years in paid employment sincestopping full-time education) are employees (84%). The
majority (54%) hold an indefinite-term contract, 26% havea fixed-term contract, 10% have no contract, 5% areapprentices and 4% are temporary agency workers.
A high percentage of newly hired staff in companies (withless than a year’s seniority) work under a temporaryemployment contract: 40% of workers who have been in acompany for less than one year hold an indefinite-termcontract, 33% a fixed-term contract, 7% a temporary agencycontract, 3% are in an apprenticeship, while 15% have nocontract.10
Profile of the European worker
Educational level The typical European worker is 40 years old and completedfull-time education at the age of 18. On average, 59% ofmen finished their education before or at the age of 18compared to 54% of women.
Major differences between country groups in this respectcan be seen, with workers in the Scandinavian countriesand Netherlands finishing their education at a later agethan workers in the other country groups. This is mirroredby the higher proportion of workers in those countries thatcompletes third-level education.
Job tenureIn the EU27, the average worker has spent 10 years in theircurrent job. However, some sectors are characterised byshorter-than-average periods of job stability: in the hotels
9
Context and structural data
10 Among such employees, 2% were classified as ‘other’.
Figure 1.10: Educational level, by country group (%)
0 10 20 30 40 50 60 70 80 90 100
DK, NL, FI, SE
IE, UK
BE, DE, FR, LU, AT
Non-EU: CH+NO
AC2: BG, RO
EU27
EL, ES, IT,CY, MT, PT
CC2: TR, HR
primary or none (ISCED 0+1) lower-secondary (ISCED 2)
upper-secondary (ISCED 3) post-secondary (ISCED 4) tertiary (ISCED 5+6)

and restaurants sector, 25% of employees have spent onlyone year or less in their job; similarly, in the wholesale andretail trade, real estate, construction, and electricity, gas andwater, 12%–13% of workers report just one year or less ofservice, which is an indication of the sectors with thehighest turnover.
Age Figure 1.11 illustrates how demographic ageing is affectingdifferent country groups: countries such as theScandinavian countries and the Netherlands that have ahigher proportion of older workers will see a substantialproportion (above 15%) of their workforce retiring over thenext 10 years.
Differences also exist between the age profile of differentsectors, as Figure 1.12 illustrates. For example, in twosectors – education and agriculture – the proportion ofworkers aged 55 years or more is more than eightpercentage points higher than the proportion aged 24 years
or under, an indication that these sectors will have to adaptto current demographic pressures.
In contrast, three sectors have a much higher proportion ofyounger workers than older workers: the hotels andrestaurants sector, the wholesale and retail trade andelectricity, gas and water.
Nationality Across all 31 European countries covered by the survey, 3%of workers are not citizens of the country in which theywork: 2% comes from outside the EU, while 1% comes fromanother EU Member State.
Luxembourg has the highest proportion of non-nationalworkers (38%), followed by Estonia (17%), Switzerland andLatvia (14%) and Spain (13%).
Most non-national workers are employed in other servicesand construction (18% and 17%, respectively).
Household characteristicsOver half of all households (55%) have two wage-earnersand around a third (30%) have only one wage-earner. In a
10
Fourth European Working Conditions Survey
Non-EU: CH+NO
DK, NL, FI, SE
IE, UK
AC2: BG, RO
EL, ES, IT, CY, MT, PT
EU27
CZ, EE, LV, LT,HU, PL, SI, SK
BE, DE, FR, LU, AT
CC2: TR, HR
0 5 10 15 20 25 30 35 40 45
24 years or younger 25–39 years
40–54 years 55 years or older
Figure 1.11: Age distribution of workers, by countrygroup (%)
Figure 1.12: Age distribution, by sector, 31 Europeancountries (%)
Hotels and restaurants
Wholesale and retail trade
Electricity, gas and water
Construction
Real estate
Other services
Manufacturing
Agriculture
Transport and communication
Public administration and defence
Financial intermediation
Health
Education
24 years or younger 55 years or older
0 5 10 15 20 25 30 35 40 45

small minority of households (15%), there are more thantwo workers.
Gender segregation
On average in the EU27, more men than women are in paidemployment (55% compared to 44%).11 However, in threecountries – Lithuania, Latvia and Estonia – the proportionof women in the workforce is almost equal to that of men(49%), while in five countries it is less than 40% (Turkey27%, Malta 31, Spain 39, Italy 40 and Greece 38%).
Gender segregation is the phenomenon of women beingunder-represented in some occupational areas and over-represented in others (relative to their averagerepresentation in employment overall). A number ofstudies, including analyses of the previous editions of theEuropean Working Conditions Survey have revealed that ahigh degree of gender segregation is a persistent feature ofthe structure of employment in Europe.12 Analysis of anumber of dimensions in the survey reveals the extent ofgender segregation in 2005.
Segregation can take place across various employmentvariables: occupation, sector, economic status of the firm,employment status, employment contract and form (full-time/part-time work). Alongside the ‘horizontal’ segregationof women into different types of jobs is ‘vertical’ segregation:the under-representation of women in higher hierarchicalpositions, better paid jobs and jobs with a higher status.
In recent years, part-time work – largely a femalephenomenon – has been increasing in Europe. For example,between 2000 and 2005, 43% of newly created jobs havebeen women’s part-time jobs, 15% men’s part-time jobs,22% men’s full-time jobs and 20% women’s full-time jobs.13
This development can be categorised as a success as morepeople, especially women, have been able to re-enter orremain in the labour market due to the availability of part-time work and hence have been better able to reconcilework and outside work responsibilities; however, it isimportant to acknowledge that the rise in employment ratesdoes not necessarily result in an improvement in the qualityof employment any more than it guarantees greater equalitybetween men and women.14 This is why when consideringgender equality issues, it is important to distinguishbetween male and female part- and full-time status.
Looking at all jobs together, and differentiating them bygender and part-time/full-time status (Figure 1.13), it isinteresting to note that, on average, the majority of jobs(52%) are men’s full-time jobs, nearly a third of them (32%)
11
Context and structural data
11 For more information on participation rates, please refer to Figure 1.1.12 See for example, Gender, jobs and working conditions in the European Union, http://www.eurofound.europa.eu/publications/htmlfiles/ef0249.htm or Gender
and working conditions in the European Union, http://www.eurofound.europa.eu/publications/htmlfiles/ef9759.htm13 Employment in Europe 2006, Figure 22, p. 40, European Commission, Brussels, 2006. 14 See, for example, Working-time preferences and work–life balances in the EU, http://www.eurofound.europa.eu/publications/htmlfiles/ef0342.htm, As time
goes by: A critical evaluation of the Foundation’s work on time http://www.eurofound.europa.eu/pubdocs/2003/09/en/1/ef0309en.pdf or Part-time work inEurope http://www.eurofound.europa.eu/ewco/reports/TN0403TR01/TN0403TR01.htm
Figure 1.13: Gender breakdown of employment, bycountry and employment status (%)
TR
NO
NL
RO
PL
BE
UK
DK
CH
BG
LU
FI
EU27
EE
SE
CZ
LT
IT
IE
ES
AT
HU
EL
MT
CY
PT
FR
HR
DE
SI
LV
SK
men part time men full time women part time women full time
0 10 20 30 40 50 60 70 80 90 100

12
Fourth European Working Conditions Survey
are women’s full-time jobs, 13% are part-time women’s jobsand 4% are men’s part-time. The proportion of men’s part-time jobs is above the EU27 average in Belgium, Bulgaria,Denmark, the Netherlands, Poland, Romania and the UK,while the proportion of women’s part-time jobs is aboveaverage in Austria, Belgium, Denmark, Germany, Ireland,Luxembourg, the Netherlands (whose rate of 27% is higherthan the proportion of women’s full-time jobs in this country– 18%), Sweden and the UK (which at 23% is slightly lessthan the proportion of women’s full-time jobs – 24%).
Employment status
There are similarities in the employment status of men andwomen: for example, a similar proportion (6%) of men andwomen hold second jobs, in which they spendapproximately the same length of time (around 12 hoursper week). For 3% of both men and women, working in asecond job is a regular activity, while for 4% it is occasionaland/or seasonal.
The same percentage (7%) of male and female employeesdoes not have any employment contract, and equalpercentages (2%) are temporary agency workers. Amongyounger employees (those aged 29 years or younger), anequal proportion (60%) of men and women work under anindefinite-term contract.
However, there are some clear differences: for example, aswe have seen earlier, a higher proportion of men thanwomen are self-employed (the gender gap for the self-employed without workers is three percentage points andfour percentage points for the self-employed with workers).As noted earlier, a higher proportion of female than maleemployees hold fixed-term contracts (14% compared with10%), and part-time work is more common among women(29% of women work part time, compared to 7% of men).
Sectoral segregation
Figure 1.14 illustrates the extent of sectoral segregation inthe EU27.
There are five sectors in which male workers predominate:the construction sector (89% of male workers), electricity,gas and water (80%), transport and communication (74%),manufacturing (69%) and agriculture (64%).
In contrast, there are four sectors in which women prevail:the health sector (79% of female workers), education (72%),other services (61%) and the wholesale and retail trade(55%). These sectors also have a higher-than-averageproportion of women’s part-time jobs (above 20% in all butwholesale and retail, where the proportion of women’s part-time jobs is 18%).
The extent of segregation is usually more pronounced at thecompany level rather than at a higher aggregated level ofindicators, such as sector or occupation. It would beinteresting therefore to perform this type of analysis again ata lower level of aggregation: for example, while in generalmanufacturing is largely male-dominated, some sub-sectorssuch as the manufacture of clothing and dressing anddyeing of fur are female-dominated.
Sectoral concentration is the extent to which female (ormale) employment is concentrated in particular sectors.Male and female employment is almost equallyconcentrated in four sectors: 58% of men’s jobs areconcentrated in four sectors (manufacturing, wholesale andretail, construction, and transport) and 57% of women’sjobs are concentrated in four sectors (wholesale and retail,manufacturing, health and other services).
Figure 1.15 illustrates the concentration of men’s andwomen’s employment in the four sectors that employ themost men: manufacturing, the wholesale and retail trade,construction, and transport.
Figure 1.16, meanwhile, illustrates the concentration ofmen’s and women’s employment in the four sectors thatemploy the most women: manufacturing, the wholesale andretail trade, health and other services.
Figure 1.14: Distribution of employment, by sector, sexand part-time/full-time status, EU27 (%)
0 10 20 30 40 50 60 70 80 90 100
Construction
Electricity, gas and water
Transport and communication
Manufacturing
Agriculture and fishing
Public administrationand defence
Real estate
Financialintermediation
Hotels and restaurants
Wholesale andretail trade
Other services
Education
Health
men part time men full time women part time women full time
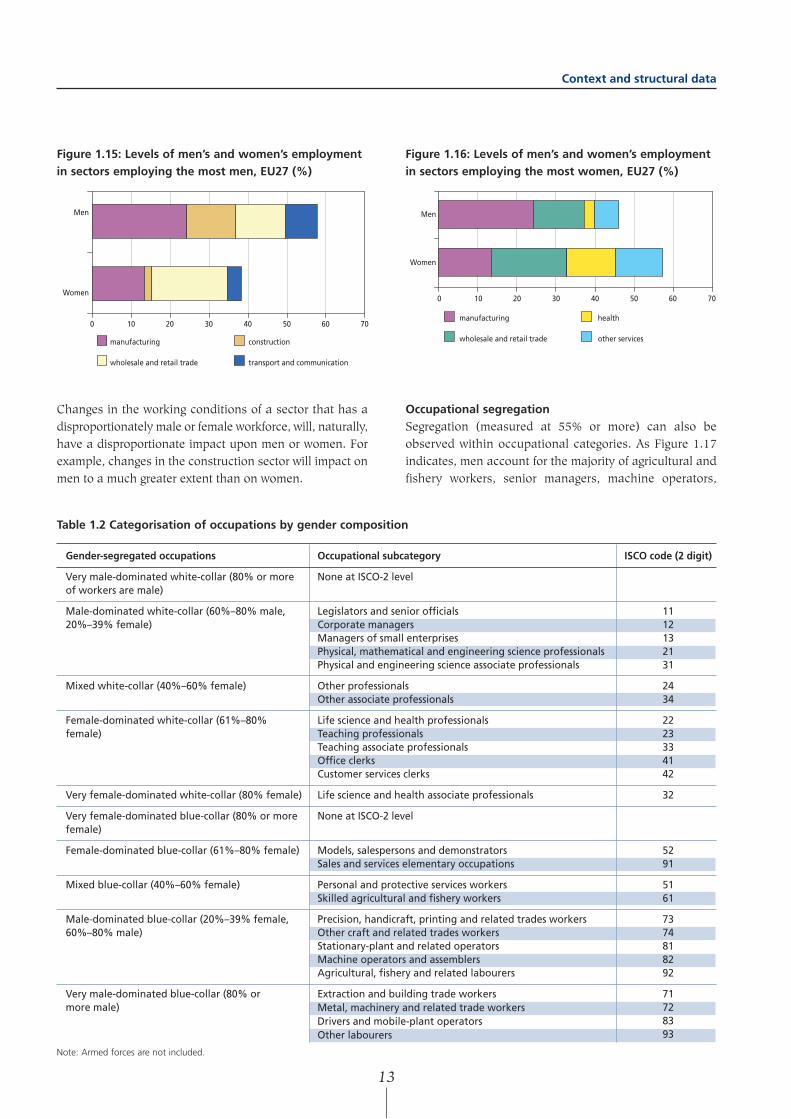
Table 1.2 Categorisation of occupations by gender composition
Note: Armed forces are not included.
Changes in the working conditions of a sector that has adisproportionately male or female workforce, will, naturally,have a disproportionate impact upon men or women. Forexample, changes in the construction sector will impact onmen to a much greater extent than on women.
Occupational segregationSegregation (measured at 55% or more) can also beobserved within occupational categories. As Figure 1.17indicates, men account for the majority of agricultural andfishery workers, senior managers, machine operators,
Figure 1.15: Levels of men’s and women’s employmentin sectors employing the most men, EU27 (%)
0 10 20 30 40 50 60 70
Men
Women
manufacturing construction
wholesale and retail trade transport and communication
13
Context and structural data
Figure 1.16: Levels of men’s and women’s employmentin sectors employing the most women, EU27 (%)
manufacturing health
wholesale and retail trade other services
Men
Women
0 10 20 30 40 50 60 70
Gender-segregated occupations
Very male-dominated white-collar (80% or more of workers are male)
Male-dominated white-collar (60%–80% male, 20%–39% female)
Mixed white-collar (40%–60% female)
Female-dominated white-collar (61%–80%female)
Very female-dominated white-collar (80% female)
Very female-dominated blue-collar (80% or morefemale)
Female-dominated blue-collar (61%–80% female)
Mixed blue-collar (40%–60% female)
Male-dominated blue-collar (20%–39% female, 60%–80% male)
Very male-dominated blue-collar (80% or more male)
Occupational subcategory
None at ISCO-2 level
Legislators and senior officials Corporate managers Managers of small enterprisesPhysical, mathematical and engineering science professionalsPhysical and engineering science associate professionals
Other professionals Other associate professionals
Life science and health professionals Teaching professionalsTeaching associate professionalsOffice clerksCustomer services clerks
Life science and health associate professionals
None at ISCO-2 level
Models, salespersons and demonstratorsSales and services elementary occupations
Personal and protective services workersSkilled agricultural and fishery workers
Precision, handicraft, printing and related trades workersOther craft and related trades workersStationary-plant and related operatorsMachine operators and assemblersAgricultural, fishery and related labourers
Extraction and building trade workersMetal, machinery and related trade workersDrivers and mobile-plant operatorsOther labourers
ISCO code (2 digit)
1112132131
2434
2223334142
32
5291
5161
7374818292
71728393

skilled workers and members of the armed forces whilewomen account for the majority of clerical workers, serviceand sales workers and technicians. Only two occupationalcategories – unskilled workers and professionals – aregender-balanced at this level of aggregation. However, atthe sub-category level of these two groups the picture is lessbalanced: among professionals, life science and health, andteaching professionals are female-dominated while anothersub-category – physical, mathematical and engineeringscience professionals – is male dominated. Similarly,looking at the sub-levels of the unskilled workers categoryof the elementary occupations, the cleaning, domesticservice, refuse and street vendors’ occupations are allfemale-dominated.
Related to this occupational segregation is the phenomenonof occupational concentration (the predominance of onesex in a particular occupation or group of occupations).Table 1.2 categorises occupations by status and gendercomposition.15
14
Fourth European Working Conditions Survey
Figure 1.17: Occupational segregation of women’s andmen’s employment, EU27 (%)
0 10 20 30 40 50 60 70 80 90 100
Armed forces
Skilled workers
Machine operators
Senior managers
Agricultural and fishery workers
Professionals
Technicians
Unskilled workers
Service and sales workers
Clerical workers
men part time men full time women part time women full time
15 Model developed by Fagan and Burchell, see Gender, jobs and working conditions in the European Union,http://www.eurofound.europa.eu/pubdocs/2002/49/en/1/ef0249en.pdf
16 Exact figures are 6.4 + 6.2, which is then rounded to 13.
Table 1.3 Distribution of men’s and women’s employment in gender-segregated occupations categories, EU27 (%)
Gender-segregated occupations Percentage of men Percentage of Percentage of total employed women employed workforce employed
Male-dominated white-collar (60%–80% male, 20%–39% female) 10 4 14
Mixed white-collar (40%–60% female) 6 6 1316
Female-dominated white-collar (61%–80% female) 6 14 20
Very female-dominated white-collar (80% female or more) 0 2 2
Female-dominated blue-collar (61%–80% female) 5 10 15
Mixed blue-collar (40%–60% female) 5 5 10
Male-dominated blue-collar (20%–39% female, 60%–80% male) 7 3 10
Very male-dominated blue-collar (80% or more male) 15 1 16
All occupations 53 45 100
Table 1.4 Concentration of men’s employment in gender-segregated occupations, EU27 (%)
Men
Gender-segregated occupations Part-time Full-time All men
Male-dominated white-collar (20–39% female) 1 18 19
Mixed white-collar (40–60% female) 1 11 12
Female dominated white-collar (61–80% female) 1 10 11
Very female-dominated white-collar (80% female) 0 0.4 0.4
Female-dominated blue-collar (61–80% female) 2 8 10
Mixed blue-collar (40–60% female) 1 8 9
Male-dominated blue-collar (20–39% female) 1 11 12
Very male-dominated blue-collar (less than 20% female) 1 27 28
All 7 93 100
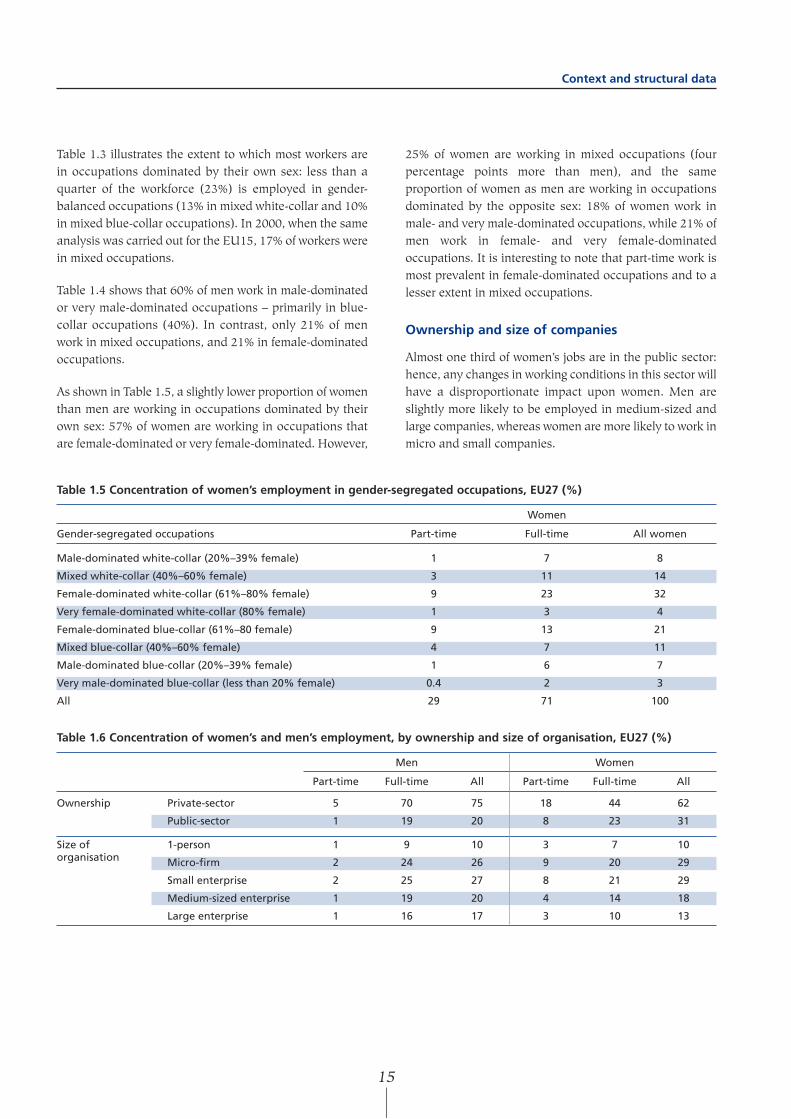
Table 1.3 illustrates the extent to which most workers arein occupations dominated by their own sex: less than aquarter of the workforce (23%) is employed in gender-balanced occupations (13% in mixed white-collar and 10%in mixed blue-collar occupations). In 2000, when the sameanalysis was carried out for the EU15, 17% of workers werein mixed occupations.
Table 1.4 shows that 60% of men work in male-dominatedor very male-dominated occupations – primarily in blue-collar occupations (40%). In contrast, only 21% of menwork in mixed occupations, and 21% in female-dominatedoccupations.
As shown in Table 1.5, a slightly lower proportion of womenthan men are working in occupations dominated by theirown sex: 57% of women are working in occupations thatare female-dominated or very female-dominated. However,
25% of women are working in mixed occupations (fourpercentage points more than men), and the sameproportion of women as men are working in occupationsdominated by the opposite sex: 18% of women work inmale- and very male-dominated occupations, while 21% ofmen work in female- and very female-dominatedoccupations. It is interesting to note that part-time work ismost prevalent in female-dominated occupations and to alesser extent in mixed occupations.
Ownership and size of companies
Almost one third of women’s jobs are in the public sector:hence, any changes in working conditions in this sector willhave a disproportionate impact upon women. Men areslightly more likely to be employed in medium-sized andlarge companies, whereas women are more likely to work inmicro and small companies.
15
Context and structural data
Table 1.5 Concentration of women’s employment in gender-segregated occupations, EU27 (%)
Women
Gender-segregated occupations Part-time Full-time All women
Male-dominated white-collar (20%–39% female) 1 7 8
Mixed white-collar (40%–60% female) 3 11 14
Female-dominated white-collar (61%–80% female) 9 23 32
Very female-dominated white-collar (80% female) 1 3 4
Female-dominated blue-collar (61%–80 female) 9 13 21
Mixed blue-collar (40%–60% female) 4 7 11
Male-dominated blue-collar (20%–39% female) 1 6 7
Very male-dominated blue-collar (less than 20% female) 0.4 2 3
All 29 71 100
Table 1.6 Concentration of women’s and men’s employment, by ownership and size of organisation, EU27 (%)
Men Women
Part-time Full-time All Part-time Full-time All
Ownership Private-sector 5 70 75 18 44 62
Public-sector 1 19 20 8 23 31
Size of 1-person 1 9 10 3 7 10organisation Micro-firm 2 24 26 9 20 29
Small enterprise 2 25 27 8 21 29
Medium-sized enterprise 1 19 20 4 14 18
Large enterprise 1 16 17 3 10 13

Working time is one of the key dimensions of workingconditions, a dimension which lies at the heart of theemployment relationship and which has an impact wellbeyond work. This means that working time is not only akey determinant of the conditions of work, but also of theconditions of employment. The length, scheduling andorganisation of working hours are important determinantsof the quality of work. Beyond the workplace, working timeis obviously a crucial element in linking and balancing workand life: the organisation of time at work has a huge impacton the organisation of time outside work.
The fourth European Working Conditions Survey coversvarious aspects of working time, highlighting the differentsystems of working time organisation in different EUcountries. The data serve to support the discussion of keyissues, such as the impact of long working hours on workingconditions, the relationship between paid and unpaid workand gender differences in relation to use of time. Thischapter gives an overview of working hours in Europe,looking at time schedules in European workplaces and thedifferent systems of working time organisation, with aspecial focus on their flexibility. It also explores workingtime outside the main job: time spent in second jobs,commuting times and unpaid working hours.
Length of working time
Weekly working hours
Since 1991, there has been a clear and consistent trend inthe EU towards a reduction in paid working hours, a trendwhich only slowed in 2005 due to the impact of EUenlargement in 2004, the new Member States having longeraverage working hours. However, even in the NMS, theproportion of people working more than 41 hours per weekhas decreased considerably since 2001, while theproportion of people working shorter hours is graduallyincreasing.
Figure 2.2 shows average working hours (for bothemployees and self-employed) in 2005 in all the 31
countries covered in the survey. The differences aresubstantial, both in the average length of working hours andin the range of working time in each country. The thickgreen vertical line represents the average working time, thebox around it represents the interquartile range (i.e. 50% ofthe workers fall within the categories of working hoursdefined by the box) and the longer lines represent the 5thand 95th percentiles. In the Netherlands, for example, theaverage weekly working hours are 33; 50% of Dutchworkers work between 24 and 40 hours (the limits of thebox); 5% work more than 50 hours and 5% less than 10hours (the extremes of the outward lines). Turkey has thelongest working hours and is also among the countries withthe greatest variation in hours worked. In most countries,the average working hours are around the standard 40hours per week with most workers following this pattern.
However, there are variations between countries, whichtend to follow a geographical pattern: eastern and southernEuropean countries have the longest hours, while centraland northern European countries (including Ireland and theUnited Kingdom) have the shortest hours. The Netherlands,
fewer than 20 35–38 39–41 42–48 more than 4821–34
EU12: 1990
EU15: 1995
EU15: 2000
EU25: 2005
0 10 20 30 40 50 60 70 80 90 100
TR
RO
EL
BG
PL
HR
SK
HU
PT
SI
CZ
LV
MT
LT
ES
EE
CY
AT
EU27
IT
LU
SE
IE
DE
FI
CH
BE
DK
FR
UK
NO
NL0 10 20 30 40 50 60 70 80 90 100
Figure 2.1: Evolution of weekly working hours,1990–2005 (%)
Figure 2.2: Average weekly working hours, by country
Working time 2
17

with its very high incidence of part-time work (reflected inFigure 2.2 by the large variation in working hours) has theshortest average working hours.
Figure 2.3 shows the number of days worked per week in all31 European countries (ranked by the percentage of peopleworking seven days a week). Turkey has a longer workingweek than most other countries: almost 50% of Turkishworkers report working seven days a week, and almost 75%work six or seven days. These figures probably reflect thedifferences in sectoral composition of the Turkish economycompared to the rest of Europe, with a much higherproportion of workers in agriculture where working hoursare very long. The differences between countries are verysimilar to the differences found in weekly working hours: ahigher incidence of long working weeks in southern andeastern Europe and of short working weeks in northern andcentral European countries.
But even if there are clear differences between countries, itshould be noted that there is a remarkable concentration of
working times around what we can call the ‘standard timenorm’ (40 hours and five days a week). With the exceptionof Turkey and probably the Netherlands at the twoextremes, a substantial majority of workers in mostcountries work around 40 hours and five days a week.
Long working hours
Figure 2.4 shows the proportion of people working morethan 48 hours a day in different countries (the reference forlong working hours in the fourth European WorkingConditions Survey is 48 hours or more). The countrydifferences follow the same trends as the figures for averageworking hours, with the possible exception of Ireland,which in terms of average working hours did not stand out(it was one of the countries with shortest average hours) butwhich has a sizeable proportion of people working very longhours (almost 17% of the total working population).Surprisingly, considering the importance of this debate inthe British context, the UK’s working hours are aboutaverage. In fact, the UK stands out only in terms of the longworking hours of male full-time employees in comparisonwith other EU15 countries.
TR
EL
RO
PL
BG
HR
LT
HU
SI
CZ
AT
IE
PT
LV
MT
EU27
ES
SK
CY
BE
LU
NO
EE
UK
DK
IT
FI
CH
FR
DE
SE
NL
765less than 5
0 10 20 30 40 50 60 70 80 90 100
TR
RO
EL
PL
BG
HU
CZ
SK
HR
LV
SI
IE
MT
ES
AT
LT
CH
EU27
BE
PT
IT
UK
CY
DK
EE
DE
SE
NL
LU
FI
FR
NO
self-employed employee
0 10 20 30 40 50 60 70
Figure 2.3: Number of days worked per week, by country (%)
Figure 2.4: Long working hours (>48h per week), bycountry
Fourth European Working Conditions Survey
18

Figure 2.5 shows that long working hours are apredominantly male phenomenon in Europe (see, however,the discussion on unpaid working hours below), and onewhich affects self-employed workers to a greater extent thanemployees. The sectors most affected by long working hours(Figure 2.6) are agriculture, hotels and restaurants andconstruction (all with more than 20% of workers in thiscategory); in terms of occupations, it is managers andagricultural workers who most often work more than 48hours.
Finally, Figure 2.7 shows the impact of working long hourson some other indicators of working conditions, such ashealth and work–life balance. The first indicator shown –the proportion of workers complaining that they rarely ornever have enough time to get their job done – is higher forthose working very long hours. Of course, the causality herecan go both ways, but it shows an interesting relationshipbetween working time and flexibility that would meritfurther exploration. It is clear from the data that workingvery long hours may increase health and safety risks: thosewho work more than 48 hours a week are more likely toconsider their health and safety at risk because of their work(twice as many as other workers), and that their job affectstheir health.
But the greatest negative effect of long working hours is onwork–life balance: three times as many workers workinglong hours compared to other workers feel that theirworking hours do not fit in with their social and familycommitments. However, there is far less of a differencebetween those workers working long hours and others interms of the indicator for satisfaction with workingconditions, probably because of the existence of possiblebenefits from working long hours (also shown in Figure 2.7).For example, while working long hours does not improvecareer prospects, it does pay: half of those working morethan 48 hours a week are in the top three income deciles.Also, working long hours may bring with it a limited degreeof flexibility: as Figure 2.7 shows, two thirds of those
self-employed employees
Sect
or o
f ac
tivi
tyO
ccup
atio
n
Agriculture
Manufacturing
Electricity, gas and water
Construction
Wholesale and retail trade
Hotels and restaurants
Transport and communication
Financial intermediation
Real estate
Public administration and defence
Education
Health
Other services
Senior managers
Professionals
Technicians
Clerical workers
Service and sales workers
Agricultural and fishery workers
Skilled workers
Machine operators
Unskilled workers
Armed forces
0 10 20 30 40 50 60 0 10 20 30 40 50 60 70 80
48 or less more than 48
Rarely or never has enoughtime to get the job done
Health and safety at riskbecause of work
Work affects health
Working hours do not fit family or social commitments
Dissatisfied with working conditions
Impa
ctCo
mpe
nsat
ions
Job offers good career prospects
Flexible starting and finishing times
In the top three income categories
Figure 2.6: Long working hours, by sector andoccupation, EU27 (%)
0
5
10
15
20
25
30
35
40
45
50
Men Women Employee Self-employed
Total EU27 Sex Employment status
Figure 2.5: Long working hours (>48h per week), bygender and employment status, EU27 (%)
Figure 2.7: Impact and effects of long working hours,EU27 (%)
Working time
19

working more than 48 hours are not constrained by fixedstarting and finishing times, compared with only one thirdof those working less than 48 hours a week.
Non-standard working hours
In terms of the percentage of EU workers with schedulesoutside the ’normal’ working day, the results do not point toan increasing diversification of working hours, or a trendtowards a 24-hour society. If anything, the proportion ofpeople working outside normal working hours has slightlydecreased since 1995.
Figures 2.8 and 2.9 show the proportion of workers withatypical schedules in the different EU country groups in2005. Clearly, evening work is much more widespread thannight work, and the Netherlands and the Scandinaviancountries have the highest proportion of workers engaged inthis type of work. But in fact, looking at the number ofevenings worked, it appears that evening work inScandinavian countries is mainly ‘casual’ evening work,probably related to the higher flexibility of working times inthese countries (see Figure 2.8). In contrast, in southernand eastern European countries, the proportion of peopleworking more than five evenings per month (that is, on aless casual basis) is much higher. As for night work, it isquite low in most countries except those in eastern Europe,where 25% of the working population are affected.Weekend work (see Figure 2.9) is most prevalent in theacceding and candidate countries (particularly Turkey),probably because of the very high proportion of agriculturalworkers in the Turkish workforce. Within the EU25,southern Europe has the highest proportion of workersworking every Saturday per month, while Sunday work ismost prevalent in the Netherlands and the Scandinaviancountries, albeit only casual Sunday work (fewer than threeSundays per month). In general, the continental countriesshow a smaller proportion of workers with atypical workschedules.
Finally, Figures 2.10 and 2.11 show the breakdown fordifferent sectors, for EU27 countries only. The sectors thatclearly stand out in terms of atypical work schedules arehotels and restaurants, agriculture, and transport andcommunication. The wholesale and retail trade shows avery high proportion of work on Saturdays only. The sectorsin which there is consistently less work at atypical hoursare construction and financial intermediation.
Organisation of working time
Regularity of schedules
Figure 2.12 illustrates the incidence of regular workinghours in the different country groups. More than half of all
EU27
Non-EU: CH+NO
CC2: TR, HR
AC2: BG, RO
CZ, EE, LV, LT, HU, PL, SI, SK
EL, ES, IT, CY, MT, PT
BE, DE, FR, LU, AT
IE, UK
DK, NL, FI, SE
1–5 evenings per month more than 5 evenings per month
1–5 nights per month more than 5 nights per month
0 10 20 30 40 50 60 70 80 90
EU27
Non-EU: CH+NO
CC2: TR, HR
AC2: BG, RO
CZ, EE, LV, LT, HU, PL, SI, SK
EL, ES, IT, CY, MT, PT
BE, DE, FR, LU, AT
IE, UK
DK, NL, FI, SE
0 10 20 30 40 50 60 70 80 90
1–3 Saturdays per month 4 or 5 Saturdays per month
1–3 Sundays per month 4 or 5 Sundays per month
Figure 2.9: Saturday and Sunday work, by countrygroup (%)
Figure 2.8: Evening and night work, by country group (%)
Fourth European Working Conditions Survey
20
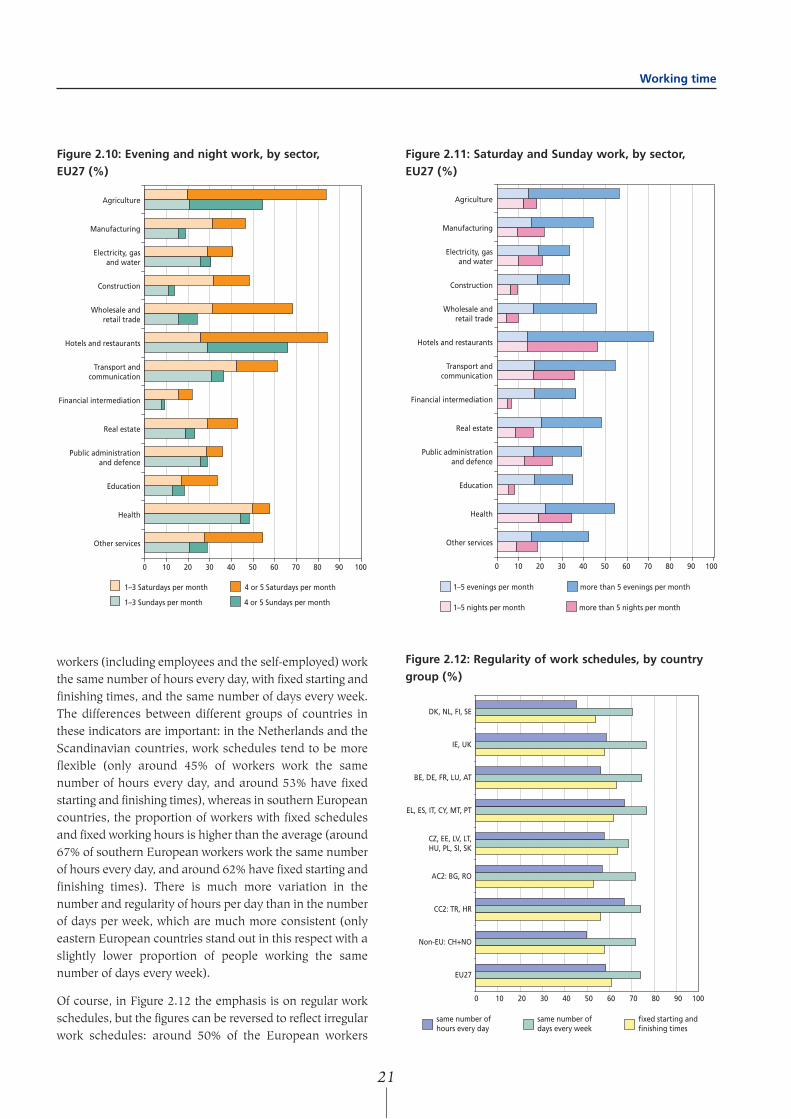
workers (including employees and the self-employed) workthe same number of hours every day, with fixed starting andfinishing times, and the same number of days every week.The differences between different groups of countries inthese indicators are important: in the Netherlands and theScandinavian countries, work schedules tend to be moreflexible (only around 45% of workers work the samenumber of hours every day, and around 53% have fixedstarting and finishing times), whereas in southern Europeancountries, the proportion of workers with fixed schedulesand fixed working hours is higher than the average (around67% of southern European workers work the same numberof hours every day, and around 62% have fixed starting andfinishing times). There is much more variation in thenumber and regularity of hours per day than in the numberof days per week, which are much more consistent (onlyeastern European countries stand out in this respect with aslightly lower proportion of people working the samenumber of days every week).
Of course, in Figure 2.12 the emphasis is on regular workschedules, but the figures can be reversed to reflect irregularwork schedules: around 50% of the European workers
Other services
Health
Education
Public administration and defence
Real estate
Financial intermediation
Transport and communication
Hotels and restaurants
Wholesale and retail trade
Construction
Electricity, gasand water
Manufacturing
Agriculture
0 10 20 30 40 50 60 70 80 90 100
1–3 Saturdays per month 4 or 5 Saturdays per month
1–3 Sundays per month 4 or 5 Sundays per month
Other services
Health
Education
Public administration and defence
Real estate
Financial intermediation
Transport and communication
Hotels and restaurants
Wholesale and retail trade
Construction
Electricity, gasand water
Manufacturing
Agriculture
1–5 evenings per month more than 5 evenings per month
1–5 nights per month more than 5 nights per month
0 10 20 30 40 50 60 70 80 90 100
Figure 2.11: Saturday and Sunday work, by sector,EU27 (%)
DK, NL, FI, SE
IE, UK
BE, DE, FR, LU, AT
EL, ES, IT, CY, MT, PT
CZ, EE, LV, LT,HU, PL, SI, SK
AC2: BG, RO
CC2: TR, HR
Non-EU: CH+NO
EU27
0 10 20 30 40 50 60 70 80 90 100
same number of hours every day
same number of days every week
fixed starting and finishing times
Figure 2.12: Regularity of work schedules, by countrygroup (%)
Figure 2.10: Evening and night work, by sector, EU27 (%)
Working time
21

covered in the survey do not work the same number ofhours every day, around 40% do not have fixed starting andfinishing working hours, and around 30% do not work thesame number of days every week. And this proportion isincreasing, slowly but steadily: in 1995, 65% of EU workershad fixed work schedules, declining to 61% in 2005.
Shift work
Shift work has an important economic function incompanies’ operations and a large impact on individualworking conditions. Its economic importance is based oncompanies’ dependence on the use of shift working in orderto extend operating hours. This is usually a feature ofcompanies where there are high fixed costs (typically thecase in manufacturing, which uses expensive machinery)or where the time of operation has to match the time ofdemand (typically in services).
Figure 2.13 shows the proportion of workers involved inshift work in different groups of EU countries, and the typeof shift system in operation. There is a considerably higherproportion of shift work in eastern European and, albeit toa lesser extent, southern European countries than in theother country groups. The differences between countryclusters in the use of shifts is strongly influenced by thesectoral composition of the economy because, as Figure2.14 shows, there is an important variation in the use ofshifts in different sectors. In health, about one third ofworkers work shifts. In the hotels and restaurants, andmanufacturing and transport sectors, around one in everyfour workers is a shift worker. This proportion is around or
below 5% in agriculture, construction and financialintermediation.
Closer analysis of the survey data on shift work (Figure2.15) reveals that shift workers tend to have more standardworking hours than non-shift workers: almost 40% of thoseworking shifts in Europe work in the very limited range of 39to 41 hours per week (10% more than the rest of workers).Also, the proportion of shift workers with very long or veryshort working hours is almost half that of non-shift workers.
In terms of autonomy at work (the capacity to change theorder of tasks, methods of work and rate of work), it isevident that shift workers are much less autonomous thanother workers: the general level of shift workers withoutautonomy is around 50–60% compared to 30% for workersnot working shifts. This is confirmed by looking at whodecides how working times are organised: in the case ofshift work, in 70% of the cases it is entirely decided by thecompany with no possibility for change. This is the case foronly 53% of other workers. Only 15% of shift workers canreally adapt working hours to their needs (with or withoutsome limits), compared to almost 40% in the case of non-shift workers.
0 5 10 15 20 25 30 35 40
DK, NL, FI, SE
IE, UK
BE, DE,FR, LU, AT
EL, ES, IT, CY, MT, PT
CZ, EE, LV, LT,HU, PL, SI, SK
AC2: BG, RO
CC2: TR, HR
Non-EU: CH+NO
EU27
daily split shifts permanent shifts (morning, afternoon or night)
alternating / rotating shifts other
daily split shifts permanent shifts (morning, afternoon or night)
alternating / rotating shifts other
0 5 10 15 20 25 30 35 40
Agriculture
Manufacturing
Electricity, gas and water
Construction
Wholesale and retail trade
Hotels and restaurants
Transport and communication
Financial intermediation
Real estate
Public administration and defence
Education
Health
Other services
Figure 2.13: Incidence of shift work, by country group (%)
Figure 2.14: Incidence of shift work, by sector, EU27 (%)
Fourth European Working Conditions Survey
22
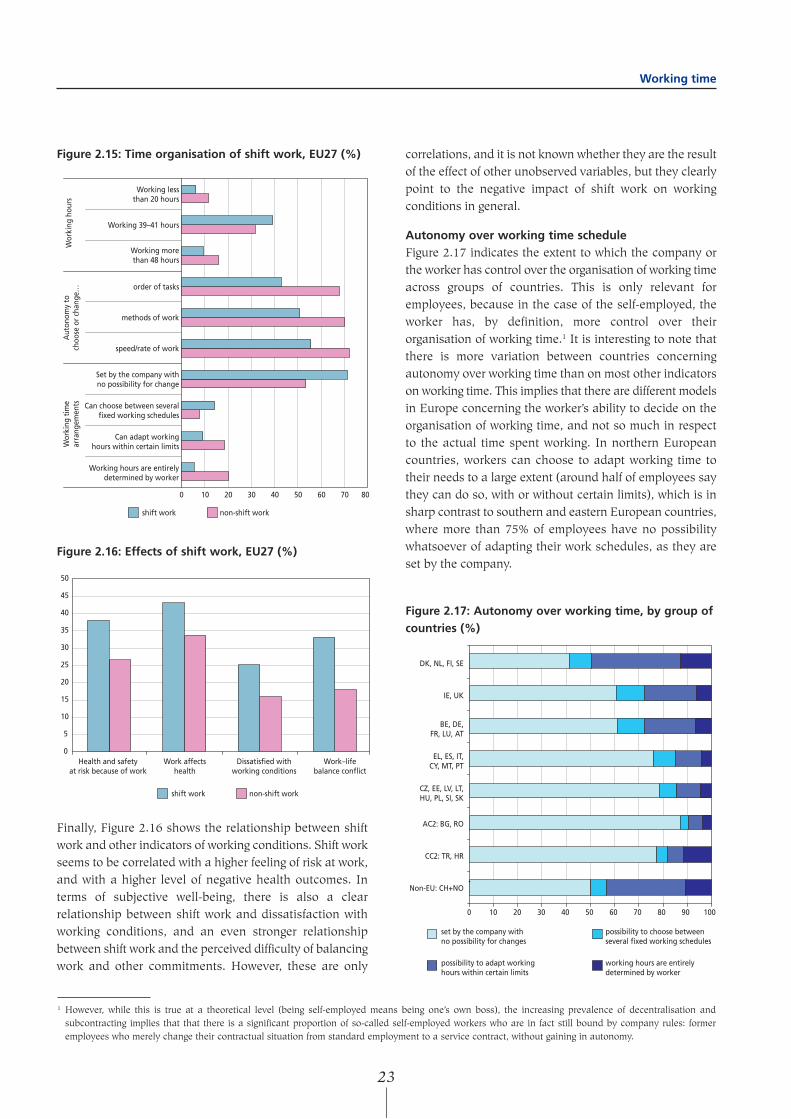
Finally, Figure 2.16 shows the relationship between shiftwork and other indicators of working conditions. Shift workseems to be correlated with a higher feeling of risk at work,and with a higher level of negative health outcomes. Interms of subjective well-being, there is also a clearrelationship between shift work and dissatisfaction withworking conditions, and an even stronger relationshipbetween shift work and the perceived difficulty of balancingwork and other commitments. However, these are only
correlations, and it is not known whether they are the resultof the effect of other unobserved variables, but they clearlypoint to the negative impact of shift work on workingconditions in general.
Autonomy over working time scheduleFigure 2.17 indicates the extent to which the company orthe worker has control over the organisation of working timeacross groups of countries. This is only relevant foremployees, because in the case of the self-employed, theworker has, by definition, more control over theirorganisation of working time.1 It is interesting to note thatthere is more variation between countries concerningautonomy over working time than on most other indicatorson working time. This implies that there are different modelsin Europe concerning the worker’s ability to decide on theorganisation of working time, and not so much in respectto the actual time spent working. In northern Europeancountries, workers can choose to adapt working time totheir needs to a large extent (around half of employees saythey can do so, with or without certain limits), which is insharp contrast to southern and eastern European countries,where more than 75% of employees have no possibilitywhatsoever of adapting their work schedules, as they areset by the company.
Wor
king
hou
rs
0 10 20 30 40 50 60 70 80
Aut
onom
y to
choo
se o
r ch
ange
…W
orki
ng t
ime
arra
ngem
ents
Working lessthan 20 hours
Working 39–41 hours
Working morethan 48 hours
order of tasks
methods of work
speed/rate of work
Set by the company withno possibility for change
Can choose between severalfixed working schedules
Can adapt workinghours within certain limits
Working hours are entirelydetermined by worker
shift work non-shift work
shift work non-shift work
0
5
10
15
20
25
30
35
40
45
50
Health and safetyat risk because of work
Work affectshealth
Dissatisfied withworking conditions
Work–lifebalance conflict
possibility to adapt working hours within certain limits
working hours are entirely determined by worker
set by the company with no possibility for changes
possibility to choose between several fixed working schedules
DK, NL, FI, SE
IE, UK
BE, DE,FR, LU, AT
EL, ES, IT,CY, MT, PT
CZ, EE, LV, LT,HU, PL, SI, SK
AC2: BG, RO
CC2: TR, HR
Non-EU: CH+NO
0 10 20 30 40 50 60 70 80 90 100
Figure 2.15: Time organisation of shift work, EU27 (%)
Figure 2.16: Effects of shift work, EU27 (%)
Figure 2.17: Autonomy over working time, by group ofcountries (%)
1 However, while this is true at a theoretical level (being self-employed means being one’s own boss), the increasing prevalence of decentralisation andsubcontracting implies that that there is a significant proportion of so-called self-employed workers who are in fact still bound by company rules: formeremployees who merely change their contractual situation from standard employment to a service contract, without gaining in autonomy.
Working time
23

Composite working time
Most analyses of working time are based on a restrictive(and not always explicit) definition. Working time ismeasured in standard labour force surveys as time spent inthe main paid job. However, that does not necessarilycorrespond to the time the individual spends on working.There are three main ways in which this definition is toorestrictive.
• It does not include time spent in paid jobs other than themain one. Although the proportion of people having asecond job is small, it is not negligible, and for the peopleaffected it makes a big difference.
• It does not include commuting time, that is, time spenttravelling to and from work. Although from theperspective of the employer this is not working time, it isdefinitely time devoted to work from the perspective ofthe employee. It should, therefore, be considered whendiscussing the length of time dedicated to work.
• Most importantly, it does not include time spent doingunpaid work. Unpaid work is clearly as important insocietal and economic terms as paid work, even if it isnot remunerated by the market. And obviously, from theperspective of the individual, unpaid work (time spenton household duties, and caring for children and adults)still represents work, so it should be considered as such,even if not placed in the same category as paid work.
So far, the discussion on working time has been based onthe definition of time spent in the main paid job. The fourthEuropean Working Conditions Survey includes newindicators that explore working hours from a moreintegrated perspective, including these other working times.This section will first look at the three other types of workingtime and then present an aggregate working hours indicator.
There is, however, one limitation in the fourth EuropeanWorking Conditions Survey’s analysis of unpaid workinghours. Because of the strict definition of the respondent inthe survey, the sample only includes people who were inpaid employment in the reference week. It is evident thatunpaid work is not only performed by people in paidemployment: a very sizeable proportion of unpaid work iscarried out by people who do not have any paid job (suchas women at home). Therefore caution should be exercisedwhen interpreting the figures on unpaid working hours: inthis context, it means the unpaid working hours carried outby people already in paid employment of some kind.
More than one job
On average in the 31 countries covered in the fourthEuropean Working Conditions Survey, less than 7% of theworkers have more than one job. Although the proportion is
rather small in all countries (only in Norway is it more than15%), the differences by country are important, as we cansee in Figure 2.18. The Scandinavian countries and theNetherlands have a high proportion of workers with morethan one job and this proportion is also high in easternEurope. In the rest of Europe, multiple jobs arecomparatively rare.
Commuting time
Workers in all countries spend an average of around 40minutes every day travelling to and from work – not an
Figure 2.18: Percentage of multiple-job holders bycountry (%)
Note: Question asked ‘Besides your main paid job, do you have any other
paid job?’
0 5 10 15 20
NO
DK
LV
EE
CZ
SE
CH
FI
EL
MT
SK
SI
NL
PL
HU
BE
HR
AT
IE
LT
EU27
ES
DE
IT
TR
BG
RO
LU
PT
UK
CY
FR
yes, regular yes, occasional yes, seasonal other
Fourth European Working Conditions Survey
24

insignificant amount of time, as it represents an increase of8% in a standard eight-hour working day. Averagecommuting time increases with working hours, as can beseen in Figure 2.19. Only in the case of very long hours ofwork (more than 48) is this positive relationship betweencommuting and working hours broken, which quiteprobably reflects the high proportion of agricultural workersin this category (average commuting times of agriculturalworkers are the lowest, along with those for hotel andrestaurant workers). Specifically, the commuting times ofpart-time workers are substantially lower than thecommuting times of full-time workers. This is consistentwith numerous studies on the relationship between part-time work, gender and commuting times, in which it is oftenargued that the different household responsibilities of menand women at home lead women to choose jobs withshorter commuting times (in the same way that morewomen work part time).
Unpaid working hours
The fourth European Working Conditions Survey did notinclude a specific question concerning the number ofweekly hours spent on unpaid work. Respondents wereasked how many hours per day they spent on differentactivities outside paid work and these were multiplied byseven to compute the weekly total.2 While themeasurement of unpaid working hours is probably a goodapproximation of the real values, the measurement is,however, less precise than the measurement for paidworking hours.
Figures 2.20 and 2.21 show the three elements of theunpaid working hours indicator – hours spent caring forchildren and adults and hours spent on housework – bycountry group and gender. The total unpaid working hoursindicator is calculated by combining these three individual
values. The figures show the considerable differencesbetween women and men in the amount of time devoted tounpaid work in all European countries. This is even moresignificant given the fact that the data reflect only theworking population: if the data also took into account thosenot in paid employment (including a majority of women athome), the differences between the hours of unpaid workof women and men would be even higher.
The results show clearly that working women spend moretime in unpaid work than do working men in all Europeancountries. However, there are important differences in thegender distribution by country group: in the Netherlandsand the Scandinavian countries (and Switzerland), theamount of unpaid work is more equal between men andwomen than in southern European, continental andcandidate countries; eastern European countries fallsomewhere in between. There are also significantdifferences between countries regarding the type of activity:in the Netherlands and Scandinavian countries, workersdevote more time to childcare. In continental countries and
20
25
30
35
40
45
50
55
60min
Less than 20 21–34 35–38 39–41 42–48 More than 48h/week
DK, NL, FI, SE
IE, UK
BE, DE, FR,LU, AT
EL, ES, IT,CY, MT, PT
CZ, EE, LV,LT, HU, PL, SI, SK
AC2: BG, RO
CC2: TR, HR
Non-EU: CH+NO
0 5 10 15 20
hours caring for adults (women)
hours caring for adults (men)
hours caring for children (women)
hours caring for children (men)
Figure 2.20: Hours spent caring for children and adultsper week, by country group and sex
Figure 2.19: Average commuting time in minutes, byweekly working hours, EU27
2 If the respondent replied ‘less than one hour per day every day’, he or she had to choose from several options such as ‘every day or every second day for lessthan one hour’, ‘less than one hour per week’, etc.
Working time
25

Ireland and the UK, workers devote more time tohousework. Although fewer hours are spent caring foradults than on other activities everywhere, the amount oftime devoted to caring for adults in southern Europeancountries is considerably greater than in most othercountries. The information contained in the variables ofunpaid working hours is very rich, and although it clearlygoes beyond the scope of this report to give further analysis,the data need to be analysed and viewed in the context ofthe different welfare systems, labour market situations,cultural values attached to childrearing, technologiesassisting housework and general levels of gender inequalityin different countries.
Composite working hours indicator
Figure 2.22 presents the combined working hoursbreakdown for the 31 European countries covered in thefourth European Working Conditions Survey. The compositeworking hours indicator is made up of the figures for weeklyworking hours, plus the average weekly working hours injobs other than the main job, commuting time and the totalweekly unpaid working hours. The countries have beenranked from high to low and the contrast between weeklyworking hours and total composite working hours isconsiderable.
Figure 2.23 shows the gender breakdown for combinedworking hours by country group, indicating that there is ahuge difference in the working hours of women and menwhen unpaid work is taken into consideration. While menwork longer hours than women in paid employment in allcountries, women in fact work more hours than men whenpaid and unpaid working hours are combined.
The composite working hours indicator gives an interestinginsight into part-time work. Part-time work is oftenpromoted as a family-friendly measure that can help
workers to balance their working life with responsibilitiesoutside work. But as the figures show, the time spent onunpaid work varies enormously between men and women.How do men and women spend the time they save whenthey work part time?
Figure 2.24 shows the figures for combined working hoursbroken down by full-time and part-time work and sex acrossthe EU27. Even if somewhat expected, these results arequite striking. While male part-time workers dedicate evenless time to unpaid work than male full-time workers (7.2hours), women working part time appear to use the timesaved to carry out unpaid work (volume of hours only takeninto consideration, notwithstanding the voluntary characterof part-time work, its impact on salary and career
DK, NL, FI, SE
BE, DE, FR, LU, AT
EL, ES, IT, CY, MT, PT
AC2: BG, RO
Non-EU: CH+NO
IE, UK
CC2: TR, HR
CZ, EE, LV, LT,HU, PL, SI, SK
0 2 4 6 8 10 12 14 16 18 20
men women
0 10 20 30 40 50 60 70 80
RO
TR
NO
EL
SI
PL
HU
LV
LU
HR
SK
BG
EE
PT
NL
CY
IT
EU27
UK
IE
CZ
CH
MT
ES
BE
DK
LT
FR
SE
AT
FI
DE
paid working hours main job
paid working hours second job
commuting time
unpaid working hours
Figure 2.22: Composite working hours indicator, bycountry
Figure 2.21: Hours spent on housework per week, bycountry group and sex
Fourth European Working Conditions Survey
26

development, etc). On average, the unpaid work–paid workratio is 150% for female part-time workers whereas it standsat 33% for male part-time workers. It is also important tonote that when considering paid and unpaid work incombination as measured by the European WorkingConditions Survey, female part-time workers work morehours in total per week than male full-time workers (56against 54 hours). Also, the total working hours of womenworking full time are the longest, at more than 65 per weekin total.
0 10 20 30 40 50 60 70 80 90
male
female
male
female
male
female
male
female
male
female
male
female
male
female
male
female
male
female
paid working hours main job
paid working hours second job
commuting time
unpaid working hours
DK
,N
L, F
I, SE
IE, U
KBE
, DE,
FR
, LU
, AT
EL, E
S, IT
,CY
, MT,
PT
CZ, E
E, L
V,LT
, HU
, PL,
SI, S
K
AC2
: BG
, RO
CC2:
TR,
HR
Non
-EU
: CH
+NO
EU27
0 10 20 30 40 50 60 70
Part
-tim
eFu
ll-ti
me
male
female
male
female
paid working hours main job
paid working hours second job
commuting time
unpaid working hours
Figure 2.23: Composite indicator of working time, bycountry group and sex (hours)
Figure 2.24: Composite working hours indicator, by full-time/part-time hours and sex, EU27
Working time
27

Despite a decline in the proportion of the workforceemployed in traditional, physically demanding sectors suchas manufacturing and agriculture, the fourth EuropeanWorking Conditions Survey reveals that some physical risksare still prevalent. It also confirms findings from theprevious surveys that changes in levels of exposure to mostwork-related physical risks tend to be small from one surveyto another. Such improvements as there have been inexposure to some factors tend to be gradual, withcountervailing negative trends.1
One in five workers continues to be exposed to breathingin smoke, powder or fumes and nearly one in two workersreports working at least a quarter of the time in painful ortiring positions. While 15 years is a relatively short periodin terms of evolving employment structure, it might havebeen expected that the workplace changes that have takenplace during this time would generate improved workingconditions, especially in terms of a significant decrease inthe overall incidence of workplace physical risks.
This chapter examines the overall incidence of a number ofindividual physical risk factors, including some that havebeen included for the first time in the 2005 survey (e.g.
exposure to infectious materials and to workplace tobaccosmoke). It provides a three-way grouping of risk factors(ergonomic, biological/chemical and noise/temperatures). Italso looks at the extent to which different categories ofworkers (by age group, sex and, especially, sector) areaffected by each. Finally, some of the consequences ofincreased physical risk exposure in terms of individualperceptions of job sustainability and work-related healthrisks are explored.
As Figure 3.1 shows, trends for most physical risks haveremained within a narrow range across the four surveyssince 1990. The proportion of workers exposed to repetitivehand or arm movements at least one quarter of the time hasactually increased over the last five years. This is the mostcommonly cited physical risk, with 62% of the workingpopulation reporting exposure.
There has been a small decrease in workers reporting moreor less permanent (all/nearly all of the time) exposure toradiation, handling of chemical products or substances andbreathing of smoke, fumes, dust or powder. However,exposure to vibrations and noise has increased since 2000.
New survey questions
Three new questions relating to physical work factors wereintroduced in the 2005 survey, concerning exposure totobacco smoke and to infectious materials and theproportion of working time spent standing or walking.
Exposure to tobacco smoke One in five workers report being exposed to tobacco smokefrom other people at least a quarter of the time (20%,dropping to 7% for those reporting being exposed all ornearly all of the time). There was a significant differenceaccording to the sex of the respondent: 25% of male workersreport exposure at least a quarter of the time compared to14% of female workers. There is also a wide variation fromcountry to country, showing the probable effect of nationallegislation to restrict or ban smoking in the workplace, withcountries already having such legislation in place showingthe lowest levels.
Exposure to infectious materialsNearly one in 10 workers (9%) reports being exposed toinfectious materials (such as waste, bodily fluids andlaboratory materials) at their workplace at least a quarterof the time, but more women (5%) than men (2%) report ahigh level of such exposure (all or nearly all of the time),
29
3Physical risk factors
Figure 3.1: Exposure to physical risks,* 1990–2005 (%)
Note: No data is available for 1990 for some of the risks, as questions on
these were only introduced in later waves of the survey.
1 In this chapter, the term ‘physical risks’ refers to physical risks in the broadest sense, encompassing exposure to physical or ergonomic risks (e.g. workinvolving painful or tiring positions), biological or chemical risks, as well as to ambient or environmental risk factors (e.g. noise, high/low temperatures).
Repetitive hand or arm movements
Painful, tiring positions
Radiation
Handling chemical products / substances
Breathing smoke,fumes, dust
Low temperatures
Noise
Vibrations
1990-EU12 1995-EU15 2000-EU15 2005-EU25
0 10 20 30 40 50 60 70
* % exposed a quarter or more of the time

attributable in large part to the higher proportion of womenworking in the most exposed sectoral category, health andsocial work (where 23% report themselves exposed all ornearly all of the time).
Work involving standing or walking Another new question introduced in 2005 is whether workinvolves standing or walking. While standing or walking arehealthy activities in themselves, being subjected to theseactivities for extended periods can predispose a worker tophysical risk, in particular musculoskeletal problems orfatigue. At the other end of the scale, jobs – often office-based – that are almost completely sedentary can lead toincreased health risks related to physical inactivity (forexample, high blood pressure and obesity).2
The findings reveal that the degree of walking and standingat work is overall quite high. Almost three quarters (73%) ofrespondents carry out their work while standing or walkingat least a quarter of the time while 43% report doing so all,or nearly all of the time. The youngest age category (under25 years of age) reports the highest levels of walking andstanding. More women (30%) than men (25%) report thattheir work never, or almost never, involves standing.
The sector in which people work has a more decisive impactthan either sex or age on the extent to which work involvesstanding or walking. At one end of the scale, those workingin financial intermediation – primarily desk and office-based jobs – report comparatively low levels. At the otherend, four out of five workers in the hotel and restaurantssector report having to stand or walk in their main paid joball, or almost all of the time.
Gender dimension of physical risk factors
In general, more men than women report being subjected totraditional physical work risks (such as noise andvibrations), although there are exceptions to this rule. Inparticular, ergonomic risks (for example repetitive hand orarm movements, work involving painful or tiring positions)tend to be more gender-neutral, especially in terms of theproportion of workers exposed all or nearly all of the time.For certain risks (exposure to infectious materials, jobsinvolving lifting or moving people) prevalence is higheramongst female workers, reflecting at least in part thesegregation of the sexes in specific sectors, notably thehealth and social work sector.
0
10
20
30
40
50
60
70
Men Women Men Women Men WomenVibrations Noise Breathing in smoke,
fumes, powder, dust
all / almost all time 1/4 of time and more
Figure 3.2: Gender differences in exposure to physicalrisk, with a male higher risk (%)
2 See for example Expert Forecast on emerging physical risks related to OSH, http://riskobservatory.osha.eu.int/risks/forecasts/physical_risks/
Vibr
atio
ns
Noi
se
Hig
h te
mps
Low
tem
ps
Brea
thin
g
Vapo
urs
Han
dlin
g
Radi
atio
n
Toba
cco
Infe
ctio
us
Tirin
g / p
ainf
ul
Mov
ing,
Hea
vy
Stan
ding
Repe
titiv
e ha
nd /
smok
e, fu
mes
chem
ical
s
smok
e
posit
ions
mat
eria
ls
arm
mov
emen
ts
liftin
g pe
ople
load
s
wal
king
Table 3.1: Physical risks exposure (% exposed quarter of time or more)
EU country rank
Most 1 HU 34.2 PL 41.6 RO 45.0 EL 39.0 RO 29.1 LT 17.5 FI 23.3 MT 8.5 EL 37.2 RO 19.0 EL 66.2 ES 12.4 RO 45.1 LT 80.4 FI 79.6exposed
2 EE 33.6 SI 40.1 EL 44.5 RO 38.6 SK 28.5 CZ 16.6 LT 19.9 SI 7.8 PT 29.0 FI 15.8 RO 61.5 SE 12.1 LT 41.9 PT 80.0 RO 77.2
3 PT 33.3 LT 40.0 CY 36.7 CY 32.7 LV 27.9 SK 16.3 SI 19.8 DE 6.8 LV 28.9 SE 14.5 CY 59.6 FI 11.4 LV 41.4 FI 79.4 EL 76.8
4 LT 31.8 EE 39.4 MT 32.5 LT 30.6 EE 27.5 ES 14.7 EL 18.2 SE 6.8 ES 28.2 MT 13.1 PT 57.1 RO 11.3 EL 41.3 RO 78.8 PT 74.2
5 LV 31.7 HU 38.2 RO 32.0 ES 28.6 EL 27.3 FI 14.4 PL 17.8 FI 6.2 DK 27.5 LT 13.1 HU 53.2 UK 11.1 PL 40.8 SE 77.6 LT 69.3
Least 24 DK 16.8 IT 23.9 LT 17.7 BE 16.4 IE 14.2 IE 6.3 LU 10.5 LU 3.3 FI 11.3 PL 6.2 IE 31.6 LV 4.5 DK 29.8 LU 64.7 LU 54.1exposed
25 NL 15.9 UK 23.7 UK 16.4 AT 15.8 NL 13.7 SE 6.2 DK 10.2 BE 3.3 IT 9.1 CY 5.6 UK 30.6 IT 3.9 IT 28.5 CY 62.1 BE 52.4
26 UK 15.4 LU 23.4 IE 14.6 IE 15.3 DK 13.2 UK 6.0 CY 9.6 IT 3.1 SE 6.7 BG 5.0 CZ 30.0 BG 3.6 LU 25.6 CZ 59.6 IE 51.5
27 SE 15.1 NL 20.0 EE 14.0 IT 13.6 UK 11.7 DK 4.5 NL 8.7 UK 3.1 IE 5.8 IT 3.7 NL 24.8 PL 3.1 NL 22.0 NL 59.1 MT 51.1
Fourth European Working Conditions Survey
30

Measurement of exposure to combined physical risksIn order to identify those categories of workers with thegreatest exposure to a combination of different types of riskfactor, data indicating the average exposure of respondentsto a variety of related workplace physical risk factors canbe used.
As all the variables are measured using the same seven-point scale (from 1 ‘all of the time’ to 7 ‘never’), the averageexposure on a scale of 1–7 can be calculated for threecomposite variables representing exposure to different typesof risk: ergonomic, biological/chemical and noise/temperatures. The greater the exposure to multiple risks and
the more intense the nature of the exposure to individualrisks, the higher an individual’s combined risk score will be.3
To facilitate interpretation, a standardised score (z-score)was calculated across the distribution: 0 represents medianexposure, a positive score is greater than median exposureand a negative score is less than median exposure,measured in standard deviation units. In general, a positivescore indicates higher exposure to risk and can therefore beconsidered negative from a working conditions or healthand safety perspective.
What emerges is that men, especially younger men, reportthemselves more exposed than women to physical riskfactors at the workplace (see Figure 3.5). Exposure tophysical risk factors diminishes for men as they grow olderbut even in the most senior of the three age categories (age50+), men still have a slightly greater-than-average level ofexposure to the composite indicators for biological/chemicaland noise/temperatures. For women, the pattern is more
0
2
4
6
8
10
12
70
Handling infectious materials Lifting / moving people
Men Women Men Women
all / almost all time 1/4 of time and more
Figure 3.4: Gender differences in exposure to physicalrisks, with a female higher risk (%)
0
10
20
30
40
50
60
70
Men Women Men Women
Painful / tiring movements Repetitive hand / armmovements
all / almost all time 1/4 of time and more
3 Composite physical risk factors were constructed as follows: ergonomic risks = combined exposure to painful/tiring positions, vibrations, lifting or movingpeople, carrying heavy loads, standing or walking, repetitive hand/arm movements (Cronbach’s alpha = 0.73); biological/chemical and radiation risks =combined exposure to breathing in smoke, fumes, powder or dust, breathing in vapours such as solvents and thinners, handling chemical products, radiation,handling infectious materials (Cronbach’s alpha = 0.72); ambient risks = combined exposure to noise, high temperatures and low temperatures (Cronbach’salpha = 0.71). Cronbach's alpha is a statistical measure that assesses the reliability of a rating summarising a group of survey answers which measure someunderlying factor (i.e. in this example, ergonomic risks, etc). Cronbach’s alpha scores of 0.7 or above are generally taken to indicate a reliable rating
Figure 3.3: Gender differences in exposure to physicalrisk, with similar levels of risk (%)
Figure 3.5: Exposure to combined physical risks, by sexand age (mean z-score for composite risk indicators)
Note: +/- < 0.25 = small deviation from mean exposure
+/- 0.25-0.5 = substantial deviation from mean exposure
+/- >0.5 = very substantial deviation from mean exposure
-0.4 -0.3 -0.2 -0.1 0 0.1 0.2 0.3 0.4
Women 50+
Women 30–49
Women 15–29
Men 50+
Men 30–49
Men 15–29
noise / temperatures ergonomic risks biological / chemical risks
Physical risk factors
31

stable in general with less than average exposure to eachset of risk factors across all age groups.
Occupational and sectoral dimension of physicalrisk factors
There is a strong correlation between working in specificoccupations and sectors and exposure to physical risks, asFigures 3.6–3.8 illustrate. By occupation, the most exposedgroups are craft and related trades workers, plant andmachine operators and skilled agricultural and fisheryworkers – in this respect there is a clear differentiation interms of blue-collar and white-collar jobs.
In terms of sectors, the construction sector reports thehighest level of exposure to each set of risks, with theagriculture and manufacturing sectors also reporting higher-than-median exposure. The financial intermediation andreal estate sectors are those in which the lowest exposure isreported for each set of risks. The hotel and restaurants andthe health sectors are the only sectors in which there aremarked differences between levels of exposure to the threesets of risks. Workers in the hotel and restaurants sectorreport high levels of ergonomic risk but relatively low levelsof biological and chemical risk. In the health sector, workers
32
Fourth European Working Conditions Survey
Figure 3.6: Type of exposure to ergonomic risk factors,by sector and occupation (average standardised (z)score)
Note: +/- < 0.25 = small deviation from mean exposure
+/- 0.25-0.5 = substantial deviation from mean exposure
+/- >0.5 = very substantial deviation from mean exposure
-1 -0.8 -0.6 -0.4 -0.2 0 0.2 0.4 0.6 0.8
Financial intermediation
Real estate
Education
Public administration and defence
White-collar occupations
Transport and communication
Wholesale and retail trade
Other services
Electricity, gas and water
Health
Manufacturing
Hotels and restaurants
Blue-collar occupations
Agriculture
Construction
Figure 3.7: Exposure to biological and chemical riskfactors, by sector and type of occupation (averagestandardised (z) score)
Note: +/- < 0.25 = small deviation from mean exposure
+/- 0.25-0.5 = substantial deviation from mean exposure
+/- >0.5 = very substantial deviation from mean exposure
-0.6 -0.4 -0.2 0 0.2 0.4 0.6 0.8
Financial intermediation
Education
Real estate
Hotels and restaurants
White-collar occupations
Wholesale and retail trade
Public administration and defence
Transport and communication
Other services
Agriculture
Electricity, gas and water
Manufacturing
Blue-collar occupations
Health
Construction
Figure 3.8: Exposure to noise/temperatures, by sectorand type of occupation (average standardised (z) score)
Note: +/- < 0.25 = small deviation from mean exposure
+/- 0.25-0.5 = substantial deviation from mean exposure
+/- >0.5 = very substantial deviation from mean exposure
-0.8 -0.6 -0.4 -0.2 0 0.2 0.4 0.6 0.8
Financial intermediation
Real estate
Health
White-collar occupations
Education
Wholesale and retail trade
Public administration and defence
Other services
Transport and communication
Hotels and restaurants
Electricity, gas and water
Manufacturing
Blue-collar occupations
Agriculture
Construction

report substantial levels of biological and chemical risk, butvery low levels of risks from noise/temperatures.
Impact of increased exposure to physical risks
The survey sought to identify the correlation betweenexposure to physical workplace risks and a worker’sperception of health risks arising from work and also ontheir perception of work sustainability. Persons who reporta high level of exposure to physical risk are more likely toreport that their health is at risk as a result of their work.They also do not think they will be able to carry out theircurrent main job at the age of 60. Of the three sets ofphysical risks (ergonomic, biological/chemical andnoise/temperatures), increased exposure to ergonomic riskhas the most significant impact on a respondent’sperception of their ability and/or willingness to carry outtheir current job when they are 60 (Figure 3.9).
The most commonly reported physical risk at work isrepetitive hand or arm movements (62% exposed a quarterof the time or more). The survey confirms a correlationbetween the level of exposure to this risk and healthproblems such as muscular problems in the shoulder, neckor limbs, and backache. Repetitive hand/arm movement isonly one of several factors contributing to work-relatedmusculoskeletal problems and there is clearly a widevariation in the nature of the relationship from oneindividual to another. While the incidence of backache andmusculoskeletal problems has been found to rise withincreased exposure to repetitive movements, nonethelessthe majority of those workers with the greatest exposure (‘all
of the time’) do not report that they suffer from each of therelated health problems. On the other hand, the likelypresence of a ‘healthy worker effect’ may serve to reducethe reported levels. In other words, workers for whomrepetitive movements have a major negative health impactmay no longer be in the workforce.
Information about workplace risks and use ofprotective equipment
In addition to measuring exposure to a variety of physicalrisk factors, the survey also asked respondents whether theyconsidered themselves to be well-informed about the health
4 Note: Quartiles are values that divide a sample into four equal parts while terciles divide a sample into three equal parts.
33
Physical risk factors
Figure 3.9: Ability to do same job at the age of 60, bylevel of ergonomic risk exposure (z-score quartiles)4 (%)
Note: The survey question on work sustainability was, ‘Do you think you will
be able to do the same job you are doing now when you are 60 years old?’
0
20
40
60
80
100
High Medium-high Medium-low Low
I wouldn't want to no, I don't think so yes, I think so
Figure 3.10: Lack of information on workplace risks, bycompany size (%)
0
2
4
6
8
10
12
14
16
18
One-personcompany
Microenterprise
(2–9 employees)
Small enterprise
(10–49 employees)
Mediumenterprise (50–249
employees)
Large enterprise
(250+ employees)
not very well informed not at all well informed
Figure 3.11: Lack of information on workplace risks, byemployment status and occupational type (%)
* ie. fixed-term or temporary agency contract
0
5
10
15
20
25
Self-employed
Employee:indefinite-
term contract
Employee: temporary*
Employee:no contract
or other
White-collar Blue-collar
Employment status Occupational type
not very well informed not at all well informed

Fourth European Working Conditions Survey
34
and safety risks related to the performance of their job andalso whether their job necessitated the wearing of personalprotective equipment.
Workers in the new Member States declare themselves tobe better informed regarding workplace risks than theirEU15 counterparts: 15% of EU15 workers reportthemselves not very well informed or not at all informedregarding workplace risks, compared to 9% of NMSworkers. There has been a relatively significant increase(five percentage points) in the proportion of EU15 workersreporting themselves not well-informed over the last fiveyears.
There was an increase in the proportion of EU15 workerswearing protective equipment in 2005 (32%) compared to2000 (28%).
There is a significant correlation between company size andcontract status with level of information regardingworkplace risks. Workers in bigger organisations considerthemselves generally to be well informed about workplacerisks. Workers on indefinite contracts consider themselvesto be better informed about risks than those with a lesspermanent attachment to their main job. Among the self-employed, those working alone are twice as informed aboutworkplace risks (16%) as those with employees (8%).

35
4Violence, harassment and discrimination in the workplace
Table 4.1: Incidence of violence, harassment and discrimination at work (%)
Over the past 12 months, have you or 1995 2000 2005 2005 2001 2005 2001 AC2 2005 AC2have you not been personally subjected EU15 EU15 EU25 EU15 NMS NMSat work to:
Threats of physical violence - - 6 6 - 5 - 4
Physical violencefrom people within workplace 4* 2 2 2 1 1 1 1from people outside workplace 4 4 5 3 4 3 3
Physical violence either from people 4 5 5 6 3 4 4 4within or outside workplace **
Intimidation 8 9 - - 7 - 7 -
Bullying and/or harassment - - 5 5 - 4 - 4
Sexual discrimination 2 2 1 1 1 1 <1 1
Unwanted sexual attention 2 2 2 2 2 2 2 1
Age discrimination 3 3 3 3 3 3 3 3
Nationality discrimination 1 1 1 1 <1 1 1 1
Ethnic discrimination 1 1 1 1 <1 1 1 1
Religious discrimination - - 1 1 - <1 - <1
Disability discrimination 1 1 <1 <1 1 <1 1 <1
Sexual orientation - <1 <1 <1 <1 <1 1 <1
* The two sub-questions were combined in 1995.
** A combined variable based on those answering ‘Yes’ to either Q29b or Q29c
1 See, for example, the following reports from the Foundation: Trends of quality of work in the Netherlands, available athttp://www.eurofound.europa.eu/ewco/surveys/NL0601SR01/NL0601SR01_7.htm and Work-related disorders in Swedenhttp://www.eurofound.europa.eu/ewco/surveys/SE0601SR01/SE0601SR01_3.htm
2 Where the term ‘physical violence’ or ‘violence’ is used without any qualification, it refers to situations where a worker is exposed to violence from persons either inside or outside the workplace.
National working conditions surveys in recent years havehighlighted a trend towards the increasing incidence ofpsychological health problems cited as the basis for work-related health problems.1 Significant factors contributing topsychological ill-health and stress may include bullying orharassment, violence or the threat of violence, as well asvarious forms of discrimination. Research shows that, if leftunchecked, these forms of behaviour can have damagingeffects, not only on the individual well-being andperformance of the person targeted but also on thecollective psychosocial work environment and overallorganisational and economic performance.
The small percentages reported for all of these issues revealthem to be the exception rather than the norm in theworking lives of Europeans. One in 20 workers reportshaving been exposed to bullying and/or harassment in theprevious 12-month period and a similar proportion reportshaving been exposed to violence;2 only about one worker
in 100 reports experiencing discrimination in relation toreligion, ethnic origin or sexual orientation. It should bepointed out, however, that selection bias may lead tounderreporting for many of these categories. For instance, itcould be the case that many workers subjected to seriousinstances of abuse (physical or psychological) ordiscrimination are no longer working and hence do notappear in the target population group ‘persons inemployment’.
It is also the case that certain forms of discrimination – forexample, those related to religion, ethnic origin, sexualorientation and nationality – may only realistically apply tovery limited subgroups from the survey sample belongingto specific minority groupings. The low overall incidence ofthese forms of discrimination tends to conceal a muchhigher incidence in the groups potentially affected.Therefore, figures relating to discrimination should beinterpreted with caution.

In terms of trends, the incidence of various forms ofviolence, harassment and discrimination at work hasremained broadly stable over the last 10 years, althoughlevels of exposure to violence appear to be increasing (from4% to 6% over the period 1995–2005, in the EU15 only).
There have been changes in the phrasing of somequestions. An existing question on exposure to‘intimidation’ has been amended to refer instead to‘bullying/harassment’ to reflect a growing consensus ofusage based on these terms. A new sub-question on ‘threatsof physical violence’ introduced in the 2005 surveyindicated, not surprisingly, that a higher proportion ofworkers were exposed to such threats than to actual acts ofviolence.
Physical violence
Physical violence at work affects just a small proportion ofthe overall workforce: one in 20 workers (5%) overallreports having been personally subjected to violence eitherfrom fellow workers or from others. Higher-than-averagelevels are reported in the Netherlands (10%), France andthe UK (both 9%) and Ireland (8%).
In general, there is a higher reported incidence of exposureto violence, as well as to threats of violence, in the northernEuropean Member States and a lower reported incidencein the southern Member States. There has been an increasein the level of physical violence in the period 1995–2005(from 4% to 6%) in the EU15, which is consistent withfindings at national level.3
More workers are affected by violence from people outsidethe workplace (4%) than from fellow workers (2%) – levelssimilar to those reported in 2000 (for the EU15). A slightlyhigher percentage of workers (6%) reports being subjectedto threats of physical violence than to actual violent acts.
Neither sex nor employment nor contractual status appearsto have a significant impact on exposure to violence,although there are substantial occupational and sectoralvariations. In contrast to standard workplace physical riskexposures, white-collar workers are somewhat moreexposed than blue-collar workers to risks related toviolence, harassment and discrimination (6% compared to4%).
Harassment
Two forms of harassment are examined in the survey:bullying and/or harassment4 and sexual harassment(‘unwanted sexual attention’).
Bullying and harassment
Around one in 20 (5%) workers reports having beensubjected to bullying and harassment in the workplace in2005. However, this low average figure conceals widevariations between countries, ranging from 17% in Finlandand 12% in the Netherlands to 2% in Italy and Bulgaria.Such differences may reflect different levels of culturalawareness of, and sensitivity to, the issue as much asdifferences in actual incidence. Despite the change inwording of this question, it is worth noting that Finland andthe Netherlands were also the two countries with thehighest reported incidence of ‘intimidation’ in the 2000survey, at 15% and 14% respectively.
Women are more subject to bullying and harassment (6%)than men (4%) and younger women are at greatest risk (8%of those under 30 years old). Employees (6%) are moresusceptible than self-employed people (3%), while there areno notable differences according to employment status.
There are substantial differences in the incidence of
BE, DE, FR, LU, AT
EL, ES, IT, CY, MT, PT
DK, NL, FI, SE
IE, UK
CZ, EE, LV, LT, HU, PL, SI, SK
AC2: BG, RO
CC2: TR, HR
Non-EU: CH+NO
EU27
0 2 4 6 8 10 12
threats of violence violence at work
3 See, for example, the Foundation report Violence, bullying and harassment in the workplace, available online at http://www.eurofound.europa.eu/ewco/reports/TN0406TR01/TN0406TR01.pdf
4 This sub-question was reworded in this fourth survey to reflect the prevailing usage of the terms ‘bullying’ and/or ‘harassment’ to describe certain types ofbehaviour, in place of the term ‘intimidation’ which had been used in previous surveys. On the basis of the change in wording, it is inadvisable to draw anyconclusions on trends.
Figure 4.1: Workers subjected to violence or threats ofviolence, by country group (%)
Fourth European Working Conditions Survey
36

bullying and harassment by company size: those working inlarger establishments (over 250 workers) report the highestlevels (8%). Sector is also an important variable, withworkers in the education, health and social work, andhotels and restaurants sectors reporting higher-than-averageincidences.
Sexual harassmentThe incidence of sexual harassment, or unwanted sexualattention, is reported by fewer than 2% of respondentsoverall but affects three times as many female workers asmale. Women in the Czech Republic (10%), Norway (7%),Turkey, Croatia, (6%), Denmark, Sweden, Lithuania and theUK (5%) are the most affected, while in some southernEuropean countries the phenomenon is barely reported atall. Italy, Spain, Malta, Cyprus all have incidences of lessthan 1% overall.
Again, the group most at risk is young women (under 30years old), where the incidence rises to 6%. The rate ishigher for employed workers than for self-employed, and interms of contract status, women on fixed-term contracts ortemporary agency workers report higher levels (5%) thanthose on indefinite contracts (2%).
Incidence of violence and harassment by sector andoccupation The survey reveals major sectoral differences in theincidence of violence and harassment. In many sectorswhere physical risks are high – agriculture, construction and
FI
NL
LU
LT
EL
IE
BE
HR
MT
FR
SI
DK
CH
EE
UK
AT
TR
NO
RO
LV
DE
PT
SK
SE
PL
CY
HU
CZ
ES
IT
BG
0 5 10 15 20 25
men women
EU27
Figure 4.2: Bullying and harassment, by sex andcountry (%)
15–29 30–49 50+ average01
234
567
89
men women
Figure 4.3: Bullying and harassment, by sex and age,EU27 (%)
0
1
2
3
4
5
6
7
8
9
physical violence from people in workplace physical violence from others
bullying/harassment threats of physical violence
Micro enterprise(2–9 employees)
Small enterprise(10–49 employees)
Medium enterprise (50–249 employees)
Large enterprise (250+ employees)
Figure 4.4: Violence and harassment, by company size, EU27 (%)
0
1
2
3
4
5
6
7
8
9
15–29 30–49 50+ average
men women
Figure 4.5: Sexual harassment, by sex and age, EU27 (%)
Violence, harassment and discrimination in the workplace
37

manufacturing – relatively low levels of violence andharassment are reported. The reverse is also true: in sectorswhere physical risks are low, high levels of exposure topsychosocial risk factors are reported. Workers in the healthsector are eight times more likely to have experienced thethreat of physical violence than workers in themanufacturing sector.
Significantly, these differences can be shown to exist acrossall the sub-questions related to psychosocial risks: exposureto physical violence, threat of violence, bullying and/orharassment and unwanted sexual attention.
The risk of experiencing both violence and harassment isgreatest in the education and health sectors as well as the
public administration and defence sectors, with lower butstill significantly above average levels in the transport andcommunication and hotel and restaurant sectors.
Given that the health and social work sector reports thehighest incidence of any sector, it is unsurprising thereforethat in occupational terms life science and healthprofessionals and associate professionals (occupationalcategories including, for example, doctors, dentists, nurses,dental technicians, etc.) also report high levels of exposureto violence. A high level of occupational skill orspecialisation does not appear to offer protection in thisrespect, as professionals are somewhat more affected thanassociate professionals.
Table 4.2: Violence at work: the most exposed sectorsand occupations, EU27 (%)*
Sector Occupation
Health and social work 15.2 Life science and health 15.3professionals
Land transport; transport 11.5 Personal and protective 14.6via pipelines services workers
Public administration 10.8 Life science and health 13.4and defence associate professionals
Hotels and restaurants 8.1 Drivers and mobile 9.5plant operators
Education 7.9 Customer services clerks 8.2
Other service activities 5.2 Teaching professionals 7.6
* Classification based on ISCO/NACE 2-digit codes; only sectors / occupations
with N>500 included.
If the figures above are further analysed in terms of the twocomponents of workplace violence – violence from fellowworkers and violence from people outside the workforce –interesting differences show up both in the health andteaching professions between occupational levels.Professionals – those generally holding more seniorpositions – have a high level of exposure to violence fromnon-colleagues but comparatively low levels of exposure toviolence from colleagues.5 For associate professionals inboth professions, on the other hand, violence is as likely tobe at the hands of people from their workplace as frompeople outside the workforce.
Overall, 6% of public sector workers report havingexperienced bullying or harassment compared to 4% ofthose working in the private sector. For each of thequestions relating to violence in the workplace, public
38
Fourth European Working Conditions Survey
0 2 4 6 8 10 12 14 16 18
Electricity, gas and water
Manufacturing
Financial intermediation
Real estate
Agriculture
Construction
Wholesale and retail trade
Other services
EU27
Hotels and restaurants
Transport and communication
Public administration and defence
Education
Health
threats of violence violence bullying / harassment
unwanted sexual attention
Figure 4.6: Level of violence and harassment, by sector,EU27 (%)
5 Professionals (ISCO-88 major group 2) include occupations whose main tasks require a high level of professional knowledge and experience and generallyeducation and training to university-degree level (e.g. medical doctors, secondary school teachers, etc). Technicians and associate professionals (ISCO-88 majorgroup 3) include occupations whose main tasks require technical knowledge and experience with some post-secondary training but generally not to university-degree level (e.g. dental assistant). See the ILO’s ISCO web site for more information (http://www.ilo.org/public/english/bureau/stat/isco/isco88/index.htm).

sector workers are more than twice as likely to have beensubjected to threats of violence or actual violence as thosein the private sector.
One reason why public sector workers are more affected byviolence or the threat of violence at the workplace may bethe higher level of interaction with people other thancolleagues. Around half of the public-sector workerssurveyed (50%) reported that their job involves dealingdirectly at least three quarters of the time with non-colleagues (i.e. customers, students, patients, etc.)compared to just 38% of private sector workers.
Discrimination
The survey assesses discrimination of different types: basedon sex, ethnic background, age, nationality, religion,disability and sexual orientation. In general, levels ofdiscrimination in the workplace are low – from less than 1%in relation to religion, ethnic background, sexual orientationand disability to 1% in relation to nationality or sex
(although 2% of women and 4% of those under 30 years ofage are affected). Levels have remained stable for allquestions between 2000 and 2005.
Only discrimination related to age is reported by more thana marginal percentage of respondents (3%), varying fromless than 1% in Spain to 6% in the Czech Republic.Interestingly, more respondents under 30 years of age (5%)report being subject to age discrimination than respondentsover 50 (4%), with women under 30 years of age reportingthe highest levels.
Looking at the incidence of age discrimination by countrygroup reveals interesting variations by sex and in agegroups most affected. In the Scandinavian countries andthe Netherlands, there is little differentiation by sex or agein reported levels of age discrimination. In the UK andIreland and in the eastern European countries, higherproportions of younger female workers are affected and thispattern is even more marked in the case of non-EU MemberStates Norway and Switzerland.
39
Violence, harassment and discrimination in the workplace
0
2
4
6
8
10
12
14
16
violence from people from your workplace violence from others
Life science andhealth
professionals
Teachingprofessionals
Life science andhealth associate
professionals
Teachingassociate
professionals
Figure 4.7: Exposure to violence in the health andeducation sectors, by occupational category, EU27 (%)
0
1
2
3
4
5
6
7
8
9
10
11
12
15–29 30–49 50+ average
men women
Figure 4.8: Age discrimination by sex and age, EU27 (%)
0 2 4 6 8 10 12
DK, NL, FI, SE
IE, UK
BE, DE, FR, LU, AT
EL, ES, IT, CY, MT, PT
CZ, EE, LV, LT, HU, PL, SI, SK
AC2: BG, RO
CC2: TR, HR
Non-EU: CH+NO
EU27
men 15–29 women 15–29 men 50+ women 50+
Figure 4.9: Age discrimination by age, sex and countrygroup (%)
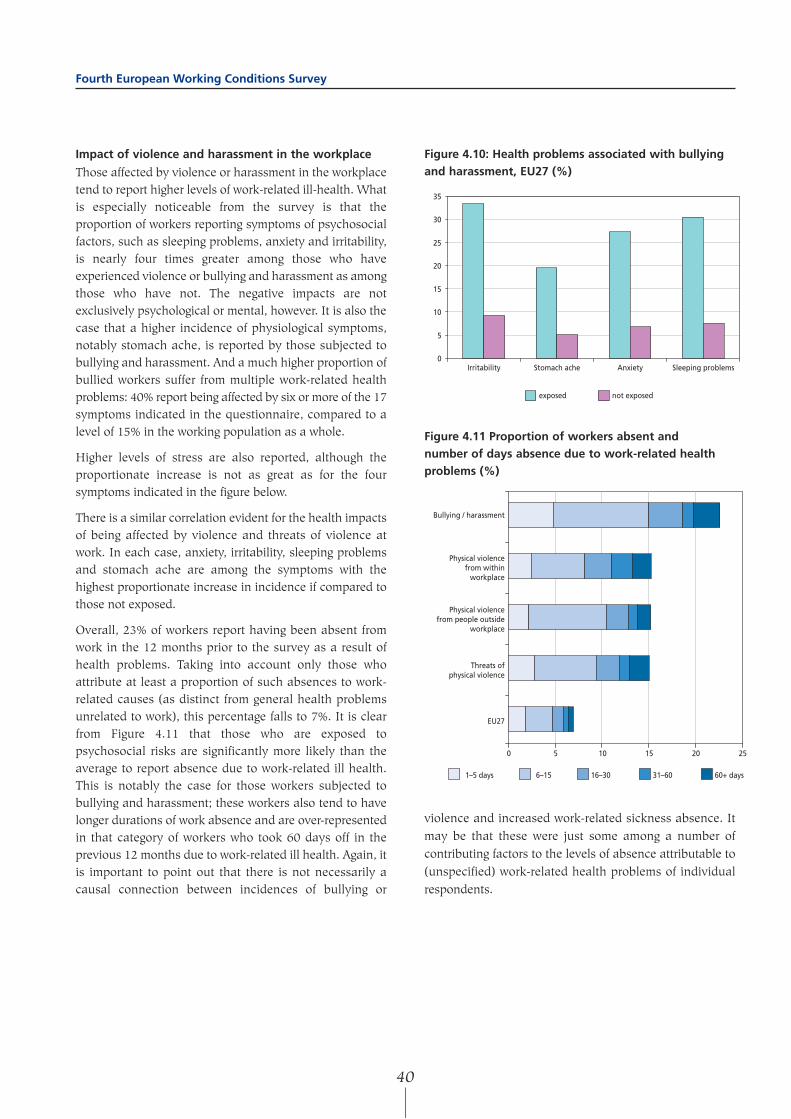
Impact of violence and harassment in the workplace
Those affected by violence or harassment in the workplacetend to report higher levels of work-related ill-health. Whatis especially noticeable from the survey is that theproportion of workers reporting symptoms of psychosocialfactors, such as sleeping problems, anxiety and irritability,is nearly four times greater among those who haveexperienced violence or bullying and harassment as amongthose who have not. The negative impacts are notexclusively psychological or mental, however. It is also thecase that a higher incidence of physiological symptoms,notably stomach ache, is reported by those subjected tobullying and harassment. And a much higher proportion ofbullied workers suffer from multiple work-related healthproblems: 40% report being affected by six or more of the 17symptoms indicated in the questionnaire, compared to alevel of 15% in the working population as a whole.
Higher levels of stress are also reported, although theproportionate increase is not as great as for the foursymptoms indicated in the figure below.
There is a similar correlation evident for the health impactsof being affected by violence and threats of violence atwork. In each case, anxiety, irritability, sleeping problemsand stomach ache are among the symptoms with thehighest proportionate increase in incidence if compared tothose not exposed.
Overall, 23% of workers report having been absent fromwork in the 12 months prior to the survey as a result ofhealth problems. Taking into account only those whoattribute at least a proportion of such absences to work-related causes (as distinct from general health problemsunrelated to work), this percentage falls to 7%. It is clearfrom Figure 4.11 that those who are exposed topsychosocial risks are significantly more likely than theaverage to report absence due to work-related ill health.This is notably the case for those workers subjected tobullying and harassment; these workers also tend to havelonger durations of work absence and are over-representedin that category of workers who took 60 days off in theprevious 12 months due to work-related ill health. Again, itis important to point out that there is not necessarily acausal connection between incidences of bullying or
violence and increased work-related sickness absence. Itmay be that these were just some among a number ofcontributing factors to the levels of absence attributable to(unspecified) work-related health problems of individualrespondents.
0
5
10
15
20
25
30
35
Irritability Stomach ache Anxiety Sleeping problems
exposed not exposed
0 5 10 15 20 25
Bullying / harassment
Physical violencefrom within
workplace
Physical violencefrom people outside
workplace
Threats ofphysical violence
EU27
1–5 days 6–15 16–30 31–60 60+ days
Figure 4.10: Health problems associated with bullyingand harassment, EU27 (%)
Figure 4.11 Proportion of workers absent and number of days absence due to work-related healthproblems (%)
Fourth European Working Conditions Survey
40

This chapter examines some of the changes taking place inhow work is performed: where work is carried out, theincreasing use of information technology at work, and thepossibilities for on-the-job learning.
Place of work
Previous editions of the European Working ConditionsSurvey included indicators on telework and working fromhome. In this fourth edition of the survey, two newindicators have been introduced that facilitate the study ofEuropeans’ place of work in greater detail: the proportion oftime spent working at company premises and theproportion of time working in places other than at home orat company premises (at clients’ premises, on the road etc.)
Figure 5.1 shows the distribution of these four indicators forthe whole of the EU27. As expected, company premises areby far the most important place of work in Europe: almost60% of EU workers work all or almost all the time atcompany premises. It is interesting to note that aconsiderable proportion of people never or almost neverwork at company premises (almost 30%). Around 15% ofrespondents work always or almost always outside thehome or company premises, and twice as many do so atleast a quarter of the time. The proportion of workersworking all or almost all of the time from home (with orwithout a personal computer (PC)) is extremely low: lessthan 3% of the EU working population. On the other hand,around 12% of European workers report working at least aquarter of the time from home without a PC and 8% athome with a PC – a sizeable proportion. This suggests that,although telework or working from home is not yet a realalternative to working on company premises, it is used bya substantial proportion of people as a complement to theirnormal working arrangements.
The general distribution of the four indicators of place ofwork shown in Figure 5.1 does not provide an overallpicture of the usual place of work of Europeans, because itdoes not show, for example, whether those who never workat company premises work from home or elsewhere. Forthis reason, a single composite indicator of the usual placeof work has been created, aggregating the informationprovided by each of the four individual indicators. Thiscomposite indicator classifies workers according to theiranswers in one of the following eight categories:
1) work only in company premises (51% of EU workers);
2) work both at company premises and outside (13%);
3) work only outside (10%);
4) work outside and from home (2%);
5) work only from home (2%);
6) work at company and from home (5%);
7) work a significant amount of time in all locations (4%);
8) do not work a significant amount of time in any of thesecategories; it can be assumed that they work in someother place (13%).
Figure 5.2 illustrates the usual places of work (using thecomposite indicator) in the different sectors of the EUeconomy. There is quite a big variation between differentsectors. In hotels and restaurants, manufacturing, health,retail, financial intermediation and public administration,the proportion of people working only at company premisesis much greater than for all the other categories (only thecategory of ‘company and outside’ has a similar share). Inthe other sectors, a substantial proportion of people work inplaces other than company premises. Construction,transport and utilities stand out as the sectors in which theproportion of people working outside is highest. Educationhas a high proportion of people working from home (aroundone third works either mainly or significantly from home),and, to a lesser extent, real estate and agriculture. Althoughit is a marginal category in all sectors, the proportion ofpeople who are working everywhere (at company premises,outside and from home, a significant amount of time) ishighest in real estate and financial intermediation. Finally,the category of ‘other’ is quite large in agriculture andfishing, which probably indicates that the indicators used tomeasure place of work in the survey do not fit theexperience of workers in this sector very well.
The implications for workers of the different places of workcan be explored. Figure 5.3 shows the relationship betweenthe place of work and the time spent there, showing theaverage working hours for workers in each of the place-of-
At company premises
Outside home and company
At home (without PC)
Telework (at home with PC)
0 10 20 30 40 50 60 70 80 90 100
all the time almost all the time around 3/4 of the time
around 1/2 of the time around 1/4 of the time almost never never
Figure 5.1: Place of work, EU27 (%)
Nature of work 5
41

work categories (represented by the thick line in the middleof each of the boxes) as well as their dispersion (the boxrepresents the 50% of workers around the average, and thevertical lines represent the 90% around the average). Forinstance, the average weekly hours of those working atcompany premises are 37.5; 50% of these workers workfrom 35 to 40 hours, and 90% between 16 and 55 hours perweek. What the graph indicates is that those working atcompany premises show much less variation in their weeklyworking hours than all the others (the box and vertical linesfor them are much less spread out than for the othercategories). By contrast, those working from home (or alsoat the company premises or outside) show a much greaterdispersion of working hours. This points to the fact thatworking from home is by nature much more flexible time-wise (in most cases, the organisation of the hours workedfrom home are entirely determined by the worker), whereasworking at company premises implies a higher degree ofcoordination with the work process and cooperation withothers, which often leads to lower flexibility and thereforemore standardisation of working hours.
Related to this, Figure 5.4 shows the levels of satisfactionwith work–life balance (measured by the question of howwell the respondent considers that working hours fit with
family and social commitments) of the workers in thedifferent places of work. Although the levels of satisfactionwith work–life balance are quite high across all categories,there is a clear correlation between satisfaction with work–life balance and usual place of work. Specifically, thoseworking from home are considerably more satisfied withtheir work–life balance than all other workers and thoseworking outside and everywhere are least satisfied. Thissuggests that not only working hours, but the place of workhas an impact on the work–life balance of workers.
Finally, Figure 5.5 shows the relationship between the placeof work and the perception of health and safety risks. Thereis a clear and quite important correlation: those workingfrom home face the lowest risk levels and those workingoutside face the highest, with the category of working atcompany premises falling in between. A multivariate logisticregression model (not shown here), controlling for sectorand occupation, confirms that working outside has anegative impact on the perception of safety risks from workwhile working from home has a positive impact.
42
Fourth European Working Conditions Survey
Hotels and restaurants
Manufacturing
Health
Wholesale and retail trade
Financial intermediation
Public administration and defence
EU27
Education
Electricity, gasand water
Other services
Real estate
Transport and communication
Agriculture
Construction
company company and outside
home company and home
outside outside and home
everywhere other
0 10 20 30 40 50 60 70 80 90 100
0 10 20 30 40 50 60 70 80
Company
Companyand outside
Outside
Outside andhome
Home
Companyand home
Everywhere
Other
Figure 5.2: Usual place of work, by sector, EU27 (%) Figure 5.3: Weekly working hours by usual place ofwork, EU27

TeleworkIn the fourth European Working Conditions Survey, there is a specific indicator on telework, which is defined as working from homeand with a PC. Figure 5.6 shows the distribution of telework for a number of variables. The overall proportion of people doingtelework is very low: slightly more than 5% of all EU workers do any telework at all, and less than 2% regularly work from homeand with a PC. Although generally very low everywhere, the proportion of people teleworking is highest in the Scandinaviancountries and the Netherlands and lowest in the southern European countries; it is also high in eastern European countries. Teleworkis much more often carried out by self-employed persons than by employees, and men are slightly more likely to do telework thanwomen. In terms of sectors, three stand out with a considerably higher use of telework than all the rest: real estate, financialintermediation and education. Only professional, managerial and technical occupations have more than 5% of workers workingsometimes or always from home and with a PC. Educational level (not shown here) is also strongly related to telework: the higherthe formal qualifications, the more likely workers are to telework.
Use of technology
Changes in the use of technology are one of the maindeterminants of changes in the process of work and,consequently, of working conditions in the long term.According to many analysts, in the last couple of decadesthe use of technologies at work is going through a process
of radical change matched only by the first and secondindustrial revolutions. The most salient aspect of thisrevolution is, of course, the use of information technology(IT) in work processes in advanced economies.
0
5
10
15
Sector Occupation
sometimesalways
Agr
icul
ture
Man
ufac
turin
g
Elec
tric
ity, g
as a
nd w
ater
Cons
truc
tion
Who
lesa
le a
nd re
tail
trad
e
Hot
els a
nd re
stau
rant
s
Tran
spor
t and
com
mun
icat
ion
Fina
ncia
l int
erm
edia
tion
Real
est
ate
Publ
ic a
dmin
istra
tion
and
def
ence
Educ
atio
n
Hea
lth
Oth
er se
rvic
es
Seni
or m
anag
ers
Prof
essio
nals
Tech
nici
ans
Cler
ical
wor
kers
Serv
ice
and
sale
s wor
kers
Agr
icul
tura
l a
nd fi
sher
y w
orke
rs
Skill
ed w
orke
rs
Mac
hine
ope
rato
rs
Uns
kille
d w
orke
rs
43
Nature of work
Figure 5.4: Work–life balance, by usual place of work,EU27 (%)
Note: Question asked ‘Do your working hours fit in with your family or social
commitments outside work?’
Figure 5.5: Perceived impact of work on health, byplace of work, EU27 (%)
Note: Respondents were asked ‘Does your work affect your health?’
Figure 5.6: Telework by sector and occupation, EU27 (%)
Everywhere
Outside
Company and outside
Other
Outside and home
Company and home
Company
Home
not very well not at all wellvery well well
0 10 20 30 40 50 60 70 80 90 100
Home
Company and home
Company
Everywhere
Other
Outside and home
Company and outside
Outside
0 5 10 15 20 25 30 35 40 45

The survey has indicators on the use of IT and of moretraditional types of technology, which can be used toexplore the use of both types of technology in Europeanworkplaces. Drawing from four questions in the survey, acomposite indicator has been derived, following closely theapproach of a previous report on technology and workingconditions carried out by the Foundation in 2002.1 The fouroriginal variables are: use of PC at work, use of internet andemail, work affected by vibrations from machinery and paceof work determined by the automatic speed of a machine.Those workers whose work implies a significant use of PCand internet are classified as ‘IT’ (37% of EU workers) andthose whose work is significantly determined by the use ofmachinery are classified as ‘machinery’ (23%). There is amixed category (workers significantly affected by both,around 10% in the whole of the EU) and a category ofworkers not significantly determined by either IT ormachinery (30%).2
Figure 5.7 represents the proportion of workers that fall intothe IT and machinery category in each country.3 There is astrong negative correlation at the country level between theuse of IT and the use of machine technologies: thosecountries with a higher proportion of workers using IT arealso the countries with less use of machinery, and viceversa. This may suggest a trade-off, an internationaltechnological specialisation or simply the substitution of oldtechnologies by new – one of the characteristics of atechnological revolution (which would mean that thosecountries that are higher in the graph are more advancedin this revolution). In any case, there is a cleardifferentiation by countries in the graph: all theScandinavian countries and the Netherlands score veryhighly in terms of IT use but have very little use of machinetechnology, whereas most eastern and southern Europeancountries are the opposite. Bulgaria, Romania and Turkeyscore significantly lower than all the other countries in theuse of IT at work, and relatively highly in the use ofmachinery. The results seem to show that the compositeindicator of use of technology at work is indeed capturingwhat it intends to capture, as the country differences areconsistent with what could be expected, according toprevious literature and other similar indicators.
Figure 5.8 shows the distribution of the use of IT andmachinery technologies by sector. The sectors in which the
Financial intermediation
Real estate
Public administration and defence
Education
Health
Electricity, gasand water
EU27
Wholesale and retail trade
Other services
Transport and communication
Manufacturing
Hotels and restaurants
Construction
Agriculture
0 10 20 30 40 50 60 70 80 90 100
IT IT and machinery machinery
1 Dhondt, S. et al (2002): Work organisation, technology and working conditions, http://www.eurofound.europa.eu/publications/htmlfiles/ef0205.htm2 Although this composite indicator of use of technologies is meaningful and consistent, it has to be interpreted with care. Because of the way the original
questions were constructed, the indicators for IT are ‘softer’ (they only measure whether people use computers and internet at work a significant amount oftime) than the indicators for machinery (which not only reflect the use of machinery, but also whether the worker is significantly affected or determined bythem). This means that the indicator probably slightly underestimates the use of machine technology, and, consequently, overestimates the proportion ofworkers whose work is not significantly determined by their use. This need not be a weakness of the indicator, as long as one is aware of its limitations.
3 Those in the middle category (work determined by both) have been added to both.
Figure 5.7: Use of technology at work, by country (%)
Figure 5.8: Use of technology at work, by sector, EU27 (%)
0
10
20
30
40
50
60
70
80
Prop
orti
on w
hose
wor
k is
det
erm
ined
by
IT
0 10 20 30 40 50 60 70 80
TRRO
BG
HU
LV
EL
PL
ES PTLT
CY
SK
EE
CZ
HRITMT
ATSI
DE
IE
FRUK
BE
FI
LUNO
DKCH
NLSE
Fourth European Working Conditions Survey
44

use of IT is above the EU average are financialintermediation, real estate, public administration,education, health and utilities. In all these sectors, exceptfor utilities, the use of machinery is marginal. Sectors thatare below the EU average in the use of IT are retail, otherservices, transport, manufacturing, hotels and restaurants,construction and agriculture. In manufacturing,construction and agriculture, the percentage of workerswhose work is substantially determined by the use ofmachinery is very high (above 40% in all cases). At thesame time, there is also a large group of workers inagriculture (and in hotels and restaurants) whose work isnot determined significantly by any type of technology.
There are also very substantial differences in the use oftechnologies in the different occupational groups, as shownin Figure 5.9. Professionals, clerical workers, techniciansand managers use IT most widely, in all cases above 50%;at the other end of the spectrum are skilled workers andmachine operators (who use machine technologies in morethan 60% of cases). Agricultural workers, unskilled workersand service workers show low levels of use of both types oftechnology (with more than 50% of workers not making anysubstantial use of technology at all).
Figures 5.10 and 5.11 show the use of technology at workby sex, age and educational level. The use of IT is slightlyhigher for women than for men, and the use of machinetechnologies is considerably higher for men than for womenof all ages. This reflects the sectoral composition of maleand female work: many of the sectors where men
predominate (notably manufacturing and agriculture) usemachine technologies extensively whereas women areoverrepresented in health, education, the public sector andin clerical occupations, all characterised by greater use ofIT.
The relationship between education and use of technologiesat work is very strong, as can be seen in Figure 5.11. Theuse of IT at work increases dramatically with theeducational level, while both the use of machinery and notusing technology at all decrease substantially.
So, there are wide variations in the use of technology atwork by country, sector, occupation, sex and education. Ingeneral, there is also a clear correlation between the use ofIT at work and better working conditions as reflected in avariety of indicators, and between the use of machinery andpoorer working conditions. Work determined by machineryis characteristically more repetitive and monotonous, withless autonomy and is physically – and sometimes
Figure 5.10: Use of technology at work, by sex andage, EU27 (%)
Professionals
Clerical workers
Technicians
Senior managers
Service and sales workers
Unskilled workers
Skilled workers
Machine operators
Agricultural and fishery workers
0 10 20 30 40 50 60 70 80 90 100
IT IT and machinery machinery
IT IT and machinery machinery
0 10 20 30 40 50 60 70 80 90 100
15–29
30–49
50+
15–29
30–49
50+
Men
Wom
en
0 10 20 30 40 50 60 70 80 90 100
Primary or lower
Lower secondary
Upper secondary
Post secondary
Tertiary
Post graduate
IT IT and machinery machineryFigure 5.9: Use of technology at work, by occupation,EU27 (%)
Figure 5.11: Use of technology at work, by level ofeducation, EU27 (%)
Nature of work
45

psychologically – more demanding. As Figure 5.12 shows,this has an impact on the occupational health risk ofworkers. Work determined by machine technology results inmuch higher levels of musculoskeletal disorders(represented in Figure 5.12 by backache) and considerablymore exposure to workplace risks, according to theevaluation of workers themselves. The use of machinetechnology is also (although not very strongly) correlatedwith higher levels of stress.
Figure 5.13 gives a final indication of the relationshipbetween the different uses of technology at work, andworking and employment conditions. In this case, it can beseen that those working with IT technologies areconsiderably more optimistic about the possibilities forcareer progression offered by their job than workers whosework is determined by machine technology, or workers whodo not make substantial use of any technology.
Skills development and training
A job that makes cognitive and intellectual demands ismore likely to provide opportunities for the worker todevelop their cognitive/intellectual skills; in this respect, thelevel of learning demanded in a job and the degree ofintellectual challenge involved are indicators of the extentto which workers can develop their skills on the job.
Being in a position to avail of learning developmentopportunities in a job also increases general employability.Employability – a key concept in the current Lisbon strategy– depends on a worker continually updating skills, both toprogress in the current job, and to retain the flexibility tofind another job, hence ensuring greater employmentsecurity. A number of indicators of employability wereexamined in the survey; these included the cognitive andintellectual dimensions of work and the possibilities forprofessional development (including access to training).
Cognitive dimensions of work Table 5.1 shows the distribution of cognitive demands ofwork in Europe by sex, age, educational levels, occupation,sector and use of technologies at work. Eight indicatorshave been selected from the fourth European WorkingConditions Survey that can provide an idea of the differentaspects of cognitive demands from work: two of them arerelated to the use of quality standards in the work process(meeting precise quality standards and assessing the qualityof your own work), three of them refer to the complexity ofwork and the need to learn new things (solving unforeseenproblems, carrying out complex tasks and learning newthings) and three of them reflect the opposite: whether workhas low cognitive demands and is characterised bymonotonous and repetitive tasks.
In general, most European workers consider their jobsintellectually demanding in one way or another, althoughalmost half of them report their job as involving a significantnumber of monotonous tasks. But as Table 5.1 shows, thereare quite substantial differences by sector, occupation, andalso by sociodemographic characteristics. In the table, apartfrom the proportion of workers who report being affected byeach of the indicators, the Cramer’s V coefficient is alsodisplayed, to facilitate the interpretation of the table. Thiscoefficient, which ranges from 0 to 1, reflects the strength ofthe relationship between each variable (e.g. education) andeach indicator (e.g. complex tasks), so it can be used tocompare the relationship between cognitive demands andeach of the variables shown in the table. For instance,education is seen to have a stronger influence on the levelof cognitive demands from work than sex and age, becausethe Cramer’s V coefficients are higher for almost allindicators.
Figure 5.12: Occupational health risk, by use oftechnology, EU27 (%)
0 5 10 15 20 25 30 35 40 45 50
IT
IT andmachinery
Machinery
No technology
stress backachehealth and safety at risk because of work
Figure 5.13: Perception of likelihood of jobadvancement, by use of technology, EU27 (%)
Note: Question asked: ‘Do you agree with the following statement “My job
offer good possibilities for career advancement”? ’
strongly disagree disagree neither agree nor disagree
agree strongly agree
0 10 20 30 40 50 60 70 80 90 100
IT and machinery
Machinery
No technology
IT
Fourth European Working Conditions Survey
46
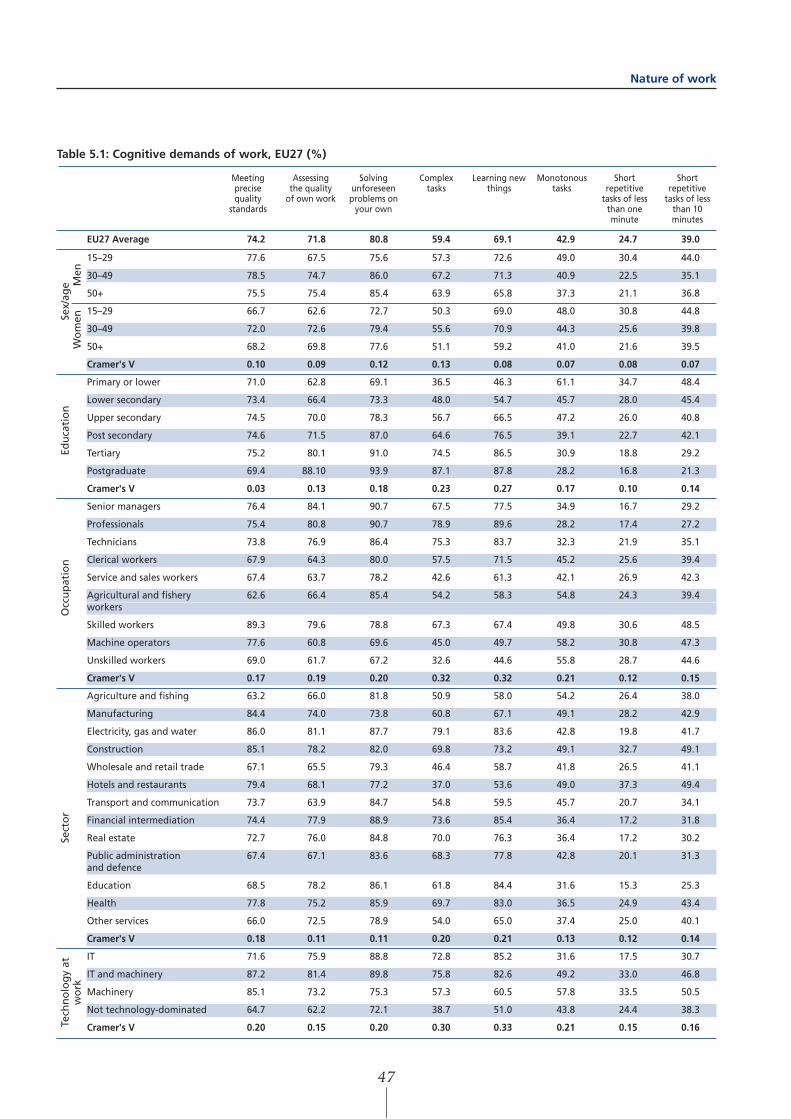
Table 5.1: Cognitive demands of work, EU27 (%)
EU27 Average 74.2 71.8 80.8 59.4 69.1 42.9 24.7 39.0
15 –29 77.6 67.5 75.6 57.3 72.6 49.0 30.4 44.0
30–49 78.5 74.7 86.0 67.2 71.3 40.9 22.5 35.1
50+ 75.5 75.4 85.4 63.9 65.8 37.3 21.1 36.8
15–29 66.7 62.6 72.7 50.3 69.0 48.0 30.8 44.8
30–49 72.0 72.6 79.4 55.6 70.9 44.3 25.6 39.8
50+ 68.2 69.8 77.6 51.1 59.2 41.0 21.6 39.5
Cramer's V 0.10 0.09 0.12 0.13 0.08 0.07 0.08 0.07
Primary or lower 71.0 62.8 69.1 36.5 46.3 61.1 34.7 48.4
Lower secondary 73.4 66.4 73.3 48.0 54.7 45.7 28.0 45.4
Upper secondary 74.5 70.0 78.3 56.7 66.5 47.2 26.0 40.8
Post secondary 74.6 71.5 87.0 64.6 76.5 39.1 22.7 42.1
Tertiary 75.2 80.1 91.0 74.5 86.5 30.9 18.8 29.2
Postgraduate 69.4 88.10 93.9 87.1 87.8 28.2 16.8 21.3
Cramer's V 0.03 0.13 0.18 0.23 0.27 0.17 0.10 0.14
Senior managers 76.4 84.1 90.7 67.5 77.5 34.9 16.7 29.2
Professionals 75.4 80.8 90.7 78.9 89.6 28.2 17.4 27.2
Technicians 73.8 76.9 86.4 75.3 83.7 32.3 21.9 35.1
Clerical workers 67.9 64.3 80.0 57.5 71.5 45.2 25.6 39.4
Service and sales workers 67.4 63.7 78.2 42.6 61.3 42.1 26.9 42.3
Agricultural and fishery 62.6 66.4 85.4 54.2 58.3 54.8 24.3 39.4workers
Skilled workers 89.3 79.6 78.8 67.3 67.4 49.8 30.6 48.5
Machine operators 77.6 60.8 69.6 45.0 49.7 58.2 30.8 47.3
Unskilled workers 69.0 61.7 67.2 32.6 44.6 55.8 28.7 44.6
Cramer's V 0.17 0.19 0.20 0.32 0.32 0.21 0.12 0.15
Agriculture and fishing 63.2 66.0 81.8 50.9 58.0 54.2 26.4 38.0
Manufacturing 84.4 74.0 73.8 60.8 67.1 49.1 28.2 42.9
Electricity, gas and water 86.0 81.1 87.7 79.1 83.6 42.8 19.8 41.7
Construction 85.1 78.2 82.0 69.8 73.2 49.1 32.7 49.1
Wholesale and retail trade 67.1 65.5 79.3 46.4 58.7 41.8 26.5 41.1
Hotels and restaurants 79.4 68.1 77.2 37.0 53.6 49.0 37.3 49.4
Transport and communication 73.7 63.9 84.7 54.8 59.5 45.7 20.7 34.1
Financial intermediation 74.4 77.9 88.9 73.6 85.4 36.4 17.2 31.8
Real estate 72.7 76.0 84.8 70.0 76.3 36.4 17.2 30.2
Public administration 67.4 67.1 83.6 68.3 77.8 42.8 20.1 31.3and defence
Education 68.5 78.2 86.1 61.8 84.4 31.6 15.3 25.3
Health 77.8 75.2 85.9 69.7 83.0 36.5 24.9 43.4
Other services 66.0 72.5 78.9 54.0 65.0 37.4 25.0 40.1
Cramer's V 0.18 0.11 0.11 0.20 0.21 0.13 0.12 0.14
IT 71.6 75.9 88.8 72.8 85.2 31.6 17.5 30.7
IT and machinery 87.2 81.4 89.8 75.8 82.6 49.2 33.0 46.8
Machinery 85.1 73.2 75.3 57.3 60.5 57.8 33.5 50.5
Not technology-dominated 64.7 62.2 72.1 38.7 51.0 43.8 24.4 38.3
Cramer's V 0.20 0.15 0.20 0.30 0.33 0.21 0.15 0.16
Meetingprecise quality
standards
Assessing the quality
of own work
Solvingunforeseenproblems on
your own
Complex tasks
Learning newthings
Monotonoustasks
Shortrepetitive
tasks of lessthan oneminute
Shortrepetitive
tasks of lessthan 10minutes
Tech
no
log
y at
Se
cto
rO
ccu
pat
ion
Edu
cati
on
Sex/
age
wo
rkW
om
enM
enNature of work
47

Although sex and age do not have a very strong relationshipwith the levels of cognitive demands of work, it still shouldbe noted that women systematically report lower levels ofcognitive demands (and more monotonous and repetitivetasks) than men, in all age groups. Education, on the otherhand, shows a consistent relationship with the indicatorsof cognitive demands of work: as the educational levelincreases, the reported levels of cognitive demands alsoincrease, and the proportion of workers doing monotonouswork decreases considerably. This suggests that there is arelationship between the educational level and cognitivedemands of work, as expected.
Occupation has a more complex relationship with thedifferent indicators. The use of quality systems at work ishigher for skilled occupations and lower for clerical andservice occupations. Complex tasks and the requirement oflearning new things at work are more frequent in skilled,professional and technical occupations, but occur rarely inunskilled, semi-skilled and service occupations. As formonotonous tasks, they tend to be less prevalent in higheroccupational groups.
By sectors, the picture is also complex. Quality systems aremore important in manufacturing, utilities and construction,but play no particular role in retail, public administration,education and other services. Complex tasks can be oftenfound in utilities, financial services and real estate, butrarely in retail and hotels and restaurants. Learning newthings is most reported in utilities, financial services,education and health, but not so much in retail, hotels andrestaurants and agriculture. Monotonous tasks are morefrequent in agriculture, manufacturing, construction andhotels and restaurants, and less frequent in financialservices, real estate, education and health.
The main conclusion that can be drawn from looking at thedifferent cognitive demands by occupation and sector isthat there are important differences, with some sectors andoccupations showing fairly high cognitive demands andothers quite low ones (which are normally also correlatedwith monotonous and repetitive work). Professionals,technicians and skilled workers report higher levels ofcognitive demands, as do the sectors of financialintermediation, education and health. Unskilled and semi-skilled occupations and the retail, hotels and restaurantsand agriculture sectors show consistently lower levels ofreported cognitive demands, and higher levels ofmonotonous and repetitive work.
Finally, Table 5.1 also shows the relationship between theuse of technology at work and the different types ofcognitive demands. There is a consistent relationshipbetween both aspects of work. Complex tasks and learningnew things are much more frequent in jobs using IT than injobs using machinery, while the opposite applies tomonotonous tasks (more prevalent in machinery work). Theuse of quality standards is on the other hand more frequentin work determined by machinery, which is not surprising,considering that such work is easier to standardise.
Professional development
It has already been mentioned that there seems to be arelationship between the level of education and thecognitive demands of work. But there should also be sometype of relationship between cognitive demands andtraining at work. Table 5.2 shows how workers facing eachtype of cognitive demand assess the match between theirskills and the duties of their current jobs. Those workerswho carry out complex tasks and learn new things at workare much more likely to feel that they need further training,whereas the opposite is the case for those carrying outmonotonous or repetitive tasks (who are actually morelikely to consider themselves overskilled for the work theydo). And, according to the training levels reported byrespondents, this has an impact on real training levels: ingeneral, all those workers who report high cognitivedemands are considerably more likely to have receivedtraining in the 12 months prior to the survey, even whenthey themselves paid for the training. The opposite is thecase for those who perform monotonous tasks: they areslightly less likely to have received any training in the last12 months.
Access to training
The levels and types of cognitive demands at work do notonly vary substantially by different educational levels andjob characteristics: they are also correlated with theperception of skills match and the levels of training. Butdata in Table 5.2 show that the levels of training are notvery high in general, even for those workers facingcognitively demanding jobs. As Figure 5.14 shows, less than30% of EU employees received any type of training at workin 2005. The levels of training in the EU have not increasedin the last 10 years, since the European Working ConditionsSurvey started measuring them4. But there are very bigcountry differences. As in previous editions of the survey,northern European countries come at the top of the league:more than 50% of workers received training at work in
48
Fourth European Working Conditions Survey
4 See the Foundation report 15 years of working conditions in the EU: Charting the trends, at http://www.eurofound.europa.eu/publications/htmlfiles/ef0685.htm

Finland and Sweden. At the other end of the scale are most
southern and eastern European countries, where the levels
of training are very low, hardly reaching 20% of employees
in Spain, Greece, Hungary, Portugal, Romania and 10% of
employees in Bulgaria and Turkey.
Table 5.3 shows the main differences in training levels in
different sectors and occupations. The levels of training
provided by the employer are much higher in public
administration, finance, education and health; they are very
low in hotels and restaurants, agriculture, construction, the
retail trade and manufacturing. By occupation, managers,
professionals and technicians receive much more training
than the rest: the levels of training are particularly low in
skilled, semi-skilled and unskilled industrial and service
occupations. By employment and part-time status there are
significant differences as well: part-time and temporary
workers are less likely to have received training than their
full-time, permanent colleagues. Finally, both the amount
of training received from the employer and paid for by the
worker themselves increases steadily with the level of
education, ranging from 11% of workers with a primary
level of education to nearly 40% for workers with a tertiary
level of education.
FI
SE
CH
BE
NO
UK
IE
AT
SI
MT
DK
LU
SK
NL
EE
PL
CZ
EU27
DE
HR
FR
LT
LV
CY
IT
ES
EL
HU
PT
RO
BG
TR
paid by employer paid by worker
0 10 20 30 40 50 60 70 80 90 100
Table 5.2: Cognitive demands, skills match and training, EU27 (%)
49
Nature of work
Which of the following alternatives would best Have you undergone Have you undergonedescribe your skills in your own work? training paid for or training paid for by
provided by your yourself in the last 12employer in the last months?12 months?
Yes No Yes No
meeting precise quality No 10.5 55.0 34.5 23.0 77.0 4.2 95.8standards Yes 14.1 51.2 34.7 31.3 68.7 5.0 95.0
assessing the quality No 11.4 56.1 32.5 20.5 79.5 3.5 96.5of own work Yes 13.8 50.7 35.5 32.9 67.1 5.4 94.6
solving unforeseen No 11.2 58.8 30,0 16.7 83.3 2.4 97.6problems on your own Yes 13.7 50.8 35.6 32.4 67.7 5.5 94.5
complex tasks No 7.7 55.9 36.5 18.7 81.3 3.6 96.4
Yes 16.9 49.9 33.2 36.3 63.7 5.8 94.2
learning new things No 4.7 57.4 37.9 11.7 88.3 2.4 97.6
Yes 16.9 50.1 32.9 36.8 63.2 6.0 94.0
monotonous tasks No 14.8 53.4 31.8 32.3 67.7 5.9 94.1
Yes 11.1 51.0 37.9 25.0 75.0 3.7 96.3
short repetitive tasks of No 13.4 53.1 33.5 30.2 69.8 5.0 95.0less than one minute Yes 12.0 50.9 37.2 25.2 74.8 4.5 95.5
short repetitive tasks No 13.4 53.1 33.4 30.9 69.1 5.0 95.0of less than 10 minutes Yes 12.7 51.3 36.0 26.1 73.8 4.7 95.3
Doe
s yo
ur m
ain
paid
job
invo
lve.
..?
I need furthertraining to copewell with myduties
My dutiescorrespond wellwith my presentskills
I have skills tocope with moredemandingduties
Figure 5.14: Percentage of employees who receivedtraining, by country (%)
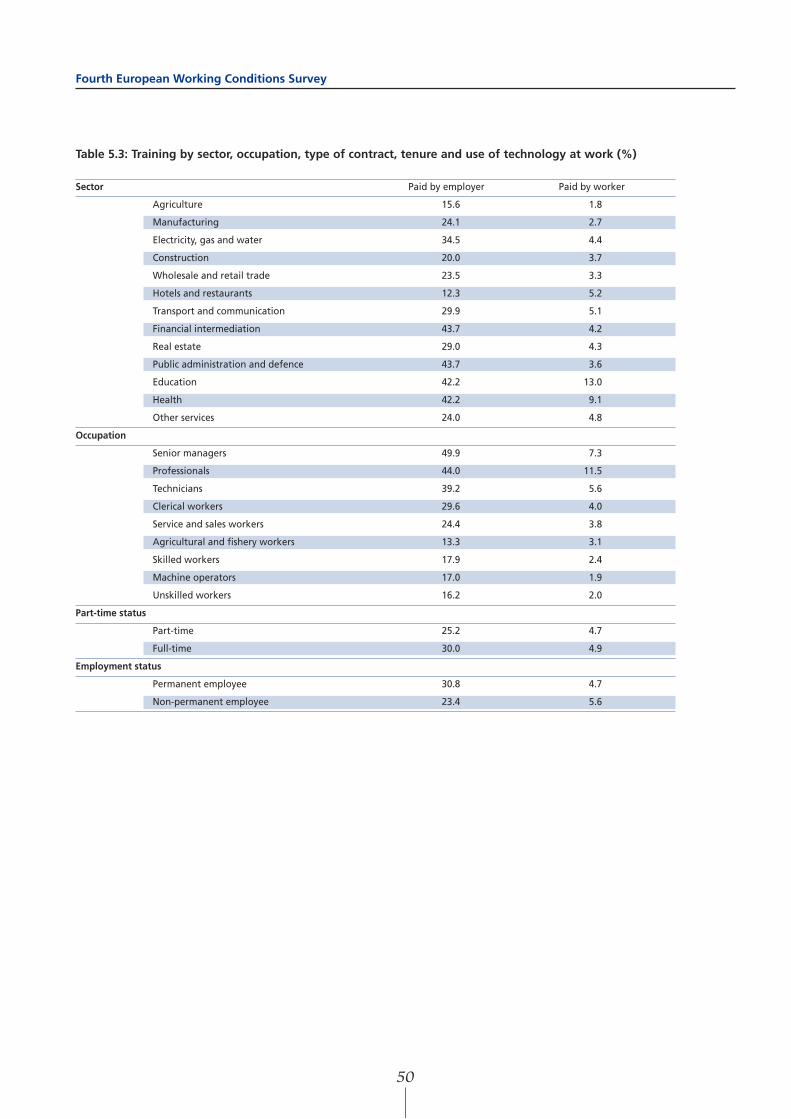
50
Fourth European Working Conditions Survey
Table 5.3: Training by sector, occupation, type of contract, tenure and use of technology at work (%)
Sector Paid by employer Paid by worker
Agriculture 15.6 1.8
Manufacturing 24.1 2.7
Electricity, gas and water 34.5 4.4
Construction 20.0 3.7
Wholesale and retail trade 23.5 3.3
Hotels and restaurants 12.3 5.2
Transport and communication 29.9 5.1
Financial intermediation 43.7 4.2
Real estate 29.0 4.3
Public administration and defence 43.7 3.6
Education 42.2 13.0
Health 42.2 9.1
Other services 24.0 4.8
Occupation
Senior managers 49.9 7.3
Professionals 44.0 11.5
Technicians 39.2 5.6
Clerical workers 29.6 4.0
Service and sales workers 24.4 3.8
Agricultural and fishery workers 13.3 3.1
Skilled workers 17.9 2.4
Machine operators 17.0 1.9
Unskilled workers 16.2 2.0
Part-time status
Part-time 25.2 4.7
Full-time 30.0 4.9
Employment status
Permanent employee 30.8 4.7
Non-permanent employee 23.4 5.6

Over the last 20 years, debates on the organisation of workin modern market economies have revolved around thecontraposition of two types of work organisation – the‘traditional industrial model’ versus ‘new forms of workorganisation’. The traditional industrial model ischaracterised by a centralised, top-down organisation ofwork, with limited autonomy and rigid hierarchies; bycontrast, new forms of work organisation emphasise flatterauthority structures, more autonomy at all hierarchicallevels, and teamwork.
In this chapter, the fourth European Working ConditionsSurvey will be used to study the main features of workorganisation in Europe. First, the levels of autonomy atwork, teamwork and task rotation will be analysed. Themain determinants of pace of work in European workplacesand the perceived levels of work intensity will then beexamined. Finally, an analytical model linking workorganisation and job demands will be used to summarisethe main findings of the chapter.
Autonomy at work
The fourth European Working Conditions Survey includesseveral indicators of autonomy at work. Table 6.1 outlinesthe current levels of work autonomy in the EU27 for five ofthese indicators.1 Three of these indicators have to do withthe worker’s freedom to exercise control over the workprocess (the ability to choose or change the order of tasks,the methods of work and the speed or rate of work); thefourth refers to the influence the worker has over the choiceof working partners, and the fifth concerns the ability of theworker to interrupt their work in order to take a short break,when they wish.
Table 6.1 shows that a high proportion of workers enjoysome control over the work process, and can take a break
when they wish: almost two thirds of European employeesreport control over these four indicators. A much lowerproportion (32%) has any influence over the choice ofworking partners.
To facilitate the analysis of the degree of autonomy indifferent countries and types of work, a composite indicatorwas constructed, drawn from the five indicators shown inTable 6.1. and using the statistical measure Cronbach’salpha to gauge reliability.2 As each of the five individualvariables can only take a positive or negative value, thecomposite variable can be constructed by simply adding theindividual indicators.3 By way of illustration, an individualwith a score of four in the autonomy composite indicatorhas control over four of the five indicators in Table 6.1.
51
6Work organisation
1 Given the fact that the self-employed enjoy much higher levels of autonomy than employees, this section will focus mainly on employees.2 The internal consistency of this group of variables is quite high, as shown by the Cronbach’s alpha of the five individual indicators: 0.72.3 Adding the individual indicators implies an assumption that the individual variables in the composite indicator all have the same relative importance, i.e. they
are all equally weighted in the indicator.
Table 6.1: Extent of work autonomy, by employmentstatus (%)
Self-employed EmployeesAble to choose or change 87 59order of tasksAble to choose or change 87 63methods of workAble to choose or change 89 65speed of workInfluence over choice 64 32of working partnersAble to take a break 90 58when desired
Figure 6.1: Extent of autonomy in the workplace, bycountry
Note: Figures apply to employees only.
0 1 2 3 4 5
DK
SE
NO
NL
FI
MT
CH
LU
LV
BE
EE
FR
IE
IT
UK
LT
EU27
AT
RO
TR
SI
HU
PL
HR
CY
PT
DE
ES
CZ
SK
EL
BG

The composite indicator allows for comparisons to be madein the level of autonomy in the workplace in differentEuropean countries, as Figure 6.1 shows. Scandinaviancountries and the Netherlands display the highest levels ofautonomy, with Denmark and Sweden having a score ofaround 3.6; southern and eastern European countries havethe lowest levels, with Bulgaria having a score of just 2.1.
There are considerable sectoral and occupationaldifferences in levels of autonomy measured by thecomposite indicator, as is shown in Table 6.2. The highestlevels of autonomy are found in financial intermediation(3.42), electricity, gas and water (3.40), and real estate(3.34); the lowest levels are found in hotels and restaurantsand in manufacturing (2.31 and 2.40 respectively). Byoccupation, the differences are even greater: seniormanagers enjoy the highest levels of autonomy (4.02),followed by professionals (3.29) and technicians (3.15); atthe other end of the scale, machine operators have the
lowest levels of autonomy (1.84), followed by skilledworkers (2.35). Table 6.2 also indicates the different degreesof autonomy associated with different uses of technology: itis interesting to note that the use of information technologyin the workplace is clearly associated with a higher degreeof autonomy (3.36) in comparison with the use of machinetechnology (2.11 ) or no technology at all (2.41).
Functional flexibility and teamwork
Another key difference between the ‘traditional’ and the‘new’ forms of work organisation is the importance attachedin the latter forms to functional flexibility and teamwork.
Looking at the results of the fourth European WorkingConditions Survey, it seems that the levels of functionalflexibility and teamwork are quite high in Europeanworkplaces: around 50% of employees in the EU27 rotatetasks with their colleagues, i.e. they are functionally flexible,and 60% do part or all their work in teams (as Table 6.3shows).
The survey questionnaire used follow-up questions toassess the degree of autonomy associated with these twoforms of work organisation. In the case of functionalflexibility, different skills are required in almost 78% ofcases; however, it was usually the boss or manager whodecided the division of tasks (in around 72% of cases),while the team participated in the division of tasks inaround 50% of cases. Therefore, it seems that the level ofautonomy associated with this indicator is relatively high.In the case of teamwork, only around 50% of thoseemployees who work in teams decide themselves on thedivision of tasks, and less than 30% can select the head oftheir team. So for teamwork, while it is prevalent as a formof work organisation, the levels of autonomy anddecentralisation of decision-making in the teams is muchlower than for task rotation.
52
Fourth European Working Conditions Survey
Table 6.2: Autonomy composite indicator, by sector,occupation and use of technology at work Sector
Agriculture 2.98
Manufacturing 2.40
Electricity, gas and water 3.40
Construction 2.66
Wholesale and retail trade 2.66
Hotels and restaurants 2.31
Transport and communication 2.63
Financial intermediation 3.42
Real estate 3.34
Public administration and defence 3.01
Education 2.96
Health 2.79
Other services 3.01
Occupation
Senior managers 4.02
Professionals 3.29
Technicians 3.15
Clerical workers 2.84
Service and sales workers 2.55
Agricultural and fishery workers 3.23
Skilled workers 2.35
Machine operators 1.84
Unskilled workers 2.43
Technology in workplace
Information technology only 3.36
Information technology and machinery 3.02
Machinery only 2.11
No technology 2.41
Note: Figures apply to employees only.
Figure 6.2: ‘Basic’ functional flexibility and teamwork,by country (%)
Note: Figures apply to employees only.
CH
NO
TR
RO
HR
BG
UK
SE
FI
SK
SI
PTPL
AT
NLMT
HU
LULT
LV
CY
IT
IE
FR
ES
EL
EE
DEDK
CZ BE
40
50
60
70
80
90
20 30 40 50 60 70 80 90
Employees rotating tasks with colleagues
Empl
oyee
s w
orki
ng in
tea
ms

Looking at the national and sectoral distribution of theseindicators gives a more precise picture regarding theirprevalence. Figure 6.2 illustrates the extent of task rotationand of teamwork in different European countries. Bothforms of work organisation are most prevalent in Slovenia,Netherlands and some Nordic countries, while they areleast prevalent in France, Hungary, Italy, Portugal andSpain.
As mentioned above, it is important to qualify the generalindicators of functional flexibility and teamwork with theanswers given to the follow-up questions, which indicatethe prevalence of advanced forms of both types of workorganisation. As Figure 6.3 shows, these ‘advanced’ formsof work organisation are considerably more prevalent in thenorthern European countries, while they are least prevalentin the southern and eastern European countries.
Figures 6.4 and 6.5 show the levels of functional flexibilityand teamwork (both ‘basic’ and ‘advanced’) among EU27employees in different sectors and occupations. Health isthe sector that displays the greatest prevalence of advancedforms of both functional flexibility and teamwork. Other
sectors where functional flexibility and teamwork areprevalent are electricity, gas and water, education, andconstruction. In contrast, the two indicators are leastprevalent in transport and communications, and in anumber of service sectors.
In terms of occupations, both indicators are most prevalentamong professionals, managers and skilled workers, andare least prevalent among unskilled workers, machineoperators and clerical workers.
The results show that there is a wide variation in the use offunctional flexibility and teamwork across sectors andoccupations. In some cases, the presence or absence ofthese forms of work organisation may not necessarily reflectforms of work organisation but may instead reflect thenature of the work processes themselves. In construction,for instance, the fact that work is organised in teams andentails high levels of task rotation is probably due to thenature of construction work itself: top-down coordinationof work is difficult, and most work can best be carried outby groups of skilled labourers working together.
53
Work organisation
Table 6.3 Autonomy in functional flexibility and in teamwork (%)
Employees whose job involves rotating tasks with colleagues47.7
of total
tasks require different skills 77.8 37.1
manager decides div ision of tasks 71.6 34.1
team decides division of tasks 51.0 24.3
Employees whose job involves doing part or all work in teams60.0
of total
team members decide division of tasks 52.1 31.3
team members select head of team 28.8 17.3
Figure 6.3: ‘Advanced’ functional flexibility andteamwork, by country (%)
Note: Figures apply to employees only.
0
10
20
30
40
50
60
Empl
oyee
s in
aut
onom
ous
team
s
10 20 30 40 50 60 70
Employees rotating different-skill tasks with colleagues
BECZ
DK
DE EE
ELESFR
IE
IT
CY
LV
LTLU
HU
MT
NL
AT
PL
PT
SI
SK
FI SE
UK
BG
HR
RO
TR
NO
CH Figure 6.4: ‘Basic’ functional flexibility and teamwork,by sector and occupation (%)
Note: Figures apply to employees only.
Unskilled workers
Machine operators
Skilledworkers
Service/sales workers
Clerical workers
Technicians
Professionals
Senior managers
Other services
Health
Education
Public administration & defence
Real estate
Financial intermediation
Transport & communication
Hotels & restaurants
Wholesale and retail trade
Construction
Electricity, gas & water
Manufacturing
Agriculture
40
50
60
70
80
20 30 40 50 60 70
Employees rotating tasks with colleagues
Empl
oyee
s w
orki
ng in
tea
ms

Determinants of pace of work
As Table 6.4 indicates, the most important determinant ofthe pace of work – according to more than 68% of Europeanworkers – is direct demands from people, which can beunderstood as an indicator of direct market constraintsupon the work process. By contrast, the most visibleindustrial constraint – a pace of work determined by theautomatic speed of a machine – affects only 19% ofEuropean workers (a proportion that has been decreasingover the past 15 years).
In recent years, shifts in the structure of the economy (withthe services sector growing at the expense ofmanufacturing) have resulted in changes in thedeterminants or constraints of work. Moreover, pressurefrom increasing market competition, economic activity andconsequently work itself is becoming more directlydependent on market constraints.
Between these two poles of industrial and marketconstraints, there are three types of determinants that donot fit so clearly into either bracket (and affect more thanone third of the EU working population): the work done bycolleagues (42%), numerical production targets (42%) andthe direct control of a superior (36%); these types ofconstraints reflect the organisation of work, rather thanexternal constraints. In any case, the survey responsesregarding these five indicators confirms the predominanceof market constraints and the decreasing importance ofmechanised industrial constraints. While direct control of a
superior shows a downward trend, the work done bycolleagues and numerical and production targets areincreasing in importance as determinants of the pace ofwork in Europe.4
Table 6.4 shows the determinants of pace of work indifferent occupations and sectors. Direct demands frompeople are most important in services sectors (more than70%), and in high-skilled occupations (more than 70% forsenior managers, professionals and technicians). Directdemands are least important in agriculture and fishing(35%) and manufacturing (55%), and for those occupationsmore closely linked to manufacturing industry – skilledworkers, machine operators and unskilled occupations (allbetween 50% and 60%).
The automatic speed of a machine, by contrast, is a majordeterminant of the pace of work in manufacturing (41%),and is also important in construction (24%), transport andcommunications (23%) and agriculture (22%); in sectoralterms it is a very important determinant of pace of workamong machine operators (50%) and skilled workers (33%).However, it is almost negligible in education, health, andother services, and in professional and service occupations.
In Figure 6.6, countries are plotted on a chart, according tothe percentage of workers whose pace of work depends onmarket constraints, i.e. direct demands from people, andthe percentage of workers whose pace of work depends onindustrial constraints, i.e. the speed of a machine. Anegative correlation between the incidences of the two typesof constraints is clearly visible: for countries in whichmarket constraints are more important, industrial
54
Fourth European Working Conditions Survey
4 For a discussion of the evolution of these and other indicators, see the Foundation résumé, 15 years of working conditions in the EU: Charting the trends,http://www.eurofound.europa.eu/publications/htmlfiles/ef0685.htm
Figure 6.5: ‘Advanced’ functional flexibility andteamwork, by sector and occupation (%)
Note: Figures apply to employe es only.
Agriculture
Manufacturing
Electricity, gas & water
Construction
Wholesale and retail tradeHotels & restaurantsTransport &
communication
Financial intermediation
Real estate
Public administration & defence
Education
Health
Other services
Senior managers
Professionals
Technicians
Clerical workers
Service/sales workers Skilled workers
Machine operatorsUnskilled workers
20
30
40
50
20 30 40 50 60
Employees rotating different-skill tasks with colleagues
Empl
oyee
s in
aut
onom
ous
team
s
Figure 6.6: Market constraints and industrialconstraints as determinants of pace of work, bycountry (%)
UK
TR
SKSI
SE
RO
PT
PL
NO NL
MT
LV
LU
LT
IT
IE
HU
HR
FRFI
ESEL
EE
DK
DE
CZ
CYCH
BG
BEAT
0 10 20 30 40
Automatic speed of a machine
40
50
60
70
80
Dir
ect
dem
ands
fro
m p
eopl
e

55
Work organisation
Table 6.4: Determinants of pace of work, by sector and occupation (%)
Direct demands Work done Numerical Direct control Automatic from people by colleagues production of boss speed of
targets a machine
EU27 average 68.1 42.2 42.1 35.7 18.8
Employment status
Employers 83.4 35.6 45.2 3.7 18.5
Self-employed 69.88 16.5 32.8 6.4 12.6
Permanent employee 67.97 46.0 45.5 40.8 19.87
Non-permanent employee 64.5 47.8 36.5 45.7 20.1
Cramer's V 0.08 0.20 0.10 0.29 0.06
Sector
Agriculture 29.6 33.3 50.1 22.1 22.1
Manufacturing 54.7 51.6 63.3 46.1 41.4
Electricity, gas and water 65.3 48.9 47.1 38.1 14.6
Construction 67.4 57.6 51.5 43.4 23.5
Wholesale and retail trade 82.0 34.5 31.1 33.8 13.1
Hotels and restaurants 87.6 48.7 30.9 36.8 14.3
Transport and communication 70.6 42.4 46.8 38.6 22.4
Financial intermediation 77.2 37.6 48.6 36.3 10.1
Real estate 71.1 39.5 41.0 31.6 11.7
Public administration and defence 61.7 43.9 30.5 39.9 10.8
Education 79.4 30.5 32.8 28.4 3.8
Health 83.0 47.7 30.08 29.5 7.9
Other services 65.8 31.5 29.2 24.95 9.7
Cramer's V 0.30 0.18 0.26 0.16 0.31
Occupation
Senior managers 83.0 39.8 45.3 21.4 15.0
Professionals 76.2 37.8 41.5 27.4 7.9
Technicians 74.8 41.7 43.1 35.9 12.4
Clerical workers 72.4 44.3 34.4 42.0 13.0
Service and sales workers 82.0 37.4 29.8 31.8 9.4
Agricultural and fishery workers 27.3 26.9 47.4 12.1 18.4
Skilled workers 59.6 51.6 55.7 44.8 33.7
Machine operators 55.1 51.7 56.1 48.5 49.6
Unskilled workers 53.4 38.9 33.2 40.9 19.7
Cramer's V 0.29 0.13 0.18 0.19 0.31
constraints are less important, and vice versa. In Turkeyand most eastern European countries, the automatic speedof a machine is a much more important determinant of thepace of work – and direct demands from people a much lessimportant determinant – than in most other countries.
Figure 6.7 plots countries in a similar way, but using thedeterminants of direct demands from people, and directcontrol by a superior. A clear negative correlation is onceagain apparent, as is an even clearer differentiation ofcountries: for northern European countries, work is stronglydetermined by direct demands from people, while the directcontrol of a superior is almost negligible as a determinant;for countries such as Bulgaria and Croatia, direct control by
a superior is still an important determinant of the pace ofwork, while direct demands by people play a more limitedrole. Cyprus, Malta and the UK are exceptions to thispattern: in these countries, work is strongly determined bydirect demands from people; however, the direct control ofa superior is also an important determinant.
Econometric analysis of the impact of the differentdeterminants of pace of work on working conditions wascarried out to show that the impact is quite significant inmost areas. Workers whose pace of work is determined bythe automatic speed of a machine or by numericalproduction targets are more likely to be affected by physicalhealth problems, to perceive work as more intense and

56
Fourth European Working Conditions Survey
Support at workAnother, less formal way in which employees collaborate at work is through assistance – either from colleagues, superiors or fromindividuals outside the organisation. Table 6.5 illustrates the availability of these three sources of support in different sectors, indifferent occupations and in terms of the extent of use of technology. Nine out of 10 employees in most sectors and occupationscan get assistance from colleagues if they need it; a slightly smaller proportion – eight out of 10 – can also get assistance from theirsuperiors. External assistance is much less available, only around 50% of employees having access to it if needed; its availabilityvaries considerably among occupations (as indicated by the higher value of Cramer’s V, which indicates the variability of eachindicator).5
In general, for positions higher in the occupational structure, more support is available from colleagues, superiors and, in particular,external sources. The type of technology used at work is also related to the availability of support: those using informationtechnologies have more support. Sectoral differences do not seem to be very important in determining the availability of support.
5 Cramer's V is a coefficient that indicates the relationship among two categorical variables. The value for Cramer’s V gives a useful overview of the impact thatsector, occupation and technology make upon the availability of support. For instance, the value of 0.15 for support from colleagues in terms of sector is higherthan the value of 0.13 for support from colleagues in terms of technology; this greater variabliilty indicates that sector plays a bigger role in determiningavailability of support than does the technology employed.
Table 6.5: Sources of support at work (%)
Support from colleagues Support from superior External support
EU27 average 88.2 81.2 49.7
Sector
Agriculture 89.25 84.0 52.4
Manufacturing 90.2 80.3 42.0
Electricity, gas and water 92.3 87.0 54.3
Construction 93.1 85.1 55.09
Wholesale and retail trade 88.9 85.0 49.0
Hotels and restaurants 87.9 80.3 39.7
Transport and communication 79.5 77.2 49.9
Financial intermediation 92.7 88.5 57.0
Real estate 86.7 82.2 52.7
Public administration and defence 93.5 84.5 56.8
Education 87.2 78.1 54.3
Health 90.4 81.2 53.1
Other services 76.5 72.2 46.7
Cramer’s V (sector) 0.15 0.10 0.11
Occupation
Senior managers 92.3 84.7 68.7
Professionals 91.1 84.9 59.4
Technicians 91.1 85.7 55.6
Clerical workers 88.5 82.7 47.9
Service and sales workers 86.6 82.5 46.9
Agricultural and fishery workers 87.5 81.7 47.2
Unskilled workers 91.4 80.2 46.2
Machine operators 85.6 78.5 41.8
Unskilled workers 78.1 69.3 34.6
Cramer’s V (Occupation) 0.14 0.13 0.18
Technology at work
IT 90.9 85.7 56.8
IT and machinery 93.8 86.1 60.0
Machinery 89.2 78.1 41.2
Not technology-dominated 81.7 75.5 42.5
Cramer's V (technology) 0.13 0.12 0.16
Note: Figures apply to employees in the EU27 only.

Interruptions at work
Having frequent interruptions at work is another obviousdeterminant of the pace of work; this can also have importantconsequences in terms of stress and the perceived intensity ofthe work effort. Around one third of EU workers experienceinterruptions in their work often or very often, although inmost cases these interruptions are without consequences (seeFigure 6.8). Interruptions at work were compared (in a similarmanner to support available at work) by constructing acomposite index.6 Analysis of the different indices reveals thatinterruptions at work are much more prevalent in servicesectors than in manufacturing, construction or transport andcommunciations, and are more prevalent among workers inthe higher occupational ranks (see Table 6.6). Those usinginformation technologies and those with a higher degree ofautonomy at work report more frequent interruptions.
stressful, and to enjoy less autonomy at work. Workerswhose pace of work is determined by direct demands frompeople report higher levels of negative psychological healthoutcomes.
Intensity of work
The most direct impact of the pace of work on workingconditions is via the perception of intensity of work. In thefourth European Working Conditions Survey, there are threeindicators for work intensity: ‘working at a very high speed’,‘working to tight deadlines’ and ‘not having enough time toget the job done’. In order to simplify the analysis, a
57
Work organisation
Figure 6.7: Types of demands as determinants of paceof work, by country (%)
30
40
50
60
70
80
0 10 20 30 40 50 60 70
Direct control by a superior
Dir
ect
dem
ands
fro
m p
eopl
e
UK
TR
SKSI
SE
RO
PT
PL
NONL
MT
LV
LU
LT
IT
IE
HU
HR
FRFI
ESEL
EE
DK
DECZ
CYCH
BG
BE
AT
Sector IndexAgriculture 0.30Manufacturing 0.35Electricity, gas and water 0.40Construction 0.37Wholesale and retail trade 0.38Hotels and restaurants 0.42Transport and communication 0.32Financial intermediation 0.44Real estate 0.40Public administration and defence 0.43Education 0.36Health 0.50Other services 0.35
Technologies Information technology 0.46Information technology and machinery 0.46Machinery 0.32No technology 0.30
OccupationSenior managers 0.56Professionals 0.42Technicians 0.42Clerical workers 0.42Service and sales workers 0.38Agricultural and fishery workers 0.32Skilled workers 0.35Machine operators 0.25Unskilled workers 0.30
Autonomy 0 (low) 0.261 0.322 0.373 0.404 0.425 (high) 0.49
EU27 average 0.38
Figure 6.8 Interruptions at work (%)
Note: The questions asked were: ‘How often do you have to interrupt a
task in order to take on an unforeseen task?’ and ‘For your work, are these
interruptions…disruptive/without consequences/positive?’
Table 6.6 Interruptions index by sector, occupation, technology and autonomy
0
10
20
30
40
50
60
veryoften
fairlyoften
occasion-ally
never disruptivewithoutconse-
quences
positive notrelevant
6 The index assigns a value of 0 to ‘never’, 0.3 to ‘occasionally’, 0.6 to ‘fairly often’ and 1.0 to ‘often’.

58
Fourth European Working Conditions Survey
composite index has been constructed, using the twoindicators ‘working at a very high speed’ and ‘working totight deadlines’ (the inclusion of the third indicator is notpossible because of the different construction of the scaleand because of its change in the last wave of the survey). 7
Figure 6.9 indicates the value of the index for all 31 survey countries. There is considerable variation betweencountries: while the intensity index for the EU27 asmeasured in 2005 is 43%, it ranges from more than 50% inAustria, Cyprus, Denmark, Finland, Greece, Slovenia andSweden to less than 35% in Bulgaria, Latvia, Lithuania andPoland.
Figure 6.10 charts the change in work intensity over the last15 years, for those countries included in the survey sinceits inception. One of the clearest trends since the firstEuropean Working Conditions Survey was carried out 15
years ago is a rise in the levels of perceived work intensity.This rise, already evident in 2000, is confirmed by nationalworking conditions surveys in most Member States. In
Figure 6.9 Intensity index, by country (%)
0 10 20 30 40 50 60
S.I
FI
SE
EL
CY
DK
AT
DI
MT
HU
CZ
ES
EU27
IT
BE
UK
EE
LU
NL
FR
SK
P.T
IE
P.L
LT
LV
Figure 6.10: Evolution in work intensity, EU15, 1991–2005 (%)
Note: Austria, Finland and Sweden, being outside the EU in 1991, were not
included in that year’s survey. Data for 1991 cover EU12 only.
0 10 20 30 40 50 60
BE
DK
DE
EL
ES
FR
IE
IT
LU
NL
AT
PT
FI
SE
UK
EU15
1991 1995 2000 2005
7 This index assigns a value of 0 to ‘never’, 10 to ‘almost never’, 25 to ‘a quarter of the time’, etc. The composite index is the average of the two indicators ofwork intensity.

almost all countries in the former EU15, there has been aclear and consistent increase in the levels of perceived workintensity over the last 15 years.
In the NMS, however, there has been a slight decrease inthe perception of work intensity since 2001 (the first yearfor which we have data for these countries); the sameapplies in Bulgaria and Romania (see Figure 6.11).
In order to test what determines the perceived intensity ofwork, a multivariate regression was carried out: thisindicated that the hotels and restaurants sector has thehighest levels of work intensity, and education the lowest.In terms of occupation, there are no significant differencesin intensity levels; there are, however, notable differencesdepending on which technologies are in use at work: thoseworking with machinery perceive the highest levels ofintensity at work. Having greater autonomy at work isassociated with a lower perceived level of intensity, whilehaving to deal with frequent interruptions at work isassociated with a higher level.
Work organisation and intensity
In one of the most widely cited and used models of jobstrain, Karasek explained stress at work as the interactionof psychological demands from work, with the degree ofcontrol or decision latitude of the worker. The basichypothesis of his model was that the negative healthoutcomes of stress occur most often when the worker has toface high levels of psychological demands, but has lowlevels of autonomy at work: psychological demands createstress; if the worker cannot channel this stress because oftheir low levels of control, this ‘unreleased’ stressaccumulates and has a negative impact on health, jobsatisfaction, etc. The ideal situation would be, then, one inwhich demanding work is accompanied by a higher degreeof control (what Karasek termed ‘active work situations’).8
Although Karasek’s model was originally developed toexplain stress at work, it provides a useful conceptualframework for linking work organisation and workingconditions. By looking simultaneously at job demands andjob control, it is possible to divide the different forms ofwork organisation into four categories: active workorganisation, characterised by high demands and highcontrol; high-strain work organisation (high demands andlow control); low-strain work organisation (low demands
and high control); and passive work organisation (lowdemands and low control).
It is possible to replicate Karasek’s model with the data fromthe fourth survey, using the composite indicator of jobautonomy and the composite index of work intensity (bothdiscussed earlier); the composite indicator equates toKarasek’s concept of ‘control’, while the composite indexequates to ‘job demands’.9 Figure 6.12 shows into whichcategory of work organisation each country falls; it alsoindicates how they are positioned in relation to the EU27average (shown by the dotted lines). Figure 6.12summarises the overall conclusions of the analysis carriedout in this chapter.
59
Work organisation
8 Karasek, J.A., ‘Job demands, job decision latitude, and mental strain: implication for job redesign’, Administrative Science Quarterly, 24, 1979, pp. 285–308.9 This way of applying Karasek’s model closely follows the approach of Gimeno, D. et al, ‘Psychosocial factors and work related sickness absence among
permanent and non-permanent employees’, Journal of Epidemiological Community Health, 2004, 58, pp. 870–876.
Figure 6.11 Evolution in work intensity in the NMS,2000–2005 (%)
2000 2005
CZ
EE
CY
LV
LT
HU
MT
PL
SI
SK
NMS
BG
RO
AC2
0 10 20 30 40 50 60 70

Figure 6.12 shows that the Nordic countries included in thesurvey most closely approach the ‘active work organisation’category, which has been identifed as being most conduciveto performance (without negative consequences for workingconditions): greater demands on the worker arecounterbalanced by greater control over the content ofwork, diminishing the negative impact of work intensity.Cyprus, the Czech Republic, Germany and Greeceapproach most closely the category of ‘high-strain workorganisation’: workers in these countries face levels of jobdemands that cause stress, but have relatively low levels ofautonomy; such a form of work organisation has the mostnegative impact on working conditions. Belgium,Luxembourg and the Netherlands approach most closelythe low-strain category, with low levels of demands but highautonomy. (These three countries are characterised by veryhigh productivity levels, which indicates that ‘low-strain’does not mean low performance). Finally, Bulgaria, Poland,Portugal and Slovakia approach most closely the passivework organisation category; according to Karasek, thismodel has the most negative implications for performance. To end this chapter, Figure 6.13 illustrates how sectors and
occupations fit into the work organisation model. Onlyworkers in managerial positions fall into the ‘active workorganisation’ category; these are the only workers who, ingeneral, enjoy high levels of control and at the same timehave demanding jobs. Skilled and semi-skilled industrialoccupations and workers in hotels and restaurants and inmanufacturing are closer to the category of ‘high-strainwork organisation’, with high levels of stress and lowcontrol, and consequently, the most arduous workingconditions. Professionals and those working in financialintermediation and public administration are closest to the‘low-strain work organisation’ category. Finally, unskilledworkers and those in service occupations and the retailsector are closest to the ‘passive work organisation model’.The positioning of occupations and sectors along the axesof job demands and job control are clearly withinexpectations and confirm the consistency of the approach.
60
Fourth European Working Conditions Survey
Figure 6.12: Job demands and control, by country
Note: Figures apply to employees only.
1.5
2
2.5
3
3.5
4
4.5
0.25 0.3 0.35 0.4 0.45 0.5 0.55 0.6 0.6
Demands (intensity)
Cont
rol (
auto
nom
y)
Low-strain workorganisation
Active workorganisation
Passive workorganisation
High-strain workorganisation
EU27
avg
.(i
nte
nsi
ty)
EU27 avg.(control)
BE
CZ
DK
DE
EE
EL
ES
FRIEIT
CY
LV
LT
LU
HU
MTNL
AT
PL PT SI TR
SK
FI
SE
UK
BG
RO
NO
CH
Figure 6.13: Job demands and control, by sector andoccupation
Note: Figures apply to employees only.
1.5
2
2.5
3
3.5
4
4.5
0.25 0.3 0.35 0.4 0.45 0.5 0.55 0.6 0.65
Demands (intensity)Co
ntro
l (au
tono
my)
Low-strain workorganisation
Active workorganisation
Passive workorganisation
High-strain workorganisation
EU
27
avg
.(i
nte
nsi
ty)
EU27 avg.(control)
Senior managers
Agricultural & fishery workers
Clerical workersHealth
Real estae
Financial intermediationElectricity, gas & water
Unskilled workers
Service & sales workers
Technicians
Professionals
Other servicesPublic administration
& defence
Wholesale & retail trade
Agriculture
Machine operators
Skilled workers
Transport and communicationConstruction
Manufacturing
Hotels and restaurants
Education

‘Maintaining and promoting the health and well-being ofworkers’ is one of the four main pillars of the Foundation’sresearch model for quality of work and employment.1
Earlier research by the Foundation has found that, despitethe general trend towards a service- and knowledge-basedeconomy, the physical and psychological strain factors ofwork have not reduced substantially over the last 15 years.Some of the trends observed in employment relationshipsand working conditions in the last 15 years have in fact hada negative impact on the health of European workers – forexample, the flexibilisation of the employment relationship2
or the intensification of work associated with new forms ofwork organisation.3 It is crucial, therefore, to monitor therelationship between work and health, as reported byworkers, in order to identify the most problematic cases(according to sectors and occupations), so that specificpolicies can be developed to address them.
This chapter will first consider the overall perceived impactof work on health. It will then look at individual work-related health outcomes as measured in the fourthEuropean Working Conditions Survey and their relationshipwith characteristics of work and employment. The finalsection will explore the levels of health-related leave inEurope.
Work can impact on health in numerous ways and itseffects vary from person to person. A person’s state of healthcan in turn impact on how work is being carried out.Research shows that people at work tend to be in betterhealth than the general population (the ‘healthy workereffect’); this effect becomes even more pronounced in casesof difficult work situations. Moreover, the level of reportingof health problems differs greatly between countries, gender,occupations, sectors, etc.
Perceived impact of work on health
The first question about work-related health outcomes asksthe respondent, ‘Does your work affect your health?’ Thisquestion measures a worker’s individual perception of theimpact of health on work, and also serves as a filterquestion for detailing any symptoms the worker suffers fromon account of work. As a single indicator, this generalquestion can be taken as a good approximation of thehealth impact of work in different European countries, as
shown in Figure 7.1. While the EU27 average is 35%,differences between European countries in this respect arequite substantial. In Greece, Poland, Latvia and Slovenia,around two thirds of workers report that their work affectstheir health, a perception shared by only one fifth of UKworkers and one quarter of German, Dutch, Irish andFrench workers. It is important to note that the levels ofhealth impact of work as shown in Figure 7.1 clearly reflectother indicators of working conditions described elsewherein this report, although for this particular question, thedifferences between countries are more significant. EasternEuropean countries, on average, report the highest levels ofwork-related health impact.
61
7Impact of work on health
Figure 7.1: Perceived impact of work on health, bycountry (%)
Note: Respondents were asked ‘Does your work affect your health?’
10 20 30 40 50 60 70 80
EL
PL
LV
SI
EE
SE
RO
LT
SK
HR
MT
NO
BG
TR
HU
DK
CY
FI
PT
IT
LU
AT
CH
BE
FR
IE
NL
DE
UK
0
CZ
ES
EU27
1 See the Foundation report, Quality of Work and Employment in Europe, 2002, available online athttp://www.eurofound.europa.eu/pubdocs/2002/12/en/1/ef0212en.pdf
2 See Benach, Gimeno and Benavides, Types of employment and health in the European Union, 2002, available online athttp://www.eurofound.europa.eu/pubdocs/2002/21/en/1/ef0221en.pdf
3 See Daubas-Letourneux and Thébaud-Mony, Work organisation and health in the European Union, 2003, available online athttp://www.eurofound.europa.eu/pubdocs/2002/06/en/1/ef0206en.pdf

Figure 7.2 shows the results for the same indicator, brokendown by sector and employment status. As with Figure 7.1,the differences are quite substantial: the agricultural sectorstands out as having a much higher level of work-relatedhealth impact; higher-than-average levels are also reportedfor construction, manufacturing, transport, health andeducation. The differences according to employment statusare not so pronounced, but still quite relevant andconsistent with previous research: the self-employed reporthigher levels of work-related health problems (45%) thanself-employed with employees (36%) or employees (averagebetween permanent and non-permanent of 33%).
Figure 7.2: Impact of work on health, by sector andemployment status, EU27 (%)
Types of work-related health problems
The persons who replied in the affirmative to the questionabout perceived impact of work on health were then askedto identify from a list of 16 health symptoms those thatapply to them. Table 7.1 shows the percentages of workersreporting different symptoms across the EU27 as a whole.
The most often reported symptoms are musculoskeletaldisorders (backache and muscular pains), followed byfatigue, stress, headaches and irritability. Other symptomssuch as problems with eyesight, hearing, skin andrespiratory problems are all reported by fewer than 10% ofworkers.
It is important to note that because the question aboutindividual symptoms allows for multiple responses, mostpeople reported between two and six individual symptoms(as shown in Figure 7.3). For this reason, it was decided toanalyse all the symptoms together, taking into account the
overall prevalence and considering which symptoms tendto be reported together, and then to establish the correlationbetween different symptoms, using factor analysis.
Table 7.1: Percentage of workers reporting eachindividual symptom, EU27 (%)
Symptom
Backache 24.7
Muscular pain 22.8
Fatigue 22.6
Stress 22.3
Headaches 15.5
Irritability 10.5
Injuries 9.7
Sleeping problems 8.7
Anxiety 7.8
Eyesight problems 7.8
Hearing problems 7.2
Skin problems 6.6
Stomach ache 5.8
Breathing difficulties 4.8
Allergies 4.0
Heart disease 2.4
Other 1.6
Figure 7.3: Number of reported symptoms perrespondent, EU27 (%)
Sectoral and occupational differencesThe physical and psychological health factors developedfrom factor analysis are displayed in Figures 7.4, 7.5. and7.6. The horizontal axis represents physical health factors:the further an occupation, sector or country lies to the right,the higher the incidence of this type of health outcome. Thevertical axis represents psychological health factors: thefurther an occupation, sector or country lies towards thetop, the higher the incidence of this type of health outcome.The chemical or biological factor was not analysed, as itincorporates only a small percentage of the originalinformation and is highly specialised.
62
Fourth European Working Conditions Survey
Agriculture
Manufacturing
Electricity, gas and water
Construction
Wholesale and retail trade
Hotels and restaurants
Transport and communication
Financial intermediation
Real estatePublic administration
and defence
Education
Health
Other services
Self-employed (with employees)
Self-employed
Permanent employees
Non-permanent employees
0 10 20 30 40 50 60 70
0
2
4
6
8
10
12
14
16
1 2 3 4 5 6 7 8 9 10 11 12 13 14 15 16 17

In terms of sectors (Figure 7.4), agriculture has a high ratingfor the physical health factor, but a low rating for thepsychological health factor. Construction also has a fairlyhigh rating for the physical health factor (although lowerthan agriculture); however, its rating for the psychologicalhealth factor is below the average. The converse applies tothe education, health and public administration sectors:here, the levels of reported physical problems are below theaverage, but the levels of psychological strain are higherthan for all other sectors. The sectors that are least affectedby both factors are the wholesale and retail trade andfinancial intermediation.
In terms of occupations, Figure 7.5 shows that agriculture isagain very strongly affected by the physical health
Measuring the correlation between health symptoms
Factor analysis is a statistical technique that studies thecorrelation between groups of interrelated variables, lookingfor patterns of correlation. When these patterns exist, thetechnique creates new variables – called factors – that sum upthe information contained in the original set of variables in asimpler way, even if some of the original information may belost in the process. Because the individual variables in thequestion on health impact of work are strongly correlated,they are suitable for this technique.
Table 7.2 shows the outcome of this factor analysis: 55% ofthe information contained in the 16 original variables issummed up in three factors: physical and psychological health
factor (the most important factor, incorporating 38% of the
original information), psychological health factor
(incorporating 9% of the original information) and respiratory
and skin health factor (incorporating 7%). To understand the
content of these factors, it is necessary to look at the rotated
factor matrix: some variables show a strong correlation with
each factor and permit the interpretation of the factors. The
first factor is strongly correlated with musculoskeletal
disorders (backache and muscular pains), fatigue, injury, stress
and headaches. The second factor is strongly correlated with
anxiety, sleep problems, irritability and stomach ache. Finally,
the third factor captures respiratory problems, allergies, skin
and heart problems.
63
Impact of work on health
Table 7.2: Factor analysis of individual symptoms (EU27)
Type of health outcome (using the rotated factor matrix)*
Physical (associated with Psychological (associated with Chemical/biological physically demanding psychologically demanding (associated with chemical/work environments) work environments) biological risks)
Hearing problems 0.51 0.04
Eyesight problems 0.38 0.26 0.27
Skin problems 0.40 0.05 0.59
Backache 0.82 0.25 0.12
Headaches 0.55 0.49 0.13
Stomach pain 0.14 0.60 0.22
Muscular pain 0.81 0.26 0.12
Breathing difficulties 0.21 0.07 0.69
Heart trouble -0.04 0.34 0.52
Injury 0.61 0.05 0.33
Stress 0.59 0.58 0.03
Fatigue 0.70 0.44 0.12
Sleeping problems 0.16 0.73 0.15
Allergies 0.15 0.14 0.68
Anxiety 0.15 0.74 0.08
Irritability 0.29 0.70 0.09
* rotation method = varimax with Kaiser normalisation (seven iterations)
Figure 7.4: Physical and psychological health factors, bysector, EU27 (%)
-0.3
-0.2
-0.1
0
0.1
0.2
0.3
0.4
0.5
0.6
0.7
-0.4 -0.3 -0.2 -0.1 0 0.1 0.2 0.3 0.4 0.5 0.6 0.7
+ Psychological
- Psychological
- Physical + Physical
Agriculture
Manufacturing
Electricity, gas and water
Construction
Wholesale and retail trade
Transport and communication
Financialintermediation
Real estate
Public administration and defence
Education
Health
Other services
Hotels and restaurants

outcomes of work. Skilled workers have relatively highlevels of physical health outcomes, but low levels ofpsychological health factors. Professionals and seniormanagers report relatively high levels of psychologicallyrelated health problems but low levels of physical problems.
Employment status does not appear to be strongly relatedto these two factors. Only the self-employed report relativelyhigher levels (although not significantly so) of work-relatedhealth outcomes for both factors.
Figure 7.5: Physical and psychological health factors, byoccupation and employment status, EU27 (%)
Figure 7.6: Physical and psychological health factors, bycountry, EU27 (%)
Country differencesFigure 7.6 indicates which kinds of work-related healthproblems are most often reported in different countries.Substantial differences are apparent in this respect. Greecehas very high levels of reported physical and psychologicalwork-related health problems, followed by Estonia andLithuania. Respondents in Poland, Slovenia and Slovakiareport high levels of physical risks but relatively low levelsof psychological risk. The opposite is the case for Sweden:respondents here report relatively high levels of
psychological health problems, but low levels of physicalhealth problems. There are a number of countries in whichrespondents report lower-than-average risk levels for bothfactors: the UK (particularly low levels of physical healthfactors), Germany, Netherlands, Ireland and Austria.
Health-related leave
The fourth European Working Conditions Survey includesquestions on health-related leave. Respondents were askedif they had taken health-related leave in the previous 12-month period and, if so, how many days they took, and howmany of those days were on account of work-related healthproblems. Health-related leave is a complex phenomenon,dependent on many factors such as working conditions, theindividual health of the workers, and the differentregulatory systems operating in each country (andsometimes even in each sector – the difference between thepublic and private sector is quite important in this respect).
64
Fourth European Working Conditions Survey
0
0.1
0.2
0.3
0.4
0.5
0.6
0.7
-0.4 -0.3 -0.2 -0.1 0 0.1 0.2 0.3 0.4 0.5 0.6 0.7
-0.3
-0.2
-0.1
+ Psychological
- Psychological
- Physical + Physical
Skilled workers
Machine operators
Self-employedPermanentemployee
Senior managers
Professionals
Technicians Clericalworkers
Service andsales workers
Agricultural andfishery workers
Unskilled workers
Armed forces
Non-permanent employee
Self-employed (with employees)
0
0.1
0.2
0.3
0.4
0.5
0.6
0.7
-0.4 -0.3 -0.2 -0.1 0 0.1 0.2 0.3 0.4 0.5 0.6 0.7
-0.3
-0.2
-0.1
+ Psychological
- Psychological
- Physical + PhysicalBE
CZ
DK
DE
EE
EL
ES
FR
IE
IT
CY
LV
LT
LU
HU
MT
NL
AT
PL
PTSI
SK
FI
SE
UK
ROBG
Figure 7.7: Proportion of workers taking health-relatedleave and average days taken, by country
Average number of days taken
0% 5% 10% 15% 20% 25% 30% 35% 40% 45% 50%
0 10 20 30 40 50 60 70
FI
MT
NL
DK
LU
BE
SI
CZ
SE
DE
EE
NO
IT
HU
LV
SK
EU27
UK
IE
LT
AT
BG
PL
HR
CH
FR
TR
CY
ES
EL
PT
RO

However, these national and sectoral differences remainoutside the scope of this report.
Figure 7.7 gives a picture of health-related leave levelsacross the EU27: the horizontal bars represent theproportion of workers in each country who took health-related leave in the previous 12-month period; thediamonds (its scale is at the bottom of the graph) representthe average number of days’ leave these workers took.There seems to be no correlation between the levels ofreported impact of work on health (as described in theprevious section) and the levels of health-related leave. Thecountries with higher levels of reported work-related healthproblems are not the countries where there is more health-related leave. For instance, Greece, which has by far thehighest level of reported impact of work on health, has oneof the lowest proportions of workers taking health-relatedleave. This clearly demonstrates the complex andmultidimensional aspects of health-related absenteeism.
A different way of presenting the same information is shownin Figure 7.8. In this case, the average for each countryrefers to the number of health-related leave days taken perworker. This includes all active workers, not only those whodid actually take leave. It serves as an indicator for theimpact of health-related leave on each of the nationallabour markets: it means that, on average, each worker inCroatia took slightly more than nine days’ health-relatedleave in 2005, compared to only two days for Romanianworkers.
Figure 7.9 presents data regarding health-related leave,broken down by sex and employment status. An average of23% of workers across the EU27 reported taking time offwork on account of health-related problems during theprevious 12-month period, with slightly more women (24%)than men (22%) affected. Table 7.3 presents data showingthe average number of health-related days of leave takenby workers across the EU27, broken down by sex,employment status and size of company.
Finally, Table 7.4 gives the sectoral breakdown for health-related leave, with agriculture (14%) and publicadministration and defence representing the two extremepoles (30%) and most other sectors adhering closely to theEU27 average number of days.
65
Impact of work on health
100 1 2 3 4 5 6 7 8 9
EU27
BG
LT
LV
CH
CY
IE
MT
IT
UK
ES
DE
AT
EL
RO
HR
SI
PT
NL
FI
NO
BE
SE
DK
PL
FR
CZ
LU
SK
HU
TR
EE
Figure 7.8: Average number of health-related leavedays per worker (all workers), by country
Figure 7.9: Health-related leave, by sex andemployment status, EU27 (%)
Note: Figures apply to workers who took health-related leave over previous
12 months.
0 5 10 15 20 25 30
Men
Women
Sex
Empl
oym
ent s
tatu
s
Employers
Self-employed
Permanentemployee
Non-permanent employee
EU27 average

66
Fourth European Working Conditions Survey
Table 7.3: Number of days of health-related leave
Average no. of Average no. of days Average no. of Average no. of days taken by taken by workers accident-related other work-related workers (all) who took at least days taken by days taken by
one day of leave workers (all) workers (all)
EU27 average 4.6 20.2 0.4 1.8
Men 4.2 19.2 0.5 1.8
Women 5.0 21.3 0.4 1.7
Self-employed 2.8 21.2 0.3 1.4
Permanent employee 5.5 21.1 0.4 2.2
One-person enterprise 2.5 22.9 0.2 1.3
Micro enterprise (2–9 workers) 3.2 19.0 0.5 1.0
Small enterprise (10–49 workers) 4.6 19.0 0.4 1.9
Medium sized enterprise (50–249 workers) 5.6 19.0 0.5 2.0
Large enterprise (250 + workers) 7.4 24.3 0.7 3.0
Table 7.4: Health-related leave, by sector, EU27 (%)
Sector
Agriculture 14.2
Manufacturing 25.9
Electricity, gas and water 26.4
Construction 21.3
Wholesale and retail trade 19.4
Hotels and restaurants 18.8
Transport and communication 25.0
Financial intermediation 22.5
Real estate 18.2
Public administration and defence 30.7
Education 29.9
Health 25.4
Other services 18.5
EU27 average 22.9
Note: Percentage of workers who took health-related leave over previous 12
months.

One of the defining features of the European economic andsocial model is the level of employee participation andinvolvement in decision-making in the workplace, carriedout through both formal and informal channels. This wasacknowledged by the EU Information and ConsultationDirective (2002/14/EC), which extended this model to thefew European countries where there was no such tradition.This report, based as it is on a survey of individual workers,is not the vehicle for exploring formal systems of employeerepresentation at the workplace. The survey findings,however, give an overview of the extent of informalcommunication in European workplaces, and how this isorganised. As employee participation and communicationtakes place mainly between hierarchical levels in theworkplace, this chapter first looks at hierarchical structuresin European countries and then examines howcommunication and participation take place.1
Managerial and supervisory positions
The survey reveals a number of key findings concerninghierarchical levels in European companies. Theconcentration of managerial and supervisory roles variesbetween country groups: there are, for example,
substantially greater concentrations of top-level managersin the UK and Ireland than in other country groups. Bothlonger working hours and higher remuneration arecharacteristic of those occupying higher managementpositions. Women occupy far fewer supervisory and man-agerial roles than do men, and, when in these roles, theymainly manage other women, or less qualified workers.
The structure of workplace hierarchies differs betweendifferent European country groupings. Figure 8.1 gives anoverview of the proportion of workers with supervisory ormanagerial roles across European countries.2
According to the survey, around 20% of respondents havesome type of managerial or supervisory role: between a halfand three quarters of them are supervisors, while betweena quarter and a half are managers.
The proportion of supervisors and managers in a companyis, to a large extent, determined by company characteristicssuch as its size, and the economic sector in which itoperates. However, the variation between country groupsalso suggests that there are different management modelsand hierarchical cultures in the various countries.
For example, the proportion of top-level managers inIreland and the UK (at 9%) is higher than in the othercountry groups; in eastern European countries and theacceding countries, the proportion is below average (justover 1% in both groups). In southern European countries(and to a lesser extent also in Ireland and the UK) there isa somewhat above-average proportion of managers of smallcompanies (7% and 6% respectively). In Bulgaria andRomania, the figure is 2%.
Working hours and salary
Two key dimensions of working conditions are workinghours and salary. As Figures 8.2 and 8.3 indicate, as thelevel of responsibility rises, both working hours and salariesincrease substantially. While – according to the survey –workers with no managerial or supervisory responsibilitiescomprise more than 80% of the workforce, only 9% of themwork more than 48 hours per week. By contrast, between20% and 25% of those with supervisory responsibilitieswork more than 48 hours per week, while 30% of top-levelmanagers do so. Interestingly, managers of small companies
Figure 8.1: Proportion of supervisors and managers inworkforce, by country group (%)
Note: ‘Top-level managers’ refers to ISCO codes 11 and 12: senior managers
in public and private enterprises; ‘managers of small companies’ refers to
ISCO code 13.
supervisors of 10 or fewer people supervisors of more than 10 people
managers of small companies top-level managers
0 5 10 15 20 25 30
DK, NL, FI, SE
IE, UK
BE, DE, FR, LU, AT
EL, ES, IT, CY, MT, PT
CZ, EE, LV, LT, HU, PL, SI, SK
AC2: BG, RO
CC2: TR, HR
Non-EU: CH+NO
EU27
1 The information in this chapter relates to workers in establishments of two or more people. 2 The variable – managerial or supervisory position – was constructed using two different sources: the question concerning the occupation of the respondent
and the question concerning supervisory duties (‘How many people work under your supervision, for whom pay increases, bonuses or promotion dependdirectly on you?’).
Management and communication structures
8
67

work longer hours than do all other groups – 41% workmore than 48 hours per week.
Supervisory or managerial position has an even greaterimpact on salary than on working hours: more than 40% oftop-level managers are in the top 10% of the income scaleof all respondents, compared to less than 10% forsubordinates; similarly high figures are seen for supervisorsof more than 10 people. Managers of small companies onaverage, however, earn slightly less: fewer than 40% are inthe top income bracket.
Women in supervisory positions Since 1995, the European Working Conditions Survey hasasked respondents whether their immediate superior is aman or a woman. From the answer given, a slight, gradual increase in the percentage of women superiors hasbeen visible: from 20% in 1995, to 23% in 2000, to 25% in
2005. As Figure 8.4 indicates, differences between countriesin this respect are substantial. The highest proportions ofwomen in supervisory and managerial positions are in theScandinavian countries and Netherlands and in the easternEuropean countries (reaching nearly 40% in Finland andEstonia); by contrast, southern European countries, andsome continental countries, have the lowest proportions –less than 20% in Germany and Italy.
Figure 8.4: Proportion of women superiors, by country (%)
0 5 10 15 20 25 30 35 40 45
FI
EE
LT
UK
SI
SE
NO
LV
HU
IE
DK
PL
SK
PT
BG
BE
FR
HR
RO
EU27
CZ
AT
NL
MT
ES
CH
EL
LU
DE
IT
TR
CY
Figure 8.5: Sex of immediate superior, by sex ofrespondent (%)
0 10 20 30 40 50 60 70 80 90 100
female bossmale boss
Men
Women
Figure 8.2: Working hours, by position (%)
Note: Subordinates are respondents who report having no managerial or
supervisory responsibilities.
Subordinates
Supervisors of 10 orfewer people
Supervisors of morethan 10 people
Managers of smallcompanies
Top-level managers
0 10 20 30 40 50 60 70 80 90 100
20 hours or fewer 21–34 hours 35–38 hours 39–41 hours
42–48 hours 48 hours +
Figure 8.3: Place in salary scale, by position (%)
Note: Scale ranges from lowest to highest income decile.
Subordinates
Supervisors of 10 or fewer people
Supervisors of more than 10 people
Managers of small companies
Top-level managers
0 10 20 30 40 50 60 70 80 90 100
Fourth European Working Conditions Survey
68

Figure 8.5 shows that most female supervisors andmanagers in the EU27 have female subordinates: fewerthan 10% of men have a woman as their immediatesuperior, as against 42% of women.
Figure 8.6 shows that the proportion of female superiorsfalls as the position of those they are supervising rises: thatis, female superiors are more prevalent among the lowerranks of workers. A related finding is that women are morelikely to supervise part-time than full-time workers: 41% ofpart-time workers have female bosses, compared to 21% offull-time workers. Both men and women in part-timeemployment are more likely to be managed by a woman.
Communication and consultation
Communication with superiorsIn order to measure the extent to which workers interactwith their immediate superiors, the survey askedrespondents whether they had had a discussion with theirboss about their work performance over the previous year,and also if they had discussed work-related problems.
There are substantial differences between the differentcountry groups in the levels of direct communicationbetween workers and superiors. These differences cannotbe explained solely by the relative proportions ofsupervisors (see Figure 8.1), or by differences in the relativeimportance of economic sectors or types of companies:instead, they would seem to reflect the existence of differentorganisational cultures. The highest levels of directcommunication in European workplaces are in theScandinavian countries and the Netherlands, where morethan 70% of workers had discussed their work performance,and work-related problems with their superior. In Irelandand the UK, and in the eastern European countries, thefigure was between 50% and 60%, while the lowest levelswere observed in southern European and continentalcountries (around 40%). These findings are consistent withpublished research on organisational systems in differentEU countries.
Communication with employee representatives
Another important dimension of communication within theworkplace (particularly in the European model) is thecommunication that takes place between workers andemployee representatives.
To measure the extent of such communication, the surveyasked respondents whether they had discussed work-related problems with an employee representative in theprevious 12-month period. In the EU27, around one in fiveemployees had discussed work-related problems withemployee representatives in the previous 12 months. Again,differences between country groupings are substantial:around 30% of respondents in the acceding countries, theeastern European countries and Ireland and the UK reportsuch communication, as compared to between 16% and19% in continental countries and southern Europeancountries.
Different sectors and different sizes of organisations havedifferent levels of employee representation, and thesedifferences are reflected in the survey findings. As Figure8.7 shows, the bigger the company, the greater the reportedlevels of communication with employee representatives. Anumber of sectors also report higher levels ofcommunication: public administration and defence;electricity, gas and water; transport and communication;
Figure 8.6: Sex of immediate superior, by position ofrespondent (%)
Subordinates
Supervisors of 10or fewer people
Supervisors of morethan 10 people
0 10 20 30 40 50 60 70 80 90 100
female bossmale boss
Figure 8.7: Communication with employeerepresentative, by sector and size of enterprise (%)
Note: The question asked if respondents had discussed work-related
problems with an employee representative in the previous 12-month period.
Agriculture
Manufacturing
Electricity, gas and water
Construction
Wholesale and retail trade
Hotels and restaurants
Transport and communication
Financial intermediation
Real estate
Public administration and defence
Education
Health
Other services
Micro enterprise (2–9 employees)
Small enterprise (10–49 employees)
Medium enterprise (50–249 employees)
Large enterprise (250+ employees)
0 5 10 15 20 25 30 35
Management and communication structures
69

Figure 8.8: Consultation in the workplace, by countrygroups (%)
Note: The question asked if respondents had been consulted about changes
in work organisation and/or working conditions in the previous 12-month
period.
0 10 20 30 40 50 60 70 80
DK, NL, FI, SE
IE, UK
BE, DE, FR, LU, AT
EL, ES, IT, CY, MT, PT
CZ, EE, LV, LT, HU, PL, SI, SK
AC2: BG, RO
CC2: TR, HR
Non-EU: CH+NO
EU27
Figure 8.9: Consultation in the workplace, byoccupation (%)
Note: The question asked if respondents had been consulted about changes
in work organisation and/or working conditions in the previous 12-month
period.
Senior managers
Professionals
Technicians
Clerical workers
Service and sales workers
Agricultural and fishery workers
Skilled workers
Machine operators
Unskilled workers
0 10 20 30 40 50 60 70
Fourth European Working Conditions Survey
70
and manufacturing. Lower levels of communication arereported in small companies, construction and otherservices.
Consultation on work organisation
In addition to discussions on performance and work-relatedproblems, another element of workplace communication isthe extent of consultation regarding changes in workorganisation and working conditions. As Figure 8.8indicates, the highest levels of such consultation are foundin the Scandinavian countries and the Netherlands, wheremore than 70% of respondents report having been
consulted about changes in work organisation or workingconditions in the previous 12-month period, almost twicethe level found in southern European countries (just under40%).
The findings also show that the level of consultationreported by workers is related to their occupation: the lowera respondent’s position in the occupational structure, theless they are consulted about changes in work organisationor working conditions. Almost 70% of senior managers areconsulted, compared to less than 40% in all blue-collaroccupations, both skilled and unskilled.

Extensive data was collected in the fourth EuropeanWorking Conditions Survey about the organisation of time,including working time and time spent on non-workactivities (domestic tasks, caring for children and olderrelatives as well as leisure, voluntary and politicalactivities), and about people’s perceptions as to how welltheir working arrangements fit in with family and socialcommitments.
These questions sketch a broad picture of people’s work–lifebalance in Europe. They provide information which enablethe links between work and non-working life to be explored– for example, the working time arrangements of parentsand their domestic responsibilities and the degree ofsatisfaction with the work–life balance of each partner. Theyalso make it possible to identify particular categories ofworkers who express comparatively high levels ofdissatisfaction with their work–life balance. What thesequestions cannot do, of course, is identify the institutionalsettings, such as levels of social provision (e.g. childcare)and the social organisation of time, which vary greatly fromcountry to country and which could influence workers’perceptions of work–life balance. Equally, issues relating tochanging gender roles and expectations in work and familylife can only be approached indirectly. Nevertheless, whatworkers report regarding their work–life balance impacts onthe quality of their work and also reflects the broader socialperspective.
This chapter will look at how negative or positive reportingof work–life balance varies according to sex, parental statusand number of working hours. It also explores how otheraspects of working time – regularity, predictability, flexibility,individual discretion over working hours, and differentworking time schedules – affect work–life balance.
Satisfaction with work–life balance
In the survey, respondents were asked if their job ‘fits inwith their family or social commitments outside work’according to a four-point scale (‘very well’, ‘well’, ‘not sowell’, ‘not at all well’). Four out of five European workerssay they are satisfied with how their working timearrangements fit in with their non-work commitments.Satisfaction levels in the older Member States haveremained similar since the previous survey in 2000, while inthe new Member States and Bulgaria and Romania theyhave declined by around 5%. (see Figure 9.1)
The overall figure for positive perception of work–lifebalance is high (over 80% in the EU as a whole) but, as withthe survey question regarding general job satisfaction (seeChapter 10), questions on satisfaction with work–lifebalance tend to routinely elicit high levels of positive
response. For this reason, the survey included additionalquestions to further explore elements of work–life balance.
One of the principal factors influencing work–life balanceis the volume of hours worked. The more hours a personworks, the greater the difficulty in reconciling work and non-working activities. While very high levels of basicsatisfaction with work–life balance (85% and higher) isreported by those working fewer than 30 hours per week,
Figure 9.2: Perception of work–life balance, by lengthof working week, EU27 (%)
0 10 20 30 40 50 60 70 80 90 100
very well well not very well not at all well
fewer than10 hours
10–30
31–35
36–40
41–45
over 45hours
Figure 9.1: Perception of work–life balance, trends overtime (%)
Note: Question asked ‘In general, do your working hours fit in with your
family or social commitments outside work?’
2005
2001
2000
very well well not very well not at all well
EU15
NMS
BG+RO
EU25
NMS
BG+RO
EU15
0 10 20 30 40 50 60 70 80 90 100
Work–life balance 9
71

over 40% of those working more than 45 hours per weekreport that their working hours do not fit in well with theirfamily and social commitments (see Figure 9.2).
Broken down by country, the data show considerablevariation, from 11% dissatisfaction with work–life balancein Norway and Austria to over 40% in Greece (see Figure9.3). Including a country marker for average weekly workinghours (in the respondent’s main job) confirms that there isa positive correlation between hours worked anddissatisfaction with work–life balance at a country level.
Gender differencesGiven the assumption that working women remaindisproportionately involved in unpaid domestic and caringactivities – an assumption supported by evidence from thesurvey, as shown later in this chapter – a key focus in thework–life balance debate has been the specific pressures onworking women. It is interesting, therefore, to note that menreport more dissatisfaction with their work–life balance thanwomen. The main factors contributing to this unexpectedoutcome are, however, the volume of weekly working hoursand the different ways in which working hours areorganised between men and women. In general, part-timeworkers are twice as likely as full-time workers to have apositive perception of their work–life balance. The highincidence of part-time work among women, and the lowincidence of part-time work among men, are therefore keyfactors in explaining the levels of satisfaction with work–lifebalance among working men and women.
However, even among both sexes working full-time, asomewhat higher proportion of men (24% compared to 20%of women) have a negative perception of their work–lifebalance.
Working parentsIf attention is focused on the working parents of childrenaged under 16, the differences between the sexes is evenmore pronounced. Working fathers tend to have a morenegative assessment of their work–life balance than working
Figure 9.3: Perception of work–life balance, by country
Note: Question asked ‘In general, do your working hours fit in with your
family or social commitments outside work?’
not very well not at all well weekly hours
hours
0% 10% 20% 30% 40% 50%
NO
AT
DK
CH
FI
DE
UK
NL
LU
BE
PT
FR
IE
CZ
EU27
SE
MT
SK
CY
LT
EE
ES
HR
SI
RO
BG
HU
IT
PL
LV
TR
EL
30 36 42 48 54 60
Table 9.1: Working hours and family life, by sex, EU27 (%)
Men Women
Do your working hours fit with no dependent with dependent with no with dependent in with your family or social children under 16 children dependent children children commitments outside work? under 16 under 16 under 16
very well 31.3 24.4 36.6 32.9
well 48.4 48.7 47.7 48.8
not very well 15.4 20.0 13.1 14.7
not at all well 5.0 6.9 2.6 3.6
Fourth European Working Conditions Survey
72

Figure 9.4: Incidence of part-time work, by sex andhousehold situation, EU27 (%)
Men Women0
5
10
15
20
25
30
35
40
45
no children under 16 children under 16
Figure 9.5: Weekly working hours, by householdsituation, EU27 (%)
20
25
30
35
40
45
men women
No children One child Two children Three children Four or more
hour
s
Work–life balance
73
mothers (27% of fathers compared to 18% of mothers), asTable 9.1 indicates.
The same determining factor in this case is the volume ofweekly working hours: the different take-up of part-timework between men and women creates an even largergender time gap for working parents.
While the incidence of part-time work among men ingeneral is low, men without children are twice as likely towork part time (9%) as are men with children (4%), asFigure 9.4 shows. By contrast, parenthood for womenimplies an increased incidence of part-time work. Bothtrends contribute to the growing incidence of ‘one-and-a-half’ worker households, with a full-time working father anda part-time working mother.
It is also the case that working fathers tend to work longerweekly hours as their parental responsibilities grow.Working fathers living with two children aged under 16years work more than two hours extra each week, comparedto men without children (see Figure 9.5). Only amongfathers with extended family responsibilities (three or morechildren) is there a slight reduction in weekly workinghours.
The opposite is the case for working mothers: they workfewer hours than women without children, although this islargely due to the prevalence of part-time work amongworking mothers. Among women who work full time, theaverage weekly working hours increase according to thenumber of children they have.
The divergent pattern of weekly working hours for men andwomen with children is reflected in the growing gap insatisfaction with work–life balance. Working parents, bothmale and female, tend to have lower levels of satisfactionwith work–life balance; however, the higher uptake of part-time work offsets to an extent the dissatisfaction levels of
working mothers. For working fathers, a longer workingweek, possibly combined with changing social expectationsregarding the domestic role of fathers (and, possibly,frustration at their inability to fulfil such expectations) maycontribute to their relative dissatisfaction with their work–life balance.
Paid and unpaid working hours
Domestic work
Despite the increasing participation of women in the labourforce, the traditional division of domestic responsibilitiesbetween men and women persists. Results from the surveyreveal that a much higher proportion of working womenthan working men devotes time outside work to domesticresponsibilities, such as caring for children, housework orcooking. Indeed, as indicated in Chapter 2 (on workingtime), if the estimated weekly hours spent on these forms ofunpaid work are combined with hours spent in paid work,a significant reversal of the conventional picture emerges.On average, men work longer hours than women in theirpaid jobs; however, when paid and unpaid hours are addedtogether, it is women who work the longest number ofhours. Women’s work and life are ‘balanced’ in the sensethat they devote comparable amounts of their time to bothpaid and unpaid work, in particular between the ages of 25and 54 years. A man’s ‘work’ tends largely to be confined tohis paid job.
Table 9.2: Unpaid weekly working hours, by sex andage (%)
Age of respondent Men Women
24 years or younger 3.2 10.4
25–39 years 9.2 31.8
40–54 years 8.6 26.9
55 years or older 5.2 17.9

Work and non-working time
A new question (introduced in the survey in 2005) assessesthe extent to which work impinges on non-working life: itasks workers whether they are contactable in relation totheir main paid job outside normal working hours. Thegrowth of faster communication technologies (phone lines,mobile phones and broadband internet/email) over the pastfive years has made such contact possible for the majorityof Europeans. For certain categories of workers – e.g. thosewith supervisory responsibilities, or the self-employed – thiscan blur the boundaries between work and non-work. Thesame communication technologies that make contactpossible may also make further work possible, effectivelyextending working hours by stealth. In essence, this can beseen as a form of negative ‘flexibility’. As the survey alsorevealed, rather than offering some protection against out-
of-hours contact, working long hours is associated withhigher levels of contactability outside work (see Figure 9.6).
It is notable that managers (those with staff working undertheir supervision) report this type of contact more than doother workers, and that men, in general, appear to be moreaffected (see Figure 9.7).
Type of working schedule
Another factor that influences perceptions of work–lifebalance is the way in which working time is organised, bothin terms of its regularity and also with reference to the‘standard’ working schedule (around 40 hours per week,working only weekdays). Working non-standard hours (inthe evening, at weekends or at night after 22.00 hours) isassociated with poorer levels of work–life satisfaction.Working long working days (of more than 10 hours) on aregular basis also has a negative impact.
Many societal time arrangements (opening hours of shops,public institutions and schools, etc.) are organised to bebroadly consistent with standard daytime working hours. Itis not surprising, therefore, that the optimal schedule froma work–life balance perspective is the standard one ofdaytime work during weekdays, without long days. Workerswho are regularly required to work outside these limitsreport more dissatisfaction with their work–life balance;those having to carry out night work regularly areparticularly affected (see Figure 9.8).
Consistent and regular schedules lead to greater satisfactionwith work–life balance, while any deviations from aconsistent working pattern tend to raise the levels ofdissatisfaction. Thus, working the same number of days perweek or hours per day is preferable to working a variablenumber of days or hours; fixed starting and finishing timesare considered preferable to variable ones.
Variability or ‘imposed’ flexibility that undermines theregularity or predictability of working schedules isconsidered very unfavourable by workers from a work–lifebalance perspective. Against a background of pressure todiversify working schedules – for example, from companieswishing to extend or vary operating levels and times – it isinteresting to observe that the ‘old-fashioned’ working week(of around forty hours, with regular weekday, daytimeschedules and little or no work at non-standard hours) isstill regarded very positively in work–life balance terms.Regularity may be a more important consideration forworkers than flexibility when it comes to ensuring that theirworking hours fit in well with their non-work commitments.
Workers who report that their working schedule changesfrequently report less satisfaction with their work–life
Figure 9.6: Extent of out-of-hours contact, by length ofaverage working week, EU27 (%)
0
10
20
30
40
50
60
70
80
90
100
fewer than10 hours per week
10–30 31–35 36–40 41–45 more than 45hours per week
every day at least once a week a couple of times a month
less often never
Figure 9.7: Extent of out-of-hours contact, by level ofresponsibility and sex (%)
0 2010 30 50 70 9040 60 80 100
Men
Women
Men
Women
Supe
rvis
ory
resp
onsi
bilit
ies
No
supe
rvis
ory
resp
onsi
bilit
ies
every day at least once a week a couple times of a month or less often
less often never
Fourth European Working Conditions Survey
74

balance (see Figure 9.9). Moreover, the shorter the period ofnotice given in changes to schedules, the greater the degreeof dissatisfaction. Clearly, the ad hoc nature of such a workschedule imposes an extra burden in terms of managingnon-working time.
Working-time organisation based on collective starting andfinishing times is usually associated with older, traditionalforms of production. In the context of the discussions on
the merits of flexible working-time arrangements, it isinteresting to note that workers with such fixed, regularschedules express comparatively higher levels ofsatisfaction with their work–life balance.
Flexibility that extends choices to workers (for example,flexitime schemes) is marginally more favourable from awork–life balance perspective. However, paradoxically, it isthose with most say in how their working time is organised– those who replied that ‘working time is determinedentirely by myself’ – who express most dissatisfaction withhow their working hours fit in with their family and sociallife. As a group, these respondents are the most‘empowered’ in terms of working-time discretion; however,this is evidently more than counterbalanced by other factors– notably an increased number of working hours. The self-employed – as a rule those with the greatest say in how theirworking time is arranged – tend to work much longer hoursthan employees. This tends to support the case that it is thevolume of hours worked – rather than control over workingtime – that most influences satisfaction with work–lifebalance.
Figure 9.8: Dissatisfaction with work–life balance, byworking schedule (%)
Notes: Regular weekend work is defined as working four or more
Saturdays/Sundays per month. Regular night work, regular evening work and
regular long days (of more than 10 hours) are defined as five instances or
more per month in each case. Male part-time workers were excluded due to
the small number of cases in individual categories.
0 5 10 15 20 25 30 35 40 45 50
Same number of hrs each day
Not same number of hrs each day
Same number of days each week
Not same numberof days each week
Start / finish times fixed
Start / finish times not fixed
Shiftwork
Daytime, weekday, no long days
Daytime, some weekendwork, no long days
Daytime, weekday,some long days
Daytime, some weekendincluding long days
Regular night work
Regular evening work
Regular weekend work
Regular long days
Type
of
sche
dule
sD
ayti
me
wor
k sc
hedu
leva
rian
tsRe
gula
r at
ypic
al h
ours
women part time men full time women full time
Figure 9.9: Perception of work–life balance, by noticegiven of changes to work schedule (%)
Note: Question asked ‘Do your working hours fit in with your family or social
commitments outside work?’
0
20
10
40
30
60
50
80
70
100
90
Not informed Informed same day
Informedday before
Informedseveral daysin advance
Informedseveral weeks
in advance
very well well not very well not at all well
Work–life balance
75

Work occupies a significant part of the waking hours of themajority of European adults and in most cases provides thebasic means of economic sustenance. Work alsocontributes to a sense of social identity and usefulnesswithin the context of the immediate work environment –through relationships with one’s colleagues, boss, clients,patients, etc. – and within society as a whole. Given thecentral place of work, a measure of the psychological well-being that individuals associate with their work can also beseen as an indicator at a collective level of how well workmeets the professional, private and social needs ofindividual workers.
Despite the acknowledged importance of work satisfactionin employment policy and research – reflected at EU levelin its inclusion as an indicator of ‘quality of work’ in theEuropean Employment Strategy – it is important to pointout that it is a subjective measure. As a consequence, it maybe less empirically reliable than more objective or verifiablework–life indicators – for example, working hours orexposure to physical risks. Workers may report high levelsof work satisfaction for reasons to do with personaldisposition or outlook rather than the quality of the workor working conditions. A worker in an ostensibly ‘good’ job– well-paid, secure, with a generally positive workingenvironment – may report a lower level of work satisfactionthan someone in a more menial, less well-paid job, becausethe two have very contrasting expectations of work.
It is also the case that in all surveys workers generallyappear predisposed to report high levels of satisfaction withworking conditions. Over three quarters of workers will, onaverage, report themselves ‘content’ or ‘very content’ withtheir job or working conditions when questioned, and thefourth European Working Conditions Survey is no exceptionto this pattern.
Main trends
The last three European Working Conditions Surveys, in1995, 2000 and 2005, have included a question on worksatisfaction or satisfaction with working conditions: in each,five out of six workers consistently reported themselves‘satisfied’ or ‘very satisfied’ with working conditions in theirmain paid job.1 There has been little change in the aggregateproportions of workers expressing satisfaction with workingconditions, as Figure 10.1 shows.
If the EU15 countries are compared over the period 1995–2005, a remarkably consistent proportion of workers(between 83% and 85%) report themselves satisfied or verysatisfied with their work. What is clear, however, is thatthese aggregate figures conceal large differences betweendifferent groups of countries.
From the more detailed country breakdown of the 2005survey shown in Figure 10.2, it can be seen that theNetherlands and the Nordic countries generally show highlevels of satisfaction with working conditions, withDenmark and Norway recording the highest levels. Thedifference between the old and new Member States is clearin the country comparison: most of the EU15 MemberStates are above the EU average, in terms of respondentsreporting themselves satisfied or very satisfied with theirworking conditions, with the exception of three southernEuropean countries – Italy, Spain and Greece; by contrast,all but one of the new Member States (Cyprus) are belowthe EU average. In general, national levels of satisfaction
EU25EU15EU15200520001995
0
10
20
30
40
50
60
70
80
90
100
very satisfied satisfied not very satisfied not at all satisfied
1 There was a change of question wording from 1995 to 2000. In 1995, the question asked was ‘On the whole, are you very satisfied, fairly satisfied, not verysatisfied or not at all satisfied with your main job?’ In 2000, this was changed to ‘…are you […] satisfied with working conditions in your main paid job?’ andthis formulation has been retained in 2005.
Figure 10.1: Work satisfaction trends, 1995–2005 (%)
Satisfaction with working conditions 10
77

2 See the Foundation study, Measuring job satisfaction in surveys, available online at http://www.eurofound.europa.eu/ewco/reports/TN0608TR01/TN0608TR01.htm
with working conditions appear to track closely standardmeasures of national wealth: countries with higher GDP perhead report generally higher levels of satisfaction.
Indicators of satisfaction with work
The fourth European Working Conditions Survey includes anumber of new questions which are intended to throw lighton the different elements of work satisfaction. As indicatedabove, working conditions surveys tend to reveal a highproportion of individuals who report satisfaction with theirwork. However, to gain a more accurate picture of worksatisfaction, it is necessary to examine in detail the various
factors contributing to satisfaction, such as income, workingtime arrangements, possibilities for skills development andcareer advancement, and the degree of individual controlover work.2
The questions (37 a–f in the questionnaire) relating to thesefactors are in the form of statements and do not explicitlymention ‘satisfaction’; nevertheless, they can be considereduseful proxies for frequently cited components of job orwork satisfaction. Thus, a respondent who agrees orstrongly agrees with the statement ‘I am well paid for thejob I do’ can reasonably be said to be expressing a positiveopinion about or satisfaction with their pay.
In general, the high level of general work satisfactiondemonstrated in the single question on satisfaction withworking conditions (question 36) is only partially reflectedin respondents’ assessment of key elements of worksatisfaction – see Figure 10.3. Once these are considered onan individual basis, a more nuanced picture emerges. Forthe two questions relating to the respondent’s sense ofsocial integration in the company, (‘feel at home in theorganisation’ and ‘have very good friends at work’), thereare comparably high proportions of positive responses.Similarly, the majority of respondents were also optimisticabout their job security: only 13% – less than one in seven– considered it likely that they would lose their job over the
78
Fourth European Working Conditions Survey
DK
NO
UK
CH
AT
BE
DE
NL
LU
IE
SE
PT
FI
CY
FR
EU27
CZ
MT
ES
PL
IT
HU
SK
EE
HR
SI
LV
BG
LT
EL
RO
TR
very satisfied satisfied not very satisfied not at all satisfied
0 10 20 30 40 50 60 70 80 90 100
Figure 10.2: Work satisfaction, by country (%)
Figure 10.3: Satisfaction with positive job elements (%)
Note: Data based on answers to questions 37 a–f.
* Job security: Results were obtained from a reverse coding of the answers to
Q37a, ‘I might lose my job in the next six months’. For instance, ‘strongly
agree’ in the above legend is a reverse coding of the response ‘strongly
disagree’ to this question.
strongly agree agree neither agree nor disagree disagree strongly disagree
Good prospects for career advancement
Well paid for the work done
Opportunities to learn and grow
Feel 'at home' in organisation
Have very good friends at work
Job security*
0 10 20 30 40 50 60 70 80 90 100

ensuing six months. However, at least one third of workersconsider themselves to be underpaid; while about the sameproportion are optimistic about their prospects for careeradvancement in their current job. Figure 10.3 indicates, inparticular, that workers are much less optimistic about theirprospects for career or personal development in their workthan the high levels of overall satisfaction with workingconditions might suggest.
Respondents who reported that their working hours fittednot very well or not at all well with their family or socialcommitments not surprisingly reported lower levels ofsatisfaction with working conditions (Figure 10.4).
Based on an analysis of the correlation between the mainjob satisfaction question (Q36) and other questions with apossible bearing on job satisfaction (Q18, Q25 h–m, Q27,Q37 a–f and EF5), the most important factors correlatedwith general satisfaction with working conditions are asense of belonging in one’s company or organisation (‘I feelat home in this organisation’) and a perception of being wellrewarded.
Significantly, the perception of being well paid appears to bemuch more important than actual income itself (asindicated by the place of respondents in the incomedistribution scale). Developmental possibilities in work
(‘opportunities to learn and grow’ and ‘prospects for careeradvancement’) and work–life balance are also significantlycorrelated with overall satisfaction with working conditions.
Intellectual and emotional demands
A second set of questions (25 h–m in the questionnaire),introduced for the first time in the 2005 survey, exploresaspects concerning psychological well-being at work: thefeeling of doing useful work and a job well done, findingwork either intellectually or emotionally demanding, havingopportunities to do one’s best and apply new ideas in thejob. As with the previous questions related to worksatisfaction, the overall picture is positive (Figure 10.5). Ahigh proportion of workers in Europe consider that they douseful work and that their job gives them the feeling of work
79
Satisfaction with working conditions
almost always often sometimes rarely almost never
Feeling of doinguseful work
Feeling of workwell done
Opportunity todo what you
do best
Able to applyown ideas to
your work
0
10
20
30
40
50
60
70
80
90
100
Figure 10.4: Level of work–life balance and satisfactionwith working conditions (%)
Note: Responses (‘very well’, ‘well’ etc.) are based on answers to question 18:
‘Do your working hours fit in with your family or social commitments outside
work?’
Figure 10.5: Aspects of work-related well-being (%)
Very satisfied Satisfied Not verysatisfied
Not at allsatisfied
Not at all well Not very well Well Very well
0
10
20
30
40
50
60
70
80
90
100
0
20
40
60
80
100
Men Women Men Women
Intellectually demanding Emotionally demanding
almost always often sometimes rarely almost never
Figure 10.6: Intellectual and emotional demands ofwork, by sex (%)

3 ISCED (International Standard Classification of Education) is a classification system designed by UNESCO in the early 1970s to serve ‘as an instrumentsuitable for assembling, compiling and presenting statistics of education both within individual countries and internationally’.
well done: the ratio of such positive statements to negativestatements is over 10:1. In terms of how work presentsopportunities for using one’s own ideas, the responses arestill positive but less emphatically so. Two out of threeworkers report that they often or almost always have theopportunity to do what they do best at work.
Figure 10.6 indicates that broadly similar proportions ofmen and women consider their work to be intellectuallydemanding (just under 50% of both indicate that this isoften or almost always the case), while more women thanmen find that their work imposes emotional demands.
Dissatisfaction with work
Given the high levels of overall satisfaction with workingconditions reported in the survey, it is worthwhileconcentrating on the minority of workers activelydissatisfied with work and see how these are distributedaccording to standard background variables (age, sex,employment status, education etc.)
In general, men, particularly younger men, report higherlevels of job dissatisfaction than do women. Byoccupational type, white-collar workers report lessdissatisfaction than do blue-collar workers. Public-sectorworkers are less dissatisfied than their private-sectorcounterparts and, among employees, those with anindefinite-term contract have higher levels of satisfaction with their working conditions than their fixed-term ortemporary-agency counterparts (grouped under ‘Temporary’in Figure 10.7).
There is a clear relationship between the educational levelattained by respondents and their satisfaction with workingconditions: lower levels of educational attainment areassociated with higher levels of job dissatisfaction. It is alsothe case that higher levels of education are associated withgreater work satisfaction: 51% of workers with an advancedthird-level degree (ISCED 63) report being ‘very satisfied’compared to an average of 25% for the sample as a whole.
It should be emphasised that in most categories less thanone in five workers declare themselves to be ‘not verysatisfied’ or ‘not at all satisfied’ with their work. It is truethat blue-collar workers, workers with a lower secondarylevel of education or less, those holding temporary or fixed-term contracts and male workers under 30 years of agereport higher levels of dissatisfaction; however, even inthese groups, the proportion of dissatisfied workers isaround one in four or lower.
80
Fourth European Working Conditions Survey
Figure 10.7: Dissatisfaction with working conditions, bygroup (%)
Figure 10.8: Satisfaction with working conditions, bysector (%)
0 5 10 15 20 25 30
not very satisfied not at all satisfied
Third level (ISCED 5+6)
Post secondary (ISCED 4)
Upper secondary (ISCED 3)
Lower secondary (ISCED 2)
Primary or lower (ISCED 0+1)
Blue-collar
White-collar
No contract
Temporary contract
Indefinite contract
Self-employed
Public sector
Private sector
Women 50+
Men 50+
Women 30–49
Men 30–49
Women 15–29
Men 15–29
Age
ban
d / s
exSe
ctor
Empl
oym
ent
stat
usOc
cupa
tiona
lty
peLe
vel o
f ed
ucat
ion
very satisfied
Agriculture
Hotels and restaurants
Manufacturing
Construction
Transport and communication
EU27
Public administration and defence
Wholesale and retail trade
Education
Health
Other services
Electricity, gas and water
Real estate
Financial intermediation
satisfied not very satisfied not at all satisfied
0 10 20 30 40 50 60 70 80 90 100

There is a contrast between high satisfaction levels inpredominantly office-based service sectors (such asfinancial intermediation and real estate) and low levels intraditional, non-service sectors. In particular, there arenotably high levels of job dissatisfaction in the agricultureand fishing sectors, where overall sectoral retrenchmentmay contribute to such dissatisfaction, in combination withother negative work aspects identified elsewhere in thisreport – long working hours and high levels of physical riskexposure (see Figure 10.8).
Key determinants of work satisfaction
Various work-related factors impact on reported levels ofsatisfaction with working conditions. Long or non-standardworking hours, high levels of work intensity, low levels ofjob control and exposure to physical or psychological risks(with the associated negative effects on health) all tend tobe linked to lower levels of satisfaction. By contrast, greaterautonomy over how work is carried out and greaterintellectual demands (without excessive pressure or workintensity) tend to be associated with high levels ofsatisfaction with working conditions.
An important indicator of work satisfaction is the extent towhich respondents consider that their health and safety are
at risk or affected by their work. As Figure 10.9 shows,workers who report that their work affects their health andthat their health and safety is at risk in their workplace aremuch more likely to be dissatisfied in their work than thosewho do not consider their health to be affected or at risk.
Jobs that involve solving unforeseen problems, performingcomplex tasks and learning new things are associated withhigher levels of work satisfaction (see Figure 10.10). In thiscase, level of job content may just be one of a number ofcontributing factors to greater work satisfaction. Jobs thatmake more sophisticated intellectual demands tend to beassociated with higher educational qualifications and alsowith higher levels of pay, both of which independentlycorrelate with greater work satisfaction.
81
Satisfaction with working conditions
0 10 20 30 40 50 60 70 80 90 100
very satisfied satisfied not very satisfied not at all satisfied
Perception ofhealth not at risk
+ not affected
Perception ofhealth at risk +health affected
Figure 10.9: Satisfaction with working conditions, byextent of health outcomes (%)
Figure 10.10: Work satisfaction and cognitive demands(%)
Note: The level of job content is a composite variable (Cronbach’s alpha 0.64)
based on the average scores for Q23c (job involves solving unforeseen
problems on your own), Q23d (monotonous tasks – reverse coded), Q23e
(complex tasks) and Q23f (learning new things).
0
10
20
30
40
50
60
70
80
90
100
High level ofjob content
High–medium Medium Low–medium Low level ofcognitive demands
very satisfied satisfied not very satisfied not at all satisfied

Although not directly related to conditions of work, pay isstill a crucial element in understanding and explainingworking conditions. The link between pay and work isobvious: the employment contract is an exchange of labour(and time) for money. Because pay is essentially a rewardfor work carried out, some sort of relationship between payand working conditions can be expected.
In this sense, pay plays an indirect but very important rolein the fourth European Working Conditions Survey. Whilethe survey does not focus directly on labour income (thereare other statistical sources specifically designed for this),1
income is one of the most important secondary variables. Inearlier chapters, income has been used for that purpose, asan independent or secondary variable. This chapterconcentrates on what findings from the survey regardingincome reveal about aspects such as the gender pay gap.
Measuring pay in the survey
It is always difficult to collect information about pay,especially in international surveys. Very often (although notequally often in all countries) people are quite reluctant todeclare their earnings; even if this reluctance can beovercome, the complexity and divergence of pay systems indifferent countries means that the problem of defining acommon, comparable base remains. In order to take thisinto account, a new approach to measuring pay wasintroduced. In the fourth European Working ConditionsSurvey, pay was measured by asking the respondents toposition their usual monthly earnings in their main paid jobon a 10-point scale corresponding to the 10 income decilesin each country. Then they were asked about thecomponents (fixed and variable) of their labour income, inorder to take into account the variability of pay systems.2
In taking this approach, the intention is to have informationon income which is both meaningful in the national contextand easy to compare at the European level; moreover, thisapproach has the advantage of providing both relative andabsolute information about the labour earnings of therespondent. Because the income bands used roughlycorrespond to the distribution of income broken down into10 parts (deciles), the results should provide roughlycomparable income groups: for example, someonepositioned in the lower income band in Portugal would
have the same relative position in their labour market assomeone positioned in the lower band in Ireland, despitedifferences in absolute income.
Figure 11.1 shows the proportion of respondents in eachincome band in the EU, differentiating for employees andthe self-employed. Each of the income bands roughlycorresponds to 10% of the respondents. However, incomebands work much better for employees than for the self-employed whose earnings are much more difficult tomeasure: the self-employed show a much more polariseddistribution of income than the employees, with morepeople both at the top and at the bottom end of the scale.
Determinants of pay in the EU
Pay is generally used in this report as a secondary variable:the analysis shows how pay relates to other issues, such asworking time or position in an organisation. However, it isalso interesting to look at pay as the dependent variableand try to explain its determinants.
The measure does not study monthly pay directly: rather,the position of individuals in the wage structure of theircountry is analysed. 3 In order to simplify the interpretationof results, the income variable has been transformed froma 10-point to a 3-point scale. This means that respondentsare classified according to whether they are in the bottom,middle or top third of the population in their country, interms of the earnings received from their main paid job. Theaim of this analysis is to explain what determines theprobability (or risk) of falling in the bottom, middle or topthird of the income scale.
Lowest income band Highest income band
0 10 20 30 40 50 60 70 80 90 100
Employees
Self-employed
1 For example, the European Earnings Structure Survey, carried out by national statistical institutes under the umbrella of Eurostat. 2 For a more detailed discussion about the methodology used for measuring earnings in the survey, see Annex 2. The methodology is further discussed in
Construction of income bands for the 4th European Working Conditions Survey, available online at http://www.eurofound.europa.eu/docs/ewco/4EWCS/4EWCSincomebands.pdf
3 The survey is more suited to studying income from a relative than from an absolute perspective (as explained in the previous section); in addition, a relativeapproach makes it easier to explore the determinants of income from a European perspective (relative positions are intrinsically comparable, whereas absolutepay is nationally-specific).
Figure 11.1: Distribution of income, by employmenttype, EU27 (%)
Income and payment systems 11
83

Deriving the income variable and its determinants
In order to study the determinants of pay, a multivariate statistical model was used. This means that each variable is controlledby all the others so that the individual impact of each variable can be assessed. For instance, the gap between pay for men andwomen appears bigger than it actually is, a large proportion of the gap being due to the greater take-up of part-time work bywomen (who earn less because they work fewer hours). To properly examine the impact of one specific variable on pay, the effectof other variables such as part-time status has to be controlled for. This is done in Table 11.1, using a multinomial logistic regressionmodel. The table includes two types of determinants: job-related and individual-related determinants.
The interpretation of a multinomial logit model is not straightforward. Essentially, the coefficients in the table show how thevariables in the table affect the odds that the individual falls into the low-pay or high-pay categories (with the middle categoryas a reference). To read the coefficients, each of them has to be compared with the reference category (indicated by ref.) Forinstance, the odds that a part-time worker falls into the bottom category are 5.9 times higher than the odds for a full-time workerdoing so: this shows that part-time work is one of the main determinants for falling into the low-pay category in the EU.Coefficients below 1 indicate lower probabilities than the reference category: for instance, the odds that those with universityeducation will fall into the lower income category are 0.38, compared to the odds for those with primary or no education (thereference category) doing so. The pseudo r2 statistic indicates that overall the model explains around half the variability of thedependent variable, and the asterisks indicate the statistical significance of each coefficient.
Table 11.1: The determinants of pay in EU27, employees only
Odds pay low/medium Odds pay high/medium
Occupation Senior managers 0.32 ** 4.10 **Professionals 0.28 ** 2.63 **Technicians 0.48 ** 1.72 **Clerical workers 0.57 ** 1.55 **Service and sales workers 0.78 ** 1.42 **Skilled workers 0.64 ** 1.10Machine operators 0.55 ** 1.18Unskilled workers (ref.) ref. ref.
Part-time Part-time 5.90 ** 0.67 **Full-time (ref.) ref. ref.
Tenure (years) 0.96 ** 1.03 **Supervisory role Not supervisor (ref.) ref. ref.
Supervisor of fewer than 10 people 0.52 ** 1.50 **Supervisor of more than 10 people 0.38 ** 2.85 **
Sector Agriculture 1.69 ** 1.20Manufacturing and utilities (ref.) ref. ref.Construction 0.44 ** 1.02Retail and other services 1.05 0.98Transport and communication 0.70 ** 1.21 *Real estate and financial intermediation 0.92 1.35 **Public administration and defence 0.93 1.42 **Education and health 0.85 0.77 **
Size of company Micro enterprise (fewer than 10 employees.) (ref.) ref. ref.Small enterprise (10–49 employees) 0.64 ** 1.15 *Medium enterprise (50–249 employees) 0.64 ** 1.09Large enterprise (250+ employees) 0.58 ** 1.41 **
Type of contract Not indefinite-term 1.50 ** 0.69 **Indefinite-term (ref.) ref. ref.
Sex Female 2.55 ** 0.43 **Male (ref.) ref. ref.
Education Primary or no education (ISCED 0–1) (ref.) ref. ref.Lower secondary education(ISCED 2) 0.94 1.40 *Upper secondary education (ISCED 3) 0.69 ** 1.84 **Post-secondary (ISCED 4) 0.47 ** 1.77 **Tertiary education (ISCED 5–6) 0.38 ** 3.73 **
Note: *significant at 5%; ** significant at 1%; Nagelkerke’s pseudo r2 = 0.46
Ind
ivid
ual
char
acte
rist
ics
Job
-rel
ated
var
iab
les
Fourth European Working Conditions Survey
84

Figure 11.2: Income levels of the self-employed, by sector and size of establishment, EU27 (%)
*Not enough data available
Highest income band
0 10 20 30 40 50 60 70 80
Agriculture
Manufacturing
Electricity, gas and water*
Construction
Wholesale and retail trade
Hotels and restaurants
Transport and communication
Financial intermediation*
Real estate
Public administration and defence*
Education*
Health
Other services
One-person company
Micro enterprise (2–9 employees)
Small enterprise (10–49 employees)
Medium enterprise (50–249 employees)
Large enterprise (250+ employees)*
Lowest income band
90 100
Income and payment systems
85
The statistical model (described in the text box opposite)shows that variables related to the type of job have thestrongest impact on the relative position of the respondentin the income scale. The most important determinants areoccupation and employment status. Occupation has astrong impact: managers and professionals have a muchgreater chance of being in the highest pay category and amuch smaller chance of falling into the lowest category thanthe other occupations. By contrast, having a part-time job islikely to put a respondent into the lower pay category; italso means that they are very unlikely to make it into thetop third of the income scale. Other variables with asubstantial impact on pay are length of job tenure andsupervisory role. The impacts of sector, company size andtype of contract are less important, but still significant.
After job-related variables, coefficients related tosociodemographic variables are included. Age is notintroduced in the model because it is already indirectlycovered by years of tenure (so adding age does not increasethe explanatory power of the model). It is interesting to notethat the sex of the respondent still has a strong impact onthe income position, even after controlling for all the othervariables in the model. That means that a woman still hasa significantly higher chance of falling into the lower incomecategory and a significantly lower chance of falling into thehigh income category than does a man with a similaroccupation, employment status, tenure, etc. This can becontrasted with previous analyses of the gender pay gap,
which are based on estimating the difference in absolutepay for two people who have exactly the same job but areof different sex. Such ‘pay gaps’ are usually smaller thanthe difference found in this model, which also includes the‘position gap’, the dependent variable being a measure ofthe respondent’s relative position in the income distributionof the country. The model is therefore very sensitive to thefact that women tend to have lower-paid jobs, even if thosejobs have similar characteristics to those occupied by men.
The relationship between education and pay is indirect: arespondent’s educational level affects their chances ofhaving a particular occupation, which then determines pay.Having a university degree, however, is still one of the mostimportant predictors for falling into the top third of theincome scale.
All of the above analysis concerns employees only. For theself-employed, the measure of earnings is much less preciseand reliable (see Figure 11.2). The survey therefore providesonly information on the distribution of income for differentsectors and sizes of establishment. This shows that theagricultural sector has a very different profile of self-employment than all the other sectors, with a much lowermonthly income. Transport and other services also showlower-than-average pay. In contrast, it appears that thosewho are self-employed in manufacturing and in real estateare more likely to be in the top income levels. There is alsoa clear relationship between the size of establishment in

which a self-employed person works and their averagemonthly earnings: the bigger the establishment, the higherthe earnings.
Gender and pay
Analysing the differences between the relative pay of menand women in different country groups produces somestriking results. Figure 11.3 shows the percentage of menand women in each of the three earnings groups (bottom,middle and top third of the scale). In all country groups(except for the acceding countries), around half of allwomen are positioned in the bottom third of the scale. Inmost cases only around 20% of men occupy this position,whereas they are clearly overrepresented in the top third ofthe scale. This is partly due to the fact that women are muchmore likely to work part time, and part-time workers (alsoincluded in the figure) are disproportionately representedin the bottom third of the pay scale.
Figure 11.4 also shows findings for gender-related pay indifferent country groups: however, it differentiates betweenfull-time and part-time status. It becomes clear that theposition of women lower down the income scale is in partdue to their higher take-up of part-time work: within part-time work, the differences in wages for male and femaleworkers are relatively small. However, when full-timeemployment is studied, the wage gap between men andwomen is still very important, almost as big as the wage gapbefore part-time status was controlled for. For all countrygroups, women are particularly underrepresented in the topthird of the income scale.
Components of pay
The fourth European Working Conditions Survey alsoprovides an overview of the different pay systems inEurope, by analysing the findings concerning the differentcomponents of pay. This information derives from aquestion (Question EF6) that asks the respondents whatelements are included in the remuneration of their mainpaid job: for example, basic fixed salary, piece rate orproductivity payments, payment for overtime or Sundaywork, compensation for poor/dangerous workingconditions, payment from financial participation schemes,etc.
Figure 11.5 shows the overall results of this indicator, forEU27 employees. In the vast majority of cases (more than
Figure 11.3: Gender differences in pay, by countrygroup (%)
Note: Findings apply only to employees.
Figure 11.4: Gender differences in pay, by full-time/part-time status, by country group (%)
Note: Part-time status is controlled for. Findings apply only to employees.
Men
Women
Men
Women
Men
Women
Men
Women
Men
Women
Men
Women
lower pay bracket middle pay bracket upper pay bracket
AC2: BG, RO
CZ, EE, LV, LT, HU, PL, SI, SK
EL, ES, IT, CY, MT, PT
BE, DE, FR, LU, AT
IE, UK
DK, NL, FI, SE
0 10 20 30 40 50 60 70 80 90 100
Men
Women
Men
Women
Men
Women
Men
Women
Men
Women
Men
Women
Men
Women
Men
Women
Men
Women
Men
Women
Men
Women
Men
Women
Part
tim
e
DK
, NL,
FI,
SEIE
, UK
BE, D
E, F
R, L
U, A
TEL
, ES,
IT, C
Y, M
T, P
TCZ
, EE,
LV,
LT,
H
U, P
L, S
I, SK
AC2
: BG
, RO
Full
tim
ePa
rt t
ime
Full
tim
ePa
rt t
ime
Full
tim
ePa
rt t
ime
Full
tim
ePa
rt t
ime
Full
tim
ePa
rt t
ime
Full
tim
e
lower pay bracket middle pay bracket upper pay bracket
0 10 20 30 40 50 60 70 80 90 100
Fourth European Working Conditions Survey
86

95%), there is a basic fixed component in pay. In more thanhalf of the cases, however, employees’ pay includes somevariable component. The most common variablecomponents of pay are also the most traditional: extra payfor overtime (which is an element of pay for roughly onethird of employees) and other forms of extra pay. Piecerate/productivity payment is relatively uncommon in theEU27 as a whole: just around 12% of employees have sucha pay component. Forms of employee participation incompany profits or shares are even less common, notreaching 10% overall.
There are important differences between countries, as alook at the distribution of each variable in differentcountries shows. Figure 11.6 shows the prevalence of fixed-pay and variable pay components (piece rate orproductivity pay). Again, the predominance of a fixed salaryin all countries is clear: only in the Baltic States, Bulgariaand Romania does the proportion of employees without afixed pay component approach 20%. As for piece rate orproductivity components of pay, the variation betweendifferent countries is quite large: they are relatively commonin most eastern European countries, but in most of theEU15 the proportion of workers with piece rate/productivitypay components is almost negligible. Only in Finland andItaly is it a significant component.
Figure 11.7 shows the distribution of different types of extrapay. Overtime pay is the most widely used extra componentof pay, being paid to at least 20% of the employees in allcountries, except Lithuania. It is particularly common in
Austria, the Czech Republic, Italy and Slovenia. Extra payfor poor working conditions is relatively rare except inAustria, the Czech Republic, Slovakia and Slovenia. Finally,Finland, Slovakia and Sweden stand out in terms of extrapay for Sunday work. It is difficult to find a clear pattern interms of the groups of countries making use of anyparticular type of extra pay; this probably reflects the factthat extra pay components are more directly determined bythe economic sector in which the establishment operatesthan by national socio economic models.
Finally, Figure 11.8 shows the percentage of employees indifferent countries whose pay includes some form ofparticipation in company profits or shares in theircompanies. Compared to the previous indicators, thepercentages in this case are much lower. The most commonform of financial participation is company profit-sharing,whereby employees share in the profits of the company inwhich they work. Profit-sharing is quite common in
Figure 11.6: Fixed and piece rate/productivity pay, bycountry (%)
Note: Findings apply to employees only.
Figure 11.5: Components of pay, EU27 (%)
Note: Findings apply to employees only.
Basic fixed salary / wage
Piece rate / productivity pay
Extra pay for overtime
Extra pay for bad working conditions
Extra pay for Sundays
Other extra pay
Profit sharing / company
Profit sharing / group
Shares in company
Advantages of other sort
Other
0 10 20 30 40 50 60 70 80 90 100
SK
IT
EE
LT
CZ
RO
SI
FI
LV
BG
PT
AT
ES
HU
PL
BE
DK
DE
EL
MT
IE
SE
LU
FR
UK
CY
NL
basic fixed salary/wage piece rate / productivity pay
0 2010 30 50 70 9040 60 80 100
Income and payment systems
87

Slovakia (where almost 30% of employees are involved),and relatively common in France, Luxembourg, theNetherlands, Slovenia and Sweden. Company profit-sharing is very rare in most southern European countriesand in Hungary and Romania. Group-profit sharing, ingeneral, is less common, but the patterns are essentially thesame as for company-profit sharing.
The other important form of financial participation isequity-sharing, which means that employees actually ownpart of the company. This form of financial participation ismuch rarer: only 5% of employees in France and Irelandengage in it. In Belgium, Bulgaria, Denmark, Estonia,Slovenia and the UK, around 3% of employees receiveshares in their companies. In all other countries, the figureis even lower.
In general, the findings for financial participation from thissurvey are consistent with previous research carried out bythe Foundation, with some qualifications. 4 This surveyfound the general levels of financial participation to belower, but this probably reflects the fact that previousresearch was based on a sample of large companies only, inwhich financial participation is much more common;moreover, it surveyed companies, rather than individualworkers (not necessarily all workers within a company willhave access to financial participation systems, even if theyexist). The results from the fourth European WorkingConditions Survey indicate that financial participation isvery rarely used as a component of pay in most Europeancountries
4 See Financial participation in the EU: Indicators for benchmarking, available online at http://www.eurofound.europa.eu/publications/htmlfiles/ef0480.htm
Figure 11.8: Forms of employee participation in profitsand shares (%)
Note: Findings apply to employees only.
Company sharesGroup profit-sharingCompany profit-sharing
29.5
19.0
14.4
13.7
17.0
15.6
12.7
12.8
11.0
10.6
10.3
7.6
6.6
7.2
6.9
5.0
6.9
6.1
5.8
4.5
5.8
4.4
3.1
3.9
2.5
2.1
2.2
SK
SI
FR
LU
NL
SE
CZ
FI
EE
IE
LV
BG
BE
DK
UK
LT
AT
PL
DE
IT
ES
RO
EL
MT
HU
PT
CY
19.1
14.9
8.2
7.6
6.6
6.4
8.8
9.9
9.9
6.2
5.9
4.8
2.7
3.2
2.9
4.5
1.9
2.8
2.7
3.2
2.1
1.8
2.9
2.2
1.9
1.9
0.1
2.3
2.9
5.5
3.9
1.0
2.0
2.3
1.0
2.6
5.7
0.8
2.6
4.1
2.8
3.0
1.6
1.4
0.6
0.7
0.8
0.2
1.8
1.4
0.7
0.8
1.1
1.2
SK
SI
FR
LU
NL
SE
CZ
FI
EE
IE
LV
BG
BE
DK
UK
LT
AT
PL
DE
IT
ES
RO
EL
MT
HU
PT
CY
SK
SI
FR
LU
NL
SE
CZ
FI
EE
IE
LV
BG
BE
DK
UK
LT
AT
PL
DE
IT
ES
RO
EL
MT
HU
PT
CY
0 20 40 60 80 1000 20 40 60 80 1000 20 40 60 80 100
Figure 11.7: Extra pay components, by country (%)
Note: Findings apply to employees only.
Overtime Working conditions Sunday work Other
CZ
SK
SI
AT
SE
IT
MT
LU
DK
FI
EE
EL
FR
NL
IE
DE
RO
HU
PL
UK
BE
PT
BG
ES
CY
LV
LT
CZ
SK
SI
AT
SE
IT
MT
LU
DK
FI
EE
EL
FR
NL
IE
DE
RO
HU
PL
UK
BE
PT
BG
ES
CY
LV
LT
CZ
SK
SI
AT
SE
IT
MT
LU
DK
FI
EE
EL
FR
NL
IE
DE
RO
HU
PL
UK
BE
PT
BG
ES
CY
LV
LT
BG
ES
CY
LV
LT
CZ
SK
SI
AT
SE
IT
MT
LU
DK
FI
EE
EL
FR
NL
IE
DE
RO
HU
PL
UK
BE
PT
0 20 40 60 80 100 0 20 40 60 80 1000 20 40 60 80 1000 20 40 60 80 100
33.2
33.9
19.5
31.5
13.4
19.4
20.4
46.6
22.9
39.9
30.5
34.6
40.9
22.3
17.3
23.7
29.7
14.4
25.1
10.7
25.8
10.7
21.6
37.0
10.3
23.9
18.8
21.4
27.8
20.8
17.1
33.4
14.5
22.2
17.0
20.2
25.0
16.9
16.4
13.2
16.1
16.5
9.6
9.6
10.1
8.9
9.9
13.0
8.3
10.0
8.2
9.7
7.8
5.8
19.9
15.8
14.7
17.6
3.9
9.0
9.1
7.2
5.4
3.5
5.7
11.2
9.4
1.2
2.4
8.3
7.0
4.0
9.1
2.4
6.3
5.7
9.2
4.0
3.3
6.1
5.0
50.4
39.7
45.1
43.6
35.5
48.7
37.1
38.9
34.8
28.1
33.2
27.5
30.6
34.0
31.8
26.6
25.8
26.9
22.9
28.4
21.3
26.0
18.7
23.8
21.4
18.1
15.3
Fourth European Working Conditions Survey
88

Non-response to the question on earnings
Normally the issue of non-response to a question is of interest only to methodologists; sometimes, however, the non-response can
hide information that is as interesting as the results of the actual responses themselves. One of the best examples of this is non-
response to the income question. Questions about income in surveys routinely have much lower response rates than any other
question, as people tend to be reluctant to provide information about how much they earn. Interestingly, however, this does not
hold true for all European countries: the percentage of people refusing to disclose their earnings varies more between countries
than do many of the other variables studied in this report. Figure 11.9 shows the variation of non-response to the question on
income in all the countries covered by the survey. In some countries (particularly Netherlands and the Scandinavian countries, but
also Germany, Switzerland and Tur key), the level of non-response is almost negligible (around or below 5%). In other countries,
however, more than one in four respondents is not willing to disclose their income (particularly in Austria, the Czech Republic, Italy
and the UK).
Figure 11.9: Non-response to question on earnings, by country (%)
Occupation and employment status also makes a substantial difference to the level of non-response. On average, 16% of
respondents did not answer this question; however, this rose to 24% in the case of senior managers and 21% for the self-employed.
Men are slightly more reluctant to disclose their pay than are women (a non-response rate that is 4 percentage points higher) and
older workers are considerably less keen on reporting their income than are younger workers (a difference of almost 10 percentage
points). Sector does not appear to make any difference.
0
5
10
15
20
25
30
35
UK AT IT CZ FR BE PT ES EU27 EE SK HR PL SI EL HU LU BG RO LT MT IE NL LV CH DE NO CY FI DK TR SE
Income and payment systems
89

Understanding the conditions under which people workacross the different EU Member States and other Europeancountries is central to achieving improved quality of work,greater productivity and increased employment – the Lisbonobjectives in the employment domain. The Foundation’sEuropean Working Conditions Survey presents the views ofworkers on a wide range of issues including workorganisation, working time, equal opportunities, training,health and well-being and job satisfaction. With its five-yearcycle, the survey represents an effective means of trackingover time the impact of crucial issues and events: EUenlargement, the ageing workforce and pressures associatedwith an ever-increasing pace of life.
In this, the fourth European Working Conditions Survey, theresults show that despite the dramatic changes seen inEurope’s workforce over the last five years, triggered by theaccession of 10 new Member States, the increase in non-traditional forms of employment such as part-time andtemporary work, and greater numbers of women enteringthe labour market, working conditions have remainedrelatively stable on average throughout the EU.
Overall, the findings highlight the fact that most Europeanworkers (over 80%) are satisfied with their workingconditions and are happy with their work–life balance. Jobsatisfaction is largely associated with job security, a positiveworking atmosphere and good opportunities to learn andgrow.
Feeding information on these issues of key importance intothe debate at European and national level is a key elementof the Foundation’s activities. In an effort to do thiseffectively, the Foundation has, in recent years, focused itsresearch and information activities in the area of workingconditions and employment on four main policy areas:ensuring career and employment security; maintaining thehealth and well-being of workers; developing skills andcompetencies; and reconciling work–life balance. The mainconclusions of the survey’s findings are also presented inthis way below.
Ensuring career and employment security
The current policy objectives reinforce the key role thatwork plays in the lives of European citizens. Under thisheading, the report looks at access and conditions ofemployment, status, salary and rights atached to work.Participation rates are high on the political agenda.Therefore, it is important to look at the issue of changingdemographics. The survey results highlight the fact thatwith the gradual ageing of Europe’s population, manyEuropean countries will lose around 15% of their workforceto retirement in the next 10 years. The substantial
proportions of workers (16%) in the 40–54 years and olderage group indicates a significant ongoing policy challenge,particularly for Austria, Belgium, France, Germany andLuxembourg, the Netherlands and the Scandinaviancountries. The results also underline the importance ofimproving and developing working conditions to enableolder workers to remain in the workforce for as long aspossible and to facilitate the career trajectory of youngerworkers.
The survey results also show that while women haveincreased their participation in the workforce, they still lagbehind men: more women are moving into managerial rolesbut the gender pay gap still exists, with women still morelikely than men to be found in the lower income groups.This highlights the continuing challenges to the equalopportunities objectives. In the EU27, more men thanwomen are in employment and many sectors are still largelydominated by one sex. Women account for the majority ofworkers in health, education, other services, hotels andrestaurants and the wholesale and retail trade. These foursectors employ more than half of all women in employment.Therefore it is clear that any changes in the workingconditions in these sectors would have a considerableimpact on the quality of work and employment for women.
In terms of pay differences, the survey reveals thatoccupation, gender and employment status (whether peoplework full or part time) are the most important determinants.Part-time workers, workers on temporary contracts, andworkers in the agricultural sector are more likely to fall intothe lower income categories, while senior officials,managers or professionals, and persons in a supervisorycapacity are most likely to belong to the higher incomecategories.
Maintaining the health and well-being ofworkers
In terms of health and well-being, the results show that adeclining proportion (35%) of European workers considerstheir health and safety at risk because of their work,although workers in the NMS report significantly higherlevels than those in the EU15. The most often reportedhealth symptoms are musculoskeletal disorders (backacheand muscular pains), followed by fatigue, stress, headachesand irritability. Other symptoms such as problems witheyesight, hearing and skin, and respiratory problems are allreported by fewer than 10% of workers. The people whoreport that their health is affected by work usually reportbetween two and six symptoms.
The proportion of the European workforce employed intraditional, physically demanding sectors such as
91
12Conclusions

manufacturing and agriculture is declining; however, theproportion of workers reporting repetitive hand or armmovements (the most commonly cited physical risk) hasincreased overall. Again, the gender differences areapparent, with women more exposed than men to somerisks, and vice versa. Although the findings show thatviolence at work remains relatively limited, it is mostcommon in sectors where women constitute the majority ofthe workforce.
Underlining the need for a better understanding of the roleof work organisation in this area, the findings show thatwork intensity is clearly on the increase, with risingnumbers working at high speed and to tight deadlines: onequarter of all workers reports having to work at very highspeed all or nearly all of the time. Nevertheless workers’autonomy levels are high, although the results show thatlevels of autonomy are not increasing.
Developing skills and competencies
Promoting and encouraging lifelong learning has becomeone of the EU’s key policy objectives. It is also central tothe life-course approach that looks at flexible workinginitiatives and corresponding social security arrangementsas part of the flexicurity debate.
In terms of skills and training, the report shows that amajority of workers report that work is interesting and offersnew opportunities to learn, although access to training hasnot improved. This is particularly the case for older and lessqualified workers, highlighting a deficit in progress towardsthe life long learning objective.
The survey results also show that one of the most importantchanges in the workplace is the increasing use ofinformation technology. Computer use has risenconsiderably across Europe and younger workers usecomputers twice as much as older workers. Around 26% ofworkers now work with computers all, or almost all, of thetime; in 1990, the equivalent figure was around 13%.Moreover, people clearly link the use of the new technology
to better career prospects. However, a sizeable proportion ofworkers still never use internet or email.
Alongside these dimensions, it is important to highlight thatthe survey provides the possibility of assessing how workin itself is changing; it is becoming, possibly less rapidlythan expected, more knowledge and technology based andis developing a stronger customer orientation.
Reconciling work–life balance
With the objective of increasing women’s participation inthe workforce high on the agenda and against the backdropof an ageing population, it is important to reflect on theduration, times and predictability of work with a view toensuring a more positive work–life balance for both womenand men. The findings show, however, that even womenworking part time work more hours in total than menworking full time, taking into account other tasks related tocaring, household duties, etc. Furthermore, the perceivedincrease in implementation of flexible working hours is notas widespread as it would appear: on the contrary, in mostinstances, working schedules are still fixed by companiesand while part-time work is increasing, the proportion ofworkers with atypical schedules remains low.
A large majority of workers are satisfied with their work–lifebalance. Since 1991, there has been a steady reduction inthe length of the EU working week – a trend that changedin 2005 following the accession of the NMS, where averageworking hours are longer. It is interesting to note thatwork–life balance is perceived most positively by thoseworking regular and predictable schedules.
Placing the key findings of the fourth European WorkingConditions Survey in this policy context again highlights thepertinence of this survey in charting the trends of workingconditions and employment in an enlarged Europe over thelast 15 years, to provide timely and comprehensiveinformation for policymakers as they shape the future ofworking and, indeed, living conditions throughout Europe.
92
Fourth European Working Conditions Survey

The European Working Conditions Survey (EWCS) is carriedout by the European Foundation for the Improvement ofLiving and Working Conditions, an autonomous EU agencywith a tripartite Governing Board based in Dublin. GallupEurope was contracted by the Foundation to carry out thefieldwork of the EWCS 2005.
Between 19 September and 30 November 2005, theFoundation carried out its fourth European WorkingConditions Survey. Almost 30,000 European workers wereinterviewed in 31 countries (all EU25 Member States plusBulgaria, Croatia, Norway, Romania, Turkey andSwitzerland), answering more than 100 items on a widerange of issues regarding their employment situation andworking conditions. This provides a unique source ofinformation on the conditions of work in different Europeancountries and a source which is entirely comparable (thesame questionnaire was used in all countries covered). Italso allows for analysis of the current situation in thecontext of the last 15 years as this is the fourth time thissurvey has been conducted.
The previous surveys were carried out in 1991, 1995 and2000 (including the candidate countries, now the newMember States, in 2001). The number of questions andissues covered has increased with each subsequent survey,but a core of key questions remained the same, in order tostudy trends in working conditions. The development of thesurvey reflects also the development of the EU itself: fromcovering only 12 countries in 1991, it covered 15 in 1995and 2000 (extended to cover the 10 former candidatecountries in 2001), to 25 EU countries plus four accedingand candidate countries and two members of the EuropeanFree Trade Association in 2005.
Preparation of the fourth survey included the review of theEWCS statistical production process and the design of astrict quality assurance framework relying on current bestmethods. The production process was examined, subprocesses identified, actors’ roles described, performancetargets fixed and performance indicators selected andmonitored. The quality assurance framework has guided theimplementation of the fourth survey. Quality control wasperformed by internal and external agents. A minimum of10% of interviews and 10% of routes have been checked ineach country.
Questionnaire design and translation process
The questionnaire, in common with previous editions of theEWCS, was developed in close cooperation with the expertquestionnaire development group (see Annex 4). This groupwas composed of representatives of the national institutesthat carry out this type of survey at national level, membersof the tripartite Governing Board of the Foundation(employer associations, trade unions and governments), theEuropean Commission and other EU bodies (Eurostat, theEuropean Agency for Safety and Health at Work),international organisations (OECD, ILO), as well as leadingEuropean experts in the field of working conditions andsurvey methodology. While the priority was to retain trendquestions in order to preserve and extend the time series, acertain number of new areas were identified where thesurvey’s scope could be usefully extended (access totraining, work engagement and commitment, job security,the collective dimension of work, the blurring boundariesof work and non-work life). New questions introduced were,where possible, based on existing questions alreadysuccessfully used in other similar national surveys. In thecase of certain background demographic variables,including highest completed education level, net monthlyjob income and household composition, more extensivequestion formulations were developed in order to createricher future analytical possibilities. Out of the 63 questionscontained in the questionnaire, 31 are unchanged, 26 aremodified and six are new.
The questionnaire was translated into 27 differentlanguages, with nine of these used in more than onecountry. The translation process implemented for the surveywas based on current good practice in the multilingualtranslation of international survey questionnaires: for trendquestions, existing translations from previous surveys wereretained except in a small number of cases where problemswere identified and new revised translations introduced. Fornew and modified questions, the English master versionwas subject to parallel translation into the main targetlanguages by independent translators familiar with surveyresearch in the working conditions area. These paralleltranslations were merged into a final draft which was thentranslated back into English to identify and resolveremaining problems or ambiguities. The majority of thetranslations were also subject to final vetting by nationalexperts from the expert development questionnaire groupwho assisted the Foundation in this task. In general, theyrated positively the quality of the individual translationsand in some cases proposed some important fine-tuning.
93
Annex 1: Survey methodology

1 ‘Employed persons are persons aged 15 and over, who during the reference week performed work, even for just one hour per week, for pay, profit or familygain or were not at work but had a job or business from which they were temporarily absent because of, e.g., illness, holidays, industrial dispute and education or training’ (Eurostat, Labour Force Survey: Concepts, Definitions and Classifications, 2005).
2 In principle, the definition of region was to follow the NUTS-2 European Standard definition. In practice, while this was the case in most countries, in somecases NUTS-1 was used, as NUTS-2 was too detailed and implied an unrealistic sampling stratification.
3 Unfortunately, there is no homogeneous EU-comparable classification of urbanisation levels, so in each country the urbanisation category used forstratification is different (in most cases, based in the categories used in the national census). It was decided that it was better to stratify according to someurbanisation category even if it was not homogeneous, because it would lead to a better spread of the sample in the territory (within each region).
4 Basically, this procedure stated that, starting from the assigned address, the interviewer should select each third building to the left; if there was more thanone floor, to go to the third one; if there was more than one household in each floor, to select the third one starting from the left, etc. These strict andcumbersome rules ensure a properly random selection of the households to be contacted.
Fourth European Working Conditions Survey
94
Sampling design
The sample of the EWCS is representative of the persons inemployment (employees and self-employed, according tothe Eurostat definition) during the fieldwork period in eachof the countries covered.1
In each country, the EWCS sample followed a multi-stage,stratified and clustered design with a ‘random walk’procedure for the selection of the respondents at the laststage (except for Belgium, Netherlands, Sweden andSwitzerland, where the selection of the respondents wasmade using a phone register). All interviews were conductedface-to-face in the respondent’s own household.
The sampling design had the following stages:
1. Stratification of primary sampling units (PSUs)according to region and urbanisation level: as is theusual practice in face-to-face surveys, the interviews tobe conducted in each country were clustered in anumber of PSUs (each of them corresponding to a‘random walk’ starting address) which were allocated togeographic areas stratified by region2 and urbanisationlevel.3 That is to say, in each country a table ofpopulation by region and urbanisation level wascreated, and the PSUs were allocated to the cellsaccording to the proportion of population in each cell.
2. Random selection of starting addresses withineach PSU: within each stratum, each PSU wasrandomly assigned an address from which the ‘randomwalk’ would start.
3. ‘Random walk’ procedure for the selection of thehousehold: starting from the assigned address, theinterviewer followed a strictly pre-defined procedure(‘random walk’) to select the households to contact forinterviewing.4 Once a household was selected, it couldnot be substituted even if there was nobody at home,until four attempts to contact the interviewer had beenunsuccessful (at different times and days). The ‘randomwalks’ were scheduled at a time of the day when the
employees and self-employed were available (normally,in the evenings and weekends).
4. Selection of the interviewee within the household:once a successful contact was achieved, the interviewerhad precise instructions to: first, identify how manyemployed persons (according to the Eurostat definition)inhabited the house; and second, whenever more thanone person in employment was identified, the personwhose birthday was the latest should be selected for theinterview.
In Belgium, Netherlands, Sweden and Switzerland, adifferent procedure for the selection of the respondent wasfollowed. Previous experiences of ‘random walk’ surveyshad proven quite unsuccessful in these countries (with verylow response rates), so it was decided to use phonedirectories to select the interviewees, randomly selecting
Table A1: Number of interviews (after quality control)
Austria 1009 Luxembourg 600
Belgium 1003 Malta 600
Bulgaria 1134 Netherlands 1025
Cyprus 600 Poland 1000
Czech Republic 1027 Portugal 1000
Denmark 1006 Romania 1053
Estonia 602 Slovakia 1024
Finland 1059 Slovenia 600
France 1083 Spain 1017
Germany 1018 Sweden 1059
Greece 1001 United Kingdom 1058
Hungary 1001
Ireland 1009 Croatia 1011
Italy 1005 Norway 1000
Latvia 1003 Switzerland 1040
Lithuania 1017 Turkey 1015

5 In some countries, the phone registers did not allow the selection of individual phone numbers according to the geographic location, so the households werematched to each of the strata after the first contact by phone.
6 Overall, there were almost 19,000 successfully contacted households in which there were no employed persons at all.7 American Association for Public Opinion Research (2004), Standard definitions: Final dispositions of case codes and outcome rates for surveys, 3rd edition,
Lenexa, Kansas.8 This ‘cooperation rate’ is very often reported as ‘response rate’, which is wrong according to the internationally agreed definitions. As we will see, the response
rate is the proportion of completed interviews relative to all eligible cases (not only the cases actually contacted). The ‘response rate’ reported in the thirdEuropean Working Conditions Survey was actually this ‘cooperation rate’.
9 The denominator includes in this case, apart from interviews (total and partial) and refusals, non-contacts, ‘others‘, and an estimation of the number ofpotentially eligible cases from all cases in which the eligibility is unknown (an estimation which is based in the proportion of households with employedpersons in the households actually contacted).
10 The denominator of the formula is the same as in the contact rate.
Annex 1: Survey methodology
95
from numbers within the strata defined in stage 1.5 This onlyaffected the method for the selection of the interviewee (thatis, Stages 2-5 of the sampling design), but not the logic forthe selection of the interviewees (employed personsaccording to the Eurostat definition, randomly selected) orthe mode of interviewing (which was exactly the same, face-to-face interviews in the household of the respondent). Sothe resulting interviews are entirely comparable.
The target number of interviews was 1,000 in all countriesexcept Cyprus, Estonia, Luxembourg, Malta and Slovenia,in which it was 600. The number of interviews actuallycarried out in each country is summarised in Table A1.Paper-and-pencil interviews (PAPI) were used in allcountries except in the Czech Republic, Denmark,Germany, the Netherlands and Slovakia, where interviewswere collected using computer-assisted personal interviews(CAPI).
Fieldwork outcome and response rates
The fieldwork was carried out from 17 September 2005 to30 November, with different durations by country but anaverage of seven weeks. The total number of interviewersinvolved in the survey fieldwork was 2,745 who in totalvisited 72,300 households, out of which 29,766 interviewswere actually carried out.
This means that more than 40,000 attempts at contacts orinterviews were not possible or unsuccessful. In general,face-to-face surveys involving random walk tend to faceconsiderable (and increasing) difficulties in reaching therespondent (not only because of refusals and no response,but because of more mundane problems like difficulties inaccessing the building, empty households, etc). In thefourth European Working Conditions Survey, it is importantto note an additional difficulty: once a successful contactwas made, the interviewer still had to select eligibleinterviewees in the household according to a very strictdefinition (the Eurostat definition of persons inemployment, which in some cases can be quite difficult toapply to real-life situations, especially in less standard-
industrial types of employment such as agricultural work,family business, etc.) which obviously increased thenumber of unsuccessful visits.6
Table A2 shows the achieved response rates in the fourthsurvey, calculated following the most widely acceptedstandard definitions.7 The cooperation rate (coop3) is theproportion of completed interviews to all eligible units evercontacted.8 This shows that overall, two thirds of the eligiblerespondents (that is, households in which there wereemployed persons according to the Eurostat definition) thatwere contacted did cooperate with the EWCS. Theproportion is quite similar (and high) in all countries exceptfor the cases in which phone screening procedures wereapplied, which had a much lower response rate (it isnormally easier to refuse an interview by phone than at thedoor of your household).
The contact rate measures the proportion of all contactedhouseholds to all households eligible,9 and it is around 0.8in all countries, with very small variations from country tocountry except for the countries with phone screeningwhich again have a lower rate. The refusal rate (ref2)measures the proportion of refusals to the total number ofpotentially eligible cases.
The response rate (rr3) is calculated as the proportion ofcompleted interviews to the total number of eligible cases.10
The overall response rate of the fourth survey is 0.48, whichis a reasonable response rate for this type of survey. In mostcountries, the response rates are around this average of 0.5or above, with eight countries below a 0.4 response rate(Belgium, Finland, Luxembourg, Netherlands, Poland,Slovenia, Switzerland and the United Kingdom). Asdiscussed above, three of the countries in which phonescreening was used for increasing response rates actuallyhave the lowest response rates of the overall survey(Belgium, Netherlands and Switzerland), which indicatesthat the attempt at increasing response rates wasdisappointing (although it is not clear what the responserates would have been had the random route been retainedeven in these countries). The very low response rate in

Luxembourg is a usual outcome of door-to-door surveys inthis country. The three countries in which response ratesare lower than expected are Poland, Slovenia and theUnited Kingdom.
Weighting
In the fourth European Working Conditions Survey, threetypes of weighting have been applied to the data in order toenhance the representativity of results:
1 Selection probability weighting: the ‘random walk’selects households and within households,respondents. This has the unintended consequence ofgiving more probability of selection to respondents livingin smaller households (in a one-person household, theprobability of being selected is 100%, whereas it falls to50% in a two-person household, etc.). This has beencorrected by applying selection probability weights.11 In
order to have unbiased results, the data must always beweighted by this selection probability weight.12
2 Non-response (or post-stratification) weighting:different types of eligible respondents have differentresponse rates, which can lead to biased estimations.The usual way to minimise this effect is to generate aweight that corrects the biased response rates for somekey variables, so that the bias is minimised. Obviously,that requires knowing the real population figures for thevariables used for producing these non-responseweights: in this case, it was assumed that the figures ofthe European Labour Force Survey (LFS) are the realfigures, to generate a weight that adjusts these results tothe results of the LFS for the following variables: sex,age, region (NUTS-2), occupation (ISCO at 1 digit) andsector (NACE at 1 digit). The method followed tocalculate these weights was the raking method, whichcarries out an iterative process of estimation of the
96
Fourth European Working Conditions Survey
Table A2: Response rates
AAPOR code: coop3 con2 ref2 rr3 AAPOR code: coop3 con2 ref2 rr3
EWCS 2005 0.66 0.78 0.25 0.48
F2F sampling, overall 0.69 0.80 0.23 0.51
Telephone sampling 0.53 0.68 0.30 0.34 Malta 0.60 0.86 0.31 0.47overall
Austria 0.71 0.88 0.25 0.61 Netherlands 0.44 0.66 0.35 0.28
Belgium 0.50 0.72 0.34 0.34 Poland 0.53 0.69 0.31 0.35
Czech Republic 0.84 0.85 0.13 0.69 Portugal 0.73 0.95 0.24 0.67
Cyprus 0.88 0.75 0.08 0.57 Slovenia 0.52 0.77 0.34 0.37
Denmark 0.66 0.70 0.21 0.42 Slovakia 0.81 0.79 0.14 0.58
Estonia 0.72 0.83 0.20 0.54 Spain 0.68 0.97 0.31 0.66
Finland 0.63 0.68 0.21 0.35 Sweden 0.63 0.80 0.28 0.47
France 0.74 0.81 0.20 0.58 United Kingdom 0.48 0.77 0.36 0.34
Germany 0.88 0.76 0.08 0.61
Greece 0.63 0.83 0.29 0.49 Bulgaria 0.75 0.91 0.21 0.65
Hungary 0.61 0.91 0.33 0.51 Croatia 0.61 0.77 0.29 0.45
Ireland 0.81 0.72 0.12 0.51 Romania 0.85 0.85 0.11 0.67
Italy 0.64 0.78 0.27 0.49 Turkey 0.88 0.78 0.09 0.64
Latvia 0.77 0.89 0.20 0.65
Lithuania 0.83 0.84 0.13 0.64 Norway 0.74 0.81 0.20 0.57
Luxembourg 0.41 0.88 0.46 0.32 Switzerland 0.59 0.59 0.22 0.32
11 Which simply means multiplying each case by the number of eligible persons (i.e. persons in employment) in the household.12 The variable holding this weight in the dataset is ‘w1’.
coop
erat
ion
cont
act
refu
sal
resp
onse
coop
erat
ion
rate
cont
act
rate
refu
sal
rate
resp
onse
ra
te
rate
rate
rate
rate

weights that would be required for each case in order toreplicate with the survey data the marginals of the LFSin terms of the weighting variables. This weightincorporates the selection probability weight, and mustbe always used when trying to make unbiased pointestimates.13
3 Cross-national weighting: this final step in theweighting is applied in order to be able to do cross-national estimations. The weights of all respondents ineach country are multiplied by the proportion that thiscountry represents in the total employed population inthe respective cross-national area. When trying toestimate values for cross-national areas, thecorresponding cross-national weighting must beapplied.14
Limitations of the survey
The main objective of the fourth European WorkingConditions Suvey is to provide comparable information onthe conditions of work and employment of employedpersons in different EU countries. It is not aimed at studyingthe situation in each country in depth. The sampling designreflects these aims: with a sample of 1,000 interviews ineach country, the survey is not the correct statistical sourcefor making a detailed analysis of the working conditions ofspecific groups within specific EU countries. What it canprovide is a reliable comparison of working conditions indifferent EU countries, and when using data aggregated atthe EU or EU-region level, the survey can be used to carryout detailed analysis of working conditions according todifferent employment characteristics or sectors of activity.The survey is a unique source of information in providingstrictly comparable data on working conditions at aEuropean level, but for carrying out detailed analysis in onespecific country, the reader should refer to the existingnational working conditions surveys.15
On a more general level, it should be noted that EUaverages often hide differences between countries andsectors, and different paths of evolution. When looking atthe EU27 aggregates, the reader should bear in mind thatfive countries in Europe account for more than half ofEuropean workers and therefore strongly influenceaverages: Germany (17%), United Kingdom (14%), France(12%), Italy (11%) and Spain (9%). It is also important to beaware that since the last time the survey was performed (in2000), the EU has enlarged by 12 new Member States. This
means that when considering differences between the lasttwo waves, readers should remember that the average nowreflects the inclusion of 12 new countries. The same goesfor differences between 1990-91 and 1995, the periodduring which three new countries joined the EuropeanUnion: Austria, Finland and Sweden.
The European Working Conditions Suvery is a survey thatcaptures the working conditions of European workers asthey are perceived and reported by them. In some cases, theinformation captured in the survey is quite factual, so thatthe difference between perceived reality and reality can beassumed to be only minor (such as in reported workinghours, or in employment status). In other cases, we areasking the respondent to subjectively evaluate theirsituation, so that the problem of perceived vs ‘real’ is simplyirrelevant. But there are some cases in which this might bea real problem, such as those questions in which therespondent is asked to report on a ‘factual’ aspect of workwhich is very strongly affected by subjective evaluations:some examples of these are the questions about healthoutcomes of work, exposure to risks or the questions aboutwork intensity. Of course, this is not necessarily a weakness,or a problem in itself: in most cases, it is the perceivedreality that has social effects, not reality itself (if a workerperceives – correctly or not – that her job has a negativeimpact on her health, she may change jobs or take frequentsick leave). But it is important to have this qualification inmind when interpreting the results.
Finally, it is also important to be cautious when interpretingthe results of an international survey: all internationalsurveys based in pre-coded interviews suffer from thedifficulties of translating the questions into differentlanguages, cultures and contexts, which always involves acertain degree of misunderstanding. The EWCS is not anexception to this: although the economic structures inEurope are becoming more similar, and probably also theconceptualisations of work, we are still quite far from ahomogeneous understanding of work throughout Europe.The understanding of concepts such as ‘task’ or‘harassment’ varies considerably between cultures and yetin both cases they have been confronted with exactly thesame questions. There are several ways in which theFoundation has tried to deal with this issue: firstly, by usingalready validated questions (tested in previous surveys)which are as factual as possible in their wording and scales;secondly, by trying to develop the best possible translation
97
Annex 1: Survey methodology
13 The non-response weighting is held in variable ‘w4’ in the dataset.14 There are various cross-national weights in the dataset, all starting by ‘w5’ and followed by the EU region covered. 15 http://www.eurofound.europa.eu/ewco/surveys/index.htm.

process, taking into account not only linguistic issues, butalso cultural and contextual ones;16 and thirdly, bymeasuring complex phenomena (e.g. job intensity) usingseveral different questions, so that it is possible to cross-check answers for (in)consistencies. But still, there arecertainly some limitations in the comparability of some of
the most complex concepts studied in this survey. At thetime of writing this report, a qualitative post-test on some ofthe dimensions covered in the survey was being carried outin five countries, in an effort to access some qualitativeinformation on these difficulties of understanding of thequestionnaire concepts in different countries.
98
Fourth European Working Conditions Survey
16 For a detailed explanation of the questionnaire translation process in the survey, see: Questionnaire translation process in the 4th European Working ConditionsSurvey, http://www.eurofound.europa.eu/docs/ewco/4EWCS/4EWCStranslationprocess.pdf
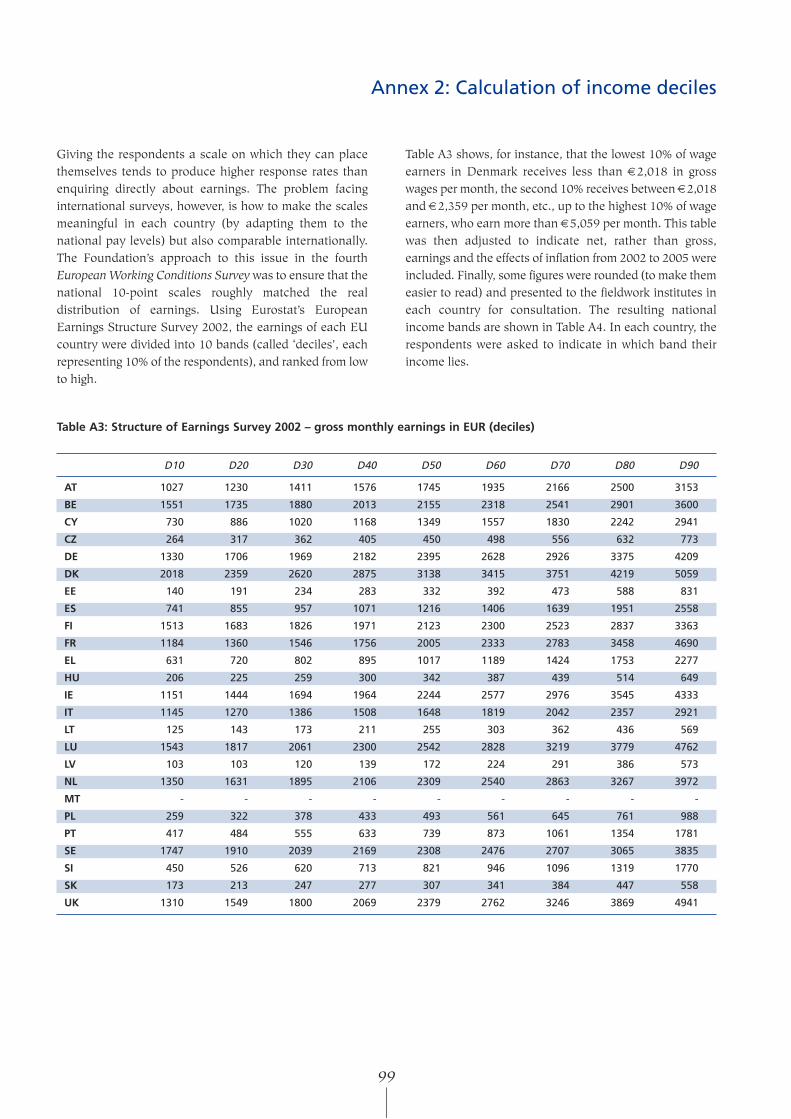
Giving the respondents a scale on which they can placethemselves tends to produce higher response rates thanenquiring directly about earnings. The problem facinginternational surveys, however, is how to make the scalesmeaningful in each country (by adapting them to thenational pay levels) but also comparable internationally.The Foundation’s approach to this issue in the fourthEuropean Working Conditions Survey was to ensure that thenational 10-point scales roughly matched the realdistribution of earnings. Using Eurostat’s EuropeanEarnings Structure Survey 2002, the earnings of each EUcountry were divided into 10 bands (called ‘deciles’, eachrepresenting 10% of the respondents), and ranked from lowto high.
Table A3 shows, for instance, that the lowest 10% of wageearners in Denmark receives less than €2,018 in grosswages per month, the second 10% receives between €2,018and €2,359 per month, etc., up to the highest 10% of wageearners, who earn more than €5,059 per month. This tablewas then adjusted to indicate net, rather than gross,earnings and the effects of inflation from 2002 to 2005 wereincluded. Finally, some figures were rounded (to make themeasier to read) and presented to the fieldwork institutes ineach country for consultation. The resulting nationalincome bands are shown in Table A4. In each country, therespondents were asked to indicate in which band theirincome lies.
Table A3: Structure of Earnings Survey 2002 – gross monthly earnings in EUR (deciles)
D10 D20 D30 D40 D50 D60 D70 D80 D90
AT 1027 1230 1411 1576 1745 1935 2166 2500 3153
BE 1551 1735 1880 2013 2155 2318 2541 2901 3600
CY 730 886 1020 1168 1349 1557 1830 2242 2941
CZ 264 317 362 405 450 498 556 632 773
DE 1330 1706 1969 2182 2395 2628 2926 3375 4209
DK 2018 2359 2620 2875 3138 3415 3751 4219 5059
EE 140 191 234 283 332 392 473 588 831
ES 741 855 957 1071 1216 1406 1639 1951 2558
FI 1513 1683 1826 1971 2123 2300 2523 2837 3363
FR 1184 1360 1546 1756 2005 2333 2783 3458 4690
EL 631 720 802 895 1017 1189 1424 1753 2277
HU 206 225 259 300 342 387 439 514 649
IE 1151 1444 1694 1964 2244 2577 2976 3545 4333
IT 1145 1270 1386 1508 1648 1819 2042 2357 2921
LT 125 143 173 211 255 303 362 436 569
LU 1543 1817 2061 2300 2542 2828 3219 3779 4762
LV 103 103 120 139 172 224 291 386 573
NL 1350 1631 1895 2106 2309 2540 2863 3267 3972
MT - - - - - - - - -
PL 259 322 378 433 493 561 645 761 988
PT 417 484 555 633 739 873 1061 1354 1781
SE 1747 1910 2039 2169 2308 2476 2707 3065 3835
SI 450 526 620 713 821 946 1096 1319 1770
SK 173 213 247 277 307 341 384 447 558
UK 1310 1549 1800 2069 2379 2762 3246 3869 4941
99
Annex 2: Calculation of income deciles

Table A4: Bands for the income question in the fourth European Working Conditions Survey
Currency D10 D20 D30 D40 D50 D60 D70 D80 D90
AT EUR 700 800 900 1000 1100 1200 1300 1400 1700
BE EUR 850 900 950 1000 1050 1100 1150 1300 1600
CY CYP 400 500 600 700 800 900 1000 1300 1700
CZ CZK 7800 9500 10600 11700 12800 14400 15500 18200 21500
DE EUR 800 1000 1100 1150 1250 1350 1500 1700 2000
DK DKK 9000 10500 11500 12500 13500 14500 16000 18000 21000
EE EEK 1750 2500 3000 3500 4250 5000 6000 7500 10000
ES EUR 600 650 700 750 850 950 1100 1300 1700
FI EUR 600 750 910 1020 1100 1200 1340 1520 1890
FR EUR 800 900 950 1050 1200 1350 1600 2000 2500
EL EUR 450 500 550 600 700 800 950 1150 1500
HU HUF 50000 60000 75000 80000 100000 120000 140000 160000 200000
IE EUR 1200 1350 1500 1650 1800 2050 2300 2600 3000
IT EUR 600 750 850 900 1000 1100 1200 1350 1600
LT LTL 430 500 600 700 800 900 1000 1300 1500
LU EUR 1200 1400 1600 1800 2000 2200 2400 2800 3400
LV LVL 80 100 120 140 180 220 260 300 400
NL EUR 1050 1150 1250 1350 1450 1600 1800 2100 2500
MT MTL 200 280 350 400 450 500 650 700 800
PL PLZ 800 1000 1150 1300 1500 1700 2000 2400 3000
PT EUR 300 350 400 450 550 650 750 900 1200
SE SEK 11000 12000 13000 14000 15000 16000 17500 20000 25000
SI SIT 80000 95000 110000 125000 140000 155000 175000 205000 260000
SK SKK 6500 8000 9000 10000 11000 12500 14000 16500 20000
UK GBP 900 950 1000 1100 1250 1400 1650 2000 2500
NO NOK 225000 250000 270000 290000 310000 330000 360000 410000 440000
CH CHF 1600 2800 3500 4100 4600 5000 5600 6500 8100
BG BGN 100 130 150 160 180 200 230 270 360
HR HRK 1500 2000 2500 3200 3800 4500 5500 6000 7000
RO RON 320 360 400 440 540 650 700 860 1200
TR TRL 200 350 450 550 650 800 1000 1500 2000
Source: Eurostat.
Note: results refer only to employees working in establishments with 10 or more employees. In the countries not covered in the European Earnings Structure Survey
(MT, NO, CH, BG, HR, RO, TR), the national fieldwork institutes were asked to provide similarly constructed income bands. For more detailed information on the
income tables, refer to http://www.eurofound.eu.int/docs/ewco/4EWCS/4EWCSincomebands.pdf
100
Fourth European Working Conditions Survey

Annex 3: Statistical tables
101
Back
grou
nd v
aria
bles
(EU
27 a
ggre
gate
s)Pla
ce of
wor
k and
wor
k org
anisa
tion
Sex
Age
Secto
r: NAC
E main
code
sOc
cupa
tion:
1st-l
evel
ISCO
code
sTy
pe of
emplo
ymen
t
Note:
see s
tatist
ical a
nnex
key o
verle
af for
inter
preta
tion o
f data
and c
atego
ries
mf
<= 24
25-3
940
-54
55+
Agric
Man
ufUt
ilsCo
nst
Retai
lHo
telTra
nsFin
anc
Rl_es
tPu
bad
Educ
Healt
hisc
o1isc
o2isc
o3isc
o4isc
o5isc
o6isc
o7isc
o8isc
o9isc
o10
self
emp
Q11f.
Wor
king a
t com
pany
/ or
g. pr
emise
s 69
.876
.575
.574
.272
.367
.649
.482
.567
.449
.576
.076
.257
.281
.175
.580
.382
.481
.276
.978
.281
.280
.273
.347
.067
.461
.067
.477
.755
.176
.6Q1
1g. T
elewo
rking
from
home
9.56.8
5.78.7
8.78.5
1.95.6
5.99.4
6.35.1
9.114
.819
.26.8
15.4
6.215
.519
.012
.05.4
6.01.4
4.52.3
2.24.1
14.3
7.1Q1
1j. D
ealin
g dire
ctly w
ith pe
ople
who a
re no
t emp
loyee
s (eg
. cus
tome
rs)59
.566
.060
.964
.860
.961
.326
.337
.761
.464
.574
.475
.170
.974
.969
.563
.481
.779
.778
.677
.269
.366
.278
.828
.347
.040
.448
.840
.273
.660
.5Q1
1k. W
orkin
g with
comp
uters
43.1
48.5
35.1
51.1
45.3
39.8
9.936
.858
.325
.643
.717
.043
.392
.975
.869
.456
.855
.665
.976
.570
.176
.034
.75.4
16.2
11.6
15.4
66.0
36.2
47.6
Q11l.
Usin
g int
ernet
/ ema
il for
wor
k34
.538
.023
.541
.936
.030
.97.5
26.4
47.9
25.1
30.7
15.0
36.0
81.6
68.8
52.8
47.8
37.3
60.9
66.1
56.3
59.9
23.0
3.410
.64.3
9.940
.934
.336
.7Q2
0a_a
. Sho
rt rep
etitiv
e tas
ks of
<1m
23.8
25.8
33.2
25.0
23.3
20.6
26.4
28.2
19.9
32.7
26.5
37.3
20.7
17.2
17.2
20.1
15.3
24.9
16.7
17.4
21.9
25.7
26.9
24.3
30.6
30.8
28.7
24.0
23.9
24.9
Q20a
_b. S
hort
repeti
tive t
asks
of <
10m
37.4
41.0
46.9
37.7
38.4
37.2
38.0
42.9
41.7
49.1
41.1
49.4
34.1
31.8
30.2
31.3
25.3
43.4
29.2
27.2
35.1
39.4
42.3
39.4
48.5
47.3
44.6
26.2
37.3
39.5
q20b
_a. W
orkin
g at v
ery hi
gh sp
eed
62.4
56.1
67.3
61.1
58.9
50.3
61.2
65.5
54.5
72.3
60.3
75.4
63.1
55.2
55.4
51.1
39.2
61.8
59.8
50.4
57.7
57.8
59.9
60.9
71.8
67.5
53.6
58.3
59.5
59.9
q20b
_b. W
orkin
g to t
ight d
eadli
nes
67.7
54.4
59.2
65.3
62.6
52.1
62.5
69.1
64.1
77.2
52.9
66.1
72.7
67.0
70.3
56.6
42.7
59.1
65.6
60.1
64.0
61.8
49.1
64.9
77.2
68.5
48.7
51.7
61.7
62.3
q21a
. Pac
e of w
ork d
epen
dent
on co
lleag
ues
44.9
38.8
52.3
45.0
39.3
33.4
33.3
51.6
48.9
57.6
34.5
48.7
42.4
37.6
39.5
43.9
30.5
47.7
39.8
37.8
41.7
44.3
37.4
26.9
51.6
51.7
38.9
54.5
22.4
46.5
q21b
. Pac
e of w
ork d
epen
dent
on di
rect d
eman
ds fr
om cu
stome
rs etc
65.4
71.4
69.6
70.0
65.7
68.0
29.6
54.7
65.3
67.4
82.0
87.6
70.6
77.2
71.1
61.7
79.4
83.0
82.9
76.2
74.8
72.4
81.9
27.3
59.6
55.1
53.3
47.3
74.0
67.2
q21c
. Pac
e of w
ork d
epen
dent
on nu
meric
al pr
oduc
tion /
perfo
rm. t
argets
47.6
35.1
40.3
44.3
42.7
35.1
50.1
63.3
47.1
51.5
31.1
30.9
46.8
48.6
41.0
30.5
32.8
30.1
45.3
41.5
43.1
34.4
29.8
47.4
55.7
56.1
33.2
31.2
36.6
43.4
q21d
. Pac
e of w
ork d
epen
dent
on au
toma
ted eq
uipme
nt /
mach
ine23
.213
.222
.219
.418
.514
.322
.141
.414
.623
.513
.114
.322
.410
.111
.710
.83.8
7.915
.07.9
12.4
13.0
9.418
.433
.749
.619
.78.3
14.4
19.8
q21e
. Pac
e of w
ork d
epen
dent
on bo
ss36
.035
.347
.838
.433
.024
.822
.146
.138
.143
.333
.736
.738
.636
.331
.639
.928
.429
.521
.427
.435
.942
.031
.812
.144
.848
.540
.945
.85.6
41.9
q22a
. Hav
e to i
nterr
upt a
task
in or
der t
o tak
e on a
n unfo
resee
n tas
k31
.334
.428
.136
.032
.029
.521
.829
.039
.031
.434
.134
.625
.240
.037
.535
.630
.947
.244
.438
.437
.138
.633
.020
.828
.216
.724
.935
.230
.333
.4q2
4a. C
an ch
oose
/ ch
ange
orde
r of t
asks
62.8
64.1
45.9
64.1
65.3
71.5
77.3
51.3
72.3
57.9
62.6
56.8
55.0
77.8
74.3
63.2
70.5
65.3
85.2
76.0
71.0
63.8
61.5
84.4
49.3
34.7
54.6
54.5
86.8
58.7
q24b
. Can
choo
se /
chan
ge m
ethod
s of w
ork
67.2
66.7
50.9
66.7
69.7
74.3
76.4
56.6
74.5
63.4
65.8
58.1
55.4
71.8
75.2
67.4
85.3
68.1
86.7
83.2
73.4
63.7
61.5
84.1
60.0
38.1
57.3
57.9
86.9
63.1
q24c
. Can
choo
se /
chan
ge sp
eed o
f wor
k69
.169
.357
.470
.269
.576
.483
.860
.882
.965
.566
.757
.862
.776
.779
.570
.579
.966
.382
.280
.773
.868
.363
.387
.963
.549
.262
.359
.888
.865
.3q2
5a. C
an ge
t assi
stanc
e fro
m co
lleag
ues i
f ask
ed68
.166
.876
.069
.165
.262
.258
.567
.670
.672
.865
.968
.862
.575
.165
.977
.271
.174
.464
.270
.574
.471
.165
.456
.270
.364
.258
.178
.347
.771
.3q2
5b. C
an ge
t assi
stanc
e fro
m su
perio
rs / b
oss i
f aske
d54
.558
.164
.058
.553
.548
.943
.355
.762
.055
.356
.253
.653
.468
.657
.064
.058
.461
.148
.360
.464
.363
.455
.733
.254
.153
.647
.554
.824
.860
.3q2
5c. C
an ge
t exte
rnal
assis
tance
if as
ked
32.7
30.5
26.8
32.7
32.0
32.5
32.2
26.4
34.4
35.1
30.5
27.5
33.3
36.5
34.6
38.6
32.3
35.7
39.8
35.6
35.9
31.2
29.2
29.0
29.1
27.8
23.8
47.2
33.2
31.4
q25d
. Has
influ
ence
over
choic
e of w
orkin
g part
ners
28.6
18.7
14.0
24.3
25.0
31.2
41.9
21.6
26.6
33.4
24.6
29.5
21.1
23.7
27.3
18.2
15.1
20.2
57.6
26.7
23.5
14.6
18.0
48.6
23.7
12.8
14.3
23.1
55.1
18.7
q25e
. Can
take
brea
k whe
n wish
es47
.541
.032
.543
.845
.356
.065
.338
.557
.446
.943
.137
.046
.861
.661
.646
.319
.535
.269
.344
.947
.044
.837
.668
.937
.430
.440
.450
.974
.238
.3q2
5f. H
as en
ough
time t
o get
the j
ob do
ne68
.870
.671
.668
.668
.972
.873
.170
.472
.664
.370
.570
.665
.670
.968
.169
.570
.365
.865
.367
.966
.971
.271
.667
.769
.169
.575
.971
.275
.468
.4q2
6a. T
ask r
otati
on44
.542
.649
.946
.342
.035
.435
.846
.448
.644
.742
.548
.037
.536
.635
.053
.743
.857
.238
.542
.848
.939
.843
.338
.649
.044
.539
.770
.425
.047
.7q2
6b. T
eamw
ork
57.4
52.3
58.7
56.7
54.8
48.3
49.8
58.8
60.4
64.3
45.8
58.5
51.1
52.5
49.0
67.0
56.1
67.7
55.4
59.6
60.3
48.9
52.3
48.8
61.6
53.2
47.5
72.7
31.7
60.0
q31.
Imme
diate
boss
is a w
oman
9.442
.025
.424
.923
.126
.910
.613
.611
.84.8
26.2
24.7
14.9
25.5
20.8
24.3
45.2
55.5
18.1
29.0
32.3
27.8
35.3
15.0
7.411
.329
.63.1
na24
.5
Job c
onten
t and
train
ingm
f<=
2425
-39
40-5
455
+Ag
ricM
anuf
Utils
Cons
tRe
tail
Hotel
Trans
Finan
cRl_
est
Puba
dEd
ucHe
alth
isco1
isco2
isco3
isco4
isco5
isco6
isco7
isco8
isco9
isco1
0se
lfem
p
q23a
. Mee
ting p
recise
quali
ty sta
ndard
s?77
.669
.971
.875
.675
.070
.063
.284
.486
.085
.167
.179
.573
.774
.472
.767
.468
.577
.876
.475
.373
.867
.967
.462
.589
.377
.669
.062
.875
.774
.4q2
3b. A
ssessi
ng qu
ality
of ow
n wor
k73
.369
.859
.673
.873
.571
.666
.074
.081
.178
.265
.568
.163
.977
.975
.967
.178
.275
.284
.180
.876
.964
.363
.766
.479
.560
.861
.767
.881
.570
.1q2
3c. S
olving
unfor
esee
n pro
blems
83.5
77.5
68.2
82.5
82.9
81.6
81.8
73.8
87.7
82.0
79.3
77.3
84.7
88.9
84.7
83.6
86.1
85.9
90.7
90.7
86.4
80.0
78.2
85.4
78.8
69.6
67.2
85.7
89.3
79.5
q23d
. Mon
oton
ous t
asks
41.8
44.3
51.0
43.3
41.8
38.1
54.2
49.1
42.8
49.1
41.8
49.0
45.7
36.4
36.4
42.8
31.6
36.5
34.9
28.2
32.3
45.2
42.1
54.8
49.8
58.2
55.8
36.1
38.8
43.8
q23e
. Com
plex t
asks
64.2
53.4
46.4
62.9
61.3
55.6
50.9
60.8
79.1
69.8
46.4
37.0
54.8
73.6
70.0
68.3
61.8
69.7
67.5
78.9
75.3
57.5
42.6
54.2
67.3
45.0
32.7
67.2
58.6
60.0
q23f.
Learn
ing ne
w th
ings
70.2
67.8
68.0
73.7
67.7
62.0
58.0
67.1
83.6
73.2
58.7
53.6
59.5
85.4
76.3
77.8
84.4
83.0
77.5
89.6
83.7
71.5
61.3
58.3
67.4
49.7
44.6
92.4
68.5
69.6
q25j.
Able
to ap
ply ow
n ide
as in
wor
k60
.056
.539
.957
.662
.067
.266
.650
.457
.960
.056
.255
.648
.260
.663
.252
.676
.457
.583
.574
.662
.045
.855
.972
.653
.139
.546
.451
.684
.453
.3q2
7. Jo
b-sk
ills m
atch:
need
mor
e trai
ning
12.7
13.6
16.4
15.6
11.5
7.69.1
12.3
14.9
12.7
10.1
5.79.0
15.4
14.8
16.3
19.8
19.6
13.1
22.3
18.3
13.9
9.78.9
12.2
7.05.2
16.2
12.3
13.2
q27.
Job-
skills
matc
h: co
rresp
ond w
ell51
.752
.948
.349
.853
.260
.355
.951
.849
.754
.852
.957
.453
.451
.850
.250
.349
.451
.049
.046
.650
.051
.055
.454
.454
.558
.054
.650
.152
.452
.4q2
7. Jo
b-sk
ills m
atch:
could
cope
with
mor
e dem
andin
g dut
ies35
.633
.535
.234
.635
.232
.035
.035
.935
.332
.537
.036
.937
.632
.835
.133
.530
.829
.437
.931
.131
.735
.134
.836
.733
.334
.940
.133
.735
.334
.4q2
8a_1
. Has
unde
rgon
e paid
-for t
rainin
g in p
reviou
s 12 m
onth
s25
.327
.121
.029
.127
.219
.17.9
22.4
35.5
18.5
20.3
11.9
28.2
42.8
26.2
42.6
42.0
40.8
31.7
40.9
37.5
28.9
22.5
5.217
.016
.414
.842
.312
.229
.1
Violen
ce, h
arassm
ent a
nd di
scrim
inatio
nm
f<=
2425
-39
40-5
455
+Ag
ricM
anuf
Utils
Cons
tRe
tail
Hotel
Trans
Finan
cRl_
est
Puba
dEd
ucHe
alth
isco1
isco2
isco3
isco4
isco5
isco6
isco7
isco8
isco9
isco1
0se
lfem
p
q29a
. Thr
eats
of ph
ysica
l viol
ence
5.96.2
5.67.1
5.74.2
2.51.8
1.33.7
5.29.2
9.71.9
2.211
.311
.916
.48.0
7.77.0
4.79.1
2.52.4
5.84.7
8.34.9
6.3q2
9b. P
hysic
al vio
lence
from
colle
ague
s1.7
2.02.0
2.11.8
1.01.0
1.21.1
1.90.7
1.31.8
0.00.5
3.43.7
6.11.5
1.83.0
1.02.5
1.41.3
1.51.7
2.30.5
2.1q2
9c. P
hysic
al vio
lence
from
othe
r peo
ple4.6
4.04.0
4.84.3
3.20.9
1.54.3
1.94.5
7.57.3
3.11.4
8.75.2
11.4
6.24.8
4.14.1
6.91.6
1.54.7
3.99.7
4.34.4
q29d
. Bull
ying /
haras
smen
t4.3
6.15.8
5.15.1
4.33.1
4.15.6
3.05.9
8.56.9
2.73.1
5.36.6
8.74.0
5.85.2
6.06.1
3.03.7
4.55.8
1.12.7
5.6q2
9f. U
nwan
ted se
xual
atten
tion
0.82.9
3.62.2
1.20.6
0.31.4
0.50.8
1.93.9
2.62.0
1.31.3
2.03.3
2.51.5
2.12.4
2.60.9
0.71.2
1.40.0
1.41.8
q29g
. Age
discr
imina
tion
2.52.8
5.41.9
2.04.4
1.92.1
1.72.1
3.43.1
2.62.6
2.52.6
3.33.0
2.92.3
3.63.7
2.22.7
2.21.4
2.81.2
1.72.8
Physi
cal w
ork f
acto
rsm
f<=
2425
-39
40-5
455
+Ag
ricM
anuf
Utils
Cons
tRe
tail
Hotel
Trans
Finan
cRl_
est
Puba
dEd
ucHe
alth
isco1
isco2
isco3
isco4
isco5
isco6
isco7
isco8
isco9
isco1
0se
lfem
p
q10a
. Vibr
ation
s35
.610
.126
.123
.725
.221
.438
.444
.234
.263
.214
.811
.623
.32.5
7.911
.55.3
9.215
.59.1
11.4
5.88.6
38.0
67.1
51.0
25.3
30.0
27.1
23.9
q10b
. Nois
e39
.118
.933
.829
.831
.025
.235
.449
.837
.860
.319
.829
.028
.64.4
11.1
17.8
31.8
12.2
22.1
20.3
20.5
11.6
17.6
34.9
65.8
55.1
29.2
38.2
27.3
30.8
q10c
. High
temp
eratu
res30
.717
.527
.424
.226
.220
.756
.234
.227
.742
.116
.038
.626
.96.4
11.2
19.9
10.8
16.3
15.7
11.1
14.9
11.5
22.7
60.2
44.2
41.8
29.4
33.4
28.4
24.1
q10d
. Low
temp
eratu
res29
.013
.322
.222
.622
.220
.159
.622
.426
.151
.919
.514
.328
.94.3
9.418
.39.1
8.716
.48.5
12.8
12.6
15.6
62.4
39.2
33.1
28.0
30.8
27.7
20.7
q10e
. Brea
thing
in sm
oke,
fumes
, pow
der o
r dus
t etc
28.3
7.620
.918
.420
.116
.930
.533
.327
.148
.913
.111
.719
.22.0
6.911
.44.3
5.211
.56.3
10.4
5.78.4
30.7
53.4
35.7
19.2
26.2
20.7
18.9
q10f.
Brea
thing
in va
pour
s suc
h as s
olven
ts an
d thin
ners
15.0
6.512
.011
.111
.89.4
7.820
.312
.328
.77.9
4.26.4
1.55.5
6.72.8
8.77.6
5.77.0
2.96.2
6.631
.817
.512
.016
.210
.911
.5q1
0g. H
andli
ng ch
emica
l sub
stanc
es16
.911
.413
.314
.715
.511
.621
.220
.815
.627
.69.7
9.95.3
1.28.2
9.64.5
22.1
9.78.8
12.4
3.110
.124
.329
.018
.319
.918
.216
.914
.1q1
0h. R
adiat
ion6.2
2.84.1
5.24.7
3.71.8
7.35.6
7.93.2
0.94.0
1.12.5
3.81.3
13.0
2.05.9
5.61.4
1.91.6
10.9
6.12.9
5.63.4
4.9q1
0i. To
bacc
o smo
ke fr
om ot
her p
eople
24.9
14.1
27.8
20.3
18.7
16.6
15.6
20.7
19.7
37.5
18.8
50.0
19.6
9.411
.622
.78.0
13.0
19.0
10.7
16.1
16.0
23.3
17.0
31.4
24.0
20.9
39.6
19.1
20.0
q10j.
Infec
tious
mate
rials
8.110
.78.0
9.59.8
8.114
.46.7
10.7
9.33.7
5.44.3
0.64.2
7.75.7
45.4
4.613
.613
.62.1
7.715
.79.5
7.010
.210
.88.2
9.4q1
1a. T
iring o
r pain
ful po
sition
s48
.242
.046
.043
.447
.544
.875
.750
.448
.769
.842
.551
.343
.021
.427
.334
.826
.448
.735
.928
.236
.629
.141
.783
.369
.759
.554
.837
.254
.843
.5q1
1b. L
ifting
or m
oving
peop
le5.8
11.1
6.88.9
8.46.4
5.62.9
2.06.9
2.54.4
4.41.2
2.310
.410
.943
.42.6
11.2
13.0
2.412
.36.2
5.54.9
9.915
.05.5
8.7q1
1c. C
arryin
g or m
oving
heav
y loa
ds43
.025
.041
.934
.434
.831
.367
.141
.732
.964
.242
.447
.834
.54.0
13.2
17.5
11.1
27.7
29.7
11.2
18.6
15.2
34.1
72.7
65.0
51.9
48.7
27.5
44.7
33.1
q11d
. Stan
ding o
r walk
ing75
.170
.178
.772
.071
.972
.591
.576
.669
.185
.378
.293
.054
.334
.848
.457
.182
.279
.769
.362
.864
.846
.385
.096
.289
.164
.789
.079
.977
.372
.0q1
1e. R
epeti
tive h
and o
r arm
mov
emen
ts62
.562
.066
.161
.962
.559
.179
.068
.963
.576
.259
.477
.363
.949
.755
.851
.343
.654
.650
.945
.150
.256
.960
.783
.281
.176
.574
.943
.564
.561
.7q1
1m. W
earin
g pers
onal
prot
ectiv
e clot
hing o
r equ
ipmen
t42
.423
.537
.834
.433
.730
.536
.349
.457
.567
.124
.826
.826
.73.3
16.8
26.2
11.2
51.2
20.1
24.3
27.1
12.5
26.9
35.5
68.8
51.0
38.4
56.2
28.5
35.4

Sex
Age
Secto
r: NAC
E main
code
sOc
cupa
tion:
1st-l
evel
ISCO
code
sTy
pe of
emplo
ymen
t
Infor
matio
n and
comm
unica
tion
mf
<= 24
25-3
940
-54
55+
Agric
Man
ufUt
ilsCo
nst
Retai
lHo
telTra
nsFin
anc
Rl_es
tPu
bad
Educ
Healt
hisc
o1isc
o2isc
o3isc
o4isc
o5isc
o6isc
o7isc
o8isc
o9isc
o10
self
emp
q30b
. Con
sulte
d abo
ut ch
ange
s in w
ork o
rgan
isatio
n etc
47.1
47.2
38.9
48.8
48.0
47.2
42.9
43.4
47.7
41.8
44.8
45.2
48.6
55.5
49.5
49.9
56.8
56.2
67.3
61.2
53.4
48.0
43.7
31.9
38.4
35.4
36.0
45.3
na47
.1q3
0c. S
ubjec
t to r
egula
r for
mal a
ssessm
ent o
f perf
orma
nce
41.6
38.1
38.4
41.5
40.7
34.2
26.9
37.3
44.1
38.2
39.2
30.0
46.6
58.7
38.6
47.2
42.4
46.6
48.4
49.6
42.9
43.6
34.3
25.8
37.8
34.6
29.7
53.7
na40
.0q1
2. W
ell-in
forme
d abo
ut he
alth a
nd sa
fety r
isks
84.2
81.8
80.1
82.5
84.2
84.7
76.5
84.5
87.7
84.3
82.7
78.9
82.0
85.2
82.3
85.3
82.5
88.8
87.5
87.3
87.1
82.5
81.4
74.3
82.7
83.8
75.4
95.8
83.5
83.5
Healt
hm
f<=
2425
-39
40-5
455
+Ag
ricM
anuf
Utils
Cons
tRe
tail
Hotel
Trans
Finan
cRl_
est
Puba
dEd
ucHe
alth
isco1
isco2
isco3
isco4
isco5
isco6
isco7
isco8
isco9
isco1
0se
lfem
p
q32.
Cons
ider h
ealth
or sa
fety a
t risk
beca
use o
f wo
rk33
.722
.423
.829
.530
.524
.952
.632
.530
.743
.319
.526
.835
.213
.919
.629
.019
.534
.622
.022
.119
.616
.425
.462
.244
.145
.426
.639
.935
.527
.3q3
3. W
ork a
ffects
healt
h38
.132
.126
.135
.738
.833
.061
.439
.733
.944
.327
.633
.237
.921
.226
.930
.635
.739
.132
.432
.227
.124
.329
.570
.447
.949
.232
.935
.842
.834
.0q3
3a_a
… he
aring
prob
lems
9.93.9
5.56.3
8.86.7
13.3
14.0
11.0
12.2
2.84.3
9.20.7
2.24.3
7.32.2
4.04.4
3.22.8
2.912
.117
.617
.25.7
11.9
6.97.3
q33a
_b...
prob
lems w
ith yo
ur vi
sion
8.47.0
3.77.2
9.97.0
11.2
11.6
8.98.6
4.42.5
9.66.5
9.29.6
6.75.1
4.58.7
6.89.4
3.611
.312
.310
.74.8
2.18.6
7.6q3
3a_c
... sk
in pr
oblem
s7.4
5.55.7
7.36.7
4.914
.58.2
9.212
.33.8
5.94.0
1.23.1
3.93.6
9.92.5
4.34.7
2.25.3
14.3
13.9
9.57.3
2.77.3
6.4q3
3a_d
… ba
ckac
he26
.622
.317
.724
.327
.324
.250
.527
.524
.436
.519
.922
.328
.412
.016
.519
.516
.826
.317
.916
.817
.715
.820
.159
.737
.437
.626
.121
.131
.323
.3q3
3a_e
.. hea
dach
es15
.116
.011
.016
.217
.013
.227
.717
.316
.815
.211
.912
.915
.88.8
12.4
13.7
20.2
18.0
11.8
16.9
12.0
12.1
13.0
32.4
18.7
21.3
13.6
13.0
18.9
14.8
q33a
_f…
stom
ach a
che
6.25.3
3.16.1
6.84.9
12.3
6.06.6
5.93.4
5.07.5
4.94.2
7.37.4
4.54.6
5.24.3
4.74.9
13.3
7.28.7
5.18.1
7.55.5
q33a
_g…
mus
cular
pains
24.3
20.8
16.5
22.1
25.4
22.8
50.5
25.5
25.6
32.5
18.1
20.4
24.7
11.7
15.3
17.2
15.9
24.3
16.9
15.4
15.8
14.2
18.7
57.6
35.3
34.0
24.1
13.2
29.9
21.4
q33a
_h…
resp
irato
ry dif
ficult
ies6.1
3.14.9
4.34.9
5.411
.38.0
5.89.6
2.35.0
2.80.6
1.72.9
2.52.7
2.92.0
2.41.6
2.712
.711
.08.3
4.69.1
5.74.5
q33a
_i… he
art di
seas
e2.9
1.80.7
1.72.8
4.99.6
2.92.4
2.00.9
1.12.4
0.21.7
2.72.6
1.91.7
2.21.5
0.91.7
11.9
3.43.0
1.91.2
4.62.0
q33a
_j...in
jury(i
es)
13.0
5.69.3
10.4
9.78.2
23.7
12.7
16.9
21.0
5.38.9
9.71.0
3.38.7
3.610
.25.1
4.36.1
2.76.8
25.6
22.1
15.6
9.913
.612
.89.1
q33a
_k...s
tress
23.3
21.0
14.1
23.7
24.7
18.4
30.0
23.8
22.9
22.9
16.5
23.2
24.7
14.7
18.4
22.6
28.5
29.4
22.2
25.5
19.3
16.5
19.6
32.1
26.2
29.3
17.7
21.7
25.6
21.8
q33a
_l...o
veral
l fatig
ue24
.220
.515
.823
.024
.521
.749
.025
.523
.128
.715
.923
.023
.713
.913
.918
.223
.625
.020
.320
.315
.814
.017
.255
.431
.033
.321
.219
.129
.721
.1q3
3a_m
...slee
ping p
roble
ms8.9
8.54.1
8.610
.18.8
14.9
9.46.8
4.95.5
8.513
.36.9
7.510
.111
.412
.99.6
10.1
7.16.5
7.415
.97.7
14.4
6.68.0
10.4
8.4q3
3a_n
...alle
rgies
4.04.0
3.04.2
4.43.3
9.16.0
3.84.4
1.73.4
1.50.6
2.23.3
3.46.5
2.03.3
2.71.5
3.09.6
7.85.5
4.31.2
5.03.8
q33a
_o...a
nxiet
y7.7
8.02.8
8.09.4
7.310
.37.6
7.26.1
5.07.3
7.06.0
8.010
.913
.711
.47.9
10.7
7.36.9
7.310
.07.0
7.66.5
9.79.1
7.7q3
3a_p
... Irr
itabil
ity11
.19.7
5.311
.112
.18.7
11.1
10.6
11.1
9.97.1
12.6
13.6
6.38.6
12.4
15.6
15.2
10.8
12.3
9.38.8
9.811
.111
.114
.07.9
12.5
11.2
10.4
q35.
Able
to do
same
job w
hen 6
058
.458
.043
.654
.262
.477
.554
.254
.165
.250
.361
.142
.354
.474
.464
.958
.361
.760
.469
.370
.666
.765
.654
.352
.947
.448
.444
.732
.365
.757
.1q3
4a_d
. Abs
ent f
or he
alth p
roble
ms in
prev
ious y
ear
22.0
23.9
20.0
22.8
24.1
22.4
14.4
26.1
26.4
21.5
19.5
18.9
25.0
22.6
18.2
30.9
29.9
25.5
15.9
26.3
26.5
24.0
21.8
16.2
24.0
23.1
20.6
19.1
12.4
25.2
q34b
_ef. A
verag
e day
s hea
lth-re
lated
abse
nce i
n prev
ious y
ear
4.25.0
2.33.9
5.85.1
3.15.1
4.44.2
2.92.7
5.54.5
3.68.2
5.15.2
1.84.7
4.14.3
5.03.5
5.65.3
4.96.7
2.65.0
Wor
k and
fami
ly life
mf
<= 24
25-3
940
-54
55+
Agric
Man
ufUt
ilsCo
nst
Retai
lHo
telTra
nsFin
anc
Rl_es
tPu
bad
Educ
Healt
hisc
o1isc
o2isc
o3isc
o4isc
o5isc
o6isc
o7isc
o8isc
o9isc
o10
self
emp
Q18.
Wor
king h
ours
fit fa
mily
/ soc
ial co
mmitm
ents
well o
r very
well
76.6
83.0
79.8
76.7
80.1
84.7
71.3
79.2
89.0
78.1
76.8
70.4
71.5
86.4
81.7
79.9
90.1
79.6
74.5
84.2
85.3
86.3
73.3
70.6
78.2
70.2
81.2
70.0
72.6
80.8
q19.
Cont
acted
abou
t wor
k out
side n
orma
l wor
king h
ours
26.3
16.8
16.5
24.1
22.2
21.2
16.8
17.2
21.5
30.3
17.5
20.4
28.2
27.9
32.6
18.1
23.4
21.2
37.5
33.5
24.5
16.4
20.7
11.1
18.1
16.3
13.9
15.3
30.3
20.7
ef4c.
Carin
g for
and e
duca
ting y
our c
hildr
en ev
ery da
y for
an ho
ur or
mor
e21
.238
.25.2
39.8
32.8
6.624
.427
.226
.918
.927
.724
.426
.336
.327
.432
.039
.738
.230
.533
.630
.333
.028
.325
.121
.024
.829
.324
.025
.429
.6ef4
d. Co
oking
and h
ouse
work
22.8
75.8
28.1
49.8
49.9
42.9
41.4
37.5
35.6
24.9
49.3
43.6
34.5
45.3
44.6
52.4
69.9
66.6
37.1
54.3
53.3
59.2
54.9
43.0
26.2
28.8
52.5
22.7
37.3
48.2
Job s
atisfa
ction
mf
<= 24
25-3
940
-54
55+
Agric
Man
ufUt
ilsCo
nst
Retai
lHo
telTra
nsFin
anc
Rl_es
tPu
bad
Educ
Healt
hisc
o1isc
o2isc
o3isc
o4isc
o5isc
o6isc
o7isc
o8isc
o9isc
o10
self
emp
q36.
Satis
fied o
r very
satis
fied w
ith w
orkin
g con
dition
s81
.483
.579
.682
.282
.485
.363
.879
.191
.481
.483
.975
.681
.390
.886
.784
.486
.984
.788
.489
.888
.485
.881
.359
.979
.573
.976
.383
.783
.682
.4q3
7a_e
f. I m
ight lo
se m
y job
in th
e nex
t 6 m
onth
s13
.813
.519
.415
.012
.19.2
12.5
16.4
14.3
17.7
15.1
20.2
14.9
7.614
.67.4
7.09.1
5.99.3
11.9
15.2
14.3
9.517
.019
.818
.98.1
7.114
.9q3
7b_e
f. I am
well
paid
for th
e wor
k I do
45.7
40.2
41.8
43.5
43.3
44.0
21.2
42.1
51.2
51.8
42.0
38.5
43.2
64.5
53.2
48.9
38.8
37.1
55.6
50.1
48.3
46.2
40.5
15.5
42.9
35.0
34.6
51.2
44.2
43.4
q37c
_ef. M
y job
offer
s goo
d pro
spec
ts for
caree
r adv
ance
ment
33
.128
.339
.737
.526
.317
.68.5
27.4
45.4
33.2
26.9
25.0
30.1
55.9
45.7
41.7
27.6
33.9
42.1
46.4
39.6
34.1
30.1
6.725
.813
.715
.356
.930
.031
.3
Struc
ture
of wo
rkfor
ceQ2
d_ef.
Senio
rity (
mean
years
)10
.68.6
1.65.8
12.9
19.0
16.1
10.8
11.7
9.07.7
5.310
.211
.06.7
12.7
11.0
9.912
.29.9
10.1
9.47.2
17.6
10.1
9.47.3
14.0
13.1
9.1
Wor
king t
ime
mf
<= 24
25-3
940
-54
55+
Agric
Man
ufUt
ilsCo
nst
Retai
lHo
telTra
nsFin
anc
Rl_es
tPu
bad
Educ
Healt
hisc
o1isc
o2isc
o3isc
o4isc
o5isc
o6isc
o7isc
o8isc
o9isc
o10
self
emp
q8a_
ef. M
ean u
sual
week
ly wo
rking
hour
s41
.734
.735
.539
.039
.437
.849
.240
.540
.142
.538
.539
.139
.937
.437
.238
.130
.734
.246
.336
.136
.935
.535
.851
.441
.241
.934
.541
.346
.437
.2Q8
b. %
usua
lly w
orkin
g five
days
per w
eek
67.3
62.3
58.1
67.3
67.4
57.9
24.5
77.2
80.8
74.7
50.7
33.1
67.2
78.2
71.7
78.3
77.0
63.7
52.9
73.8
76.0
73.7
50.0
17.9
74.5
71.1
58.0
78.5
32.0
72.0
Q9a.
% w
ith m
ore t
han o
ne jo
b6.3
6.16.6
6.85.9
4.95.9
4.45.0
4.85.2
6.45.8
5.59.1
6.29.0
7.34.9
8.76.3
4.76.4
4.75.6
5.07.6
4.07.1
5.9q1
3_ef.
Dail
y com
mutin
g tim
e (ret
urn,
in mi
nutes
)43
.339
.536
.343
.142
.639
.136
.241
.549
.949
.635
.632
.443
.455
.145
.645
.038
.640
.641
.046
.843
.242
.337
.533
.345
.540
.735
.845
.630
.343
.6q1
4e_e
f. Lon
g wor
king d
ays
22.4
10.0
10.4
18.1
17.1
18.3
43.6
12.5
14.7
16.6
15.2
28.6
25.2
13.6
18.8
14.9
8.815
.337
.215
.612
.15.6
16.8
50.8
13.8
20.2
11.2
26.0
39.1
12.7
q16a
_a. W
ork s
ame n
umbe
r of h
ours
each
day
55.8
61.7
63.8
58.4
57.9
55.1
37.1
69.6
70.6
58.8
60.5
49.5
48.7
61.5
54.5
64.5
46.5
57.0
44.8
46.3
58.0
71.0
56.2
29.5
66.6
63.8
69.4
63.4
36.4
63.3
q16a
_b. W
ork s
ame n
umbe
r of d
ays e
ach w
eek
71.9
76.6
73.5
74.2
74.2
73.3
60.3
78.7
78.9
74.1
73.5
67.9
64.0
81.7
74.2
78.2
85.5
63.2
66.0
75.4
75.3
85.0
66.3
60.2
78.5
70.7
75.9
70.2
58.8
77.5
q16a
_c. W
ork f
ixed s
tartin
g and
finish
ing tim
es55
.767
.063
.461
.960
.954
.627
.569
.970
.957
.365
.150
.553
.758
.451
.163
.568
.063
.939
.454
.761
.973
.662
.222
.166
.966
.070
.360
.429
.467
.6q1
6a_d
. Wor
k shif
ts17
.217
.420
.719
.116
.710
.54.5
25.8
17.4
5.316
.329
.924
.16.2
9.517
.78.0
35.5
8.811
.614
.313
.426
.92.6
17.6
34.5
19.2
19.2
5.719
.8q1
7a. %
with
less
flexib
le sch
edule
s 63
.467
.677
.167
.163
.852
.830
.974
.471
.965
.066
.263
.570
.848
.551
.868
.680
.370
.433
.458
.862
.073
.370
.220
.576
.083
.375
.589
.115
.475
.9
Stat
isti
cal a
nn
ex k
eyIn
gen
eral
, per
cent
ages
ref
er t
o pr
opor
tion
of r
espo
nden
ts a
nsw
erin
g po
stiv
ely
with
don
’t k
now
s / r
efus
als
omitt
ed f
rom
cal
cula
tions
.
For
the
follo
win
g qu
estio
ns, d
iffer
ent
answ
er c
ateg
orie
s ha
ve b
een
com
bine
d as
indi
cate
d: Q
10*:
¼ o
f th
e tim
e or
mor
e; Q
11*:
¼ o
f th
e tim
e or
mor
e; Q
12: w
ell i
nfor
med
or
very
wel
l inf
orm
ed; Q
14e_
ef: %
wor
king
mor
e th
an 1
0 hr
s a
day
mor
e th
an f
ive
times
per
mon
th. Q
18:
wel
l or
very
wel
l; Q
19: a
cou
ple
oftim
es a
mon
th o
r m
ore;
Q20
b_*:
¼ o
f th
e tim
e or
mor
e; Q
22a:
ver
y of
ten
or f
airly
oft
en; Q
25*:
oft
en o
r al
mos
t al
way
s; Q
34b_
ef: m
ean
no.
of d
ays
for
all r
espo
nden
ts; Q
35:
yes,
I th
ink
so;
Q37
*: a
gree
or
stro
ngly
agr
ee;
EF4*
: ev
ery
day
for
one
hour
or
mor
e. Q
37*.
agr
ee o
r st
rong
ly a
gree
.
NA
CE
cod
es:A
gric
=ag
ricul
ture
and
fis
herie
s; M
anuf
=M
anuf
actu
re a
nd m
inin
g; U
tils=
elec
tric
ity,g
as a
nd w
ater
sup
ply;
Con
st=
Con
stru
ctio
n; R
etai
l=w
hole
sale
and
ret
ail t
rade
; Hot
el=
hote
ls a
nd r
esta
uran
ts; T
rans
=tr
ansp
ort
and
com
mun
icat
ions
; Fin
anc=
finan
cial
inte
rmed
iatio
n; R
l_es
t=re
al e
stat
e; P
ubad
=pu
blic
adm
inis
trat
ion
and
defe
nce;
Edu
c=ed
ucat
ion.
ISC
O c
odes
: isc
o1=
legi
slat
ors,
sen
ior
offic
ials
and
man
ager
s; is
co2=
prof
essi
onal
s; is
co3=
tech
nici
ans
and
asso
ciat
e pr
ofes
sion
als;
isco
4=cl
erks
; isc
o5=
serv
ice,
sho
p an
d m
arke
t sa
les
wor
kers
; isc
o6=
skill
ed a
gric
ultu
ral a
nd f
ishe
ry w
orke
rs; i
sco7
=cr
aft
and
rela
ted
trad
es w
orke
rs;
isco
8 =
pla
nt a
nd m
achi
ne o
pera
tors
and
ass
embl
ers;
isco
9=el
emen
tary
occ
upat
ions
; isc
o0=
arm
ed f
orce
s. T
ype
of e
mpl
oym
ent:
Sel
f=se
lf-em
ploy
ed; e
mp=
empl
oyee
.
Co
un
try
gro
up
s:N
MS=
ten
Mem
ber
Stat
es t
hat
join
ed E
U o
n 1
May
200
4. N
M2=
tw
o M
embe
r St
ates
tha
t jo
ined
EU
on
1 Ja
n 20
07. C
C2=
Can
dida
te c
ount
ries,
Cro
atia
and
Tur
key.
102
Fourth European Working Conditions Survey

Coun
try
data
Place
of w
ork a
nd w
ork o
rgan
isatio
nNo
te: se
e stat
istica
l ann
ex ke
y on p
reviou
s pag
e for
Coun
try gr
oups
Coun
tries
interp
retati
on of
data
and c
atego
ries
EU27
EU25
EU15
NMS
NM2
CC2
BEBG
CZDK
DEEE
ELES
FRIE
ITCY
LVLT
LUHU
MT
NLAT
PLPT
ROSI
SKFI
SVUK
HRTR
NOCH
q11f.
Wor
king a
t com
pany
/ or
g. pr
emise
s72
.873
.173
.571
.168
.062
.074
.877
.081
.987
.178
.687
.452
.664
.275
.779
.463
.439
.378
.775
.876
.949
.387
.263
.877
.869
.286
.464
.987
.284
.788
.288
.176
.683
.560
.381
.583
.6q1
1g. T
elewo
rking
from
home
8.38.7
8.410
.72.0
3.214
.71.9
18.7
16.0
8.514
.77.1
8.47.0
5.53.9
5.213
.77.8
7.83.6
3.114
.014
.210
.12.1
2.08.5
11.6
13.0
10.5
9.617
.32.1
11.6
8.3q1
1j. D
ealin
g dire
ctly w
ith pe
ople
who a
re no
t emp
loyee
s(eg.
custo
mers)
62.4
64.1
66.3
51.5
34.7
28.6
63.4
40.0
53.2
72.0
60.8
58.0
63.0
60.9
70.0
71.7
68.8
57.2
55.1
63.2
67.3
45.0
58.5
66.1
66.2
50.5
62.8
32.9
58.2
50.2
73.9
77.7
69.8
56.9
26.4
77.9
68.3
q11k
. Wor
king w
ith co
mput
ers45
.547
.349
.832
.916
.615
.656
.121
.939
.462
.353
.541
.029
.335
.953
.348
.941
.730
.830
.934
.658
.829
.445
.271
.650
.529
.635
.114
.951
.335
.962
.069
.650
.743
.313
.455
.958
.5q1
1l. U
sing i
ntern
et / e
mail f
or w
ork
36.0
37.6
39.5
26.4
11.0
12.6
45.8
14.9
33.3
54.3
39.3
36.9
22.0
30.4
42.0
36.9
35.5
23.3
26.2
31.7
46.1
21.3
37.5
55.5
43.0
23.3
26.6
9.840
.227
.351
.855
.541
.231
.711
.143
.249
.1q2
0a_a
. Sho
rt rep
etitiv
e tas
ks of
<1m
24.7
24.6
26.2
15.6
26.4
45.8
16.7
25.4
18.6
27.4
21.7
22.8
23.1
39.9
24.9
18.5
24.2
38.6
17.4
31.7
26.7
12.2
21.5
16.3
21.5
12.6
39.2
26.8
26.6
13.9
35.7
15.6
29.7
16.7
47.8
28.4
19.6
q20a
_b. S
hort
repeti
tive t
asks
of <
10m
39.0
38.9
40.4
30.1
41.2
52.1
25.7
39.8
37.6
46.9
42.8
38.4
35.0
47.8
35.4
28.2
40.8
44.6
29.6
46.1
34.8
25.7
37.6
44.8
35.4
25.7
46.5
41.7
40.9
32.5
60.2
38.1
36.6
33.8
53.4
31.8
30.7
q20b
_a. W
orkin
g at v
ery hi
gh sp
eed
59.6
59.7
61.1
51.5
57.3
71.3
60.5
27.2
60.4
75.5
72.2
57.0
73.3
60.0
49.7
42.0
66.6
72.5
39.5
48.9
56.8
64.4
59.5
60.9
72.4
42.8
51.2
67.1
75.2
57.0
77.7
85.0
46.7
23.2
74.7
78.4
71.6
q20b
_b. W
orkin
g to t
ight d
eadli
nes
61.8
61.9
62.4
59.1
59.9
68.9
62.1
53.6
71.2
68.8
70.9
59.6
68.4
55.1
54.3
57.3
59.2
68.8
51.0
57.8
56.3
58.5
69.6
61.2
68.5
56.0
53.0
62.0
67.3
54.7
73.6
71.7
63.5
43.6
70.6
64.8
66.3
q21a
. Pac
e of w
ork d
epen
dent
on co
lleag
ues
42.2
41.9
42.1
40.4
47.4
47.5
41.2
54.5
42.3
49.4
39.2
53.5
45.8
37.3
38.4
44.3
37.5
42.5
50.6
50.5
43.4
48.7
59.5
43.4
35.5
33.0
46.7
45.0
58.1
45.0
42.2
44.9
53.8
52.7
47.1
46.2
33.0
q21b
. Pac
e of w
ork d
epen
dent
on di
rect d
eman
ds fr
om cu
stome
rs etc
68.0
69.0
71.0
57.2
52.9
48.7
69.1
51.5
70.3
73.0
68.9
62.1
72.3
69.2
73.4
69.5
72.0
74.4
56.7
55.5
64.1
57.2
73.2
75.7
70.4
50.7
64.9
53.4
64.0
63.9
74.2
76.7
70.8
66.5
47.4
78.0
71.4
q21c
. Pac
e of w
ork d
epen
dent
on nu
meric
al pr
oduc
tion /
perfo
rm. ta
rgets
42.1
41.8
42.8
36.6
45.9
36.6
55.3
29.2
34.6
32.0
46.3
39.9
44.4
25.4
55.1
25.8
41.0
43.6
41.3
34.1
50.5
33.0
24.0
47.3
50.2
39.3
50.9
51.3
21.3
34.6
53.2
40.1
35.9
32.3
36.9
39.9
54.5
q21d
. Pac
e of w
ork d
epen
dent
on au
toma
ted eq
uipme
nt /
mach
ine18
.818
.718
.519
.420
.328
.119
.017
.323
.214
.619
.524
.318
.219
.517
.111
.419
.916
.821
.122
.314
.721
.416
.315
.621
.216
.325
.821
.222
.623
.019
.88.5
18.3
22.6
28.5
11.9
12.4
q21e
. Pac
e of w
ork d
epen
dent
on bo
ss35
.735
.334
.042
.342
.731
.032
.652
.743
.219
.831
.533
.242
.438
.735
.534
.425
.153
.147
.044
.635
.360
.454
.118
.331
.936
.447
.639
.434
.845
.715
.516
.447
.042
.930
.121
.024
.0q2
2a. H
ave t
o int
errup
t a ta
sk in
orde
r to t
ake o
n an u
nfores
een t
ask
32.7
33.3
34.8
24.6
22.7
14.0
45.7
16.7
19.3
50.3
23.7
21.7
38.7
22.4
37.9
44.6
30.3
36.2
19.4
24.5
42.1
23.0
42.0
53.1
32.4
26.7
34.5
24.6
30.7
22.7
52.1
48.2
45.1
32.7
12.7
51.9
44.6
q24a
. Can
choo
se /
chan
ge or
der o
f tas
ks63
.463
.664
.061
.160
.374
.172
.757
.758
.684
.852
.465
.158
.760
.072
.071
.360
.453
.463
.257
.271
.463
.285
.279
.265
.462
.457
.761
.160
.655
.481
.385
.366
.155
.975
.478
.273
.9q2
4b. C
an ch
oose
/ ch
ange
meth
ods o
f wor
k66
.967
.468
.262
.859
.080
.476
.354
.156
.480
.770
.670
.859
.654
.567
.969
.575
.555
.174
.468
.373
.365
.282
.873
.563
.262
.666
.360
.660
.862
.972
.689
.363
.460
.781
.882
.082
.4q2
4c. C
an ch
oose
/ ch
ange
spee
d of w
ork
69.2
69.0
68.9
69.8
71.9
86.9
72.0
60.3
60.0
81.2
62.2
79.7
73.7
62.2
70.1
75.8
78.8
69.2
81.0
82.8
76.0
75.4
85.0
74.7
72.8
69.5
64.1
75.6
72.5
65.0
73.7
65.6
68.5
63.0
88.6
76.6
76.1
q25a
. Can
get a
ssista
nce f
rom
colle
ague
s if a
sked
67.6
67.1
65.5
76.6
74.5
40.7
67.2
67.3
77.1
87.4
64.9
83.9
61.0
70.1
50.8
82.8
50.7
71.8
85.7
68.4
71.6
79.9
84.0
84.7
72.8
74.5
49.2
77.1
78.0
81.6
84.3
87.7
76.1
79.4
37.6
83.0
80.7
q25b
. Can
get a
ssista
nce f
rom
supe
riors
/ bos
s if a
sked
56.1
56.1
54.5
65.8
56.6
23.7
51.0
58.9
63.6
77.2
58.3
71.0
46.2
61.5
36.7
74.7
33.6
65.2
78.7
61.5
59.0
70.9
76.2
71.0
65.0
62.9
39.8
55.8
71.1
71.0
73.5
70.2
66.2
67.7
20.0
64.6
72.3
q25c
. Can
get e
xtern
al as
sistan
ce if
aske
d31
.632
.030
.640
.125
.710
.728
.826
.549
.155
.929
.534
.725
.633
.816
.347
.714
.322
.442
.344
.929
.737
.247
.451
.144
.137
.314
.125
.434
.949
.541
.541
.445
.440
.38.2
40.5
36.3
q25d
. Has
influ
ence
over
choic
e of w
orkin
g part
ners
24.2
23.7
23.5
24.6
33.2
41.3
29.0
24.8
20.2
36.4
17.9
23.6
35.5
24.2
23.4
28.6
20.3
30.8
28.8
21.4
28.2
23.8
29.0
37.6
29.0
27.6
18.9
36.2
21.6
16.2
27.0
30.2
23.0
26.7
42.5
30.2
33.9
q25e
. Can
take
brea
k whe
n wish
es44
.644
.444
.743
.247
.056
.547
.424
.435
.557
.726
.650
.350
.039
.752
.256
.647
.844
.153
.133
.459
.041
.842
.056
.850
.748
.142
.754
.239
.332
.662
.660
.250
.639
.857
.650
.759
.5q2
5f. H
as en
ough
time t
o get
the j
ob do
ne69
.669
.268
.772
.375
.867
.461
.387
.960
.367
.660
.579
.067
.973
.172
.671
.776
.167
.680
.277
.674
.079
.269
.964
.560
.074
.174
.971
.875
.963
.467
.968
.369
.579
.966
.569
.474
.6q2
6a. T
ask r
otati
on43
.743
.343
.343
.249
.335
.046
.751
.943
.368
.251
.146
.551
.030
.034
.347
.133
.945
.553
.734
.741
.427
.043
.662
.344
.745
.228
.448
.472
.246
.844
.556
.847
.854
.533
.653
.642
.6q2
6b. T
eamw
ork
55.2
55.0
54.6
57.0
58.4
47.1
60.7
61.9
58.4
57.7
59.1
73.0
52.2
40.0
46.4
65.4
38.5
49.8
69.2
64.7
64.9
46.7
68.6
75.2
56.0
54.7
46.4
57.3
84.8
61.2
71.5
69.5
68.9
62.9
46.0
72.1
59.1
q31.
Imme
diate
boss
is a w
oman
24.5
24.5
23.9
28.3
25.1
16.1
25.3
26.2
24.0
29.3
18.2
37.5
19.7
21.0
25.2
29.8
17.5
14.8
31.1
34.1
19.5
30.6
21.0
21.7
22.8
28.0
26.9
24.6
33.1
26.8
39.0
33.3
33.1
25.1
14.8
32.4
20.3
Job c
onten
t and
train
ingCo
untry
grou
psCo
untri
es
EU27
EU25
EU15
NMS
NM2
CC2
BEBG
CZDK
DEEE
ELES
FRIE
ITCY
LVLT
LUHU
MT
NLAT
PLPT
ROSI
SKFI
SVUK
HRTR
NOCH
q23a
. Mee
ting p
recise
quali
ty sta
ndard
s74
.274
.775
.072
.866
.276
.173
.360
.469
.379
.471
.467
.358
.274
.276
.172
.876
.868
.171
.558
.673
.183
.473
.776
.482
.473
.781
.668
.066
.969
.678
.457
.179
.971
.076
.495
.277
.4q2
3b. A
ssessi
ng qu
ality
of ow
n wor
k71
.872
.672
.970
.558
.880
.069
.355
.773
.988
.764
.886
.868
.564
.283
.074
.077
.064
.583
.973
.677
.948
.282
.072
.778
.576
.776
.059
.869
.552
.175
.677
.774
.379
.080
.187
.585
.5q2
3c. S
olving
unfor
esee
n pro
blems
80.8
81.3
81.4
80.8
73.2
77.8
85.7
72.6
80.1
93.2
77.4
85.2
75.0
79.6
86.0
78.9
79.6
71.9
71.7
68.7
84.4
80.8
89.1
93.9
83.0
83.6
80.4
73.3
82.6
75.1
81.7
96.1
78.5
80.6
77.6
94.3
88.6
q23d
. Mon
oton
ous t
asks
42.9
43.0
41.9
49.0
41.9
63.8
31.4
58.1
55.6
43.8
28.5
56.2
58.1
63.5
40.8
46.3
39.5
44.1
39.6
52.8
37.2
36.6
25.4
22.7
26.4
52.0
49.9
36.7
39.5
44.6
48.0
23.1
55.0
62.0
64.0
25.4
22.9
q23e
. Com
plex t
asks
59.4
59.5
59.0
62.4
57.7
47.4
52.3
66.2
67.7
74.6
71.6
62.3
57.0
39.9
57.2
55.0
51.7
50.2
58.2
58.5
63.1
75.6
50.8
65.0
82.9
58.2
54.9
55.0
61.3
61.9
74.5
66.6
56.1
75.0
45.5
64.3
73.8
q23f.
Learn
ing ne
w th
ings
69.1
69.8
70.2
67.3
58.0
66.2
74.4
55.8
70.5
86.4
66.1
78.0
61.9
60.0
72.3
76.9
71.9
64.5
67.3
56.6
75.2
59.2
79.1
83.6
76.8
68.2
69.1
58.8
80.1
66.9
90.0
89.3
68.6
72.8
65.8
87.7
85.6
q25j.
Able
to ap
ply ow
n ide
as in
wor
k58
.458
.359
.154
.060
.464
.764
.157
.557
.572
.049
.854
.256
.857
.364
.568
.158
.460
.066
.046
.064
.157
.880
.070
.860
.251
.362
.161
.464
.448
.964
.373
.159
.056
.565
.370
.566
.3q2
7. Jo
b-sk
ills m
atch:
need
mor
e trai
ning
13.1
13.3
13.0
14.9
10.0
14.3
11.0
5.512
.213
.821
.820
.114
.17.6
10.5
8.814
.37.5
14.5
21.8
14.2
12.6
12.9
10.2
28.9
16.7
10.2
11.5
11.8
10.6
15.0
6.16.9
13.3
14.4
14.3
19.5
q27.
Job-
skills
matc
h: co
rresp
ond w
ell52
.352
.552
.254
.348
.350
.260
.763
.665
.852
.950
.648
.346
.557
.244
.047
.457
.951
.154
.654
.448
.446
.955
.056
.446
.852
.962
.543
.354
.353
.462
.652
.750
.143
.450
.657
.549
.4q2
7. Jo
b-sk
ills m
atch:
could
cope
with
mor
e dem
andin
g dut
ies34
.634
.234
.830
.941
.735
.528
.230
.922
.033
.327
.731
.739
.535
.245
.643
.827
.841
.430
.923
.837
.440
.532
.133
.424
.430
.427
.345
.233
.936
.022
.341
.243
.043
.334
.928
.231
.0q2
8a_1
. Has
unde
rgon
e paid
-for t
rainin
g in p
reviou
s 12 m
onth
s26
.127
.127
.325
.610
.26.7
40.5
7.626
.636
.325
.329
.813
.118
.924
.437
.316
.919
.522
.022
.737
.015
.835
.231
.637
.526
.315
.111
.038
.034
.052
.651
.038
.622
.85.6
43.0
45.4
Violen
ce, h
arassm
ent a
nd di
scrim
inatio
nCo
untry
grou
psCo
untri
es
EU27
EU25
EU15
NMS
NM2
CC2
BEBG
CZDK
DEEE
ELES
FRIE
ITCY
LVLT
LUHU
MT
NLAT
PLPT
ROSI
SKFI
SVUK
HRTR
NOCH
q29a
. Thr
eats
of ph
ysica
l viol
ence
6.06.1
6.35.2
3.74.4
8.32.9
5.55.0
4.56.6
4.54.7
6.97.9
1.42.2
4.34.7
5.72.7
6.012
.24.6
6.24.4
4.06.3
3.612
.59.7
10.9
6.54.2
7.24.4
q29b
. Phy
sical
violen
ce fr
om co
lleag
ues
1.81.9
2.10.8
1.22.5
3.40.7
0.93.1
0.50.9
1.61.0
2.83.2
0.80.8
0.41.0
1.80.4
1.06.3
1.80.9
0.71.3
1.00.5
1.54.0
3.62.5
2.50.9
0.8q2
9c. P
hysic
al vio
lence
from
othe
r peo
ple4.3
4.44.6
3.53.1
3.65.2
1.73.5
2.43.5
4.52.5
3.77.1
5.61.0
1.75.1
2.74.4
1.32.9
6.62.6
3.93.7
3.63.9
4.57.1
3.27.2
5.13.4
5.43.4
q29d
. Bull
ying /
haras
smen
t5.1
5.15.4
3.84.0
5.28.5
1.82.9
7.34.1
6.59.2
2.87.7
9.02.3
3.04.6
10.1
11.3
3.08.0
12.0
5.03.2
3.64.7
7.43.6
17.2
3.45.4
8.25.0
4.87.1
q29f.
Unw
anted
sexu
al att
entio
n1.8
1.81.7
2.21.4
2.41.9
1.14.8
2.81.1
2.22.0
0.71.5
2.20.9
0.81.1
2.81.5
0.93.2
1.41.8
1.81.8
1.62.8
1.22.1
2.53.6
2.82.4
3.41.1
q29g
. Age
discr
imina
tion
2.72.7
2.63.2
2.72.9
2.91.6
5.72.0
2.92.3
4.20.4
2.44.2
2.62.8
1.34.9
3.72.9
3.03.6
3.22.3
2.23.1
3.53.9
3.54.1
2.52.9
2.92.2
3.9
Physi
cal w
ork f
acto
rsCo
untry
grou
psCo
untri
es
EU27
EU25
EU15
NMS
NM2
CC2
BEBG
CZDK
DEEE
ELES
FRIE
ITCY
LVLT
LUHU
MT
NLAT
PLPT
ROSI
SKFI
SVUK
HRTR
NOCH
q10a
. Vibr
ation
s24
.224
.223
.130
.125
.425
.718
.724
.825
.416
.828
.833
.630
.626
.821
.820
.124
.428
.431
.731
.818
.834
.223
.115
.924
.331
.233
.325
.629
.224
.121
.615
.115
.429
.125
.414
.017
.6q1
0b. N
oise
30.1
30.2
28.7
38.8
28.0
29.1
25.2
33.3
33.0
30.0
32.9
39.4
34.9
31.0
31.9
25.7
23.9
25.3
37.4
40.0
23.4
38.2
28.6
20.0
24.3
41.6
31.9
26.2
40.1
36.3
37.0
34.2
23.7
33.9
28.7
24.2
21.9
q10c
. High
temp
eratu
res24
.923
.923
.426
.441
.136
.022
.929
.122
.520
.523
.714
.044
.532
.026
.714
.618
.936
.718
.917
.723
.126
.632
.523
.622
.929
.425
.445
.027
.624
.324
.917
.916
.429
.936
.414
.122
.4q1
0d. L
ow te
mpera
tures
22.0
21.1
20.4
25.5
36.1
39.3
16.4
28.6
21.3
19.9
18.3
28.1
39.0
28.6
23.9
15.3
13.6
32.7
27.7
30.6
21.7
22.3
23.6
17.0
15.8
27.3
19.3
38.6
26.0
22.1
25.9
19.2
19.7
26.3
40.3
18.6
20.3
q10e
. Brea
thing
in sm
oke,
fumes
, pow
der o
r dus
t etc
19.1
18.6
17.6
24.6
27.7
38.0
15.0
23.3
23.9
13.2
19.3
27.5
27.3
20.1
19.9
14.2
15.6
17.9
27.9
26.3
16.4
23.8
26.7
13.7
18.7
23.9
24.8
29.1
25.6
28.5
24.4
18.4
11.7
29.6
38.6
12.8
18.6
q10f.
Brea
thing
in va
pour
s suc
h as s
olven
ts an
d thin
ners
11.2
11.2
10.9
13.0
11.9
9.48.8
14.1
16.6
4.513
.812
.311
.314
.713
.56.3
9.19.1
12.3
17.5
7.313
.012
.36.7
11.9
11.0
13.6
11.2
13.0
16.3
14.4
6.26.0
17.1
8.96.3
9.0q1
0g. H
andli
ng ch
emica
l sub
stanc
es14
.514
.413
.917
.216
.317
.411
.915
.215
.510
.215
.515
.918
.213
.716
.611
.511
.79.6
16.5
19.9
10.5
16.3
17.3
8.712
.617
.814
.416
.719
.817
.323
.316
.011
.816
.817
.412
.613
.5q1
0h. R
adiat
ion4.6
4.64.7
4.64.7
4.23.3
3.35.3
3.66.8
4.25.4
5.73.7
4.03.1
5.64.8
5.13.3
3.98.5
4.25.1
4.05.4
5.27.8
5.46.2
6.83.1
5.34.2
4.44.5
q10i.
Toba
cco s
moke
from
othe
r peo
ple20
.119
.919
.720
.922
.428
.818
.614
.420
.427
.525
.627
.237
.228
.219
.95.8
9.119
.028
.927
.517
.222
.915
.915
.622
.619
.929
.025
.017
.516
.911
.36.7
14.7
35.9
28.2
8.613
.8q1
0j. In
fectio
us m
ateria
ls9.2
8.99.0
8.015
.69.6
10.9
5.07.6
9.110
.58.7
11.5
9.49.9
9.23.7
5.611
.313
.19.8
8.913
.110
.46.6
6.28.3
19.0
9.813
.015
.814
.58.2
9.69.6
12.8
9.9q1
1a. T
iring o
r pain
ful po
sition
s45
.544
.744
.446
.457
.768
.039
.445
.930
.033
.546
.450
.966
.248
.252
.831
.648
.959
.648
.547
.243
.653
.244
.224
.850
.151
.057
.161
.551
.833
.245
.243
.630
.658
.868
.728
.234
.9q1
1b. L
ifting
or m
oving
peop
le8.1
8.18.7
4.89.4
6.510
.73.6
8.66.0
6.95.0
5.712
.410
.99.0
3.95.9
4.55.9
6.85.5
7.96.6
7.13.1
6.611
.35.1
4.811
.412
.111
.16.6
6.512
.76.0
q11c
. Carr
ying o
r mov
ing he
avy l
oads
35.0
34.5
33.9
38.0
42.8
50.2
30.6
36.0
31.2
29.8
31.8
39.7
41.3
40.7
39.2
32.1
28.5
29.8
41.4
41.9
25.6
36.3
36.0
22.0
35.9
40.8
37.0
45.1
35.0
36.1
38.5
36.7
33.9
37.4
51.1
28.5
26.9
q11d
. Stan
ding o
r walk
ing72
.972
.672
.971
.076
.979
.867
.171
.059
.673
.573
.572
.875
.072
.874
.972
.074
.162
.174
.180
.464
.770
.570
.259
.172
.973
.180
.078
.872
.775
.379
.477
.671
.677
.280
.072
.373
.3q1
1e. R
epeti
tive h
and o
r arm
mov
emen
ts62
.361
.561
.561
.574
.976
.852
.467
.666
.661
.256
.965
.476
.864
.560
.751
.564
.664
.559
.169
.354
.162
.351
.160
.757
.258
.174
.277
.264
.364
.779
.664
.260
.069
.977
.359
.041
.5q1
1m. W
earin
g pers
onal
prot
ectiv
e clot
hing o
r equ
ipmen
t34
.033
.632
.042
.839
.619
.328
.726
.647
.925
.934
.738
.118
.531
.227
.842
.532
.317
.440
.839
.327
.936
.542
.025
.724
.242
.741
.443
.752
.448
.442
.532
.535
.346
.717
.232
.026
.6

Infor
matio
n and
comm
unica
tion
Coun
try gr
oups
Coun
tries
EU27
EU25
EU15
NMS
NM2
CC2
BEBG
CZDK
DEEE
ELES
FRIE
ITCY
LVLT
LUHU
MT
NLAT
PLPT
ROSI
SKFI
SVUK
HRTR
NOCH
q30b
. Con
sulte
d abo
ut ch
ange
s in w
ork o
rgan
isatio
n etc
47.1
47.1
46.9
47.9
47.8
45.9
57.5
61.8
46.6
53.6
42.2
63.1
51.9
39.3
42.8
56.2
37.7
57.0
54.5
79.3
46.0
49.8
50.3
82.9
47.5
42.3
27.5
42.2
49.3
50.6
71.8
60.1
52.2
36.1
47.2
47.2
52.1
q30c
. Sub
ject t
o reg
ular f
orma
l asse
ssmen
t of p
erfor
manc
e40
.039
.939
.244
.141
.232
.143
.843
.255
.532
.239
.451
.542
.634
.827
.542
.625
.743
.846
.564
.937
.938
.544
.152
.644
.741
.734
.840
.440
.931
.862
.244
.353
.334
.531
.859
.059
.2q1
2. W
ell-in
forme
d abo
ut he
alth a
nd sa
fety r
isks
83.1
83.3
82.4
88.3
80.8
42.7
79.0
88.0
88.1
83.5
89.4
91.9
77.0
77.3
68.9
89.0
80.6
82.6
86.4
85.6
75.6
91.6
73.0
78.0
84.6
89.1
84.2
78.5
88.1
81.0
96.5
85.5
89.8
87.9
39.4
85.4
89.2
Healt
hCo
untry
grou
psCo
untri
es
EU27
EU25
EU15
NMS
NM2
CC2
BEBG
CZDK
DEEE
ELES
FRIE
ITCY
LVLT
LUHU
MT
NLAT
PLPT
ROSI
SKFI
SVUK
HRTR
NOCH
q32.
Cons
ider h
ealth
or sa
fety a
t risk
beca
use o
f wor
k28
.627
.525
.240
.248
.044
.023
.744
.423
.723
.218
.039
.450
.837
.223
.123
.528
.434
.049
.143
.429
.833
.235
.422
.623
.247
.331
.449
.145
.634
.724
.348
.519
.138
.944
.418
.122
.4q3
3. W
ork a
ffects
healt
h35
.434
.330
.655
.852
.948
.529
.048
.436
.144
.223
.759
.268
.136
.026
.925
.738
.642
.664
.252
.434
.444
.651
.624
.932
.265
.340
.954
.462
.352
.242
.556
.520
.851
.848
.248
.331
.1q3
3a_a
… he
aring
prob
lems
7.27.1
5.913
.59.7
6.44.5
7.28.2
6.14.8
12.6
10.3
9.54.4
4.17.7
7.211
.111
.65.8
10.9
6.53.8
6.716
.49.9
10.5
17.5
13.4
11.6
15.3
2.610
.26.1
8.33.1
q33a
_b...
prob
lems w
ith yo
ur vi
sion
7.87.4
5.419
.012
.99.5
6.811
.610
.32.1
3.425
.411
.27.5
6.92.9
9.19.5
23.4
21.1
10.0
12.3
10.5
2.05.5
22.9
10.6
13.3
24.0
19.5
7.64.6
1.715
.89.0
4.03.3
q33a
_c...
skin
prob
lems
6.66.3
5.311
.411
.615
.34.3
7.27.7
5.95.0
12.8
15.7
7.74.4
5.65.7
7.511
.215
.35.6
10.1
8.23.4
5.012
.55.2
13.0
14.6
11.6
10.7
9.92.7
11.4
15.5
6.22.8
q33a
_d…
back
ache
24.7
23.8
21.1
38.9
39.2
35.2
19.4
29.2
22.9
23.1
18.8
40.2
47.0
29.1
21.6
14.5
24.3
32.7
44.1
38.0
26.9
31.6
29.8
13.8
24.0
45.8
30.7
42.4
45.9
38.9
26.2
27.8
10.8
41.5
34.7
22.7
18.1
q33a
_e.. h
eada
ches
15.5
14.7
13.1
24.2
27.7
30.8
10.5
22.1
16.5
15.9
12.0
26.9
35.4
14.1
11.9
8.716
.923
.127
.525
.416
.718
.023
.78.7
11.6
27.6
23.9
29.5
25.7
26.2
15.7
19.7
7.028
.631
.015
.26.1
q33a
_f…
stom
ach a
che
5.85.5
4.98.6
11.9
14.5
6.76.5
6.35.3
4.26.4
18.7
3.96.4
1.96.5
7.28.2
11.3
10.4
6.46.3
2.74.8
9.64.5
13.6
7.110
.15.2
10.5
1.46.4
15.1
5.91.9
q33a
_g…
mus
cular
pains
22.8
21.9
19.4
36.2
37.0
33.8
17.2
30.3
23.7
30.0
14.8
43.0
45.7
27.0
18.8
13.8
22.3
31.5
35.5
35.7
23.8
26.5
30.0
15.6
20.0
43.9
28.8
39.2
38.2
30.3
32.8
38.2
9.437
.633
.531
.613
.1q3
3a_h
… re
spira
tory
diffic
ulties
4.74.2
3.58.5
13.2
10.2
2.48.5
7.32.5
1.910
.814
.84.7
3.21.9
2.88.8
8.614
.03.6
6.03.0
3.93.8
8.47.8
14.8
9.511
.96.9
4.52.7
8.510
.32.8
2.4q3
3a_i…
heart
dise
ase
2.42.1
1.45.6
8.16.8
0.64.2
2.90.8
1.47.9
2.71.7
1.50.6
2.11.3
6.47.7
1.84.0
1.21.3
2.76.9
3.19.4
5.85.2
1.92.7
0.13.9
7.01.5
0.8q3
3a_j.
..injur
y(ies
)9.7
9.58.3
16.0
12.8
17.1
6.513
.211
.96.3
8.212
.623
.811
.99.1
6.58.9
11.8
16.5
14.8
9.515
.75.7
4.89.7
17.3
9.312
.621
.317
.78.4
12.0
3.516
.017
.27.2
4.5q3
3a_k
...stre
ss22
.321
.720
.230
.430
.936
.821
.018
.017
.426
.716
.032
.455
.321
.418
.316
.227
.133
.436
.931
.026
.625
.728
.016
.221
.034
.927
.635
.037
.730
.725
.437
.711
.835
.236
.929
.017
.0q3
3a_l.
..ove
rall fa
tigue
22.5
21.3
17.8
40.7
43.6
37.8
18.7
40.4
24.0
16.8
11.3
42.1
58.5
24.8
20.1
15.2
24.7
35.8
45.7
40.7
23.5
32.0
34.2
14.8
5.548
.826
.744
.641
.438
.621
.515
.99.1
9.839
.812
.011
.0q3
3a_m
...slee
ping p
roble
ms8.7
8.37.6
11.9
15.9
21.0
9.013
.39.2
9.64.4
17.4
17.2
7.69.1
6.28.1
9.419
.619
.111
.59.2
6.16.9
6.211
.810
.816
.718
.911
.013
.119
.45.9
10.4
21.7
10.9
5.4q3
3a_n
...alle
rgies
4.03.8
3.27.2
7.010
.52.6
6.13.7
3.12.3
8.211
.14.0
3.71.8
4.37.5
7.58.4
5.16.1
4.22.5
2.58.2
4.77.3
9.08.4
7.47.3
0.85.7
10.9
4.83.3
q33a
_o...a
nxiet
y7.8
7.87.9
7.28.9
12.1
6.616
.53.0
2.01.5
30.0
35.3
8.410
.87.0
12.6
18.3
21.8
15.2
10.6
7.512
.22.6
1.35.6
13.6
6.49.3
4.66.6
16.6
6.110
.812
.210
.83.4
q33a
_p...
Irrita
bility
10.5
10.4
10.3
11.5
11.0
8.112
.114
.13.5
14.4
5.426
.827
.311
.411
.48.3
15.0
16.2
20.6
18.4
15.3
15.0
25.1
9.68.5
8.816
.010
.024
.320
.014
.814
.76.2
19.8
7.313
.66.1
q35.
Able
to do
same
job w
hen 6
058
.258
.961
.047
.047
.731
.352
.344
.254
.568
.873
.658
.840
.553
.548
.653
.259
.955
.853
.954
.954
.452
.351
.972
.159
.943
.645
.748
.833
.737
.465
.269
.763
.542
.730
.472
.068
.1q3
4a_d
. Abs
ent f
or he
alth p
roble
ms in
prev
ious y
ear
22.9
23.4
23.5
22.8
13.6
18.7
28.8
20.2
28.6
32.9
28.2
27.5
14.1
14.2
19.4
21.4
25.2
17.7
23.9
21.8
31.7
23.8
41.0
33.7
20.9
19.9
13.5
11.4
28.3
22.8
44.7
28.0
22.6
19.4
18.7
27.3
19.2
q34b
_ef. A
verag
e day
s hea
lth-re
lated
abse
nce i
n prev
ious y
ear
4.64.7
4.55.4
2.55.1
7.04.3
5.56.6
3.54.6
2.83.6
5.53.9
3.83.9
4.14.3
5.45.0
3.88.6
3.45.5
8.62.0
8.75.2
8.56.7
3.79.4
4.87.1
4.0
Wor
k and
fami
ly life
Coun
try gr
oups
Coun
tries
EU27
EU25
EU15
NMS
NM2
CC2
BEBG
CZDK
DEEE
ELES
FRIE
ITCY
LVLT
LUHU
MT
NLAT
PLPT
ROSI
SKFI
SVUK
HRTR
NOCH
q18.
Wor
king h
ours
fit fa
mily
/ soc
ial co
mmitm
ents
well o
r very
well
79.4
79.8
80.9
73.4
73.8
64.1
83.1
73.7
79.5
87.8
85.5
75.8
57.9
75.4
80.9
80.6
73.0
76.8
67.0
76.0
83.4
73.1
79.2
84.6
88.0
70.6
82.4
73.8
74.2
78.3
86.0
79.4
84.8
74.9
63.4
88.1
87.8
q19.
Cont
acted
abou
t wor
k out
side n
orma
l wor
king h
ours
22.1
22.5
22.2
23.9
15.1
16.6
30.9
11.3
31.3
33.7
25.8
36.7
12.1
24.2
8.330
.512
.79.7
30.8
14.7
17.0
26.5
25.5
39.3
25.1
21.4
19.6
16.4
21.7
22.4
44.2
45.3
24.4
13.3
16.8
49.0
26.4
ef4c.
Carin
g for
and e
duca
ting y
our c
hildr
en ev
ery da
y for
an ho
ur or
mor
e28.8
28.2
27.3
33.1
37.8
23.3
42.1
35.6
20.1
36.5
18.0
39.4
32.7
14.9
34.6
36.1
27.3
39.7
37.9
33.3
43.8
42.7
35.1
45.3
28.0
34.7
40.6
38.4
34.5
28.4
27.5
30.6
28.4
35.2
22.4
46.8
28.4
ef4d.
Cook
ing an
d hou
sewo
rk46
.446
.246
.842
.450
.622
.154
.446
.330
.257
.040
.958
.137
.537
.851
.558
.037
.945
.561
.347
.247
.941
.429
.655
.840
.444
.351
.652
.048
.340
.450
.255
.157
.942
.720
.659
.651
.6
Job s
atisfa
ction
Coun
try gr
oups
Coun
tries
EU27
EU25
EU15
NMS
NM2
CC2
BEBG
CZDK
DEEE
ELES
FRIE
ITCY
LVLT
LUHU
MT
NLAT
PLPT
ROSI
SKFI
SVUK
HRTR
NOCH
q36.
Satis
fied o
r very
satis
fied w
ith w
orkin
g con
dition
s82
.383
.784
.877
.260
.753
.589
.566
.680
.093
.489
.275
.059
.978
.682
.186
.576
.283
.370
.267
.486
.575
.981
.189
.289
.678
.584
.958
.871
.675
.984
.585
.392
.771
.952
.293
.091
.2q3
7a_e
f. I m
ight lo
se m
y job
in th
e nex
t 6 m
onth
s13
.713
.311
.325
.219
.619
.29.0
22.9
32.2
7.212
.719
.520
.915
.07.7
9.58.9
14.2
19.0
23.3
5.522
.115
.217
.88.9
26.6
19.3
18.5
27.3
15.1
13.3
20.4
6.819
.419
.17.2
12.1
q37b
_ef. I
am w
ell pa
id for
the w
ork I
do
43.2
44.3
47.0
29.0
25.1
26.6
55.1
28.4
34.9
53.9
58.4
33.6
32.3
47.7
35.7
56.5
33.8
55.3
31.6
32.1
57.8
18.3
43.8
58.0
50.6
28.7
28.6
24.1
35.3
25.1
35.5
40.4
53.6
39.6
25.7
47.2
58.8
q37c
_ef. M
y job
offer
s goo
d pro
spec
ts for
caree
r adv
ance
ment
31.0
31.6
33.0
23.9
20.1
21.1
34.7
25.3
25.1
39.1
30.4
24.0
27.0
28.6
36.6
42.0
23.6
32.5
27.8
22.7
40.5
18.7
43.7
34.6
33.7
24.8
34.6
18.4
30.6
18.0
35.0
26.8
42.4
26.3
20.8
26.6
34.3
Struc
ture
of wo
rkfor
ceCo
untry
grou
psCo
untri
es
EU27
EU25
EU15
NMS
NM2
CC2
BEBG
CZDK
DEEE
ELES
FRIE
ITCY
LVLT
LUHU
MT
NLAT
PLPT
ROSI
SKFI
SVUK
HRTR
NOCH
q2d_
ef. Se
niorit
y (me
an ye
ars)
9.79.7
9.89.4
9.411
.812
.07.7
8.27.9
10.2
7.311
.38.8
10.1
9.211
.810
.97.4
7.911
.07.8
10.5
9.710
.310
.79.8
10.0
11.8
8.410
.810
.47.5
11.0
11.9
10.3
9.4
Wor
king t
ime
Coun
try gr
oups
Coun
tries
EU27
EU25
EU15
NMS
NM2
CC2
BEBG
CZDK
DEEE
ELES
FRIE
ITCY
LVLT
LUHU
MT
NLAT
PLPT
ROSI
SKFI
SVUK
HRTR
NOCH
q8a_
ef. M
ean u
sual
week
ly wo
rking
hour
s38
.638
.237
.442
.845
.953
.337
.244
.341
.436
.037
.740
.045
.440
.335
.537
.938
.439
.841
.240
.638
.242
.440
.633
.039
.843
.941
.946
.441
.643
.137
.637
.934
.843
.154
.134
.537
.2q8
b. %
usua
lly w
orkin
g five
days
per w
eek
65.1
66.1
66.5
63.6
48.8
22.6
61.3
63.0
71.0
75.2
73.0
74.1
51.0
64.5
71.4
65.8
62.0
68.2
68.5
69.6
78.0
71.2
65.1
52.8
67.3
56.0
71.6
44.2
65.9
73.0
81.4
75.2
61.4
59.0
19.9
63.9
64.2
q9a.
% w
ith m
ore t
han o
ne jo
b6.2
6.25.9
8.05.7
5.77.2
5.39.6
15.0
6.413
.410
.16.0
3.06.5
6.13.4
13.7
6.55.1
7.410
.09.9
6.66.9
4.45.8
9.99.8
10.3
10.6
3.87.2
5.616
.410
.8q1
3_ef.
Dail
y com
mutin
g tim
e (ret
urn,
in mi
nutes
)41
.641
.140
.942
.050
.240
.441
.139
.538
.240
.945
.048
.940
.138
.137
.142
.034
.732
.246
.241
.239
.445
.733
.950
.731
.842
.233
.453
.935
.444
.338
.541
.745
.438
.540
.531
.636
.6q1
4e_e
f. Lon
g wor
king d
ays
16.9
15.9
15.1
20.3
33.2
31.0
17.9
24.3
20.0
14.5
12.9
19.1
25.9
14.0
13.8
22.1
15.4
13.7
25.0
19.6
11.1
19.6
19.5
12.7
20.1
20.6
13.0
36.3
17.8
21.2
15.7
14.5
17.6
17.0
32.1
13.4
11.7
q16a
_a. W
ork s
ame n
umbe
r of h
ours
each
day
58.4
58.5
58.6
57.9
56.7
66.6
52.2
70.7
50.7
34.2
57.4
54.5
67.1
70.8
56.4
64.2
60.9
76.6
60.3
62.7
64.0
64.0
73.3
48.5
45.5
57.6
76.6
52.1
54.7
57.9
47.7
44.5
58.2
70.9
66.3
54.7
47.0
q16a
_b. W
ork s
ame n
umbe
r of d
ays e
ach w
eek
74.0
74.1
75.1
68.9
71.7
74.1
77.2
75.5
64.8
70.2
74.3
62.1
83.4
82.6
75.0
83.0
68.2
89.9
72.0
72.2
84.1
71.9
81.8
72.1
68.6
68.9
87.2
70.4
70.1
65.8
71.1
66.4
76.1
81.3
73.6
64.3
75.9
q16a
_c. W
ork f
ixed s
tartin
g and
finish
ing tim
es60
.761
.260
.863
.652
.756
.258
.273
.560
.656
.165
.957
.664
.769
.461
.563
.151
.578
.766
.460
.368
.067
.072
.951
.452
.363
.976
.945
.858
.064
.349
.159
.957
.575
.854
.866
.952
.4q1
6a_d
. Wor
k shif
ts17
.317
.116
.023
.021
.08.2
13.2
21.0
22.2
9.315
.720
.413
.022
.214
.912
.018
.111
.821
.919
.413
.920
.722
.311
.813
.223
.510
.321
.030
.027
.524
.316
.015
.433
.56.4
23.4
12.9
q17a
. % w
ith le
ss fle
xible
sched
ules
65.3
65.2
64.1
71.2
66.7
41.3
61.7
80.0
69.0
49.3
70.2
67.7
62.5
76.7
64.4
60.8
56.2
76.9
79.5
72.7
65.1
75.6
76.8
46.5
58.1
68.7
79.0
62.4
68.2
80.0
53.4
40.7
64.1
76.7
38.8
57.6
43.6

Advisory Committee
GovernmentsBirgit StimmerFederal Ministry of Economics and LabourAustriaAndreas HorstFederal Ministry of Labour and Social Affairs GermanyPaolo ReboaniMinistry of Labour and Social PolicyItalyInger Ohlsson (ex-member)National Institute for Working LifeSweden
EmployersNatascha Waltke (ex-member)UNICEBelgiumHeitor SalgueiroConfederation of Portuguese IndustryPortugalMaria Angeles AsenjoCNC SpainMarie-Louise Thorsén Lind (ex-member)Confederation of Swedish EnterpriseSweden
WorkersHerman FonckConfederarion of Christian Trade Unions (CSC-AVC)BelgiumErik PentengaDutch Trade Union Federation (FNV) NetherlandsPavle VrhovecUnion of Free Trade Unions of Slovenia (ZSSS)Slovenia
European CommissionDimitrios DimitriouDG Employment, Social Affairs and Equal OpportunitiesBelgiumJean-Francois LebrunDG Employment, Social Affairs and Equal OpportunitiesBelgium
Committee of ExpertsJouko NättiUniversity of JyväskyläFinlandFred HuijgenUniversity of NijmegenNetherlands
National experts
Cornelia MoserStatistics AustriaAustriaLuc van HammeFederal Public Service Employment, Labour and SocialDialogueBelgiumRenáta Kyzlinková Research Institute for Labour and Social AffairsCzech RepublicOle OlsenNational Institute of Occupational HealthDenmarkEster RünklaMinistry of Social AffairsEstoniaDamien CartronCentre d'Etudes de l'EmploiFranceMichel GollacCentre d’Etudes de l’EmploiFranceSylvie Hamon CholetMinistry of LabourFrancePekki YlöstaloMinistry of LabourFinlandHanna SutelaStatistics FinlandFinlandBeate BeermannFederal Institute for Occupational Safety and Health(FIOSH)GermanyChristos IoannouAthens University of Economics and BusinessGreeceMichalis Petrakos AgilisGreeceEva Berde University of BudapestHungaryGerry HughesEconomic and Social Research Institute (ESRI)IrelandPhilip J. O’ConnellEconomic and Social Research Institute (ESRI)IrelandMaurizio Curtarelli(Isfol)ItalyMarinella Giovine(Isfol)Italy
105
Annex 4: Expert questionnaire development group

Laura Incagli(Isfol)ItalyZaiga PriedeCentral Statistical Bureau of LatviaLatviaGintare Buzinskaite Ministry of Social Security and LabourLithuaniaNadine WelterMinistry for Work and EmploymentLuxembourgSaviour RizzoUniversity of MaltaMaltaSteven DhondtTNO Work and EmploymentNetherlandsPeter SmuldersTNO Work and EmploymentNetherlandsMałgorzata PosniakNational Research InstitutePolandMaria João RebeloDepartamento de Estudos, Estatistica e PlaneamentoPortugalIvan SvetlikUniversity of Ljubljana SloveniaMaria AntalovaUniversity of EconomicsSlovakiaClotilde NogaredaNational Working Conditions CentreSpainKerstin FredrikssonStatistics SwedenSwedenAnders Wikman National Institute for Working LifeSwedenBrendan BurchellUniversity of CambridgeUnited KingdomSimon ClarkeHealth and Safety ExecutiveUnited KingdomSvetla KarovaConfederation of Independent Trade Unions BulgariaJeana ApostolNational Institute of StatisticsRomaniaDilsen LostarKocaeli UniversityTurkey
European CommissionEleni DapergolaDG Employment, Social Affairs and Equal OpportunitiesBelgium
Anne Degrand-GuillaudDG Employment, Social Affairs and Equal OpportunitiesBelgium
Angel FuenteDG Employment, Social Affairs and Equal OpportunitiesLuxembourg
Didier DupréEurostatLuxembourg
Antti KarjalainenEurostatLuxembourg
European and international institutionsMarc Sapir Trade Union Technical Bureau (TUTB)BelgiumPaul SwaimEmployment Analysis and Policy Division, OECDFrancePascal PaoliThe European Agency for Safety and Health at Work(OSHA)SpainElke SchneiderThe European Agency for Safety and Health at Work(OSHA)SpainSangheon LeeProgramme on Conditions of Work and Employment,International Labour OfficeSwitzerland
Non-EU partnersTorkel SandegrenRoyal Ministry of Labour and Government AffairsNorway
Margaret GrafState Secretariat of Economic AffairsSwitzerland
Ulrich PekruhlUniversity of Applied SciencesSwitzerland
106
Fourth European Working Conditions Survey

Coordination centre
Gallup EuropeGallup Organisation Europe SAAvenue Michel Ange 701000 Brussels
Members of the network
AustriaSPECTRA MarktforschungBrucknerstrasse 3–54020 Linz
BelgiumIRB Europe Sprl81 Boulevard Louis Schmidtlaan1040 Brussels
CyprusCymar Market Research Ltd1686 NicosiaDigeni Akrita,40 Strovolos 2045
Czech RepublicFocus Centre for Social and Market AnalysisVrchlického sad 4602 00 Brno
DenmarkVilstrupFrederiksborggade 181360 Koebenhavn
EstoniaSAAR POLL Ltd10119 Tallinn
FinlandTaloustutkimus OyLemuntie 900510 Helsinki
FranceEfficience 326 rue BuiretteBP 20271057 Reims Cedex
GermanyIFAK Institut GmbH & Co. Markt- und SozialforschungPostfach 13 5165221 Taunusstein
Greece Metron Analysis SA6 Sinopsis Str.115 27 Athens
HungaryGallup OrganisationFö tér 1, Zichy Kastély1033 Budapest
IrelandEconomic and Social Research Institute (ESRI)4 Burlington RoadDublin 4
ItalyDemoskopea SpAVia Salaria 290/Via Rubicone 4100199 Rome
LatviaLatvian Facts LtdBrivibas str. 106-21001 Riga
LithuaniaBaltic Surveys LtdSermuksniu 6a2001 Vilnius
LuxembourgGallup LuxembourgRue Emile Mark 44, BP 48L-4501 Differdange
MaltaMisco International3rd Floor, Regency HouseRepublic StreetVLT04 Valletta
NetherlandsRsvoGedempte Gracht 44b1506 CH Zaandam
PolandGallup Organisation PolandKrzywickiego 3402-078 Warsaw
PortugalIntercampus LDAAv. António Augusto de Aguiar, 106 5/61050-019 Lisbon
107
Annex 5: Network of national fieldwork institutes
SlovakiaFocus Centre for Social and Market AnalysisGrossinglova 3781000 Bratislava
SloveniaCATI d.o.o.Trzaska cesta 21000 Ljubljana
SpainGallup SpainVictor de la Serna 31-33 Post.28016 Madrid
SwedenIMRI – International Market Research Institute ABLandsvägen 52172 63 Stockholm
United KindgomICM ResearchKnighton House56 Mortimer StreetLondon W1W 7RT
BulgariaVitosha Research5 Alexander Zhendov Street1113 Sofia
CroatiaGallup Organisation CroatiaZagrebUl. Grada Vukovara 62A10000 Zagreb
RomaniaGallup Organisation Romania78151 Bucharest Bd. Nicolae TitulescuNr. 1, Bl. A7, Sc. 4, Et. 8, Ap. 116-117, Sector 1.
TurkeyTRIA Research ConsultancySüleyman Nazif Sk. Aydin Apt. No : 24/6Nisantasi80220 Istanbul
NorwayMMI ASPO Box 91430133 Groenland
SwitzerlandMIS TrendPont Bessière 31005 Lausanne
108
Fourth European Working Conditions Survey

Annex 6: Survey questionnaire
Household data
(NEW)
HH1. I’d like to start by asking you a few questions about your household.
Including yourself, can you please tell me how many people live in this household?
Number of people living in household:……………………………………
99 - Refusal (spontaneous)
(NEW)
HH2.
INTERVIEWER: NOW OBTAIN INFORMATION THAT YOU NEED TO ENTER ON
HOUSEHOLD GRID ON NEXT PAGE, STARTING WITH THE RESPONDENT
a. (INTERVIEWER.: CODE GENDER OF RESPONDENT IN GRID BELOW)
b. Starting with yourself, how old are you?
c. (INTERVIEWER.: SKIP FOR RESPONDENT)
SHOW CARD D
d. What is your principal economic status?
(NEW)
HH3.
INTERVIEWER: FOR SECOND HOUSEHOLD MEMBER, START WITH THE OLDEST
MEMBER OF THE HOUSEHOLD. REPEAT GRID QUESTIONS A-D FOR ALL OTHER
HOUSEHOLD MEMBERS.
Now thinking about the other members of your household, starting with the oldest …
a. Could you tell me whether this is a male or a female?
b. How old is he/she?
SHOW CARD C
c. What is this person’s relationship to you? Is he/she your …?
SHOW CARD D
d. And what is this person’s principal economic status?
109

HOUSEHOLD GRID
A B C D
INTERVIEWER:
Code for
respondent
Relationship to respondent Principal economic status?
Male Female
Age
Code from list below Code from list below
1 Respondent 1 2 ……
01 02 03 04 05 06 07 08 09 10
88 99
2 Person 2 1 2 ……
01 02 03 04 05 06 07 08
88 99
01 02 03 04 05 06 07 08 09 10
88 99
3 Person 3 1 2 ……
01 02 03 04 05 06 07 08
88 99
01 02 03 04 05 06 07 08 09 10
88 99
4 Person 4 1 2 ……
01 02 03 04 05 06 07 08
88 99
01 02 03 04 05 06 07 08 09 10
88 99
5 Person 5 1 2 ……
01 02 03 04 05 06 07 08
88 99
01 02 03 04 05 06 07 08 09 10
88 99
6 Person 6 1 2 ……
01 02 03 04 05 06 07 08
88 99
01 02 03 04 05 06 07 08 09 10
88 99
7 Person 7 1 2 ……
01 02 03 04 05 06 07 08
88 99
01 02 03 04 05 06 07 08 09 10
88 99
8 Person 8 1 2 ……
01 02 03 04 05 06 07 08
88 99
01 02 03 04 05 06 07 08 09 10
88 99
9 Person 9 1 2 ……
01 02 03 04 05 06 07 08
88 99
01 02 03 04 05 06 07 08 09 10
88 99
10 Person 10 1 2 ……
01 02 03 04 05 06 07 08
88 99
01 02 03 04 05 06 07 08 09 10
88 99
888 - DK/No opinion
(spontaneous)
999 - Refusal
(spontaneous)
RELATIONSHIP CODES [CARD C] ECONOMIC STATUS CODES [CARD D]:
01 - spouse/partner
02 - son/daughter
03 - parent, step-parent or parent in law
04 - daughter or son in law
05 - grandchild
06 - brother/sister (incl. half and step
siblings)
07 - other relative
08 - other non relative
88 - DK/No opinion (spontaneous)
99 - Refusal (spontaneous)
01 - at work as employee or employer/self-employed
02 - at work, on child-care leave or other leave
03 - at work as relative assisting on family farm or business *
04 - unemployed less than 12 months
05 - unemployed 12 months or more
06 - unable to work due to long-term illness or disability
07 - retired
08 - full time homemaker/ responsible for ordinary shopping and looking after
the home
09 - in education (at school, university, etc.) / student
10 -other
88 - DK/No opinion (spontaneous)
99 - Refusal (spontaneous)
* If paid a formal wage or salary for work in family farm or business, code as 1
(‘at work as employee’)
110
Fourth European Working Conditions Survey
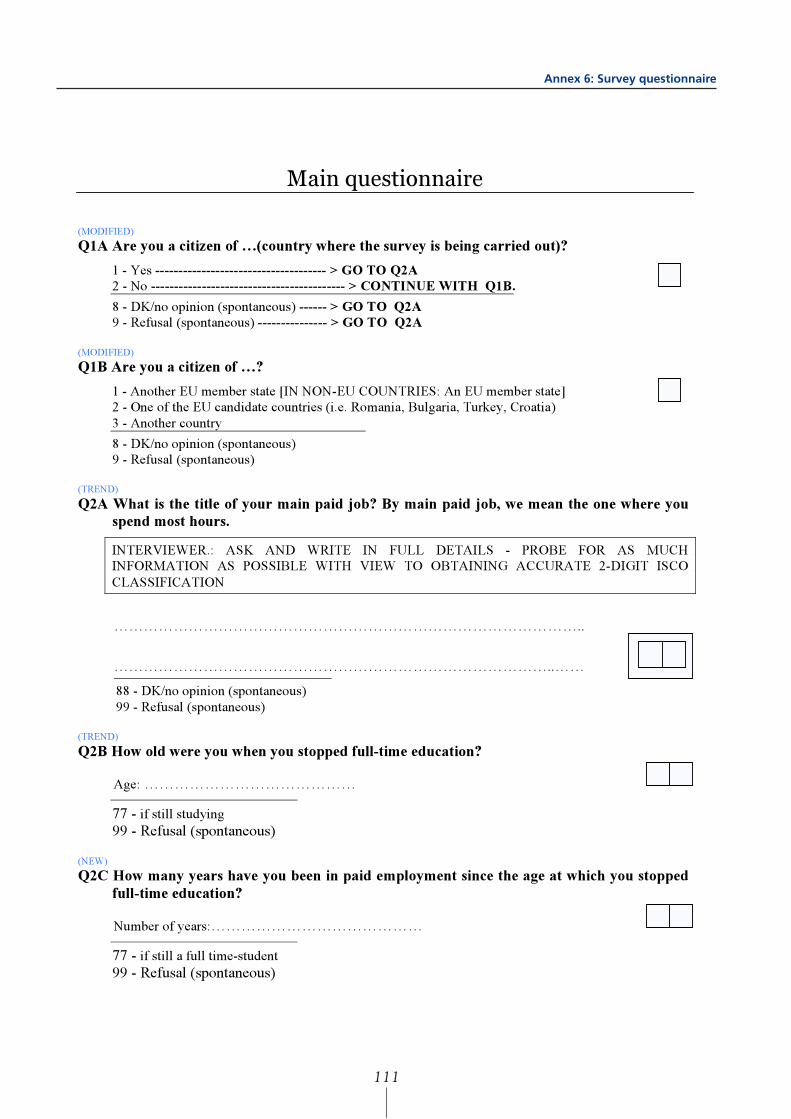
111
Annex 6: Survey questionnaire
Main questionnaire
(MODIFIED)
Q1A Are you a citizen of …(country where the survey is being carried out)?
1 - Yes ------------------------------------- > GO TO Q2A
2 - No ------------------------------------------ > CONTINUE WITH Q1B.
8 - DK/no opinion (spontaneous) ------ > GO TO Q2A
9 - Refusal (spontaneous) --------------- > GO TO Q2A
(MODIFIED)
Q1B Are you a citizen of …?
1 - Another EU member state [IN NON-EU COUNTRIES: An EU member state]
2 - One of the EU candidate countries (i.e. Romania, Bulgaria, Turkey, Croatia)
3 - Another country
8 - DK/no opinion (spontaneous)
9 - Refusal (spontaneous)
(TREND)
Q2A What is the title of your main paid job? By main paid job, we mean the one where you
spend most hours.
INTERVIEWER.: ASK AND WRITE IN FULL DETAILS - PROBE FOR AS MUCH
INFORMATION AS POSSIBLE WITH VIEW TO OBTAINING ACCURATE 2-DIGIT ISCO
CLASSIFICATION
…………………………………………………………………………………..
……………………………………………………………………………..……
88 - DK/no opinion (spontaneous)
99 - Refusal (spontaneous)
(TREND)
Q2B How old were you when you stopped full-time education?
Age: ……………………………………
77 - if still studying
99 - Refusal (spontaneous) (NEW)
Q2C How many years have you been in paid employment since the age at which you stopped
full-time education?
Number of years:……………………………………
77 - if still a full time-student
99 - Refusal (spontaneous)
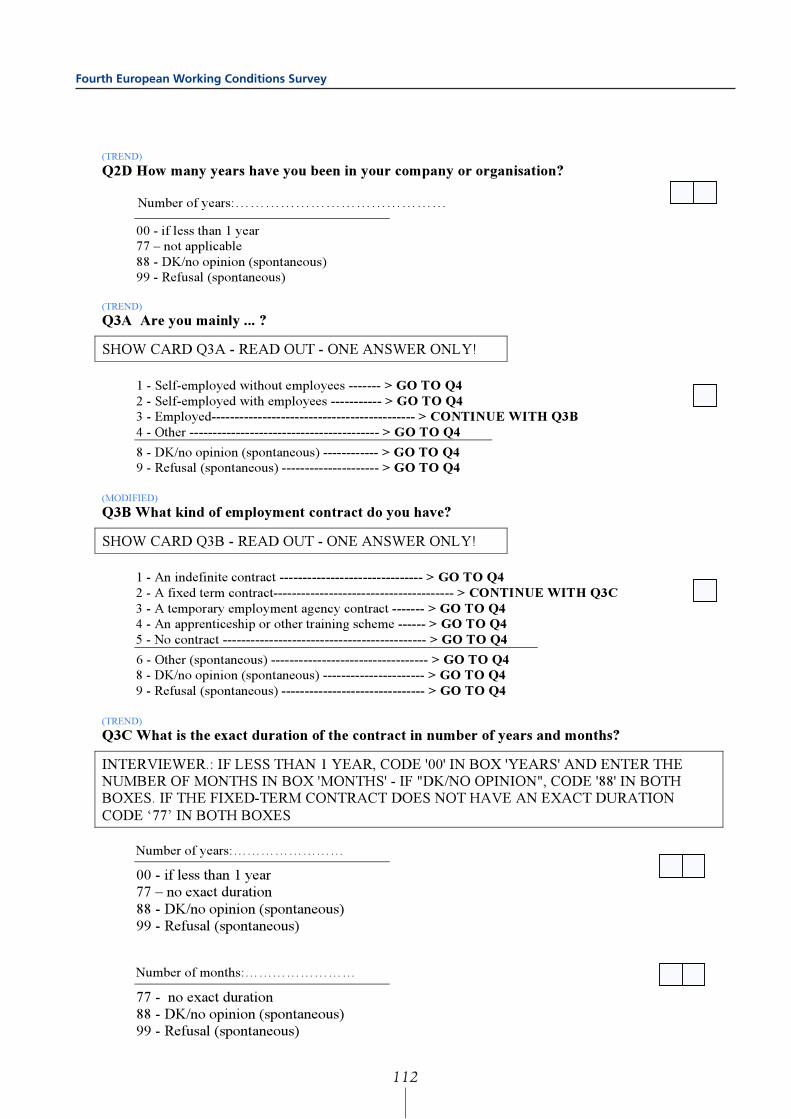
(TREND)
Q2D How many years have you been in your company or organisation?
Number of years:……………………………………
00 - if less than 1 year
77 – not applicable
88 - DK/no opinion (spontaneous)
99 - Refusal (spontaneous)
(TREND)
Q3A Are you mainly ... ?
SHOW CARD Q3A - READ OUT - ONE ANSWER ONLY!
1 - Self-employed without employees ------- > GO TO Q4
2 - Self-employed with employees ----------- > GO TO Q4
3 - Employed-------------------------------------------- > CONTINUE WITH Q3B
4 - Other ----------------------------------------- > GO TO Q4
8 - DK/no opinion (spontaneous) ------------ > GO TO Q4
9 - Refusal (spontaneous) --------------------- > GO TO Q4
(MODIFIED)
Q3B What kind of employment contract do you have?
SHOW CARD Q3B - READ OUT - ONE ANSWER ONLY!
1 - An indefinite contract ------------------------------- > GO TO Q4
2 - A fixed term contract--------------------------------------- > CONTINUE WITH Q3C
3 - A temporary employment agency contract ------- > GO TO Q4
4 - An apprenticeship or other training scheme ------ > GO TO Q4
5 - No contract -------------------------------------------- > GO TO Q4
6 - Other (spontaneous) ---------------------------------- > GO TO Q4
8 - DK/no opinion (spontaneous) ---------------------- > GO TO Q4
9 - Refusal (spontaneous) ------------------------------- > GO TO Q4
(TREND)
Q3C What is the exact duration of the contract in number of years and months?
INTERVIEWER.: IF LESS THAN 1 YEAR, CODE '00' IN BOX 'YEARS' AND ENTER THE
NUMBER OF MONTHS IN BOX 'MONTHS' - IF "DK/NO OPINION", CODE '88' IN BOTH
BOXES. IF THE FIXED-TERM CONTRACT DOES NOT HAVE AN EXACT DURATION
CODE ‘77’ IN BOTH BOXES
Number of years:……………………
00 - if less than 1 year
77 – no exact duration
88 - DK/no opinion (spontaneous)
99 - Refusal (spontaneous)
Number of months:……………………
77 - no exact duration
88 - DK/no opinion (spontaneous)
99 - Refusal (spontaneous)
Fourth European Working Conditions Survey
112

(TREND)
Q4 What is the main activity of the company or organisation where you work ?
INTERVIEWER.: ASK AND WRITE IN FULL DETAILS - PROBE FOR AS MUCH
INFORMATION AS POSSIBLE!
……………………………………………………………………………..……
88 - DK/no opinion (spontaneous)
99 - Refusal (spontaneous)
(MODIFIED TREND) (EF2000)
Q5 Are you working in the …?
1 - private sector
2 - public sector
3 - joint private-public organisation or company
4 - non-for-profit sector, NGO
5 - other
8 - DK/no opinion (spontaneous)
9 - Refusal (spontaneous)
(TREND)
SHOW CARD Q6
Q6. How many people in total work in the local unit of the establishment where you work?
01 - 1 (interviewee works alone)
02 - 2-4
03 - 5-9
04 - 10-49
05 - 50-99
06 - 100-249
07 - 250-499
08 - 500 and over
88 - DK/no opinion (spontaneous)
99 - Refusal (spontaneous)
(TREND)
Q7 How many people work under your supervision, for whom pay increases, bonuses or
promotion depend directly on you?
…………………… Number of people:
0000 - none
8888- DK/no opinion (spontaneous)
9999 - Refusal (spontaneous)
Annex 6: Survey questionnaire
113

(TREND)
Q8a How many hours do you usually work per week in your main paid job?
INTERVIEWER: EXCLUDING LUNCH BREAK AND EXCLUDING TIME SPENT
TRAVELLING TO AND FROM WORK - IF 30 MINUTES OR MORE, ROUND UP TO NEXT
HOUR
Number of hours per week:……………………
888 - DK/no opinion (spontaneous)
999 - Refusal (spontaneous)
(NEW)
Q8B How many days per week do you usually work in your main paid job?
Number of days per week:……………………
8 - DK/no opinion (spontaneous)
9 - Refusal (spontaneous)
(MODIFIED)
Q9A Besides your main paid job, do you have any other paid job(s)?
(IF YES) Is it / are they...?
SHOW CARD Q9A - READ OUT - ONE ANSWER ONLY!
1 - No other paid job --------------------- > GO TO Q10
2 - Yes, regular ------------------------------- >CONTINUE WITH Q9B
3 - Yes, occasional ----------------------- > GO TO Q10
4 - Yes, seasonal -------------------------- > GO TO Q10
5 - Other (spontaneous) ------------------ > GO TO Q10
8 - DK/no opinion (spontaneous) ------- > GO TO Q10
9 - Refusal (spontaneous) ---------------- > GO TO Q10
(MODIFIED)
Q9B How many hours a week on average do you work in job(s) other than your main paid
job?
INTERVIEWER.: IF 30 MINUTES OR MORE, ROUND UP TO THE NEXT HOUR
Number of hours:……………………
888 - DK/no opinion (spontaneous)
999 - Refusal (spontaneous)
Fourth European Working Conditions Survey
114

(MODIFIED)
Q10 Please tell me, using the following scale, are you exposed at work to ...?
SHOW CARD Q10 WITH SCALE - ONE ANSWER ONLY PER LINE!
“R”
READ OUT –ROTATE – MARK IN
COLUMN “R” WHERE YOU START
ASKING WITH AN “X” MARK
All of
the time
Almost
all of
the time
Around
of the
time
Around
half of
the time
Around
of the
time
Almost
never Never DK Ref.
A - Vibrations from hand tools,
machinery, etc. 1 2 3 4 5 6 7 8 9
B - Noise so loud that you would have
to raise your voice to talk to people 1 2 3 4 5 6 7 8 9
C - High temperatures which make you
perspire even when not working 1 2 3 4 5 6 7 8 9
D - Low temperatures whether indoors
or outdoors 1 2 3 4 5 6 7 8 9
E - Breathing in smoke, fumes (such as
welding or exhaust fumes), powder
or dust (such as wood dust or
mineral dust) etc. (MODIFIED)
1 2 3 4 5 6 7 8 9
F - Breathing in vapours such as
solvents and thinners (NEW) 1 2 3 4 5 6 7 8 9
G - Handling or being in skin contact
with chemical products or
substances (MODIFIED)
1 2 3 4 5 6 7 8 9
H - Radiation such as X rays,
radioactive radiation, welding light,
laser beams
1 2 3 4 5 6 7 8 9
I - Tobacco smoke from other people
(NEW) 1 2 3 4 5 6 7 8 9
J - Handling or being in direct contact
with materials which can be
infectious, such as waste, bodily
fluids, laboratory materials, etc (NEW)
1 2 3 4 5 6 7 8 9
Annex 6: Survey questionnaire
115

(MODIFIED)
Q11 Please tell me, using the same scale, does your main paid job involve ...?
SHOW SAME CARD (Q10) WITH SCALE - ONE ANSWER ONLY PER
LINE!
“R”
READ OUT –ROTATE – MARK IN
COLUMN “R” WHERE YOU START
ASKING WITH AN “X” MARK
All of
the time
Almost
all of
the time
Around
of the
time
Around
half of
the time
Around
of the
time
Almost
never Never DK Ref.
A - Tiring or painful positions 1 2 3 4 5 6 7 8 9
B - Lifting or moving people (NEW) 1 2 3 4 5 6 7 8 9
C - Carrying or moving heavy loads 1 2 3 4 5 6 7 8 9
D - Standing or walking (NEW) 1 2 3 4 5 6 7 8 9
E - Repetitive hand or arm movements 1 2 3 4 5 6 7 8 9
F - Working at company / organisation
premise 1 2 3 4 5 6 7 8 9
G - Teleworking from home with a PC 1 2 3 4 5 6 7 8 9
H - Working at home, excluding
telework 1 2 3 4 5 6 7 8 9
I - Working in places other than home
or company/ organisation premises,
e.g. client’s premises, on the road
1 2 3 4 5 6 7 8 9
J - Dealing directly with people who
are not employees at your
workplace such as customers,
passengers, pupils, patients, etc.
1 2 3 4 5 6 7 8 9
K - Working with computers: PCs,
network, mainframe 1 2 3 4 5 6 7 8 9
L – Using internet / email for
professional purposes (NEW) 1 2 3 4 5 6 7 8 9
M - Wearing personal protective
clothing or equipment 1 2 3 4 5 6 7 8 9
(MODIFIED)
Q12 Regarding the health and safety risks related to performance of your job, how well
informed would you say you are?
1 - Very well informed
2 - Well informed
3 - Not very well informed
4 - Not at all well informed
7 - Not applicable (spontaneous)
8 - DK/no opinion (spontaneous)
9 - Refusal (spontaneous)
Fourth European Working Conditions Survey
116
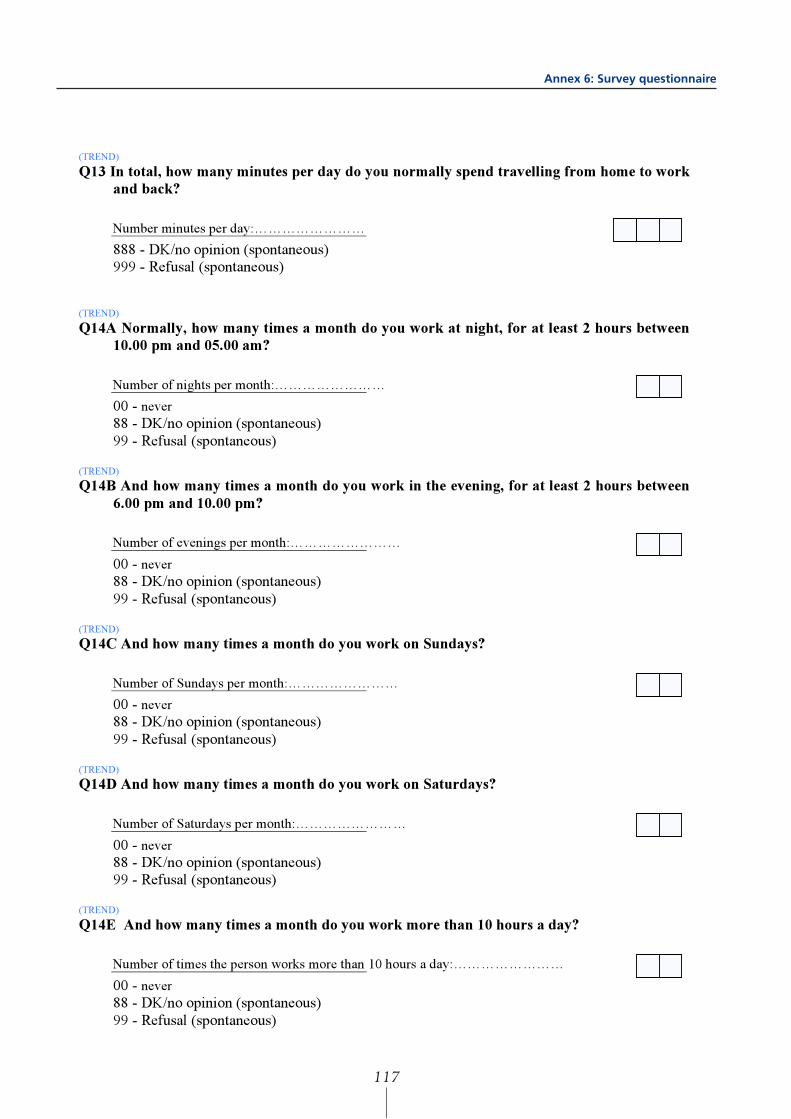
(TREND)
Q13 In total, how many minutes per day do you normally spend travelling from home to work
and back?
Number minutes per day:……………………
888 - DK/no opinion (spontaneous)
999 - Refusal (spontaneous)
(TREND)
Q14A Normally, how many times a month do you work at night, for at least 2 hours between
10.00 pm and 05.00 am?
Number of nights per month:……………………
00 - never
88 - DK/no opinion (spontaneous)
99 - Refusal (spontaneous) (TREND)
Q14B And how many times a month do you work in the evening, for at least 2 hours between
6.00 pm and 10.00 pm?
Number of evenings per month:……………………
00 - never
88 - DK/no opinion (spontaneous)
99 - Refusal (spontaneous) (TREND)
Q14C And how many times a month do you work on Sundays?
Number of Sundays per month:……………………
00 - never
88 - DK/no opinion (spontaneous)
99 - Refusal (spontaneous) (TREND)
Q14D And how many times a month do you work on Saturdays?
Number of Saturdays per month:……………………
00 - never
88 - DK/no opinion (spontaneous)
99 - Refusal (spontaneous) (TREND)
Q14E And how many times a month do you work more than 10 hours a day?
Number of times the person works more than 10 hours a day:……………………
00 - never
88 - DK/no opinion (spontaneous)
99 - Refusal (spontaneous)
Annex 6: Survey questionnaire
117

(MODIFIED)
Q15A Do you work part-time or full-time?
1 - Part-time --------------------------------------- > CONTINUE WITH Q15B
2 - Full-time ------------------------ > GO TO Q16A
9 - Refusal (spontaneous) ------ > GO TO Q16A
(MODIFIED)
Q15B Would you like to work...?
1 - Full-time
2 - More hours but not full-time
3 - The same number of hours
4 - Less hours
8 - DK/no opinion (spontaneous)
9 - Refusal (spontaneous)
(MODIFIED)
Q16A Do you work...?
READ OUT Yes No DK Refusal
A -The same number of hours every day 1 2 8 9
B - The same number of days every week 1 2 8 9
C - Fixed starting and finishing times 1 2 8 9
D - Shifts 1 2 8 9
IF Q16A_D “SHIFTS”=1 “YES” GO TO
Q16B, ALL OTHERS GO TO Q17A
(MODIFIED)
Q16B Do you work...?
SHOW CARD Q16B - READ OUT - ONE ANSWER ONLY!
1 - daily split shifts (with a break of at least 4 hours in between)
2 - permanent shifts (morning, afternoon or night)
3 - alternating / rotating shifts
4 - Other (spontaneous)
8 - DK/no opinion (spontaneous)
9 - Refusal (spontaneous)
Fourth European Working Conditions Survey
118

(MODIFIED)
Q17A How are your working time arrangements set?
SHOW CARD Q17A - READ OUT - ONE ANSWER ONLY!
1 - They are set by the company / organisation
with no possibility for changes ------------------------------- > CONTINUE WITH Q17B
2 - You can choose between several fixed working
schedules determined by the company/ organisation ------ > CONTINUE WITH Q17B
3 - You can adapt your working
hours within certain limits (eg. flexitime) ---------------------------- > GO TO Q18
4 - Your working hours are entirely determined by yourself ----------- > GO TO Q18
8 - DK/no opinion (spontaneous) ----------- > GO TO Q18
9 - Refusal (spontaneous) --------------------- > GO TO Q18
(MODIFIED TREND)
Q17B Do changes to your work schedule occur regularly? (IF YES) How long before are you informed
about these changes?
SHOW CARD Q17B - READ OUT - ONE ANSWER ONLY!
1 - No
2 - Yes, the same day
3 - Yes, the day before
4 - Yes, several days in advance
5 - Yes, several weeks in advance
6 - Other (spontaneous)
8 - DK/no opinion (spontaneous)
9 - Refusal (spontaneous)
(TREND)
Q18 In general, do your working hours fit in with your family or social commitments outside work
very well, well, not very well or not at all well?
1 - Very well
2 - Well
3 - Not very well
4 - Not at all well
8 - DK/no opinion (spontaneous)
9 - Refusal (spontaneous)
(NEW)
Q19 In the past twelve months, have you been contacted, e.g. by email or telephone, in matters
concerning your main paid job outside your normal working hours?
SHOW CARD Q19 - READ OUT - ONE ANSWER ONLY!
1 - Every day
2 - At least once a week
3 - A couple of times a month
4 - Less often
5 - Never
8 - DK/no opinion (spontaneous)
9 - Refusal (spontaneous)
Annex 6: Survey questionnaire
119

(MODIFIED)
Q20A Please tell me, does your job involve short repetitive tasks of less than...?
INTERVIEWER: IF NECESSARY, SPECIFY THAT WE MEAN TASKS AND NOT
MOVEMENTS SUCH AS CLICKING THE MOUSE BUTTON!
READ OUT Yes No DK Refusal
A - 1 minute 1 2 8 9
B- 10 minutes 1 2 8 9
(TREND)
Q20B And, does your job involve ...?
SHOW CARD Q20B WITH SCALE -ONE ANSWER ONLY PER LINE!
“R”
READ OUT –ROTATE – MARK IN
COLUMN “R” WHERE YOU START
ASKING WITH AN “X” MARK
All of
the time
Almost
all of the
time
Around
of the
time
Around
half of
the time
Around
of the
time
Almost
never Never DK Refusal
A - working at very high speed 1 2 3 4 5 6 7 8 9
B- working to tight deadlines 1 2 3 4 5 6 7 8 9
(TREND MODIFIED, C to include ‘or performance’)
Q21 On the whole, is your pace of work dependent, or not, on...?
READ OUT Yes No DK Refusal
A - the work done by colleagues 1 2 8 9
B - direct demands from people such as
customers, passengers, pupils, patients, etc. 1 2 8 9
C - numerical production targets or performance
targets 1 2 8 9
D - automatic speed of a machine or movement
of a product 1 2 8 9
E - the direct control of your boss 1 2 8 9
(TREND)
Q22A How often do you have to interrupt a task you are doing in order to take on an
unforeseen task?
SHOW CARD Q22A - READ OUT - ONE ANSWER ONLY!
1 - Very often ----------------------- > CONTINUE WITH Q22B
2 - Fairly often ----------------------- > CONTINUE WITH Q22B
3 – Occasionally --------------------- > CONTINUE WITH Q22B
4 - Never ------------------------------------ > GO TO Q23
8 - DK/no opinion (spontaneous) ------- > GO TO Q23
9 - Refusal (spontaneous) ---------------- > GO TO Q23
Fourth European Working Conditions Survey
120

(TREND)
Q22B For your work, are these interruptions...
SHOW CARD Q22B - READ OUT - ONE ANSWER ONLY!
1 - Disruptive
2 - Without consequences
3 - Positive
7 - Not relevant (spontaneous) 8 - DK/no opinion (spontaneous)
9 - Refusal (spontaneous)
(TREND)
Q23 Generally, does your main paid job involve, or not ...?
READ OUT Yes No DK Refusal
A - meeting precise quality standards 1 2 8 9
B - assessing yourself the quality of your own
work 1 2 8 9
C - solving unforeseen problems on your own 1 2 8 9
D - monotonous tasks 1 2 8 9
E - complex tasks 1 2 8 9
F - learning new things 1 2 8 9
(TREND)
Q24 Are you able, or not, to choose or change...?
READ OUT Yes No DK Refusal
A - your order of tasks 1 2 8 9
B - your methods of work 1 2 8 9
C - your speed or rate of work 1 2 8 9
Annex 6: Survey questionnaire
121

(MODIFIED)
Q25 For each of the following statements, please select the response which best describes your work
situation.
SHOW CARD Q25 WITH SCALE - ONE ANSWER ONLY PER LINE!
READ OUT Almost
always Often Sometimes Rarely
Almost
never DK Refusal
A - You can get assistance from colleagues
if you ask for it 1 2 3 4 5 8 9
B - You can get assistance from your
superiors / boss if you ask for it (MODIFIED)
1 2 3 4 5 8 9
C - You can get external assistance if you
ask for it (MODIFIED) 1 2 3 4 5 8 9
D - You have influence over the choice of
your working partners 1 2 3 4 5 8 9
E - You can take your break when you wish 1 2 3 4 5 8 9
F - You have enough time to get the job
done 1 2 3 4 5 8 9
G - You are free to decide when to take
holidays or days off 1 2 3 4 5 8 9
H - At work, you have the opportunity to do
what you do best (NEW) 1 2 3 4 5 8 9
I - Your job gives you the feeling of work
well done (NEW) 1 2 3 4 5 8 9
J - You are able to apply your own ideas in
your work (NEW) 1 2 3 4 5 8 9
K - You have the feeling of doing useful
work (NEW) 1 2 3 4 5 8 9
L - You find your job intellectually
demanding (NEW) 1 2 3 4 5 8 9
M - You find your job emotionally
demanding (NEW) 1 2 3 4 5 8 9
(MODIFIED)
Q26A Does your job involve rotating tasks between yourself and colleagues?
1 – Yes ------------------------------------- > CONTINUE WITH Q26A.1.
2 - No ---------------------------------- > GO TO Q26B
8 - DK/no opinion (spontaneous) -- > GO TO Q26B
9 - Refusal (spontaneous) ----------- > GO TO Q26B
Fourth European Working Conditions Survey
122

(NEW)
26A.1 Do the tasks require different skills?
1 - Yes
2 - No
8 - DK/no opinion (spontaneous)
9 - Refusal (spontaneous)
(NEW)
26A.2 Who decides the division of the tasks?
READ OUT Yes No DK Refusal
A - Your boss / manager 1 2 8 9
B - Decided by people who are rotating tasks 1 2 8 9
(MODIFIED)
Q26.B Does your job involve doing all or part of your work in a team?
1 - Yes ------------------------------------------- > CONTINUE WITH Q26.B1.
2 - No ----------------------------------------- > GO TO Q27
8 - DK/no opinion (spontaneous) --------- > GO TO Q27
9 - Refusal (spontaneous) ------------------ > GO TO Q27
(NEW)
Q26B.1 Do the members of the team decide by themselves…?
READ OUT Yes No DK Refusal
A - …on the division of tasks 1 2 8 9
B - …who will be head of the team 1 2 8 9
(MODIFIED)
Q27 Which of the following alternatives would best describe your skills in your own work?
SHOW CARD Q27 - READ OUT - ONE ANSWER ONLY!
1 - I need further training to cope well with my duties
2 - My duties correspond well with my present skills
3 - I have the skills to cope with more demanding duties
8 - DK/no opinion (spontaneous)
9 - Refusal (spontaneous)
Annex 6: Survey questionnaire
123

(MODIFIED)
Q28 Over the past 12 months, have you undergone any of the following types of training to
improve your skills or not?
READ OUT Yes No DK Refusal
IF YES,
indicate total
number of
days…
888 - DK
999 - Refusal
A - Training paid for or provided by your
employer, or by yourself if you are self-
employed
1 2 8 9
…….
B - Training paid for by yourself (NEW) 1 2 8 9
…….
C - On-the-job training (co-workers, supervisors) (NEW)
1 2 8 9
D - Other forms of on-site training and learning
(e.g. self-learning, on-line tutorials etc) (NEW) 1 2 8 9
E - Other (SPONTANEOUS) 1 2 8 9
(MODIFIED)
Q29 Over the past 12 months, have you or have you not, personally been subjected at work
to...?
READ OUT Yes No DK Refusal
A - threats of physical violence 1 2 8 9
B - physical violence from people from your workplace 1 2 8 9
C - physical violence from other people 1 2 8 9
D - bullying / harassment (MODIFIED) 1 2 8 9
E - sexual discrimination / discrimination linked to gender (MODIFIED)
1 2 8 9
F - unwanted sexual attention 1 2 8 9
G - age discrimination 1 2 8 9
H - discrimination linked to nationality 1 2 8 9
I - discrimination linked to ethnic background 1 2 8 9
J - discrimination linked to religion 1 2 8 9
K - discrimination linked to disability 1 2 8 9
L - discrimination linked to sexual orientation 1 2 8 9
Fourth European Working Conditions Survey
124

INTERVIEWER, QUESTIONS Q30 AND Q31 SHOULD BE ASKED TO EMPLOYEES ONLY!
IE. THOSE WHO ANSWERED “3” TO Q3A
(TREND 1995)
Q30 Over the past 12 months, have you, or not…?
READ OUT Yes No DK Refusal
A - Had a frank discussion with your boss about your work
performance? 1 2 8 9
B - Been consulted about changes in the organisation of work and /
or your working conditions? 1 2 8 9
C - Been subject to regular formal assessment of your work
performance? (NEW) 1 2 8 9
D - Discussed work-related problems with your boss? 1 2 8 9
E - Discussed work-related problems with an employee
representative? 1 2 8 9
(TREND)
Q31 Is your immediate boss a man or a woman?
1 - A man
2 - A woman
7 - Not applicable (spontaneous) 8 - DK/no opinion (spontaneous)
9 - Refusal (spontaneous)
ASK ALL!
(TREND)
Q32 Do you think your health or safety is at risk because of your work?
1 - Yes
2 – No
8 - DK/no opinion (spontaneous)
9 - Refusal (spontaneous)
(MODIFIED)
Q33 Does your work affect your health, or not?
1 – Yes --------- > CONTINUE WITH Q33A
2 – No -------------------------------------- > GO TO Q34a
8 - DK/no opinion (spontaneous) --- > GO TO Q34a
9 - Refusal (spontaneous) ------------- > GO TO Q34a
Annex 6: Survey questionnaire
125

(MODIFIED)
Q33A How does it affect your health?
SHOW CARD Q33A - READ OUT – MULTIPLE ANSWERS POSSIBLE!
Mentioned
Not
mentioned DK Refusal
A - hearing problems 1 2 8 9
B - problems with your vision 1 2 8 9
C - skin problems 1 2 8 9
D- backache 1 2 8 9
E - headaches 1 2 8 9
F - stomach ache 1 2 8 9
G - muscular pains in shoulders, neck and/or
upper/lower limbs (MODIFIED) 1 2 8 9
H - respiratory difficulties 1 2 8 9
I - heart disease 1 2 8 9
J - injury(ies) 1 2 8 9
K - stress 1 2 8 9
L - overall fatigue 1 2 8 9
M - sleeping problems 1 2 8 9
N - allergies 1 2 8 9
O - anxiety 1 2 8 9
P - irritability 1 2 8 9
Q - other (SPONTANEOUS) 1 2 8 9
(MODIFIED)
Q34A In your main paid job, over the past twelve months, have you been absent for any of the
following reasons?
READ OUT Yes No DK Refusal
A - Maternity or paternity leave 1 2 8 9
B - Educational leave 1 2 8 9
C - Family-related leave 1 2 8 9
D - Health problems 1 2 8 9
E - Other reasons 1 2 8 9
IF “YES”
CONTINUE
WITH Q34B
Fourth European Working Conditions Survey
126

IF Q34A.D =“1” CONTINUE WITH Q34B, ALL OTHERS GO TO Q35.
Q34B Over the past 12 months how many days in total were you absent from work for
reasons of health problems?
Number of days:……………………
888 - DK/no opinion (spontaneous)
999 - Refusal (spontaneous)
(MODIFIED)
Q34C Of the days of absence indicated above, can you indicate how many days were
attributable to the following:
READ OUT Number of days DK Refusal
C1 - Accident(s) at work ………………
8 9
C2 - Health problems caused by your work ………………
8 9
ASK ONLY IF RESPONDENT IS BELOW 60 YEARS OF AGE.
(TREND)
Q35 Do you think you will be able to do the same job you are doing now when you are 60
years old?
1 - Yes, I think so
2 - No, I don’t think so
3 - I wouldn’t want to
8 - DK/no opinion (spontaneous)
9 - Refusal (spontaneous)
(TREND)
Q36 On the whole, are you very satisfied, satisfied, not very satisfied or not at all satisfied with
working conditions in your main paid job?
1 - Very satisfied
2 - Satisfied
3 - Not very satisfied
4 - Not at all satisfied
8 - DK/no opinion (spontaneous)
9 - Refusal (spontaneous)
Annex 6: Survey questionnaire
127

(NEW)
Q37 How much do you agree or disagree with the following statements describing some
aspects of your job?
SHOW CARD Q37 WITH SCALE - READ OUT – ONE ANSWER PER LINE!
READ OUT Strongly
agree Agree
Neither
agree
nor disagree
Disagree Strongly
disagree DK Refusal
A - I might lose my job in the next 6 months 5 4 3 2 1 8 9
B - I am well paid for the work I do 5 4 3 2 1 8 9
C - My job offers good prospects for career
advancement 5 4 3 2 1 8 9
D - I feel myself ‘at home’ in this organisation 5 4 3 2 1 8 9
E - At work, I have opportunities to learn and
grow 5 4 3 2 1 8 9
F - I have very good friends at work 5 4 3 2 1 8 9
Fourth European Working Conditions Survey
128

Demographics (MODIFIED)
EF1 What is the highest level of education or training that you have successfully completed?
Note: LFS question; additional explanation of ISCED classification and correspondence to local
qualifications will be provided in each country
1 - No education
2 - Primary education(ISCED 1)
3 - Lower secondary education(ISCED 2)
4 - Upper secondary education (ISCED 3)
5 - Post-secondary including pre-vocational or vocational education but not tertiary (ISCED 4)
6 - Tertiary education – first level (ISCED 5)
7 - Tertiary education – advanced level (ISCED 6)
9 - Refusal (spontaneous)
(TREND)
EF3 Are you, in your household, the person who contributes most to the household income?
1 - Yes
2 - No
3 - Both equally (SPONTANEOUS) 8 - DK/no opinion (spontaneous)
9 - Refusal (spontaneous)
Annex 6: Survey questionnaire
129

(MODIFIED)
EF4 How often are you involved in any of the following activities outside work
SHOW CARD EF4 WITH SCALE- READ OUT – ONE ANSWER PER LINE!
INTERVIEWER: IF FOR ANY OF THE ITEMS FROM ‘A’ TO ‘G’ IN
QUESTION EF4 THE ANSWER IS “everyday for 1 hour or more”,
CONTINUE WITH EF4.1.
(EF4A-EF4G=1 CONTINUE WITH EF4.1)
EF4.1. How many hours per day are you involved in any of the following activities outside
work?
EF4. EF4.1.
READ OUT
Ev
ery
day
fo
r 1
ho
ur
or
mo
re
Ev
ery
day
or
every
seco
nd
day
for
less
th
an 1
ho
ur
On
ce o
r tw
ice a
wee
k
On
ce o
r tw
ice a
mo
nth
On
ce o
r tw
ice a
yea
r
Nev
er
No
t ap
pli
cab
le
DK Refusa
l
Number
of hours DK Ref.
A - Voluntary or
charitable activity 1 2 3 4 5 6 7 8 9
……… 88 99
B - Political/trade union
activity 1 2 3 4 5 6 7 8 9
……… 88 99
C - Caring for and
educating your
children
1 2 3 4 5 6 7 8 9
………
88 99
D - Cooking and
housework 1 2 3 4 5 6 7 8 9
……… 88 99
E - Caring for
elderly/disabled
relatives
1 2 3 4 5 6 7 8 9
………
88 99
F - Taking a training or
education course 1 2 3 4 5 6 7 8 9
……… 88 99
G - Sporting, cultural
or leisure activity
outside your home
1 2 3 4 5 6 7 8 9
………
88 99
Fourth European Working Conditions Survey
130

(TREND)
EF5 Presently, what is on average your net monthly income from your main paid job?
SHOW CARD EF5 - READ OUT!
INTERVIEWER.: IF NECESSARY, EXPLAIN NET MONTHLY INCOME IS THE INCOME AT
ONE'S DISPOSAL AFTER TAXES AND SOCIAL SECURITY CONTRIBUTIONS!
01 - A
02 - B
03 - C
04 - D
05 - E
06 - F
07 - G
08 - H
09 - I
10 - J
11 - K
12 - L
88 - DK/no opinion (spontaneous)
99 - Refusal (spontaneous)
INTERVIEWER: QUESTION EF6. SHOULD BE ASKED ONLY TO THOSE WHO ARE NOT
SELF-EMPLOYED!
IF Q3A =3 OR Q3A =4!
(MODIFIED)
EF6 What does your remuneration include?
SHOW CARD EF6 - READ OUT - MULTIPLE ANSWERS POSSIBLE!
Mentioned
Not
mentioned DK Refusal
A - Basic fixed salary/wage 1 2 8 9
B - Piece rate or productivity payments 1 2 8 9
C - Extra payments for additional hours of
work/overtime 1 2 8 9
D - Extra payments compensating for bad or
dangerous working conditions 1 2 8 9
E - Extra payments compensating for Sunday work 1 2 8 9
F - Other extra payments 1 2 8 9
G - Payments based on the overall performance of
the company (profit sharing scheme) where you
work
2 8 9
GOTO
EF6G_1
H - Payments based on the overall performance of a
group
2 8 9
GOTO
EF6H_1
I - Income from shares in the company your work
for 1 2 8 9
J - Advantages of other nature (for instance medical
services, access to shops, etc.) 1 2 8 9
K - Other (SPONTANEOUS) 1 2 8 9
1
1
Annex 6: Survey questionnaire
131
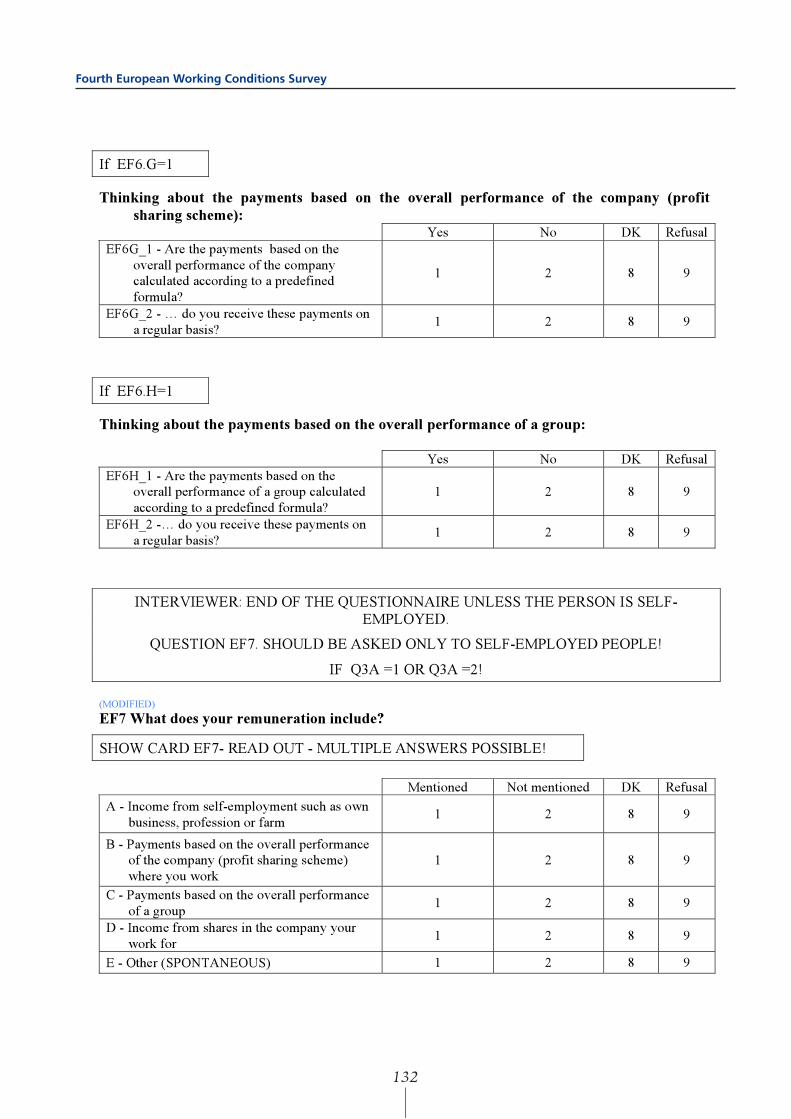
If EF6.G=1
Thinking about the payments based on the overall performance of the company (profit
sharing scheme): Yes No DK Refusal
EF6G_1 - Are the payments based on the
overall performance of the company
calculated according to a predefined
formula?
1 2 8 9
EF6G_2 - … do you receive these payments on
a regular basis? 1 2 8 9
If EF6.H=1
Thinking about the payments based on the overall performance of a group:
Yes No DK Refusal
EF6H_1 - Are the payments based on the
overall performance of a group calculated
according to a predefined formula?
1 2 8 9
EF6H_2 -… do you receive these payments on
a regular basis? 1 2 8 9
INTERVIEWER: END OF THE QUESTIONNAIRE UNLESS THE PERSON IS SELF-
EMPLOYED.
QUESTION EF7. SHOULD BE ASKED ONLY TO SELF-EMPLOYED PEOPLE!
IF Q3A =1 OR Q3A =2!
(MODIFIED)
EF7 What does your remuneration include?
SHOW CARD EF7- READ OUT - MULTIPLE ANSWERS POSSIBLE!
Mentioned Not mentioned DK Refusal
A - Income from self-employment such as own
business, profession or farm 1 2 8 9
B - Payments based on the overall performance
of the company (profit sharing scheme)
where you work
1 2 8 9
C - Payments based on the overall performance
of a group 1 2 8 9
D - Income from shares in the company your
work for 1 2 8 9
E - Other (SPONTANEOUS) 1 2 8 9
Fourth European Working Conditions Survey
132

If EF7.B=1
Thinking about the payments based on the overall performance of the company (profit
sharing scheme):
Yes No DK Refusal
EFB_1 - Are these payments based on the
overall performance of the company
calculated according to a predefined
formula?
1 2 8 9
EF7B_2 - … do you receive these payments on
a regular basis? 1 2 8 9
If EF7.C=1
Thinking about the payments based on the overall performance of a group:
Yes No DK Refusal
EF7C_1 - … are these payments calculated
according to a predefined formula? 1 2 8 9
EF7C_2- … do you receive these payments on
a regular basis? 1 2 8 9
P14 Thank you for participating in the fourth European Foundation Working Conditions
survey. The Foundation is planning to conduct a small number of follow-up interviews
(length: maximum one hour) with respondents over the coming six months.
Would you be willing to participate in such a follow-up Interviewers?
1 - Yes
2 - No
Annex 6: Survey questionnaire
133

Interview protocol
P.1 Date of the interview: Day: Month:
P.2 Time of the beginning of the interview: Hour: Minutes:
USE 24 HOUR CLOCK
P.3 Number of minutes the interview lasted: Minutes:
P4 Number of persons present during the interview, including interviewer.
1 - Two (Interviewer and respondent)
2 - Three
3 - Four
4 - Five or more
P5 Respondent cooperation
1 - Excellent
2 - Fair
3 - Average
4 - Bad
P6 Size of locality (LOCAL CODES)
P7 Region (LOCAL CODES)
P8 Postal code
P9 SAMPLE POINT NUMBER
P10 INTERVIEWER NUMBER
P11 WEIGHTING FACTOR
P12A Fixed telephone available in the household?
1 - Yes
2 - No
P12B Mobile telephone available in the household?
1 - Yes
2 - No
P13 Language of interview
Fourth European Working Conditions Survey
134

European Foundation for the Improvement of Living and Working Conditions
Fourth European Working Conditions Survey
Luxembourg: Office for Official Publications of the European Communities
2007 – VIII, 134 p. – 21 x 29.7 cm
ISBN 92-897-0974-X

EF/06/98/EN
SALES AND SUBSCRIPTIONS
Publications for sale produced by the Office for Official Publications of the EuropeanCommunities are available from our sales agents throughout the world.
How do I set about obtaining a publication?
Once you have obtained the list of sales agents, contact the sales agent of your choice andplace your order.
How do I obtain the list of sales agents?
• Go to the Publications Office website: http://publications.eu.int/
• Or apply for a paper copy by fax (352) 2929 42758

4 5 TJ-76-06-497-EN-C
Work occupies a central position in the day-to-day lives of most Europeans.
Working conditions such as working time, job content, pace of work, pay
levels and health and safety have a huge influence on individual well-being
and satisfaction. EU policymakers recognise that improving working
conditions is crucial to achieving a better quality of work, greater
productivity and increased employment – the Lisbon objectives. In this
context, the Foundation’s European Working Conditions Surveys,
conducted every five years, have been providing a valuable insight into key
aspects of work since 1990. This report analyses the findings of the fourth
European Working Conditions Survey, carried out in autumn 2005 across
31 countries, including the 27 EU Member States. Based on workers’
responses, it paints a broad and varied picture of the physical, intellectual
and psychological dimensions of work and its impact on personal fulfilment
and work-life balance.