report of the fao workshop on the use of best available ... · workshop on the use of best...
TRANSCRIPT

Report of the
WORKSHOP ON THE USE OF BEST AVAILABLE SCIENCE IN DEVELOPING AND PROMOTING BEST PRACTICES FOR TRAWL FISHING OPERATIONS IN SOUTHEAST ASIA Bangkok, Thailand, 8–13 September 2014
FAO Fisheries and
Aquaculture Report
FIAO/R1103 (En)
ISSN 2070-6987


FAO Fisheries and Aquaculture Report No. 1103 FIAO/R1103 (En)
Report of the
FAO WORKSHOP ON THE USE OF BEST AVAILABLE SCIENCE IN DEVELOPING AND PROMOTING BEST PRACTICES FOR TRAWL FISHING OPERATIONS IN SOUTHEAST ASIA
Bangkok, Thailand, 8–13 September 2014
FOOD AND AGRICULTURE ORGANIZATION OF THE UNITED NATIONS Rome, 2017


The designations employed and the presentation of material in this information product do not imply the expression of any opinion whatsoever on the part of the Food and Agriculture Organization of the United Nations (FAO) concerning the legal or development status of any country, territory, city or area or of its authorities, or concerning the delimitation of its frontiers or boundaries. The mention of specific companies or products of manufacturers, whether or not these have been patented, does not imply that these have been endorsed or recommended by FAO in preference to others of a similar nature that are not mentioned.
The views expressed in this information product are those of the author(s) and do not necessarily reflect the views or policies of FAO.
ISBN 978-92-5-109561-4
© FAO, 2017
FAO encourages the use, reproduction and dissemination of material in this information product. Except where otherwise indicated, material may be copied, downloaded and printed for private study, research and teaching purposes, or for use in non-commercial products or services, provided that appropriate acknowledgement of FAO as the source and copyright holder is given and that FAO’s endorsement of users’ views, products or services is not implied in any way.
All requests for translation and adaptation rights, and for resale and other commercial use rights should be made via www.fao.org/contact-us/licence-request or addressed to [email protected].
FAO information products are available on the FAO website (www.fao.org/publications) and can be purchased through [email protected].

iii
PREPARATION OF THIS DOCUMENT
This document is the report of the Workshop on the use of best available science in developing and promoting best practices for trawl fishing operations in South and Southeast Asia (SSA) held in Bangkok, Thailand, from 8 to 16 September 2014. The Workshop was arranged in collaboration with FAO and the Trawl Study Committee. This report summarizes the presentations of the Workshop and concludes the main discussions. The document was prepared by Professor Ray Hilborn (School of Aquatic and Fishery Sciences, University of Washington, USA) and Mr Petri Suuronen (Fishing Operations and Technology Branch, FAO). The organizers of the Workshop would like to acknowledge the Southeast Asian Fisheries Development Center (SEAFDEC) for the logistic support to this Workshop.

iv
FAO. 2017. Report of the FAO Workshop on the use of best available science in developing and promoting best practices for trawl fishing operations in Southeast Asia, Bangkok, Thailand, 8–13 September 2014. FAO Fisheries and Aquaculture Report No. R1103. Rome, Italy.
ABSTRACT
The trawl fisheries of South and Southeast Asia (SSA) are the largest in the world, and their catch is a major component of food security, poverty elimination and employment for the region. To include South and Southeast Asia (SSA) trawl fisheries in the global analysis of trawling impacts, the Trawl Study Committee initiative was conducted on 8–13 September 2014 in Thailand an expert workshop on the use of best available science in developing and promoting best practices for trawl fishing operations in South and Southeast Asia. A total of 22 experts participated in the workshop.
As elsewhere, the impact of trawl fisheries on benthic biota in this region will depend on the distribution and intensity of trawling and the sensitivity of habitats. Many benthic biota of shallow water soft bottom tropical habitats are expected to have relatively high recovery rates, and trawling in the favored shallow sandy and muddy areas is expected to have lower impacts than in areas where more sensitive biogenic habitats including sea-grasses and corals are present.
The workshop sought to: (1) identify and evaluate data on trawling distributions and impacts in South and Southeast Asia; (2) to develop and propose collaborative arrangements for sharing expertise; and (3) to evaluate best practices for trawling to enhance sustainability of food security, livelihoods and ecosystems.
Identifying best practices for the region is difficult because there are complex objectives that include food security and employment, as well as environmental sustainability and other objectives such as protection of artisanal fishing communities from industrial trawl fleets. However, common best practices have emerged, such as limitation on fleet size and composition, provision of no-trawl zones in coastal areas to protect both sensitive habitats and artisanal fishing communities, closed seasons and increasing mesh size do emerge as common themes that are being adopted.
An impediment to effective implementation of best practices is the general lack of national governments ability to enforce regulations. There appears to be a general agreement that the amount of trawl effort is more than sufficient to achieve long-term maximum yield, and in many cases there is excessive fishing capacity. It appears that the key to improving regional trawl performance is intense cooperation with the fishing fleets, and relying on the fishing fleets to strengthen self-enforcement of regulations.
The workshop served as an excellent first step in building a collaboration with a network of global trawl fishing scientists, and the collaborations identified should lead to a significant advance in our understanding of how to best manage Asian trawl fisheries.

v
Contents
PREPARATION OF THIS DOCUMENT ..................................................................................... iii
ABSTRACT ................................................................................................................................ iv
ABBREVATIONS AND ACRONYMS ........................................................................................ vi
INTRODUCTION AND PURPOSE OF THE MEETING ............................................................... 1
MAIN OUTCOME OF THE WORKSHOP .................................................................................... 2
Progress made in the Trawl Study Committee .................................................................................... 2 Phase I: Trawl footprint ...................................................................................................................... 2 Phase II: Trawling impact on biota .................................................................................................... 5 Preliminary results from the systematic review .................................................................................. 6 Phase III: Risk analysis ....................................................................................................................... 8 Phase IV: Trawling impact on target species through impact on benthic biota ................................. 9 Phase V: Evaluating alternative best practice .................................................................................... 9
KEY FINDINGS OF TRAWLING IMPACTS IN SOUTH AND SOUTHEAST ASIA ................... 11
Identification of data available ......................................................................................................... 11 Data available from specific countries and regions as presented in the workshop .......................... 13
Thailand ........................................................................................................................................ 13 Indonesia ....................................................................................................................................... 16 Viet Nam ...................................................................................................................................... 16 Malaysia ....................................................................................................................................... 17 Southeast-Asia – Malaysia TrawlBase ......................................................................................... 19 India .............................................................................................................................................. 21
DEVELOPMENT OF COLLABORATIVE ARRANGEMENTS .................................................. 25
APPLICABILITY ....................................................................................................................... 26
EVALUATION OF BEST PRACTICES ...................................................................................... 26
CONCLUSIONS AND THE NEXT STEPS IN SSA ..................................................................... 27
APPENDIX 1 - LIST OF PARTICIPANTS .................................................................................. 28

vi
ABBREVATIONS AND ACRONYMS
APFIC Asia-Pacific Fishery Commission
BoBLME Bay of Bengal Large Marine Ecosystem
CPUE catch per unit effort
DoF Department of Fisheries (Thailand)
GBR Great Barrier Reef
HAPC Habitat Areas of Particular Concern
MPAs marine protected areas
SSA South and Southeast Asia
VMS vessel monitoring system

1
INTRODUCTION AND PURPOSE OF THE MEETING
1. One of the most contentious issues in the management of marine fisheries is the use of mobile bottom contact gears, trawls and dredges. More than 25 percent of the world’s fish catch comes from the use of these gears and catch from trawls is an important element in food security in most of the world. There are growing concerns with the overall ecosystem impacts of bottom trawling. Trawls can dramatically transform sensitive benthic ecosystems, eliminating much of the associated emergent surface dwelling flora and fauna, especially on hard bottoms. In contrast, extensive studies have shown that there are fewer changes to less sensitive habitats, particularly in regions subject to frequent natural disturbance.
2. Some countries have banned industrial trawling and some major retailers refuse to stock fish caught using trawl gears. However, such decisions are not always based on the best available scientific advice. Disconcertingly, much of the scientific information available comes from fisheries in temperate waters, whereas decisions on banning trawl fisheries in recent years have largely been associated with tropical coastal fisheries where there is a paucity of data. As a consequence, there is an urgent need for a global synthesis of the scientific knowledge related to the issue, also including tropical trawl fisheries. The key questions are: (i) how does trawling affect the long-term sustainable yield of aquatic resources from an ecosystem; and (ii) how does trawling affect other ecosystem services.
3. The initiative “Finding common ground on the scientific knowledge regarding best practices in trawling” is an international collaboration of leaders in the scientific community to understand how trawling and other forms of towed bottom fishing gears interact with marine seabed habitats and their biota. The initiative (later called as “project”) is led by Profs. Ray Hilborn, Mike Kaiser and Simon Jennings and is currently funded with contributions from the Walton and Packard Foundations and fishing industries (project website: http://trawlingpractices.wordpress.com). The project is bringing together global datasets on the spatial distribution of trawl fishing activities and the impact of trawling on marine ecosystems and productivity. The project uses this information to understand the extent and consequence of trawling at a global scale and on a region by region basis for those regions from which data may be obtained. The ultimate goal is to identify a range of suitable “best practices” for trawling and determine the consequences of adopting these practices on biota, sustainable food production, ecosystems and ecosystem services and fleet performance.
4. A preliminary analysis of the datasets to which the project has had access, reveals no representation from South and Southeast Asia (SSA) which is one of the most important areas of the world in terms of the amount of trawl fishing practiced. These trawl fisheries contribute to the alleviation of poverty through the provision of food and livelihoods for people and also supply an important source (7–12 million tonnes of fish per annum) for fishmeal used for all types of aquaculture in the region. It is important to attempt to address this data gap and to engage with stakeholders and science users in the SSA region to raise awareness on the potential of a best practice for trawling.
5. To include SSA trawl fisheries in the global analysis, the project conducted an expert workshop in Thailand from 8–13 September 2014 entitled: Workshop on the use of best available science in developing and promoting best practices for trawl fishing operations in Southeast Asia. The workshop was organized by the project by the project in close collaboration with the FAO Fishing Operations and Technology Branch (FIRO). Research institutions, universities, organizations and individual experts involved in the data collection and research work dealing with the assessment and/or management of ecosystem impacts of bottom trawl fishing in SSA were identified, and when applicable, invited to the workshop. In total, 22 experts participated in the workshop, half of them from the South and Southeast Asia (the list of participants is presented in Annex I).

2
6. The overall goal of the workshop was: (i) the identification of what data are available, where they are located, and who is involved in generating these data, as well as gaps in knowledge; (ii) development of a collaborative arrangement for sharing expertise and data; (iii) evaluation of the availability and applicability of data on habitats, bycatch and ecosystem impacts of bottom trawl fishing in the SSA region; (iv) assemble the data on trawl intensity in representative South and Southeast Asian ecosystems; and (v) evaluation of best practices for trawling to enhance sustainability of food security and livelihoods and marine ecosystems in SSA trawl fisheries.
MAIN OUTCOME OF THE WORKSHOP
7. The first part of the workshop was dedicated to the Trawl Study Committee meeting (3rd meeting of the Committee) with the purpose to summarize the progress made in the five phases of the project and to prepare material for the other part of the workshop that the SSA participants attended. The work consisted of presentations, plenary discussions and separate working groups which were country/area based. Below are summaries of the progress made so far in each five phases of the project and the key findings of the work related to trawling impacts in the south and Southeast Asia.
Progress made in the Trawl Study Committee
Phase I: Trawl footprint
8. The first phase will examine the extent of trawling and habitats, compiling as much data as possible on the area trawled, the habitats trawled and the intensity of trawling. Particular attention will be paid to identifying data on the trends in the extent and frequency of areas trawled, and the distribution of trawl footprint across different habitat types. Thus far, no data sets are available from Asia. Areas with data are shown in Figure 1. Question marks indicate data that may be available for the study, however, the availability is not yet confirmed.
Figure 1
This map illustrates as check marks the regions where either we have data on the location and intensity of trawling or regional scientists have such data and are collaborating with the project. Question marks indicate where the data exist and collaborations are currently under discussion. Source: Prepared by Kathryn Hughes, University of Bangor, for trawling best practices project using the project’s database.

3
9. From the detailed data on trawl gear characteristics, and the speed and duration of trawling, we can calculate the area swept by the trawls and the total amount of bottom covered a given number of times per year (Figure 2).
Figure 2
This graph illustrates what fraction of the area is trawled and how many times per year. Data was taken from only one area of Australia. Source: Prepared by the project team on Trawling Best Practices project’s trawl effort data base.
10. In this particular area, more than half of the area is not trawled at all, a further 40 percent is trawled one time or less per year and a total of 8 percent of the bottom is trawled more than once per year. The common result found from the data sets available was that much of the bottom is not trawled at all, and a small fraction of the area is intensively trawled, although, of course, the results depend on the boundaries of the study region are placed. Apparently, some of the areas are not trawlable, for example, rocky terrains.
11. For many of the data sets there is also a time series of total trawl effort, either as the number of trawl tows, total area swept, or hours towed. The data collected for the areas of the Gulf of Mexico U.S. shrimp fishery and the Great Barrier Reef in Australia shrimp/prawn fishery are shown in Figures 3
and 4.

4
Figure 3
Total trawl effort for the Gulf of Mexico shrimp trawl fleet. Y axis is trawl swept area divided by the total shelf area. Source: Prepared by the project team on Trawling Best Practices project’s trawl effort database.
Figure 4
Time trend of trawl effort (total trawl hours) in the Queensland trawl fishery in the Great Barrier Reef (GBR) area. Source: Prepared by Dr Roland Pitcher based on data in: Pears, R.J., Morison, A., Jebreen, E.J., Dunning, M., Pitcher, C.R., Houlden, B., Courtney.A.J., Jacobsen, I.P. (2012) Ecological Risk Assessment of the East Coast Otter Trawl Fishery in the Great Barrier Reef Marine Park. Great Barrier Reef Marine Park Authority Technical Report. 276 pp. http://hdl.handle.net/11017/1147).
12. A second part of Phase I is matching the trawl footprint to the type of the bottom habitat. We have been able to obtain seabed sediment data from dbSEABED, a global data base of seabed samples

5
based at the University of Colorado (website: instaar.colorado.edu/~jenkinsc/dbseabed/), and we are currently matching our trawl footprint data to the bottom habitat data.
Phase II: Trawling impact on biota
13. The second phase is compiling and evaluating data on the impact of trawling on the abundance and diversity of bethic biota, looking especially at the key factors of intensity of trawling and type of habitat trawled (Figure 5). Where possible, information on responses of key ecosystem services to trawl disturbance is being inferred from published studies.
Figure 5
A schematic diagram illustrating how trawling affects the abundance of different biota in different ways. Seagrass and cockles are reduced in abundance, while scavengers increase. Data are from previous published studies. Source: Prepared by Kathryn Hughes, University of Bangor, for trawling best practices project using the project’s database.
14. The major effort in Phase II has been an extensive literature review of experimental and comparative studies of trawl impacts, carefully noting the type of fishing gear, type of bottom habitat and kind of benthic biota that are involved.
15. The systematic review process is currently at the data extraction and preliminary analysis stage. To date, ~37 000 papers were identified as potentially relevant from the initial search. From this, 850 papers were deemed relevant based on their title alone, which were then screened according to abstract content, from which 320 were excluded. At present, 108 studies have been formally accepted to be used at the meta-analysis stage. Of these, 53 are experimental studies, 53 are comparative studies and there are two studies that incorporate both experimental and comparative. Aside from these, there are a further ~120 potential papers which need to be screened at full text, ~100 papers that have not yet been located at full text and ~100 abstracts that have not been located.

6
Further screening needs to be applied to ~30 review papers, as well as the bibliographies of the papers that have been accepted to be used in the meta-analysis. Currently, the extracted database includes ~80 experimental studies and ~31 000 response values; ~50 comparative studies and ~5 000 response values. The previous data assemblies contained c. 5 000 response values, thus, we have increased the evidence base six times. At present, 73 papers have been fully extracted, 31 comparative papers and 42 experimental papers. There are at least 31 papers identified as potentially relevant that need to have data extracted.
Preliminary results from the systematic review
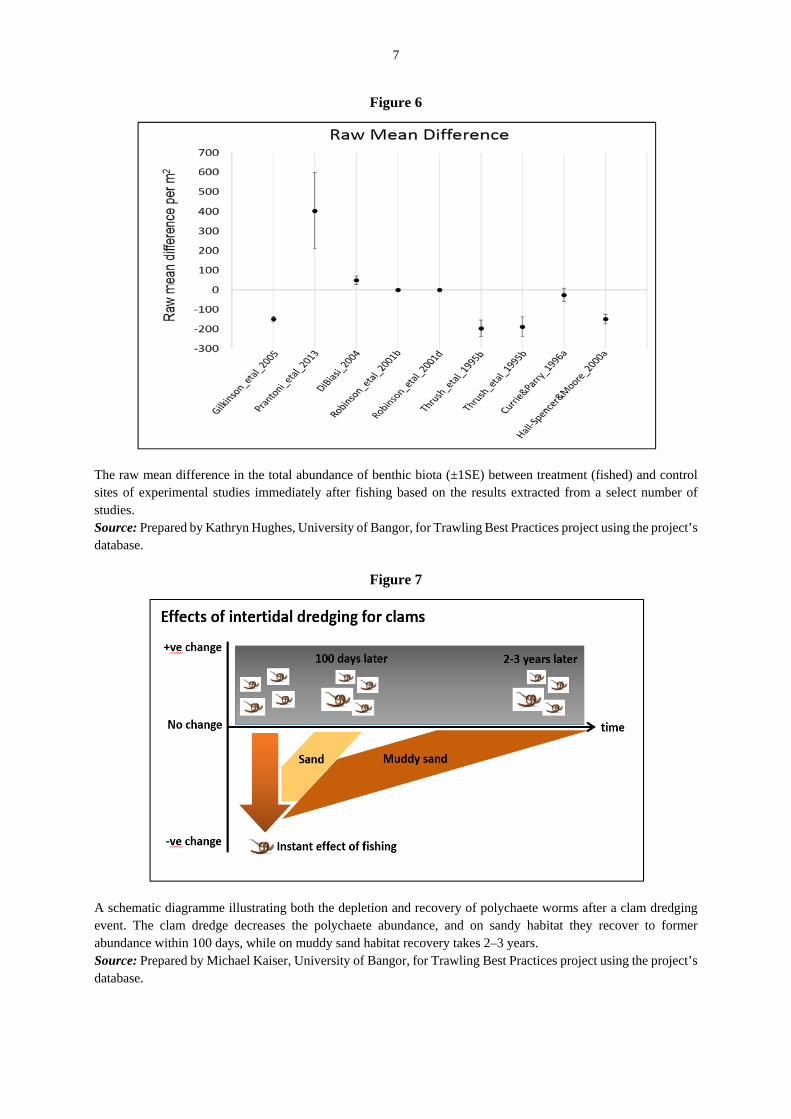
16. Some preliminary results from the data already extracted from the systematic review process for experimental studies are presented here. Figure 6 shows the standardized raw mean difference between a treatment (i.e. an experimentally fished) area and a control area, with a negative difference indicating the fishing had a negative impact on the marine benthic abundance. Studies were extracted where a mean and variance were reported for a measure of abundance within three days of the fishing impact where sampling occurred on a spatial (square metre) scale (rather than an arbitrary index e.g. diversity, or a volume scale). Extracting on a common basis allows direct comparison of results. All studies are standardized to m2 prior to analysis to ensure the results are comparable.
17. Negative values in Figure 6 illustrates that marine benthic fauna is in general less abundant in areas that have been subjected to a fishing event in comparison to areas where no fishing has taken place, across all habitats and gear types. Each study has been allocated a statistic (or ‘effect size’, in this case a raw mean difference) which represents the mean difference between the treatment and control samples. There is an overall significantly negative impact from fishing (average mean difference of -34.04 according to a random effects analysis), however, subgroup analysis (re-analyzing using mores studies but separating potential driving factors) may illustrate the true impact of fishing is dependent on factors such as the habitat type and the gear used. Other influencing factors might include the intensity of the fishing disturbance event, the time between fishing and the survey and the level of natural disturbance for the area, also whether the response (benthic faunal abundance) includes opportunistic scavengers.
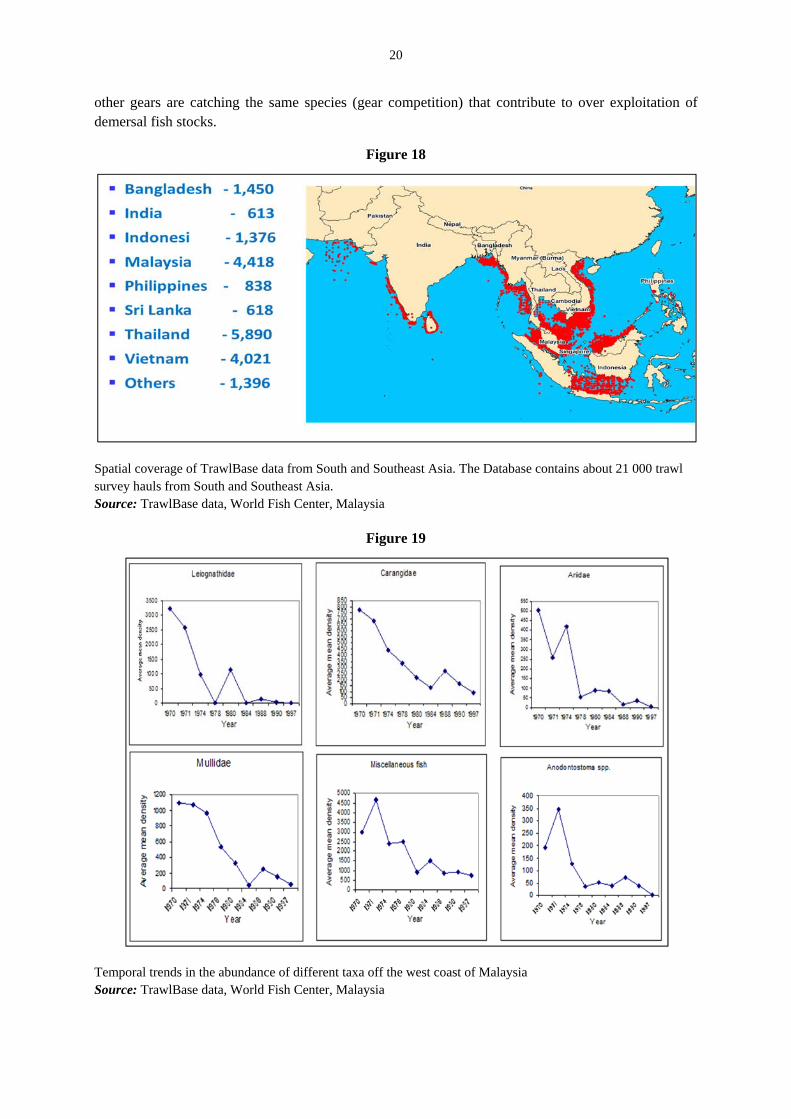
18. A second element of Phase II is the recovery rates of different biota on different habitats after trawling (or other towed fishing gears). The net impact of trawling for any specific taxon on any specific habitat will depend on the frequency of trawling, the amount a pass of the trawl reduces the abundance of the taxon, and the rate of recovery. These factors are illustrated in Figure 7 where we see that polychaete worms recover within 100 days on a sandy habitat, but require 2–3 years to recover in muddy sand.
7
Figure 6
The raw mean difference in the total abundance of benthic biota (±1SE) between treatment (fished) and control sites of experimental studies immediately after fishing based on the results extracted from a select number of studies. Source: Prepared by Kathryn Hughes, University of Bangor, for Trawling Best Practices project using the project’s database.
Figure 7
A schematic diagramme illustrating both the depletion and recovery of polychaete worms after a clam dredging event. The clam dredge decreases the polychaete abundance, and on sandy habitat they recover to former abundance within 100 days, while on muddy sand habitat recovery takes 2–3 years. Source: Prepared by Michael Kaiser, University of Bangor, for Trawling Best Practices project using the project’s database.

8
Phase III: Risk analysis
19. Phase III will conduct a risk analysis of the impacts of trawling on sedimentary habitats, for regions and fisheries where adequate data are available from Phases I and II. The analysis will be a spatially explicit landscape-scale assessment of habitat status relative to an untrawled condition. At the November 2013 meeting, a preliminary example was presented for a regional-scale trawl fishery in Australia. This spatial mapping in this example currently remains confidential (because of the explicit mapping of effort), but another illustrative example for a large bay was prepared and
provided as Appendix 2 in the November 2013 meeting report http://trawlingpractices.files.wordpress.com/2014/01/trawl-second-meeting-report.pdf ).
20. The Phase III risk analysis has critical inputs from Phases I & II, as follows:
i) The spatial maps of trawl effort intensity from Phase I.
ii) The spatial maps of sedimentary habitats from Phase I.
iii) The impact rates per trawl pass for different sedimentary habitats from Phase II.
iv) The recovery rates after trawling for different sedimentary habitats from Phase II.
21. These data from Phases I and II are to be combined in a simple model, based on those used for fisheries stock assessments, to estimate the expected long-term status of each sedimentary habitat type. Initially, this will be a relative assessment at the habitat level — essentially aggregating across all fauna that typify each habitat. The relative status of habitats can be mapped or presented in a highly summarized form — for example, presenting how much each taxon on each habitat type would be reduced by the existing trawl effort. The project has aspired to extend the risk assessments down to the faunal level (see below).
22. As Phase III is critically dependent on Phases I and II, further progress is based on completion of outputs from these pre-requisite phases. To date, most work has been directed at contributing to assisting the collation of trawl effort data (including processing & gridding methods), habitat data, and datasets for the meta-analysis.
23. The previous meeting of the Trawling Best Practices Committee reviewed the proposed risk analysis methods and considered several alternative methods of presenting the outputs that will be able to avoid confidentiality issues associated with many trawl effort datasets.
24. Phase III is the major synthesis of the trawl footprint and impact on biota and will let us calculate for each area where we have data how much each taxon has been reduced (Figure 8).

9
Figure 8.
An example of calculations in the risk analysis phase where the relative abundance of different taxa depends on how frequently the habitat is trawled and species-specific differences in the rates of removal. Polychaetes are less sensitive to trawl impacts while bivalves are much more sensitive. Source: Prepared by Kathryn Hughes, University of Bangor, for the Trawling Best Practices project using the project’s database.
Phase IV: Trawling impact on target species through impact on benthic biota
25. The fourth phase is looking at the how, the medium and long-term impacts of trawling on benthic biota affect the productivity and sustainable yield of different target species and from the ecosystem as a whole. It seems likely that trawling benefits some species and is detrimental to others. How does trawling affect the long-term sustainable yield of aquatic resources from an ecosystem? How does trawling affect other ecosystem services? A manuscript has been prepared and is in its final stages of editing before submission to a scientific journal.
Phase V: Evaluating alternative best practice
26. Phase V will identify and test a range of management options and industry practices that may improve the environmental performance of trawl fisheries, with a view to defining ‘best practice’. For each option or practice, the impact on biota, sustainable food production, and ecosystems and ecosystem services will be evaluated, along with changes in fuel consumption and other costs and impacts for the harvesting sectors.
27. Group discussions and research have identified a range of practices and options that are intended to promote sustainable harvesting with trawls (Table 1), including some management practices that are commonly used in the South and Southeast Asia (SSA) region. Each practice has a primary objective, associated habitat benefits, and resource requirements that may or may not perform well depending on local circumstances. For example, trawling prohibitions in the nearshore and spatial zoning by vessel class are widely used in the South and Southeast Asia, particularly when there are multiple scales of fishing operations and when monitoring, control and surveillance capabilities are limited. Similarly, freezing the footprint of trawl fisheries has been implemented as a precautionary measure in Alaska, because of sustained high catches and capabilities to monitor vessel positions (i.e. onboard observers and vessel monitoring system (VMS).

10
Table 1. Management and industry practices that will be used in an evidence-based analysis to identify best practices for minimizing the impacts of bottom trawling.
Management Practice Description
Freeze fishing footprint Future trawling is limited to previously trawled areas.
Prohibition (closures) by gear type
Trawls cannot be used in designated geographic areas, such as the nearshore zone. Closures may be permanent, seasonal, rotational, or bycatch-activated.
Gear modification Specific configurations are required to reduce impacts on the seafloor.
Invertebrate by-catch quotas The aggregate catch of designated benthic invertebrate(s) is limited.
Habitat impact quotas
A theoretical gear- and habitat-specific “cap-and-trade” system for effort control. The aggregate quota is intended to achieve specific habitat-conservation goals.1, 2
Broad-scale habitat management
Activities including trawling are restricted in designated areas (e.g. MPAs), as part of a multi-purpose habitat-conservation programme.
Small-scale sensitive habitat protection
Trawls cannot be used in designated areas with especially sensitive habitat(s), such as Habitat Areas of Particular Concern (HAPC).3
Rolling hot spots
Trawling effort is voluntarily redirected to another geographic area usually because of high bycatch of prohibited species.4
Removal of effort
Fleet reductions through buybacks, licensing, etc. to reduce overall trawling effort and the trawling footprint.
28. A set of performance metrics is also being developed to compare and contrast the efficacy of the different approaches, using an evidence-based analytical framework that links to outcomes from the preceding phases of the project (Table 2). For example, the Phase III risk analysis provides a basis for considering probable responses to trawl-gear modifications that are designed to minimize contact with the seafloor and reduce the removal of benthic biota, while Phase IV methodology supports interpretation of the corresponding changes in impacts on target fish. Similarly, the effects of closures that redirect effort to other habitat types can be considered based on understandings of habitat-specific impact relationships resulting from Phases I and II. Committee work in this area is concentrating on the methodology for incorporating this information into a risk-based evaluation of best practices.
1 Holland, D. S., and Schnier, K. E. 2006. Protecting marine biodiversity: a comparison of individual habitat quotas and marine protected areas. Canadian Journal of Fisheries and Aquatic Sciences, 63: 1481–1495. 2 Holland, D. S., and Schnier, K. E. 2006. Individual habitat quotas for fisheries. Journal of Environmental Economics and Management, 51: 72–92 3 https://alaskafisheries.noaa.gov/habitat/efh/hapc/default.htm 4 For example, near real-time reporting of bycatch levels by vessel and location, see: Gauvin, J. R., Haflinger, K., and Nerini, M. 1996. Implementation of a voluntary bycatch avoidance program in the flatfish fisheries of the eastern Bering Sea. Alaska Sea Grant College Report No. 96–03, University of Alaska, Fairbanks.

11
Table 2. Impact metrics that will be the basis for evaluating performance of the different management and industry practices to minimize trawling effects.
Performance Metric Description
Benthic biota
Biomass, species diversity/richness, species composition, size spectra and other ecological proxies for impacts on fish populations.
Sustainable food production and food security
Harvest levels and catch composition affecting domestic consumption and export markets.
Ecosystems and ecosystem services
Spatial extent and inclusion of representative habitats, especially those supporting vital ecological functions such as spawning, feeding and growth to maturity.
Fleet performance
Direct costs affecting operational efficiency, including those related to gear changes or modification, fuel usage, and catch rates.
29. Clearly, the definition of best management practices will differ by location and the circumstances, such that useful guidelines and performance metrics must be flexible and account for a broad range of biological, technical, and socio-economic factors not the least of which are the local policy drivers for fishery management. To this end, the committee spent three days conferring with trawl-fishery experts from India, Indonesia, Malaysia, Thailand, Philippines, and Viet Nam to gain a better understanding of management practices in the region. This consultation is the subject matter for the bulk of this report. Continuing work will include stakeholder consultations on elements of the best-practice analytical framework, a global review of successful and unsuccessful applications of the different management options, and supplementary case studies of small-scale and commercial trawl fisheries in several South Southeast Asian countries. While the trawl study committee has primarily focused on impacts on benthic biota, the definition of best practice in Asia needs to be closely integrated with the impacts of best practice on yield of target species.
KEY FINDINGS OF TRAWLING IMPACTS IN SOUTH AND SOUTHEAST ASIA
Identification of data available
30. Each SSA participant presented a report on the data available for trawl fisheries in their country and or region (Table 3). Data available included the characteristics of the trawl fleets, their catch and effort distribution. In addition, the participants presented a number of experimental and comparative studies of benthic biota and sediments.

12
Table 3. Summary of the area covered in each of the presentations
Participant V.R. Madhu B.
Meenakumari A.P.
Dineshbabu E.
Vivekanandan L.R. Garces
Country India India India India S and SE Asia
Region Saurashtra coast,
Gujarat Veraval Coast,
Gujarat All India Chennai
All S. and Se Asia
Fleet description
Yes Yes Yes
Effort For years
2003–2010 Yes Yes
Location of trawls
A sample summarized for all of Gujarat
Yes
Regulations Closed seasons,
codend mesh size
Yes Yes
Surveys Yes
Catch rate Yes Yes Yes Catch composition
Yes Yes Yes Yes
Benthic sampling
Biota and sediments
Biota and sediments
Experimental studies
Yes
Table 3. Summary of the area covered in each of the presentations
Participant P. Khemakorn Adnan
Nuruddin N. Viet Nghia
Isara Chanrachkij
M Natsir
Country Thailand Malaysia Viet Nam Thailand Indonesia
Region All Thailand All Malaysia All Viet-Nam Paknam Pran
Estuary All Indonesia
Fleet description
Yes Yes Yes Yes
Effort Yes Yes Yes Arafura sea
Location of trawls
Yes (not VMS) Yes
Regulations Yes Yes
Surveys Yes Yes
Catch rate Yes Catch composition
Yes Yes Yes Yes
Benthic sampling
Biota and sediments
Biota and sediments
Biota and sediments
Experimental studies

13
31. In terms of understanding the consequences of alternative best practices, many of the countries have data that are quite relevant. While there are no areas with complete VMS or observer data that give precise locations of all tows, for many areas we have estimates of total trawl hours and vessel characteristics that could provide estimates of total swept area, and overall intensity of trawling per unit area. Data could be used from the limited VMS studies to estimate the concentration of effort and thus, estimate the proportion of area trawled 0, 1, 2 times per year assuming the concentration of trawling is comparable.
32. Many areas have sediment composition data, and comparison of biota between trawled and untrawled areas can be used to estimate the overall impact of bottom contact trawls on biota.
Data available from specific countries and regions as presented in the workshop
Below are the summaries of the individual presentations.
Thailand
In Thailand there are about 4 000 trawlers, mainly small- (<14 m) and medium-sized (14–18 m) otter board trawlers (there are also lager trawlers, but their total number is less than 500 – Figure 9). There has been a significant reduction in the number of vessels since 1990 (about 1/3 as many now as then). Smaller trawlers operate at shallow coastal waters (10–40 m) and shrimp is one of the major target species, but the catch of low value/trash fish55 is significant. Medium-size trawlers operate mainly at 15–50 m depth range and target mainly demersal fish – they catch less shrimp and trash fish than in smaller trawlers. Pair trawlers target mainly demersal and pelagic species – shrimp is not important and trash fish is only some 10 percent of the catch. The fishing grounds in the Gulf of Thailand are mainly covered by sand and mud – apparently there are no local studies on the impact of trawling of seabed habitats because it is not considered an issue in Thailand. The Andaman Sea has a narrow shelf and trawling takes place near the coast. The major concerns in Thailand are the direct impacts of trawling on fisheries resources. Abundance has been monitored by research vessel and there has been some reduction in demersal fish with a significant reduction in the low value fish component (Figures 10 & 11). One cause of the reduction in trash fish is the increasing use of these species in surimi and they are no longer reported as trash. Apparently, there are no local studies on the impact of trawling of seabed habitats and biota because Thailand lacks facilities and resources to conduct such studies. Nonetheless, there has been some benthic sampling in dissolved oxygen and ammonium-nitrogen before and after trawling (Figure 12).
5 Fish that have a low commercial value by virtue of their low quality, small size or low consumer preference (APFIC 2005). They are either used for human consumption (often processed or preserved) or fed to livestock/fish, either directly, or through reduction to fish meal/oil.

14
Figure 9
Numbers of trawlers in 1970–2007 in Thailand. Source: Annual National Fisheries Statistics of Thailand (Department of Fisheries, DoF)
Figure 10
CPUE obtained by DOF (Department of Fisheries) research vessel in the southern Gulf of Thailand (kg/hour) in 2003–2013. Source: Annual National Fisheries Statistics of Thailand (Department of Fisheries, DoF)

15
Figure 11
Changes in abundance (CPUE) or marine resources in the Gulf of Thailand as measured by trawl surveys. Source: Sanguansin, Joompol, “Management on Demersal Resources in the Gulf of Thailand” (2010) 63(2) (March-April) Thai Fisheries Gazette.
Figure 12
Changes in dissolved oxygen and ammonium-nitrogen before and after trawling in Thailand (yellow = before, red = after). Source: Prepared by Isara Chanrachkij based on a study “Environmental Impacts of Undulated Surf Clam (Paphia spp.) in Dredge Fishing: Case Study in Paknam Pranburi Estuary and Adjacent Areas. Master of Science thesis, Faculty of Fisheries, Kasetsart University, Bangkok, Thailand, 2012).

16
Indonesia
The total number of vessels of all types has decreased from 150 000 in 2008 to 36 000 in 2012. The reduction has mainly taken place in very small-sized boats – hence, number of trawlers (which mainly are the larger vessels) may not have changed that much. Some CPUE data (tonnes/year) was presented for some specific year, but no trends were presented. The Arafura Sea is the major area of trawl fishing. Shrimp is an important target species, but there are also trawlers targeting fish. There is information of the distribution of shrimp and fish trawling (Figure 13). Shrimp trawlers are fishing mainly at depths of 10–40 m and finfish trawlers at depths of 30–80 m on mainly mud seabed.
Figure 13
Location of trawl tows in the Arafura Sea, Indonesia, demonstrating the areal fishing intensity. Based on VMS data. Study by Suryanto and A. Widodo (2011). Source: Based on a study by Suryanto and Widodo, Jurnal Ilmu dan Teknologi Kalautan Tropis, 2011, Indonesia
Viet Nam
Since the mid-2000s there has been a rapid increase in fleet size and total landings – now there is stabilization and likely the numbers of vessels will start to go down. There are about 120 000 vessels, but it is not clear how many of them are trawlers (apparently a fraction only). There are data on fishing

17
grounds and effort distribution, and on catch composition and CPUE (Figure 14). Annual landings are decreasing and demersal fish resources are declining.
Figure 14
Spatial distribution of trawl effort in Viet-Nam in 2011–2013 Source: Research Institute for Marine Fisheries, Viet Nam
Malaysia
There are about 6 000 trawlers in Malaysia, mainly small-scale. Most trawlers are not able to fish deeper than 100 m. Malaysia has instituted a zoning system based on the size of the trawlers (Figure 15). Effort data were summarized in Figure 16. Landings have been stable during the last years but trash fish landings dropped significantly in early 2000s. There are some habitat studies (Figure 17), but there are no specific studies on the seabed habitat impacts of trawl fishing.

18
Figure 15
Schematic diagram of the zoning system for trawlers in Malaysia Source: Department of Fisheries, Malaysia
Figure 16
Trawl fishing effort in Malaysia in 2012. Fishing effort for WCPM, ECPM, Sarawak, Sabah and Labuan are also available in the Annual Fisheries Statistics. “Cumulative Effort” is the aggregation of estimated monthly fishing effort. Source: Department of Fisheries, Malaysia

19
Figure 17
Density of benthic macrobenthos and sediment grain types off the west coasts of Malaysia. Source: M/V SEAFDEC Cruise 2006, Department of Fisheries, Malaysia
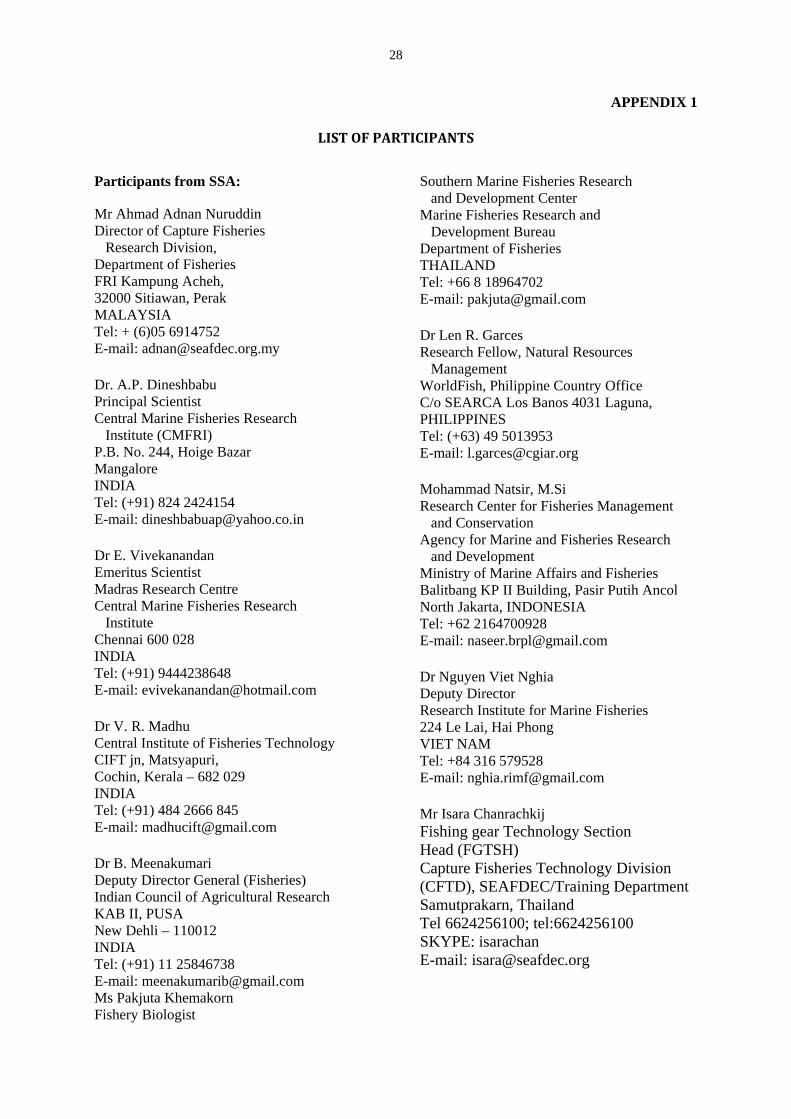
Southeast-Asia – Malaysia TrawlBase
A presentation was made on data available from TrawlBase, maintained at the World Fish Center. The database (as of 2004) contains information from over 21 000 trawl survey hauls from the Southeast Asia region (Figure 18). Species composition in trawl catches has changed since 1970s. There has been a general declining trend in species abundance and CPUE. Figure 19 illustrates this trend based on analyses of trawl survey data for the west coast of Malaysia. The presentation also stressed that many
20
other gears are catching the same species (gear competition) that contribute to over exploitation of demersal fish stocks.
Figure 18
Spatial coverage of TrawlBase data from South and Southeast Asia. The Database contains about 21 000 trawl survey hauls from South and Southeast Asia. Source: TrawlBase data, World Fish Center, Malaysia
Figure 19
Temporal trends in the abundance of different taxa off the west coast of Malaysia Source: TrawlBase data, World Fish Center, Malaysia

21
India
Several presentations were made on Indian trawl fisheries; one covering the country generally, and several examining regional fisheries. Indian catches have been increasing until recently and the kind of decline in catch seen in other SSA countries has not occurred in India. There are more than 35 000 trawlers in India – steel trawlers with engine power of more than 400 hp are replacing wooden vessels, leading to more fishing power. CPUE has increased during most recent years (Figure 20), mainly the low-value species and increasingly juveniles. Previously, shrimp was the main target species – now finfishes and cephalopods are the main target species, in general representing more than 90 percent of the catch.
Figure 20
Changes in catch rate and hours of operation of trawlers in India. Catch rate of trawlers increased from 45 kg/hour in 2008 to about 75 kg/per hour in 2012. Source: Central Marine Fisheries Research Institute (CMFRI), India The presentations from India described some studies done on the impacts of trawling on seabed habitats and seabeds (Table 4 and Figure 21). Most benthic habitats are mud and biogenic habitats are rare.

22
Table 4. Rates of decrease in organic matter at different depths in India due to bottom trawling.
Depth Rate of decrease (%)
15 – 20 m 5.06
21 – 25 m 2.94
26 – 30 m 2.72
31 – 35 m 4.46
36 – 40 m 14.02
Figure 21
Changes in abundance of polychaete tubes and damaged shells before and after trawling Source: Dineshbabu, A.P., Thomas Sujitha, E. V. Radhakrishnan, A. C. Dinesh, 2012. Preliminary experiments on application of participatory GIS in trawl fisheries of Karnataka and its prospects in marine fisheries resource conservation and management. Indian Journal of Fisheries, 59(1): 15–22.
On the west coast of India, trawl fishing effort is concentrated mainly in depths less than 50 m (more than 66 percent of the effort Figure 22). These fishing grounds are highly impacted by trawling pressure and biodiversity degradation.

23
Figure 22.
Distribution of trawl effort in southwest of India. Even with the extension of fishing grounds, the fishing pressure was found to be concentrated (more than 66%) inside of 50 m and these fishing grounds are highly impacted by trawling pressure and biodiversity degradation. Source: Dineshbabu, A P; Radhakrishnan, E V; Thomas, Sujitha; Maheswarudu, G; Manojkumar, P P; Kizhakudan, Shoba Joe; Pillai, S Lakshmi; Chakraborty, Rekha D; Josileen, Jose; Sarada, P T; Sawant, Paramita Banerjee; Philippose, K K ; Deshmukh, V D; Jayasankar, J; Ghosh, Shubhadeep; Koya, Mohammed; Purushottama, G B; Dash, Gyanaranjan, 2013. Appraisal of trawl fisheries of India with special reference on the changing trends in bycatch utilization. Journal of the Marine Biological Association of India, 55 (2): 69–78.
A presentation on the Gujarat area (India) described the fishing fleet and their gears, including some mapping of effort (Figure 23). There have been some studies of trawl impacts and changes in benthic flora and fauna.Figure 23
Distribution of trawl effort in the Gujarat region of India Source: CMFRI-CIFT-MPEDA project on square mesh codend. Technical report, December 2009

24
On the southeast coast of India in the Chennai region, there are 550 trawlers fishing about 200 days on average. The number of trawlers has not increased lately, but the total horsepower has increased dramatically (about ten-fold during the last 30 years). Hence, the fishing capacity has increased and the trawled area has expanded. Catch rates have decreased with the increase of effort (Figure 24 and 25). Seasonal trawling bans (closures) for 45 days during April-May in the last 15 years are believed to have prevented the increase in the overall fishing effort. Landings have recently been more or less stable, but there has been a change in species composition in the catches. Two thirds of the common commercial species are thought to be overexploited. It is commonly agreed that there should be: (i) a freeze in trawler numbers; (ii) no high power engines should be allowed; (iii) minimum mesh size should be increased; (iv) duration of seasonal closures increased; (v) shallow coastal waters should be made non-trawling areas (no trawling within 5 km zone); (vi) protected species should be released, and (vii) a vessel monitoring system (VMS) should be established. VMS benefits fisherman because it improves safety. There are effective community-based self-enforced monitoring systems.
Furthermore, as the CPUE and economic returns from trawl operations are decreasing, the trawlers are increasingly being converted into gillnetters, especially along the southeast coast of India. In the last two years, about 100 trawlers have been converted into gillnetters. There are conflicts between trawl operators and those operating other gears. For example, along the southeast coast, hook & line fishermen want to increase the deployment of artificial reefs, which is objected to by the trawler operators. Ring-seine fishing is banned along Tamil Nadu coast (southeast coast) but still continue to be operated along several locations along the coast. This is objected by trawl fishermen, who complain that fish available to them is reduced because of illegal use of ringseines.
Figure 24
Change in landings and catch rates in the Chennai trawl fishery of India. Source: Dr E. Vivekanandan (personal communication) from data collected from CMFRI

25
Figure 25
Catch rate in the trawl grounds of the Chennai trawl fishery. Source: Dr E. Vivekanandan (personal communication) from data collected from CMFRI It was noted that during the last five years, the discarding by the trawlers has in general decreased in India but at the same time the targeted fishery for low-value fish has increased, especially along the southwest coast of India. This is mainly due to increasing demand of fish meal plants to produce feed for aquaculture farms. The low-value catch includes small-sized adult fishes, as well as juveniles of commercially important species.
DEVELOPMENT OF COLLABORATIVE ARRANGEMENTS
At the end of the SSA session, collaborative arrangements were discussed and agreed, and are summarized in Table 5.
Table 5. Possible collaborative arrangements identified and defined at the workshop.
Country Collaborator from the
Committee
Collaboration topic
Thailand Hilborn Assist in getting the trawl data and studies of Gulf of Thailand and other regions of Thailand published in international journals.
India (Dineshbabu)
Kaiser Input and consultation into maximizing the analysis of existing datasets from trawl impact studies. Assistance in data processing of a spatial data base on trawl impact in Southwest coast of India.
India, Thailand, Malaysia, Vietnam
Kaiser Providing advice on approaches to undertaking trawl impact studies
Entire Region Kaiser Write a ‘best practice’ paper for undertaking trawl impact studies with consideration of the pros and cons of different approaches, the type of data that needs to be collected and the type of information needed to inform a study design

26
Country Collaborator from the
Committee
Collaboration topic
(target regional journal to ensure it is read by the people in the area) (generic application whole group)
N.W. India (VR Madhu)
Jennings and McConnaughey
Conduct preliminary analyses of shoot and haul position data for trawlers operating off NW India and to assess if these data can be gridded as a contribution to the Phase 1 TBP analysis and paper.
Malaysia (Nuraddin)
Jennings, Amoroso
Consult with Malaysian colleagues regarding access to VMS data for larger Malaysian vessels >40 GRT. If data available for analysis then work together to progress preliminary analysis of trawl footprint as a contribution to Phase 1 of TBP
Indonesia Arafura Sea (Natsir)
Jennings, Amoroso
Conduct preliminary analysis of VMS data for Indonesian trawlers operating in the Arafura Sea. Aim to work together with Natsir to progress this analysis of trawl footprints to the stage where it can be included as a contribution to Phase 1 of TBP.
APPLICABILITY
Given the available data, it should be possible to calculate the impact of alternative management regimes on food security, incomes and benthic impacts associated with current and possibly altered trawl regimes. The key question for food security is whether changes in total trawl effort, mesh size and spatial management would improve food security. The answer to this question will likely differ from country to country and area to area, but an obvious next step is policy analysis of alternative management practices. A high priority activity would be to conduct some pilot projects to test if the data are indeed sufficient to evaluate alternative management systems.
EVALUATION OF BEST PRACTICES
There are a range of different regulations dealing with trawl fisheries in SSA region. Table 6 summarize those regulations in different countries.
Table 6. Summary of the range of trawl regulations employed in different countries.
Country Trawl regulations in place
India Vessel numbers and size, closed seasons, closed nearshore, mesh size restrictions, MPAs, prohibited species
Indonesia Zonation by vessel size
Malaysia Zonation by size of trawler
Philippines Trawl restriction in some fishing areas (e.g. closures of bays and gulfs)
Thailand Zonation, closed areas and seasons, license limits and MPAs
Viet Nam Fleet capacity controls, zoning

27
CONCLUSIONS AND THE NEXT STEPS IN SSA
The workshop sought to: (1) identify and evaluate data on trawling distributions and impacts in South and Southeast Asia; (2) to develop and propose collaborative arrangements for sharing expertise; and (3) to consider best practices for trawling to enhance sustainability of food security, livelihoods and ecosystems.
Significant progress was made under each of these items. Each country that was represented at the meeting has its own ongoing research and management programmes. The discussions showed that identifying best practices for the region is difficult because there are multiple objectives that include food security and employment, as well as environmental sustainability and other objectives such as protection of artisanal fishing communities from industrial trawl fleets. Common best practices, however, have emerged such as limitation on fleet size and composition, provision of no-trawl zones in coastal areas to protect both sensitive habitats and artisanal fishing communities, closed seasons and increasing mesh size as common themes that are being progressively adopted in the countries.
An impediment to effective implementation of best practices is the general lack of national governments ability to enforce regulations. There appears to be a general agreement that the amount of trawl effort is more than sufficient to achieve long-term maximum yield, and in many cases there is excessive fishing capacity. It appears that the key to improving regional trawl performance is close cooperation with the fishing fleets, and relying on the fishing fleets to strengthen self-enforcement of regulations.
The collaborations identified at the workshop will be pursued and available data may feed into the broader trawl impacts study. These opportunities will be followed up. It is noteworthy that many of the countries that participated in the workshop are involved in several regional initiatives such as BoBLME (Bay of Bengal Large Marine Ecosystem) and REBYC-II CTI (Strategies for Trawl Fisheries Bycatch Management in SE Asia) projects. These projects promote regional collaboration in the development of sustainable fisheries in the region. The participating countries were also involved in the development of “Regional Guidelines for the Management of Tropical Trawl Fisheries in Asia” (FAO-RAP Publication 2014/01). This work was facilitated by the Asia-Pacific Fishery Commission (APFIC).
In conclusion, the workshop served as an excellent first step in building collaboration with a network of global trawl fishing scientists, and the collaborations identified should lead to a significant advance in our understanding of how to best manage Asian trawl fisheries. Furthermore, the workshop provided an opportunity for fisheries scientists from SSA countries to exchange knowledge and ideas with contemporaries from other parts of the world. Major challenges remain to sustainable fisheries development in the region and it is clear that much work remains to be done in many fisheries.
Finally, it was noted that the Trawl Study Committee has received a grant from the U.S Fisheries Office of International Activities to evaluate the potential for implementation of best practices in three SSA countries. Over the next year, a team will work with local government officials and industry to identify the three countries, and make site visits to discuss current management systems, best practices that might improve the performance of the fisheries, as well as possible impediments to the effective implementation of these best practices.
28
APPENDIX 1
LISTOFPARTICIPANTS
Participants from SSA:
Mr Ahmad Adnan Nuruddin Director of Capture Fisheries Research Division, Department of Fisheries FRI Kampung Acheh, 32000 Sitiawan, Perak MALAYSIA Tel: + (6)05 6914752 E-mail: [email protected] Dr. A.P. Dineshbabu Principal Scientist Central Marine Fisheries Research Institute (CMFRI) P.B. No. 244, Hoige Bazar Mangalore INDIA Tel: (+91) 824 2424154 E-mail: [email protected] Dr E. Vivekanandan Emeritus Scientist Madras Research Centre Central Marine Fisheries Research Institute Chennai 600 028 INDIA Tel: (+91) 9444238648 E-mail: [email protected] Dr V. R. Madhu Central Institute of Fisheries Technology CIFT jn, Matsyapuri, Cochin, Kerala – 682 029 INDIA Tel: (+91) 484 2666 845 E-mail: [email protected] Dr B. Meenakumari Deputy Director General (Fisheries) Indian Council of Agricultural Research KAB II, PUSA New Dehli – 110012 INDIA Tel: (+91) 11 25846738 E-mail: [email protected] Ms Pakjuta Khemakorn Fishery Biologist
Southern Marine Fisheries Research and Development Center Marine Fisheries Research and Development Bureau Department of Fisheries THAILAND Tel: +66 8 18964702 E-mail: [email protected] Dr Len R. Garces Research Fellow, Natural Resources Management WorldFish, Philippine Country Office C/o SEARCA Los Banos 4031 Laguna, PHILIPPINES Tel: (+63) 49 5013953 E-mail: [email protected] Mohammad Natsir, M.Si Research Center for Fisheries Management and Conservation Agency for Marine and Fisheries Research and Development Ministry of Marine Affairs and Fisheries Balitbang KP II Building, Pasir Putih Ancol North Jakarta, INDONESIA Tel: +62 2164700928 E-mail: [email protected] Dr Nguyen Viet Nghia Deputy Director Research Institute for Marine Fisheries 224 Le Lai, Hai Phong VIET NAM Tel: +84 316 579528 E-mail: [email protected] Mr Isara Chanrachkij Fishing gear Technology Section Head (FGTSH) Capture Fisheries Technology Division (CFTD), SEAFDEC/Training Department Samutprakarn, Thailand Tel 6624256100; tel:6624256100 SKYPE: isarachan E-mail: [email protected]

29
Participants from Trawl Study Committee: Prof. Ray Hilborn Professor School of Aquatic and Fishery Sciences Box 355020 Seattle WA 98195 USA Tel +1 206 543 3587 E-mail: [email protected] Prof. Michel Kaiser Chair in Marine Conservation Ecology School of Ocean Sciences Bangor University Menai Bridge, Anglesey LL59 5AB 44 (0) 1248 383751 Mob: 07733 138737 Skype: micheljkaiser Twitter: @micheljkaiser E-mail: [email protected] Prof. Simon Jennings Centre for Environment, Fisheries and Aquaculture Science Lowestoft Laboratory Lowestoft NR33 0HT United Kingdom 44(0) 1502 562244 E-mail: [email protected] Dr. Kathryn Hughes School of Ocean Sciences Bangor University Menai Bridge, Anglesey LL59 5AB E-mail: [email protected] Prof. Jan Hiddink Reader in Marine ecology School of Ocean Sciences Bangor University Menai Bridge LL59 5AB, United Kingdom Tel: 01248 382864 E-mail: [email protected]
Dr. Adriaan Rijnsdorp IMARES Institute for Marine Resources and Ecosystem Studies Haringkade 1 1976 CP Ijmuiden, NL Phone +31 317487191 Fax +31 317487326 E-mail: [email protected] Dr. Bob McConnaughey Alaska Fisheries Science Center National Marine Fisheries Service National Oceanic and Atmospheric Administration (NOAA) 7600 Sand Point Way NE, Seattle, Washington, 98115 USA E-mail: [email protected] Dr. Ana Parma Centro para el Estudio de Sistemas Marinos Centro Nacional Patagónico-CONICET Blvd. Brown 2915 U 9120 ACF Puerto Madryn, Chubut Argentina Phone: (++54)(280)4883184 (int. 1229) Fax: (++54)(280)4883543 Email: [email protected]; [email protected] Dr. Ricardo Amaroso School of Aquatic and Fishery Sciences Box 355020 Seattle WA 98195 USA E-mail: [email protected] Dr. Roland Pitcher Senior Principal Research Scientist CSIRO Oceans & Atmosphere Flagship EcoSciences Precinct 41 Boggo Road, DUTTON PARK, Qld. 4102 Australia (GPO Box 2583, Brisbane, QLD 4001) E-mail: [email protected] Dr. Tessa Mazor Post-Doctoral Fellow CSIRO Oceans & Atmosphere Flagship EcoSciences Precinct 41 Boggo Road, DUTTON PARK, Qld. 4102 Australia (GPO Box 2583, Brisbane, QLD 4001) E-mail: [email protected]

30
Dr Simon Funge-Smith Senior Fishery Officer FAO Regional Office for Asia and Pacific (FAO/RAP) Maliwan Mansion, 39 Phra Athit Road Bangkok 10200, Thailand Email: [email protected] Dr Petri Suuronen FAO Fishing Operations and Technology Branch (FIRO) Viale delle Terme di Caracalla 00153 Rome, ITALY Tel: +39 0657055153 Email: [email protected]

This document contains the Report of the Workshop on the use of best available science in
developing and promoting best practices for trawl fishing operations in South and Southeast
Asia (SSA) held in Bangkok, Thailand, from 8 to 16 September 2014. The workshop was
arranged in collaboration with FAO and the Trawl Study Committee. A total of 22 fisheries
experts from the South and Southeast Asia and other parts of the world participated in the
workshop. The workshop sought to identify and evaluate data on trawling distributions and
impacts in South and Southeast Asia, develop and propose collaborative arrangements for
sharing expertise, and evaluate best practices for trawling to enhance sustainability of food
security, livelihoods and ecosystems. This report summarizes the presentations made in the
workshop and concludes the main discussions.
I6611EN/1/01.17
ISBN 978-92-5-109561-4
9 7 8 9 2 5 1 0 9 5 6 1 4
ISSN 2070-6987