report of the diagnostic review team for wellington … of...diagnostic review team for wellington...
TRANSCRIPT

Document Generated On February 28, 2017
Report of the Diagnostic Review Team
for Wellington Elementary
4800 Kaufman Lane Louisville
KY 40216 us
Brandi Carney Principal
Date: January 22, 2017 -January 25, 2017
Advancl::

Kentucky Department of Education Wellington Elementary
Copyright (c) 2017 by Advance Education, Inc. AdvancED™ grants to the Institution, which is the subject of the Diagnostic Review Team Report, and its
designees and stakeholders a non-exclusive, perpetual, irrevocable, royalty-free license and release to reproduce, reprint, and distribute this report in
accordance with and as protected by the Copyright Laws of the United States of America and all foreign countries. All other rights not expressly
conveyed are reserved by AdvancED™.
© 2017 Advance Education, Inc. All rights reserved unless otherwise granted by written agreement. Page 2

Kentucky Department of Education Wellington Elementary
Table of Contents
Introduction. . . . . . . . . . . . . . . . . . . . . . . . . . . . . . . . . . . . . . . . . . . . . . . . . . . . . . . . . . . . . . . . . . . . . . . . . . . . . . . . . . . . . . . . . . . . . . 4
Results .................................................................................................. 7
Teaching and Learning Impact. . . . . . . . . . . . . . . . . . . . . . . . . . . . . . . . . . . . . . . . . . . . . . . . . . . . . . . . . . . . . . . . . . . . . . . . . . 7
Standard 3- Teaching and Assessing for Learning ...................... , ............................. 8
Standard 5 - Using Results for Continuous Improvement. . . . . . . . . . . . . . . . . . . . . . . . . . . . . . . . . . . . . . . . . . . . . . . 9
Student Performance Diagnostic ...................................................................... 9
Effective Learning Environments Observation Tool (eleot™). . . . . . . . . . . . . . . . . . . . . . . . . . . . . . . . . . . . . . . . . . 10
eleotTM Data Summary ............................................................................ 14
Findings ............................................................................................ 17
Leadership Capacity. . . . . . . . . . . . . . . . . . . . . . . . . . . . . . . . . . . . . . . . . . . . . . . . . . . . . . . . . . . . . . . . . . . . . . . . . . . . . . . . . . 21
Standard 1 - Purpose and Direction. . . . . . . . . . . . . . . . . . . . . . . . . . . . . . . . . . . . . . . . . . . . . . . . . . . . . . . . . . . . . . . . . . 22
Standard 2- Governance and Leadership. . . . . . . . . . . . . . . . . . . . . . . . . . . . . . . . . . . . . . . . . . . . . . . . . . . . . . . . . . . . 22
Stakeholder Feedback Diagnostic. . . . . . . . . . . . . . . . . . . . . . . . . . . . . . . . . . . . . . . . . . . . . . . . . . . . . . . . . . . . . . . . . . . 22
Findings. . . . . . . . . . . . . . . . . . . . . . . . . . . . . . . . . . . . . . . . . . . . . . . . . . . . . . . . . . . . . . . . . . . . . . . . . . . . . . . . . . . . . . . . . . . . 23
Resource Utilization. . . . . . . . . . . . . . . . . . . . . . . . . . . . . . . . . . . . . . . . . . . . . . . . . . . . . . . . . . . . . . . . . . . . . . . . . . . . . . . . . . . 26
Standard 4- Resources and Support Systems. . . . . . . . . . . . . . . . . . . . . . . . . . . . . . . . . . . . . . . . . . . . . . . . . . . . . . . 26
Conclusion . . . . . . . . . . . . . . . . . . . . . . . . . . . . . . . . . . . . . . . . . . . . . . . . . . . . . . . . . . . . . . . . . . . . . . . . . . . . .. . . . . . . . . . . . . . . . . 28
Addenda. . . . . . . . . . . . . . . . . . . . .. . . . . . . . . . . . . . . . . . . . . . . . . . . . . . . . . . . . . . . . . . . . . . . . . . . . . . . . . . . . . . . . . . . . . . . . . . . . 30
Team Roster .......................................................................................... 30
About AdvancED. . . . . . . . . . . . . . . . . . . . . . . . . . . . . . . . . . . . . . . . . . . . . . . . . . . . . . . . . . . . . . . . . . . . . . . . . . . . . . . . . . . . . . 32
References. . . . . . . . . . . . . . . . . . . . . . . . . . . . . . . . . . . . . . . . . .. . . . . . . . . . . . . . . . . . . . . . . . . . . . . . . . . . . . . . . . . . . . . . . . . . 33
Attach merits ............................................... ·. . . . . . . . . . . . . . . . . . . . . . . . . . . . . . . . . . . . . . . . . . . 34
© 2017 Advance Education, Inc. All rights reserved unless otherwise granted by written agreement. Page 3

Kentucky Department of Education Wellington Elementary
Introduction The Diagnostic Review is carried out by a team of highly qualified evaluators who examine the institution's
adherence and commitment to the research-aligned AdvancED Standards. The Diagnostic Review Process is
designed to energize and equip the leadership and stakeholders of an institution to achieve higher levels of
performance and address those areas that may be hindering efforts to reach desired performance levels. The
Diagnostic Review is a rigorous process that includes examination of evidence and relevant performance data,
.. interviews with stakeholders, and observations of instruction, learning and operations.
The Diagnostic Review Team used the AdvancED Standards and related criteria to guide its evaluation,
looking not only for adherence to standards, but also for how the institution functioned as a whole and
embodied the practices and characteristics of quality. Using the evidence at their disposal, the Diagnostic
Review Team arrived at a set of findings contained in this report.
Standards help to delineate what matters. They provide a common language through which an education
community can engage in conversations about educational improvement, institution effectiveness, and
achievement. They serve as a foundation for planning and implementing improvement strategies and activities
and for measuring success. AdvancED Standards were developed by a committee comprised of talented
educators and leaders from the fields of practice, research and policy who applied professional wisdom, deep
knowledge of effective practice, and the best available research to craft a set of robust standards that define
institutional quality and guide continuous improvement. Prior to implementation, an internationally recognized
panel of experts in testing ·and measurement, teacher quality and education research reviewed the standards
and provided feedback, guidance and endorsement.
The AdvancED Diagnostic Review Team uses AdvancED Standards, associated Indicators and criteria related
to student performance and stakeholder engagement to guide its evaluation. The Standards, Indicators and
related criteria are evaluated using Indicator-specific performance levels. The Team rates each Indicator and
criterion on a scale of 1 to 4. The final scores assigned to the Indicators and criteria represent the average of
the Diagnostic Review Team members' individual ratings.
Use of Diagnostic Tools A key to examining the institution is the design and use of diagnostic tools that reveal the effectiveness with
which an institution creates conditions and implements processes and practices that impact student
performance and success. In preparation for the Diagnostic Review, the institution conducted a Self
Assessment using the AdvancED Standards and provided evidence to support its conclusions vis a vis
organizational effectiveness in ensuring acceptable and improving levels of student performance.
An indicator-based tool that connects the specific elements of the criteria to evidence gathered by the
team;
a student performance analytic that examines the quality of assessment instruments used by the
institution, the integrity of the administration of the assessment to students, the quality of the learning
© 2017 Advance Education, Inc. All rights reserved unless otheJWise granted by written agreement. Page4

Kentucky Department of Education Wellington Elementary
results including the impact of instruction on student learning at all levels of performance, and the
equity of learning that examines the results of student learning across all demographics;
a stakeholder engagement instrument that examines the fidelity of administration and results of
perception surveys seeking the perspective of students, parents, and teachers;
a state-of-the-art, learner-centric observation instrument,· the Effective Learning Environments
Observation Tool (elect™) that quantifies students' engagement, attitudes and dispositions organized
in 7 environments: Equitable Learning, High Expectations, Supportive Learning, Active Learning,
Progress Monitoring and Feedback, Well-Managed Learning, and Digital Learning. All evaluators must
be trained, reach acceptable levels of inter-rater reliability, and certified to use this research-based .and
validated instrument.
The Diagnostic Review Team's findings and critical observations are shared in this report through the Indicator
ratings, identification of Powerful Practices and Improvement Priorities.
Powerful Practices A key to continuous improvement is the institution's knowledge of its most effective and impactful practices.
Such practices, yielding a performance level of 4, serve as critical leverage points necessary to guide, support
and ensure continuous improvement. The Diagnostic Review process is committed to identifying conditions,
processes and practices that are having the .most significant impact on student performance and institutional
effectiveness. The Diagnostic Review Team has captured and defined Powerful Practices that it identified as
essential to the institution's effort to continue its journey of improvement.
Improvement Priorities The Diagnostic Review Team reviewed, analyzed and deliberated over significant bodies of evidence provided
by the institution and gathered by the team during the process. For those instances in which this analysis
yielded a Level 1 Indicator rating, an Improvement Priority has been identified by the team to guide
improvement efforts. Improvement Priorities are supported by extensive explanation and rationale to give
school leaders and stakeholders a clear understanding of the conditions, practices, policies, etc., revealed
through the Diagnostic Review process. Improvement Priorities are intended to be incorporated into the
institution's improvement plan.
The Review 'Wellington Elementary School hosted a Diagnostic Review on January 22- 25, 2017. The on-site review
involved a five-member team who provided their knowledge, skills and expertise for carrying out the Diagnostic
Review process and developing this written report of their findings.
The Diagnostic Review Team expresses its appreciation to the principal, staff and stakeholders of Wellington
Elementary for their preparation and hospitality. The administration provided the Diagnostic Review Team a
comfortable and private work area throughout the review. All staff members were cordial and professional. In
© 2017 Advance Education, Inc. All rights reserved unless otherwise granted by written agreement. Page 5

Kentucky Department of Education Wellington Elementary
addition, all were knowledgeable and well prepared about the purpose of the review and the process. All staff
members were responsive to the Team's varied requests and went the "extra mile" to assist as needed.
Prior to the start of the Diagnostic Review, the Team engaged in a detailed conference call and various
communications through emails to complete the initial intensive study, review and analysis of various
documents provided by the school. The Lead and the Associate Lead Evaluators conducted a conference call
with the principal. School leaders planned and conducted the Internal Review in a timely manner despite not
having a great deal of time to prepare. The comprehensive Internal Review engaged a range of stakeholder
groups who were candid and thorough. Evidence and documentation to support the school Self Assessment
and other diagnostics were well organized and accessible by the Diagnostic Review Team Members.
A total of 34 stakeholders were interviewed, as detailed in the chart below, and 19 core classrooms were
observed during the Diagnostic Review. Three of the instructional staff members, two parents and the principal
who were interviewed also served on the School-Based Decision Making (SBDM) Council. Throughout the
Diagnostic Review, school leaders, faculty and staff were candid, reflective and honest while discussing the
needs of the school and plans for continuous improvement.
Stakeholders were interviewed by members of the Diagnostic Review Team to gain their perspectives on
topics relevant to the institution's effectiveness and student performance. The feedback gained through the
stakeholder interviews was considered with other evidences and data to support the findings of the Diagnostic
Review. The following chart depicts the numbers of persons interviewed representative of various stakeholder
groups.
Administrators 3
Instructional Staff 10
Support Staff 5
Students 10
Parents/Community/Business Leaders 6
Total 34
Using the evidence at their disposal, the AdvancED Diagnostic Review Team arrived at a set of findings
contained in this report. The report is presented in three sections: Results, Conclusion and Addenda.
© 2017 Advance Education, Inc. All rights reserved unless otherwise granted by written agreement. Page 6

Kentucky Department of Education Wellington Elementary
Results Teaching and Learning Impact The impact of teaching and learning on student achievement is the pri.mary expectation of every institution.
The relationship between teacher and learner must be productive and effective for student success. The
impact of teaching and learning includes an analysis of student performance results, instructional quality,
learner and family engagement, support services for student learning, curriculum quality and efficacy, and
college and career readiness data. These are all key indicators of an institution's impact on teaching and
learning.
A high-quality and effective educational system has services, practices, and curriculum that ensure teacher
effectiveness. Research has shown that an effective teacher is a key factor for learners to achieve their highest
potential and be prepared for a successful future. The positive influence an effective educator has on learning
is a combination of "student motivation, parental involvement" and the "quality of leadership" (Ding & Sherman,
2006). Research also suggests that quality educators must have a variety of quantifiable and intangible
characteristics that include strong communication skills, knowledge of content, and knowledge of how to .teach
the content. The institution's curriculum and instructional program should develop learners' skills that lead them
to think about the world in complex ways (Conley, 2007) and prepare them to have knowledge that extends
beyond the academic areas. In order to achieve these goals, teachers must have pedagogical skills as well as
content knowledge (Baumert, J., Kunter, M., Blum, W., Brunner, M., Voxx, T., Jordan, A., Klusmann, U.,
Krauss, S., Nuebrand, M., & Tsai, Y., 201 0). The acquisition and refinement of teachers' pedagogical skills
occur most effectively through collaboration and professional development. These are a "necessary approach
to improving teacher quality" (Colbert, J., Brown, R., Choi, S., & Thomas, 8., 2008). According to Marks, Louis,
and Printy (2002), staff members who engage in "active organizational learning also have higher achieving
students in contrast to those that do not." Likewise, a study conducted by Horng, Klasik, and Loeb (2010),
concluded that leadership in effective institutions "supports teachers by creating collaborative work
environments." Institutional leaders have a responsibility to provide experiences, resources, and time for
educators to engage in meaningful professional learning that promotes student learning and educator quality.
AdvancED has found that a successful institution implements a curriculum based on clear and measurable
expectations for student learning. The curriculum provides opportunities for all students to acquire requisite
knowledge, skills, and attitudes. Teachers use proven instructional practices that actively engage students in
the learning process. Teachers provide opportunities for students to apply their knowledge and skills to real
world situations. Teachers give students feedback to improve their performance.
Institutions with strong improvement processes move beyond anxiety about the current reality and focus on
priorities and initiatives for the future. Using results, i.e., data and other information, to guide continuous
improvement is key to an institution's success. A study conducted by Datnow, Park, and Wohlstetter (2007)
from the Center on Educational Governa.nce at the University of Southern California indicated that data can
shed light on existing areas of strength and weakness and also guide improvement strategies in a systematic
and strategic manner (Dembosky, J., Pane, J., Barney, H., & Christina, R., 2005). The study also identified six
© 2017 Advance Education, Inc. All rights reserved unless otherwise granted by written agreement. Page 7

Kentucky Department of Education Wellington Elementary
key strategies that performance-driven systems use: (1) building a foundation for data-driven decision making,
(2) establishing a culture of data use and continuous improvement, (3) investing in an information management
system, (4) selecting the right data, (5) building institutional capacity for data-driven decision making, and (6)
analyzing and acting on data to improve performance. Other research studies, though largely without
comparison groups, suggested that data-driven decision-making has the potential to increase student
performance (Alwin, 2002; Doyle, 2003; Lafee, 2002; Mcintire, 2002).
Through ongoing evaluation of educational institutions, AdvancED has found that a successful institution uses
a comprehensive assessment system based on clearly defined performance measures. The system is used to
assess student performance on expectations for student learning, evaluate the effectiveness of curriculum and
instruction, and determine strategies to improve student performance. The institution implements a
collaborative and ongoing process for improvement that aligns the functions of the school with the expectations
for student learning. Improvement efforts are sustained, and the institution demonstrates progress in improving
student performance and institution effectiveness.
Standard 3 -Teaching and Assessing for Learning The school's curriculum, instructional design, and assessment practices guide and ensure teacher
effectiveness and student learning.
3.1
3.2
3.3
3.4
3.5
3.6
3.7
3.8
3.9
The school's curriculum provides equitable and challenging learning experiences that ensure all students have sufficient opportunities to develop learning, thinking, and life skills that lead to success at the next level.
Curriculum, instruction, and assessment are monitored and adjusted systematically in response to data from multiple assessments of student learning and an examination of professional practice.
Teachers engage students in their learning through instructional strategies that ensure achievement of learning expectations.
School leaders monitor and support the improvement of instructional practices of teachers to ensure student success.
Teachers participate in collaborative learning communities to improve instruction and student learning.
Teachers implement the school's instructional process in support of student learning.
Mentoring, coaching, and induction programs support instructional improvement consistent with the school's values and beliefs about teaching and learning.
The school engages families in meaningful ways in their children's education and keeps them informed of their children's learning progress.
The school has a formal structure whereby each student is well known by at least one adult advocate in the school who supports that student's educational experience.
© 2017 Advance Education, Inc. All rights reserved unless otherwise granted by written agreement.
1.80
1.20
1.20
1.20
2.20
1.20
1.80
2.60
2.20
Page 8

Kentucky Department of Education Wellington Elementary
,,.~llll~ ~IJJ~ :!>·; ii< ··.···~
.\ ,c:.:
:•"::., ::i ,:_:.·:· ··''· ·····.: =·•: >·"
i:':,:·o:.:. •'·-:.: ..... :.,: .. -''' •·:-': •''"::
3.10 Grading and reporting are based on clearly defined criteria that represent the 2.00 attainment of content knowledge and skills and are consistent across grade levels and courses.
3.11 All staff members participate in a continuous program of professional learning. 1.80
3.12 The school provides and coordinates learning support services to meet the · 2.00 unique learning needs of students.
Standard 5 - Using Results for Continuous Improvement The school implements a comprehensive assessment system that generates a range of data about student
learning and school effectiveness and uses the results to guide continuous improvement.
'·''"· ::t'::'i '·'·""·'''''·' :.;•.
/:i t!i·~~~~~~~i;jJi . .... ,.
·:.J
··_;.··~ .·:•: :':• ~-;;,;,;/· ... , .... ,, :•;:- '':' ;;:.;c'·'S: .::·: .• ::.\.· )~!·~':;,·?•i::: o,,, .. ,,, ... :.;._'·;
5.1 The school establishes and maintains a clearly defined and comprehensive 2.00 student assessment system.
5.2 Professional and support staff continuously collect, analyze, and apply learning 1.60 from a range of data sources, including comparison and trend data about student learning, instruction, program evaluation, and organizational conditions.
5.3 Professional and support staff are trained in the evaluation, interpretation, and 1.20 use of data.
5.4 The school engages in a continuous process to determine verifiable 1.60 improvement in student learning, including readiness for and success at the next level.
5.5 Leadership monitors and communicates comprehensive information about 1.60 student learning, conditions that support student learning, and the achievement of school improvement goals to stakeholders.
Student Performance Diagnostic The quality of assessments used to measure student learning, assurance that assessments are administered
with procedural fidelity and appropriate accommodations, assessment results that reflect the quality of
learning, and closing gaps in achievement among subpopulations of students are all important indicators for
evaluating overall student performance.
Assessment Quality 3.00
Test Administration 3.00
Equity of Learning 2.00
Quality of Learning 3.00
© 2017 Advance Education, Inc. All rights reserved unless otherwise granted by written agreement. Page 9

Kentucky Department of Education Wellington Elementary
Effective Learning Environments Observation Tool (eleot™) Every learner should have access to an effective learning environment in which she/he has multiple
opportunities to be successful. The Effective Learning Environments Observation Tool (eleot™) measures the
extent to which learners are in an environment that is equitable, supportive, and well-managed. An
environment where high expectations are the norm and active learning takes place. It measures whether
learners' progress is monitored and feedback is provided and the extent to which technology is leveraged for
· learning.
Observations of classrooms or other learning venues are conducted for a minimum of 20 minutes per
observation. Every member of the Diagnostic Review Team is required to be trained and pass a certification
exam that establishes inter-rater reliability. Team members conduct multiple observations during the review
process and provide ratings on 30 items based on a four-point scale (4=very evident; 3=evident; 2=somewhat
evident; and 1 =not observed). The following provides the aggregate average score across multiple
observations for each of the seven learning environments included in eleot™.
eleot™ .Results (f) 4.0
Q) 3.5 > a> 3.0
...J (U 2.5 (..) r;: 2.0 «S E L.
0 1.0 ....... '-cu 0..
Ill Review
The Diagnostic Review Team conducted 19 classroom observations using the Effective Learning
Environments Observation Tool (elect™). The Well-Managed Learning Environment received the highest
average rating of 3.20 on a four-point scale. The Digital Learning Environment was the lowest rated at 1.77.
The Learning Environment ratings supported that the students were aware of classroom rules and routines and
were respectful of their peers and adults. Also, students demonstrated positive attitudes about their classrooms
and learning. The Progress Monitoring and Feedback Environment (2.3) and the High Expectations
© 2017 Advance Education, Inc. All rights reserved unless otherwise granted by written agreement. Page 10
Kentucky Department of Education Wellington Elementary
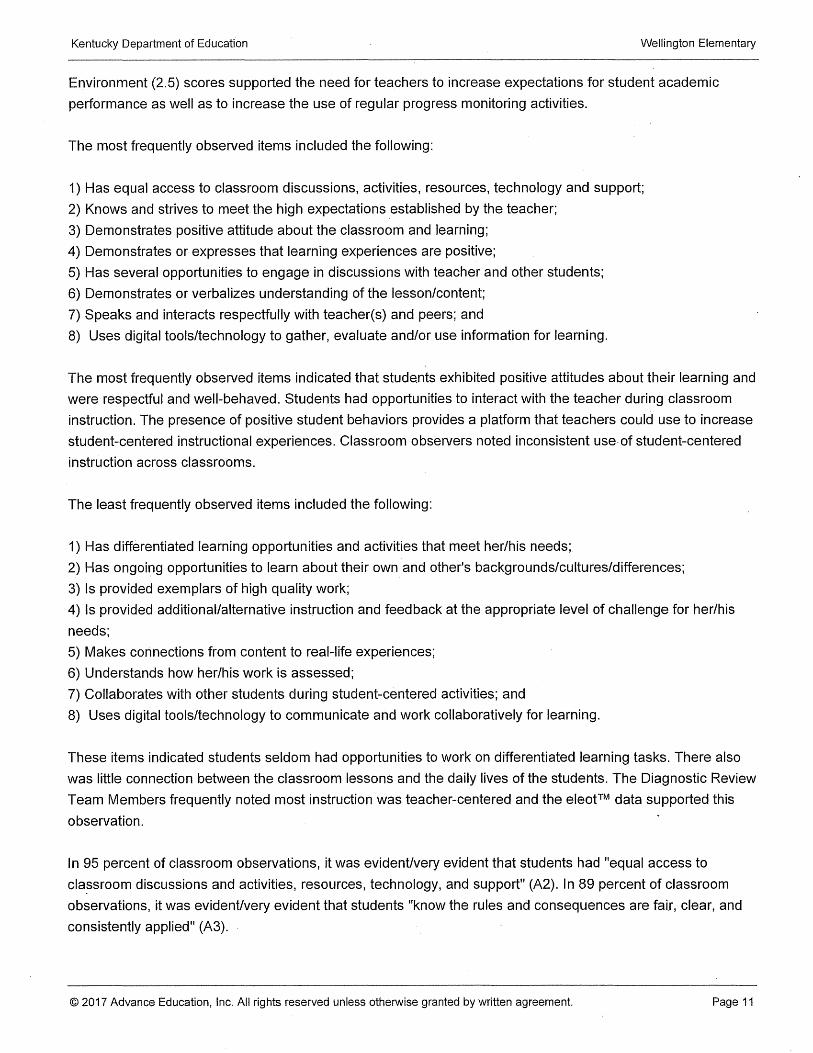
Environment (2.5) scores supported the need for teachers to increase expectations for student academic
performance as well as to increase the use of regular progress monitoring activities.
The most frequently observed items included the following:
1) Has equal access to classroom discussions, activities, resources, technology and support;
2) Knows and strives to meet the high expectations established by the teacher;
3) Demonstrates positive attitude about the classroom and learning;
4) Demonstrates or expresses that learning experiences are positive;
5) Has several opportunities to engage in discussions with teacher and other students;
6) Demonstrates or verbalizes understanding of the lesson/content;
7) Speaks and interacts respectfully with teacher(s) and peers; and
8) Uses digital tools/technology to gather, evaluate and/or use information for learning.
The most frequently observed items indicated that stude.nts exhibited positive attitudes about their learning and
were respectful and well-behaved. Students had opportunities to interact with the teacher during classroom
instruction. The presence of positive student behaviors provides a platform that teachers could use to increase
student-centered instructional experiences. Classroom observers noted inconsistent use. of student-centered
instruction across classrooms.
The least frequently observed items included the following:
1) Has differentiated learning opportunities and activities that meet her/his needs;
2) Has ongoing opportunities to learn about their own and other's backgrounds/cultures/differences;
3) Is provided exemplars of high quality work;
4) Is provided additional/alternative instruction and feedback at the appropriate level of challenge for her/his
needs;
5) Makes connections from content to real-life experiences;
6) Understands how her/his work is assessed;
7) Collaborates with other students during student-centered activities; and
8) Uses digital tools/technology to communicate and work collaboratively for learning.
These items indicated students seldom had opportunities to work on differentiated learning tasks. There also
was little connection between the classroom lessons and the daily lives of the students. The Diagnostic Review
Team Members frequently noted most instruction was teacher-centered and the eleot™ data supported this
observation.
In 95 percent of classroom observations, it was evident/very evident that students had "equal access to
cla~sroom discussions and activities, resources, technology, and support" (A2). In 89 percent of classroom
observations, it was evident/very evident that students "know the rules and consequences are fair, clear, and
consistently applied" (A3).
© 2017 Advance Education, Inc. All rights reserved unless otherwise granted by written agreement Page 11

Kentucky Department of Education Wellington Elementary
In 42 percent of classroom observations, it was evident/very evident that students had "equal opportunities to
learn about their own and other's backgrounds/cultures/differences" (A.4). In 48 percent of classroom
observations, it was evident/very evident that students had "differentiated learning opportunities" (A 1).
These data indicated that students had access to material and classroom support. This was corroborated by
student survey data. Ninety percent of students, for example, agreed/strongly agreed their "Teachers used
different activities to help me learn." Ninety-four percent of students agreed/strongly agreed with the statement
"My school has computers to help me learn." These statements indicated students had access to a variety of
materials. These data also showed that differentiation was an area of need. The 2015-2016 Professional
Learning Roadmap for Wellington addressed differentiation only once, suggesting the school could increase its
support and use of this instructional practice.
In 58 percent of classroom observations, it was evident/very evident that students understood and attempted
"to meet the high expectations established by the teacher" (81). In 63 percent of classroom observations, it
was evident/very evident that students were "tasked with activities and learning that are challenging but
attainable" (82).
In 32 percent of classroom observations, it was evident/very evident that students were "asked and responded
to questions that required higher order thinking" (85). In 37 percent of classroom observations, it was
evident/very evident that students "were engaged in rigorous coursework, discussions and/or tasks" (84).
The Wellington Elementary School Mission Statement indicated that they valued "rigorous academic program
expectations" and staff member survey data indicated 90 percent of staff members agreed/strongly agreed
with the statement, "Our school's leaders expect staff members to hold all students to high academic
standards." This contrasted with the classroom observation and student performance data attached to this
report. Staff members could examine the discrepancy between these data and their beliefs about high
academic program expectations to improve student achievement.
It was evident/very evident in 95 percent of the observations that students "Demonstrate or express that
learning experiences were positive" (C1). It was evident/very evident in 95 percent of the observations that
students "Demonstrate positive attitude about the classroom and learning" (C2).
It was evident/very evident in 27 percent of the observations that students were "provided additional/alternative
instruction and feedback at the appropriate level of challenge for his/her needs" (C5).
The students felt positive about their learning and classroom experiences. Seventy-seven percent of parents
indicated in the parent survey that they agreed/strongly agreed with the statement, "Teachers meet his/her
learning needs by individualizing instruction."
It was evident/very evident in 7 4 percent of the observations that students had "several opportunities to
engage in discussions with teacher and other students" (D1). It was evident/very evident in 32 percent of
classrooms that the students "made connections from content to real-life experiences" (D2). These data
© 2017 Advance Education, Inc. All rights reserved unless otherwise granted by written agreement. Page 12

Kentucky Department of Education Wellington Elementary
supported the need to increase classroom content to connect to the daily lives of the children. This could also
serve as a vehicle for increasing genuine student engagement.
It was evident/very evident in 53 percent of classrooms that students responded "to teacher feedback to
improve understanding" (E2). It was evident/very evident in 47 percent of classrooms that students were
"asked and/or quizzed about individual progress/learning" (E1 ). These data support the need for an increased
use of formative assessment practices. These strategies could be incorporated into a plan to develop a school
wide instructional process (Improvement Priority 2).
It was evident/very evident in 94 percent of the observations that students spoke and interacted "respectfully
with teachers and peers" (F1 ). It was also evident/very evident in 95 percent of the observations that students
know "classroom routines, behavioral expectations and consequences" (F5).
It was evident/very evident in 48 percent of the observations that students "collaborated with other students
during student-centered activities" (F4). This statement supported .observations that few student-centered
group activities occurred. In addition, when students were grouped, they typically worked on individual
worksheet activities rather than group activities.
It was evident/very evident in 37 percent of. classrooms that students "used digital tools/technology to gather,
evaluate, and/or use information for learning" (G1). In 32 percent of classrooms, it was evident/very evident
that students used technology to "conduct research, solve problems, and/or create original works for learning"
(G2). Use of technology can motivate students to want to learn and assist teachers to implement differentiated
and individualized instructional activities.
© 2017 Advance Education, Inc. All rights reserved unless otherwise granted by written agreement. Page 13

Kentucky Department of Education Wellington Elementary
eleot™ Data Summary
....., "'0 Item Average Description ....., ....., ns....,
~~ t: .Ct: Q) Q) 3:0> +"(:
Q)"'' "'0 Q)"'' 00> >.> ·s; E·- ztl) . > w w ow .c
en 0
1. 2.53 Has differentiated learning opportunities 31.58% 15.79% 26.32% 26.32% and activities that meet her/his needs
2. 3.47 Has equal access to classroom 52.63% 42.11% 5.26% 0.00% discussions, activities, resources, technology, and support
3. 3.32 Knows that rules and consequences are 42.11% 47.37% 10.53% 0.00% fair, clear, and consistently applied
4. 2.37 Has ongoing opportunities to learn 21.05% 21.05% 31.58% 26.32% about their own and other's backgrounds/cultures/differences
Average .....,
"'0 Item Description ....., ....., ns...., ~; t: .Ct: Q)
Q) 3:0> +"(: Q)"'' "'0 Q)"'' 00> >.> ·s; E.> Ztl)
w w ow .c en 0
1. 2.84 Knows and strives to meet the high 26.32% 31.58% 42.11% 0.00% expectations established by the teacher
2. 2.68 Is tasked with activities and learning that 5.26% 57.89% 36.84% 0.00% are challenging but attainable
3. 2.32 Is provided exemplars of high quality 26.32% 15.79% 21.05% 36.84% work
4. 2.37 Is engaged in rigorous coursework, 0.00% 36.84% 63.16% 0.00% discussions, and/or tasks
5. 2.11 Is asked and responds to questions that 10.53% 21.05% 36.84% 31.58% require higher order thinking (e.g., applying, evaluating, synthesizing)
© 2017 Advance Education, Inc. All rights reserved unless otherwise granted by written agreement. Page 14

Kentucky Department of Education Wellington Elementary
''(" •.• :;•!;.,';.,:· :-~:.k':"- >~·'''_.;t:,
f~IIW,I~i~~~~~~~~~ l"r>~::···~· :~~·::,,• :,:; '.;i''·i:; : .• ·_:,. ,;~).: /·: :.:,;;,•:,;:· •:,·, ·,:,:•:•::···x·:·,::, .··.•.•;;.-:;;••·•·.·-':\··:·.\•·,·.:·.,::··•··"' .;''{ :(·.111111 ··•,:
->~·-·· .,.:::<:':,§~:?'~;x•:.·,,:·::·,,":;·.J. :'·•'•'/•·;::··(i;:}!i:.:\~§f}·Xf"tMN? :•:.;•?::iJ;';::(::ii: ':·.··:
:c:;,. ,_,., .... ;" ••.; .•. ·;:.:.::.r:·r:•·.·,::: ,.,,,., ..... .. ,,,,. ......
"C Item Average Description ...... ...... n:s....,. ~; c J:c Cl>
Cl> 3:CJ> ...... c: Cl>~ "C CI>"C OCI>
>> ·:; E"> zt/) w w ow ..c
en 0
1. 3.32 Demonstrates or expresses that 36.84% §7.89% 5.26% 0.00% learning experiences are positive
2. .3.32 Demonstrates positive attitude about the 36.84% 57.89% 5.26% 0.00% classroom and learning
3. 2.47 Takes risks in learning (without fear of 31.58% 10.53% 31.58% 26.32% negative feedback)
4. 2.89 Is provided support and assistance to 31.58% 31.58% 31.58% 5.26% understand content and accomplish tasks
5. 1.84 Is provided additional/alternative 10.53% 15.79% 21.05% 52.63% instruction and feedback at the appropriate level of challenge for her/his needs
.: •· •;;,;\A'inn~H-t···~~~~A~;:-,.,.~ ,,._.i')<i·•;;:,. · ...•. : .. ;-.·.•::·:·.:···;::,:;,:•.• .. :·,,,:,';.:•::}/;·::•:·•.:.-.· . _,..,,\··', :'•:\('•.>>-·::':.',• ··•': .. · .....
.. :•:•,::
······· ~}i:{f,ft)!:~i~f;~f.i .. [~i1~~~I~J1li[1;r'iii·: E ::::::·:· •.· •. :c.· ••,.-,;.-:;:: :,; ...
:::·•: .·:.·,· . .. ,;:· .c.··· '··-"'':··.<s·:•i,:·:< ..-::n·.::y.c.•:,:'T·.>•
., .... , ;'/.::•? l~'i' • .-.;•:.<:-:: , ... ,. ~liiJIJ~Ri\~111~' i,fjl) 1·1 -,~,.,,,
..... ,, .;·!',
...... "C Item Average Description ...... ...... n:s....,.
>.c c J:c Cl> ._(I> Cl> 3:CJ> ...... (: Cl>~ "C CI>"C OCI>
>> ·:; E"> zt/) w w ow ..c
en 0
1. 3.00 Has several opportunities to engage in 42.11% 31.58% 10.53% 15.79% discussions with teacher and other students
2. 1.95 Makes connections from content to real- 21.05% 10.53% 10.53% 57.89% life experiences
3. 2.79 Is actively engaged in the learning 26.32% 31.58% 36.84% 5.26% activities
·•'•' /J. .. , :;.;"\: .•.:x•·_,_ ..• z;;;:,:: .. y;;> . .-·:·/;-~··:/{!{';. ''':<·.}-:::,;;,:;.• ··''·•··· ''.• •·-'" : .. //';';·. ·!/-:•::- ...... ·:/". •:':')>:_:,<:A-":•::.:·:::::;::.•:··• ·.·.~:;;;·::· ... :··,;:::•/'r.:'U::·:::, ·,;,;:: ........ , ..... : ... .;;;;!.;; .• ;::.:;•.;;:·;
. .J2~·5.S·:(i:l\~·c:i'i··\:~--{··."1·;\;,:~~:;;;:',1c::;:r::::': ...• , ....... ,. ····"······ .;::;,:),:}:(:,,.,, :·::.; :::·::::';.;:•:-.,;.,.•:.-:::.:·:.;•: .. · .. , ....... '''/•:cc:'~ 0~~0~~0~8 ··•·•::.- :•:c:.·.;:;.,:.-;-.,:···•::·•.;: .;·.;,.,:•::: ;::,';i: '·''•" ''i~;/:;;,;i;~:
© 2017 Advance Education, Inc. All rights reserved unless otherwise granted by written agreement. Page 15

Kentucky Department of Education Wellington Elementary
::;:;:c:c: ,:·.::, ~ ;'/{:;(.:. ,';}{'':,t;::;;w:N; :a;.;;;·.•:;JfC: .•• y_;:;;,,~ •. '.~:~~~~~~ ·'~ c;~.:·;;:o:.'\:('t);'
':'.~;,~/'\\ \'{;:_:p. ·,;·:xo:.-, ·:;:·'·.':
:+::::;:~":/:' :-,:;:.:.:"·:!i:'f':.:,;c ···:,o<!?~ .;:;'.::· -:,.;,
...... "C Item Average Description ...... ...... cu...,
~§ s::: .S:::s::: <U <U 3:cu ...... (:
cu:E "C <U"C Ocu >> ·s; E"> Zcn
w w ow .c (/) 0
1. 2.32 Is asked and/or quizzed about individual 21.05% 26.32% 15.79% 36.84% progress/learning
2. 2.47 Respondstoteacherfeedbackto 21.05% 31.58% 21.05% 26.32% improve understanding
3. 2.63 Demonstrates or verbalizes 21.05% 26.32% 47.37% 5.26% understanding of the lesson/content
4. 1.84 Understands how her/his work is 0.00% 26.32% 31.58% 42.11% assessed
5. 2.47 Has opportunities to revise/improve 31.58% 15.79% 21.05% 31.58% work based on feedback
:''i,ji;~
~~l~tlf~ .::--c .. ':''\'·'-~•':'.·;'·
.,.,:;·; ,;;_;;.";:;J'j•:::·,;··:~-. ,·,;::';\(\i·.;.:-i.'· ''·:;::::. :_':i:'c::•/: .<:•._;::c /:iF'· :::\~~i/' ,,,_,,,,,,, .J.:dLIIIl:l·,'.UII'':di: ... ,·:L
·::::.·:''~;;:;:,: .. ,.. :-<·.'·' :i):':/;::;,:~::•;:'',: :1"/::i(,:;!: ,:i".': ,'·'·):''·.·-:·,::::·
,':/_;. ;,;;,,_,,.,,,,_,,,,,·, .. : :·;,_: :.'.";:·;:;·.:_:':;·;.,::::,,::',:':!":·: :-··"'·'
.:\-: c·ii·
• ~l~t",~,.a:f! :;; , ;,;::' ,. :' , .. ,:~'';',{"~g~I~i1;~~~~ ... 'r;.·,i.~;~ .. :::·:.:::s:t\.-'.< ~iD:; ;:'};·,}:(.'?\
:·:\\'it:'i::•::,::;;,;';:,';':.':'·•::•:·:,:·:· ·;,;.·.··: •'•:'·;':: ..
...., "C Item Average Description '+=' '+=' cu...,
~53 s:: .S:::s:: Cl)
Q) ;:cu ...... '= cu:E "C <U"C OQ) >> ·s; e·s; Zcn
w w ow .c (/) 0
1. 3.42 Speaks and interacts respectfully with 47.37% 47.37% 5.26% 0.00% teacher(s) and peers
2. 3.26 Follows classroom rules and works well 42.11% 42.11% 15.79% 0.00% with others
3. 3.16 Transitions smoothly and efficiently to 31.58% 52.63% 15.79% 0.00% activities
4. 2.79 Collaborates with other students during 36.84% 21.05% 26.32% 15.79% student-centered activities
5. 3.37 Knows classroom routines, behavioral 42.11% 52.63% 5.26% 0.00% expectations and consequences
:,u ;· .. : <',';,;c;·; :,-;.· .. );_'\':.~::_,,,.,_
;•.,f . .''
':-•\'·_,/·' ·.·>,. ·.-.::.:c:::.\.:•::;\-:','.'.''''·' ':::_:·;,-: II '····:
.;'-;,:·':. :''' :,:,_: '·.;:<'!,:"'.':'.•'.''":.' ,:·,,,;:: ::::'i':):•::·\:,,•,:,_.·,;,:. ,•.,;·:.:,;:.-·'1,'::.-;.:::.l·i'
© 2017 Advance Education, Inc. All rights reserved unless otherwise granted by written agreement. Page 16

Kentucky Department of Education
Item Average
1. 2.16
2. 1.95
3. 1.21
Findings Improvement Priority
Description
Uses digital tools/technology to gather, evaluate, and/or use information for learning
Uses digital tools/technology to conduct research, solve problems, and/or create original works for learning
Uses digital tools/technology to communicate and work collaboratively for learning
...., ~~ cu:E >> w
15.79%
21.05%
0.00%
Wellington Elementary
...., "C ...., a:s....,
c .cc <U <U 3:cu ""'"''= "C <U"C Ocu
·s:: E'S: Ztn w ow .c
CJ) 0
26.32% 15.79% 42.11%
10.53% 10.53% 57.89%
10.53% 0.00% 89.47%
Develop, implement and monitor a process to systematically review curriculum and instructional practices to
ensure they are aligned vertically and horizontally and consistent with school goals for student achievement.
Ensure administrators and teachers analyze multiple sources of data and use findings to ascertain a
comprehensive and complete picture of student learning, instruction, the effectiveness of programs and the
conditions that support learning.
(Indicator 3.2, Indicator 5.2, SF2. Stakeholder Feedback Results and Analysis , SP2. Test Administration)
Primary Indicator
Indicator 3.2
Evidence and Rationale
Student Performance Data:
Student performance data, as detailed in an attachment to this report, indicated that the school had not met
their Annual Measurable Objectives (AMO) for the last two consecutive years. On recent state assessments,
the percentage of students reaching the proficient/distinguished levels in reading, math, social studies, writing
and language mechanics was lower than state average scores. Additionally, students did not meet any of their
gap delivery targets nor did they met their proficiency targets. An effective comprehensive system using
findings from data analysis to adjust curriculum, assessment and instructional practices can increase student
achievement and assist in the attainment of school academic goals.
Classroom Observation Data:
© 2017 Advance Education, Inc. All rights reserved unless otherwise granted by written agreement. Page 17

Kentucky Department of Education Wellington Elementary
Observation data, as detailed previously in the Teaching and Learning Impact section of this report, revealed
the High Expectations Learning Environment received a rating of 2.5 on a four-point scale. The Progress
Monitoring and Feedback Environment was rated 2.3 on a four-point scale with Digital Learning (1.7) being the
only environment scoring lower. It was evident/very evident in 32 percent of classroom observations that
students, "were asked and responded to questions that required higher order thinking (e.g., applying,
evaluating, synthesizing)." Observations also revealed it was evident/very evident in 37 percent of classrooms
that students, "were engaged in rigorous coursework, discussions, and/or tasks." Closely monitoring student
assessment data and modifying instructional strategies to address the learning needs of students can yield
higher degrees of student engagement and challenge them with more rigorous coursework.
Stakeholder Survey Data:
Stakeholder survey data indicated 71 percent of parents agreed/strongly agreed with the statement, "My child
. is given multiple assessments to measure his/her understanding of what was taught," indicating limited
agreement among parents on this question. Ninety-two percent of staff members agreed/strongly agreed that,
"Our school has a systematic process for collecting, analyzing, and using data." Although the survey results
indicated that data were collected and analyzed, the observations and document reviews revealed little data
were used in a routine and ongoing manner to provide instructional feedback to teachers. Further examination
supported that the school used quarterly benchmark assessment data for progress monitoring; however, these
data were not used for detailed reviews of instructional practices.
Stakeholder Interviews:
Interview data revealed that staff members were unable to articulate a process for evaluating curriculum.
Interview data indicated the level of rigor in the curriculum was low. One interviewee stated, the rigor was "not
where it should be." Interview data revealed staff members generally agreed with the statement of one
stakeholder who reported that "being able to effectively disaggregate data" was an area that needed
improvement. The process of teachers moving from understanding data at a "surface level" to "practical
application" of data analysis findings was identified as an area of need. One staff member stated, "We don't
have a systematic way of looking at data. Teac~er data use needs to be improved." Analyzing data and
incorporating findings into a focused strategy to improve student performance emerged as an area of need.
Documents and Artifacts:
The Team found little documented evidence that the curriculum and instructional process focused directly on
assessing and improving curriculum rigor. Charts and documents indicating that students were being targeted
for novice reduction were evident, yet state assessment data revealed the school had not meet any of its gap
targets. A review of professional learning community (PLC) meeting agendas and notes indicated team
members had reviewed grade level data summaries; however, the Diagnostic Review Team found few direct
connections among concerns identified from these data summaries, strategies implemented from findings and
plans to specifically address student learning needs.
© 2017 Advance Education, Inc. All rights reserved unless otherwise granted by written agreement. Page 18

Kentucky Department of Education Wellington Elementary
Improvement Priority Develop, implement and monitor a school-wide instructional process anchored in current student formative
performance data and research-informed best practices. Use formative data to develop short- and long-range ·
lesson plans and revise instructional methods (e.g., re-teach objectives or regroup students). Implement
instructional strategies that incorporate student-centered activities and focus on active student engagement.
Examples include collaboration with other students while researching topics, making topical connections,
applying information, creating projects, demonstrating a task, conducting critical peer review of writing, self
reflection activities and problem solving activities.
(Indicator 3.6)
Primary Indicator
Indicator 3.6
Evidence and Rationale
Student Performance Data:
Student performance, as detailed in an attachment to this report, was consistently below state averages for
several years at multiple grade levels and in a variety of tested areas. The percentage of students scoring
proficient/distinguished on the Kentucky Performance Rating for Educational Progress (K-PREP) third grade
reading assessment declined 9.7 percentage points from the 2014-2015 school year to the 2015-2016 school
year. In 2015-16, fifth grade reading, math, social studies and writing scores showed a negative performance
trend for the previous two years compared to previous school, district and state averages. The school did not
meet any of its proficiency or gap delivery targets for the 2015-2016 school year. These data revealed an
opportunity for the school to provide students with feedback to improve their learning.
Classroom Observation Data:
It was evident/very evident in 63 percent of classrooms that students were tasked with challenging but
attainable learning activities. It was evident/very evident in 37 percent of the classrooms that students were
engaged in rigorous coursework, discussions and/or tasks. It was evident/very evident in 47 percent of the
classrooms that students were asked and/or quizzed about individual progress/learning. It was evident/very
evident in 47 percent of the classrooms that students could demonstrate or verbalize an understanding of the
lesson content. These data underscored the need to develop a school-wide instructional process focused on
increased learning. It also supported the need to increase the school-wide use of formative questioning
strategies.
Stakeholder Interviews:
Interview data revealed teachers and administrators consistently were unable to define, explain or provide a
copy of the school-wide instructional process. Most teachers shared that learning targets were posted in their
classrooms for compliance. Several teachers reported that they needed to provide exemplars for student use.
Teachers reported that formative assessments typically consisted of exit slips and other types of formative
© 2017 Advance Education, Inc. All rights reserved unless otherwise granted by written agreement. Page 19

Kentucky Department of Education Wellington Elementary
assessment tools (e.g., rubrics, self-assessments).
Documents and Artifacts:
A review of documents and artifacts revealed the school provided the Team with few documents that showed
the existence of a school-wide instructional process. The Team identified blank formative assessment
samples. Formative assessments were in a quiz or exit slip format, making it easy for teachers to grade and
did not include student work with feedback. Documents did not include evidence of feedback informing
students of the availability of exemplar writing pieces to guide their learning. The Self-Assessment conducted
by the school included the statement, "Teachers implement the school's instructional process in support of
student learning is an area of improvement."
© 2017 Advance Education, Inc. All rights reserved unless otherwise granted by written agreement. Page 20

Kentucky Department of Education Wellington Elementary
Leadership Capacity The capacity of leadership to ensure an institution's progress towards its stated objectives is an essential
element of organizational effectiveness. An institution's leadership capacity includes the fidelity and
commitment to its institutional purpose and direction, the effectiveness of governance and leadership to enable
the institution to realize its stated objectives, the ability to engage and involve stakeholders in meaningful and
productive ways, and the capacity to enact strategies to improve results of student learning.
Purpose and direction are critical to successful institutions. A study conducted in 2010 by the London-based.
Chartered Institute of Personnel and Development (CIPD) reported that "in addition to improving performance,
the research indicates that having a sense of shared purpose also improves employee engagement" and that
"lack of understanding around purpose can lead to demotivation and emotional detachment, which in turn lead
to a disengaged and dissatisfied workforce."
AdvancED has found through its evaluation of best practices in more than 32,000 institutions around the world
that a successful institution commits to a shared purpose and direction and establishes expectations for
student learning that are aligned with the institutions' vision and supported by internal and external
stakeholders. These expectations serve as the focus for assessing student performance and overall institution
effectiveness.
Governance and leadership are key factors in raising institutional quality. Leaders, both local administrators
and governing boards/authorities, are responsible for ensuring all learners achieve while also managing many
other facets of an institution. Institutions that function effectively do so without tension between the governing
board/authority, administrators, and educators and have established relationships of mutual respect and a
shared vision (Feuerstein & Opfer, 1998). In a meta-analysis of educational institution leadership research,
Leithwood and Sun (2012) found that leaders (school and governing boards/authority) can significantly
"influence school conditions through their achievement of a shared vision and agreed-on goals for the
organization, their high expectations and support of organizational members, and their practices that
strengthen school culture and foster collaboration within the organization." With the increasing demands of
accountability placed on institutional leaders, leaders who empower others need considerable autonomy and
involve their communities to attain continuous improvement goals. Leaders who engage in such practices
experience a greater level of success (Fink & Brayman, 2006). Similarly, governing boards/authorities that
focus on policy-making are more likely to allow institutional leaders the autonomy to make decisions that
impact teachers and students and are less responsive to politicization than boards/authorities that respond to
vocal citizens (Greene, 1992).
AdvancED's experience, gained through evaluation of best practices, has indicated that a successful institution
. has leaders who are advocates for the institution's vision and improvement efforts. The leaders provide
direction and allocate resources to implement curricular and co-curricular programs that en~ble students to
achieve expectations for their learning. Leaders encourage collaboration and shared responsibility for school
improvement among stakeholders. The institution's policies, procedures, and organizational conditions ensure
equity of learning opportunities and support for innovation.
© 2017 Advance Education, Inc. All rights reserved unless otherwise granted by written agreement. Page 21

Kentucky Department of Education Wellington Elementary
Standard 1 - Purpose and Direction The school maintains and communicates a purpose and direction that commit to high expectations for learning
as well as shared values and beliefs about teaching and learning.
::;,?,;:.. :.r
:;,::;~~~[;)~ '(·:.·;,;,,•~:i,:::: ,},.'i:c
••'/{.
~~BIJ!fll~ .'·,;:·: .....
jf' ..... .,. :::~t1:;t\ >.·\/' :··:.' ,,.··.•:;,.;•c:
1.1 The school engages in a systematic, inclusive, and comprehensive process to 2.00 review, revise, and communicate a school purpose· for student success.
1.2 The school's leadership and staff commit to a culture that is based on shared 2.20 values and beliefs about teaching and learning and supports challenging, equitable educational programs and learning experiences for all students that include achievement of learning, thinking, and life skills.
1.3 The school's leadership implements a continuous improvement process that 2.00 provides clear direction for improving conditions that support student learning.
Standard 2 - Governance and Leadership The school operates under governance and leadership that promote and support student performance and
school effectiveness.
2.1
2.2
2.3
2.4
2.5
2.6
The governing body establishes policies and supports practices that ensure effective administration of the school.
The governing body operates responsibly and functions effectively.
The governing body ensures that the school leadership has the autonomy to meet goals for achievement and instruction and to manage day-to-day operations effectively.
Leadership and staff foster a culture consistent with the school's purpose and direction.
Leadership engages stakeholders effectively in support of the school's purpose and direction.
Leadership and staff supervision and evaluation processes result in impro'ved professional practice and student success.
Stakeholder Feedback Diagnostic
2.00
2.00
2.00
2.00
2.20
1.80
Stakeholder Feedback is the third of three primary areas of evaluation in AdvancED's Performance
Acc~editation model. The AdvancED surveys (student, parent, and teacher) are directly correlated to the
AdvancED Standards and indicators. They provide not only direct information about stakeholder satisfaction
but also become a source of data for triangulation by the External Review Team as it evaluates indicators.
© 2017 Advance Education, Inc. All rights reserved unless otherwise granted by written agreement. Page 22

Kentucky Department of Education Wellington Elementary
Institutions are asked to collect and analyze stakeholder feedback data, then submit the data and the analyses
to the External Review Team for review. The External Review Team evaluates the quality of the administration
of the surveys by institution, survey results, and the degree to which the institution analyzed and acted on the
results.
Questionnaire Administration
Stakeholder Feedback Results and Analysis
Findings Improvement Priority
3.00
3.00
Develop, implement and monitor a supervision process to ensure that teachers, 1) teach the approved
curriculum, 2) use data from multiple assessments of student learning to modify classroom instructional
practices and 3) use instructional strategies that require student collaboration, self-reflection and development
of critical thinking skills.
(Indicator 2.6, Indicator 3.4)
Primary Indicator
Indicator 2.6
Evidence and Rationale
Student ·Performance Data:
Student performance data, as detailed in an addendum to this report, showed the school had not met its state
Annual Measurable Objective (AMO) for the past two years. Total assessment scores declined from 44.1 in
2014-2015 to 38.5 in 2015-2016. An analysis of the 2015-2016 K-PREP indicated a decline in overall
Proficient/Distinguished scores in reading, math and writing assessed in the prior year and results also trailed
both district and state averages. In 2015-2016, fifth grade reading, math, socia.I studies and writing scores
showed a negative performance trend for the previous two years when compared to previous school, district
and state averages. For example, in 2015-2016, students in grades three through five achieved a 35.8 percent
of Proficient/Distinguished scores in Reading versus the state score of 56.0 percent Proficient/Distinguished.
The state classification of Wellington Elementary in 2015-2016 was "Needs Improvement."
Classroom Observation Data:
Classroom observation data, as detailed in the Teaching and Learning Impact section of this report, revealed
the Progress Monitoring and Feedback (2.3) and High Expectations (2.5) Learning Environments could be
improved through an effective supervision and feedback process. Classroom observations revealed that it was
© 2017 Advance Education, Inc. All rights reserved unless otherwise granted by written agreement. Page 23

Kentucky Department of Education Wellington Elementary
evident/very evident in 37 percent of classrooms students were engaged in rigorous coursework, discussions
and/or tasks. Observation data also revealed it was evident/very evident in 27 percent of classrooms that
students were provided additional/alternative instruction and feedback at the appropriate level of challenge for
her/his needs. The use of consistent, meaningful and timely instructional feedback can increase student
learning.
Stakeholder Survey Data:
Ninety-two percent of teachers agreed/strongly agreed with the statement, "All teachers in our school use
multiple types of assessments to modify instruction and to revise the curriculum." However, classroom
observations indicated a low level of rigor in the curriculum and in the questions teachers asked students
during instruction. It was evident/very evident in 32 percent of classrooms that students were asked and
responded to questions that required higher order thinking (e.g., applying, evaluating, synthesizing). Classroom
observations revealed a wide variance in teacher expectations and an inconsistent application of effective
instructional practices. In many classrooms, observers noted students used pre-printed worksheets.
Stakeholder Interviews:
Interview data showed the principal shared that she had adopted an active role in reviewing instructional plans,
conducting classroom walkthroughs and using walkthrough and school performance data as a tool to
determine the school's success. During interviews, teachers consistently were unable to describe a clear
method of how school leaders monitored and supported the improvement of instructional practices. They
described an informal walk-through process whereby a communication clipboard was maintained at each
teacher's classroom doorway. Messages and feedback from the school leaders were left for the teacher on
the clipboard as they (school leaders) completed walkthroughs. Some feedback to teachers, for example,
included the following two comments: "1 0/13/15 Thank you for keeping students engaged at all times" and
"1 0/21/15 All students focused and working hard." Teachers were able to articulate what happened to the
collected "data" from the walkthroughs or how that data would be used to improve the teacher's instructional
practices and the success of the students. The principal reported the use of clipboard messages was a tool for
asking questions and providing teacher feedback. The principal noted the system for monitoring instructional
practices "needs to be more systematic" and that she was "still tightening systems."
Documents and Artifacts:
A review of documents and artifacts provided by the school to the Team revealed limited documentation that
supported a systematic plan to improve instruction and student success. The Team Found little evidence to
support the specific use of targeted feedback aimed at helping teachers improve classroom instructional
practices. The school provided a classroom walkthrough form; however, no examples of its use were provided.
The Team found no individualized teacher feedback plans to support that the walkthrough process actually
resulted in changed instructional practice or improved student performance. Other evidence reviewed by the
Team included some classroom eleot™ observations, student performance data (K-PREP school report card)
and informal observation messages located on the classroom clipboards in each room. This evidence was not
© 2017 Advance Education, Inc. All rights reserved unless otherwise granted by written agreement. Page 24

Kentucky Department of Education Wellington Elementary
directly linked to supervision and evaluation.
© 2017 Advance Education, Inc. All rights reserved unless otherwise granted by written agreement. Page 25

Kentucky Department of Education Wellington Elementary
Resource Utilization The use and distribution of resources must be aligned and supportive of the needs of an institution and the
students served. Institutions must ensure that resources are aligned with the stated mission and are distributed
equitably so that the needs of students are adequately and effectively addressed. The utilization of resources
includes an examination of the allocation and use of resources, the equity of resource distribution to need, the
ability of the institution to ensure appropriate levels of funding and sustainability of resources, as well as
evidence of long-range capital and resource planning effectiveness.
Institutions, regardless of their size, need access to sufficient ~esources and systems of support to be able to
engage in sustained and meaningful efforts that result in a continuous improvement cycle. Indeed, a study
conducted by the Southwest Educational Development Laboratory (Pan, D., Rudo, Z., Schneider, C., & Smith
Hansen, L., 2003) "demonstrated a strong relationship between resources and student success ... both the
level of resources and their explicit allocation seem to affect educational outcomes."
AdvancED has found through its own evaluation of best practices in the more than 32,000 institutions in the
AdvancED Network that a successful institution has sufficient human, material, and fiscal resources to
implement a curriculum that enables students to achieve expectations for student learning, meets special
needs, and complies with applicable regulations. The institution employs and allocates staff members who are ·
well qualified for their assignments. The institution provides a safe learning environment for students and staff.
The institution provides ongoing learning opportunities for all staff members to improve their effectiveness and
ensures compliance with applicable governmental regulations.
Standard 4 - Resources and Support Systems The school has resources and provides services that support its purpose and direction to ensure success for
all students.
4.1
4.2
4.3
4.4
4.5
4.6
Qualified professional and support staff are sufficient in number to fulfill their roles and responsibilities necessary to support the school's purpose, direction, and the educational program.
Instructional time, material resources, and fiscal resources are sufficient to support the purpose and direction of the school.
The school maintains facilities, services, and equipment to provide a safe, clean, and healthy environment for all students and staff.
Students and school personnel use a range of media and information resources to support the school's educational programs.
The technology infrastructure supports the school's teaching, learning, and operational needs.
The school provides support services to meet the physical, social, and emotional needs of the student population being served.
© 2017 Advance Education, Inc. All rights reserved unless otherwise granted by written agreement.
2.20
2.80
2.80
2.60
2.20
2.40
Page 26

Kentucky Department of Education Wellington Elementary
4.7 The school provides services that support the counseling, assessment, referral, 2.40 educational, and career planning needs of all students. ·
© 2017 Advance Education, Inc. All rights reserved unless otherwise granted by written agreement. Page 27

Kentucky Department of Education Wellington Elementary
Conclusion School leadership and staff members had developed a very inviting and positive climate for the students over·
the past four years. Despite the improvement in climate, student academic performance had lagged well below
state and local averages. By self-report the administration shifted its primary focus about 18 months ago to a
concentrated effort to improve the school's instructional program. A focused effort was implemented to
increase teacher efficacy, which established PLCs, targeted professional development activities, increased
administrative classroom supervision and improved peer support strategies.
The PLC process provided a structure to develop an increased sense of shared responsibility for student
success. The PLC structure also shifted the prevailing cultural mindset from teaching to student learning
through planned meeting agendas and training. The administration began to emphasize the regular
examination of student performance data to directly impact classroom instructional practices. Deliberate efforts
were made to increase the level of curriculum rigor to challenge students at a higher level and to help them
better develop their critical thinking skills. Classroom walkthroughs became a regular part of the instructional
day. Collectively, these strategies have significantly increased the focus on student learning and resulted in
increased student achievement. The school should continue its efforts and significantly strengthen the
classroom walkthrough process, use of data to modify instruction and develop a school-wide instructional
process. These strategies are the focus of the three Improvement Priorities in this report.
Within the past two years the school has instituted several specific strategies to improve student performance.
These strategies included the development of 30-60-90 Day Delivery Plans (2015-2016) and targeted the
school's instructional culture, PLC process and a school-wide writing program. As part of the instructional
culture, a classroom walkthrough system was developed to provide specific feedback to teachers. Professional
development activities have been focused on classroom instructional strategies with a specific emphasis on
student engagement.
This year (2016-2017), the school established specific goals to meet its AMO and reading and math novice
reduction targets. The school added a school-wide, daily guided reading and writing program and incorporated
a school-wide student assessment plan and process. The use of Measures of Academic Progress (MAP) was
implemented to monitor student performance on a quarterly basis. At this point, the school needs to continue
its present activities. The three Improvement Priorities (see below) are directly related to current initiatives and,
if implemented with fidelity, should strengthen the instructional program and result in improved student
performance.
Improvement Priorities The institution should use the findings from this review to guide the continuous improvement process. The
institution must address the Improvement Priorities listed below:
Develop, implement and monitor a process to systematically review curriculum and instructional
practices to ensure they· are aligned vertically and horizontally and consistent with school goals for
© 2017 Advance Education, Inc. All rights reserved unless otherwise granted by written agreement. Page 28

Kentucky Department of Education Wellington Elementary
student achievement. Ensure administrators and teachers analyze multiple sources of data and use
findings to ascertain a co'mprehensive and complete picture of student learning, instruction, the
effectiveness of programs and the conditions that support learning.
Develop, implement and monitor a school-wide instructional process anchored in current student
formative performance data and research-informed best practices. Use formative data to develop short
and long-range lesson plans and revise instructional methods (e.g., re-teach objectives or regroup
students). Implement instructional strategies that incorporate student-centered activities and focus on
active student engagement. Examples include collaboration with other students while researching topics,
making topical connections, applying information, creating projects, demonstrating a task, conducting
critical peer review of writing, self-reflection activities and problem solving activities.
Develop, implement and monitor a supervision process to ensure that teachers, 1) teach the approved
curriculum, 2) use data from multiple assessments of student learning to modify classroom instructional
practices and 3) use instructional strategies that require student collaboration, self-reflection and
development of critical thinking skills.
© 2017 Advance Education, Inc. All rights reserved unless otherwise granted by written agreement. Page 29

Kentucky Department of Education Wellington Elementary
Addenda Team Roster
Dr. George W Griffin
Mr. Sam Watkins
Mrs. Rhonda Back
Ms. Nancy Burns
Dr. Griffin holds B.A. and M.Ed. degrees from Duke University. He received his Ph.D. in Special Education from The University of North Carolina at Chapel Hill. Primary areas of concentration included the education of students with learning disabilities and/or behavior problems, and educational administration. During his 40-year education career Griffin has been a special education teacher, high school principal, central office program director, state department program director, and university professor. He has extensive experience in alternative school programming; having served as a school director and statewide program director for services for violent and assaultive youth in North Carolina. Griffin has served as the Department Chair in the Department of Educational Leadership, Research, and Technology at North Carolina Central University. He has also served as a Special Education Due Process Hearing Officer in North Carolina. Griffin is the author of several entries in the Encyclopedia of Educational Leadership and Administration as well as a contributor to several special education textbooks and professional journals.
Dr. Griffin is an independent educational consultant. He serves as a Lead Evaluator with AdvancED and has lead reviews in numerous schools and school districts throughout the United States and in the Middle East. He was the keynote speaker and a session presenter at the first AdvancED International Learning Disabilities Conference (May, 2013) in Beirut, Lebanon. He has also presented interactive training sessions at AdvancED Global Education Conferences in the United Arab Emirates, Saudi Arabia, and Egypt.
Sam graduated from Eastern Kentucky Univerisity with a BBA in Business Management and Business Education. In addition to earning a MBA from Eastern Kentucky University, he has a certification to teach mathematics at the secondary level and received his Superintendency Certification from the University of Kentucky. Sam taught math for seven years, led two high schools as principal over a period of thirteen years, and was Director of Districtwide Programs for Woodford County Schools for seven years. For the past two and a half years, he has been an Educational Recovery Leader for the state of KY.
Rhonda Back is an Elementary Curriculum, Instruction and Assessment Director for Bath County Schools. Experience in education has ranged from classroom teacher to School and District Administrator working with adults and students from Pre-school to College level in the past 30+ years. She loves working with and coaching teachers to become their best for their students. She is currently involved with school improvement and moving schools to proficient and distinguished ratings.
I have 20 years experience in education. I have served as a teacher (K-5), Gifted and Talented Resource Teacher for a district, Instructional Coach for one elementary, one of two Curriculum Coaches for five large elementary schools. I obtained my National Board Certification in Middle Childhood Generalist. I am currently an MOA from Campbell County School District in Northern Kentucky, serving as an Educational Recovery Specialist for the Kentucky Department of Education.
Prior to teaching, I worked in business as an Employee Benefits Administrator for the third largest bank in Ohio.
© 2017 Advance Education, Inc. All rights reserved unless otherwise granted by written agreement. Page 30

Kentucky Department of Education Wellington Elementary
Mike York Mr. York has served public education for 26 years in multiple schools as well as at the district and state levels in Kentucky and for the US Department of Defense in London, England. He has served as a classroom math and science teacher in both middle and high school, district achievement coach, district technology integration specialist, and as an effectiveness coach at the state department of education. He is certified in math, chemistry, physics in high school and math and general science at the middle school level. He earned A.S and B.S. degrees at Eastern Kentucky University, and M.Ed. at Oxford Brookes University, England and a Rank 1 Certification at University of Louisville.
© 2017 Advance Education, Inc. All rights reserved unless otherwise granted by written agreement. Page 31

Kentucky Department of Education Wellington Elementary
About AdvancED AdvancED is the world leader in providing improvement and accreditation services to education providers of all
types in their pursuit of excellence in serving students. AdvancED serves as a trusted partner to more than
32,000 public and private schools and school systems- enrolling more than 20 million students- across the
United States and 70 countries.
In 2006, the North Central Association Commission on Accreditation and School Improvement (NCA CASI),
the Southern Association of Colleges and Schools Council on Accreditation and School Improvement (SACS
CASI), both founded in 1895, andthe National Study of School Evaluation (NSSE) came together to form
AdvancED: one strong, unified organization dedicated to education quality. In 2011, the Northwest
Accreditation Commission (NWAC) that was founded in 1917 became part of AdvancED.
Today, NCA CASI, NWAC and SACS CASI serve as accreditation divisions of AdvancED. The Accreditation
Divisions of AdvancED share research-based quality standards that cross school system, state, regional,
national, and international boundaries. Accompanying these standards is a unified and consistent process
designed to engage educational institutions in continuous improvement.
© 2017 Advance Education, Inc. All rights reserved unless otherwise granted by written agreement. Page 32

Kentucky Department of Education Wellington Elementary
References Alwin, L. (2002). The will and the way of data use. School Administrator, 59(11), 11.
Baumert, J., Kunter, M., Blum, W., Brunner, M., Voxx, T., Jordan, A., Klusmann, U., Krauss, S.,
Nuebrand, M., & Tsai, Y. (2010). Teachers' mathematical knowledge, cognitive activation in the
classroom, and student progress. American Educational Research Journal, 4 7(1 ), 133-.180.
Chartered Institute of Personnel and Development. (2012). Shared purpose: the golden thread?
London: CIPD.
Colbert, J., Brown, R., Choi, S., & Thomas, S. (2008). An investigation of the impacts of teacher-driven
professional development. Teacher Education Quarterly, 35(2), 134-154.
Conley, D.T. (2007). Redefining college readiness (Vol. 3). Eugene, OR: Educational Policy
Improvement Center.
Datnow, A., Park, V., & Wohlstetter, P. (2007). Achieving with data: How high-performing school
systems use data to improve instruction for elementary students. Los Angeles, CA: Center on
Educational Governance, USC.
Dembosky, J., Pane, J., Barney, H., & Christina, R. (2005). Data driven decision making in
Southwestern Pennsylvania school districts. Working paper. Santa Monica, CA: RAND.
Ding, C. & Sherman, H. (2006). Teaching effectiveness and student achievement: Examining the
relationship. Educational Research Quarterly, 29 (4), 40-51.
Doyle, D. P. (2003). Data-driven decision making: Is it the mantra of the month or does it have staying
power? T.H.E. Journal, 30(10), 19-21.
Feuerstein, A., & Opfer, V. D. (1998). School board chairmen and school superintendents: An analysis
of perceptions concerning special interest groups and educational governance. Journal of School
Leadership, 8, 373-398.
Fink, D., & Brayman, C. (2006). School leadership succession and the challenges of change.
Educational Administration Quarterly, 42 (62), 61-89.
Greene, K. (1992). Models of school-board policy-making. Educational Administration Quarterly, 28
(2), 220-236.
Horng, E., Klasik, D., & Loeb, S. (2010). Principal time-use and school effectiveness. American
Journal of Education 116, (4) 492-523.
Lafee, S. (2002). Data-driven districts. School Administrator, 59(11), 6-7, 9-10, 12, 14-15.
Leithwood, K., & Sun, J. (2012). The Nature and effects of transformational school leadership: A meta
analytic review of unpublished research. Educational Administration Quarterly, 48 (387). 388-423.
Marks, H., Louis, K.S., & Printy, S. (2002). The capacity for organizational learning: Implications for
pedagogy and student achievement. InK. Leithwood (Ed.), Organizational learning and school
improvement (p. 239-266). Greenwich, CT: JAI Press.
Mcintire, T. (2002). The administrator's guide to data-driven decision making. Technology and
Learning, 22(11 ), 18-33.
Pan, D., Rudo, Z., Schneider, C., & Smith-Hansen, L. (2003). Examination of resource allocation in
education: connecting spending to student performance. Austin, TX: SEDL.
© 2017 Advance Education, Inc. All rights reserved unless otherwise granted by written agreement. Page 33

Kentucky Department of Education Wellington Elementary
Attachments The following attachments have ~een included in this report.
1. Student Performance Data Analysis
2. Stakeholder Survey Plus/Delta
3. Diagnostic Review Team Schedule
© 2017 Advance Education, Inc. All rights reserved unless otherwise granted by written agreement. Page 34

Student Performance Data
School Name: Wellington Elementary
Annual Measurabl~ Obj~ctive (Atyl()) Year Baseline AMO Goal learners Met AMO Met
(Prior Year Total Score Participation ; learners Total . Rate Goal
2015-2016 38.5 YES
Met Graduation Rate Goal
Year Prior Year ·' AMOG6al ! Overall Total - M~i'AMQ ·: Met . Mef : Overall Total Score · .. Goal · Participation : Gl"~~u.~~ioll :
'"""''''''"~'"''''''''"'""''""'"''"'"'~""''~''"'"'~"''"'"'"""~"~'9n~<~or.''"''''''""'"!"~";,;L.,.,•,;,;;,.,,,,;,,,,;\.,~,,.,~.,j,,.,.,.,~,.''"'"'"''"''""""'"'''''"''''''''"i"";,i,,,,~,:;L,,E;,,;,,,,;J,.,,."'""~~,!~,.§,~-~"~''''''"''';_;;,.,:;~,,~~!~,;~~~31 2014-2015 64.3 ' <65.~. : 62.0 N(f,'', YES N//A:. ';
Plus • Student performance data showed the school met its participation rate for the 2014-
2015 school year and the 2015-2016 school year.
Delta • Student performance data showed the school did not meet its AMO goal for the 2015-
2016 school year. The overall student score declined from 44.1 in 2014-2015 to 38.5 in 2015-2016.
1

Percentages of Students Scoring at Proficient/Distinguished (P/D) levels on the K-PREP
Assessments .. ~~ ~he School and in the StateJ~~1.4~~01S,,2_0,iS-~~"~~) ... .. -
i Content %P/D School (2014-15)
%P/D School (2015-16)
%P/D State (2015-16) j Area
:,.
'Reading ''····{······
4th grade
, 5th grade
;·s.citi~l · Studies . : ' ~ .•. . : . ., .. :.c: '-" .... ,.
32.9
48.4
' 5th grade 46.8
; \Affjtir'l{f ' l
f S~h~r~d~ i, ·. 25.8
· larl~.uag~ j ·Mech. , ,
' 4th grade
Plus • The percentage of students scoring proficient/distinguished on the K-PREP fourth grade
reading assessment increased by 21.8 percentage points from the 2014-2015 school year to the 2015-2016 school year.
• The percentage of students scoring proficient/distinguished on the K-PREP fourth grade math assessment increased by 8.1 percentage points from the 2014-2015 school year to the 2015-2016 school year.
• The percentage of students scoring proficient/distinguished on the K-PREP language mechanics assessment increased by 2 percentage points from the 2014-2015 school year to the 2015-2016 school year.
Delta • Student performance data indicated the school did not perform at or above state
average in any tested areas for the 2015-2016 school year.
• The percentage of students scoring proficient/distinguished on the K-PREP third grade reading assessment declined 9. 7 percentage points from the 2014-2015 school year to the 2015-2016 school year.
• The percentage of students scoring proficient/distinguished on the K-PREP fifth grade reading assessment declined 20.1 percentage points from the 2014-2015 school year to the 2015-2016 school year.
2

• The percentage of all students scoring proficient/distinguished on the K-PREP reading assessment declined 2.3 percentage points from the 2014-2015 school year to the 2015-2016 school year.
• The percentage of students scoring proficient/distinguished on the K-PREP third grade math assessment declined by 20.1 percentage points from the 2014-2015 school year to the 2015-2016 school year.
• The percentage of students scoring proficient/distinguished on the K-PREP fifth grade math assessment declined by 25.3 percentage points from the 2014-2015 school year to the 2015-2016 school year.
• The percentage of all students scoring proficient/distinguished on the K-PREP math assessment declined by 12.1 percentage points from the 2014-2015 school year to the 2015-2016 school year.
• The percentage of students scoring proficient/distinguished on the K-PREP social studies assessment declined by 23.7 percentage points from the 2014-2015 school year to the 20152016 school year.
• The percentage of students scoring proficient/distinguished on the K-PREP writing assessment declined by 14.3 percentage points from the 2014 -2015 school year to the 2015-2016 school year.
Sch~ol Achievemer1t of Proficiency and ~ap Deliv(;!ry Tar~E!ts {2015-2016) Tested Area Proficiency Actual Score Met Target Gap Actual Met
Delivery Tar.get (Yes or No) Delivery Score for% P/D Target for% .
Combined 49.8 33.0 NO 47.9 32.6 Reading & Math
, Reading 49.3 35.8 NO 47.6 35.3 NO Math 50.2 30.2 NO 48.2 29.8 NO Social 59.2 24.3 NO 57.5 22.2 NO Studies Writing 35.5 12.2 NO 33.7 12.5 NO
Delta
• Wellington Elementary School did not meet any of its proficiency or gap delivery targets for the 2015- 2016 school year.
3

Progra~ Revi_ews 2~15-~~1~ __ Fc>rmative & Professional Aclmlr1Jst,l'~tive/ · Total ·c:Jassification· '
\ ·sllrilfuatit~: o~x~'~p.rri.~~t': ·~e~·~~rs~.~~ ··r;oit1ts · Ass~~sM¢hi: t .·.~ne~·~upport · ~~P,.Ilprt~~? :x .. ·.·.··· ·· · ···· ·.··. ~ · . l i ~~~fruciiC>ri
.. ·.·•· (~J>.ts .·· · ; •·· P()~Sipie)
·:,.J~pts.·. :····· ~~~vices< ,· .•·.IVJ.Bnit9rihg-> .. ·,· (:t!~ki~t~ ; .:·: .. :
Arts and Humanities Practical
Livir1~ . Writing
K-3
World language and
. Global ; Competency*
2.06
1.96
2.11
2.31
. P()~~ipiE!) ··' {3 pts .. ''X:>) (3 pt.s po~~iple) · .: · p~s~~~-leL ! •· .'. p()S.~i~.~~) ·· : ( · ·: ;_. ·. , ....
1.86 2.75 1.90 8.6
2.00
2.00
2.25
2.25
2.25
.J.
2.00
2.71
2.14
8.1
9.1
9.0
\•'-.i
Proficient
Proficient
Proficient
Proficient
*The 2014-15 World Language Program Reviews scores for High Schools will be included with other program reviews to generate the comparable 2014-15 program review baseline score needed for 2015-16 accountability reporting. World Language Program Reviews for Elementary and Middle Schools are scheduled to be reported in 2015-16 and included in accountability in 2016-17.
Plus • Wellington Elementary School scored proficient on all required program review areas.
Delta • Formative and summative assessment in the program area of Arts and Humanities had·
the lowest scoring area with a score of 1.86.
:'·!
.4

Stakeholder Feedback Plus/Delta
Teaching and learning Impact (Standards 3 and 5)
+ Plus: (minimum of 90 percent agreed/strongly agreed)
1. 93 percent of students agreed/strongly agreed with the statement, "My teachers help me learn
things I will need in the future."
2. 90 percent of students agreed/strongly agreed with the statement, 11My teachers use different
activities to help me learn."
3. 94 percent of students agreed/strongly agreed with the statement, "My school has computers
to help me learn."
4. 95 percent of students agreed/strongly agreed with the statement, 11 ln my school, my principal
and teachers want every student to learn."
5. 92 percent of staff agreed/strongly agreed with the statement, "All teachers in our school
monitor and adjust curriculum, instruction, and assessment based on data from student
assessments and examination of professional practice."
6. 92 percent of staff agreed/strongly agreed with the statement, "All teachers in our school use
multiple types of assessments to modify instruction and to revise the curriculum."
7. 94 percent of staff agreed/strongly agreed with the statement, /{All teachers in our school
personalize instructional strategies and interventions to address individual learning needs of
students."
8. 92 percent of staff agreed/strongly agreed with the statement, "All teachers in our school use a
variety of technologies as instructional resources."
9. 90 percent of staff agreed/strongly agreed with the statement, "Our school's leaders regularly
evaluate staff members on criteria designed to improve teaching and learning."
10. 90 percent of staff agreed/strongly agreed with the statement, "All teachers use a process to
inform students of their learning expectations and standards of performance."
11. 90 percent of staff agreed/strongly agreed with the statement, "Our school's leaders expect
staff members to hold all students to high academic standards."
12. 92 percent of staff agreed/strongly agreed with the statement, "In our school, related learning
support services are provided for all students based on their needs."
13. 92 percent of staff agreed/strongly agreed with the statement, "In our school, all staff members
use student data to address the unique learning needs of all students."
14. 92 percent of staff agreed/strongly agreed with the statement, "Our school uses multiple
assessment measures to determine student learning and student performance."
15. 90 percent of staff agreed/strongly agreed with the statement, "Our school employs consistent
assessment measures across classrooms and course."
16. 90 percent of staff agreed/strongly agreed with the statement, "Our school leaders monitor
school data related to student achievement."
17. 90 percent of staff agreed/strongly agreed with the statement, "Our school leaders monitor
data related to school continuous improvement goals."
1
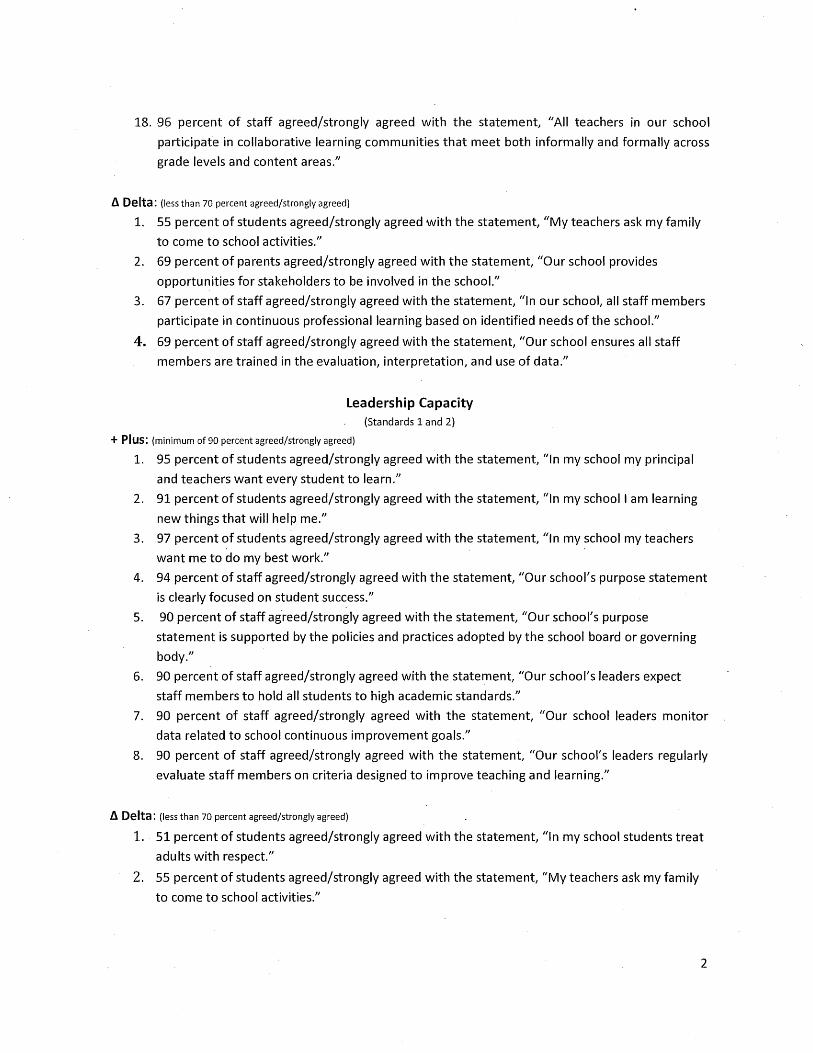
18. 96 percent of staff agreed/strongly agreed with the statement, "All teachers in our school
participate in collaborative learning communities that meet both informally and formally across
grade levels and content areas."
ll Delta: (less than 70 percent agreed/strongly agreed)
1. 55 percent of students agreed/strongly agreed with the statement, "My teachers ask my family
to come to school activities."
2. 69 percent of parents agreed/strongly agreed with the statement, "Our school provides
opportunities for stakeholders to be involved in the school."
3. 67 percent of staff agreed/strongly agreed with the statement, "In our school, all staff members
participate in continuous professional learning based on identified needs of the school."
4. 69 percent of staff agreed/strongly agreed with the statement, "Our school ensures all staff
members are trained in the evaluation, interpretation, and use of data."
leadership Capacity (Standards 1 and 2)
+ Plus: (minimum of 90 percent agreed/strongly agreed)
1. 95 percent of students agreed/strongly agreed with the statement, "In my school my principal
and teachers want every student to learn."
2. 91 percent of students agreed/strongly agreed with the statement, "In my school I am learning
new things that will help me."
3. 97 percent of students agreed/strongly agreed with the statement, "In my school my teachers
want me to do my best work."
4. 94 percent of staff agreed/strongly agreed with the statement, "Our school's purpose statement
is clearly focused on student success."
5. 90 percent of staff agreed/strongly agreed with the statement, a our school's purpose
statement is supported by the policies and practices adopted by the school board or governing
body."
6. 90 percent of staff agreed/strongly agreed with the statement, "Our school's leaders expect
staff members to hold all students to high academic standards."
7. 90 percent of staff agreed/strongly agreed with the statement, /(Our school leaders monitor
data related to school continuous improvement goals."
8. 90 percent of staff agreed/strongly agreed with the statement, "Our school's leaders regularly
evaluate staff members on criteria designed to improve teaching and learning."
ll Delta: (less than 70 percent agreed/strongly agreed)
1. 51 percent of students agreed/strongly agreed with the statement, "In my school students treat
adults with respect."
2. 55 percent of students agreed/strongly agreed with the statement, "My teachers ask my family
to come to school activities."
2

3. 54 percent of students agreed/strongly agreed with the statement, {/My principal and teachers
ask me what I think about school."
4. 66 percent of parents agreed/strongly agreed with the statement, "Our school's governing body
does not interfere with the operation or leadership of our school."
5. 69 percent of parents agreed/strongly agreed with the statement, "Our school provides
opportunities for stakeholders to be involved in the school."
Resource Utilization (Standard 4)
+ Plus: (minimum of 90 percent agreed/strongly agreed)
1. 93 percent of students agreed/strongly agreed with the statement, "My school has many places
I can learn, such as the library."
2. 94 percent of students agreed/strongly agreed with the statement, "My school has computers
to help me learn."
3. 94 percent of parents agreed/strongly agreed with the statement, "Our school provides
qualified staff members to support student learning."
4. 91 percent of parents agreed/strongly agreed with the statement, "Our school provides a safe
learning environment."
5. 90 percent of staff agreed/strongly agreed with the statement, "Our school provides sufficient
material resources to meet student needs."
6. 94 percent of staff agreed/strongly agreed with the statement, "Our school provides a variety of
information resources to support student learning." ' '
7. 94 percent of staff agreed/strongly agreed with the statement, "Our school maintains facilities
that support student learning."
8. 94 percent of staff agreed/strongly agreed with the statement, "Our school provides a plan for
the acquisition and support of technology to support student learning."
9. 96 percent of staff agreed/strongly agreed with the statement, "Our school provides
opportunities for students to participate in activities that interest them."
ll Delta: (less than 70 percent agreed/strongly agreed}
1. 67 percent of parents agreed/strongly agreed with the statement, "Our school ensures the
effective use of financial resources."
3

Advancf2
Diagnostic Review Schedule Wellington Elementary School
4800 Kaufman Lane louisville, Kentucky 40216
Sunday- January 22, 2017 1 'Tih1'e·;.<·_r:-,, j:.;;-· ,·;,.;;;··- ~--,' '·.•.···· ; ~·:;_ ',>\:.·.: •..•..••. -._-··-·· ·.•· ,·:,;·.•.•••,:; -..·;,;,·.·-: ,·:·; .,, __ --)('i\2: .. :·;-:;~· ; __ ,·:·c._ ··.;.;,;:·;; ·.·.-.··::··
·('.; '· '-:·•., .;;--.
3:30p.m. Team Meeting
4:30p.m.- Principal Overview 5:15p.m.
5:30p.m.- Team Work Session #1 9:00p.m. • Review and discuss performance data, stakeholder survey data, Self
Assessment, Executive Summary, other diagnostics in ASSIST and documents and artifacts provided by the institution to review initial ratings for all indicators.
• Determine interview questions, review Monday's schedule, overview of eleot® and discuss review logistics
Monday- January 23, 2017 Time Event 8:15a.m. Team arrives at school
9:15a.m.- Principal's Interview I Classroom Observations I Interviews 10:15 a.m.
10:15 a.m.- Classroom observations and stakeholder interviews 11:45 a.m.
11:45 a.m.- lunch- Team Members eat when it can fit into their individual schedule 12:30 p.m.
11:45 a.m.- Continued classroom observations and individual interviews 3:35p.m.
3:45p.m.--: Team returns to hotel (after dismissal) and has dinner on their own 6:00p.m. 6:00p.m.- Team Work Session #2 9:00p.m. (Agenda provided by lead Evaluator)
• Tabulate classroom observation data from Day#l
• Team Members determine individual second ratings for all indicators
• Discuss potential Powerful Practices, Opportunities for Improvement*, and Improvement Priorities
• Team Members draft Improvement Priorities, Opportunities for Improvement*, or Powerful Practices that are then shared with the Team. Team Members and lead Evaluator provide feedback.
• Prepare for Day 2
~w,..~r.~.c: \ '\'' ·._Whp?;·-··. '/·::I; •. •_(··_ ;·:; '. •. ·.~
Hotel Diagnostic Conference Review Team Room Members Hotel Diagnostic Conference Review Team Room Members
Hotel Diagnostic Conference Review Team Room Members
Where Who School office Diagnostic
Review Team Members
School Diagnostic Review Team Members
School Diagnostic Review Team Members
School Diagnostic Review Team Members
School Diagnostic Review Team Members (working in pairs or as individuals)
Hotel Diagnostic conference Review Team room Members
Revised 06.28.16

Tuesday- January 24, ·2017 Time Event Where Who 8:15a.m. Team arrives at school School Diagnostic
Review Team Members
8:15a.m.- Continue interviews and artifact review, conduct classroom observations School Diagnostic 4:00p.m. Review Team
Members 11:45 a.m.- Lunch- Team Members School Diagnostic 12:30 p.m. Review Team
Members 4:00p.m.- Team returns to hotel (after dismissal) and has dinner on own 6:00p.m.
6:00p.m.- Team Work Session #3 (Agenda provided by Lead Evaluator) Hotel Diagnostic 9:00p.m. • Review findings from the day Conference Review Team
• Tabulate and review final eleot® ratings Room Members
• Team Members determine individual final ratings for all indicators
Wednesday- January 25, 2017 Time Event Where Who
8:00a.m.- Final Team Work Session School Diagnostic 10:15 a.m. Review Team
Team Members review all components of the Diagnostic Review Team's Members findings including:
• Final ratings for standards and indicators
• Coherency and accuracy of the Improvement Priorities
• Detailed evidence for all of the findings
• eleot summary statements and narrative by learning environment
10:45 a.m. • Meeting w/ Dr. Kelly Foster, KDE Hotel
Written The Team's written report will be provided to the institution or DOE within 30 AdvancED Report days following the on-site Diagnostic Review.
Revised 06.28.16

School Diagnostic Review Summary Report
Wellington Elementary School
Jefferson County Public Schools
1/22/2017- 1/25/2017
The members of the Wellington Elementary School Diagnostic Review Team are grateful to the district
and school leadership, staff, students, families and community for the cooperation and hospitality
extended to us during the assessment process.
Pursuant to KRS 160.346, the Diagnostic Review Team has examined extensive evidence and arrived at
the following recommendations:
Principal Authority:
The principal does have the ability to lead the intervention and should remain as
principal of Wellington Elementary School to continue her roles and responsibilities
established in KRS 160.345.
Council Authority:
School council of Wellington Elementary School does have the ability to continue its roles and
responsibilities established in KRS 160.345.
I have reviewed the recommendations of the Diagnostic Review Team and adopt them as my
determination pursuant to KRS 160.346.
Commissioner, Kentucky Department of Education
____________________ Date: ______ _
I have received the diagnostic review report for Wellington Elementary School.
Principal, Wellington Elementary School
____________________ Date: ______ _
Superintendent, Jefferson County Public Schools