report name: stone fruit annual
TRANSCRIPT
THIS REPORT CONTAINS ASSESSMENTS OF COMMODITY AND TRADE ISSUES MADE BY USDA STAFF AND NOT NECESSARILY STATEMENTS OF OFFICIAL U.S. GOVERNMENT POLICY
Required Report: Required - Public Distribution Date: August 16, 2021
Report Number: CI2021-0013
Report Name: Stone Fruit Annual
Country: Chile
Post: Santiago
Report Category: Stone Fruit
Prepared By: Sergio Gonzalez
Approved By: Bret Tate
Report Highlights:
Chilean cherry planted area has historically grown year over year. Post estimates area planted to reach a
new record of 44,000 hectares in MY2021/22. Cherry productivity will likely decrease in MY2021/22
due to drought and production adjustments that Chilean producers will make to increase size and quality.
For MY2021/22, Post expects a three percent increase in cherry production and a three percent increase
in exports over MY2020/21 levels. FAS Santiago estimates that cherry production will reach 395,000
MT, while exports rise to 364,000 metric tons. For MY2021/22, Post estimates that fresh peach and
nectarine production will total 160,000 MT, a 0.6 percent decrease over MY2020/21. The decrease is
due to lower productivity and steady planted area. Peach and nectarine exports will only reach 98,000
MT, a one percent decrease from MY2020/21.
2
Commodity:
Fresh Cherries, (Sweet & Sour)
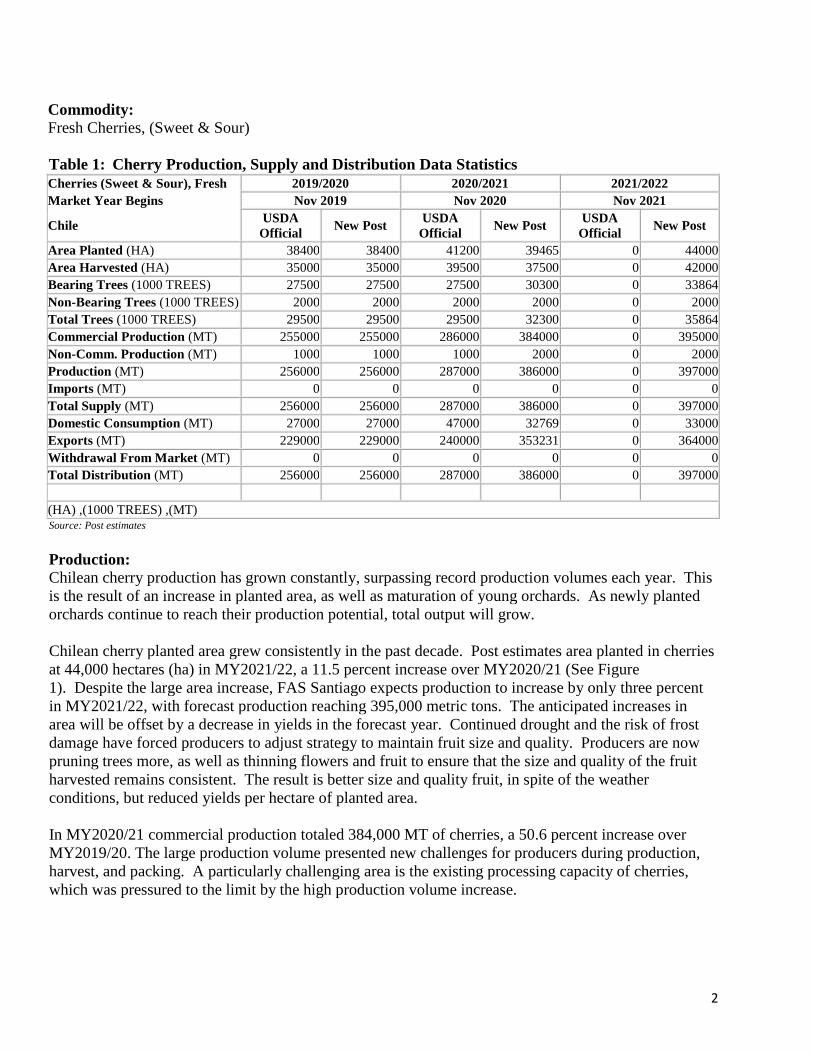
Table 1: Cherry Production, Supply and Distribution Data Statistics
Cherries (Sweet & Sour), Fresh 2019/2020 2020/2021 2021/2022
Market Year Begins Nov 2019 Nov 2020 Nov 2021
Chile USDA
Official New Post
USDA
Official New Post
USDA
Official New Post
Area Planted (HA) 38400 38400 41200 39465 0 44000
Area Harvested (HA) 35000 35000 39500 37500 0 42000
Bearing Trees (1000 TREES) 27500 27500 27500 30300 0 33864
Non-Bearing Trees (1000 TREES) 2000 2000 2000 2000 0 2000
Total Trees (1000 TREES) 29500 29500 29500 32300 0 35864
Commercial Production (MT) 255000 255000 286000 384000 0 395000
Non-Comm. Production (MT) 1000 1000 1000 2000 0 2000
Production (MT) 256000 256000 287000 386000 0 397000
Imports (MT) 0 0 0 0 0 0
Total Supply (MT) 256000 256000 287000 386000 0 397000
Domestic Consumption (MT) 27000 27000 47000 32769 0 33000
Exports (MT) 229000 229000 240000 353231 0 364000
Withdrawal From Market (MT) 0 0 0 0 0 0
Total Distribution (MT) 256000 256000 287000 386000 0 397000
(HA) ,(1000 TREES) ,(MT) Source: Post estimates
Production:
Chilean cherry production has grown constantly, surpassing record production volumes each year. This
is the result of an increase in planted area, as well as maturation of young orchards. As newly planted
orchards continue to reach their production potential, total output will grow.
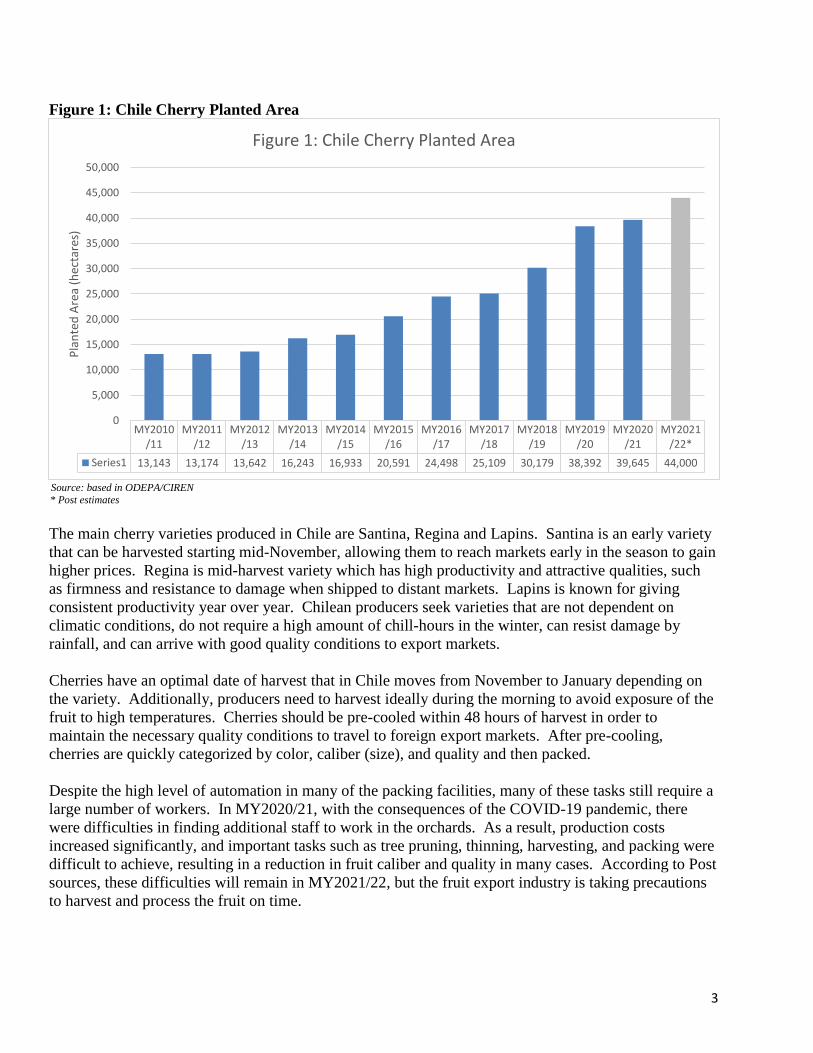
Chilean cherry planted area grew consistently in the past decade. Post estimates area planted in cherries
at 44,000 hectares (ha) in MY2021/22, a 11.5 percent increase over MY2020/21 (See Figure
1). Despite the large area increase, FAS Santiago expects production to increase by only three percent
in MY2021/22, with forecast production reaching 395,000 metric tons. The anticipated increases in
area will be offset by a decrease in yields in the forecast year. Continued drought and the risk of frost
damage have forced producers to adjust strategy to maintain fruit size and quality. Producers are now
pruning trees more, as well as thinning flowers and fruit to ensure that the size and quality of the fruit
harvested remains consistent. The result is better size and quality fruit, in spite of the weather
conditions, but reduced yields per hectare of planted area.
In MY2020/21 commercial production totaled 384,000 MT of cherries, a 50.6 percent increase over
MY2019/20. The large production volume presented new challenges for producers during production,
harvest, and packing. A particularly challenging area is the existing processing capacity of cherries,
which was pressured to the limit by the high production volume increase.
3
Figure 1: Chile Cherry Planted Area
Source: based in ODEPA/CIREN
* Post estimates
The main cherry varieties produced in Chile are Santina, Regina and Lapins. Santina is an early variety
that can be harvested starting mid-November, allowing them to reach markets early in the season to gain
higher prices. Regina is mid-harvest variety which has high productivity and attractive qualities, such
as firmness and resistance to damage when shipped to distant markets. Lapins is known for giving
consistent productivity year over year. Chilean producers seek varieties that are not dependent on
climatic conditions, do not require a high amount of chill-hours in the winter, can resist damage by
rainfall, and can arrive with good quality conditions to export markets.
Cherries have an optimal date of harvest that in Chile moves from November to January depending on
the variety. Additionally, producers need to harvest ideally during the morning to avoid exposure of the
fruit to high temperatures. Cherries should be pre-cooled within 48 hours of harvest in order to
maintain the necessary quality conditions to travel to foreign export markets. After pre-cooling,
cherries are quickly categorized by color, caliber (size), and quality and then packed.
Despite the high level of automation in many of the packing facilities, many of these tasks still require a
large number of workers. In MY2020/21, with the consequences of the COVID-19 pandemic, there
were difficulties in finding additional staff to work in the orchards. As a result, production costs
increased significantly, and important tasks such as tree pruning, thinning, harvesting, and packing were
difficult to achieve, resulting in a reduction in fruit caliber and quality in many cases. According to Post
sources, these difficulties will remain in MY2021/22, but the fruit export industry is taking precautions
to harvest and process the fruit on time.
MY2010/11
MY2011/12
MY2012/13
MY2013/14
MY2014/15
MY2015/16
MY2016/17
MY2017/18
MY2018/19
MY2019/20
MY2020/21
MY2021/22*
Series1 13,143 13,174 13,642 16,243 16,933 20,591 24,498 25,109 30,179 38,392 39,645 44,000
0
5,000
10,000
15,000
20,000
25,000
30,000
35,000
40,000
45,000
50,000
Pla
nte
d A
rea
(hec
tare
s)
Figure 1: Chile Cherry Planted Area
4
MY2020/21 was highly productive due to good climatic conditions during winter and spring, but fruit
sizes were small and there were quality problems due to the difficulty of processing the fruit on time.
So far, MY2021/22 has been characterized by having a winter with high average temperatures and
insufficient rainfall; there is a deficit of water in most of the cherry production area. This drought,
mainly in the central and northern regions in Chile, will likely reduce cherry production potential.
Additionally, according to the Chilean Meteorological Agency, there is a high risk of frost which could
affect the bloom. With the drought, risk of frost, and producer efforts to maintain fruit size and quality,
productivity is expected to decrease in MY2021/22.
Trade: For MY2021/22, Post estimates Chilean cherry exports will decrease by three percent over MY2020/21,
reaching 364,000 MT (See Table 1). The decrease in exports is due to the adjustments that producers
will make in order to maximize fruit quality for export markets. In MY2020/21 (data until May) cherry
exports totaled 353,231 MT, a 54.3 percent increase over MY2019/20 (See Table 2). In the same
period, export value increased by 57.8 percent and totaled $1.87 billion (See Table 3).
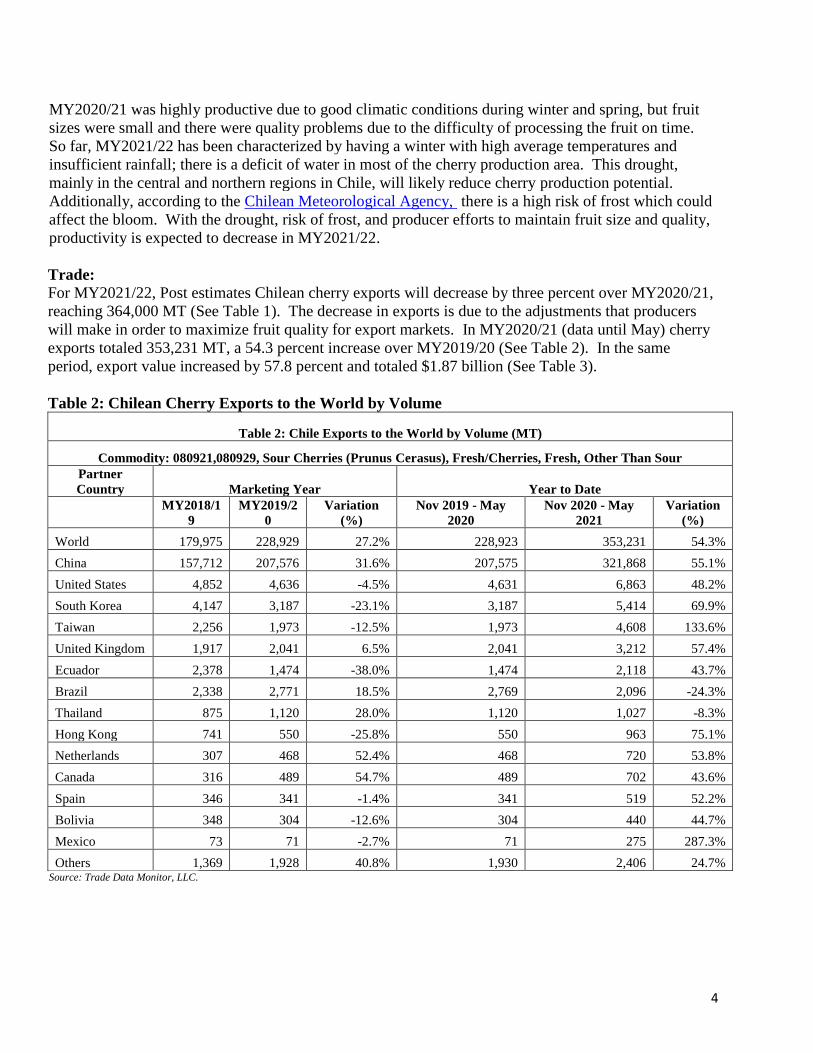
Table 2: Chilean Cherry Exports to the World by Volume
Table 2: Chile Exports to the World by Volume (MT)
Commodity: 080921,080929, Sour Cherries (Prunus Cerasus), Fresh/Cherries, Fresh, Other Than Sour
Partner
Country Marketing Year Year to Date
MY2018/1
9
MY2019/2
0
Variation
(%)
Nov 2019 - May
2020
Nov 2020 - May
2021
Variation
(%)
World 179,975 228,929 27.2% 228,923 353,231 54.3%
China 157,712 207,576 31.6% 207,575 321,868 55.1%
United States 4,852 4,636 -4.5% 4,631 6,863 48.2%
South Korea 4,147 3,187 -23.1% 3,187 5,414 69.9%
Taiwan 2,256 1,973 -12.5% 1,973 4,608 133.6%
United Kingdom 1,917 2,041 6.5% 2,041 3,212 57.4%
Ecuador 2,378 1,474 -38.0% 1,474 2,118 43.7%
Brazil 2,338 2,771 18.5% 2,769 2,096 -24.3%
Thailand 875 1,120 28.0% 1,120 1,027 -8.3%
Hong Kong 741 550 -25.8% 550 963 75.1%
Netherlands 307 468 52.4% 468 720 53.8%
Canada 316 489 54.7% 489 702 43.6%
Spain 346 341 -1.4% 341 519 52.2%
Bolivia 348 304 -12.6% 304 440 44.7%
Mexico 73 71 -2.7% 71 275 287.3%
Others 1,369 1,928 40.8% 1,930 2,406 24.7% Source: Trade Data Monitor, LLC.
5
Chile exports cherries to more than 50 different countries, but China is by far the top market for Chilean
cherries. Cherry exports to China totaled 321,868 MT in MY2020/21 and represented 91 percent of
Chilean cherry exports. The second top market is the United States with exports of 6,863 MT and
which accounts for only two percent of total Chilean fresh cherry exports.
On January 21, in the middle of the Chilean export cherry season to China, social media reported that
traces of COVID-19 had been found on a box of Chilean cherries in the city of Wuxi. Although this
was not an official communication from Chinese authorities, the news went viral. As a result, Chilean
cherry exports to China slowed and prices decreased by 59 percent. According to the Chilean
Association of Chilean Fruit Exporters (ASOEX), an independent investigation found no evidence or
traces of COVID-19 on Chilean cherry boxes. Despite this issue, Chilean cherry exporters expect
Chinese demand for cherries will remain strong, however, due to these events, Chilean exporters are
increasingly concerned about reducing market dependency by diversifying their export destinations for
cherries.
Another area of concern among Chilean cherry exporters is ensuring that only high-quality cherries
reach the Chinese market (high caliber, fruit firmness, and taste) in order to maintain a good country
reputation and, thus, high prices for their exports.
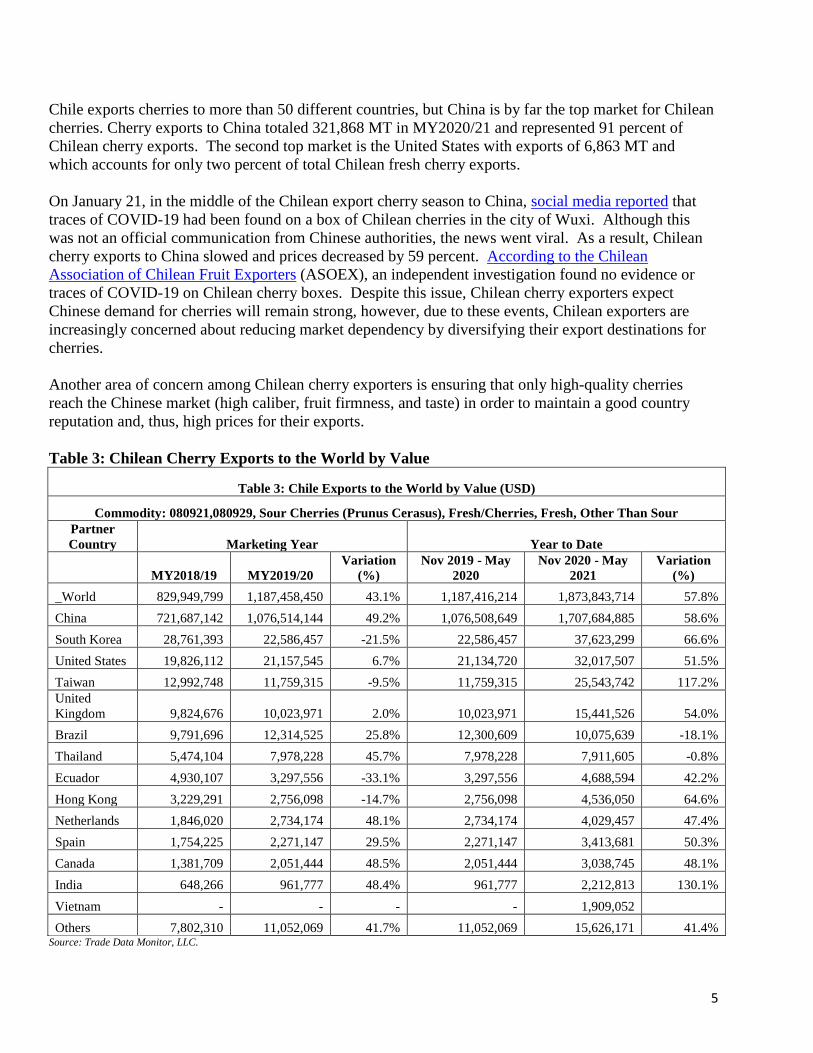
Table 3: Chilean Cherry Exports to the World by Value
Table 3: Chile Exports to the World by Value (USD)
Commodity: 080921,080929, Sour Cherries (Prunus Cerasus), Fresh/Cherries, Fresh, Other Than Sour
Partner
Country Marketing Year Year to Date
MY2018/19 MY2019/20
Variation
(%)
Nov 2019 - May
2020
Nov 2020 - May
2021
Variation
(%)
_World 829,949,799 1,187,458,450 43.1% 1,187,416,214 1,873,843,714 57.8%
China 721,687,142 1,076,514,144 49.2% 1,076,508,649 1,707,684,885 58.6%
South Korea 28,761,393 22,586,457 -21.5% 22,586,457 37,623,299 66.6%
United States 19,826,112 21,157,545 6.7% 21,134,720 32,017,507 51.5%
Taiwan 12,992,748 11,759,315 -9.5% 11,759,315 25,543,742 117.2%
United
Kingdom 9,824,676 10,023,971 2.0% 10,023,971 15,441,526 54.0%
Brazil 9,791,696 12,314,525 25.8% 12,300,609 10,075,639 -18.1%
Thailand 5,474,104 7,978,228 45.7% 7,978,228 7,911,605 -0.8%
Ecuador 4,930,107 3,297,556 -33.1% 3,297,556 4,688,594 42.2%
Hong Kong 3,229,291 2,756,098 -14.7% 2,756,098 4,536,050 64.6%
Netherlands 1,846,020 2,734,174 48.1% 2,734,174 4,029,457 47.4%
Spain 1,754,225 2,271,147 29.5% 2,271,147 3,413,681 50.3%
Canada 1,381,709 2,051,444 48.5% 2,051,444 3,038,745 48.1%
India 648,266 961,777 48.4% 961,777 2,212,813 130.1%
Vietnam - - - - 1,909,052
Others 7,802,310 11,052,069 41.7% 11,052,069 15,626,171 41.4%
Source: Trade Data Monitor, LLC.
6
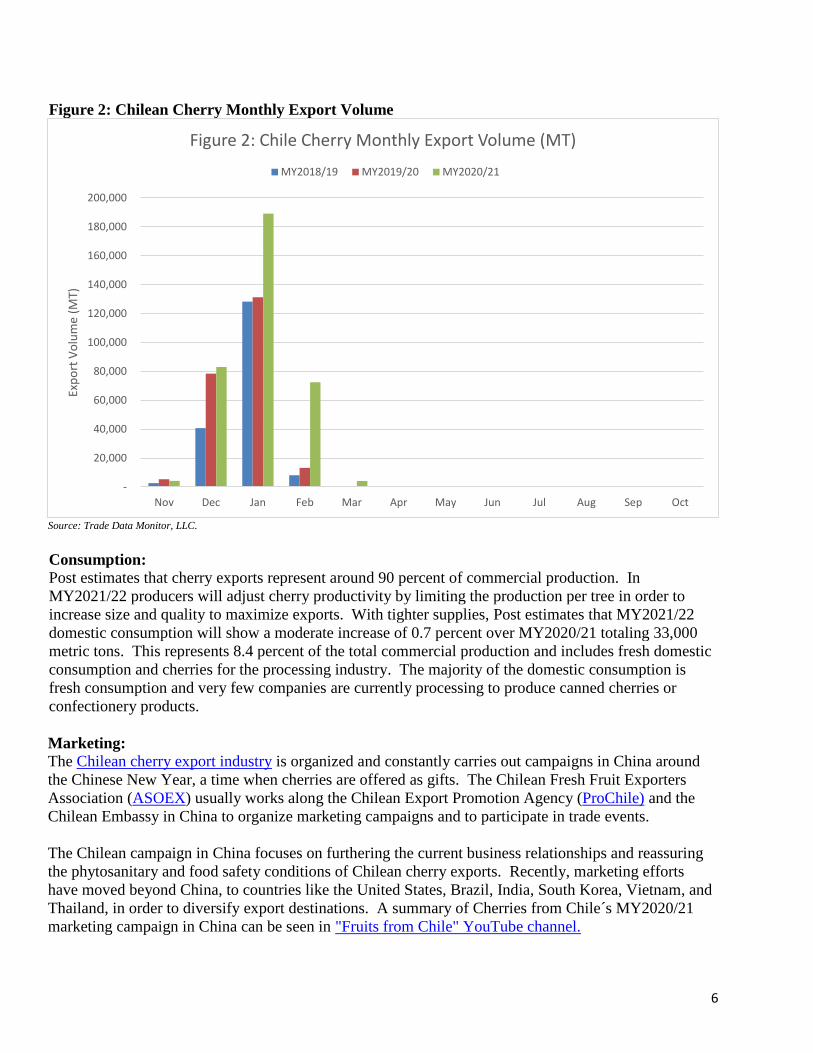
Figure 2: Chilean Cherry Monthly Export Volume
Source: Trade Data Monitor, LLC.
Consumption: Post estimates that cherry exports represent around 90 percent of commercial production. In
MY2021/22 producers will adjust cherry productivity by limiting the production per tree in order to
increase size and quality to maximize exports. With tighter supplies, Post estimates that MY2021/22
domestic consumption will show a moderate increase of 0.7 percent over MY2020/21 totaling 33,000
metric tons. This represents 8.4 percent of the total commercial production and includes fresh domestic
consumption and cherries for the processing industry. The majority of the domestic consumption is
fresh consumption and very few companies are currently processing to produce canned cherries or
confectionery products.
Marketing: The Chilean cherry export industry is organized and constantly carries out campaigns in China around
the Chinese New Year, a time when cherries are offered as gifts. The Chilean Fresh Fruit Exporters
Association (ASOEX) usually works along the Chilean Export Promotion Agency (ProChile) and the
Chilean Embassy in China to organize marketing campaigns and to participate in trade events.
The Chilean campaign in China focuses on furthering the current business relationships and reassuring
the phytosanitary and food safety conditions of Chilean cherry exports. Recently, marketing efforts
have moved beyond China, to countries like the United States, Brazil, India, South Korea, Vietnam, and
Thailand, in order to diversify export destinations. A summary of Cherries from Chile´s MY2020/21
marketing campaign in China can be seen in "Fruits from Chile" YouTube channel.
-
20,000
40,000
60,000
80,000
100,000
120,000
140,000
160,000
180,000
200,000
Nov Dec Jan Feb Mar Apr May Jun Jul Aug Sep Oct
Exp
ort
Vo
lum
e (M
T)
Figure 2: Chile Cherry Monthly Export Volume (MT)
MY2018/19 MY2019/20 MY2020/21
7
Policy:
In October 2020, Chile gained market access to export cherries to Vietnam. For Chilean cherry
exporters this is viewed as an opportunity to diversify export markets, especially considering the
increasing production trend of Chilean cherries.
The Chilean government along with the Chilean fruit production and export industry have worked to
improve protocols to reduce the risk of COVID-19 infection and to maintain regular operations in
orchards, packing plants and for logistics. The procedures include physical distancing, use of masks and
other protective equipment, measuring temperatures of workers, sanitation of facilities, among others.
More information about COVID -19 government protocols for agriculture can be found at Chilean
Ministry of Agriculture website.
Commodities:
Fresh Peaches and Nectarines
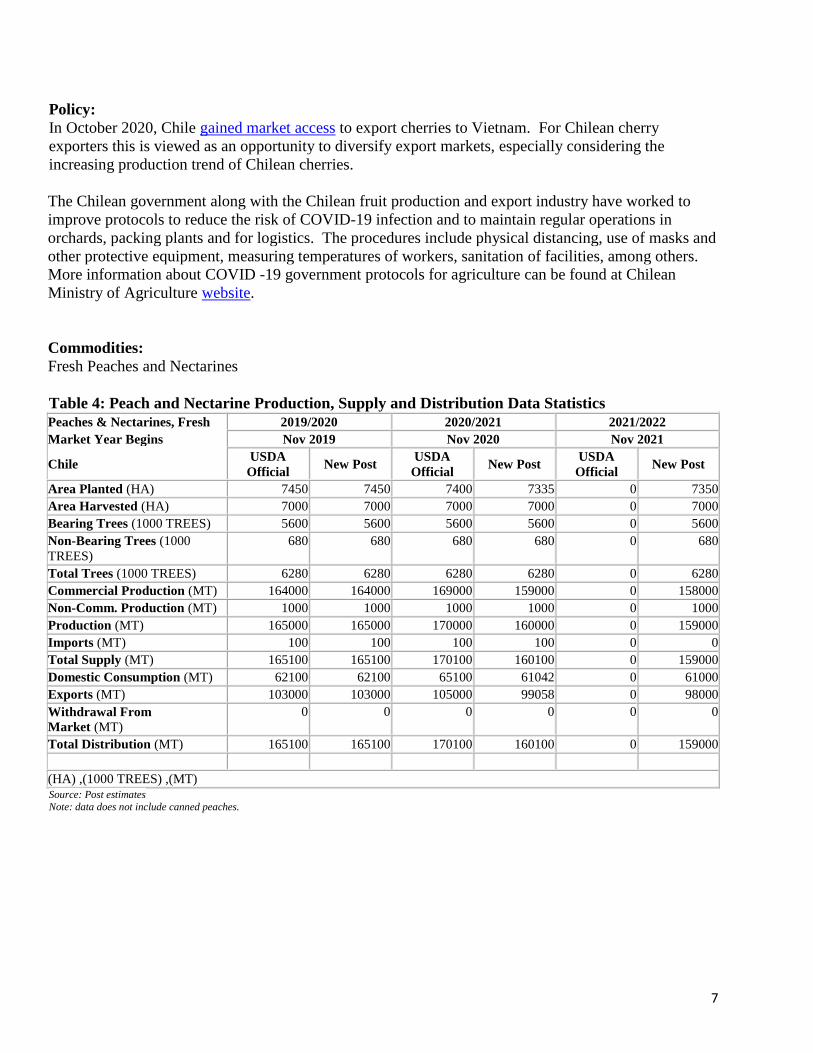
Table 4: Peach and Nectarine Production, Supply and Distribution Data Statistics
Peaches & Nectarines, Fresh 2019/2020 2020/2021 2021/2022
Market Year Begins Nov 2019 Nov 2020 Nov 2021
Chile USDA
Official New Post
USDA
Official New Post
USDA
Official New Post
Area Planted (HA) 7450 7450 7400 7335 0 7350
Area Harvested (HA) 7000 7000 7000 7000 0 7000
Bearing Trees (1000 TREES) 5600 5600 5600 5600 0 5600
Non-Bearing Trees (1000
TREES)
680 680 680 680 0 680
Total Trees (1000 TREES) 6280 6280 6280 6280 0 6280
Commercial Production (MT) 164000 164000 169000 159000 0 158000
Non-Comm. Production (MT) 1000 1000 1000 1000 0 1000
Production (MT) 165000 165000 170000 160000 0 159000
Imports (MT) 100 100 100 100 0 0
Total Supply (MT) 165100 165100 170100 160100 0 159000
Domestic Consumption (MT) 62100 62100 65100 61042 0 61000
Exports (MT) 103000 103000 105000 99058 0 98000
Withdrawal From
Market (MT)
0 0 0 0 0 0
Total Distribution (MT) 165100 165100 170100 160100 0 159000
(HA) ,(1000 TREES) ,(MT) Source: Post estimates Note: data does not include canned peaches.
8
Production: In MY2021/22, Post estimates fresh peach and nectarine production to total 158,000 MT, a 0.6 percent
decrease over MY2020/21 (See Table 4). Dropping productivity due to drought with a relatively steady
planted area for fresh peaches and nectarines explains the annual variation.
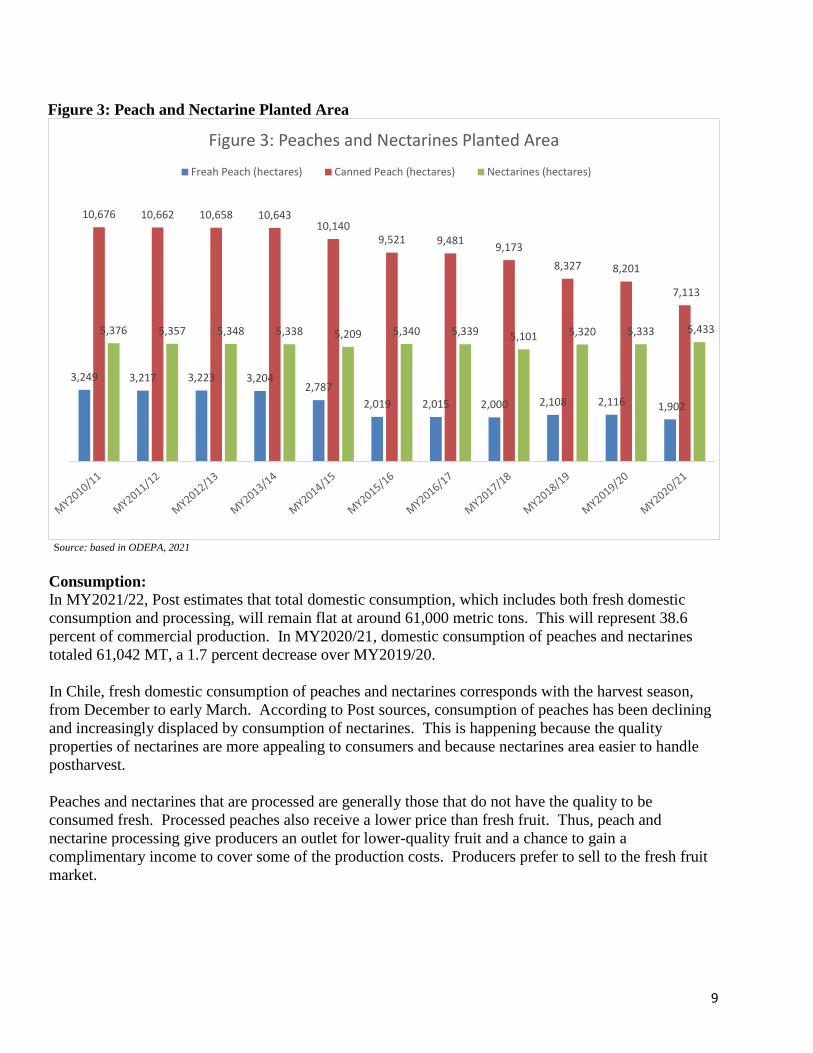
Fresh peach and nectarine planted area totaled 7,335 ha in MY2020/21. Fresh peach planted area is in a
declining trend, totaling 1,902 (ha) in MY2020/21 a 10.1 percent decrease over MY2019/20 (See Figure
3). The difficulties in commercializing peaches are pushing down production. Chilean fresh peaches
need to travel to distant markets, which have low margins and very high standards for quality and
condition of the fruit, making it a very challenging business. After long shipping times peaches often
present quality or condition problems upon arriving to commercial markets.
Planted area of peaches for canning totaled 7,113 ha in MY2020/21, a 13 percent decrease over
MY2019/20. These decreases are also because of commercial difficulties that the producers are
experiencing. (Note that canned peaches are not included in the PSD estimates of this report and are
included only for general information.)
In contrast, nectarine planted area totaled 5,433 ha in MY2020/21, a 1.9 percent increase over
MY2019/20. Nectarines are an interesting alternative to diversify stone fruit production for producers
that are seeking to reduce the risk of exporting to a single market. Nectarines are especially attractive in
those areas in the central part of the country that have the required climatic and soil conditions for
production. Nectarines are commercialized all over the world and new varieties are more resistant and
can arrive to distant markets in good conditions.
The increasing trend in the nectarine planted area will offset the decrease in fresh peach planted area.
As a result, Post expects planted area to remain relatively steady and reach 7,350 hectares in
MY2021/22.
9
Figure 3: Peach and Nectarine Planted Area
Source: based in ODEPA, 2021
Consumption: In MY2021/22, Post estimates that total domestic consumption, which includes both fresh domestic
consumption and processing, will remain flat at around 61,000 metric tons. This will represent 38.6
percent of commercial production. In MY2020/21, domestic consumption of peaches and nectarines
totaled 61,042 MT, a 1.7 percent decrease over MY2019/20.
In Chile, fresh domestic consumption of peaches and nectarines corresponds with the harvest season,
from December to early March. According to Post sources, consumption of peaches has been declining
and increasingly displaced by consumption of nectarines. This is happening because the quality
properties of nectarines are more appealing to consumers and because nectarines area easier to handle
postharvest.
Peaches and nectarines that are processed are generally those that do not have the quality to be
consumed fresh. Processed peaches also receive a lower price than fresh fruit. Thus, peach and
nectarine processing give producers an outlet for lower-quality fruit and a chance to gain a
complimentary income to cover some of the production costs. Producers prefer to sell to the fresh fruit
market.
3,249 3,217 3,223 3,2042,787
2,019 2,015 2,000 2,108 2,116 1,902
10,676 10,662 10,658 10,64310,140
9,521 9,4819,173
8,327 8,201
7,113
5,376 5,357 5,348 5,338 5,209 5,340 5,339 5,101 5,320 5,333 5,433
Figure 3: Peaches and Nectarines Planted Area
Freah Peach (hectares) Canned Peach (hectares) Nectarines (hectares)

10
Trade:
For MY2021/22, Post projects exports to decline by one percent totaling 98,000 MT based on the lower
production volume (See Table 4). In MY2020/21 Chilean exports of peaches and nectarines decreased
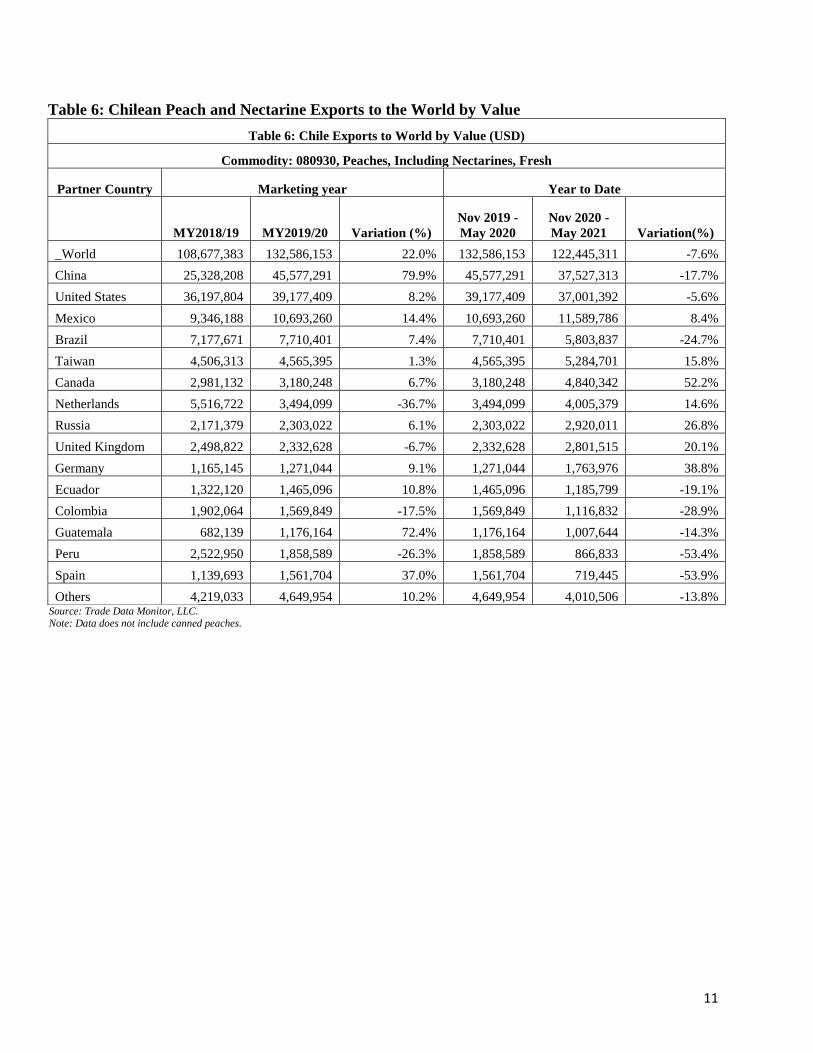
by three percent totaling 99,058 MT (See Table 5) and $122.5 million (See Table 6).
The United States was the top market for Chilean peach and nectarine exports in MY2020/21. Exports
to the U.S. totaled 33,085 MT, which represents an 8.3 increase over MY2020/21. China is the second
most important market for Chilean peaches and nectarines. Chile only exports nectarines to China. In
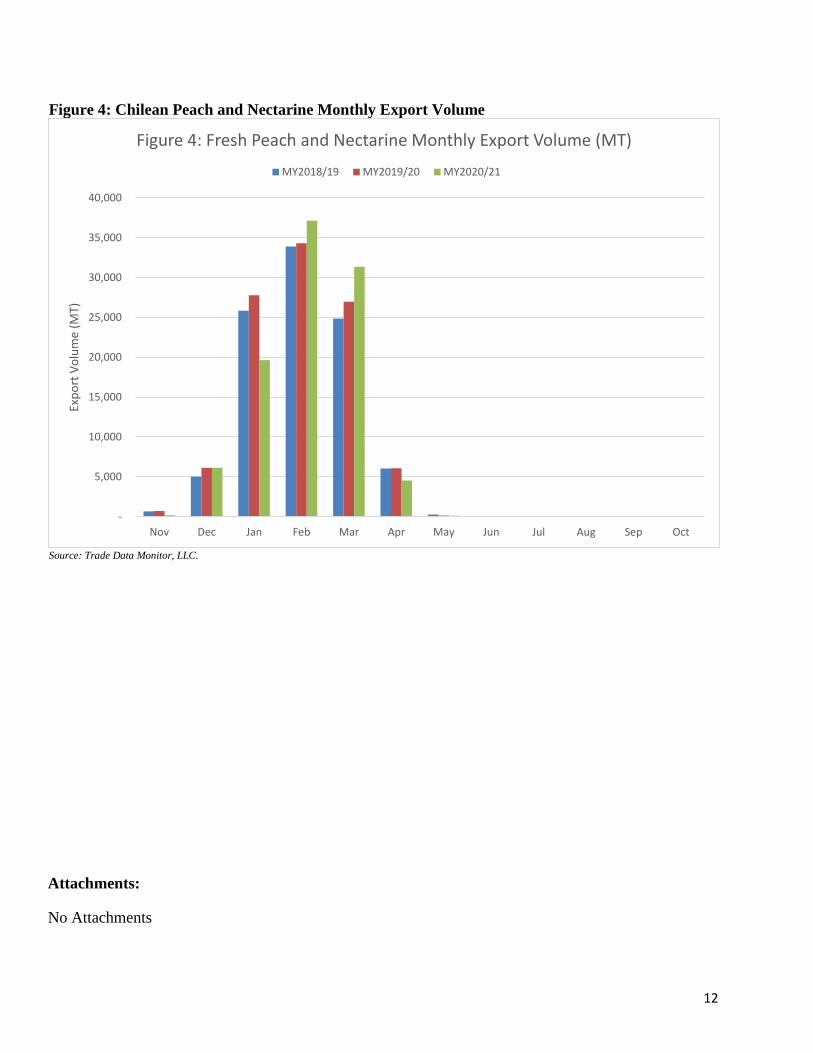
MY2020/21, exports to China totaled 26,231 MT, a 13.3 percent decline over MY2019/20. The
decrease in exports to China is attributed to delays in Chinese ports in late-January and February, which
are the peak export months for Chilean peaches and nectarines (see Figure 4). During last season’s port
delays, exporters were forced to reallocate nectarine exports in other markets such the United States,
Europe, or Mexico.
Table 5: Chilean Peach and Nectarine Exports to the World by Volume
Table 5: Chile Exports to the World by Volume (MT)
Commodity: 080930, Peaches, Including Nectarines, Fresh
Partner Country Marketing year Year to Date
MY2018/19 MY2019/20 Variation (%)
Nov 2019 -
May 2020
Nov 2020 -
May 2021 Variation(%)
World 96,568 102,097 5.7% 102,097 99,058 -3.0%
United States 34,847 30,541 -12.4% 30,541 33,085 8.3%
China 20,005 30,266 51.3% 30,266 26,231 -13.3%
Mexico 7,108 7,569 6.5% 7,569 8,308 9.8%
Brazil 6,436 6,705 4.2% 6,705 5,203 -22.4%
Netherlands 6,658 4,302 -35.4% 4,302 4,730 9.9%
Taiwan 2,961 3,292 11.2% 3,292 4,080 23.9%
Canada 2,481 2,692 8.5% 2,692 3,262 21.2%
United Kingdom 3,307 3,095 -6.4% 3,095 3,172 2.5%
Russia 1,628 1,799 10.5% 1,799 2,294 27.5%
Germany 1,077 1,323 22.8% 1,323 1,845 39.5%
Ecuador 1,095 1,189 8.6% 1,189 968 -18.6%
Peru 2,999 2,265 -24.5% 2,265 913 -59.7%
Colombia 1,358 1,152 -15.2% 1,152 849 -26.3%
Guatemala 479 743 55.1% 743 607 -18.3%
Spain 880 1,600 81.8% 1,600 552 -65.5%
Others 3,249 3,564 9.7% 3,564 2,959 -17.0% Source: Trade Data Monitor, LLC. Note: Data does not include canned peaches
11
Table 6: Chilean Peach and Nectarine Exports to the World by Value
Table 6: Chile Exports to World by Value (USD)
Commodity: 080930, Peaches, Including Nectarines, Fresh
Partner Country Marketing year Year to Date
MY2018/19 MY2019/20 Variation (%)
Nov 2019 -
May 2020
Nov 2020 -
May 2021 Variation(%)
_World 108,677,383 132,586,153 22.0% 132,586,153 122,445,311 -7.6%
China 25,328,208 45,577,291 79.9% 45,577,291 37,527,313 -17.7%
United States 36,197,804 39,177,409 8.2% 39,177,409 37,001,392 -5.6%
Mexico 9,346,188 10,693,260 14.4% 10,693,260 11,589,786 8.4%
Brazil 7,177,671 7,710,401 7.4% 7,710,401 5,803,837 -24.7%
Taiwan 4,506,313 4,565,395 1.3% 4,565,395 5,284,701 15.8%
Canada 2,981,132 3,180,248 6.7% 3,180,248 4,840,342 52.2%
Netherlands 5,516,722 3,494,099 -36.7% 3,494,099 4,005,379 14.6%
Russia 2,171,379 2,303,022 6.1% 2,303,022 2,920,011 26.8%
United Kingdom 2,498,822 2,332,628 -6.7% 2,332,628 2,801,515 20.1%
Germany 1,165,145 1,271,044 9.1% 1,271,044 1,763,976 38.8%
Ecuador 1,322,120 1,465,096 10.8% 1,465,096 1,185,799 -19.1%
Colombia 1,902,064 1,569,849 -17.5% 1,569,849 1,116,832 -28.9%
Guatemala 682,139 1,176,164 72.4% 1,176,164 1,007,644 -14.3%
Peru 2,522,950 1,858,589 -26.3% 1,858,589 866,833 -53.4%
Spain 1,139,693 1,561,704 37.0% 1,561,704 719,445 -53.9%
Others 4,219,033 4,649,954 10.2% 4,649,954 4,010,506 -13.8% Source: Trade Data Monitor, LLC. Note: Data does not include canned peaches.
12
Figure 4: Chilean Peach and Nectarine Monthly Export Volume
Source: Trade Data Monitor, LLC.
Attachments:
No Attachments
-
5,000
10,000
15,000
20,000
25,000
30,000
35,000
40,000
Nov Dec Jan Feb Mar Apr May Jun Jul Aug Sep Oct
Exp
ort
Vo
lum
e (M
T)
Figure 4: Fresh Peach and Nectarine Monthly Export Volume (MT)
MY2018/19 MY2019/20 MY2020/21