report for the year ended 30 june 2019 for personal use ... · report for the year ended 30 june...
TRANSCRIPT

Appendix 4E (ASX Listing Rules 4.3A)Report for the year ended 30 June 2019Reporting period is the year ended 30 June 2019 with the previous corresponding period the year ended 30 June 2018.
Results for announcement to the market
30 June2019
$’000
30 June2018
$’000
Increase /(Decrease)
$’000
% change
Revenue from continuing operations 659,999 619,271 40,728 6.6%Net profit for the period 33,029 33,309 (280) (0.8%)Underlying results from continuing operations 28,565 28,052 513 1.8%
Net tangible asset backing per ordinary security (cents) 48.4 43.2 5.2 12.04%
DividendsOn 22 August 2019 the Company declared a fully franked final dividend of 5.9 cents per share with respect to the year ending 30 June 2019.
Record date for determining entitlements to the dividend 5:00 pm (WST) 9 September 2019
Date the final dividend is payable 3 October 2019
The Company paid an interim dividend during the year of 4.7 cents per share:
Record date Payment date Type Cents per share
Total amount ($’000)
Franked amount per security
5 March 2019 28 March 2019 Interim 4.7 $10,096 100%
Previous Corresponding Dividends
The following dividends were paid:
Record date Payment date Type Cents per share
Total amount ($’000)
Franked amount per security
6 March 2018 29 March 2018 Interim 4.7 $10,096 100%6 March 2018 29 March 2018 Special 12.0 $25,778 100%
3 September 2018 27 September 2018 Final 5.7 $12,244 100%For
per
sona
l use
onl
y

Financial resultsFor the year ended 30 June 2019 the Group recorded net profit after tax of $33,029k, 0.8% below FY18 ($33,309k). Underlying results from continuing operations after excluding changes in value of future trailing commissions was up 1.8% to $28,565k (30 June 2018: $28,052k). The change in trailing commissions net receivable for 30 June 2019 includes the growth of the loan book as well as longer loan lives as a result of tightening credit conditions. Revenue from continuing operations was up 6.6% to $659,999k (30 June 2018: $619,271k) driven by growth in AFG Securities and longer loan lives.
Non – IFRS financial informationThe carrying value of our residential, commercial and AFGHL white label trail books are influenced amongst other things by the runoff and discount rates that are applied to these valuations. Excluding the non-cash entries to recognise the net present value of the future trailing commission receivable and payable, the underlying profit after tax is $28,565k (30 June 2018: $28,052k). The assessment of the trail loan book requires the use of assumptions which are determined by management, using a variety of inputs including external actuarial analysis of historical information, by reference to market observable inputs.
The following table reconciles the underlying earnings to the reported profit after tax for the period in accordance with Australian Accounting Standards:
30 June 2019 30 June 2018
In thousands of AUD Operating income
Profit after tax
Operating income
Profit after tax
Underlying results from continuing operations 548,235 28,565 533,053 28,052Change in the carrying value of trailing commissions receivable and payable
94,604 4,464 70,343 5,257
Total result from continuing operations 642,839 33,029 603,396 33,309
Other disclosure requirementsAdditional ASX Appendix 4E (Listing Rule 4.3A) disclosures can be found in the 2019 Annual Report. This document should be read in conjunction with the 2019 Annual Report and any public announcements made in the period by the Company in accordance with the continuous disclosure requirements of the Corporations Act 2001 and ASX Listing Rules.
This preliminary financial report under ASX Listing Rule 4.3A covers Australian Finance Group Limited and its controlled entities and is based on the consolidated financial statements and financial report which have been audited by Deloitte Touche Tohmatsu.
Cross reference Index for other disclosures included in the 2019 Annual Report PageReview of operations 14
Consolidated Statement of Financial Position 36
Consolidated Statement of Profit or Loss and Other Comprehensive Income 37
Consolidated Statement of Changes in Equity 38
Consolidated Statement of Cash Flows 39
Notes to the Financial Statements 40
Independent Auditors’ Report 91
For
per
sona
l use
onl
y

2019ANNUAL REPORT
For
per
sona
l use
onl
y

2019 ANNUAL REPORT2
11. Directors’ Report
35. Auditor’s Independence Declaration
36. Consolidated Statement of Financial Position
37. Consolidated Statement of Profit or Loss and Other Comprehensive Income
38. Statement of Changes in Equity
39. Statement of Cash Flows
40. Notes to the Financial Statements
90. Directors’ Declaration
91. Independent Audit Report
96. Shareholder Information
99. Corporate Directory
Contents
For
per
sona
l use
onl
y

2019 ANNUAL REPORT 3
For
per
sona
l use
onl
y
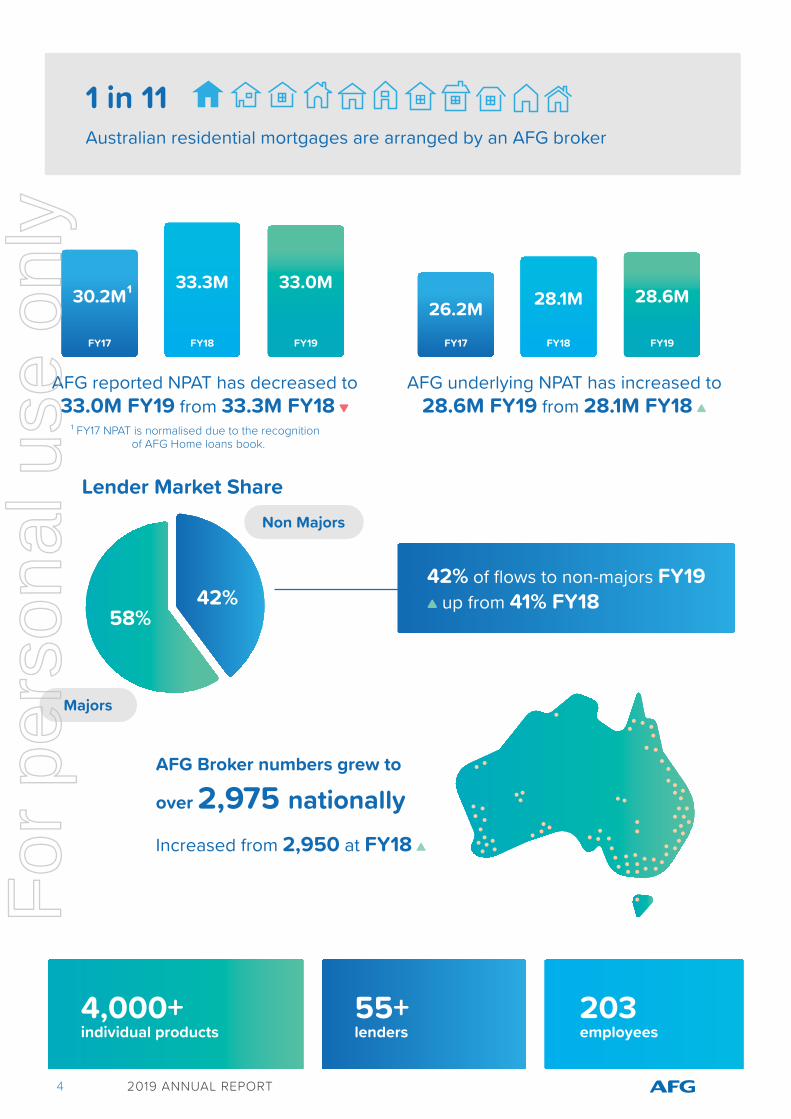
AFG reported return on equity remains at 33%
FY17¹
FY18
FY19
31%
510M 1.37B
2.06B1.06B
33%
33%
AFG reported NPAT has decreased to 33.0M FY19 from 33.3M FY18 ▼
FY17
30.2M¹26.2M 28.1M 28.6M
33.3M 33.0M
FY18 FY19
AFG underlying NPAT has increased to 28.6M FY19 from 28.1M FY18 ▲
FY17 FY18 FY19
AFGS Settlements has increased to 1.06B FY19 from 510M FY18 ▲
AFGS Loan Book has increased to 2.06B FY19 from 1.37B FY18 ▲
58%
59%
42%
Non Majors
Lender Market Share
Majors
42% of flows to non-majors FY19▲ up from 41% FY18
FY19 Residential Settlements of
$31.3B
FY19 Commercial Settlements of
$2.33B
Trail book now up
6.9% to $155.45B ▲
Asset Finance up 3%
to $553M ▲
59% of Australian mortgages are written through a broker2
Up to
10,000customers per month
AFG Broker numbers grew to
over 2,975 nationallyIncreased from 2,950 at FY18 ▲
4,000+individual products
203employees
55+lenders
1 in 11Australian residential mortgages are arranged by an AFG broker
Dividends (cents per share)
Interim Final
FY17 FY18 FY19
4.2 4.7 4.7
5.55.7
5.9
FY18
FY19
FY18
FY19
¹ FY17 NPAT is normalised due to the recognition of AFG Home loans book.
¹ FY17 NPAT is normalised due to the recognition of AFG Home Loans book.
² Mortgage and Finance Association of Australia (MFAA)
2019 ANNUAL REPORT4
For
per
sona
l use
onl
y

AFG reported return on equity remains at 33%
FY17¹
FY18
FY19
31%
510M 1.37B
2.06B1.06B
33%
33%
AFG reported NPAT has decreased to 33.0M FY19 from 33.3M FY18 ▼
FY17
30.2M¹26.2M 28.1M 28.6M
33.3M 33.0M
FY18 FY19
AFG underlying NPAT has increased to 28.6M FY19 from 28.1M FY18 ▲
FY17 FY18 FY19
AFGS Settlements has increased to 1.06B FY19 from 510M FY18 ▲
AFGS Loan Book has increased to 2.06B FY19 from 1.37B FY18 ▲
58%
59%
42%
Non Majors
Lender Market Share
Majors
42% of flows to non-majors FY19▲ up from 41% FY18
FY19 Residential Settlements of
$31.3B
FY19 Commercial Settlements of
$2.33B
Trail book now up
6.9% to $155.45B ▲
Asset Finance up 3%
to $553M ▲
59% of Australian mortgages are written through a broker2
Up to
10,000customers per month
AFG Broker numbers grew to
over 2,975 nationallyIncreased from 2,950 at FY18 ▲
4,000+individual products
203employees
55+lenders
1 in 11Australian residential mortgages are arranged by an AFG broker
Dividends (cents per share)
Interim Final
FY17 FY18 FY19
4.2 4.7 4.7
5.55.7
5.9
FY18
FY19
FY18
FY19
¹ FY17 NPAT is normalised due to the recognition of AFG Home loans book.
¹ FY17 NPAT is normalised due to the recognition of AFG Home Loans book.
² Mortgage and Finance Association of Australia (MFAA)
2019 ANNUAL REPORT 5
For
per
sona
l use
onl
y

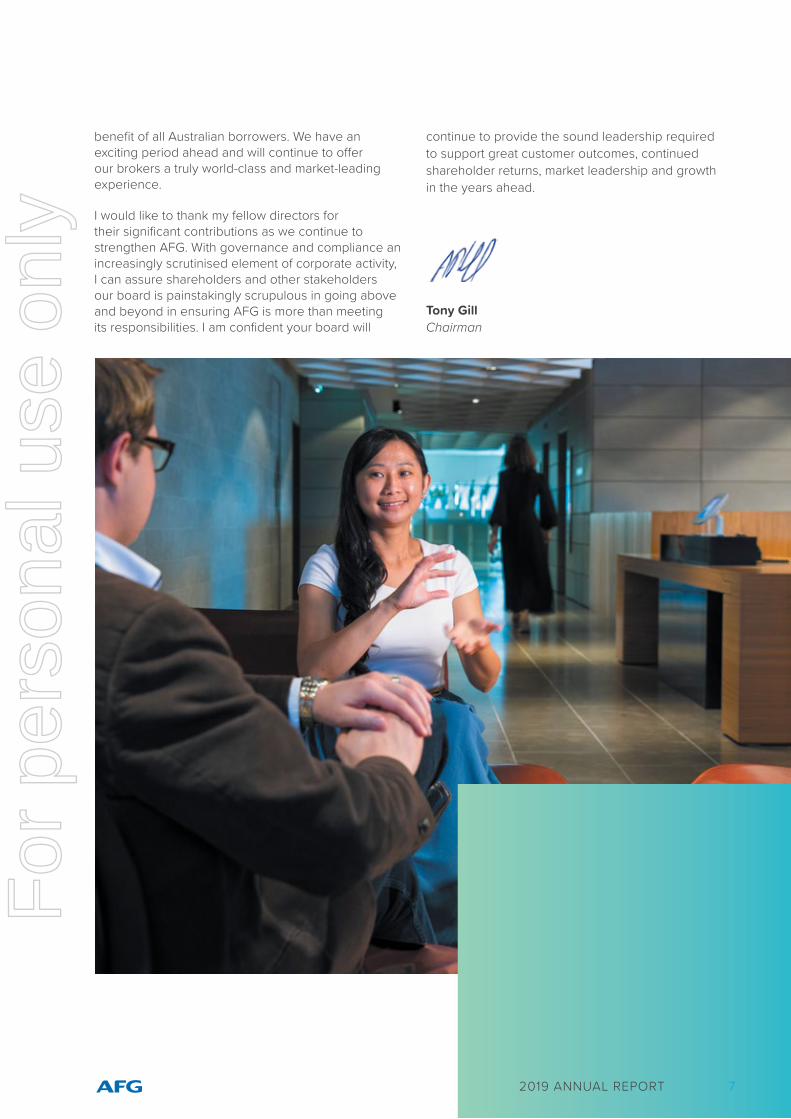
Chairman’s MessageIn presenting our results for the 2019 financial year I am pleased to report the company has emerged from a difficult year as a stronger and more sustainable business that continues to generate solid returns to shareholders, and positive outcomes for Australian borrowers.
While there is no doubt the past year was a challenging period for both AFG and the entire financial services sector, the volatile lending landscape has in fact reinforced the company’s value proposition, created growth opportunities and ensured mortgage brokers remain the dominant channel for home loans in Australia, rising to nearly 60% of all mortgages written by the close of the financial year.
Despite significant pressures on the wider financial services industry AFG has remained focused, delivering a strong financial performance and profit result as our diversification strategy gains momentum. We finished the financial year in great shape and remain optimistic about the future of our industry.
Healthy growth in our diversified earning streams including AFG Securities, AFG Home Loans, AFG Business and our strategic investment in Thinktank generated significant contributions, complementing the core residential and commercial aggregation businesses.
AFG’s strong cash flows and balance sheet provides a financial bedrock for the future of the business, that provides management with the flexibility to pursue opportunities.
AFG’s proposed merger with mortgage aggregator Connective, announced in August 2019 after the close of the financial year, demonstrates the Board’s ambitions in growing our business. The prospect of complementing our existing business with the cultural fit and shared customer-focused philosophy of Connective represents a compelling opportunity for AFG shareholders.
The transaction remains subject to a number of conditions, including legal, regulatory and shareholder approvals, but on completion the group would represent a significant mortgage distribution network, with more than 6,575 brokers and residential settlements of $70 billion a year. The merged business will continue to drive competition and choice in Australia’s $1.8 trillion home loan market.
We anticipate the transaction will complete in the second half of the 2020 financial year and remain committed to keeping shareholders updated as the transaction progresses.
The AFG Board is committed to positive customer outcomes as the best approach to enhancing long term shareholders returns, per share fully franked. Total dividends for FY19 were a healthy 10.6 cents per share, representing a dividend yield of 6.8 per cent (based on share price at 30 June 2019).
AFG is gaining increasing recognition from investors about the benefits of its sector-leading capabilities. As both a mortgage originator and distributor, AFG has a deep insight into mortgage behaviours and trends. This expertise helps frame our credit policies and lending practices, underpinning our diversified earnings business model.
In any discussion of financial year 2019, the Banking Royal Commission looms large. The sector has been the subject of intense scrutiny from Government, regulators, the media, and the community generally, but as we look ahead the company is well positioned, having experienced the scrutiny and proved its resilience.
AFG is rightly acknowledged as an industry leader and is respected in Canberra. Our industry has now been handed an opportunity to continue to influence future policy direction and we will continue to step up our industry and regulatory engagement to ensure our message is heard for the benefit of borrowers and brokers.
Finally, I offer my gratitude to the entire AFG team and every one of our brokers who have displayed immense dedication and commitment in delivering for customers, shareholders and employees over the past 12 months. Our financial results and the underlying strength of the business reflect their hard work and expertise.
We will continue to ensure AFG remains the partner of choice for lenders and broking groups for the
Tony GillChairman
2019 ANNUAL REPORT6
For
per
sona
l use
onl
y
benefit of all Australian borrowers. We have an exciting period ahead and will continue to offer our brokers a truly world-class and market-leading experience.
I would like to thank my fellow directors for their significant contributions as we continue to strengthen AFG. With governance and compliance an increasingly scrutinised element of corporate activity, I can assure shareholders and other stakeholders our board is painstakingly scrupulous in going above and beyond in ensuring AFG is more than meeting its responsibilities. I am confident your board will
continue to provide the sound leadership required to support great customer outcomes, continued shareholder returns, market leadership and growth in the years ahead.
Tony GillChairman
2019 ANNUAL REPORT 7
For
per
sona
l use
onl
y

Chief Executive Officer’s MessageIt is my pleasure to report the delivery of a strong financial result for the past year. Despite a backdrop of regulatory uncertainty and ongoing regulator intervention into the mortgage market AFG has demonstrated real resilience and cemented our track record of delivering sustainable quality earnings.
Actions we have been undertaking since 2016 to strengthen our business and diversify our earnings streams have AFG well positioned to meet the challenges facing the sector and capitalise on any emerging opportunities.
Despite a credit downturn, slowing property market and regulatory uncertainty taking place under the shadow of the Banking Royal Commission, AFG reported an annual underlying profit of $28.56 million up 1.8 per cent for the 12 months to 30 June 2019.
The 2019 financial year, which marks my third year as CEO, represents a defining moment in the development of AFG.
For the first time, more than half of AFG’s gross margin was generated from outside our mortgage broking aggregation business. A weaker domestic credit market did not stop our diversified earnings streams continuing to record solid growth over the past year.
Our core residential business continues to perform well despite enduring a tumultuous past 12 months. The tough lending environment contributed to residential settlements being down 11.5 per cent compared to last year. Our AFG Home Loans business also felt the impact, settlements were $3.15 billion, down 2.2 per cent. AFG Home Loans now services more than 23,000 retail customers.
The broker channel entrenched the importance of the role it plays in delivering competition to Australia’s home loan market. The flow of business to non-major lenders increased to a record 42 per cent during the year, as AFG’s national distribution network of almost 3000 active brokers extended its reach across the nation through growth in regional areas.
AFG’s combined residential and commercial trail book was $155.45 billion, up 6.9 per cent.
Our strategic foray into the small to medium enterprise market - through both the AFG Business
platform and our investment in Thinktank - is gaining momentum.
Thinktank has affirmed its status as a competitive non-major commercial property lender, building its reputation in the sub-$3 million market. It now boasts a loan book of $1.09 billion.
Through Thinktank, we are delivering competition to an SME marketplace that has demonstrated its appetite for greater choice and lending flexibility. With Thinktank’s lending expertise combined with our distribution network and securitisation capability, we are already generating healthy returns. Our 30.4 per cent (fully diluted) investment in Thinktank contributed $1.5 million towards net profit before tax in FY19.
After a soft launch into the market in FY18, settlements on the AFG Business platform recorded growth in its first full year of operation, driven by product improvements and a prudent approach to our expanding product range. We recorded settlements of $129.7 million, up 30.9 per cent on the previous six months. Our loan book, originated in full by brokers and underpinned by our market knowledge, expertise and relationships remains an outstanding performer.
The AFG Business platform allows brokers to lodge applications in a common format across all lenders, backed up by a simple accreditation process and embedded training and sales tools. Commercial mortgages remain the staple offering, with 22 lenders now on the platform.
It was particularly pleasing to see the excellent growth in our own Residential Mortgage-Backed Securities (RMBS) program which passed the $2 billion under management milestone on the back of growth of 50 per cent over the previous year.
During the year we successfully priced our $500 million AFG 2019-1 Trust RMBS issue. After receiving strong oversubscription, the deal was upsized from $350 million. It was our largest RMBS transaction since the initial 2013 deal, and the first time the deal
David BaileyCEO
2019 ANNUAL REPORT8
For
per
sona
l use
onl
y

has been upsized, and received increased investor participation.
Both domestic and international institutional investors increasingly recognising that AFG’s value proposition as an issuer in the Australian RMBS market is unique.
We are very confident growth from both AFG Securities and AFG Commercial will provide additional contributions to earnings over the coming 12 months. Reflecting the increasing importance of AFG Securities as an earnings contributor, we have established a new role on the executive team to lead the business.
A prime indicator of how we have built a stronger company in the past 12 months is our Return on Equity, which is one of the financial highlights from the past year. Our ROE was 33 per cent in FY19 in line with prior year.
Despite our strong underlying business, we are all continuing to work hard to implement fundamental changes, making the necessary investments to improve AFG for the inevitable challenges facing the sector as we strive to deliver on our commitment to shareholders, customers, brokers, partners and employees.
While we have made great progress in recent years, much work remains as we position ourselves to enhance our value proposition, optimise our operations and build our market share. It is the responsibility of management to ensure AFG is resilient, efficient and positioned for the future.
With these goals in mind, we will continue to explore ways to improve customer experiences and improve
the day-to-day efficiency of our brokers. Over the next two years we have earmarked further investment in our technology platform as we believe innovative technology remains a critical area of focus as we transform the way AFG and our brokers work.
It promises to be an exciting period ahead and represents a real step-change in the way AFG and our brokers do business. There is one goal in mind, the improved outcomes for customers.
I described FY19 as a defining year for AFG, which is to take nothing away from the next 12 months. In FY20, we will be working hard to finalise the merger with Connective Group announced in August 2019. Whilst we remain confident about the value AFG stands to generate from our existing ongoing growth plans, we felt successfully participating in the sale process undertaken by Connective absolutely aligned to our strategy.
The proposed transaction offers exposure to an alternative mortgage broker aggregation model with strong ongoing brand recognition whilst also providing access to a broader distribution channel. On a pro forma basis, the combined business would have FY19 reported NPAT of $44 million.
Under the plan, Connective brokers will have access to AFG’s securitisation program and the opportunity to grow scale in both asset finance and commercial lending through the combined network.
Expanded distribution channels and broader diversification of products provide greater choice for both brokers and consumers.
2019 ANNUAL REPORT 9
For
per
sona
l use
onl
y

Importantly, the businesses are highly complementary and up to $4 million in run-rate cost synergies are expected to be realised over a four-year period post completion. It’s an undeniable opportunity for AFG shareholders to benefit from the diversification and flexibility of the merged group.
We will keep shareholders informed as we work through the transaction with Connective and progress the approval processes.
In his message, our Chairman has referenced the Banking Royal Commission and its significant impact on AFG, the mortgage broking sector and Australia’s finance industry more generally but it is important for me to touch on management’s approach to the issue. AFG staff and our brokers played a vital role in our proactive engagement strategy to explain how a customer-first mantra dominates our sector.
Coming out of the federal election, there is less ambiguity and we will be using the three-year review process overseen by ASIC and the Council of Financial Regulators to educate Australians about the role we, and our brokers, play in the home loan market and how effective we are in adding to competition, choice and lower borrowing costs.
With this process in mind, we have reshaped our executive team in preparation for the heightened
industry and regulatory engagement required in today’s post-Royal Commission environment.
Looking ahead, AFG’s customer-first approach and agile operating model presents enormous opportunities for our business and we enter financial year 2020 confident of another successful year. Our business is primed for ongoing strong cash flow generation, leaving AFG set up for sustained growth.
I would like to thank our brokers across Australia that form the backbone of our national distribution network and acknowledge the commitment and energy of all AFG employees for their contributions in FY19.
We have built up an engaged team with a strong culture that prioritises the customer and our long-term strategy. We are well positioned to deliver in the coming year.
David BaileyCEO
2019 ANNUAL REPORT10
For
per
sona
l use
onl
y

2019 ANNUAL REPORT 11
Directors’ Report
Directors’ ReportThe Directors present their report together with the financial report on the consolidated entity consisting of Australian Finance Group Limited (‘the Company’ or ‘AFG’), and its controlled entities (‘the Group’), for the financial year ended 30 June 2019 and the auditor’s report thereon.
DirectorsThe Directors and Company Secretary of the Company at any time during or since the end of the financial year are:
Anthony (Tony) Gill (Non-Executive Chairman)
Mr Gill has been the Chairman of the Board since 2008. Mr Gill has extensive experience across Australia’s finance industry, mostly with Macquarie Bank. Mr Gill is a Director of First Mortgage Services and First American Title Insurance. He sits on the Board of the Butterfly Foundation for Eating Disorders, the Pinchgut Opera and is also a member of ASIC’s External Advisory Panel. Mr Gill is a former member of the Board of Genworth Mortgage Insurance Limited (GMA.AX). Mr Gill holds a Bachelor of Commerce and is a Chartered Accountant (retired).
Brett McKeon (Executive Director) Resigned 1 July 2019 (Non-Executive Director) Appointed 1 July 2019
Mr McKeon is a founding Director of AFG and the Group’s former Managing Director. Mr McKeon has worked for over 30 years in the finance industry and has considerable management, capital raising, public company and sales experience and is an experienced Director in both the public and private arenas. Mr McKeon was awarded The Ernst & Young Entrepreneur of the Year for WA in 2006. In 2016 Mr McKeon was appointed to the newly reconstituted Financial Sector Advisory Council, a non-statutory body that provided advice to the federal government on policies that will maintain an efficient, competitive and dynamic financial sector. Mr McKeon drives AFG’s advocacy activity through the company’s guiding principles of fairness, shared prosperity and the provision of choice for Australian consumers.
Malcolm Watkins (Executive Director)
Founding Director Mr Watkins plays a key role in the strategic direction of AFG. Across the past 25 years Mr Watkins has driven the company’s tactical development of market-leading IT and Marketing divisions, which have long set the company apart from competitors. Mr Watkins is now stewarding the expansion of the AFG Business portfolio and will oversee the extraction of value from AFG’s recent acquisition of a 30% stake in leading commercial property lender, Thinktank, through a seat on the lender’s board. Mr Watkins is tasked with ensuring the opportunity to blend Thinktank’s commercial property lending expertise with AFG’s broad distribution and securitisation capabilities will deliver strategic value to both businesses. Mr Watkins is a former member of the Board of the Mortgage and Finance Association of Australia (MFAA).
Kevin Matthews (Non-Executive Director)
Mr Matthews is a founding Director of the Group. He previously held a role as an Executive Director and was responsible for negotiating and managing key relationships with banks and lending institutions, including product development and the Commercial line of business. Mr Matthews ceased to be an Executive Director and became a Non-Executive Director on 1 May 2015. Mr Matthews has worked in the finance industry for more than 40 years and has been a licensed finance broker for more than 30 years. He is a former Director of the Mortgage and Finance Association of Australia (MFAA) and served on the MFAA’s National Brokers Committee for 12 years. Mr Matthews is also a Senior Fellow of the Financial Services Institute of Australasia (FINSIA) and a life member of the MFAA.
For
per
sona
l use
onl
y
Directors’ Report (Continued)
2019 ANNUAL REPORT12
Craig Carter (Independent Non-Executive Director)
Mr Carter joined the AFG Board in early 2015, and is the Chair of the Audit Committee, a member of the Risk and Compliance Committee, and a member of the Remuneration and Nomination Committee. Following a career spanning 35 years in stockbroking and investment banking, specialising in Corporate Advice and Equity Capital Markets, Mr Carter now actively manages his own family business interests across a portfolio of equities, agriculture and property. He is also Vice President of the Fremantle Football Club. Mr Carter was a Member of the Australian Stock Exchange and is a Fellow of the Financial Services Institute. Mr Carter is a well-known commercial professional with unique experience in equities, capital markets and corporate transactions. This experience provides a platform for robust perspectives and a long reputation of integrity and good governance.
Melanie Kiely (Independent Non-Executive Director)
Ms Kiely is an experienced Executive and Company Director with over 25 years of experience in health care, financial services and consulting in Australia, Europe and South Africa. Ms Kiely is also currently a Director of the Black Dog Institute and CEO of Good Samaritan Industries. Prior to this, she has held senior roles with Silver Chain, HBF Health Fund, nib health funds, MBF and was an Associate Partner at global consulting firm Accenture. She has also held a number of Board positions in the financial services and health sectors. Ms Kiely has an Honours Degree in Business Science from the University of Cape Town and is a Graduate of the Australian Institute of Company Directors. Ms Kiely joined the AFG Board as a Non-Executive Director in March 2016 and is Chair of the Remuneration and Nomination Committee, a member of the Audit Committee and a member of the Risk and Compliance Committee.
Jane Muirsmith (Independent Non-Executive Director)
Ms Muirsmith is an accomplished digital and marketing strategist, having held several executive positions in Sydney, Melbourne, Singapore and New York. Jane is Managing Director of Lenox Hill, a digital strategy and advisory firm and is a Non-Executive Director of Cedar Woods Properties Ltd, HealthDirect Australia and the Telethon Kids Institute. She is a Graduate of the Australian
Institute of Company Directors and a Fellow of Chartered Accountants Australia and New Zealand, where she is Chair of the WA Business Advisory Committee. Ms Muirsmith is also a member of the Ambassadorial Council UWA Business School. Ms Muirsmith was appointed to the AFG Board in March 2016 and is Chair of the Risk and Compliance Committee, a member of the Audit Committee and a member of the Remuneration and Nomination Committee.
The above-named Directors held office during the whole of the financial year and since the end of the financial year except where noted otherwise.
Company SecretaryLisa Bevan (Company Secretary)
Ms Bevan joined AFG in 1998 and was appointed to the position of Company Secretary in 2001. Ms Bevan is a Chartered Accountant, holds a Bachelor of Commerce degree and has a Diploma of Corporate Governance from the Governance Institute of Australia. Ms Bevan is responsible for managing AFG’s secretariat and governance programs. Ms Bevan also oversees the legal and human resources functions.
Interests in the shares and rights of the Company As at the date of this report, the interests of the Directors in the shares of the Group were:
Director Number of ordinary
shares
Number of rights over
ordinary shares
Tony Gill 1,125,000 -Brett McKeon 21,179,773 41,374Malcolm Watkins 19,602,689 52,003Kevin Matthews 15,079,516 -Craig Carter 500,000 -Melanie Kiely 67,164 -Jane Muirsmith 65,000 -
Changes in State of AffairsOther than matters dealt with in this report there were no significant changes in the state of affairs of the Group during the financial year.
For
per
sona
l use
onl
y

2019 ANNUAL REPORT 13
Directors’ Report (Continued)
DividendsTotal dividends paid during the financial year ended 30 June 2019 were $22,340k (2018: $47,690k), which included:
⊲ A final fully franked ordinary dividend of $12,244k (5.7 cents per fully paid share) was declared out of profits of the Company for 2018 and paid on 27 September 2018.
⊲ An interim fully franked ordinary dividend of $10,096k (4.7 cents per fully paid share) was declared out of profits of the Company for 2019 and paid on 28 March 2019.
A final fully franked ordinary dividend of $12,755k (5.9 cents per fully paid share) has been declared out of profits of the Company for the financial year ended 30 June 2019 and is to be paid on 3 October 2019.
Principal ActivitiesThe Group’s principal activities in the course of the financial year continued to be:
⊲ Mortgage origination and management of home loans and commercial loans; and
⊲ Distribution of own branded home loan products, funded via traditional mortgage management products, white label and its established RMBS programme.
For
per
sona
l use
onl
y

Directors’ Report (Continued)
2019 ANNUAL REPORT14
Corporate Governance StatementThe Company’s Corporate Governance Statement can be found at investors.afgonline.com.au/investor/?page=corporate-governance
Review of OperationsFor the year ended 30 June 2019 the Group recorded a net profit after tax of $33,029k, 0.8% below FY18 ($33,309k). Underlying results from continuing operations, excluding changes in value of future trailing commissions was up 1.8% to $28,565k (30 June 2018: $28,052k). The change in trailing commissions net receivable for 30 June 2019 includes the growth of the loan book as well as longer loan lives as a result of tightening credit conditions. Revenue from continuing operations was up 6.6% to $659,999k (30 June 2018: $619,271k) driven by growth in AFG Securities and longer loan lives.
The result was underpinned by the following:
⊲ AFG Securities loan book growing by 50% to $2.06B (2018: $1.37B) and 108% ($549.8M) increase in settlement volumes in the securitisation programme to $1.06B (2018: $509.8M);
⊲ Offset by higher BBSW being absorbed by the business for a period to focus on AFG Securities loan book growth;
⊲ Increased residential trail book of 7% to $147.4B (2018: $137.8B) and longer loan lives;
⊲ Decreased residential settlements of 11% to $31.3B (2018: $35.3B); and
⊲ Decreased commercial settlements of 11% to $2.33B (2018: $2.62B).
Net cash flows from operating activities $27,831k (2018: $32,486k) was in line with underlying profit whereas FY18 included the positive impact of working capital movement. The increased AFGS loan book provides a strong platform to generate increased ongoing cashflow and earnings in future years. AFG continues to generate strong cash flows and maintains a capital light business model. This enables AFG to continue to invest to generate future growth.
The following table reconciles the unaudited underlying earnings to the reported profit after tax for the period in accordance with Australian Accounting Standards:
30 June 2019 30 June 2018
In thousands of AUD Operating income
Profit after tax
Operating income
Profit after tax
Underlying results from continuing operations 548,235 28,565 533,053 28,052Change in the carrying value of trailing commissions receivable and payable
94,604 4,464 70,343 5,257
Total result from continuing operations 642,839 33,029 603,396 33,309
Likely Developments and Expected ResultsThe Group will continue to provide choice and lead the market by building on the strengths of our traditional wholesale mortgage broking business while developing our significant distribution network to access other areas of the finance market.
Further information about likely developments in the operations and the expected results of those operations in future financial years have not been included in this report because disclosure of the information would, in the opinion of the Directors, be likely to result in unreasonable prejudice to the Group.
For
per
sona
l use
onl
y

2019 ANNUAL REPORT 15
Directors’ Report (Continued)
Environmental Regulation The Group is not subject to any significant environmental regulation under a law of the Commonwealth or of a State or Territory in respect of its activities.
Subsequent EventsOn 12 August 2019, the Group announced it had entered into a binding conditional implementation deed to merge with the mortgage aggregation business of Connective Group Pty Ltd. Under the transaction, Connective Group Pty Ltd will receive $60 million in cash and 30,886,441 AFG shares valuing the acquisition at $120 million, with AFG to primarily fund the cash component through a new corporate debt facility. The transaction is conditional upon a court validating the transaction as not being unlawful or able to be set aside (a non customary condition), in addition to ACCC, AFG shareholder (if required), Connective Group shareholder approval and other customary approvals.
On 22 August 2019, the Directors declared the payment of a dividend of 5.9 cents per fully paid ordinary share, fully franked based on tax paid at 30%. The dividend has a record date of 9 September 2019 and a payment date of 3 October 2019. The aggregate amount of the proposed dividend expected to be paid out of retained earnings at 30 June 2019 is $12,755k. The financial effect of this dividend has not been brought to account in the financial statements for the year ended 30 June 2019.
There has not been any matter or circumstance, other than that referred to in the financial statements or
notes thereto, that has arisen since the end of the financial year, that has significantly affected, or may significantly affect, the operations of the Group, the results of those operations, or the state of affairs of the Group in future financial years.
Share optionsThere were no options issued or exercised during the financial year (2018: Nil).
Indemnification of insurance of officers and auditorsDuring the financial year, the Group paid a premium in respect of a contract insuring the Directors of the Group (as named above) against a liability incurred as a Director to the extent permitted by the Corporations Act 2001. The contract of insurance prohibits disclosure of the nature of the liability and the amount of the premium.
The Group has not otherwise, during or since the financial year, indemnified or agreed to indemnify an officer or auditor of the Group or of any related body corporate against a liability incurred as such an officer or auditor.
Directors’ MeetingsThe number of Directors’ meetings (excluding circulatory resolutions) held during the year and each Director’s attendance at those meeting is set out in the table below.
For
per
sona
l use
onl
y
Directors’ Report (Continued)
2019 ANNUAL REPORT16
The Directors met as a Board 13 times during the year. 11 meetings were main meetings and 2 meetings were convened to consider special business. Special meetings are convened at a time to enable the maximum number of Directors to attend and are generally held to consider specific items that cannot be held over to the next scheduled main meeting. Apologies were received from Directors in all instances where they were unable to attend a meeting.
Directors’ Board MeetingsMain Meetings
HeldMain Meetings
AttendedSpecial Meetings
HeldSpecial Meetings
AttendedTony Gill 11 11 2 2Brett McKeon 11 9 2 2Malcolm Watkins 11 11 2 2Kevin Matthews 11 11 2 2Craig Carter 11 11 2 2Melanie Kiely 11 11 2 2Jane Muirsmith 11 11 2 2
Committee membershipAs at the date of this report, the Company had an Audit Committee, Remuneration and Nomination Committee and a Risk and Compliance Committee.
Members acting on the Committees of the Board during the year were:
Audit Remuneration and Nomination Risk and ComplianceCraig Carter (C) Melanie Kiely (C) Jane Muirsmith (C)
Melanie Kiely Craig Carter Craig CarterJane Muirsmith Jane Muirsmith Melanie Kiely
Notes(C) designates the Chair of the Committee
The following table sets out the number of meetings of the Committees of the Board and the number of meetings attended by each Director who is/was a member of that Committee:
Committee MeetingsDirectors Audit Remuneration and
NominationRisk and Compliance
Maximum Possible Meetings
Attended Maximum Possible Meetings
Attended Maximum Possible Meetings
Attended
Craig Carter 5 5 5 5 5 5Melanie Kiely 5 5 5 5 5 5Jane Muirsmith 5 5 5 5 5 5F
or p
erso
nal u
se o
nly

2019 ANNUAL REPORT 17
Directors’ Report (Continued)
RoundingThe amounts contained in this report and in the financial report have been rounded to the nearest $1,000 (where rounding is applicable) and where noted ($000) under the option available to the Company under ASIC Corporations Instrument 2016/191. The Company is an entity to which the class order applies.
Non–audit servicesThe following non-audit services were provided by the entity’s auditor, Deloitte Touche Tohmatsu. The Directors are satisfied that the provision of non-audit services is compatible with the general standard of independence for auditors imposed by the Corporations Act 2001 (Cth).
The Directors are of the opinion that the services as disclosed in Note 11 to the Financial Statements do not compromise the external auditor’s independence, based on advice received from the Audit Committee, for the following reasons:
• All non-audit services have been reviewed and approved to ensure that they do not impact the integrity and objectivity of the auditor; and
• None of the services undermine the general principles relating to auditor independence as set out in APES 110 ‘Code of Ethics for Professional Accountants’ issued by the Accounting Professional & Ethical Standards Board, including reviewing or auditing the auditor’s own work, acting in a management or decision-making capacity for the Company, acting as advocate for the Company or jointly sharing economic risks and rewards.
The nature and scope of each type of non-audit service provided means that auditor independence was not compromised.
Deloitte Touche Tohmatsu received or is due to receive the following amounts for the provision of non-audit services:
$
Other non-audit services 97,500
97,500
Auditor’s Independence declaration The auditor’s independence declaration is included on page 35 of this financial report for the year ended 30 June 2019.
This report is made in accordance with a resolution of the Directors.
For
per
sona
l use
onl
y
Directors’ Report (Continued)
2019 ANNUAL REPORT18
For
per
sona
l use
onl
y

2019 ANNUAL REPORT 19
Directors’ Report (Continued)
Remuneration ReportMessage from the Chair of the Remuneration & Nomination Committee
Dear Shareholder,
On behalf of the Board I am pleased to present AFG’s Remuneration Report for FY19.
The AFG Board remains committed to an Executive Remuneration structure that drives a strong performance culture in line with our strategy and delivers satisfactory and sustainable returns for shareholders in the short term and over time. At the same time, it is important that conduct, responsible lending and ensuring positive customer outcomes remain front of mind.
Feedback from shareholders, stakeholders and proxy advisors is valuable to our remuneration process. The Board has actively sought feedback and where appropriate, revised the Executive remuneration framework over previous years. The structure for FY19 and FY20 is largely consistent with FY18, given the changes made and the outcomes delivered for shareholders and considering the challenging regulatory and economic environment, stability in remuneration structures was considered important.
I am pleased to note that following strong EPS and TSR performance the FY17 LTI plan has vested at 30 June 2019. This is the first plan that has vested since AFG listed in May 2015 and reflects the returns generated for shareholders over the last 3 years.
The focus of our executive remuneration structures remains a mixture of short and long term targets designed to drive both earnings growth and the development of key strategic initiatives to deliver continued and sustainable returns for shareholders.
FY19 Performance & Remuneration Outcomes SummaryFY19 was a challenging year for the financial services sector with both regulatory and economic headwinds. Notwithstanding this, the group delivered a solid result in FY19 which reflects the earnings diversification strategy and robust nature of the business. NPAT of $33.0M was achieved in FY19, in
line with FY18 $33.3M and representing an EPS CAGR of 13.4% since FY16.
Over the Total Shareholder Return (TSR) LTI performance period of 1 July 2016 to 1 July 2019 AFG has delivered TSR performance at the 80th and 85th percentile of the Diversified Financials and Small Industrials Indexes respectively.
While the residential mortgage market was particularly challenging during FY19 with tightened credit driving an 11% reduction in residential settlements, AFGHLs settlements performed well finishing the year 2% below FY18. Importantly, AFG Securities showed continued growth in settlements up 108% to $1.06B (FY18: $509.8M) and positions the business well to continue delivering earnings growth for shareholders.
The AFG Business platform is beginning to achieve traction with brokers. An expanded lender panel has delivered more competition and choice for customers with settlements of $129,677k in FY19 (FY18: $11,792k).
Performance against other KPI measures was also strong with the Group’s loan book ending the year at $155.45B up 6.9% from FY18. This demonstrates growth in the core business, generating ongoing stability for future investment and growth.
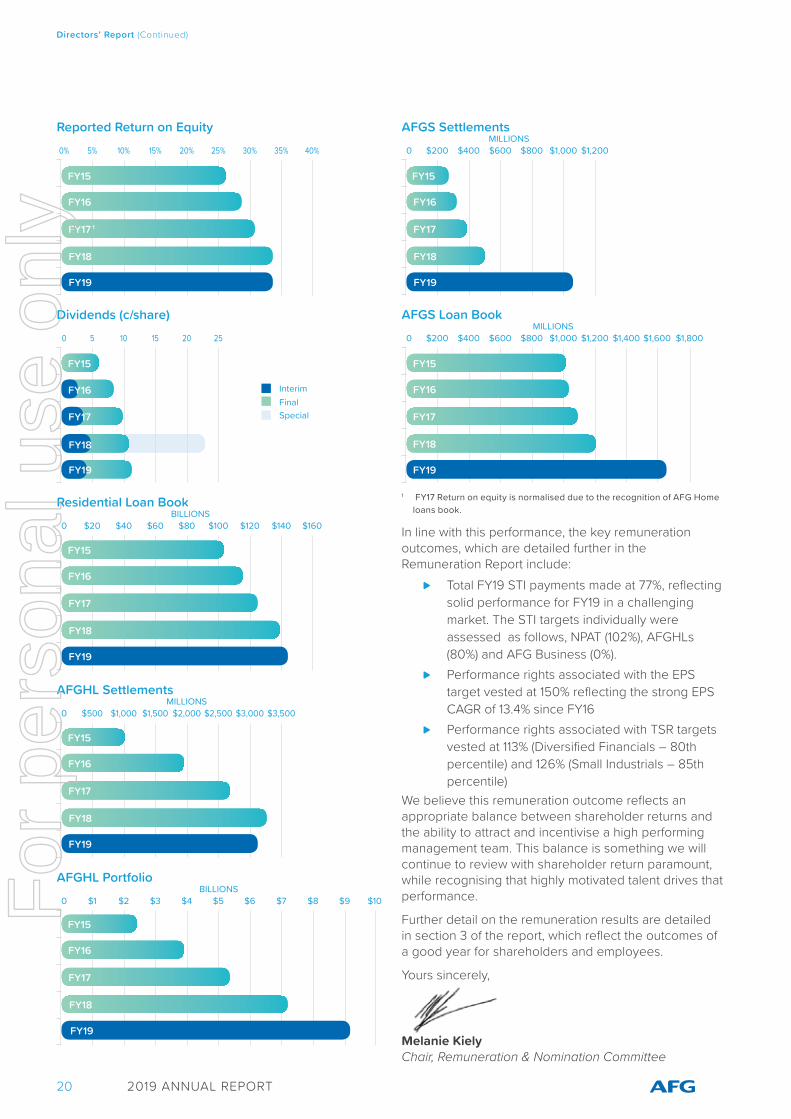
A 5-year history of AFG’s NPAT, Residential, AFGHLs and AFG Securities loan books, AFG Securities Settlements, ROE and Dividends is provided below:
$50 $10 $15 $20 $25 $30 $35 $40 $45MILLIONS
Net Profit After Tax
FY15
FY16
FY17
FY18
FY19
* Grey shading of FY17 NPAT shows the initial recognition of AFGHL white label trail book relating to loans settled in prior periods.
For
per
sona
l use
onl
y
Directors’ Report (Continued)
2019 ANNUAL REPORT20
5%0% 10% 15% 20% 25% 30% 35% 40%
Reported Return on Equity
50 10 15 20 25
Dividends (c/share)
InterimFinalSpecial
$200 $40 $60 $80 $100 $120 $140 $160BILLIONS
Residential Loan Book
$5000 $1,000 $1,500 $2,000 $2,500 $3,000 $3,500MILLIONS
AFGHL Settlements
$10 $2 $3 $4 $5 $6 $7 $8 $9 $10BILLIONS
AFGHL Portfolio
$2000 $400 $600 $800 $1,000 $1,200 $1,400 $1,600 $1,800MILLIONS
AFGS Loan Book
$2000 $400 $600 $800 $1,000 $1,200MILLIONS
AFGS Settlements
1 FY17 Return on equity is normalised due to the recognition of AFG Home loans book.
In line with this performance, the key remuneration outcomes, which are detailed further in the Remuneration Report include:
⊲ Total FY19 STI payments made at 77%, reflecting solid performance for FY19 in a challenging market. The STI targets individually were assessed as follows, NPAT (102%), AFGHLs (80%) and AFG Business (0%).
⊲ Performance rights associated with the EPS target vested at 150% reflecting the strong EPS CAGR of 13.4% since FY16
⊲ Performance rights associated with TSR targets vested at 113% (Diversified Financials – 80th percentile) and 126% (Small Industrials – 85th percentile)
We believe this remuneration outcome reflects an appropriate balance between shareholder returns and the ability to attract and incentivise a high performing management team. This balance is something we will continue to review with shareholder return paramount, while recognising that highly motivated talent drives that performance.
Further detail on the remuneration results are detailed in section 3 of the report, which reflect the outcomes of a good year for shareholders and employees.
Yours sincerely,
Melanie Kiely Chair, Remuneration & Nomination Committee
FY15
FY16
FY17 1
FY18
FY19
FY15
FY16
FY17
FY18
FY19
FY15
FY16
FY17
FY18
FY19
FY15
FY16
FY17
FY18
FY19
FY15
FY16
FY17
FY18
FY19
FY15
FY16
FY17
FY18
FY19
FY16
FY15
FY17
FY18
FY19
For
per
sona
l use
onl
y

2019 ANNUAL REPORT 21
Directors’ Report (Continued)
1) IntroductionThe Remuneration Report outlines AFG’s remuneration philosophy, framework and outcomes for all Non-Executive Directors, Executive Directors and other Key Management Personnel (collectively KMP). The report is written in accordance with the requirements of the Corporations Act 2001 (Cth) (the Act) and its regulations. This information has been audited as required by section 308(3C) of the Act.
2) Key Management PersonnelKMP are those persons who have specific responsibility for planning, directing and controlling material activities of the Group. In this report, “Executives” refers to the KMP excluding the Non-Executive Directors (“NED”).
The current KMPs of the Group for the entire financial year unless otherwise stated are as follows:
Non-Executive Directors Anthony Gill Non-Executive Chairman Appointed 28 August 2008Kevin Matthews Non-Executive Director Appointed 20 January 1995Craig Carter1 Non-Executive Director Appointed 25 March 2015Melanie Kiely2 Non-Executive Director Appointed 31 March 2016 Jane Muirsmith3 Non-Executive Director Appointed 31 March 2016Executive DirectorsBrett McKeon4 Executive Director Appointed 19 June 1996Malcolm Watkins Executive Director Appointed 8 December 1997ExecutivesDavid Bailey Chief Executive Officer Appointed 16 June 2017Lisa Bevan Company Secretary Appointed 9 March 1998Ben Jenkins Chief Financial Officer Appointed 14 December 2015John Sanger Chief Operating Officer Appointed 6 March 2018
1 Craig Carter is Chairman of the Audit Committee.
2 Melanie Kiely is Chair of the Remuneration and Nomination Committee.
3 Jane Muirsmith is Chair of the Risk and Compliance Committee.
4 Brett McKeon transitioned to Non-Executive Director effective 1 July 2019.
Other than Kevin Matthews and Brett McKeon, all Non-Executive Directors listed above are Independent Directors.
3) Executive Remuneration StructuresThe Group aims to reward Executives with a level of remuneration commensurate with their responsibilities and position within the Group and their ability to influence shareholder value creation within the context of appropriate conduct.
The remuneration framework links rewards with the strategic goals and performance of the Group and provides a market competitive mix of both fixed and variable rewards including a blend of short and long-term incentives. The variable (or “at risk”) remuneration of Executives is linked to the Group performance through measures based on the operational performance of the business and is subject to a gateway for appropriate conduct.F
or p
erso
nal u
se o
nly
Directors’ Report (Continued)
2019 ANNUAL REPORT22
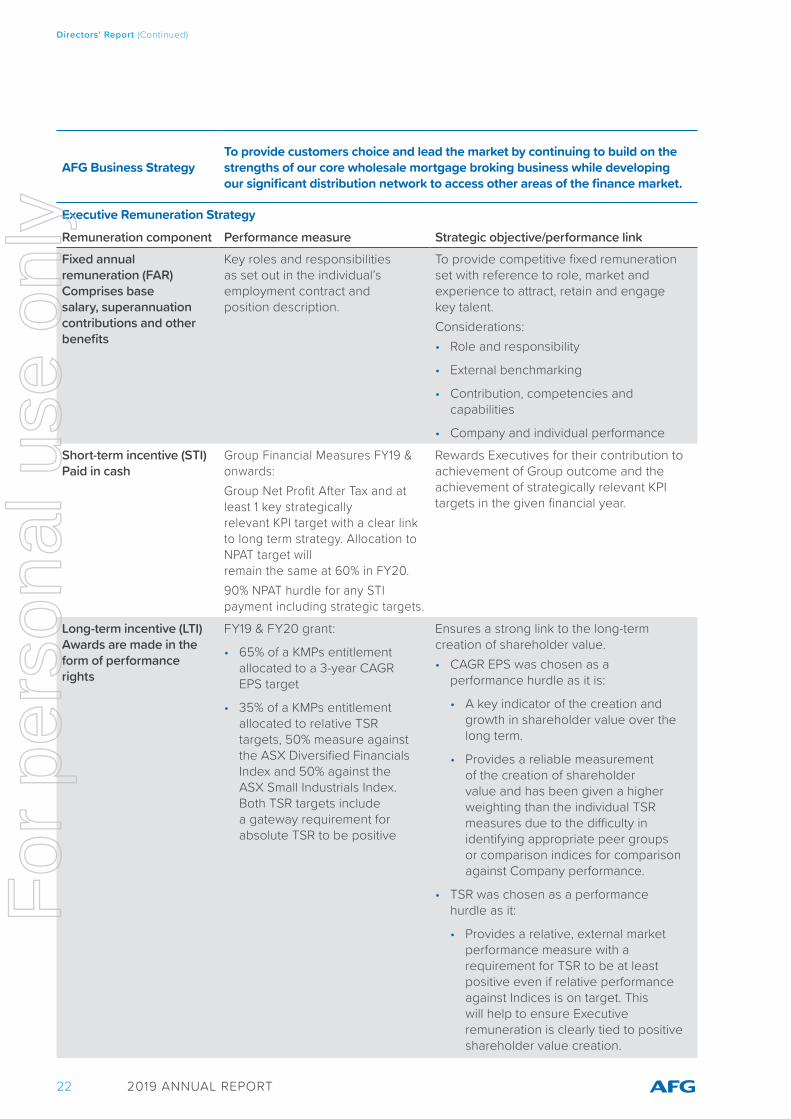
AFG Business StrategyTo provide customers choice and lead the market by continuing to build on the strengths of our core wholesale mortgage broking business while developing our significant distribution network to access other areas of the finance market.
Executive Remuneration Strategy
Remuneration component Performance measure Strategic objective/performance linkFixed annual remuneration (FAR) Comprises base salary, superannuation contributions and other benefits
Key roles and responsibilities as set out in the individual’s employment contract and position description.
To provide competitive fixed remuneration set with reference to role, market and experience to attract, retain and engage key talent.Considerations: • Role and responsibility
• External benchmarking
• Contribution, competencies and capabilities
• Company and individual performance
Short-term incentive (STI) Paid in cash
Group Financial Measures FY19 & onwards:Group Net Profit After Tax and at least 1 key strategically relevant KPI target with a clear link to long term strategy. Allocation to NPAT target will remain the same at 60% in FY20. 90% NPAT hurdle for any STI payment including strategic targets.
Rewards Executives for their contribution to achievement of Group outcome and the achievement of strategically relevant KPI targets in the given financial year.
Long-term incentive (LTI) Awards are made in the form of performance rights
FY19 & FY20 grant:
• 65% of a KMPs entitlement allocated to a 3-year CAGR EPS target
• 35% of a KMPs entitlement allocated to relative TSR targets, 50% measure against the ASX Diversified Financials Index and 50% against the ASX Small Industrials Index. Both TSR targets include a gateway requirement for absolute TSR to be positive
Ensures a strong link to the long-term creation of shareholder value.• CAGR EPS was chosen as a
performance hurdle as it is:
• A key indicator of the creation and growth in shareholder value over the long term.
• Provides a reliable measurement of the creation of shareholder value and has been given a higher weighting than the individual TSR measures due to the difficulty in identifying appropriate peer groups or comparison indices for comparison against Company performance.
• TSR was chosen as a performance hurdle as it:
• Provides a relative, external market performance measure with a requirement for TSR to be at least positive even if relative performance against Indices is on target. This will help to ensure Executive remuneration is clearly tied to positive shareholder value creation.
For
per
sona
l use
onl
y

2019 ANNUAL REPORT 23
Directors’ Report (Continued)
3.1) Executive Remuneration Outcomes
STI award outcomes FY19The combined cash bonus pool available to be paid to the Executives for on target performance in the 2019 financial year was $536,128 and the minimum is nil. For the 2019 financial year, 77% of the target STI bonus amount was achieved by the Executives as outlined below.
Target FY18 000’s
FY19 000’s Growth Payment
NPAT ($’000) $33,309 $33,029 (0.8%) 102%AFGHL settlements $3,223 $3,153 (2%) 80%AFGB settlements $11,792 $129,677 1000% (0%)
Target STI opportunity
As a % of fixed remuneration STI outcome % Achieved % Forfeited
D. Bailey $224,500 40% $172,668 77% 23%B. McKeon $22,114 17% $17,008 77% 23%M. Watkins $22,114 17% $17,008 77% 23%L. Bevan $86,400 33% $66,452 77% 23%B. Jenkins $71,000 26% $54,608 77% 23%J. Sanger $110,000 34% $84,603 77% 23%Total $536,128 $412,347
LTI award outcomes FY19For the 2019 financial year, 136% of the target LTI bonus (granted in FY17) was achieved by the Executives as outlined below. This is reflective of stretch performance against target for CAGR EPS and TSR.
Measure Target Achieved % Achieved
CAGR EPS 7.5% 13.4% 150%TSR Small Industrials 75th Percentile 85th Percentile 126%TRS Diversified Financials 75th Percentile 80th Percentile 113%
Target LTI opportunity LTI outcome % Achieved % Forfeited
D. Bailey 164,688 224,410 136% 0%B. McKeon* 176,452 240,440 136% 0%M. Watkins 35,291 48,089 136% 0%L. Bevan 84,697 115,412 136% 0%B. Jenkins 58,818 80,148 136% 0%Total 519,946 708,499 136%
* B. McKeon was MD of AFG at the commencement of the LTI period (1 July 2016) and as he continued to be employed as an Executive Director his rights were not forfeited.
For
per
sona
l use
onl
y

Directors’ Report (Continued)
2019 ANNUAL REPORT24
3.2) Fixed Annual RemunerationNo significant changes to the remuneration structure were required during the financial year.
The targeted remuneration mix for:
⊲ The CEO is 38% fixed and 62% variable (at risk): and
⊲ Other members of the Executive team are in the range of 34% to 48% fixed and 52% to 66% variable (at risk).
3.3) STI PlanAFG Executives are entitled to participate in AFG’s STI plan. The amount of the STI award each participant may become entitled to (if any) will be determined by the Remuneration and Nomination Committee based on achievement against set performance targets.
Objective The AFG STI plan rewards Executives for the achievement of objectives directly linked to AFG’s business strategy that is focused on earnings diversification and providing choice and competition to consumers.
Participation All ExecutivesSTI opportunity The STI available to each Executive is set at a level based on role, responsibilities and
market data for the achievement of stretching targets against specific KPIs. The target STI opportunity for each Executive in FY19 is listed at 3.1 as an absolute dollar amount and as a percentage of the Executive’s fixed base.
Performance period
The performance period is the relevant Financial Year. KPIs and weightings are set and reviewed each year to ensure that the STI targets remain relevant for the current environment and Executives remain focused on clear goals for the period.
Link between performance and reward
The KPI targets are selected based on what needs to be achieved over each financial performance period to deliver the business strategy over the long term. From FY18 onwards the KPIs will include a financial target and current year delivery of at least one strategically relevant KPI relating to the Group’s long-term strategy.
The weightings for each KPI is set for each performance period based on the specific business targets set by the Board. A minimum threshold hurdle is set for each KPI included in the scorecard before any payment is made in respect of that KPI measure. In order for any STI award to be payable, a conduct gateway must also be achieved.
Assessment of performance
The Board reviews and approves the performance assessment and STI payments for the CEO and all other Executives.
Payment method STI payments are delivered as cash.
3.4) FY20 STI OpportunityOffers to participate in STI awards for 2020 were made to Executives under the STI Plan on the terms set out below.
The amount of the STI award each participant may become entitled to (if any) will be determined by the Remuneration and Nomination Committee and approved by the Board based on achievement against the targeted NPAT as approved by the Board (60%), AFGHL settlement volumes (20%) and AFG Business (AFG’s new digital broking platform for commercial SME lending) settlement volumes (20%). The allocation of these targets is dependent upon the Executive’s role in the business however all have a NPAT target.
For
per
sona
l use
onl
y

2019 ANNUAL REPORT 25
Directors’ Report (Continued)
3.5) The LTI Plan – 2018, 2019 and 2020 GrantsAFG has established the LTI Plan to assist in the longer term motivation, retention and reward of KMP and certain senior employees. The LTI Plan is designed to align the interests of Executives and senior management with the interests of shareholders by providing an opportunity for the participants to receive an equity interest in AFG and to ensure a focus on long term sustainable growth. Details of the LTI Grants are provided below.
2018 & 2019 LTI Grant 2020 LTI Grant
Instrument Performance rights to acquire ordinary AFG shares
Performance rights to acquire ordinary AFG shares
Quantum 65% of an Executive’s annual LTI entitlement weighted to an EPS target
35% of an Executive’s annual LTI entitlement weighted to relative TSR targets
65% of an Executive’s annual LTI entitlement weighted to an EPS target
35% of an Executive’s annual LTI entitlement weighted to relative TSR targets
Grant date 1 July 2017, other than those approved at the 2017 AGM; and
1 July 2018 other than those subject to approval at the 2018 AGM
1 July 2019 other than those subject to approval at the 2019 AGM
Grant date fair value
TSR Small Industrials Index 2018 $0.77; 2019 $0.84
TSR Diversified Financials Index 2018 $0.75; 2019 $0.79
EPS $1.25 (being the 20-day Volume Weighted Average Price leading up to 30 June 2018)
EPS $1.36 (being the 20-day Volume Weighted Average Price leading up to 30 June 2019)
TSR Small Industrials Index $1.04
TSR Diversified Financials Index $0.98
EPS $1.58 (being the 20-day Volume Weighted Average Price leading up to 30 June 2019)
Gateway performance measure
TSR – Absolute TSR must be positive
EPS – 5.0% CAGR EPS
TSR – Absolute TSR must be positive
EPS – 2.5% CAGR EPS
The CAGR targets for the FY20 grants have been revised down in line with market expectations in a significantly depressed residential mortgage market and broader economy. This is evidenced by the RBAs decision to cut the cash rate in both June and July 2019 to a record low of 100bps.
For
per
sona
l use
onl
y

Directors’ Report (Continued)
2019 ANNUAL REPORT26
2018 & 2019 LTI Grant 2020 LTI Grant
Key performance measure
TSR
Relative Total Shareholder Return (pro-rata vesting between hurdles) 50% measured against the Diversified Financials Index, 50% against Small Industrials
50th Percentile – 50% vesting
75th Percentile – 100% vesting
85th Percentile – 125% vesting (stretch target)
90th Percentile – 150% vesting (stretch target)
EPS accretion
5.0% CAGR – 50% vesting
10% CAGR – 100% vesting
12.5% CAGR – 150% vesting (stretch target)
TSR
Relative Total Shareholder Return (pro-rata vesting between hurdles) 50% measured against the Diversified Financials Index, 50% against Small Industrials
50th Percentile – 50% vesting
75th Percentile – 100% vesting
85th Percentile – 125% vesting (stretch target)
90th Percentile – 150% vesting (stretch target)
EPS accretion
2.5% CAGR – 50% vesting
5% CAGR – 100% vesting
7.5% CAGR – 150% vesting (stretch target)
Performance & Service period
1 July 2017 – 30 June 2020
1 July 2018 – 30 June 2021
1 July 2019 – 30 June 2022
Performance assessment
30 June 2020 and 30 June 2021
Performance period not yet complete.
30 June 2022
Performance period not yet complete.
Common LTI Plan Rules & Design Considerations
Link between performance and reward
TSR
TSR encapsulates performance across the underlying key performance measures throughout the business aimed at achieving targeted business outcomes that will result in increased shareholder wealth through share price growth and dividends.
Stretch targets are available giving Executives the opportunity to increase the number of performance rights by up to 50% for exceptional performance.
EPS
Long term EPS accretion targets are set at levels that are challenging yet achievable in a sustainable manner. EPS directly links creation of shareholder wealth to the delivery of the businesses strategy over a long term period.
Stretch targets are available giving Executives the opportunity to increase the number of performance rights by up to 50% for exceptional performance.
Cessation of employment
If the participant ceases employment for cause or resigns, unless the Board determines otherwise, any unvested Performance Rights will automatically lapse.
Generally, if the participant ceases employment for any other reason, all of their unvested Performance Rights will remain on foot and subject to the original performance condition. However, the Board retains discretion to determine that some of their Rights (up to a pro rata portion based on how much of the Performance Period remains) will lapse.
Dividends & voting
The Performance Rights do not carry dividends or voting rights prior to vesting.
For
per
sona
l use
onl
y

2019 ANNUAL REPORT 27
Directors’ Report (Continued)
Common LTI Plan Rules & Design Considerations
Clawback and preventing inappropriate benefits
The Plan Rules provide the Board with broad ‘clawback’ powers if, amongst other things, the participant has acted fraudulently or dishonestly, engaged in gross misconduct or has acted in a manner that has brought AFG or its related bodies corporate into disrepute. This would include circumstances where there is a material financial misstatement, or AFG is required or entitled under law or Company policy to reclaim remuneration from the participant, or the participant’s entitlements vest as a result of the fraud, dishonesty or breach of obligations of any other person and the Board is of the opinion that the incentives would not have otherwise vested.
Change of control
In a situation where there is likely to be a change of control, the Board has the discretion to accelerate vesting of some or all of the Performance Rights. Where only some of the Performance Rights have vested on a change of control, the remainder of the Performance Rights will immediately lapse. If the change of control occurs before the Board exercises its discretion:
• a pro-rata portion of the Performance Rights equal to the portion of the relevant Performance Period that has elapsed up to the expected or actual (as appropriate) date of the change of control will immediately vest; and
the Board may, in its absolute discretion, decide whether the balance should vest or lapse.Restrictions on dealing
The participant must not sell, transfer, encumber, hedge or otherwise deal with Performance Rights.
Unless the Board determines otherwise, the participant will be free to deal with the Shares allocated on vesting of the Performance Rights, subject to the requirements of AFG’s Policy for dealing in securities.
Reconstructions, corporate action, rights issues, bonus issues, etc.
The rules of the LTI Plan include specific provisions dealing with rights issues, bonus issues, and corporate actions and other capital reconstructions. These provisions are intended to ensure that there is no material advantage or disadvantage to the participant in respect of their Performance Rights as a result of such corporate actions.
For
per
sona
l use
onl
y

Directors’ Report (Continued)
2019 ANNUAL REPORT28
4)
Stat
utor
y Re
mun
erat
ion
Tabl
es
Exec
utiv
e re
mun
erat
ion
for t
he y
ears
end
ed 3
0 Ju
ne 2
019
and
30 J
une
2018
Shor
t-ter
mPo
st e
mpl
oym
ent
Oth
er
Bonu
ses
Long
-term
Shar
e-ba
sed
paym
ents
Oth
er
Paym
ents
Tota
l Re
mun
erat
ion
Prop
ortio
n
of
rem
uner
atio
n
Sala
ry &
fe
esC
ash
bonu
s N
on
mon
etar
y be
nefit
s
Tota
lSu
pera
nnua
tion
Retir
emen
t be
nefit
sDi
scre
tiona
ry
Bonu
ses
Long
se
rvic
e le
ave
Righ
ts4
Shar
esO
ther
Pa
ymen
tsPe
rfor
man
ce
Rela
ted
KMP
$$
$$
$$
$$
$$
$%
D. B
aile
y20
1954
0,46
017
2,66
87,
049
720,
177
20,5
31-
-13
,294
277,
333
--
1,03
1,33
544
%
2018
528,
998
192,
681
5,66
772
7,346
20,0
49-
-22
,899
143,
372
--
913,
666
37%
B. M
cKeo
n120
1911
9,23
317
,008
7,04
914
3,29
012
,975
--
3,31
111
3,34
8-
-27
2,92
448
%
2018
116,
895
18,9
885,
667
141,
550
20,0
49-
-2,
099
63,5
25-
-22
7,223
36%
M. W
atki
ns1
2019
119,
233
17,0
086,
370
142,
611
13,4
18-
-2,
407
37,9
61-
-19
6,39
728
%
2018
148,
367
24,10
06,
451
178,
918
17,3
51-
-2,
841
22,0
99-
-22
1,20
921
%
L. B
evan
220
1924
4,66
966
,452
7,04
931
8,17
020
,531
--
(6,2
34)
104,
067
--
436,
534
39%
2018
240,
031
74,2
705,
667
319,
968
20,0
49-
-2,
169
55,0
23-
-39
7,209
33%
B. J
enki
ns20
1925
4,46
954
,608
7,04
931
6,12
620
,531
--
-89
,583
--
426,
240
34%
2018
254,
951
54,7
395,
667
315,
357
20,0
49-
--
45,0
00-
-38
0,40
626
%
J. S
ange
r320
1929
9,46
984
,603
7,04
939
1,121
20,5
31-
--
42,8
58-
-45
4,51
028
%
2018
91,1
3936
,904
1,81
712
9,86
05,
938
--
-12
,857
--
148,
655
33%
Tota
l 20
191,
577,
533
412,
347
41,6
152,
031,
495
108,
517
--
12,7
7866
5,15
0-
-2,
817,
940
38%
Tota
l 20
181,
380,
381
401,
682
30,9
361,
812,
999
103,
485
--
30,0
0834
1,87
6-
-2,
288,
368
32%
Not
es:
1 Br
ett M
cKeo
n an
d M
alco
lm W
atki
ns a
re e
mpl
oyed
on
a pa
rt ti
me
basi
s 2
days
per
wee
k. B
rett
McK
eon
tran
sitio
ned
to N
on-E
xecu
tive
Dire
ctor
1 Ju
ly 2
019
2 Li
sa B
evan
is e
mpl
oyed
on
a pa
rt ti
me
basi
s 4
days
per
wee
k3
Mr.
J Sa
nger
was
app
oint
ed C
OO
on
6 M
arch
201
84
Incr
ease
in s
hare
-bas
ed p
aym
ents
rem
uner
atio
n is
driv
en p
redo
min
atel
y by
the
exis
tenc
e of
thre
e LT
I pla
ns (a
nnua
l aw
ards
with
thre
e ye
ar p
erfo
rman
ce p
erio
ds) f
or th
e fir
st ti
me
For
per
sona
l use
onl
y

2019 ANNUAL REPORT 29
Directors’ Report (Continued)
5) Non-Executive Director Remuneration
5.1) Remuneration PolicyThe Board seeks to set aggregate remuneration at a level that provides the Company with the ability to attract and retain Directors of the highest calibre, whilst incurring a cost that is acceptable to shareholders. The amount of aggregate remuneration sought to be approved by shareholders and the fee structure is reviewed annually against fees paid to NEDs of comparable companies. The Board may consider advice from external consultants when undertaking the annual review process as appropriate.
The Company’s constitution and the ASX listing rules specify that the NED fee pool shall be determined from time to time by a general meeting. The latest determination was the Shareholders meeting held on 24 April 2015 when shareholders approved an aggregate fee pool of $1,000,000 per year. The Board will not seek any increase to the NED pool at the 2019 AGM.
5.2) StructureThe remuneration of NEDs consists of Directors’ fees, which is inclusive of statutory superannuation and Committee fees. The below summarises the NED fees from the date AFG listed on the ASX:
⊲ Chairman: $150,000 inclusive of superannuation
⊲ Non-Executive Directors: $90,000 inclusive of superannuation
NEDs do not receive retirement benefits, other than statutory superannuation contributions, nor do they participate in any incentive programs.
Directors may also be reimbursed for travel and other expenses incurred in attending to the Company’s affairs. The table below outlines the NED remuneration for the years ended 30 June 2019 and 30 June 2018:
Year Board and Committee Fees
Short-term benefits (non-monetary)
Superannuation Total
$ $ $ $ $T. Gill 2019 136,986 - 13,014 150,000
2018 136,986 - 13,014 150,000
K. Matthews 2019 82,192 - 7,808 90,0002018 82,192 - 7,808 90,000
C. Carter 2019 82,192 - 7,808 90,000
2018 82,192 - 7,808 90,000M. Kiely 2019 82,192 - 7,808 90,000
2018 82,192 - 7,808 90,000J. Muirsmith 2019 82,192 - 7,808 90,000
2018 82,192 - 7,808 90,000Total 2019 465,754 - 44,246 510,000Total 2018 465,754 - 44,246 510,000
For
per
sona
l use
onl
y

Directors’ Report (Continued)
2019 ANNUAL REPORT30
Additional Disclosures Relating to Rights and Shares
5.3) Rights awarded, vested and lapsed during the yearThe table below discloses the number of rights granted to Executives as remuneration during FY17, FY18 and FY19 as well as the number of rights that vested, lapsed or forfeited during the year. Rights do not carry any voting or dividend rights and shares can be allocated once the vesting conditions have been met until their expiry date.
Following the FY15 plan the Group moved to a 3-year performance period being the 2017 year below. The 2017 plan vested on 30 June 2019 as detailed below.
KMP Year / Tranches
(T)
No. of rights
awarded during the
year
Grant date
Fair value per rights at award
date $
Vesting date
Exercise price
Expiry date
No. forfeited
during the year
No. vested during
the year
B. McKeon
2017 / T1 97,500 1-Jul-16 $1.00 30-Jun-19 - 30-Jun-19 - 146,2502017 / T2 39,179 1-Jul-16 $0.67 30-Jun-19 - 30-Jun-19 - 44,0762017 / T3 39,773 1-Jul-16 $0.66 30-Jun-19 - 30-Jun-19 - 50,1142018 / T1 11,274 1-Jul-17 $1.25 30-Jun-20 - 30-Jun-20 - -2018 / T2 5,059 1-Jul-17 $0.75 30-Jun-20 - 30-Jun-20 - -2018 / T3 4,927 1-Jul-17 $0.77 30-Jun-20 - 30-Jun-20 - -2019 / T1 10,608 1-Jul-18 $1.36 30-Jun-21 - 30-Jun-21 - -2019 / T2 4,899 1-Jul-18 $0.79 30-Jun-21 - 30-Jun-21 - -2019 / T3 4,607 1-Jul-18 $0.84 30-Jun-21 - 30-Jun-21 - -
M. Watkins
2017 / T1 19,500 1-Jul-16 $1.00 30-Jun-19 - 30-Jun-19 - 29,2502017 / T2 7,836 1-Jul-16 $0.67 30-Jun-19 - 30-Jun-19 - 8,8162017 / T3 7,955 1-Jul-16 $0.66 30-Jun-19 - 30-Jun-19 - 10,0232018 / T1 16,910 1-Jul-17 $1.25 30-Jun-20 - 30-Jun-20 - -2018 / T2 7,588 1-Jul-17 $0.75 30-Jun-20 - 30-Jun-20 - -2018 / T3 7,391 1-Jul-17 $0.77 30-Jun-20 - 30-Jun-20 - -2019 / T1 10,608 1-Jul-18 $1.36 30-Jun-21 - 30-Jun-21 - -2019 / T2 4,899 1-Jul-18 $0.79 30-Jun-21 - 30-Jun-21 - -2019 / T3 4,607 1-Jul-18 $0.84 30-Jun-21 - 30-Jun-21 - -
L. Bevan
2017 / T1 46,800 1-Jul-16 $1.00 30-Jun-19 - 30-Jun-19 - 70,2002017 / T2 18,806 1-Jul-16 $0.67 30-Jun-19 - 30-Jun-19 - 21,1572017 / T3 19,091 1-Jul-16 $0.66 30-Jun-19 - 30-Jun-19 - 24,0552018 / T1 43,680 1-Jul-17 $1.25 30-Jun-20 - 30-Jun-20 - -2018 / T2 19,600 1-Jul-17 $0.75 30-Jun-20 - 30-Jun-20 - -2018 / T3 19,091 1-Jul-17 $0.77 30-Jun-20 - 30-Jun-20 - -2019 / T1 41,255 1-Jul-18 $1.36 30-Jun-21 - 30-Jun-21 - -2019 / T2 19,051 1-Jul-18 $0.79 30-Jun-21 - 30-Jun-21 - -2019 / T3 17,916 1-Jul-18 $0.84 30-Jun-21 - 30-Jun-21 - -
For
per
sona
l use
onl
y

2019 ANNUAL REPORT 31
Directors’ Report (Continued)
KMP Year / Tranches
(T)
No. of rights
awarded during the
year
Grant date
Fair value per rights at award
date $
Vesting date
Exercise price
Expiry date
No. forfeited
during the year
No. vested during
the year
D. Bailey
2017 / T1 91,000 1-Jul-16 $1.00 30-Jun-19 - 30-Jun-19 - 136,5002017 / T2 36,567 1-Jul-16 $0.67 30-Jun-19 - 30-Jun-19 - 41,1382017 / T3 37,121 1-Jul-16 $0.66 30-Jun-19 - 30-Jun-19 - 46,7722018 / T1 143,000 1-Jul-17 $1.25 30-Jun-20 - 30-Jun-20 - -2018 / T2 64,167 1-Jul-17 $0.75 30-Jun-20 - 30-Jun-20 - -2018 / T3 62,500 1-Jul-17 $0.77 30-Jun-20 - 30-Jun-20 - -2019 / T1 134,557 1-Jul-18 $1.36 30-Jun-21 - 30-Jun-21 - -2019 / T2 62,136 1-Jul-18 $0.79 30-Jun-21 - 30-Jun-21 - -
2019 / T3 58,138 1-Jul-18 $0.84 30-Jun-21 - 30-Jun-21 - -
B. Jenkins
2017 / T1 32,500 1-Jul-16 $1.00 30-Jun-19 - 30-Jun-19 - 48,7502017 / T2 13,060 1-Jul-16 $0.67 30-Jun-19 - 30-Jun-19 - 14,6932017 / T3 13,258 1-Jul-16 $0.66 30-Jun-19 - 30-Jun-19 - 16,7052018 / T1 44,200 1-Jul-17 $1.25 30-Jun-20 - 30-Jun-20 - -2018 / T2 19,833 1-Jul-17 $0.75 30-Jun-20 - 30-Jun-20 - -2018 / T3 19,318 1-Jul-17 $0.77 30-Jun-20 - 30-Jun-20 - -2019 / T1 40,775 1-Jul-18 $1.36 30-Jun-21 - 30-Jun-21 - -2019 / T2 18,830 1-Jul-18 $0.79 30-Jun-21 - 30-Jun-21 - -2019 / T3 17,708 1-Jul-18 $0.84 30-Jun-21 - 30-Jun-21 - -
J. Sanger
2018 / T1 37,987 6-Mar-18 $1.54 30-Jun-20 - 30-Jun-20 - -2018 / T2 14,189 6-Mar-18 $1.11 30-Jun-20 - 30-Jun-20 - -2018 / T3 14,063 6-Mar-18 $1.12 30-Jun-20 - 30-Jun-20 - -2019 / T1 43,174 1-Jul-18 $1.36 30-Jun-21 - 30-Jun-21 - -2019 / T2 19,937 1-Jul-18 $0.79 30-Jun-21 - 30-Jun-21 - -2019 / T3 18,750 1-Jul-18 $0.84 30-Jun-21 - 30-Jun-21 - -
* T1 – Earnings Per Share allocation
T2 – TSR (Diversified Financials) allocation
T3 – TSR (Small Industrials) allocation
For
per
sona
l use
onl
y

Directors’ Report (Continued)
2019 ANNUAL REPORT32
5.4) Shareholdings of KMP*Ordinary shares held in Australian Finance Group Limited ASX:AFG (number)
30 June 2019 Balance 1 July 2018
Granted as remuneration
Sold during the period
Net change other
Balance 30 June 2019
Held nominally
DirectorsT. Gill 1,125,000 - - - 1,125,000 1,125,000B. McKeon 21,179,773 - - - 21,179,773 21,179,773M. Watkins 19,602,689 - - - 19,602,689 19,602,689K. Matthews 15,029,516 - - 50,000 15,079,516 15,029,516C. Carter 500,000 - - - 500,000 500,000M. Kiely 67,164 - - - 67,164 67,164J. Muirsmith 65,000 - - - 65,000 65,000ExecutivesL. Bevan 1,533,333 - - - 1,533,333 83,333D. Bailey 1,066,666 - - - 1,066,666 546,666B. Jenkins - - - - - -J. Sanger 35,000 - - - 35,000 -
* Includes shares held directly, indirectly and beneficially by the KMP
6) Executive Service AgreementsRemuneration and other terms of employment for Executives are formalised in employment agreements. Each of these employment agreements provides for the payment of fixed and performance-based remuneration and employer superannuation contributions. The following outlines the details of these agreements:
Name Agreement expires Notice of termination by Company Employee noticeB. McKeon* No expiry, continuous agreement 12 months (or payment in lieu of notice) 12 weeksM. Watkins No expiry, continuous agreement 12 months (or payment in lieu of notice) 12 weeksD. Bailey No expiry, continuous agreement 12 months (or payment in lieu of notice) 12 weeksL. Bevan No expiry, continuous agreement 12 months (or payment in lieu of notice) 12 weeksB. Jenkins No expiry, continuous agreement 6 months (or payment in lieu of notice) 12 weeksJ. Sanger No expiry, continuous agreement 3 months (or payment in lieu of notice) 12 weeks
* Agreement terminated 30 June 2019 on transition to Non-Executive Director
For
per
sona
l use
onl
y

2019 ANNUAL REPORT 33
Directors’ Report (Continued)
7) Remuneration Governance
7.1) Remuneration and NominationThe Remuneration and Nomination Committee is responsible for ensuring AFG has remuneration strategies and a framework that fairly and responsibly rewards Executives and Non-Executive Directors with regard to performance, the law and corporate governance. The Committee ensures that AFG remuneration policies are directly aligned to business strategy, financial performance and support increased shareholder wealth over the long term.
As at 30 June 2019 the Committee comprised independent Non-Executive Director Melanie Kiely (Chair), and independent Non-Executive Directors Craig Carter and Jane Muirsmith.
Further information on the role of the Remuneration and Nomination Committee is set out in the Committee’s Charter available at www.afgonline.com.au and in the Corporate Governance Statement also available on the Company’s website.
7.2) Remuneration PhilosophyThe performance of the Company depends upon the quality of its Directors and Executives. To prosper, the Company must attract, motivate and retain highly skilled Directors and Executives.
The Board embodies the following principles in its remuneration framework:
⊲ Remuneration levels for KMP are set to attract and retain appropriately qualified and experienced Directors and Executives;
⊲ Alignment of Executive reward with shareholder interest and strategy;
⊲ The relationship between performance, conduct and remuneration of Executives is clear and transparent.
7.3) Use of Independent ConsultantsIn performing its role, the Remuneration and Nomination Committee can directly commission and receive information and advice from independent external advisors. The Committee has protocols in place to ensure that any advice and recommendations are provided in an appropriate manner and free from undue influence of management.
No remuneration advice or recommendations from independent consultants was received during the financial period ended 30 June 2019.
7.4) Policy for Dealing in SecuritiesAFG has a policy for dealing in securities to establish best practice procedures that protect AFG, Directors and employees against the misuse of unpublished information that could materially affect the value of AFG securities. Directors, Executives and their connected persons are restricted by trading windows.
7.5) Remuneration Report approval at 2018 AGMThe 30 June 2018 Remuneration Report was presented to shareholders and was approved at the 2018 Annual General Meeting.F
or p
erso
nal u
se o
nly

Directors’ Report (Continued)
2019 ANNUAL REPORT34
8) Other Transactions and Balances with KMP and their Related Parties (i) During the year, the Group made payments to Genworth Mortgage Insurance Australia Limited, one of
our providers of Lenders Mortgage Insurance (LMI). Mr T. Gill was a Non-Executive Director of Genworth Mortgage Insurance Australia Limited until 31 August 2018. These dealings were in the ordinary course of business and were on normal terms and conditions. The payments made for the provision of LMI policies up to 31 August 2018 were $326k (2018: $706k). These payments are not considered to be material to the financial results of the Group and therefore do not impact on Mr T. Gill’s independence as a Director.
(ii) Mr T. Gill is an Independent Director of First Mortgage Services (FMS), one of our providers of loan settlement services. During the year, the Group made payments to FMS. These dealings were in the ordinary course of business and were on normal terms and conditions. The payments made for the provision of the settlement services were $464k (2018: $333k). These payments are not considered to be material to the financial results of the Group and therefore do not impact on Mr T. Gill’s independence as a Director.
(iii) Establish Property Group Ltd (EPG) was created as part of the demerger of the property business on 22 April 2015. The Group’s head office is located at 100 Havelock Street West Perth. The Group leases these premises at commercial arm’s length rates from an investee of EPG, Qube Havelock Street Development Pty Ltd (Qube). AFG paid rent of $1,126k which has been paid to Qube. (2018: $1,583k). In addition to the above McCabe Street has an outstanding loan owing to AFG amounting to $218k (2018: $209k), this loan is on commercial terms at arms-length. EPG and McCabe Street share some common directors with AFG.
9) Independent Audit of Remuneration Report The Remuneration Report has been audited by Deloitte. Please see page 91 of this Annual Report for Deloitte’s report on the Remuneration Report.
This Directors’ Report, including the Remuneration Report, is signed in accordance with a Resolution of Directors of AFG.
Tony Gill Chairman
Perth 22 August 2019
For
per
sona
l use
onl
y

2019 ANNUAL REPORT 35
Directors’ Report (Continued)
Independence declaration under Section 307C of the Corporations Act 2001
For
per
sona
l use
onl
y

2019 ANNUAL REPORT36
Consolidated Statement of Financial PositionAs at 30 June 2019
In thousands of AUD Note 2019 2018
AssetsCash and cash equivalents 14(a) 96,818 88,710Trade and other receivables 15 5,409 810,117Contract assets 16 899,727 -Loans and advances 18 2,072,004 1,379,857Other financial assets 6 15Investment in associate 19 14,341 12,815Property, plant and equipment 20 849 1,379Intangible assets 806 516Total assets 3,089,960 2,293,409
LiabilitiesTrade and other payables 17 874,076 783,676Interest-bearing liabilities 21 2,073,772 1,381,761Employee benefits 22 5,234 4,543Current tax payable 13(b) 2,808 2,074Provisions 23 3,129 2,855Contract liability 24(a) 4,296 -Deferred Income 24(b) - 4,123Deferred tax liability 13(c) 21,823 21,053Total liabilities 2,985,138 2,200,085
Net assets 104,822 93,324EquityShare capital 26(a) 43,541 43,541Share-based payment reserve 1,630 814Other capital reserves (96) (87)Retained earnings 59,747 49,056Total equity 104,822 93,324
The Consolidated Statement of Financial Position should be read in conjunction with the Notes to the Financial Statements.For
per
sona
l use
onl
y

2019 ANNUAL REPORT 37
Consolidated Statement of Profit or Loss and Other Comprehensive IncomeFor the year ended 30 June 2019
In thousands of AUD Note 2019 2018
Continuing OperationsCommission and other income 7 569,702 551,084Securitisation interest income 73,137 52,312Operating income 642,839 603,396Commission and other cost of sales (514,091) (493,938)Securitisation interest expense (53,513) (36,875)Gross profit 75,235 72,583Other income 8 15,132 13,412Administration expenses (4,947) (3,788)Other expenses 9 (42,515) (37,129)Results from operating activities 42,905 45,078Finance income 12 2,028 2,463Finance expenses 12 - (18)Share of profit of an associate 1,526 186Net finance and investing income 3,554 2,631
Profit before tax from continuing operations 46,459 47,709Income tax expense 13(a) (13,430) (14,400)Profit from continuing operations 33,029 33,309
Attributable to:Owners of the Company 33,029 33,336Non-controlling interests - (27)
33,029 33,309Other comprehensive incomeItems that may be reclassified subsequently to profit or lossNet fair value change on equity instruments designated at FVOCI - (15)Other comprehensive loss for the year, net of income tax - (15)
Total comprehensive income for the year 33,029 33,294Total comprehensive income for the year attributable to:Owners of the Company 33,029 33,321Non-controlling interests - (27)Total comprehensive income for the year 33,029 33,294
Earnings per shareBasic earnings (cents per share) 27 15.38 15.50Diluted earnings (cents per share) 27 15.24 15.41
The Consolidated Statement of Profit or Loss and Other Comprehensive Income should be read in conjunction with the Notes to the Financial Statements.
For
per
sona
l use
onl
y
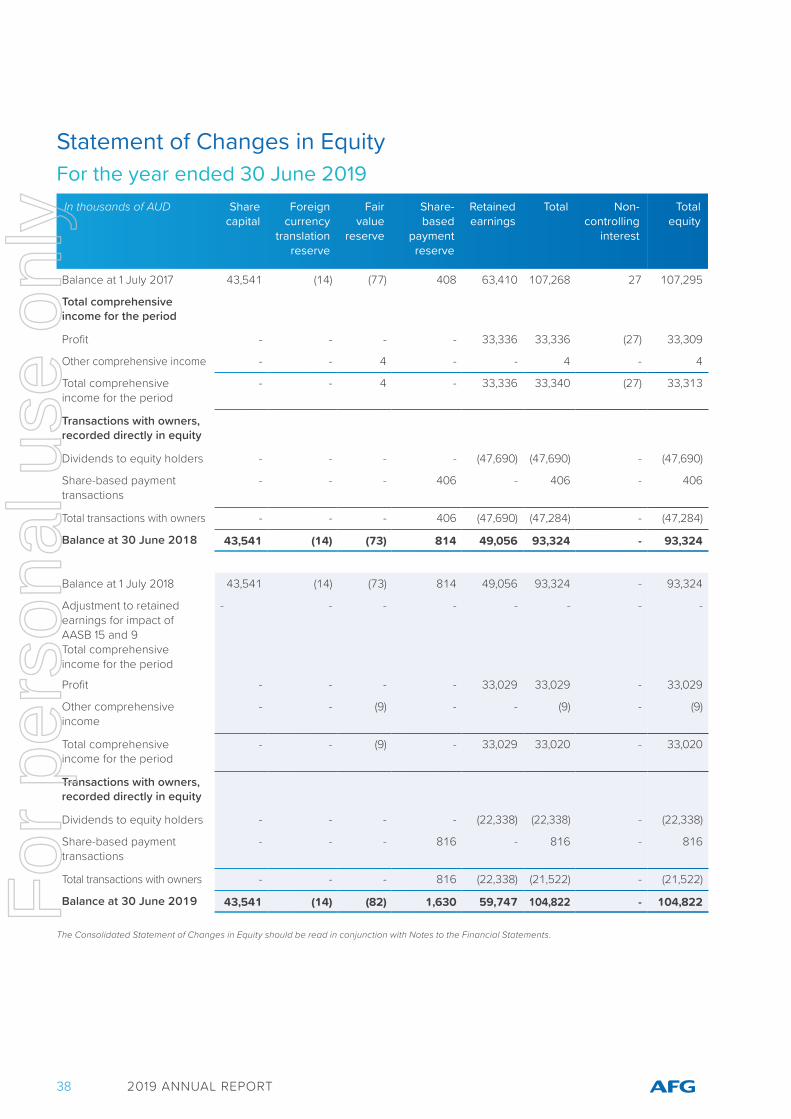
2019 ANNUAL REPORT38
Statement of Changes in EquityFor the year ended 30 June 2019
In thousands of AUD Share capital
Foreign currency
translation reserve
Fair value
reserve
Share-based
payment reserve
Retained earnings
Total Non- controlling
interest
Total equity
Balance at 1 July 2017 43,541 (14) (77) 408 63,410 107,268 27 107,295
Total comprehensive income for the period
Profit - - - - 33,336 33,336 (27) 33,309
Other comprehensive income - - 4 - - 4 - 4
Total comprehensive income for the period
- - 4 - 33,336 33,340 (27) 33,313
Transactions with owners, recorded directly in equity
Dividends to equity holders - - - - (47,690) (47,690) - (47,690)
Share-based payment transactions
- - - 406 - 406 - 406
Total transactions with owners - - - 406 (47,690) (47,284) - (47,284)
Balance at 30 June 2018 43,541 (14) (73) 814 49,056 93,324 - 93,324
Balance at 1 July 2018 43,541 (14) (73) 814 49,056 93,324 - 93,324
Adjustment to retained earnings for impact of AASB 15 and 9Total comprehensive income for the period
- - - - - - - -
Profit - - - - 33,029 33,029 - 33,029
Other comprehensive income
- - (9) - - (9) - (9)
Total comprehensive income for the period
- - (9) - 33,029 33,020 - 33,020
Transactions with owners, recorded directly in equity
Dividends to equity holders - - - - (22,338) (22,338) - (22,338)
Share-based payment transactions
- - - 816 - 816 - 816
Total transactions with owners - - - 816 (22,338) (21,522) - (21,522)
Balance at 30 June 2019 43,541 (14) (82) 1,630 59,747 104,822 - 104,822
The Consolidated Statement of Changes in Equity should be read in conjunction with Notes to the Financial Statements.
For
per
sona
l use
onl
y

2019 ANNUAL REPORT 39
Statement of Cash FlowsFor the year ended 30 June 2019
In thousands of AUD Note 2019 2018
Cash flows from operating activitiesCash receipts from customers 483,933 496,851Cash paid to suppliers and employees (463,800) (467,799)Interest received 73,137 52,313Interest paid (53,513) (36,875)Income taxes paid (11,926) (12,004)Net cash generated by operating activities 14(b) 27,831 32,486
Cash flows from investing activitiesNet interest received 2,014 2,429Acquisition of property, plant and equipment (291) (178)Investment in intangible assets (529) -Investment in Thinktank - (11,141)Contingent consideration Thinktank - (992)Decrease/(increase) in other loans and advances 270 (3,267)Loans and advances to customer borrowings (690,655) (224,763)Net cash used in investing activities (689,191) (237,912)
Cash flows used in financing activitiesProceeds from/(repayments) of warehouse facilities 509,557 (67,225)Proceeds from securitised funding facilities 182,272 284,340Decrease in loans from funders (21) (90)Dividends paid to equity holders of the parent 26(c) (22,340) (47,690)Net cash generated by financing activities 669,468 169,335
Net increase/(decrease) in cash and cash equivalents 8,108 (36,091)Cash and cash equivalents at 1 July 88,710 124,801Cash and cash equivalents at 30 June 14(a) 96,818 88,710
The Statement of Cash Flows should be read in conjunction with the Notes to the Financial Statements.
For
per
sona
l use
onl
y
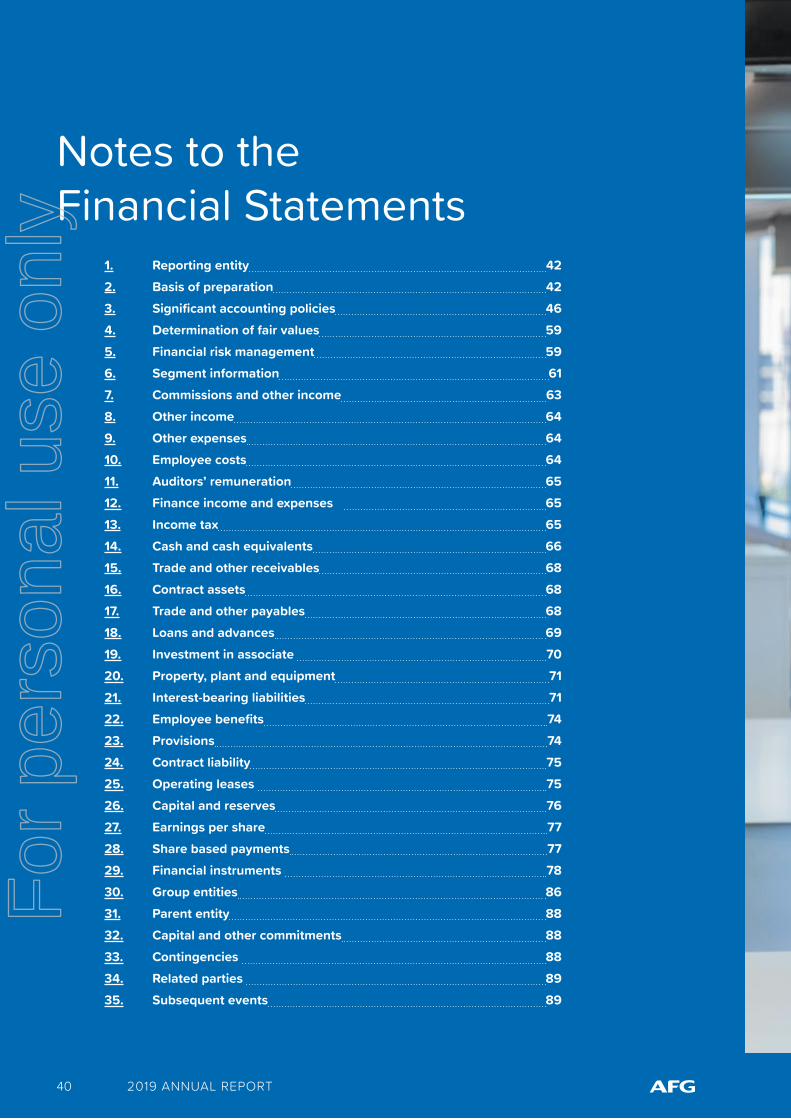
2019 ANNUAL REPORT40
1. Reporting entity 422. Basis of preparation 423. Significant accounting policies 464. Determination of fair values 595. Financial risk management 596. Segment information 617. Commissions and other income 638. Other income 649. Other expenses 6410. Employee costs 6411. Auditors’ remuneration 6512. Finance income and expenses 6513. Income tax 6514. Cash and cash equivalents 6615. Trade and other receivables 6816. Contract assets 6817. Trade and other payables 6818. Loans and advances 6919. Investment in associate 7020. Property, plant and equipment 7121. Interest-bearing liabilities 7122. Employee benefits 7423. Provisions 7424. Contract liability 7525. Operating leases 7526. Capital and reserves 7627. Earnings per share 7728. Share based payments 7729. Financial instruments 7830. Group entities 8631. Parent entity 8832. Capital and other commitments 8833. Contingencies 8834. Related parties 8935. Subsequent events 89
Notes to the Financial Statements
For
per
sona
l use
onl
y

2019 ANNUAL REPORT 41
For
per
sona
l use
onl
y

Notes to the Financial Statements (continued)
2019 ANNUAL REPORT42
1 Reporting entityThe Consolidated Financial Statements for the financial year ended 30 June 2019 comprise Australian Finance Group Limited (the ‘Company’), which is a for profit entity and a Company domiciled in Australia and its subsidiaries (together referred to as the ‘Group’) and the Group’s interest in associates and jointly controlled entities. The Group’s principal activities in the course of the financial year were mortgage origination and lending. The Company’s principal place of business is 100 Havelock Street, West Perth, Western Australia.
2 Basis of preparation
(a) Statement of complianceThe Financial Report complies with Australian Accounting Standards, and International Financial Reporting Standards (‘IFRS’) as issued by the International Accounting Standards Board (“AASB”).
The Financial Report is a general-purpose financial report, for a ‘for-profit’ entity, which has been prepared in accordance with the requirements of the Corporations Act 2001 (Cth) and Australian Accounting Standards and other authoritative pronouncements of the Australian Accounting Standards Board. The Financial Report has also been prepared on a historical cost basis, except where noted.
The Financial Statements comprise the Consolidated Financial Statements of the AFG Group of companies.
The Financial Report is presented in Australian dollars and all values are rounded to the nearest thousand dollars ($000’s) unless otherwise stated.
The Consolidated Financial Statements were authorised for issue by the Board of Directors on 23 August 2019.
(b) Basis of measurementThe consolidated financial statements have been prepared on a historical cost basis except for the following material items:
• Payables relating to trailing commission are initially measured at fair value and subsequently at amortised cost;
• Contract assets relating to trailing commission are measured at amortised cost;
• Financial instruments at fair value through profit
or loss are measured at fair value; and
• Non-traded equity investments have been designated at fair value through other comprehensive income.
(c) Functional and presentation currencyThese Consolidated Financial Statements are presented in Australian dollars (“AUD”).
The Group is of a kind referred to in ASIC Corporations Instrument 2016/191 dated 31 March 2016 and in accordance all financial information presented in Australian dollars has been rounded to the nearest thousand dollars unless otherwise stated.
(d) Use of estimates and judgementsThe preparation of Financial Statements in conformity with AASB’s requires management to make judgements, estimates and assumptions that affect the application of accounting policies and the reported amounts of assets and liabilities, income and expenses. Actual results may differ from these estimates.
Estimates and underlying assumptions are reviewed on an ongoing basis. Revisions to accounting estimates are recognised in the period in which the estimate is revised and in any future periods affected.
Information about critical judgements in applying accounting policies that have the most significant effect on the amounts recognised in the Financial Statements is included in the following notes:
• Note 3(a)(i) – Consolidation of special purpose entities
• Note 3(b)(i) – Impairment of financial assets held at amortised cost being customer loans and advances
• Note 3(i) – Expected value of trailing income contract assets
Information about assumptions and estimates that have a significant risk of resulting in a material adjustment within the next financial years are included in the following:
• Note 3(i) and 29(d) - Determination of assumptions used in forecasting and discounting future trail commissions
• Note 28 - Measurement of share-based payments
• Note 29 - Valuation of contract assets and financial instruments
For
per
sona
l use
onl
y

2019 ANNUAL REPORT 43
Notes to the Financial Statements (continued)
TaxationThe Group’s accounting for taxation requires Management’s judgement in assessing whether deferred tax assets and certain deferred tax liabilities are recognised on the Statement of Financial Position. Deferred tax assets, including those arising from un-recouped tax losses, capital losses and temporary differences, are recognised only where it is considered more likely than not that they will be recovered, which is dependent on the generation of sufficient future taxable profits.
Assumptions about the generation of future taxable profits depend on Management’s estimates of future cash flows. These depend on estimates of future income, operating costs, capital expenditure, dividends and other capital management transactions. Judgements and assumptions are also required about the application of income tax legislation. These judgments and assumptions are subject to risk uncertainty, hence there is a possibility that changes in circumstances will alter expectations, which may impact the amount of deferred tax assets and deferred tax liabilities recognised on the Statement of Financial Position and the amount of other tax losses and temporary differences not yet recognised. In such circumstances, some or all of the carrying amounts of recognised deferred tax assets and liabilities may require adjustment, resulting in a corresponding credit or charge to the Consolidated Statement of Profit or Loss and Other Comprehensive Income.
(e) Changes in accounting policies and disclosuresThe accounting policies adopted are consistent with those of the previous financial year except as follows:
(i) Adoption of new and revised Accounting Standards
New and revised Standards and amendments thereof and interpretations effective for the current year end that are relevant to the Group include:
• AASB 9 Financial Instruments;
• AASB 15 Revenue from Contracts with Customers;
• AASB 2017-1 Amendments to Australian Accounting Standards - Transfers of Investment Property, Annual Improvements 2014- 2016 Cycle and Other Amendments;
• AASB 2016-5 Amendments to Australian Accounting Standards - Classification and Measurement of Share-based Payment Transactions;
• AASB 2015-10 Amendments to Australian Accounting Standards – Effective Date of Amendments to AASB 10 and AASB 128;
• AASB 2017-7 Amendments to Australian Accounting Standards – Long-term Interests in Associates and Joint Ventures;
• AASB 2018-1 Amendments to Australian Accounting Standards – Annual Improvements 2015-2017 Cycle.
The Group has adopted all of the new and revised Standards and Interpretations, including amendments to the existing standards issued by the Australian Accounting Standards Board (the AASB) that are relevant to their operations and effective for the current reporting period. The Group has adopted AASB 9 and AASB 15 using the cumulative effect method, with the effect of initially applying this standard recognised at the date of initial application (1 July 2018). Therefore, comparative periods have not been restated. The adoption of these amendments has not resulted in any material changes to the measurement or disclosure of the amounts reported for the current or prior periods, and therefore the Group has made no adjustment to opening retained earnings on initial adoption of these standards.
AASB 15 ‘Revenue from Contracts with Customers’ A full assessment of AASB 15 on all revenue streams has been performed. As a result of the adoption of AASB 9 and AASB 15, the Group’s trail commission receivable no longer meets the definition of a financial asset, as the Group’s right to receive the trail consideration is not unconditional. This is because the Group’s entitlement to the trail commission is contingent on the customer not discharging or refinancing the loan with the lender. The trail commission receivable is therefore no longer presented in the statement of financial position within “trade and other receivables” under AASB 139 as it is now recognised and disclosed as a “contract asset” under AASB 15. Consequently, the Group applies the AASB 15 variable consideration guidance to the measurement of the contract asset. The variable consideration guidance does not have any impact on the measurement of the trail commission receivable or associated revenue at initial recognition nor subsequently as the valuation model currently used by the Group is an expected value method and complies with AASB 15. All revenue streams were considered, and no impact was noted. Refer to note 3(i) for updated accounting policy.
For
per
sona
l use
onl
y

Notes to the Financial Statements (continued)
2019 ANNUAL REPORT44
AASB 9 ‘Financial Instruments’ and the relevant amending standards introduce new requirements for the classification and measurement of financial assets and impairment of financial assets.
All recognised financial assets that are within the scope of AASB 9 are required to be measured subsequently at amortised cost or fair value on the basis of the Group’s business model for managing the financial assets and the contractual cash flow characteristics of the financial assets. On 1 July 2018 (the date of initial application of AASB 9), the business models which apply to the financial assets held by the Group were assessed and classified its financial instruments into the appropriate AASB 9 categories. Key changes include:
• the Held to Maturity (HTM) and Available for Sale (AFS) asset categories were removed;
• a new asset category for non-traded equity investments measured at Fair Value through Other Comprehensive Income (FVOCI) was introduced. The Group has elected to present subsequent changes in FV of equity investments in Other comprehensive income; and
• all other financial assets and financial liabilities will continue to be measured on the same basis as is currently adopted under AASB 139. Refer 3(b)(i).
The classification and measurement of financial liabilities has remained largely unchanged. The Group’s trade receivables and loans and advances (securitised assets) are classified and measured at amortised cost due to the contractual cashflows being solely payments of principal and interest (SPPI) and are held for collection of principal and interest.
The AASB 9 impairment requirements are based on a general approach expected credit loss model (ECL) that replaces the incurred loss model under
the current accounting standard. The Group is generally required to recognise either a 12-month’ or lifetime ECL, depending on whether there has been a significant increase in credit risk since initial recognition. The ECL model under AASB 9 applies to debt instruments accounted for at amortised cost and AASB 15 contract assets. AASB 9 has changed the Group’s current methodology for calculating the provision for doubtful debts, in particular for collective provisioning. AASB 9 also introduces a simplified approach for measuring the ECL of trade receivables and contract assets that do not contain a significant financing component, which uses a provision matrix to measure the loss allowance at an amount equal to lifetime expected loss.
The Group has applied the ‘general approach’ ECL model to its loans and advances to measure expected credit losses under AASB 9. Trade receivables are not material to the Group, no historical losses have been incurred and outstanding balance is aged within the Groups normal payment terms, therefore the simplified approach ECL for trade receivables is not material. Applying this revised methodology for calculation of impairment did not result in a material impact on the Group’s results on initial transition, however, has resulted in additional disclosures.
As the Group’s future trail commission contract assets and cash and cash equivalents are held with major financial institutions and there has been no historical instances where a loss has been incurred, therefore ECL is not material.
The following table and the accompanying notes below explain the original classification under AASB 139 and the new classification under AASB 9 for each class of the Group’s financial assets as at 1 July 2018. There has been no change in the measurement categories with each class of the Group’s financial assets remaining at amortised cost under AASB 9.
For
per
sona
l use
onl
y

2019 ANNUAL REPORT 45
Notes to the Financial Statements (continued)
As at 1 July 2018
Financial AssetsIn thousands of AUD
Original Classification under
AASB 139
New Classification under AASB 9
Original Carrying amount under AASB 139
New Carrying amount
under AASB 9
Cash and cash equivalents
Loans and receivables
Financial Asset at amortised cost
49,640 49,640
Restricted cash Loans and receivables
Financial Asset at amortised cost
39,070 39,070
Trade receivables Loans and receivables
Financial Asset at amortised cost
5,064 5,064
Future trail commissions contract asset
Loans and receivables
Contract assets (AASB 15)
805,053 805,053
Loan and advances Loans and receivables
Financial Asset at amortised cost
1,379,857 1,379,857
Other financial assets Available-for-sale Equity Investments at FVOCI
15 15
Total Financial Assets 2,278,699 2,278,699
Trail commission receivables have been reclassified from financial assets held at amortised cost to contract assets. Trail commission payables are still recognised as financial liabilities. Refer to Note 3(b) for the updated accounting policies on the Group’s non-derivative financial assets and liabilities, including impairment of the Group’s financial assets and contract assets
Hedge accounting changes arising from AASB 9 do not apply to the Group.
(ii) Accounting Standards and Interpretations Issued But Not Yet Effective
At the date of authorisation of the Financial Statements, the Standards and Interpretations that were issued but not yet effective, which have not been early adopted are listed below:
Affected Standards and Interpretations Application date* Application date for Group
AASB 16 ‘Leases’ 1 January 2019 30 June 2020AASB 2017-4 Amendments to Australian Accounting Standards – Uncertainty over Income Tax Treatments 1 January 2019 30 June 2020
*Reporting period commences on or after the application date.
For
per
sona
l use
onl
y

Notes to the Financial Statements (continued)
2019 ANNUAL REPORT46
AASB 16 Leases will replace AASB 117 Leases, Interpretation 4 Determining whether an Arrangement contains a Lease, Interpretation 115 Operating Leases – Incentives and Interpretation 127 Evaluating the Substance of Transactions Involving the Legal Form of a Lease. The Standard will provide a comprehensive model for the identification of lease arrangements and their treatment in the financial statements of both lessees and lessors.
Key requirements of AASB 16:AASB 16 distinguishes leases and service contacts on the basis of whether an identified asset is controlled by a customer. Distinctions of operating leases (off balance sheet) and finance leases (on balance sheet) are removed for lessee accounting and is replaced by a model where a right-of-use asset and a corresponding liability must be recognised for all leases by lessees (i.e. all on balance sheet) except for short-term leases or leases of low value assets.
The right of use asset is initially measure at cost and subsequently measure at cost (subject to certain exceptions) less accumulated depreciation and impairment losses, adjusted for any remeasurement of the lease liability. The lease liability is initially measured at the present value of the lease payments that are not paid at that date. Subsequently, the lease liability is adjusted for interest and lease payments, as well as the impact of lease modifications, amongst others. Furthermore, the classification of cash flows will also be affected as operating lease payments under AASB 117 are presented as operating cash flows; whereas under the AASB 16 model, the lease payments will be split into a principal and an interest portion which will be presented as financing and operating cash flows respectively.
As at the reporting date, the Group has non-cancellable operating lease commitments of $9,175k, refer to Note 25.
These operating leases will result in the recognition of right of use assets and corresponding liabilities upon initial transition of AASB 16. The Group has performed a full assessment which resulted in no significant net impact to the Group’s results. Additional disclosures will be prepared under the new standard.
3 Significant accounting policiesExcept as expressly described in the Notes to the Financial Statements, the accounting policies set out below have been applied consistently to all periods presented in these Consolidated Financial Statements and have been applied consistently by all Group entities.
(a) Basis of consolidation The Consolidated Financial Statements incorporate the Financial Statements of the Company and entities (including structured entities) controlled by the Company and its subsidiaries. Control is achieved when the Company:
• Has power over the investee
• Is exposed, or has rights, to variable returns from its involvement with the investee
• Has the ability to use its power to affect its returns
When the Group has less than a majority of the voting rights or similar rights of an investee, the Group considers all relevant facts and circumstances in assessing whether it has power over an investee, including:
• The contractual arrangement with the other vote holders of the investee
• Right arising from other contractual arrangements
• The Group’s voting rights and potential voting rights
Consolidation of a subsidiary begins when the Group obtains control over the subsidiary and ceases when the Group loses control of the subsidiary. Specifically, income and expenses of a subsidiary acquired or disposed of during the year are included in the Consolidated Statement of Profit or Loss and Other Comprehensive Income from the date the Company gains control until the date when the company ceases to control the subsidiary. Subsidiaries are entities controlled by the Group.
When necessary, adjustments are made to the Financial Statements of subsidiaries to bring their accounting policies in line with the Group’s accounting policies.
Non-controlling interest is determined as the non-controlling interest’s proportion of the fair value of the recognised identifiable assets, liabilities and contingent liabilities at the date of the original acquisition. Post-acquisition of non-controlling interest in the identifiable assets and liabilities of a subsidiary comprises the non-controlling interest’s share of movements in equity since the date of the original controlling acquisition, after eliminating intra-group transactions.
Profit or loss and each component of other comprehensive income are attributed to the owners of the Company and to the non-controlling interests. Total comprehensive income of subsidiaries is
For
per
sona
l use
onl
y

2019 ANNUAL REPORT 47
Notes to the Financial Statements (continued)
attributed to the owners of the Company and to the non-controlling interests even if this results in the non-controlling interests having a deficit balance.
All intra-group balances, and any unrealised income and expenses arising from intra-group transactions, are eliminated in preparing the Consolidated Financial Statements. Unrealised gains arising from transactions with equity accounted investees are eliminated against the investment to the extent of the Group’s interest in the investee. Unrealised losses are eliminated in the same way as unrealised gains, but only to the extent that there is no evidence of impairment.
Changes in the Group’s ownership interests in subsidiaries that do not result in the Group losing control over the subsidiaries are accounted for as equity transactions. The carrying amounts of the Group’s interests and the non-controlling interests are adjusted to reflect the changes in their relative interests in the subsidiaries. Any difference between the amount by which the non-controlling interests are adjusted and the fair values of the consideration paid or received is recognised directly in equity and attributed to the owners of the Company.
When the Group loses control of a subsidiary, a gain or loss is recognised in the profit or loss and is calculated as the difference between (i) the aggregate of the fair value of the consideration received and the fair value of any retained interest and (ii) the previous carrying amount of the assets, and liabilities of the subsidiary and any non-controlling interests. All the amounts previously recognised in other comprehensive income in relation to that subsidiary are accounted for as if the Group has directly disposed of the related assets and liabilities of the subsidiary. The fair value of any investment retained in the former subsidiary at the date when control is lost is regarded as the fair value on initial recognition for subsequent accounting under AASB 9, when applicable, the cost on initial recognition of an investment in an associate or a joint venture.
(i) Special purpose entities
Special purpose entities are those entities over which the group has no ownership interest but in effect the substance of the relationship is such that the Group controls the entity so as to obtain the majority of the benefits from its operation.
The Group has established the following special purpose entities to support the specific funding needs of the Group’s securitisation programme:
• AFG 2010-1 Trust and its Series (SPE) to conduct securitisation activities funded by
short term warehouse facilities provided by reputable lenders
• AFG 2016-1 Trust, AFG 2017-1 Trust, AFG 2018-1 Trust and AFG 2019-1 Trust (SPE-RMBS) to hold securitised assets and issue Residential Mortgage Backed Securities (RMBS)
• AFG 2010-2 Pty Ltd to hold and fund investments in some of our Residential Mortgage Backed Securities (RMBS) to meet risk retention requirements
The special purpose entities meet the criteria of being controlled entities under AASB 10 – Consolidated Financial Statements.
The elements indicating control include, but are not limited to, the below:
• The Group has existing rights that gives it the ability to direct relevant activities that significantly affect the special purpose entities’ returns
• The Group is exposed, and has rights, to variable returns from its involvement with the special purpose entities
• The Group has all the residual interest in the special purpose entities
• Fees received by the Group from the special purpose entities vary on the performance, or non-performance, of the securitised assets
• The Group has the ability to direct decision making accompanied by the objective of obtaining benefits from the special purpose entities’ activities
The Group continues to retain control over the financial assets, for which some, but not substantially all, the risks and rewards have been transferred to the warehouse facilities providers and the bondholders. The securitised assets and the corresponding liabilities are recorded in the Statement of Financial Position and the interest earned and paid recognised in the Consolidated Statement of Profit or Loss and Other Comprehensive Income.
(ii) Investments in associates (equity accounted investee)
Associates are those entities in which the Group has significant influence, but not control, over the financial and operating policies. Investments in associates are accounted for using the equity method (equity accounted investee) and are initially recognised at cost. The cost of the investment includes transaction costs (see Note 19).
For
per
sona
l use
onl
y

Notes to the Financial Statements (continued)
2019 ANNUAL REPORT48
The Consolidated Financial Statements include the Group’s share of the profit or loss and other comprehensive income of the investee, after adjustments to align the accounting policies with those of the Group, from the date that significant influence commences until the date that significant influence ceases.
(b) Financial instruments
(i) Financial assets
Initial recognition and measurement With the exception of trade receivables that do not contain a significant financing component, the Group initially measures a financial asset at its fair value, plus in the case of a financial asset not at fair value through profit or loss, transaction costs that are directly attributable to the acquisition of the financial asset. Transaction costs of financial assets carried at fair value through profit or loss are expensed in profit or loss. Trade receivables that do not contain a significant financing component are initially measured at the transaction price determined under AASB 15 (see Note 3(i) Revenue from contracts with customers).
Subsequent measurement
Financial assets at amortised costA financial asset is measured at amortised cost if it meets the following conditions: • it is held within a business model whose
objective is to hold assets to collect contractual cash flows;
• its contractual terms give rise on specified dates to cash flows that are solely payments of principal and interest (SPPI) on the principal amount outstanding; and
• it is not designated at Fair Value through Profit and Loss (FVPL).
The amortised cost of a financial asset is:• the amount at which the financial asset is
measured at initial recognition;
• minus the principal repayments;
• plus the cumulative amortisation using the effective interest method of any difference between that initial amount and the maturity amount; and
• adjusted for any loss allowance.
Interest income, foreign exchange gains and losses and impairment are recognised in profit and loss.
Equity investments at FVOCIA financial asset is measured at FVOCI if the Group has made an irrevocable election to classify and measure financial assets as FVOCI at initial recognition on the basis that they are held for strategic purposes. Gains and losses relating to these financial assets will be recognised in other comprehensive income. Dividends from such investments are recognised as income in profit or loss when the Group has the right to receive payments unless the dividend clearly represents a recovery of part of the cost of the investment. The accumulated fair value reserve related to these investments will never be reclassified to profit or loss.
Derecognition of financial assets The Group derecognises a financial asset when the contractual rights to the cash flows from the asset expire, or when it transfers the financial asset and substantially all the risks and rewards of ownership of the asset to another entity. If the Group neither transfers nor retains substantially all the risks and rewards of ownership and continues to control the transferred asset, the Group recognises its retained interest in the asset and an associated liability for amounts it may have to pay.
(ii) Impairment
AASB 9 replaces the ‘incurred loss’ model in AASB 139 with an Expected Credit Loss (“ECL”) model. This applies to financial assets and contract assets measured at amortised cost and debt investments at FVOCI, but not to investments in equity instruments.
ECLs are a probability-weighted estimate of credit losses. Credit losses are measured as the present value of all cash shortfalls (i.e. the difference between the cash flows due to the entity in accordance with the contract and the cash flows that the Group expects to receive). It consists of 3 components:
a) probability of default (PD): represents the possibility of a default over the next 12 months and remaining lifetime of the financial asset;
b) a loss given default (LGD): expected loss if a default occurs, taking into consideration the mitigating effect of collateral assets and time value of money;
c) exposure at default (EAD): the expected loss when a default takes place.
For
per
sona
l use
onl
y

2019 ANNUAL REPORT 49
Notes to the Financial Statements (continued)
The Group measures the loss allowance for a financial instrument at an amount equal to the lifetime ECL if the credit risk on that financial instrument has increased significantly since initial recognition, or if the financial instrument is a purchased or originated credit-impaired financial asset. If the credit risk on a financial instrument has not increased significantly since initial recognition (except for a purchased or originated credit-impaired financial asset), the Group measures the loss allowance for that financial instrument at an amount equal to a 12-month ECL.
The Group has reviewed and assessed the Group’s existing financial assets for impairment in accordance with the requirements of AASB 9 to determine the credit risk of the respective items at the date they were initially recognised, and compared that to the credit risk as at 1 July 2018. The impact to the Group was insignificant and therefore no adjustment to opening retained earnings was required. The Group has assessed the loans and advances (securitised assets) and recognised the ECL for these assets.
Impairment of Loans and AdvancesThe Group has applied the three-stage model based on the change in credit risk since initial recognition to determine the loss allowances of its loans and advances.
Stage 1: 12-month ECLAt initial recognition, ECL is collectively assessed and measured by classes of financial assets with the same level of credit risk based on the PD within the next 12 months and LGDs with consideration to forward looking economic indicators. Loss allowances for financial assets measured at amortised cost are deducted from the gross carrying amount of the assets.
Stage 2: Lifetime ECLWhen the Group determines that there has been a significant increase in credit risk since initial recognition but not considered to be credit impaired, the Group recognises a lifetime ECL calculated as a product of the PD for the remaining lifetime of the financial asset and LGD, with consideration to forward looking economic indicators. Similar to Stage 1, loss allowances for financial assets measured at amortised cost are deducted from the gross carrying amount of the assets.
Stage 3: Lifetime ECL - credit impairedAt each reporting date, the Group assesses whether financial assets carried at amortised cost are credit impaired. A financial asset is ‘credit-impaired’ when one or more events that have a detrimental impact on the estimated future cash flows of the financial asset have occurred. For financial assets that have been assessed as credit impaired, a lifetime ECL is recognised as a collective or specific provision, and interest revenue is calculated in subsequent reporting periods by applying the effective interest rate to the amortised cost instead of the carrying amount.
When determining whether the credit risk of a financial asset has increased significantly since initial recognition and when estimating ECLs, the Group considers reasonable and supportable information that is relevant and available without undue cost or effort. This includes both quantitative and qualitative information and analysis, based on the Group’s historical experience and informed credit assessment including forward-looking information.
As part of the forward-looking assessment, the Group has considered:
• actual or expected adverse changes in business, financial or economic conditions that are expected to cause a significant change to the borrower’s ability to meet its obligations such as market interest rates, unemployment rates or property growth rates are incorporated in the model;
• external (if available) credit ratings;
• significant changes in the value of the collateral supporting the obligation or in the quality of third-party guarantees or credit enhancements;
• significant changes in the quality of the underwriter;
• S&P assumptions such as first homebuyer, occupancy, employment type, geographical concentration, principal and interest and interest only.
A summary of the assumptions underpinning the Groups ECL model is as follows:F
or p
erso
nal u
se o
nly

Notes to the Financial Statements (continued)
2019 ANNUAL REPORT50
Category Definition of Category Basis for recognition of ECL provision
Performing Customers have a low risk of default and a strong capacity to meet contractual cash flows 12 month expected losses.
DoubtfulLoans for which there is a significant increase in credit risk; as significant increase in credit risk is presumed if interest and/or principal repayments are 30 days past due
Lifetime expected losses
In default Interest and/or principal repayments are 90 days past due Lifetime expected losses
Write off Interest and/or principal repayments are past due and there is no reasonable expectation of recovery Asset is written off
The group assumes the credit risk on a financial instrument has not increased significantly since initial recognition if the financial instrument is determined to have a low credit risk at the reporting date. A financial instrument is determined to have a low credit risk if:
1) the financial instrument has a low risk of default;
2) the debtor has a strong capacity to meets its contractual cash flow obligation in the near term; and
3) adverse changes in economic and business conditions in the longer term may, but will not necessarily, reduce the ability of the borrower to fulfil its contractual cash flow obligations.
Impairment of Contract Assets and Cash and Cash EquivalentsThe Group’s contract assets relate to trail commission receivable mainly from high credit quality financial institutions who are the members of AFG’s lender panel (Refer to Note 5(a)). There have been no historical instances where a loss has been incurred, including through the global financial crisis and therefore ECL would not be material. There have been no historical instances where a loss has been incurred and therefore any ECL has been determined not material.
Impairment of trade receivablesTrade and other receivables from other customers are rare given the nature of the Group’s business. The Group has assessed its history of losses as well as performing a forward-looking assessment, both of which have not resulted in any historical or expected material forward looking losses. Group does not require collateral in respect of trade and other receivable (refer to Note 5(a)).
Write off policyThe Group writes off a financial asset when there is information indicating that the debtor is in severe financial difficulty and there is no realistic prospect of recovery, e.g. when the debtor has been placed under liquidation or has entered into bankruptcy proceedings. Financial assets written off may still be subject to enforcement activities under the Groups recovery procedures, taking into account legal advice where appropriate. Any recoveries made are recognised in profit or loss.
Trade receivables are written off when there is no reasonable expectation of recovery. Indicators that there is no reasonable expectation of recovery include, amongst others, the failure of a debtor to engage in a repayment plan with the Group, and a failure to make contractual payments.
(iii) Financial Liabilities
Initial recognition and measurement Financial liabilities within the scope of AASB 9 are classified as financial liabilities at fair value through profit or loss, or loans and borrowings. The Group determines the classification of its financial liabilities at initial recognition. All financial liabilities are recognised initially at fair value, in the case of loans and borrowings, net of directly attributable transactions.
For
per
sona
l use
onl
y

2019 ANNUAL REPORT 51
Notes to the Financial Statements (continued)
The Group initially recognises financial liabilities (including liabilities designated at fair value through profit or loss) on the trade date at which the Group becomes a party to the contractual provisions of the instrument. The Group derecognises a financial liability when its contractual obligations are discharged, cancelled or expired.
The Group’s non-derivative financial liabilities include interest-bearing liabilities and trade and other payables.
Subsequent measurement Subsequent to initial recognition, interest-bearing liabilities are measured at amortised cost using the effective interest rate method.
DerecognitionA financial liability is derecognised when the obligation under the liability is discharged or cancelled or expires. When an existing financial liability is replaced by another from the same lender on substantially different terms, or the terms of an existing liability are substantially modified, such an exchange or modification is treated as the derecognition of the original liability and the recognition of a new liability. The difference in respect of the carrying amounts is recognised in the income statement.
(iv) Amortised cost and effective interest method
The effective interest method is a method of calculating the amortised cost of a debt instrument and of allocating interest income over the relevant period. For financial assets other than purchased or originated creditimpaired financial assets (i.e. assets that are creditimpaired on initial recognition), the effective interest rate is the rate that exactly discounts estimated future cash receipts (including all fees and points paid or received that form an integral part of the effective interest rate, transaction costs and other premiums or discounts) excluding expected credit losses, through the expected life of the debt instrument, or, where appropriate, a shorter period, to the gross carrying amount of the debt instrument on initial recognition. For purchased or originated creditimpaired financial assets, a creditadjusted effective interest rate is calculated by discounting the estimated future cash flows, including expected credit losses, to the amortised cost of the debt instrument on initial recognition.
The amortised cost of a financial asset is the amount at which the financial asset is measured at initial
recognition minus the principal repayments, plus the cumulative amortisation using the effective interest method of any difference between that initial amount and the maturity amount, adjusted for any loss allowance. The gross carrying amount of a financial asset is the amortised cost of a financial asset before adjusting for any loss allowance.
(v) Share capital
Ordinary sharesOrdinary shares are classified as equity. Incremental costs directly attributable to the issue of ordinary shares and share options are recognised as a deduction from equity at the time of issuance, net of any related income tax benefit.
Repurchase of share capitalWhen share capital recognised as equity is repurchased the amount of consideration paid, including directly attributable costs, is recognised as a reduction in equity.
DividendsDividends are recognised as a liability in the period in which they are declared.
(c) Cash and short-term depositsCash and short-term deposits in the Consolidated Statement of Financial Position comprise cash at bank and on hand, short term deposits with a maturity of three months or less, as well as restricted cash such as proceeds and collections in the special purpose entities’ accounts which are not available to the shareholders.
For the purpose of the Statement of Cash Flows, cash and cash equivalents consist of the cash and term deposits as defined above, net of outstanding bank overdrafts.
(d) Property, plant and equipment
(i) Recognition and measurement
Items of property, plant and equipment are measured at cost less accumulated depreciation (see (iii) below) and impairment losses (see accounting policy 3(f)).
Purchased software that is integral to the functionality of the related equipment is capitalised as part of that equipment. Borrowing costs related to the acquisition or construction of qualifying assets are capitalised as part of the cost of the assets.
For
per
sona
l use
onl
y

Notes to the Financial Statements (continued)
2019 ANNUAL REPORT52
Where parts of an item of property, plant and equipment have different useful lives, they are accounted for separately.
Gains and losses on disposal of an item of property, plant and equipment are determined by comparing the proceeds from disposal with the carrying amount and are recognised net within “other income” in profit or loss.
(ii) Subsequent costs
The cost of replacing part of an item of property, plant and equipment is recognised in the carrying amount of the item if it is probable that the future economic benefits embodied within the part will flow to the Group and its costs can be measured reliably. The costs of the day-to-day servicing of property, plant and equipment are recognised in profit or loss as incurred.
(iii) Depreciation
Depreciation is recognised in profit or loss on a straight-line basis over the estimated useful lives of each part of an item of property, plant and equipment. Leased assets are depreciated over the shorter of the lease term and their useful life unless it is reasonably certain that the Group will obtain ownership by the end of the lease term. Land is not depreciated.
The estimated useful lives for the current and comparative periods are as follows:
a) plant and equipment 2 - 5 years
b) fixtures and fittings 5 - 20 years
Depreciation methods, useful lives and residual values are reassessed at each reporting date.
(e) Intangibles
(i) Software development costs
Software development costs are recognised as an expense when incurred, except to the extent that such costs, together with previous unamortised deferred costs in relation to that project, are expected beyond reasonable doubt, to provide future economic benefits. Any deferred development costs are amortised over the estimated useful lives of the relevant assets.
The unamortised balance of software development costs deferred in previous periods is reviewed regularly and at each reporting date, to ensure the criterion for deferral continues to be met. Where such costs are considered to no longer provide future
economic benefits they are written-off as an expense in the profit or loss.
(ii) Other intangible assets
Other intangible assets that are acquired by the Group, which have finite useful lives, are measured at cost less accumulated amortisation (see above (i)) and impairment losses (see accounting policy 3(f)).
(iii) Subsequent expenditure
Subsequent expenditure is capitalised only when it increases the future economic benefits embodied in the specific asset to which it relates. All other expenditure is recognised in profit or loss when incurred.
(iv) Amortisation
Amortisation is recognised in profit or loss on a straight-line basis over the estimated useful lives of intangible assets from the date that they are available for use. The estimated useful lives for the current and comparative periods are as follows:
a) Capitalised software development costs 2.5 - 5 years
b) Software licenses 2.5 - 5 years
(f) Impairment of non-financial assets The carrying amounts of the Group’s non-financial assets, other than deferred tax assets, are reviewed at each reporting date to determine whether there is any indication of impairment. If any such indication exists then the asset’s recoverable amount is estimated.
For the purpose of impairment testing, assets are grouped together into the smallest group of assets that generates cash inflows from continuing use that are largely independent of the cash inflows of other assets or groups of assets (the “cash-generating unit”).
An impairment loss is recognised if the carrying amount of an asset or its cash-generating unit exceeds its recoverable amount. A cash-generating unit is the smallest identifiable asset group that generates cash flows that largely are independent from other assets and groups.
The recoverable amount of an asset or cash-generating unit is the greater of its value in use and its fair value less costs to sell. In assessing value in use, the estimated future cash flows are discounted to their present value using a pre-tax discount rate that
For
per
sona
l use
onl
y

2019 ANNUAL REPORT 53
Notes to the Financial Statements (continued)
reflects current market assessments of the time value of money and the risks specific to the asset.
Impairment losses recognised in prior periods are assessed at each reporting date for any indications that the loss has decreased or no longer exists. An impairment loss is reversed if there has been a change in the estimates that have been used to determine the recoverable amount. An impairment loss is reversed only to the extent that the assets carrying amount does not exceed the carrying amount that would have been determined, net of depreciation or amortisation, if no impairment loss has been recognised.
(g) Employee benefits
(i) Long-term employee benefits
The Group’s liability in respect of long-term employee benefits is the amount of future benefits that employees have earned in return for their service in the current and prior periods; that benefit is discounted to determine its present value, and the fair value of any related assets is deducted. Consideration is given to the expected future wage and salary levels, and periods of service. The discount rate is the yield at the reporting date on government bonds that have maturity dates approximating the terms of the Group’s obligations and that are denominated in the same currency as the Group’s functional currency.
(ii) Short-term benefits
Short-term employee benefits are measured on an undiscounted basis and are expensed as the related service is provided.
A liability is recognised for employee benefits such as wages, salaries, annual leave and sick leave if the Group has present obligations resulting from employees’ services provided to reporting date.
A provision is recognised for the amount expected to be paid under short-term and long-term cash bonus or profit-sharing plans if the Group has a present legal or constructive obligation to pay this amount as a result of past service provided by the employee and the obligation can be estimated reliably.
(iii) Share-based payment transactions
The grant date fair value of options and shares granted to employees is recognised as an employee expense, with a corresponding increase in equity over the period in which the employees become unconditionally entitled to the options or shares.
The amount recognised as an expense is adjusted to reflect the actual number of options or shares that vested, except for those that fail to vest due to market conditions not being met.
(h) ProvisionsA provision is recognised if, as a result of a past event, the Group has a present legal or constructive obligation that can be estimated reliably, and it is probable that an outflow of economic benefits will be required to settle the obligation. Provisions are determined by discounting expected future cash flows at a pre-tax discount rate that reflects current market assessments of the time value of money and the risks specific to the liability.
The unwinding of the discount is recognised as a finance cost.
Provision for clawbacks on settlements within the period are raised on both commission received and commission payable. Clawbacks will be re-measured each reporting period.
(i) Revenue from contracts with CustomersThe Group adopted AASB 15 Revenue from contracts with customers 1 July 2018. The standard has introduced a single principle based five step recognition measurement model for revenue recognition:
1) Identifying the contract with a customer;
2) Identifying the separate performance obligations;
3) Determining the transaction price;
4) Allocating the transaction price to the performance obligations;
5) Recognising revenue when or as performance obligations are satisfied
Revenue is recognised either at a point in time or over time, when (or as) the Group satisfies performance obligations by transferring the promised goods or services to its customers. The Group recognises contract liabilities (see note 24) for consideration received in respect of unsatisfied performance obligations and reports these amounts as other liabilities in the statement of financial position. Similarly, if the Group satisfies a performance obligation before it receives the consideration, the Group recognises either a contract asset or a receivable in its statement of financial position, depending on whether something other than the passage of time is required before the consideration is due.
For
per
sona
l use
onl
y

Notes to the Financial Statements (continued)
2019 ANNUAL REPORT54
Under AASB 15, revenue is recognised when the Group satisfies performance obligations by transferring the promised services to its customers. Determining the timing of the transfer of control - at a point in time or over time - requires judgement. Below is a summary of the major services provided and the Group’s accounting policy on recognition as a result of adopting AASB 15.
The Group’s significant income streams under AASB 15 include:
• Commissions – origination and trail commissions and associated interest income
• Other income – sponsorship income and fees for services.
The Group often enters into transactions that will give rise to different streams of revenue. In all cases, the total transaction price for a contract is allocated amongst the various performance obligations based on their relative stand-alone selling prices. The transaction price for a contract excludes any amounts collected on behalf of third parties.
Commissions – origination and trail commissionsThe Group provides loan origination services and receives origination commission on the settlement of loans. Additionally, the lender normally pays a trailing commission over the life of the loan.
Commission revenue is recognised as follows: • Origination commissions: Origination
commissions are recognised upon the loans being settled and receipt of commission net of clawbacks. Commissions may be clawed back by lenders in accordance with individual contracts. These potential clawbacks are estimated and recognised at the same time as origination commission and included in origination commission revenue.
• Trailing commissions: The Group receives trail commissions from lenders on settled loans over the life of the loan based on the loan balance outstanding. The Group also makes trail commission payments to brokers when trail commission is received from lenders. The future trail commission receivable is recognised upfront as a contract asset. Trailing commissions include revenue on residential, commercial and AFGHL white label trail books.
• Interest income: This is the financing component of the trail commission contract asset which brings into consideration the time value of money. Recognised in line with effective interest rate in line with AASB 9.
Trail commissions – significant estimates and judgements
Given AASB 15 has been adopted at the same time as AASB 9, trail commission receivables are determined to be contract assets under AASB 15. Consequently, the Group applies the AASB 15 variable consideration guidance to the measurement of the contract asset.
On initial recognition, the Group recognises a contract asset which represents management’s estimate of the variable consideration to be received. The Group uses the ‘expected value’ method of estimating variable consideration which requires significant judgement. A corresponding expense and payable is also recognised, initially measured at fair value being the net present value of expected future trailing commission payable to brokers.
The value of trail commission receivable from lenders and the corresponding payable to brokers is determined by using a discounted cash flow valuation. These calculations require the use of assumptions which are determined by management using a variety of inputs including external actuarial analysis of historical information. Key assumptions underlying the calculation include the average loan life, discount rate and the percentage paid to brokers. Refer to Note 29(d) for details on these key assumptions.
Other income Sponsorship income is the income received in advance from sponsorship payment arrangements with Lenders. The income is brought to account once the sponsored event has occurred.
Fees for services relates to providing marketing, compliance and administration services to the brokers. This revenue is recognised with reference to the stage of completion for the contract of services.
Impact of application of AASB 15 Revenue from Contracts with Customers
Determining performance obligations are satisfied (over time or a point in time) requires judgement. The below table illustrates a summary of the impact of AASB 15 on the Group’s significant revenue from contracts with customers.
Payment for upfront commissions and fees for services are all typically due within 30 days of satisfying performance obligations.
For
per
sona
l use
onl
y

2019 ANNUAL REPORT 55
Notes to the Financial Statements (continued)
“Point in time” or “Over time”
Types of Service
Nature and timing of satisfaction of performance obligations
Revenue recognition policy under AASB 118
Revenue recognition policy under AASB 15
Nature of change in accounting policy
Point in time
Commissions – origination commissions
At the point in time when the loan is settled with the lender.
Origination commissions received by the Group are recognised as revenue upon settlement of the loan, net of estimated clawbacks.
The Group recognises revenue at the point in time when the loan is settled with the lender. The transaction price is adjusted for any expected clawbacks.
AASB 15 did not have a significant impact on the Group’s accounting policies.
Point in time
Commissions – trail commissions
At the point in time when the loan is settled with the lender.
Trailing commissions revenue has historically been recognised under AASB 139.
On initial recognition at settlement, trailing commission revenue and the related receivable are recognised at fair value being the net present value of the expected future trailing commissions to be received.
The carrying amounts of the receivable and payable are adjusted to reflect actual and revised estimated cash flows by recalculating the net present value of the estimated future cash flows at the original effective interest rate.
The Group recognises this revenue at the point in time, when the loan is settled with the lender.
On initial recognition a contract asset is recognised, representing managements estimate of the variable consideration to be received.
The Group uses the “expected value” method of estimating the variable consideration, which includes significant financing component, by recalculating the net present value of the estimated future cash flows at the original effective interest rate.
The carrying amounts of the receivable and payable are the same under both revenue standards.
With the introduction of AASB 15, trailing commission is now accounted for under the revenue standard, instead of the financial instruments standard.
However, no change occurs from AASB 139 to AASB 15 as the approach to estimating the expected value of the trailing commission is in line with the approach under AASB 139.
For
per
sona
l use
onl
y

Notes to the Financial Statements (continued)
2019 ANNUAL REPORT56
“Point in time” or “Over time”
Types of Service
Nature and timing of satisfaction of performance obligations
Revenue recognition policy under AASB 118
Revenue recognition policy under AASB 15
Nature of change in accounting policy
Over time
Interest income – discount unwind on the NPV trail commission contract asset
Revenue arising from the discount rate applied to the trail commission contract asset.
Revenue is recognised at the time of valuation of the trail commission contract asset.
Interest income has changed from the effective interest rate on financial assets under AASB 139 to the financing component of the trailing commission contract asset under AASB 15. There is no change in timing of recognising the revenue, this remains over time.
AASB 15 did not have a significant impact on the Group’s accounting policies.
Point in time
Other income – sponsorship income
The performance obligation is that a sponsored event has occurred.
Revenue is recognised as the events are undertaken.
Funds are received in advance and initially recognised as contract liability (deferred income). Revenue is recognised at a point in time when the sponsored event has occurred.
AASB 15 did not have a significant impact on the Group’s accounting policies.
Over time
Other income – Fees for services
The performance obligation is the provision of services to brokers, including marketing, compliance and administration services. The income is recognised with reference to the stage of completion for the contract of the services.
Revenue is recognised as the services are performed.
Revenue is recognised with reference to the stage of completion for the contract of services.
AASB 15 did not have a significant impact on the Group’s accounting policies.
In summary, the Group notes no adjustments are required to the amounts recognised in the balance sheet at the date of initial application, 1 July 2018.
For
per
sona
l use
onl
y

2019 ANNUAL REPORT 57
Notes to the Financial Statements (continued)
(j) Lease paymentsThe determination of whether an arrangement is, or contains, a lease is based on the substance of the arrangement at inception date, whether fulfilment of the arrangement is dependent on the use of a specific asset or assets or the arrangement conveys a right to use the asset, even if that right is not explicitly specified in an arrangement.
Payments made under operating leases are recognised in the profit or loss on a straight-line basis over the term of the lease. Lease incentives received are recognised as an integral part of the total lease expense, over the term of the lease.
Minimum lease payments made under finance leases are apportioned between the finance expense and the reduction of the outstanding liability. The finance expense is allocated to each period during the lease term so as to produce a constant periodic rate of interest on the remaining balance of the liability.
(k) Finance income and expensesFinance income comprises interest income on funds invested, changes in the fair value of financial assets at fair value through profit or loss and foreign currency gains. Interest income is recognised as it accrues, using the effective interest method.
Finance expenses comprise interest payable on borrowings and changes in fair value of financial assets at fair value through profit or loss.
(l) Securitisation interest income and expenseInterest income is the key component of this revenue stream and it is recognised as it accrues using the effective interest method in accordance with AASB 9. The rate at which revenue is recognised is referred to as the effective interest rate and is equivalent to the rate that effectively discounts estimated future cash flows throughout the estimated life to the net carrying value of the loan. Acquisition costs are also spread across the estimated life of the loan.
Interest income is recognised using the effective interest method for debt instruments measured subsequently at amortised cost and at fair value through other comprehensive income.
For financial assets other than purchased or originated creditimpaired financial assets, interest income is calculated by applying the effective interest rate to the gross carrying amount of a financial asset, except for financial assets that have subsequently become credit-impaired.
For financial assets that have subsequently become credit impaired, interest income is recognised by applying the effective interest rate to the amortised cost of the financial asset. If, in subsequent reporting periods, the credit risk on the creditimpaired financial instrument improves so that the financial asset is no longer creditimpaired, interest income is recognised by applying the effective interest rate to the gross carrying amount of the financial asset.
For purchased or originated creditimpaired financial assets, the Group recognises interest income by applying the creditadjusted effective interest rate to the amortised cost of the financial asset from initial recognition. The calculation does not revert to the gross basis even if the credit risk of the financial asset subsequently improves so that the financial asset is no longer creditimpaired.
Securitisation expense comprises interest payable on borrowings and changes in fair value of financial assets at fair value through profit or loss.
(m) Income tax expenseCurrent tax assets and liabilities for the current and prior periods are measured at the amount expected to be recovered from or paid to the taxation authorities. The tax rates and tax laws used to compute the amount are those that are enacted or substantively enacted by the balance sheet date.
Deferred income tax is generally provided on all temporary differences at the balance sheet date between the tax bases of assets and liabilities and their carrying amounts for financial reporting purposes.
Deferred tax assets are recognised where management consider that it is probable that future taxable profits will be available to utilise those temporary differences. The carrying amount of deferred income tax assets is reviewed at each balance sheet date and reduced to the extent that it is no longer probable that sufficient taxable profit will be available to allow all or part of the deferred income tax asset to be utilised.
Unrecognised deferred income tax assets are reassessed at each balance sheet date and are recognised to the extent that it has become probable that future taxable profit will allow the deferred tax asset to be recovered.
Deferred income tax assets and liabilities are measured at the tax rates that are expected to apply to the year when the asset is realised, or the liability
For
per
sona
l use
onl
y

Notes to the Financial Statements (continued)
2019 ANNUAL REPORT58
is settled, based on tax rates (and tax laws) that have been enacted or substantively enacted at the balance sheet date.
Income taxes relating to items recognised directly in equity are recognised in equity and not in the profit or loss.
(i) Tax consolidation
The Company and its wholly-owned Australian resident entities have formed a tax consolidated group with effect from 1 July 2004 and are therefore taxed as a single entity from that date. The head entity within the tax-consolidated group is the Company.
Current tax expenses, deferred tax liabilities and deferred tax assets arising from temporary differences of the members of the tax-consolidated group are recognised in the separate Financial Statements of the members of the tax-consolidated group using the ‘group allocation’ approach by reference to the carrying amounts of assets and liabilities in the separate Financial Statements of each entity and the tax values applying under tax consolidation.
Any current tax liabilities (or assets) and deferred tax assets arising from unused tax losses of the subsidiaries is assumed by the head entity in the tax-consolidated group and are recognised by the Company as amounts payable (receivable) to (from) other entities in the tax-consolidated group in conjunction with any tax funding arrangement amounts (refer below). Any difference between these amounts is recognised by the Company as an equity contribution or distribution.
The Company recognises deferred tax assets arising from unused tax losses of the tax-consolidated group to the extent that it is probable that future taxable profits of the tax-consolidated group will be available against which the asset can be utilised. Any subsequent period adjustments to deferred tax assets arising from unused tax losses as a result of revised assessments of the probability of recoverability is recognised by the head entity only.
(ii) Nature of tax funding arrangements and tax sharing arrangements
The head entity, in conjunction with other members of the tax-consolidated group, has entered into a tax funding arrangement which sets out the funding obligations of members of the tax-consolidated group in respect of tax amounts. The tax funding
arrangements require payments/(receipts) to/(from) the head entity equal to the current tax liability (asset) assumed by the head entity and any tax loss deferred tax asset assumed by the head entity, resulting in the head entity recognising an intra-group receivable (payable) equal in amount to the tax liability (asset) assumed. The inter-entity receivables (payables) are at call.
Contributions to fund the current tax liabilities are payable as per the tax funding arrangement and reflect the timing of the head entity’s obligation to make payments for tax liabilities to the relevant tax authorities.
The head entity in conjunction with other members of the tax-consolidated group has also entered into a tax sharing agreement. The tax sharing agreement provides for the determination of the allocation of income tax liabilities between the entities should the head entity default on its tax payment obligations. No amounts have been recognised in the Financial Statements in respect of this agreement as payment of any amounts under the tax sharing agreement is considered remote.
(iii) Goods and services tax
Revenue, expenses and assets are recognised net of the amount of goods and services tax (GST), except where the amount of GST incurred is not recoverable from the taxation authority. In these circumstances, the GST is recognised as part of the cost of acquisition of the asset or as part of the expense.
Receivables and payables are stated with the amount of GST included. The net amount of GST recoverable from, or payable to, the Australian Taxation Office (ATO) is included as a current asset or liability or as part of the expense.
Cash flows are included in the Statement of Cash Flows on a gross basis. The GST components of cash flows arising from investing and financing activities which are recoverable from, or payable to, the ATO are classified as cash flows from operating activities.
(n) Contract liabilitySponsorship income, lease incentives and professional indemnity insurance income is received in advance and is recognised as a contract liability in accordance with AASB 15. Income is deferred until the performance obligations are satisfied, with sponsorship income being recognised when the sponsorship event has occurred (refer to Note 3(i)).
For
per
sona
l use
onl
y

2019 ANNUAL REPORT 59
Notes to the Financial Statements (continued)
(o) Borrowing costs Borrowing costs directly attributable to the acquisition, construction or production of a qualifying asset are capitalised as part of the cost of that asset and subsequently amortised over the life of that asset. Borrowing costs that are not directly attributable to the acquisition, construction or production of a qualifying asset are recognised in the profit or loss using the effective interest method.
4 Determination of fair valuesA number of the Group’s accounting policies and disclosures require the determination of fair value, for both financial and non-financial assets and liabilities. Fair values have been determined for measurement and/or disclosure purposes based on the following methods. Where applicable, further information about the assumptions made in determining fair values are disclosed in the notes specific to that asset or liability.
Trail commissions payableThe Group receives trail commissions from lenders on settled loans over the life of the loan based on the loan book balance outstanding. This is initially recognised as a contract asset and is measured using the ‘expected value’ method under AASB 9 (refer to Note 3(i) Revenue from Contracts with Customers). The corresponding payable to brokers is also recognised, initially measured at fair value being the net present value of expected future trailing commission payable to brokers.
The contract asset from lenders and the corresponding payable to brokers is determined by using a discounted cash flow valuation. These calculations require the use of assumptions which are determined by management using a variety of inputs including external actuarial analysis of historical runoff information. Refer to Note 29(d) for details on the key assumptions.
Trade and other payablesAll trade and other payables have a remaining life of less than one year and the notional amount is deemed to reflect the fair value.
Investments in equity instrumentsThe fair value of financial assets at fair value through profit or loss and non-traded equity investments designated at fair value through other comprehensive income is determined by reference to their quoted closing bid price at reporting date.
Other financial instrumentsThe carrying amount of all other financial assets and liabilities recognised in the Statement of Financial Position approximate their fair value, with the exception of the trail commission payables that are initially recognised at fair value and subsequently carried at amortised cost.
5 Financial risk management
OverviewThe Group has exposure to credit, liquidity and market risks from the use of financial instruments.
This note presents information about the Group’s exposure to each of the below risks, the objectives, policies and processes for measuring and managing risk, and the management of capital. There have been some changes this reporting period to impairment regarding loans and advances as a result of AASB 9 implementation and the development of an ECL model. Refer to note 3(b)(i) for details. Further quantitative disclosures are included throughout the financial report.
The Board of Directors has overall responsibility for the establishment and oversight of the risk management framework. The Risk and Compliance Committee is responsible for developing and monitoring risk management policies.
Risk management policies are established to identify and analyse the risks faced by the Group, to set appropriate risk limits and controls, and to monitor risks and adherence to limits. Risk management policies and systems are reviewed regularly to reflect changes in market conditions and the Group’s activities. The Group, through its training and management standards and procedures, aims to develop a disciplined and constructive control environment in which all employees understand their roles and obligations.
The Risk and Compliance Committee oversees how management monitors compliance with the Group’s risk management policies and procedures and reviews the adequacy of the risk management framework in relation to the risks faced by the Company and the Group.
(a) Credit riskCredit risk is the risk of financial loss to the Group if a customer or counterparty to a financial instrument fails to meet its contractual obligations and arises principally from the Group’s receivables from customers. Refer to Note 29(a) for details.
For
per
sona
l use
onl
y

Notes to the Financial Statements (continued)
2019 ANNUAL REPORT60
Trade and other receivablesThe Group’s exposure to credit risk is influenced mainly by the individual characteristics of each customer. The demographics of the Group’s customer base, including the default risk of the industry and country in which customers operate, has less of an influence on credit risk.
Excluding financial institutions on the lender panel, trade and other receivables from other customers are rare given the nature of the Group’s business. The Group has assessed its history of losses as well as performing a forward looking assessment, both of which have not resulted in any historical or expected material forward looking losses. Group does not require collateral in respect of trade and other receivables.
Contract assetsThe Group’s contract assets relate mainly to high credit quality financial institutions who are the members of the lender panel. New panel entrants are subject to commercial due diligence prior to joining the panel. The Group bears the risk of non-payment of future trail commissions by lenders (contract assets) should they not maintain solvency. However, should a lender not meet its obligations as a debtor then the Group is under no obligation to pay out any future trail commissions to brokers. The group has applied the low credit risk exemption to contract assets and as such no impairment has been identified. Refer to note 29(a)(ii) for details.
Loans and advancesTo mitigate exposure to credit risk on loans and advances, the Group has adopted the policy of only dealing with creditworthy counterparties and obtaining sufficient collateral or other security where appropriate.
The Group’s loans and advances relate mainly to loans advanced through its residential mortgage securitisation programme. Credit risk management is linked to the origination conditions externally imposed on the Group by the warehouse facility provider including geographical limitations. As a consequence, the Group has no significant concentrations of credit risk. The Group has established a credit quality review process to provide early identification of possible changes in credit worthiness of counterparties by the use of external credit agencies, which assigns each counterparty a risk rating. Risk ratings are subject to regular review.
The Group’s maximum exposure is the excess of the net realisable value and the carrying amount of the loans, net of any impairment losses. Subsequent to June 2014 all residential loans with a loan to value ratio of greater than 80% are subject to a lenders mortgage insurance contract.
The Group has applied an ECL model to determine the collective impairment provision of its loans and advances. Refer note 3(b)(i)) and 29(a)(iii) for details.
(b) Liquidity riskLiquidity risk is the risk that the Group will not be able to meet its financial obligations as they fall due or will have to do so at an excessive cost. The Group’s approach to managing liquidity is to ensure, as far as possible, that it will always have sufficient liquidity to meet its liabilities when due, under both normal and stressed conditions, without incurring unacceptable losses or risking damage to the Group’s reputation.
To limit this risk, the Group manages assets with liquidity in mind, and monitors future cash flows and liquidity on a regular basis. This incorporates an assessment of expected cash flows and the availability of high-grade collateral which could be used to secure additional funding if required.
The liquidity position is assessed and managed under a variety of scenarios, giving due consideration to stress factors relating to both the market in general and specifically to the Group.
(c) Market riskMarket risk is the risk that changes in market prices, such as foreign exchange rates, interest rates and equity prices will affect the Group’s income or the value of its holdings of financial instruments. The objective of market risk management is to manage and control market risk exposures within acceptable parameters, while optimising the return.
Currency risk The Group is exposed to foreign currency risk on cash assets that are denominated in a currency other than AUD. The currencies giving rise to this risk are denominated in US dollars (USD) and New Zealand dollars (NZD). The Group elects not to enter into foreign exchange contracts to hedge this exposure as the net movements would not be material. The Group has no significant exposure to currency risk.
Interest rate riskInterest rate risk is the risk to the Group’s earnings and equity arising from movements in interest rates. Positions are monitored on an ongoing basis to ensure risk levels are maintained within established limits.
The Group’s most significant exposure to interest rate risk is on the interest-bearing loans within the SPE which fund the residential mortgage securitisation
For
per
sona
l use
onl
y

2019 ANNUAL REPORT 61
Notes to the Financial Statements (continued)
programme. To minimise its exposure to increases in cost of funding, the Group only lends monies on variable interest rate term. Should there be changes in pricing the Group has the option to review its position and offset those costs by passing on interest rate changes to the end customer.
Prepayment riskPrepayment risk is the risk that the Group will incur a financial loss because its customers and counterparties repay or request repayment earlier than expected.
The Group’s key exposure relates to the net present value of contracts assets and future trail commissions payable. The Group uses regression models to project the impact of varying levels of prepayment on its net income. The model makes a distinction between the different reasons for repayment and takes into account the effect of any prepayment penalties. The model is back tested against actual outcomes.
For the loans and advances within the SPE and SPE-RMBS, the Group minimises the prepayment risk by passing back all principal repayments to the warehouse facility providers and bondholders.
Other market riskThe Group is exposed to an increase in the level of credit support required within its securitisation programme arising from changes in the credit rating of mortgage insurers used by the SPE, and the composition of the available collateral held. The Group regularly reviews and reports on the credit ratings of those insurers as well as the Company’s maximum cash flow requirements should there be any adverse movement in those credit ratings.
(d) Capital managementThe Board’s policy is to maintain a strong capital base so as to maintain investor, creditor and market confidence and to sustain future development of the business. The Board of Directors monitors the return on capital, which the Group defines as net operating income divided by total shareholders’ equity and aims to maintain a capital structure that ensures the lowest cost of capital available to the Group. The Board of Directors also monitors the level of dividends to ordinary shareholders.
The SPEs are subject to the external requirements imposed by the warehouse facility providers. The terms of the warehouse facilities provide a mechanism for managing the lending activities of the SPE and ensure that all outstanding principal and interest is paid at the end of each reporting
period. Similarly, the SPE-RMBS are subject to external requirements imposed by the bondholders and the rating agencies. The terms of the RMBS transactions provide a mechanism for ensuring that all outstanding principal and interest is paid at the end of each reporting period. There were no breaches of the covenants or funding terms imposed by the warehouse and RMBS transactions in the current period. AFG Securities Pty Ltd is subject to externally imposed minimum capital requirements by the Australian Securities and Investments Commission (ASIC) in accordance with the conditions of their Australian Financial Services Licence.
6 Segment informationAASB 8 requires operating segments to be identified on the basis of internal reports about business activities in which the Group is engaged and that are regularly received by the chief operating decision maker, the Board of Directors, in order to allocate resources to the segment and to assess its performance.
The Group has identified two reportable segments based on the nature of the products and services, the type of customers for those products and services, the processes followed to produce, the method used to distribute those products and services and the similarity of their economic characteristics.
The following summary describes the operations in each of the Group’s reportable segments:
AFG Wholesale Mortgage BrokingThe mortgage broking segment refers to the operating activities in which the Group acts as a wholesale mortgage broker that provides its contracted brokers with administrative and infrastructure support as well as access to a panel of lenders.
The Group receives two types of commission payments on loans originated through its network;
• Upfront commissions on settled loans
Upfront commissions are received by the Group from lenders as a percentage of the total amount borrowed. Once a loan settles, the Group receives a one-off payment linked to the total amount borrowed as an upfront commission, a large portion of which is then paid by the Group to the originating broker.
For
per
sona
l use
onl
y

Notes to the Financial Statements (continued)
2019 ANNUAL REPORT62
• Trail commissions on the loan book
Trail commissions are received by the Group from lenders over the life of the loan (if it is in good order and not in default), as a percentage of the particular loan’s outstanding balance. The trail book represents the aggregate of residential and commercial mortgages outstanding that have been originated by the Group’s contracted brokers and are generating trail income.
AFG Home LoansAFGHL offers the Group’s branded mortgage products, funded by third party wholesale funding providers (white label products) or AFG Securities mortgages (securitised loans issued by AFG Securities Pty Ltd) that are distributed through the Group’s distribution network. AFGHL sits on the Group’s panel of lenders alongside the other residential lenders and competes with them for home loan customers. The segment earns fees for services, largely in the form of upfront and trail commissions, and net interest margin on loans funded by its securitisation programme. Segment results that are reported to the Board of Directors include items directly attributable to the relevant segment as well as those that can be allocated on a reasonable basis.
Other/UnallocatedOther/unallocated items are comprised mainly of other operating activities from which the Group earns revenue and incurs expenses that are not required to be reported separately since they don’t meet the quantitative thresholds prescribed by AASB 8 or are not managed separately and include corporate and taxation overheads, assets and liabilities. Information regarding the results of each reportable segment is included below. Performance is measured based on segment profit before tax, as included in the internal management reports that are reviewed by the Board of Directors.
Year ended 30 June 2019
In thousands of AUD AFG Wholesale Mortgage Broking
AFG Home Loans
Other / Unallocated
Total
IncomeExternal customers 530,095 111,288 1,456 642,839Inter-segment 31,622 - (31,622) -Other operating income 1,603 - 13,529 15,132Interest income - 33 1,995 2,028Total segment income 563,320 111,321 (14,642) 659,999Timing of revenue recognition At a point in time 563,320 37,335 (25,306) 575,349 Over time - 73,986 10,664 84,650ResultsSegment profit/(loss) before income tax 33,223 16,728 (3,492) 46,459Income tax expense (13,430)Net profit after tax 33,029
Assets and liabilitiesTotal segment assets 880,616 2,184,060 25,284 3,089,660Total segment liabilities 868,931 2,115,354 853 2,985,138
Other segment information Depreciation and amortisation (149) (21) (855) (1,025)
For
per
sona
l use
onl
y

2019 ANNUAL REPORT 63
Notes to the Financial Statements (continued)
Year ended 30 June 2018
In thousands of AUD AFG Wholesale Mortgage Broking
AFG Home Loans
Other / Unallocated
Total
IncomeExternal customers 508,670 93,301 1,425 603,396Inter-segment 29,152 - (29,152) -Other operating income 3,230 - 10,182 13,412Interest income - 25 2,438 2,463Total segment income 541,052 93,326 (15,107) 619,271Timing of revenue recognition At a point in time 541,052 40,883 (25,123) 556,812 Over time - 52,443 10,016 62,459ResultsSegment profit/(loss) before income tax 33,357 18,729 (4,377) 47,709Income tax expense (14,400)Net profit after tax 33,309
Assets and liabilitiesTotal segment assets 789,370 1,474,700 29,339 2,293,409Total segment liabilities 780,377 1,416,783 2,925 2,200,085
Other segment information Depreciation and amortisation (168) (17) (814) (999)Interest expense - - (3) (3)
7 Commissions and other incomeIn thousands of AUD 2019 2018
Timing of revenue recognitionAt a point in timeCommissions 514,124 500,955Securitisation transaction fees 1,263 516Over timeInterest on commission income receivable 53,466 49,040Mortgage management services 213 132Securitisation transaction fees 636 441Total commissions and other income 569,702 551,084
Commission and other income is accounted for in accordance with AASB 15 – Revenue from contracts with customers. Refer to Note 3(i) for accounting policy. The expected value of the commercial trail book was recognised for the first time during the current year and as a result commission revenue and commission expense includes additional trail commissions related to prior period commercial settlements with no material impact on the relevant financial statement line items.
For
per
sona
l use
onl
y

Notes to the Financial Statements (continued)
2019 ANNUAL REPORT64
8 Other income In thousands of AUD 2019 2018
Timing of revenue recognitionAt a point in timeSponsorship and incentive income 3,605 2,107Quality and other bonuses income 834 1,289Over timeProfessional indemnity insurance(i) 2,321 2,213Software licence fees (ii) 2,883 2,755Fees for services 4,996 4,482Other(iii) 493 566Total Other income 15,132 13,412
(i) Professional indemnity insurance is the income generated from professional indemnity insurance cover. AFG purchases a third-party professional indemnity insurance policy for which it pays a premium and offers AFG’s brokers the option to be included under AFG’s policy cover. If this offer is taken up, brokers will be charged a fee. This revenue from this fee is brought to account over time
(ii) Software Licenses is the income generated from FLEX & SMART. This revenue relates to AFG software used by brokers and is recognised over time as the software license service is provided.
(iii) Other income is accounted for in accordance with AASB 15 – Revenue from contracts with customers. Refer to Note 3(i) for accounting policy.
9 Other expensesIn thousands of AUD Note 2019 2018
Advertising and promotion 3,977 1,840Consultancy and professional fees 2,148 1,451Information technology 3,433 3,296Occupancy costs 423 426Employee costs 10 29,391 26,905Depreciation and amortisation 1,026 999Operating lease costs 1,609 2,030Impairment loss on receivables 508 182
42,515 37,129
10 Employee costs
In thousands of AUD 2019 2018
Wages and salaries 20,344 18,572Other associated personnel expenses 6,268 5,837Change in liabilities for employee benefits (13) 229Share-based payment transactions 772 385Superannuation 2,020 1,882
29,391 26,905
For
per
sona
l use
onl
y

2019 ANNUAL REPORT 65
Notes to the Financial Statements (continued)
11 Auditors’ remunerationIn AUD 2019 2018
Audit servicesAmounts due and receivable for:Audit of the financial report of the Group and other entities of the Group
Deloitte Touche Tohmatsu 205,000 210,000205,000 210,000
Other services - Deloitte Touche TohmatsuOther non-audit services 97,500 162,600
97,500 162,600
12 Finance income and expensesRecognised in profit or loss
In thousands of AUD 2019 2018
Interest income on loans and receivables 599 337Interest income on bank deposits 1,415 2,096Net foreign exchange gain 14 30Finance income 2,028 2,463Net change in fair value of financial assets designated at fair value through profit or loss
- (15)
Interest expense - (3)Finance expense - (18)
Net finance income and expense 2,028 2,445
13 Income tax
(a) Current tax expense
In thousands of AUD 2019 2018
Income tax recognised in profit or loss
Current tax expenseCurrent period 12,853 12,938Adjustments for prior periods (126) (111)Other adjustments (26) -Deferred tax expenseOrigination and reversal of temporary differences 729 1,573Income tax expense reported in the statement of profit or loss 13,430 14,400
For
per
sona
l use
onl
y

Notes to the Financial Statements (continued)
2019 ANNUAL REPORT66
Numerical reconciliation between tax expense and pre-tax accounting profit
In thousands of AUD 2019 2018
Profit before tax from continuing operations 46,459 47,709Income tax using the Company’s domestic tax rate of 30% (2018: 30%)
13,938 14,313
Non-deductible expenses (356) 211Over provision in prior periods (126) (111)Other adjustments (26) (13)
13,430 14,400
(b) Current tax assets and liabilitiesThe current tax liability for the Group of $2,808k (2018: $2,074k) represents the amount of income taxes payable in respect of current and prior financial years.
(c) Deferred tax assets and liabilitiesDeferred tax assets and liabilities are attributable to the following:
Assets Liabilities Net
In thousands of AUD 2019 2018 2019 2018 2019 2018
Property, plant and equipment and intangibles
(34) - - 120 (34) 120
Trade and other receivables - - - 235,120 - 235,120Contract asset - - 263,014 - 263,014 -Employee benefits (1,459) (1,237) - - (1,459) (1,237)Trade and other payables (237,881) (211,281) - - (237,881) (211,281)Other items (1,817) (1,669) - - (1,817) (1,669)Tax (assets) / liabilities (241,191) (214,187) 263,014 235,240 21,823 21,053Set off of tax 241,191 214,187 (241,191) (214,187) - -Net tax liabilities - - 21,823 21,053 21,823 21,053
14 Cash and cash equivalents (a) Cash and cash equivalents
In thousands of AUD 2019 2018
Cash at bank 48,297 48,364Short term deposits 1,276 1,276Unrestricted cash 49,573 49,640
Cash collections accounts1 30,611 22,055Restricted cash2 16,634 17,015Restricted cash 47,245 39,070
Cash and cash equivalents 96,818 88,710Cash and cash equivalents in the Statement of Cash Flows 96,818 88,710
1 Discloses amounts held in the special purpose securitised trusts and series on behalf of the warehouse funder and the bondholders 2 Discloses cash collateralised standby letter of credit, liquidity reserve account and cash provided in trust by the warehouse providers
to fund pending settlements
For
per
sona
l use
onl
y

2019 ANNUAL REPORT 67
Notes to the Financial Statements (continued)
The effective interest rate on short term deposits in 2019 was 2.32% (2018: 2.27%). The deposits had an average maturity of 73 days (2018: 65 days).
The Group’s exposure to interest rate risk and a sensitivity analysis for financial assets and liabilities are disclosed in Note 29.
(b) Reconciliation of cash flows from operating activities
In thousands of AUD 2019 2018
Cash flows from operating activitiesProfit for the period from continuing operations 33,029 33,309Adjustments to reconcile the profit to net cash flows:Income tax expense from continuing operations 13,430 14,400Depreciation and amortisation 1,026 999Net interest income from investing activities (2,015) (2,432)Expense recognised in respect of equity-settled share-based payments 773 381Share of profit in an associate (1,526) (186)Present value of future trail commission income (94,674) (70,343)Present value of future trail commission expense 88,298 62,832Other non-cash movements 10 226
38,351 39,186Working capital adjustments:Changes in assets and liabilitiesDecrease in receivables and prepayments (2,576) (489)Increase in trade and other payables 3,205 4,700(Decrease)/Increase in contract liability (178) 1,406Increase/(Decrease) in employee entitlements 681 (13)Increase/(Decrease) in provisions 274 (300)Cash generated from operations 39,757 44,490Income tax paid (11,926) (12,004)Net cash generated by operating activities 27,831 32,486
For
per
sona
l use
onl
y

Notes to the Financial Statements (continued)
2019 ANNUAL REPORT68
15 Trade and other receivablesIn thousands of AUD 2019 2018
CurrentTrade receivables 239 337Other receivables1 1,256 992Accrued income 375 -
1,870 1,329Net present value of future trail commissions receivable2 - 170,191Prepayments 3,539 3,735
5,409 175,255Non-CurrentNet present value of future trail commissions receivable2 - 634,862
- 634,8625,409 810,117
1 Other receivables include the Thinktank Pty Ltd term deposit. Refer Note 19.2 The trail commission receivable is now classified as a contract asset upon transition to AASB 15 (refer Note 3(i) and the new contract asset Note 16).
16 Contract AssetIn thousands of AUD 2019 2018
CurrentNet present value of future trail commissions contract asset1 194,283 -Non-currentNet present value of future trail commissions contract asset1 705,444 -
899,727 -
1 The trail commission receivable is now classified as a contract asset upon transition to AASB 15. Refer to Note 3(i) for accounting policy and Note 29(d) for assumptions related to contract asset expected value. Impairment on contract assets is immaterial and therefore not recognised. The expected value of the commercial trail book was recognised for the first time during the current year and as a result a trail commission contract asset and corresponding liability has been recognised for the first time with no material impact on the relevant financial line items.
The Group’s exposure to credit and currency risks and impairment losses related to contract assets are disclosed in Note 29.
17 Trade and other payablesIn thousands of AUD Note 2019 2018
CurrentPresent value of future trail commissions payable 4 172,430 150,340Other trade payables 63,282 62,632Non-trade payables and accrued expenses 3,981 2,529
239,693 215,501Non-currentNet present value of future trail commissions payable 634,383 568,175
634,383 568,175
874,076 783,676
For
per
sona
l use
onl
y

2019 ANNUAL REPORT 69
Notes to the Financial Statements (continued)
Trade payables are non-interest-bearing and are normally settled on 60-day terms. Non-trade payables are non-interest-bearing and are normally paid on a 60-day basis. The Group’s exposure to liquidity risk related to trade and other payables is disclosed in Note 29.
18 Loans and advances In thousands of AUD 2019 2018
Current Securitised assets1 353,870 331,372Other secured loans2 1,574 1,916Capitalised origination cost 73 205
355,517 333,493
Non-current 2019 2018Securitised assets1 1,710,714 1,042,477Capitalised origination cost 2,703 555Other secured loans2 3,827 3,755Less: Provision for expected credit loss3 (757) (423)
1,716,487 1,046,364
2,072,004 1,379,857
1 The originated mortgage loans and securitised assets are held as security for the various debt interests in the special purpose securitised trusts and series.
2 Other secured loans include:
a) Loans and advances to Brokers secured over future trail commissions’ payable to the broker and in some cases personal guarantees. Interest is charged on average at 10.70% p.a. (2018: 11.06% p.a.).
b) Loan and advances to McCabe St Limited (related party) are secured over its land and assets. Interest is charged on average at 4.13% p.a. (2018: 4.08% p.a.).
3 Refer to Note 29(a)(ii) for a reconciliation of opening and closing expected credit losses on loans and advances including movements between credit risk stages.
At the end of the reporting period, the balance of the Group’s securitised assets includes a provision for expected credit loss of $757k (2018: $423k).
During the financial year, new loans issued in the Group’s securitisation programme were $1,059,513k (2018: $509,753k).
The Group’s exposure to credit, currency and interest rate risks related to loans and advances is disclosed in Note 29.
For
per
sona
l use
onl
y
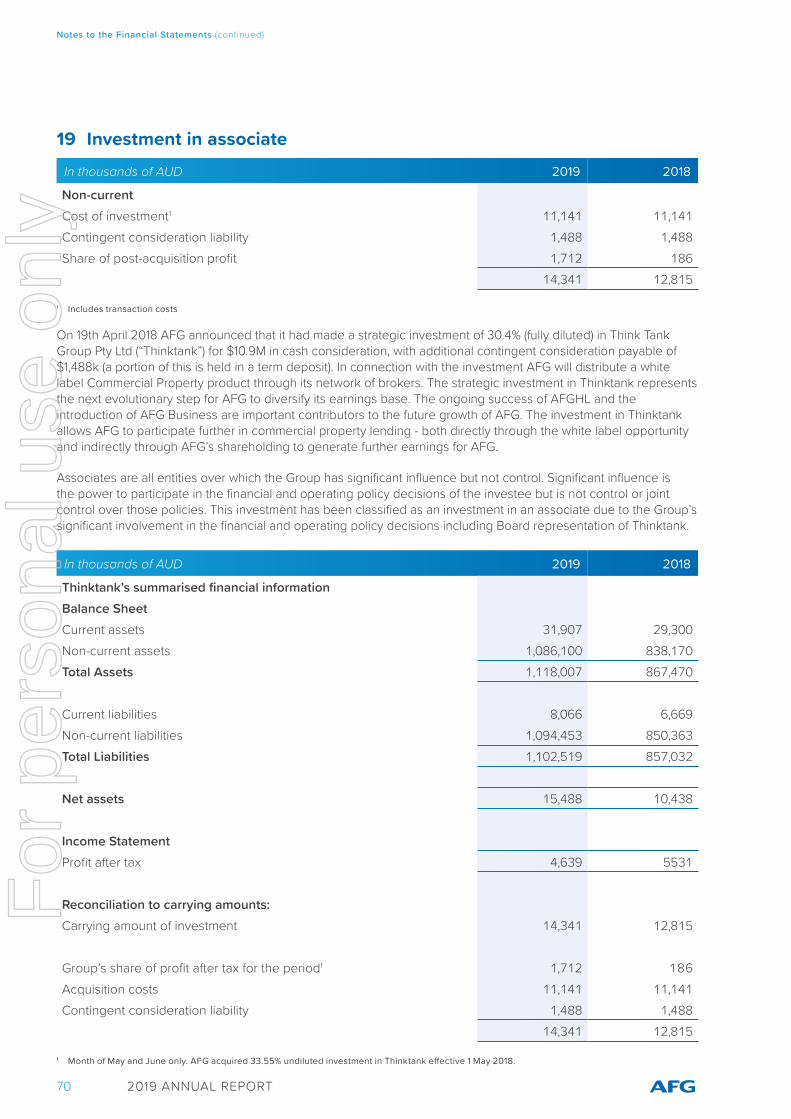
Notes to the Financial Statements (continued)
2019 ANNUAL REPORT70
19 Investment in associateIn thousands of AUD 2019 2018
Non-currentCost of investment1 11,141 11,141Contingent consideration liability 1,488 1,488Share of post-acquisition profit 1,712 186
14,341 12,815
1 Includes transaction costs
On 19th April 2018 AFG announced that it had made a strategic investment of 30.4% (fully diluted) in Think Tank Group Pty Ltd (“Thinktank”) for $10.9M in cash consideration, with additional contingent consideration payable of $1,488k (a portion of this is held in a term deposit). In connection with the investment AFG will distribute a white label Commercial Property product through its network of brokers. The strategic investment in Thinktank represents the next evolutionary step for AFG to diversify its earnings base. The ongoing success of AFGHL and the introduction of AFG Business are important contributors to the future growth of AFG. The investment in Thinktank allows AFG to participate further in commercial property lending - both directly through the white label opportunity and indirectly through AFG’s shareholding to generate further earnings for AFG.
Associates are all entities over which the Group has significant influence but not control. Significant influence is the power to participate in the financial and operating policy decisions of the investee but is not control or joint control over those policies. This investment has been classified as an investment in an associate due to the Group’s significant involvement in the financial and operating policy decisions including Board representation of Thinktank.
In thousands of AUD 2019 2018
Thinktank’s summarised financial informationBalance SheetCurrent assets 31,907 29,300Non-current assets 1,086,100 838,170Total Assets 1,118,007 867,470
Current liabilities 8,066 6,669Non-current liabilities 1,094,453 850,363Total Liabilities 1,102,519 857,032
Net assets 15,488 10,438
Income StatementProfit after tax 4,639 5531
Reconciliation to carrying amounts:Carrying amount of investment 14,341 12,815
Group’s share of profit after tax for the period1 1,712 186Acquisition costs 11,141 11,141Contingent consideration liability 1,488 1,488
14,341 12,815
1 Month of May and June only. AFG acquired 33.55% undiluted investment in Thinktank effective 1 May 2018.
For
per
sona
l use
onl
y

2019 ANNUAL REPORT 71
Notes to the Financial Statements (continued)
20 Property, plant and equipmentIn thousands of AUD Plant and
equipmentFixtures and
fittingsTotal
Consolidated Balance at 1 July 2017 210 1,688 1,898Acquisitions 201 55 256Disposals and write-offs (50) - (50)Depreciation (115) (610) (725)Balance at 30 June 2018 246 1,133 1,379
Balance at 1 July 2018 246 1,133 1,379Acquisitions 254 11 265Disposals and write-offs (3) - (3)Depreciation (185) (607) (792)Balance at 30 June 2019 312 537 849
21 Interest-bearing liabilities This note provides information about the contractual terms of the Group’s interest-bearing loans and borrowings. For more information about the Group’s exposure to interest rate risk, see Note 29.
In thousands of AUD 2019 2018
CurrentSecuritisation warehouse facilities 962,444 496,896Loans from funders - 20Securitised funding facilities1 191,722 261,795
1,154,166 758,711Non-current Securitised funding facilities1 919,606 623,049Loans from funders - 1
919,606 623,050
2,073,772 1,381,761
1 Securitised funding facilities include RMBS and risk retention facilities. Refer Note 21 (a) (ii).
For
per
sona
l use
onl
y

Notes to the Financial Statements (continued)
2019 ANNUAL REPORT72
Terms and debt repayment scheduleTerms and conditions of outstanding loans were as follows:
2019 2018
In thousands of AUD
Weighted Average Effective interest
rate
Year of maturity
Face value
Carrying amount
Weighted Average Effective interest
rate
Year of maturity
Face value
Carrying amount
Warehouse facilities
3.13% 2019-2020 962,444 962,444 3.12% 2018-2019 496,896 496,896
Securitised funding facilities
3.17% 2019-2024 1,106,674 1,111,328 3.00% 2018-2023 883,425 884,844
Loans from funders
6.00% 2019-2020 - - 6.00% 2018-2020 21 21
2,069,118 2,073,772 1,380,342 1,381,761
(a) Warehouse and Securitised funding facilities
(i) Warehouse facilities
The warehouse facilities provide funding for the financing of loans and advances to customers within the SPE and its Series.
The security for advances under these facilities is a combination of fixed and floating charges over all assets of the SPE being loans and advances to customers. If the warehouse facility is not renewed or should there be a default by the trustee under the existing terms and conditions, the warehouse facility funder will not have a right of recourse against the remainder of the Group.
Customer loans and advances are secured against residential properties only. Up until 1 July 2014, all new loans settled irrespective of their LVR were covered by a separate individual lenders mortgage insurance contract. Subsequent to this date, all new loans settled with an LVR of less than or equal to 80% were settled on the basis that no lenders mortgage insurance policy was required. When purchased, a lender’s mortgage insurance contract covers 100% of the principal of the loan.
As at the reporting date the unutilised securitisation warehouse facility for all Series is $44,356k (2018: $93,346k). The interest is recognised at an effective rate of 3.13% (2018: 3.12%).
The Group has secured an extension to the term of both of its residential warehouse facilities. The NAB residential warehouse facility has been extended to 10 December 2019 and the ANZ facility has been extended to 10 May 2020. AFG expects this warehouse facility to be rolled post December 2019 given AFG has historically been able to extend by 12 months at a time.
Liquidity facilityThe Liquidity facility is established by the warehouse facility providers to temporarily fund any excess amount of interest, fees and any other charges which may accrue from the date of cash flows calculation, to the date of cash flows payment.
As at the reporting date the unutilised facility has not been drawn down (2018: not drawn down).
Additional credit support includes subordinated credit enhancement held by the Company of $21,500k (2018: $20,740k).
For
per
sona
l use
onl
y

2019 ANNUAL REPORT 73
Notes to the Financial Statements (continued)
(ii) Securitised funding facilities
Secured bond issuesSPE-RMBS were established to provide funding for loans and advances (securitised assets) originated by AFG Securities Pty Ltd. The bond issues have a legal final maturity of 31.5 years from issue, and a weighted average life of up to 5 years. The security for loans and advances is a combination of fixed and floating charges over all assets of the SPE-RMBS.
Under the current trust terms, a default by the borrowing customer will not result in the bondholders having a right of recourse against the Group (as Originator, Trust Manager or Servicer). The interest is recognised at a weighted effective rate of 3.17% (2018: 3.00%).
Liquidity facilityVarious mechanisms have been put in place to support liquidity within the transaction to support timely payment of interest, including;
• principal draws which are covered by Redraw Notes for redraws that cannot be covered by normal collections (available principal),
• a liquidity facility between 1% and 1.3% of the initial invested amount of all notes,
• $150k Reserve Account which is an Extraordinary Expense Ledger account, and
• available income.
Additional credit support includes subordinated credit enhancement held by the Company (unrated Class C Notes) of $5,940k (2018: $2,460k).
During the financial year there were no breaches to the terms of the SPE-RMBS that gave right to the bondholders to demand payment of the outstanding value.
Other Securitised funding facilities Securitised funding facilities are secured only on the assets of each of the individual securitisation trusts. During the year NAB issued $21,323k which has been used for security over the net assets of AFG 2019-1 Trust.
For
per
sona
l use
onl
y
Notes to the Financial Statements (continued)
2019 ANNUAL REPORT74
(b) Other finance facilities
In thousands of AUD 2019 2018
Standby facility 200 200Bank guarantee facility 276 276
476 476Facilities utilised at reporting dateStandby facility 118 113Bank guarantee facility 276 276
394 389Facilities not utilised at reporting date Standby facility 82 87
82 87
The facilities are subject to annual review.
22 Employee benefitsIn thousands of AUD 2019 2018
CurrentSalaries and wages accrued 2,491 1,788Liability for long service leave 1,444 1,405Liability for annual leave 1,181 1,235
5,116 4,428Non-CurrentLiability for long-service leave 118 115
118 115
5,234 4,543
23 ProvisionsIn thousands of AUD 2019 2018
Provision for Clawbacks1 1,291 1,206Provision for Contingent Payment2 1,488 1,488Provision for make good 350 161
3,129 2,855
1 Provision for clawbacks relates to commissions that maybe clawed back by lenders in accordance with individual contracts. These potential clawbacks are estimated, and a provision raised (see note 3(i)).
2 Provision for contingent payment to Thinktank (see note 19).
For
per
sona
l use
onl
y

2019 ANNUAL REPORT 75
Notes to the Financial Statements (continued)
24 Contract liability and Deferred Income
(a) Contract Liability
In thousands of AUD 2019 2018
CurrentSponsorship income 3,936 -Lease incentives 10 -Unearned professional indemnity insurance 350 -
4,296 -
(b) Deferred income
In thousands of AUD 2019 2018
CurrentSponsorship income - 3,352Lease incentives - 369Unearned professional indemnity insurance - 402
- 4,123
Deferred income in prior period, however from 1 July 2018 the new AASB 15 became effective, changing the classification to Contract Liability. Refer Note 2(e)(i).
25 Operating leases
Leases as lesseeNon-cancellable operating lease rentals are payable as follows:
In thousands of AUD 2019 2018
Less than one year 1,703 2,223Between one and five years 5,969 2,041After five years 1,503 -
9,175 4,264
The Group leases a number of office facilities under operating leases. The leases run for a period of up to 8 years, with an option to renew the lease after that date. Lease payments are generally increased every year to at least reflect Consumer Price Index (CPI) movements, with regular adjustments to reflect market rentals. During the year ended 30 June 2019 the West Perth lease was extended for an additional 7 years.
During the financial year ended 30 June 2019 $1,609k was recognised as an expense in the Consolidated Statement of Profit or Loss and Other Comprehensive Income in respect of operating leases (2018: $2,030k).
The Group has performed a full assessment of the impact of applying the new AASB 116 Leases standard. The Group has a limited number of operating leases which will result in the recognition of right of use assets and corresponding liabilities. No significant net impact has been identified. Additional disclosures will be prepared under the new standard when adopted and effective 30 June 2020. See Note 2(e)(ii) for more information.
For
per
sona
l use
onl
y

Notes to the Financial Statements (continued)
2019 ANNUAL REPORT76
26 Capital and reserves(a) Share capital
Share Capital($’000)
Ordinary shares(’000)
The Company 2019 2018 2019 2018
On issue at 1 July 43,541 43,541 214,813 214,813On issue at 30 June – fully paid 43,541 43,541 214,813 214,813
The Company does not have authorised capital or par value in respect of its issued shares. All issued shares are fully paid and rank equally with regard to the Company’s residual assets.
The holders of ordinary shares are entitled to receive dividends as declared from time to time and are entitled to one vote per share at meetings of the Company.
(b) Fair value reserve The fair value reserve comprises the cumulative net change in fair value of available-for-sale financial assets until the investments are derecognised or impaired.
(c) DividendsDividends paid in the current year by the Group are:
Cents per share
Total amount($’000)
Franked /unfranked
Date of payment
2019
Final 2018 ordinary1st interim 2019 ordinary
5.74.7
12,24410,096
100%100%
27/09/201828/03/2019
22,340
2018
1st interim 2018 ordinary 4.7 10,096 100% 29/03/2018Final 2017 ordinary 5.5 11,816 100% 28/09/2017Special dividend 12.0 25,778 100% 29/03/2018
47,690
Declared and unrecognised as a liability:
2019
Final 2019 ordinary 5.9 12,755 100% 3/10/201912,755
Dividends declared or paid during the year or after 30 June 2019 were franked at the rate of 30%.
In thousands of AUD 2019 2018
Dividend franking account 15,114 12,76330 per cent franking credits available to shareholders of Australian Finance Group Limited for subsequent financial years
35,267 29,780
50,381 42,543
The ability to utilise the franking credits is dependent upon the ability to declare dividends. In accordance with the tax consolidation legislation the Company as the head entity in the tax-consolidated group has also assumed the benefit of $50,381k (2018: $42,543k) franking credits.
For
per
sona
l use
onl
y

2019 ANNUAL REPORT 77
Notes to the Financial Statements (continued)
27 Earnings per share (EPS)Basic EPS amounts are calculated by dividing the profit for the year attributable to ordinary equity holders of Australian Finance Group Limited by the weighted average number of ordinary shares outstanding during the year.
Diluted EPS amounts are calculated by dividing the profit attributable to ordinary equity holders of Australian Finance Group Limited by the weighted average number of ordinary shares during the year plus the weighted average number of ordinary shares that would be issued on conversion of all the dilutive potential ordinary shares into ordinary shares.
The following reflects in the income and share data used in the basic and dilutive EPS computations:
In thousands of AUD 30 June 2019 30 June 2018
Profit attributable to ordinary equity holders of the Company 33,029 33,336
Thousands ThousandsWeighted average number of ordinary shares for basic EPS (thousands) 214,813 214,813Effect of dilution: Performance rights 1,956 1,289Weighted average number of ordinary shares adjusted for the effect of dilution 216,769 216,102
There have been no other transactions involving ordinary shares or potential ordinary shares between the reporting date and the date of authorisation of these financial statements.
28 Share based payments
Executive Rights plan (Long-Term Incentive Plan)The Group has in place an Executive Long-Term Incentive Plan (LTIP) which grants rights to certain Executives subject to the achievement of performance and service requirements. Eligible Executives are granted rights to a value determined by the Board that is benchmarked against direct industry peers and other Australian listed companies of a similar size and complexity.
Executives participating in the plan will not be required to make any payment for the acquisition of rights.
The rights lapse if the performance and service criteria are not met. The rights granted under the plan are subject to instalment vesting over a three-year period. The rights are subject to Total Shareholder Return (TSR) and Earnings Per Share (EPS) performance hurdles in addition to continuous service vesting conditions. The Board has the full discretion to determine whether some or all of the rights vest or lapse or whether unvested rights remain subject to vesting conditions in the event of a change of control. Refer to section 3.5 of the remuneration report for further detail.
In any event, any rights that remain unvested will lapse immediately after the end of the relevant vesting period.
The following table outlines performance rights that are conditionally issued under LTIP:
Offer Date Vesting date
Balance at start of the
year
Granted during the
year
Vested during the
year
Expired during the
year
Forfeited during the
year
Balance at end of the
year
1/07/2016 30/06/2019 - 593,136 - - - 593,1361/07/2017 30/06/2020 593,136 695,396 - - - 1,288,5321/07/2018 30/06/2021 1,288,532 667,373 593,136 - - 1,362,769
For
per
sona
l use
onl
y

Notes to the Financial Statements (continued)
2019 ANNUAL REPORT78
29 Financial instruments
(a) Credit risk
Exposure to credit riskThe carrying amount of the Group’s financial assets represents the maximum credit exposure.
(i) Contract assets
The majority of the Group’s net present value of future trail commission receivables is from counterparties that are rated between AA+ and A-. The following table provides information on the credit ratings at the reporting date according to the Standard & Poor’s counterparty credit with AAA and BBB being respectively the highest and the lowest possible ratings. There has been no historical instances where a loss has been incurred, including through the global financial crisis and therefore ECL would not be material.
In thousands of AUD Current Non-Current Current Non-Current
Standard & Poor’s Credit rating 2019 2019 2018 2018AA+ - - 10 37AA- 142,095 515,948 128,253 478,420A+ 16,154 58,656 7,262 27,088A 4,177 15,169 2,076 7,746A- 8,654 31,422 7,411 27,644BBB+ 6,461 23,460 3,481 12,986BBB 8,401 30,503 11,940 44,541BBB- - - 2,097 7,823Not rated 8,341 30,286 7,661 28,577
194,283 705,444 170,191 634,862
(ii) Loans and advances
Exposure to credit riskThe Group’s maximum exposure to credit risk for loans and advances at the reporting date by customer type are summarised as follows:
Carrying amount
In thousands of AUD 2019 2018
Customer typeResidential mortgage borrowers 2,064,586 1,373,849Brokers 5,183 5,462Other 2,235 546
2,072,004 1,379,857
Residential mortgage borrowersThe Group minimises credit risk by obtaining security over residential mortgage property for each loan. The estimated value of collateral held at balance date was $3,729,217k (2018: $2,551,566k). During the year ended 30 June 2019 the Group took possession of five additional residential securities and also managed two further securities as assisted shortfall sales loans. The carrying amount of the repossessed residential properties, at date of repossession, was $2,289k (2018: $287k). Of the 7 securities sold as mortgagee in possession or
For
per
sona
l use
onl
y

2019 ANNUAL REPORT 79
Notes to the Financial Statements (continued)
assisted shortfall sale - one returned a surplus sale figure, three properties have been sold before the end of the financial year, with the shortfall repaid by our lender’s mortgage insurance and three remains unsold.
In monitoring the credit risk, mortgage securitisation customers are grouped according to their credit characteristics using credit risk classification systems. This includes the use of the Loan to Value Ratio (LVR) to assess its exposure to credit risk from loans originated through the securitisation programme.
The table below summarises the Group exposure to residential mortgage borrowers by current LVR, with the valuation used determined as at the time of settlement of the individual loan. The ECL model considers the different risk profiles across the different loan portfolios full doc, near prime and low doc. The assumptions applied are the same across the portfolios.
Carrying amount
In thousands of AUD 2019 2018
Loan to value ratioGreater than 95% 2,188 1,324Between 90%-95% 43,971 51,734Between 80%-90% 319,534 204,896Less than 80%1 1,698,893 1,115,895
2,064,586 1,373,849
1 LVR less than 80% is required to have Lenders Mortgage Insurance (LMI), resulting in 100% of this balance being insured.
A summary of the assumptions underpinning the Groups ECL model is as follows:
Category Definition of Category Basis for recognition of ECL provision
Performing Customers have a low risk of default and a strong capacity to meet contractual cash flows
12 month expected losses
Doubtful Loans for which there is a significant increase in credit risk; as significant increase in credit risk is presumed if interest and/or principal repayments are 30 days past due
Lifetime expected losses
In default Interest and/or principal repayments are 90 days past due Lifetime expected lossesWrite off Interest and/or principal repayments are past due and there is no
reasonable expectation of recoveryAsset is written off
ECL rate Basis of recognition of ECL provision
Estimated gross carrying amount at default
Carrying amount (net of impairment provision)
Basis for calculation of interest revenue
In thousands of AUD
Performing 0.02% 12 month expected losses 2,059,376 2,058,927 Gross carrying amount
Underperforming 3.62% Lifetime expected losses 2,919 2,813 Gross Carrying amount
Non-performing 8.84% Lifetime expected losses 2,291 2,089 Amortised cost
Write off - Asset is written off 174 - None
Total Loans 2,063,829
For
per
sona
l use
onl
y
Notes to the Financial Statements (continued)
2019 ANNUAL REPORT80
Performing Under performing
Non- performing
Write off Total
In thousands of AUD
Closing loss allowance as at 30 June 2018 (calculated under AASB 139) 74 - 175 174 423
Amounts restated through retained earnings - - - - -
Opening loss allowance as at 1 July 2018 (calculated under AASB 9) 74 - 175 174 423
Individual financial assets transferred to under-performing (lifetime expected credit losses)
- - - - -
Individual financial assets transferred to non-performing (credit-impaired financial assets)
- - - - -
New financial assets originated or purchased - - - - -
Write-offs - - - (174) (174)Recoveries - - (175) - (175)Other changes 375 106 202 - 683Closing loss allowance as at 30 June 2019 (calculated under AASB 9) 449 106 202 - 757
In thousands of AUD 30 June 2019
Performing 2,059,376Underperforming 2,919Non-performing 2,291Loans written off 174Total gross loans and advances 2,064,760Less Loan loss allowance (757)Less Write off (174)Loans and advances net of ECL as at 30 June 2019 2,063,829
The reconciliation of opening and closing expected credit losses on loans and advances are as follows:
In thousands of AUD 30 June 2018 Movement 30 June 2019
Stage 1 74 375 449Stage 2 - 106 106Stage 3* 349 (147) 202Total Provision for ECL 423 334 757
For
per
sona
l use
onl
y

2019 ANNUAL REPORT 81
Notes to the Financial Statements (continued)
In thousands of AUD 30 June 2019
Opening loss allowance as at 1 July 2018 423Stage 1 375Stage 2 106Stage 3* (147)Closing loss allowance as at 30 June 2019 757
* Amount was written off in the reporting period ended 30 June 2019. The Group has written off the financial asset due to the fact that there is information indicating that the debtor is in severe financial difficulty and there is no realistic prospect of recovery.
Securitisation assetsLoans and advances of SPEs: The Group is required to provide the warehouse facility provider with a level of subordination or Credit Support. The Group’s maximum exposure to credit risk on securitised loans at reporting date is the carrying amount of subordinated notes.
The SPE-RMBS loans and advances: Under the current trust terms, a default by the customers will not result in the bond holders having a right of recourse against the Group (as Originator, Trust Manager or Servicer). Importantly, all residential mortgages under SPE-RMBS with an LVR exceeding 80% are insured by a lender’s mortgage insurance contract which covers 100% of the principal. The Group’s maximum exposure is the loss of future interest income on its Class C notes investment, which eliminate on consolidation. No impairment loss was recognised during 2019 (2018: Nil).
Other secured loansThe Group has minimal exposure to credit risk for loans made during the year. No impairment loss was recognised during 2019 (2018: Nil).
(b) Liquidity riskLiquidity risk is the risk that the Group will encounter difficulty in meeting the obligations associated with its financial liabilities that are settled by delivering cash or another financial asset. The Group’s approach to managing liquidity is to ensure, as far as possible, that it will always have sufficient liquidity to meet its liabilities when due, under both normal and stressed conditions, without incurring unacceptable losses or risking damage to the Group’s reputation. The Board of Directors reviews the rolling cash flow forecast on a monthly basis to ensure that the level of its cash and cash equivalents is at an amount in excess of expected cash outflows over the proceeding months. Excess funds are generally invested in at call bank accounts with maturities of less than 90 days. Within the special purpose entities, the Group also maintains sufficient cash reserves to fund redraws and additional advances on existing loans.
The following are the contractual maturities of financial liabilities based on undiscounted payments, including estimated interest payments and excluding the impact of netting agreements for the Group.
For
per
sona
l use
onl
y

Notes to the Financial Statements (continued)
2019 ANNUAL REPORT82
2019
In thousands of AUD
Carryingamount
Contractual cash flows
6 months or less
6-12 months
1-2 years 2-5 years More than 5 years
Securitisation warehouse facilities
962,444 983,944 778,678 205,266 - - -
Securitised funding facilities1
1,111,027 1,128,618 96,723 96,722 160,289 774,884 -
Net present value of future trail commissions payable
806,813 959,597 112,221 102,067 175,934 349,582 219,793
Trade and other payables
64,612 64,612 64,612 - - - -
2,944,896 3,136,771 1,052,234 404,055 336,223 1,124,466 219,793
1 Excludes set up costs amortisation
2018
In thousands of AUD
Carryingamount
Contractual cash flows
6 months or less
6-12 months
1-2 years 2-5 years More than 5 years
Securitisation warehouse facilities
496,896 517,636 517,636 - - - -
Securitised funding facilities
885,885 909,479 164,363 100,899 155,385 488,832 -
Loans from funders 22 22 14 6 2 - -Net present value of future trail commissions payable
718,515 862,335 98,906 90,676 157,501 315,903 199,349
Trade and other payables
65,161 64,612 64,612 - - - -
2,166,479 2,354,084 845,531 191,581 312,888 804,735 199,349
The obligation in respect of the net present value of future trail commission only arises if and when the Group receives the corresponding trail commission revenue from the lenders.
It is not expected that the cash flows included in the maturity analysis could occur significantly earlier, or at significantly different amounts.
Securitisation warehouse facilitiesSecured bond issuances are based on expected cashflows rather than contractual as each must be repaid to secured bondholders on receipt of funds from underlying mortgage customers. The warehouse facilities are short term funding facilities that are generally renewable bi-annually or annually. If the warehouse facility is not renewed or should there be a default by the trustee under the existing terms and conditions, the warehouse facility funder will not have a right of recourse against the remainder of the Group. Should the warehouse facility not be renewed then the maximum exposure to the Group would be the loss of future income streams from excess spread, being the difference between the Group’s mortgage rate and the underlying cost of funds and inability to fund new loans.
For
per
sona
l use
onl
y

2019 ANNUAL REPORT 83
Notes to the Financial Statements (continued)
On 7 May 2019, the Group secured an extension to the term of the jointly funded ANZ residential warehouse facility to 10 May 2020. The funding continues to be provided through the issue of four classes of secured, limited and floating rate notes, with the senior notes being issued to ANZ, mezzanine notes to Deutsche Bank and the subordinated notes to AFG.
On 9 April 2019, the Group secured a short-term extension of the NAB residential warehouse facility that was due to expire on 11 June 2019 to 10 December 2019. The warehouse comprises four classes of secured, limited and floating rate notes, with the senior notes being issued to NAB, Deutsche Bank holding the two mezzanine notes and AFG the subordinated Class C Notes.
Securitised funding facilitiesThe securities are issued by the SPE-RMBS with an expected weighted average life of 4 to 5 years. They are pass through securities that may be repaid early (at the call date) by the issuer (the Group) in certain circumstances. The above maturity assumes that the securities will be paid at the securities call date.
The Directors are satisfied that the Group’s ability to continue as a going concern will not be affected. For terms and conditions relating to trade payables and net present value of future trail commissions payable refer to Note 17.
(c) Market risk
(i) Currency risk
Exposure to currency riskAs at reporting date the Group held cash assets denominated in NZD and USD. Fluctuations in foreign currencies are not expected to have a material impact on the Consolidated Statement of Profit or Loss and Other Comprehensive Income and equity of the Group and have therefore not formed part of the disclosures.
(ii) Interest rate risk
The table below summarises the profile of the Group’s interest-bearing financial instruments and contract assets at reporting date.
Carrying amount
In thousands of AUD 2019 2018
Fixed rate instruments1 Contract assets 899,727 805,053Financial liabilities 806,813 718,515
92,914 86,538Variable rate instrumentsLoans and advances 2,168,749 1,468,332Financial liabilities 2,073,772 1,381,761
94,977 86,571
The Group’s main interest rate risk arises from securitised assets, cash deposits and interest-bearing facilities. All the Group’s borrowings are issued at variable rates, however the vast majority pertains to the warehouse facility which is arranged as ‘pass through’ facilities, and therefore the exposure to the interest rate risk is mitigated by the ability to pass any rate increases onto borrowers.
1 Discount rate for trail commission receivable and payable is fixed for the life of the loan.
For
per
sona
l use
onl
y

Notes to the Financial Statements (continued)
2019 ANNUAL REPORT84
Cash flow sensitivity analysis for variable rate instrumentsDue to the market conditions existing at 30 June 2019, the Group does not expect that interest rates will move in excess of 100 basis points (bps) from current conditions in the next reporting period. This has therefore formed the basis for the sensitivity analysis.
A change of 100 basis points in interest rates at the reporting date would have increased/(decreased) equity and profit or loss by the amounts shown below. This analysis assumes that all other variables remain constant. The analysis is performed on the same basis for 2018 and 2019.
After tax profit Equity
Effect in thousands of AUD 100bp increase
100bp decrease
100bp increase
100bp decrease
30 June 2019Variable rate contract assets 15,143 (15,143) 15,143 (15,143)Variable rate financial liabilities 6,737 (6,737) 6,737 (6,737)Cash flow sensitivity (net) 8,406 (8,406) 8,406 (8,406)30 June 2018Variable rate contract assets 10,239 (10,239) 10,239 (10,239)Variable rate financial liabilities 3,478 (3,478) 3,478 (3,478)Cash flow sensitivity (net) 6,761 (6,761) 6,761 (6,761)
(iii) Prepayment risk
Net present value of contract assets and future trail commissions payable
Exposure to prepayment riskThe Group will incur financial loss if customers or counterparties repay or request repayment earlier or later than expected. A change in the pattern of repayment by end consumers will have an impact on the fair value of future trail commissions receivable and payable. Refer to Note 29(d) for more details.
Sensitivity analysisManagement have engaged the use of actuaries for the purposes of reviewing the run-off rate of the loans under management. Management does not expect the run-off rate to change in excess of 5% positive or 5% negative of the rates revealed from the actuarial analysis performed on AFG’s historical loan data. The change estimate is calculated based on historical movements of the prepayment rate.
The effect from changes in prepayment rates, with all other variables held constant, is as follows:
In thousands of AUD 2019 2018
+5% -5% +5% -5%After tax profit (3,982) 4,208 (3,746) 3,960
Securitised assetsThe Group is exposed to prepayment risk on its securitised assets. The warehouse facilities and the securitised funding facilities funding the securitisation operations are pass through funding facilities in nature. All principal amounts prepaid by residential mortgage borrowers are passed through to the warehouse facility provider or the bond holders as part of the monthly payment terms. Consequently, the Group has no material exposure to prepayment risk on its securitised assets.
For
per
sona
l use
onl
y

2019 ANNUAL REPORT 85
Notes to the Financial Statements (continued)
(iv) Equity price risk
Exposure to equity price riskThe Group’s maximum exposure to this risk, deemed insignificant, is presented by the carrying amounts of its financial assets designated at fair value through profit or loss and available-for-sale financial asset carried in the Statement of Financial Position.
(v) Other market risks
The Group is exposed to other market risks on the credit support (securitisation loan receivable) provided by the Group in relation to the warehouse facilities. The value of the loan is dynamic in that it can change due to circumstances including the credit ratings of mortgage insurers. The Group has assessed that if this were to occur, it would not have a material impact on the Group’s profit after tax and equity.
(d) Accounting classifications and fair values
Fair value hierarchyThe different levels have been defined as follows:
• Level 1: quoted prices (unadjusted) in active markets for identical assets or liabilities
• Level 2: inputs other than quoted prices included within level 1 that are observable for the asset or liability, either directly (i.e. as prices) or indirectly (i.e. derived from prices).
• Level 3: inputs for the asset or liability that are not based on observable market data (unobservable inputs).
Fair value of financial assets and liabilities that are not measured at fair value (but fair value disclosures are required)With the exception of the trailing commission contract asset recognised at amortised cost and payables that are initially recognised at fair value and subsequently carried at amortised cost, the carrying amount of all financial assets and liabilities recognised in the Statement of Financial Position approximate their fair value.
Trailing commissions are received from lenders on settled loans over the life of the loan based on the loan book balance outstanding if the respective loans are in good order and not in default. The Group is entitled to the trailing commissions without having to perform further services. The Group also makes trailing commission payments to Members when trailing commission is received from lenders. Trail commissions are actuarially assessed on future cashflow based on a number of assumptions including estimated loan life, discount rate, payout ratio and income rate. Refer to Note 3 for the accounting policies regarding trail commissions
The trail commission assets and liabilities at 30 June 2019 relate to the Residential, Commercial and the AFGHLs white label loan books.
The movement in the future trail commission balances for the period are mostly attributable to the growth of the respective trail books over the financial year as opposed to any significant changes in the assumptions applied.
In thousands of AUD 30 June 2019 30 June 2018
Carrying amount Fair value Carrying amount Fair value
Contract Assets* Future Trail commission contract asset 899,727 922,409 805,053 832,315Financial liabilitiesFuture Trail commission payables 806,813 826,777 718,515 742,368
* Future trailing commission receivable was recognised as a financial asset under AASB 139 for the year ended 30 June 2018. It is now recognised as a contract asset under AASB 15. Refer to note 2(b)(i) for details.
For
per
sona
l use
onl
y

Notes to the Financial Statements (continued)
2019 ANNUAL REPORT86
The fair value of trail commission contract asset from lenders and the corresponding payable to brokers is determined by using a discounted cash flow valuation. These calculations require the use of assumptions which are determined by the management, using a variety of inputs including external actuarial analysis of historical information, by reference to market observable inputs. The valuation is classified as level 2 in the fair value measurement hierarchy.
The key assumptions underlying the fair value calculations of trail commission receivable and the corresponding payable to brokers at the reporting date is summarised in the following table:
30 June 2019 30 June 2018
Average loan life Between 3.2 and 5.1 years Between 3.2 and 5.0 yearsDiscount rate per annum1 Between 5% and 13.5% Between 5% and 13.5%Percentage paid to brokers2 Between 85% and 93.8% Between 85% and 93.4%
1 Discount rates once set are not adjusted during the life of the loan. The spread in discount rate captures loans settled in previous financial years (from approximately 2002) as well as the current financial year.
2 The percentage paid to brokers is fixed by the terms of their respective agreement with the Group. As a consequence, management does not expect
changes to the percentage paid to brokers to be reasonably possible.
30 Group entities
Composition of the Group
Country ofincorporation
Ownershipinterest
2019 2018
Parent entityAustralian Finance Group Limited Australia 100 100Significant subsidiariesAustralian Finance Group (Commercial) Pty Ltd Australia 100 100Australian Finance Group Securities Pty Ltd Australia 100 100AFG Securities Pty Ltd Australia 100 100AFG 2010-1 Trust Australia 100 100AFG 2013-2 Trust Australia - 100AFG 2016-1 Trust Australia 100 100AFG 2017-1 Trust Australia 100 100AFG 2018-1 Trust Australia 100 100AFG 2019-1 Trust Australia 100 -AFG 2010-2 Pty Ltd Australia 100 -New Zealand Finance Group Ltd New Zealand 100 100AFG Home Loans Pty Ltd Australia 100 100Investment in associatesThink Tank Group Pty Ltd Australia 33.55 33.55
AFG 2019-1 Trust and AFG 1010-2 Pty Ltd were opened and AFG 2013-2 Trust was closed during the year ended 30 June 2019.
For
per
sona
l use
onl
y

2019 ANNUAL REPORT 87
Notes to the Financial Statements (continued)
Additional disclosures with respect to Consolidated Structured Entities
Subscription of Subordinated Notes within the Trust Structures
As part of the funding arrangement for the Group’s Securitisation business the Company has subscribed for the subordinated note in each of the independent funding structures. These notes represent the first loss position for each of the securitisation vehicles. In the event that a loss is incurred in the relevant structure, then the balance of subordinated note is first applied against such losses. A loss would only be incurred within the respective Trust in the event that the sale of the underlying security was not sufficient to cover the loan balance, there was no mortgage insurance policy in existence and the loss could not be covered out of the excess spread generated by the respective Trust.
The weighted average loan to value ratio of all outstanding loans as at time of settlement was below 70% and as at year end, approximately 63% (2018: 65%) of the loans (in dollar value) have a lenders mortgage insurance policy which have been individually underwritten by a mortgage insurer. With respect to those loans which do not have mortgage insurance, the weighted average loan to value ratio for all of these loans is 32% (2018: 45%).
At no point since the inception of the Securitisation business has the subordinated note been required to be accessed to cover any lending losses within the respective Trusts.
In thousands of AUD 2019 2018
Subordinated notes held in AFG 2010-1 Trust and Series1 21,500 20,740Subordinated notes held in SPE-RMBS trusts following a term transaction:
• AFG 2013-2 - 750• AFG 2016-1 450 450• AFG 2017-1 560 560• AFG 2018-1 700 700• AFG 2019-1 3,925 -
1 The level of subordination subscribed by the company will increase or decrease over time depending upon a number of factors including the size of the warehouse or RMBS term structure as well as the ratings methodology used for these warehouse facilities
Other
Holders of RMBS are limited in their recourse to the assets of the Securitisation vehicle (subject to limited exceptions). AFG Group companies may however incur liabilities in connection with RMBS which are not subject to the limited recourse restrictions (for example where an AFG Group company acts as a trust manager or servicer of a Securitisation vehicle).
For
per
sona
l use
onl
y

Notes to the Financial Statements (continued)
2019 ANNUAL REPORT88
31 Parent entityThroughout the financial year ending 30 June 2019, the parent Company of the Group was Australian Finance Group Limited.
In thousands of AUD 2019 2018
Results of the parent entityProfit for the period 31,112 20,975Other comprehensive income - (15)Total comprehensive income for the period 31,112 20,960
In thousands of AUD 2019 2018
Financial position of parent entity at year end Current assets 230,075 202,286Total assets 965,132 863,306Current liabilities 250,551 224,774Total liabilities 899,659 807,370Total equity of the parent entity comprising of:Share capital 43,542 43,542Reserves 1,455 690Retained earnings 20,476 11,704Total equity 65,473 55,936
See Notes 32 and 33 for the parent entity capital and other commitments, and contingencies.
Refer to Note 21 (c) for the parent entity’s guarantees.
32 Capital and other commitmentsThere are no capital commitments as at the reporting date.
33 Contingencies
Third Party GuaranteesBank guarantees have been issued by third party financial institutions on behalf of the Group and its subsidiaries for items in the normal course of business such as operating lease contracts. The amounts involved are not considered to be material to the Group.
Contingent LiabilityThe contingent liability refers to the contingent consideration payable of $1,488k (2018: $1,488k) in relation to the Thinktank strategic investment.
Other than above, no material claims against these warranties have been received by the Group at the date of this report, and the Directors are of the opinion that no material loss will be incurred.
For
per
sona
l use
onl
y

2019 ANNUAL REPORT 89
Notes to the Financial Statements (continued)
34 Related parties
(a) Other related partiesA number of key management personnel held positions in other entities that result in them having control over the financial or operating policies of these entities.
A number of these entities transacted with the Group in the reporting period. The terms and conditions of the transactions with the other related parties were no more favourable than those available, or which might reasonably be expected to be available, on similar transactions to non-key management personnel related entities on an arm’s length basis.
The aggregate amounts recognised during the year relating to other related parties were as follows:
(i) During the year, the Group made payments to Genworth Mortgage Insurance Australia Limited, one of our providers of Lenders Mortgage Insurance (LMI). Mr T. Gill was a Non-Executive Director of Genworth Mortgage Insurance Australia Limited until 31 August 2018. These dealings were in the ordinary course of business and were on normal terms and conditions. The payments made for the provision of LMI policies up to 31 August 2018 were $326k (2018: $706k). These payments are not considered to be material to the financial results of the Group and therefore do not impact on Mr T. Gill’s independence as a Director.
(ii) Mr T. Gill is an Independent Director of First Mortgage Services (FMS), one of our providers of loan settlement services. During the year, the Group made payments to FMS. These dealings were in the ordinary course of business and were on normal terms and conditions. The payments made for the provision of the settlement services were $464k (2018: $333k). These payments are not considered to be material to the financial results of the Group and therefore do not impact on Mr T. Gill’s independence as a Director.
(iii) Establish Property Group Ltd (EPG) was created as part of the demerger of the property business on 22 April 2015. The Group’s head office is located at 100 Havelock Street West Perth. The Group leases these premises at commercial arm’s length rates from an investee of EPG, Qube Havelock Street Development Pty Ltd (Qube). AFG paid rent of $1,126k which has been paid to Qube. (2018: $1,583k).In addition to the above McCabe Street has an outstanding
loan owing to AFG amounting to $218k (2018: $209k), this loan is on commercial terms at arms-length. EPG and McCabe Street share some common directors with AFG.
(b) Subsidiaries Loans are made by the parent entity to wholly owned subsidiaries to fund working capital and purchases of shares from one subsidiary to the other subsidiary. Loans outstanding between the Company and its subsidiaries are unsecured, have no fixed date of repayment and are non-interest bearing. Interest-free loans made by the parent entity to all its subsidiaries are payable on demand.
35 Subsequent eventsOn 12 August 2019, the Group announced it had entered into a binding conditional implementation deed to merge with the mortgage aggregation business of Connective Group Pty Ltd. Under the transaction, Connective Group Pty Ltd will receive $60 million in cash and 30,886,441 AFG shares valuing the acquisition at $120 million, with AFG to primarily fund the cash component through a new corporate debt facility.
The transaction is conditional upon a court validating the transaction as not being unlawful or able to be set aside (a non customary condition), in addition to ACCC, AFG shareholder (if required), Connective Group shareholder approval and other customary approvals.
On 22 August 2019, the Directors declared the payment of a dividend of 5.9 cents per fully paid ordinary share, fully franked based on tax paid at 30%. The dividend has a record date of 9 September 2019 and a payment date of 3 October 2019. The aggregate amount of the proposed dividend expected to be paid out of retained earnings at 30 June 2019 is $12,755k. The financial effect of this dividend has not been brought to account in the financial statements for the year ended 30 June 2019.
Other than the above, there has not been any matter or circumstance, other than that referred to in the Financial Statements or notes thereto, that has arisen since the end of the financial year, that has significantly affected, or may significantly affect, the operations of the Group, the results of those operations, or the state of affairs of the Group in future financial years.
For
per
sona
l use
onl
y
Directors’ Declaration
2019 ANNUAL REPORT90
Directors’ DeclarationIn accordance with a resolution of the Directors of Australian Finance Group Limited, I state that:
In the opinion of the Directors:
a. The Financial Statements and Notes to the Financial Statements of Australian Finance Group Limited are in accordance with the Corporations Act 2001, including:
(i) Giving a true and fair view of the Consolidated entity’s financial position as at 30 June 2019 and of its performance for the year ended on that date
(ii) Complying with Australian Accounting Standards (including the Australian Accounting Interpretations) and the Corporations Regulations 2001
b. The Financial Statements and Notes to the Financial Statements also comply with International Financial Reporting Standards as disclosed in Note 2(a)
c. There are reasonable grounds to believe that the Company will be able to pay its debts as and when they become due and payable.
The Directors have been given the declarations by the Chief Executive Officer, and the Chief Financial Officer required by Section 295A of the Corporations Act 2001.
On behalf of the Board
Tony GillChairman Dated at Perth, Western Australia on 22 August 2019.
For
per
sona
l use
onl
y

2019 ANNUAL REPORT 91
Independent Audit Report to the members of Australian Finance Group Limited
For
per
sona
l use
onl
y

Independent Audit Report (continued)
2019 ANNUAL REPORT92
For
per
sona
l use
onl
y
2019 ANNUAL REPORT 93
Independent Audit Report (continued)
For
per
sona
l use
onl
y

Independent Audit Report (continued)
2019 ANNUAL REPORT94
For
per
sona
l use
onl
y

2019 ANNUAL REPORT 95
Independent Audit Report (continued)
For
per
sona
l use
onl
y
Shareholder Information (continued)
2019 ANNUAL REPORT96
Shareholder InformationAdditional information required by the Australian Stock Exchange Ltd (ASX) and not disclosed elsewhere in this report is set out below. The information is current as at 31 July 2019.
(a) Number of holders of equity securities
Ordinary share capital
214,812,671 fully paid ordinary shares are held by 2,796 individual shareholders
All issued ordinary shares carry one vote per share.
(b) Distribution of holders of equity securitiesThe number of shareholders by size of holding is set out below:
Range Securities % No. of holders %
100,001 and Over 181,123,153 84.32 60 2.1510,001 to 100,000 28,118,414 12.16 1,020 36.485,001 to 10,000 5,090,286 2.37 641 22.931,001 to 5,000 2,299,349 1.07 742 26.541 to 1,000 181,469 0.08 333 11.91Total 214,812,671 100 2,796 100Unmarketable Parcels* 945 0.00 66 2.36
* An unmarketable parcel is considered to be a shareholding of 258 shares or less, being a value of $500 or less in total, based on the Company’s last sale price on the ASX at 31 July 2019 of $1.94.
(c) Substantial shareholdersThe names and the number of securities held by substantial shareholders are set out below:
# Shares % of issued capital
Commonwealth Bank of Australia and its related bodies corporate 29,907,737 13.92%MBM Investments ATF The Brett McKeon Family Trust 21,179,773 9.86%MSW Investments ATF The Malcolm Stephen Watkins Family Trust 19,602,689 9.13%Oceancity Investments ATF The Matthews Family Trust 15,000,000 6.98%Banyard Holdings Pty Ltd ATF The B&K McGougan Trust 14,788,765 6.88%Australian Ethical Investment Limited 13,461,256 6.27%Milford Asset Management Limited 11,200,014 5.21%Renaissance Smaller Companies Pty Ltd 10,780,338 5.02%
For
per
sona
l use
onl
y

2019 ANNUAL REPORT 97
Shareholder Information (continued)
Twenty largest holders of quoted equity securities
Top holders # Shares % of issues capital
HSBC CUSTODY NOMINEES (AUSTRALIA) LIMITED 37,288,390 17.36
NATIONAL NOMINEES LIMITED 32,818,159 15.28CITICORP NOMINEES PTY LIMITED 28,742,171 13.38MBM INVESTMENTS PTY LTD THE BRETT MCKEON FAMILY 21,179,773 9.86OCEANCITY INVESTMENTS PTY LTD THE MATTHEWS FAMILY 15,000,000 6.98BANYARD HOLDINGS PTY LTD B & K MCGOUGAN 14,788,765 6.88JP MORGAN NOMINEES AUSTRALIA LIMITED 8,388,589 3.91
MRS KAREN JANE MCGOUGAN <B&K MCGOUGAN NO 2 A/C> 4,000,000 1.86ASSURED FINANCIAL SERVICES PTY LTD 2,000,000 0.93
NEWECONOMY COM AU NOMINEES PTY LIMITED <900 ACCOUNT> 1,917,825 0.89
LISA BEVAN 1,450,000 0.68ADRIEN MANN (SOUTH PACIFIC) PTY LTD 1,110,000 0.52
ANGELA MIDDLETON 1,000,250 0.47EDI NOMINEES PTY LTD <THE BUFFALO CREEK SUPER A/C> 1,000,000 0.47NOLDEX PTY LTD 643,545 0.30BNP PARIBAS NOMS PTY LTD <DRP> 529,883 0.25DAVID BAILEY 505,000 0.24EGMONT PTY LTD <CRAIG CARTER SUPER FUND A/C> 500,000 0.23B & J HODGES SUPERANNUATION <ARAKOOLA SUPER FUND A/C> 465,000 0.22PROJECT ADVISORY SERVICES PTY LTD <SUPER FUND A/C> 455,000 0.21
Company Secretary
Ms L. Bevan
Registered Office
Level 4, 100 Havelock Street, West Perth WA 6005
Share Registry
Link Market Service - Level 12, 680 George Street, Sydney NSW 2000For
per
sona
l use
onl
y

This page is intentionally left blank.
For
per
sona
l use
onl
y

2019 ANNUAL REPORT 99
Notice of AGMThe annual general meeting of Australian Finance Group Limited will be held on Friday 22 November 2019 at 9.00am WST at Level 4, 100 Havelock Street, West Perth WA 6005.
Corporate OfficeAustralian Finance Group LimitedLevel 4 100 Havelock Street West Perth WA 6005
Postal AddressPO Box 710 West Perth WA 6872
Phone 08 9420 7888
Email [email protected]
Website www.afgonline.com.au
Share RegistryLink Market ServicesLevel 12 680 George Street Sydney NSW 2000
Postal AddressLocked Bag A14 Sydney South NSW 1235
Phone 1300 554 474
Email [email protected]
Stock ListingAustralian Finance Group Limited’s ordinary shares are listed on the Australian Securities Exchange (ASX code: AFG).
Corporate DirectoryDirectorsAnthony (Tony) Gill(Non-Executive Chairman)
Brett McKeon(Non-Executive Director)
Malcolm Watkins(Executive Director)
Kevin Matthews(Non-Executive Director)
Craig Carter(Non-Executive Director)
Melanie Kiely(Non-Executive Director)
Jane Muirsmith(Non-Executive Director)
Company SecretaryLisa Bevan (Company Secretary)
For
per
sona
l use
onl
y

www.afgonline.com.au
Level 4, 100 Havelock StreetWest Perth WA 6005
T 08 9420 7888F 08 9420 6858
Australian Finance Group Ltd.
Australian Credit Licence: 389087
ABN: 11 066 385 822
ACN: 066 385 822
For
per
sona
l use
onl
y