report basics - cisco.com · † working with active radius sessions, ... for example, when you...
TRANSCRIPT
CiscoOL-26134-01
C H A P T E R 25
ReportingCisco Identity Services Engine (Cisco SE) reports are used with monitoring and troubleshooting features to analyze trends, monitor system performance and network activities from a central location. For more information, see Chapter 24, “Monitoring and Troubleshooting.”
This chapter explains the types of reports that are available in Cisco ISE. It also discusses the various ways that you can use report data, and how you can organize data for more effective use.
This chapter covers the following topics:
• Report Basics, page 25-1
• Catalog Reports, page 25-5
• Favorite Reports, page 25-8
• Shared Reports, page 25-10
• System Reports, page 25-10
• Organizing and Formatting Report Data, page 25-11
• Working with Active RADIUS Sessions, page 25-38
• Available Reports, page 25-41
Report BasicsCisco ISE collects log and configuration data from across your network, and it then aggregates the data into reports for you to view and analyze. Cisco ISE provides a standard set of predefined reports that you can use and customize to fit your needs.
The reports are grouped into logical categories for information related to authentication, session traffic, device administration, configuration and administration, and troubleshooting. For a complete list of Cisco ISE reports, see Available Reports, page 25-41.
Note All the reports except Favorite and Shared reports will be deleted after upgrade.
This section covers the following topics:
• Understanding Reports View and Interactive Viewer, page 25-2
• Running, Viewing, and Navigating Reports, page 25-3
• Exporting and Printing Reports, page 25-4
25-1 Identity Services Engine User Guide, Release 1.1.x

Chapter 25 Reporting Report Basics
• Deleting Reports, page 25-5
Understanding Reports View and Interactive ViewerYou can view, run, and customize report data using Reports View and Interactive Viewer for all types of reports.
Note Cisco does not recommend using Interactive Viewer in the following version 8 releases of Windows Internet Explorer running in a Microsoft Windows XP operating system environment:
• Version 8.0.6001.18702
• Version 8.0.6001.18702IC
About Reports View
The Reports View displays lists of catalog or favorites reports, allows you to run reports, view results, export data, and print information. Reports View displays automatically when you choose Operations > Reports > Catalog or Favorites.
• Catalog reports are preconfigured system reports that are standard in Cisco ISE. For more information, see Catalog Reports, page 25-5.
• Favorites reports are frequently used reports that you add to your Favorites page to make them easier to find. For more information, see Favorite Reports, page 25-8.
• Shared reports are reports that you make available for all users by placing them in a shared folder.
About Interactive Viewer
Interactive Viewer allows you to organize and format report data into tables, graphs, or charts. It also allows you to drill down for finer details, filter report data, customize your reports, and then save custom report designs for later use.
You access Interactive Viewer by clicking the Launch Interactive Viewer link on the toolbar that appears at the top of the window after you run a report.
Figure 25-1 Launch Interactive Viewer Icon
The Interactive Viewer toolbar appears, providing the tools for Organizing and Formatting Report Data, page 25-11. For specific information, see Working with the Interactive Viewer Toolbar, page 25-12.
Figure 25-2 Interactive Viewer Toolbar
25-2Cisco Identity Services Engine User Guide, Release 1.1.x
OL-26134-01

Chapter 25 Reporting Report Basics
Using Context Menu Shortcuts
Context menus provide shortcuts for performing formatting and organizing tasks, and they appear when you right-click a report item. Each context menu is specific to the item you right-click. For example, when you right-click a label, the context menu that appears supports formatting the label.
For more information:
See the Troubleshoot, page A-40 of Appendix A, “User Interface Reference,” for details on the fields.
Running, Viewing, and Navigating Reports This section describes how to run, view, and navigate reports using Reports View. You can specify time increments over which to display data in a report. Available time durations include the last 30 minutes, the last hour, the last 12 hours, yesterday, the last 7 days, or the last 30 days.
Prerequisite
You should have reviewed Understanding Reports View and Interactive Viewer, page 25-2.
To run, view, and navigate reports using the Reports View, complete the following steps:
Step 1 Choose Operations > Reports and Catalog or Favorites. This example uses catalog.
Step 2 Click a Report category from the Reports navigation pane.
Note Hover your mouse cursor over a report name to view a context-sensitive description for the report, along with its logging category, when applicable.
The page for the chosen report category appears.
Step 3 Run a report in one of the following ways:
• Click the radio button to the left of the report name, and then a time duration for the report from the Run drop-down list.
• Click the Report Name link to run the report for today only.
A page appears showing the report data.
Step 4 Enter report criteria for the selected report as needed, and then click Run. To reload the report data click the Reload link.
Step 5 Scroll down to view report results, expanding topic headings for more details.
Step 6 To move forward or back through the report, click the First, Prev, Next, or Last links on the toolbar. Or, jump directly to a specific page by entering the page number in the Go to Page text box, and then clicking Go.
Step 7 To view a table of contents, click the Toggle TOC icon on the toolbar, then click the desired report category in the navigation pane. Click the plus (+) icon to expand and view the contents.
For more information:
• Catalog Reports, page 25-5
• Favorite Reports, page 25-8
25-3Cisco Identity Services Engine User Guide, Release 1.1.x
OL-26134-01

Chapter 25 Reporting Report Basics
• Shared Reports, page 25-10
• System Reports, page 25-10
• Available Reports, page 25-41
• Reports, page A-15 for information on individual fields
Exporting and Printing ReportsAfter you run a report, you can export the data to a spreadsheet or print the data “as is.” You perform these tasks using the Print and Export icons on the toolbar.
Figure 25-3 Print and Export Icons
Exporting Report Data
You can export report data to an Excel spreadsheet as a comma-separated values (.csv) file, pipe-separated values (.psv) file, or a tab-separated values (.tsv) file.
Note Exported report records have a 5 k size limit. Check the size of the data prior to exporting, and export in bundles of 5 k or less.
Spreadsheet data is formatted like the data in the information object or the template. If you edit column headers or format numeric data in the report design, the spreadsheet does not reflect your edits. For more information, see Organizing and Formatting Report Data, page 25-11.
Prerequisite
Check the size of the report data you want to export. The data must be 5 k or less.
To export report data, complete the following steps:
Step 1 Run a report, as described in Running, Viewing, and Navigating Reports, page 25-3.
Step 2 In the top left-hand corner of the report summary page, click the Export Data icon. The Export Data dialog box appears.
Step 3 Choose an Available Results Set from the drop-down list.
Step 4 Specify the data columns that you want to export by selecting the names from the Available Columns list and clicking the arrow button (>) to move them to the Selected Columns list. Or click the double arrows button (>>) to select and move all the columns.
To move unwanted selected columns back to the Available Columns list, select the column and click the reverse arrow button (<). To move all the columns back, click the double reverse arrows button (<<).
Step 5 Choose an encoding style and separator type from their respective drop-down lists.
Step 6 Check the Export Column Data Type check box, and then click OK.
25-4Cisco Identity Services Engine User Guide, Release 1.1.x
OL-26134-01

Chapter 25 Reporting Catalog Reports
Printing a Report
You can print a report that appears in the viewer in HTML or PDF format. If you modify the report, you can choose to print the original report or the modified report. For more information, see Organizing and Formatting Report Data, page 25-11.
To print report data, complete the following steps:
Step 1 Run a report, as described in Running, Viewing, and Navigating Reports, page 25-3.
Step 2 In the top left-hand corner of the report summary page, click the Print Report icon. The Print dialog appears.
Step 3 Select a format, either HTML or PDF.
Step 4 For PDF, you can specify the size of the printout by selecting Auto, Actual Size, or Fit to Page.
Step 5 Specify the pages that you want printed by choosing either All, Current Page, or Pages. Then, enter a range of pages in the text field.
Step 6 Click OK. A printer-friendly formatted page appears, along with a Print dialog.
Step 7 Select the appropriate printer, and click OK.
For more information:
See the Reports, page A-15 of Appendix A, “User Interface Reference,” for details on the fields.
Deleting Reports You can only delete customized reports. You are not allowed to delete catalog system reports.
Prerequisites
You should have created a customized catalog or favorites report, as described in the following sections:
• Customizing Catalog Reports, page 25-6
• Editing or Deleting Favorite Reports, page 25-9
To delete a customized report, complete the following steps:
Step 1 Choose Operations > Reports > Catalog, Favorites, or Shared
Step 2 Navigate to the custom report and click the radio button next to the report name that you want to delete. The Delete button is activated.
Step 3 Click Delete, and then click Yes to confirm the action.
Catalog ReportsCatalog reports are preconfigured system reports. Reports of a similar nature are grouped in the same category. For a complete list of catalog reports, see Available Reports, page 25-41.
25-5Cisco Identity Services Engine User Guide, Release 1.1.x
OL-26134-01

Chapter 25 Reporting Catalog Reports
This section covers the following topics:
• Accessing Catalog Reports, page 25-6
• Customizing Catalog Reports, page 25-6
• Restoring Default Report Settings, page 25-7
Accessing Catalog ReportsThis section shows you how to access the various system reports that are standard with Cisco ISE. For a complete list of catalog reports, see Available Reports, page 25-41.
To access catalog reports, complete the following steps:
Step 1 Choose Operations > Reports > Catalog. A list of catalog report categories appears in the Reports navigation pane.
Step 2 Click a report category from the Reports navigation pane. A page for the chosen report category appears.
Note Hover your mouse cursor over a report name to display a context-sensitive description for the report, along with its logging category, when applicable.
Step 3 Click a report from the list, and perform any of the following tasks:
• Running, Viewing, and Navigating Reports, page 25-3
• Customizing Catalog Reports, page 25-6
• Exporting and Printing Reports, page 25-4
For more information:
See section of Appendix A, “User Interface Reference,” for details on the fields.
Customizing Catalog Reports You can customize a catalog report and save the changes as a new report, or restore the default report settings.
Note If you save a customized report with the same name as the original system report (overwriting the original system report), you will not be allowed to delete it. To restore a customized report to the default, preconfigured system report settings, see Restoring Default Report Settings, page 25-7.
To customize a catalog report, complete the following steps:
Step 1 Choose Operations > Reports > Catalog.
Step 2 Click a category in the Reports navigation pane.
A page for the chosen report category appears.
25-6Cisco Identity Services Engine User Guide, Release 1.1.x
OL-26134-01

Chapter 25 Reporting Catalog Reports
Step 3 Click a report from the list.
Step 4 Click Run, and then modify fields in the Run Reports page as needed.
Step 5 Click Run again, to incorporate the changes that you made to the fields.
Step 6 (Optional) Perform the tasks that are described in Organizing and Formatting Report Data, page 25-11.
Step 7 Click Save As and enter a unique report name.
For more information:
See the Reports, page A-15 of Appendix A, “User Interface Reference,” for details on the fields.
Restoring Default Report SettingsThis section shows you how to restore a customized system report, with the same name as the default system report, back to its default settings.
Take, for example, the RADIUS_authentication report. If you save a customized version of this report under the same name with date and time changes , when you reset the report, the original date and time are reinstated.
Note This procedure resets all the reports in a particular catalog category. For example, if you reset a customized report that resides in the Endpoint category, this procedure resets all other reports within the Endpoint category as well.
Prerequisites
Before you begin this task, you should have customized a catalog report, as described in Customizing Catalog Reports, page 25-6.
To restore default report settings, complete the following steps:
Step 1 Choose Operations > Reports > Catalog.
Step 2 Click the category of the customized report from the Reports navigation pane.
Step 3 Click Reset Reports.
Step 4 Click Yes to confirm that you want to reset all the catalog reports in the selected category to their factory defaults.
For more information:
See the Reports, page A-15 of Appendix A, “User Interface Reference,” for details on the fields.
25-7Cisco Identity Services Engine User Guide, Release 1.1.x
OL-26134-01

Chapter 25 Reporting Favorite Reports
Favorite Reports You can add reports that you use frequently to a list of favorites to make them easier to find, similar to how you bookmark favorite websites in a browser. You can view and edit the parameters of your favorite reports, and then save the customized reports for reuse.
Note Every administrator account is assigned one or more administrative roles. Depending upon the roles that are assigned to your account, you may not be able to perform the tasks that are described in this section.
This section contains the following topics:
• Adding Favorite Reports, page 25-8
• Viewing Report Parameters, page 25-9
• Editing or Deleting Favorite Reports, page 25-9
Adding Favorite Reports You can add preconfigured catalog system reports to your favorites list, as well as reports that you have customized.
The following preconfigured catalog system reports are available in Operations > Reports > Favorites by default:
• Authentications - RADIUS - Today—A report that is preconfigured from AAA Protocol > RADIUS_Authentication to run for the current system date.
• Authentications - RADIUS - Yesterday—A report that is preconfigured from AAA Protocol > RADIUS_Authentication to run for the previous day from the current system date.
• ISE-Server Configuration Audit - Today—A report that is preconfigured from Server Instance > Server_Configuration_Audit to run for the current system date.
• ISE-System Diagnostics -Today—A report that is preconfigured from Server Instance > Server_System_Diagnostics to run for the current system date.
This section shows you how to create a favorites list.
Prerequisites
Before beginning this task, you should have successfully completed Running, Viewing, and Navigating Reports, page 25-3.
To add a report to your favorites list, complete the following steps:
Step 1 Choose Operations > Reports > Catalog.
Step 2 Click a category in the Reports navigation pane.
A page for the chosen report category appears.
Step 3 Click a report from the list.
Step 4 Click Add to Favorite.
Step 5 Specify the following information in the Add to Favorite page:
a. Enter a unique favorite name.
25-8Cisco Identity Services Engine User Guide, Release 1.1.x
OL-26134-01

Chapter 25 Reporting Favorite Reports
b. Enter a server IP address, or choose one from the drop-down list.
c. Choose a time range from the drop-down list.
d. If you specified a custom time range, specify a start date and an end date for the report by clicking the calendar icon and selecting a date.
Step 6 Click Add to Favorites. The report appears in your Favorites list.
For more information:
See the Reports, page A-15 of Appendix A, “User Interface Reference,” for details on the fields.
Viewing Report ParametersBefore running a Favorites report, you can view and edit the report parameters.
To view the parameters of a report, complete the following steps:
Step 1 Choose Operations > Reports > Favorites.
Step 2 Check the check box next to the report for which you want to view the parameters, and then click Parameters.
A dialog box appears, listing the parameters in your report with their respective values.
Step 3 Click Cancel to return to the Favorites report.
For more information:
See the Reports, page A-15 of Appendix A, “User Interface Reference,” for details on the fields.
Editing or Deleting Favorite ReportsAfter you view the existing parameters in your favorite report, you can edit them.
To edit the parameters in your favorite reports, complete the following steps:
Step 1 Choose Operations > Reports > Favorites.
A list of your favorite reports appears.
Step 2 To edit a report, check the check box next to the report and click Edit.
The Edit Favorite page appears.
Step 3 Modify the values for the parameters as needed.
Step 4 Do one of the following:
• To save the changes, click Edit Favorite.
• To restore the original values, click Reset.
• To cancel the changes and return to the Favorites page, click Cancel.
25-9Cisco Identity Services Engine User Guide, Release 1.1.x
OL-26134-01
Chapter 25 Reporting Shared Reports
A status message appears, stating that the report was successfully edited.
Step 5 To customize the display of a favorite report, see Organizing and Formatting Report Data, page 25-11.
Step 6 To save your customizations, see Saving Customized Reports, page 25-38.
Step 7 To delete a favorite report, check the check box next to the report and click Delete.
For more information:
See the Reports, page A-15 of Appendix A, “User Interface Reference,” for details on the fields.
Shared Reports You can share selected reports, making them available to other users. You share reports by adding them to a Shared folder.
To share reports with other users, complete the following steps:
Step 1 Choose Operations > Reports > Catalog or Favorites, and select the report that you want to share.
Step 2 Run the report, as described in Running, Viewing, and Navigating Reports, page 25-3
Step 3 Launch the report in the Interactive Viewer, as described in Working with the Interactive Viewer Toolbar, page 25-12.
Step 4 Click the Save icon in the upper-left corner of the Interactive Viewer. The Save dialog box appears.
Step 5 In the Save dialog box, do the following:
a. In the Choose a Folder list, choose Shared by double clicking on Shared in the list. The Admin > Shared window would be displayed.
b. Enter a unique filename for the report.
c. Choose a format from the Save as Type drop-down list.
Step 6 Click Save.
The report appears in your Shared folder and is available for all users.
System Reports System reports allow you to view different types of system data, so that you can better monitor your Cisco ISE network. System reports include the following:
• Data Management
– Administration Node: Backup History, Restore History
– Monitoring Node: Backup History, Purging History
• Licensing History
• Log Collection Status, for Cisco ISE servers
25-10Cisco Identity Services Engine User Guide, Release 1.1.x
OL-26134-01
Chapter 25 Reporting Organizing and Formatting Report Data
Note The logging function that reports on system diagnostics is not enabled in Cisco ISE by default. To enable system diagnostic reports, see the “Enabling System Diagnostic Reports in Cisco ISE” section of the Cisco Identity Services Engine Hardware Installation Guide, Release 1.1.x.
To view history related system reports, complete the following steps:
Step 1 Choose Operations > Reports > System.
Step 2 In the System navigation pane, do one of the following:
• Click Data Management and then do one of the following:
– Click Administration Node, and then click Backup History or Restore History. A history report for your selection appears.
– Click Monitor Node, and then click Backup History or Purging History. A history report for your selection appears.
• Click License History. A history report for your selection appears.
Step 3 To filter applicable report data, see Filtering Report Data, page 25-23.
To view a log collection status report, complete the following steps:
Step 1 Choose Operations > Reports > System.
Step 2 In the System navigation pane, choose Log Collection Status. A list of server log collections appears in the Log Collection Status page.
Step 3 To view a log collection, click the radio button next to a server name, and then click Get Details.
Step 4 To update the report information, click Refresh.
Step 5 To return to the list of server log collections, click Back.
Organizing and Formatting Report DataYou can modify the layout of reports, customize the display, and reformat the data. After you access a data source and select the data set to use, you determine the best way to display the data in a report.
This section covers the following topics:
• Working with the Interactive Viewer Toolbar, page 25-12
• Grouping, Sorting, and Hiding Data, page 25-12
• Changing Column Layouts, page 25-17
• Creating Report Calculations, page 25-20
• Filtering Report Data, page 25-23
• Working with Aggregate Data, page 25-27
• Working with Charts, page 25-28
25-11Cisco Identity Services Engine User Guide, Release 1.1.x
OL-26134-01

Chapter 25 Reporting Organizing and Formatting Report Data
• Formatting Reports, page 25-31
• Saving Customized Reports, page 25-38
Working with the Interactive Viewer ToolbarThe majority of the data formatting and organizing tasks are performed from the Interactive Viewer, working with the utilities that are shown on the toolbar. Hover your mouse cursor over a toolbar icon to display a tooltip with the name of the utility. The organizing and formatting data tasks refer to these icons, as appropriate.
Figure 25-4 Interactive Viewer Toolbar
In many cases, you have the option of using context menu shortcuts to access the same functionality as the icons shown on the toolbar.
To display and use the Interactive Viewer toolbar, complete the following steps:
Step 1 Select Operations > Reports > Catalog. Then select and run a report.
Step 2 In the upper right-hand corner of the Reports View page, click Launch Interactive Viewer. The toolbar appears at the top of the page.
Step 3 To activate the toolbar, click a column or other element in the report. The tools that are applicable to the selected element become active.
Note If you select inside a heading row, the tools for formatting text are activated. To activate the rest of the tools on the toolbar, click the bottom line of the heading.
For more information:
See Troubleshoot, page A-40 of Appendix A, “User Interface Reference,” for details on the fields.
Grouping, Sorting, and Hiding DataA group displays all the information about a type of item in one place, which allows you to better compare values and make assessments of the data. If a report presents all its data in an unorganized list, it is difficult to make comparisons and calculate values.
For example, you might group all the information about one customer to see how much that client ordered from your company in a specific quarter. And then you might group information about another customer for another quarter, and so on.
This section covers the following tasks:
• Grouping Data, page 25-13
25-12Cisco Identity Services Engine User Guide, Release 1.1.x
OL-26134-01

Chapter 25 Reporting Organizing and Formatting Report Data
• Sorting Data, page 25-14
• Hiding and Displaying Report Items, page 25-15
• Hiding and Displaying Column Data, page 25-16
Grouping Data
To organize information into a useful report, you create data groups. Data groups contain related data rows. For each group, you can show aggregate data, such as the total purchase price or a count of the items in a group. Grouping data gives your report a more polished, organized look, and it makes it easier to create useful comparisons and calculations.
The grouped-data changes that you make do not affect the report design. You can save the report output to reflect your changes.
Adding Groups
You can add groups in Interactive Viewer if the report design does not contain the desired grouping.
To create a data group, complete the following steps:
Step 1 Open and run a report, as described in Running, Viewing, and Navigating Reports, page 25-3, and then click Launch Interactive Viewer.
Step 2 Do one of the following:
• Click to highlight the column that you want to use to create a group, and then click the Add Group icon on the toolbar.
• Right-click the column that you want to use to create a group, and choose Group > Add Group from the context menu.
The new group appears in the viewer, expanding to show all the detail rows.
Step 3 (Optional) To collapse the group, click the minus sign ( - ) next to the group name.
Step 4 To save your changes, see Saving Customized Reports, page 25-38.
Grouping Based on Date and Time
When you create a group based on a column that contains date or time data, you can set a grouping interval. For example, if the column contains time data, you can group hours, minutes, or seconds.
To create a group based on date and time, complete the following steps:
Step 1 Open and run a report, as described in Running, Viewing, and Navigating Reports, page 25-3, and then click Launch Interactive Viewer.
Step 2 Do one of the following:
• Click to highlight the column that you want to use to create a group, and then click the Add Group icon on the toolbar.
• Right-click the column that you want to use to create a group, and choose Group > Add Group from the context menu.
25-13Cisco Identity Services Engine User Guide, Release 1.1.x
OL-26134-01
Chapter 25 Reporting Organizing and Formatting Report Data
The Group Detail dialog box appears. To show every date or time value, leave the default setting Group Using Individual Values.
Step 3 (Optional) To set a grouping interval, choose Group Every, enter a value, and select the grouping interval. For example, to create a new group for every month, enter 1, and choose Month from the drop-down list.
Step 4 To save your changes, see Saving Customized Reports, page 25-38.
Removing an Inner Group
You can remove data groups in Interactive Viewer to attain the desired groupings.
To remove a specific data grouping, complete the following steps:
Step 1 Open and run a report, as described in Running, Viewing, and Navigating Reports, page 25-3, and then click Launch Interactive Viewer.
Step 2 Do one of the following:
• Click to highlight the column that you want to use to create a group, and then click the Delete Inner Group icon on the toolbar.
• Right-click the column that you want to use to create a group, and choose Group > Delete Inner Group from the context menu.
Step 3 To save your changes, see Saving Customized Reports, page 25-38.
Sorting Data
The data source determines the default sort order of the data rows in the report. Typically, data appears randomly, so sorting is an important task in creating a useful report. You can sort single data columns or multiple columns.
Sorting a Single Column
You can sort a single column of data in ascending order or descending order.
To sort a single data column, complete the following steps:
Step 1 Open and run a report, as described in Running, Viewing, and Navigating Reports, page 25-3, and then click Launch Interactive Viewer.
Step 2 Choose a column in the report and do one of the following:
• Right-click and choose Sort > Ascending or Sort > Descending from the context menu.
• Click either the Sort Ascending or Sort Descending icon on the toolbar.
Step 3 (Optional) To return the data to its original order, click the Undo icon on the toolbar.
Step 4 To save your changes, see Saving Customized Reports, page 25-38.
25-14Cisco Identity Services Engine User Guide, Release 1.1.x
OL-26134-01

Chapter 25 Reporting Organizing and Formatting Report Data
Sorting Multiple Columns
You can sort multiple columns of data in a report, however, it is important to understand the order of precedence for the sort. Using Advanced Sort, the first column that you select becomes the primary sorting column, and the other columns are sorted in relation to the primary column.
For example, if the primary (first sorted) column is Customer Names and it is sorted in ascending order, the customers are shown in alphabetical order. If the next column that you select for sorting is Location, the order is also ascending, and within each Customer entry, the locations are sorted in ascending order. If the third column that you select for sorting is Order Number, the order is ascending, and within each location, the order numbers are sorted in ascending order.
Note If the report uses grouped data, the drop-down lists in Advanced Sort show only the detail columns in the report, not the columns that you used to group the data.
To sort multiple data columns, complete the following steps:
Step 1 Open and run a report, as described in Running, Viewing, and Navigating Reports, page 25-3, and then click Launch Interactive Viewer.
Step 2 Right-click inside the primary sorting column, and choose Sort > Advanced Sort from the context menu.
Step 3 Choose a column from the first drop-down list, and click either the Ascending or Descending radio button.
Step 4 Right-click the next column, choose a sort order, and so on.
Step 5 To save your changes, see Saving Customized Reports, page 25-38.
Hiding and Displaying Report Items
You can hide and show selected items in a report.
To hide and display selected report items, complete the following steps:
Step 1 Open and run a report, as described in Running, Viewing, and Navigating Reports, page 25-3, and then click Launch Interactive Viewer.
Step 2 Right-click inside a column, and choose Hide or Show Items from the context menu. The Hide or Show Items dialog box appears.
Step 3 Do any of the following:
• Click to select any items that you want to hide.
• Click to deselect any hidden items that you want to display.
• To display all hidden items, click Clear.
Step 4 Click Apply.
Step 5 To save your changes, see Saving Customized Reports, page 25-38.
25-15Cisco Identity Services Engine User Guide, Release 1.1.x
OL-26134-01

Chapter 25 Reporting Organizing and Formatting Report Data
Hiding and Displaying Column Data
There may be times when you do not want to display all the data in a report. For example, a column of detail can display duplicate values in consecutive data rows. In this case, suppressing consecutive duplicate values makes the report easier to read. You can also choose to collapse groups or sections, so that you display only the column headings and summary data, such as aggregate data rows.
This section covers the following tasks:
• Suppressing and Displaying Repeated Values, page 25-16
• Hiding or Displaying Detail Rows in Groups or Sections, page 25-16
Suppressing and Displaying Repeated Values
Data rows appear in the report exactly as they appear in the data source, which may include rows with duplicate values. To make the report easier to read, you can choose to suppress the display of the repeated values. This suppression only alters the visual display and not the data source itself. You can later choose to redisplay the repeated values at any time.
To suppress and display repeated values in a report, complete the following steps:
Step 1 Open and run a report, as described in Running, Viewing, and Navigating Reports, page 25-3, and then click Launch Interactive Viewer.
Step 2 Right-click inside a column, and choose Hide or Show Items from the context menu. The Hide or Show Items dialog box appears.
Step 3 Do any of the following:
• Click to select any items that you want to hide.
• Click to deselect any hidden items that you want to display.
• To display all hidden items, click Clear.
Step 4 Click Apply.
Step 5 To save your changes, see Saving Customized Reports, page 25-38.
Hiding or Displaying Detail Rows in Groups or Sections
If a report contains groups, you can easily collapse and expand a group to hide and show its contents.
To hide and display detail rows in groups or sections, complete the following steps:
Step 1 Open and run a report, as described in Running, Viewing, and Navigating Reports, page 25-3, and then click Launch Interactive Viewer.
Step 2 To collapse a group or section, right-click the group or section and choose Group > Hide Detail from the context menu.
Step 3 To redisplay the group or section, right-click inside the report and choose Group > Show Detail.
Step 4 To save your changes, see Saving Customized Reports, page 25-38.
25-16Cisco Identity Services Engine User Guide, Release 1.1.x
OL-26134-01

Chapter 25 Reporting Organizing and Formatting Report Data
Changing Column LayoutsYou can change the display of columns and their content. This section shows you how to perform the following tasks:
• Modifying Column Display, page 25-17
• Realigning Column Data, page 25-17
• Hiding and Displaying Columns, page 25-19
• Merging Columns, page 25-19
• Selecting a Column from a Merged Column, page 25-19
• Moving Data from a Group Column into the Header, page 25-20
Modifying Column Display
The default formatting for column data comes from the data source. You can modify the default formatting of column data to enhance the appearance and readability of the report. When you format column data, the format changes are applied to the entire column, with the exception of the column header and aggregate rows. You are not allowed to modify the data itself.
To modify the formatting of column data, complete the following steps:
Step 1 Open and run a report, as described in Running, Viewing, and Navigating Reports, page 25-3, and then click Launch Interactive Viewer.
Step 2 Right-click inside a column and choose Style > Font from the context menu.
Step 3 In the Font dialog box, modify the style properties as desired. You can see your changes applied immediately in the Preview field.
Step 4 Indicate whether to apply the new text style to all columns in the report or only to the selected column. The default setting is to apply the new style only to the selected column.
Step 5 Click Apply.
Step 6 To save your changes, see Saving Customized Reports, page 25-38.
Realigning Column Data
You can easily change the alignment of data in individual columns in a report, to enhance readability and visual appeal. The default is to align column data along the left side of the column. You can also choose to center the data or align it along the right-hand side of the column. Select the alignment that is best suited for your report data.
25-17Cisco Identity Services Engine User Guide, Release 1.1.x
OL-26134-01

Chapter 25 Reporting Organizing and Formatting Report Data
To change the alignment of column data, complete the following steps:
Step 1 Open and run a report, as described in Running, Viewing, and Navigating Reports, page 25-3, and then click Launch Interactive Viewer.
Step 2 Select a column to highlight, and then do one of the following:
• To align column data to the left, click the Align Left icon on the toolbar. This setting is the default.
• To center the column data, click the Align Center icon on the toolbar.
• To align column data to the right, click the Align Right icon on the toolbar.
Step 3 Repeat Step 2 with other columns in the report, as desired.
Step 4 To save your changes, see Saving Customized Reports, page 25-38.
Reordering and Removing Columns
Note When you remove a column from the report, you are not deleting the column from the information object or other data source. You are only removing the information from the report display.
To reorder a column, complete the following steps:
Step 1 Open and run a report, as described in Running, Viewing, and Navigating Reports, page 25-3, and then click Launch Interactive Viewer.
Step 2 Do one of the following:
• Click the Reorder Columns icon on the toolbar.
• Right-click inside a column and choose Column > Reorder Columns from the context menu.
Note You can select only detail rows, not groups or sections.
Step 3 Click a column header from the Arrange Columns dialog box, and click the Up or Down arrows until the column is in the desired position.
Step 4 Repeat Step 3 until all columns are in the desired order, and then click Apply. The order of the columns changes to match your selections.
Step 5 To save your changes, see Saving Customized Reports, page 25-38.
To remove a column, complete the following steps:
Step 1 Open and run a report, as described in Running, Viewing, and Navigating Reports, page 25-3, and then click Launch Interactive Viewer.
Step 2 To remove a single column, click that column, and then click the Delete icon on the toolbar.
Step 3 To remove multiple columns press the Control key, and click the columns that you want to remove. Then click the Delete icon on the toolbar.
25-18Cisco Identity Services Engine User Guide, Release 1.1.x
OL-26134-01

Chapter 25 Reporting Organizing and Formatting Report Data
Step 4 To save your changes, see Saving Customized Reports, page 25-38.
Hiding and Displaying Columns
To hide and display columns, complete the following steps:
Step 1 Open and run a report, as described in Running, Viewing, and Navigating Reports, page 25-3, and then click Launch Interactive Viewer.
Step 2 To hide a column, select the column and do one of the following:
• Click the Hide Column icon on the toolbar.
• Right-click and choose Column > Hide Column.
Step 3 To redisplay hidden columns, select a column and do one of the following:
• Click the Show Columns icon on the toolbar.
• Right-click and choose Column > Show Columns.
Step 4 To save your changes, see Saving Customized Reports, page 25-38.
Merging Columns
To merge columns, complete the following steps:
Step 1 Open and run a report, as described in Running, Viewing, and Navigating Reports, page 25-3, and then click Launch Interactive Viewer.
Step 2 To merge data in multiple columns, choose the desired columns using the Control and arrow keys, and do one of the following:
• Click the Merge Columns icon on the toolbar.
• Right-click and choose Column > Merge Columns from the context menu.
Step 3 To save your changes, see Saving Customized Reports, page 25-38.
Selecting a Column from a Merged Column
You can aggregate, filter, and group data in a column that contains merged data from multiple columns. However, you first need to select one of the columns on which to aggregate, filter, or group the data.
To select column data from merged columns, complete the following steps:
Step 1 Open and run a report, as described in Running, Viewing, and Navigating Reports, page 25-3, and then click Launch Interactive Viewer.
Step 2 Right-click the merged column, and choose a command from the context menu, such as Aggregation, Filter > Filter, or Group > Add Group. The Select Data Item dialog box appears.
If you need to provide more information, a dialog box appears. For example, if you choose Aggregation, the Aggregation dialog box appears.
25-19Cisco Identity Services Engine User Guide, Release 1.1.x
OL-26134-01

Chapter 25 Reporting Organizing and Formatting Report Data
Step 3 From the Select Data drop-down list, choose the column name to which the command will be applied, and then click Apply.
Step 4 To save your changes, see Saving Customized Reports, page 25-38.
Moving Data from a Group Column into the Header
You can move data from a group column into the header.
To move data from columns to group headers, complete the following steps:
Step 1 Open and run a report, as described in Running, Viewing, and Navigating Reports, page 25-3, and then click Launch Interactive Viewer.
Step 2 Create a group, as described in Adding Groups, page 25-13.
Step 3 Right-click inside a column and choose Column > Move to Group Header. Then, click a group name from the drop-down list.
Step 4 Click a header row value from the drop-down list.
Step 5 Click Apply. The data value from the specified row in the selected group appears in the group column header.
Creating Report CalculationsMost reports require calculations to track sales, finances, inventory, and other critical business activities. You can use typical mathematical functions such as counting, addition, subtraction, multiplication, and division. In addition, you can write expressions that extend these basic functions.
This section covers the following topics:
• Creating a Calculated Column, page 25-20
• Using Numbers and Dates in an Expression, page 25-21
• Multiplying Values in Calculated Columns, page 25-21
• Adding Days to an Existing Date Value, page 25-22
• Subtracting Date Values in a Calculated Column, page 25-22
Creating a Calculated Column
Displaying calculated data in a report requires that you create a calculated column.
To create a calculated column, complete the following steps:
Step 1 Open and run a report, as described in Running, Viewing, and Navigating Reports, page 25-3, and then click Launch Interactive Viewer.
Step 2 Click a report column and then click the Add Calculation icon. The Calculation dialog box appears. The new calculated column appears to the right of the column that you selected.
25-20Cisco Identity Services Engine User Guide, Release 1.1.x
OL-26134-01

Chapter 25 Reporting Organizing and Formatting Report Data
Step 3 In the Column Label text box, enter a header for the calculated column. The header must start with a letter and can contain only letters, numbers, underscores, and spaces.
Step 4 Enter an expression in the Enter Expression text box that indicates the data to use and how to display the calculated data. Follow the guidelines in Using Numbers and Dates in an Expression, page 25-21, as needed.
The expression contains a function and one or more arguments. Arguments indicate the data that you want to use to create the calculation.
Step 5 Click a function and provide the argument.
Step 6 To save your changes, see Saving Customized Reports, page 25-38.
For more information:
See Reports, page A-15 of Appendix A, “User Interface Reference,”
Using Numbers and Dates in an Expression
When you create an expression that contains a number, the number should be typed according to the conventions of the U.S. English locale. In other words, use a period (.), not a comma (,), as the decimal separator. For example:
Correct: 1234.56
Incorrect: 1234,56
When you create an expression that contains a date, type the date according to the conventions of the locale that you chose when you logged in. For example, in the French (France) locale, type 03/12/2007 to represent December 3, 2007, not 12/03/2007. You can enter a date, or a date and time. Dates and times must be enclosed in double quotes (""), for example:
"03/12/2007"
"03/12/2007 11:00 AM"
Multiplying Values in Calculated Columns
To multiply values in a calculated column, complete the following steps:
Step 1 Open and run a report, as described in Running, Viewing, and Navigating Reports, page 25-3, and then click Launch Interactive Viewer.
Step 2 Click a report column and then click the Add Calculation icon. The Calculation dialog box appears. The new calculated column appears to the right of the column that you selected.
Step 3 In the Column Label text box, enter a header for the calculated column. The header must start with a letter and can contain only letters, numbers, underscores, and spaces.
Step 4 In the Enter Expression text box, enter a left square bracket ([). A list of the columns in the report appears. This list includes any calculated columns that the report contains.
Click the column that contains the multiplier. For example, to multiply a unit price times the quantity ordered, click the column that contains unit prices.
Step 5 Enter an asterisk (*) as the multiplication operator. You do not need to include a space after the column name.
25-21Cisco Identity Services Engine User Guide, Release 1.1.x
OL-26134-01

Chapter 25 Reporting Organizing and Formatting Report Data
Step 6 Enter another left square bracket ([) and click the multiplicand. For example, if the multiplier is the unit price, click the column that contains the quantity ordered as the multiplicand.
Step 7 To verify the expression, click Validate. If the expression syntax is correct, the dialog box displays a validation message. If the expression syntax is incorrect, the dialog box displays a message explaining the error.
Step 8 After validating the expression, click Apply. The calculated column appears in the report.
Step 9 To save your changes, see Saving Customized Reports, page 25-38.
Adding Days to an Existing Date Value
To add days to an existing date value, complete the following steps:
Step 1 Open and run a report, as described in Running, Viewing, and Navigating Reports, page 25-3, and then click Launch Interactive Viewer.
Step 2 Click a column in a report and then click the Add Calculation icon. The Calculation dialog box appears. The new calculated column appears to the right of the column that you selected.
Step 3 In the Column Label text box, enter a name for the calculated column. For example, enter the Forecast Shipping Date.
Step 4 In the Enter Expression text box, enter A. A drop-down list appears, displaying functions that begin with A.
Step 5 Choose ADD_DAY(date, daysToAdd).
Step 6 For the first argument, enter a left square bracket ([) and choose the date column from the drop-down list. For example, choose Order Date.
Step 7 For the second argument, enter the number of days to add. In this case, enter 7.
Step 8 Validate the expression, and then click Apply.
The new calculated column appears in the report. For every value in the Order Date column, the calculated column displays a date seven days later than the order date.
Step 9 To save your changes, see Saving Customized Reports, page 25-38.
Subtracting Date Values in a Calculated Column
To display the difference between two date values, complete the following steps:
Step 1 Open and run a report, as described in Running, Viewing, and Navigating Reports, page 25-3, and then click Launch Interactive Viewer.
Step 2 Choose a report column and then click the Add Calculation icon. The Calculation dialog box appears. The new calculated column appears to the right of the column you selected.
Step 3 In the Column Label text box, enter a name for the calculated column. For example, to subtract the actual shipping date from the date requested, enter Shipping Delay.
Step 4 In the Enter Expression text box, enter D. A drop-down list appears, displaying functions that begin with D.
25-22Cisco Identity Services Engine User Guide, Release 1.1.x
OL-26134-01

Chapter 25 Reporting Organizing and Formatting Report Data
Step 5 Choose DIFF_DAY(date1, date2).
Step 6 For the first argument, enter a left square bracket ([) and choose the first date column from the drop-down list. For example, choose Date Requested.
Step 7 For the second argument, enter a left square bracket ([) and choose the second date column from the drop-down list. For example, choose Actual Shipping Date.
Step 8 Validate the expression, and then click Apply. The new calculated column appears in the report, displaying the difference between the two dates.
Step 9 To save your changes, see Saving Customized Reports, page 25-38.
Filtering Report DataFilters limit the data that appears in reports. For example, by using a database of customer data, you can use filters to run a report that lists only the customers in a specific state or province, or only the customers whose purchases total more than US$1.5 million. To limit the data even more, you can, for example, list customers in a specific state who have credit limits of less than US$50,000 and who have not made a purchase in the past 90 days.
This section contains the following topics:
• Creating Filters, page 25-23
• Creating a Multiple Condition Filter, page 25-25
• Working with Aggregate Data, page 25-27
• Creating a Multiple Condition Filter, page 25-25
• Deleting One Condition in a Multiple Condition Filter, page 25-26
Creating Filters
A filter is based on one or more fields in a report. To create a filter based on a single field, you select a condition and a value. For example, you can create a filter that returns values that are equal to a specified value, less than a specified value, between two values, and so on.
To create a data filter, complete the following steps:
Step 1 Open and run a report, as described in Running, Viewing, and Navigating Reports, page 25-3, and then click Launch Interactive Viewer.
Step 2 Select a column, and do one of the following:
• Click the Filter icon on the toolbar.
• Right-click and choose Filter > Filter from the context menu.
The Filter dialog appears.
Note If the detail column that you selected is a merged column, the Select Data Item dialog box appears.
Step 3 Choose a condition from the drop-down list. Additional fields may appear, depending on the condition that you choose.
25-23Cisco Identity Services Engine User Guide, Release 1.1.x
OL-26134-01

Chapter 25 Reporting Organizing and Formatting Report Data
Step 4 Do one of the following:
• Enter values for each field. To view all possible values, click Select Values and then choose a value from the drop-down list.
• To search for a value, enter the value in the Find Value text box, and click Find. All values that match your filter text are returned. Double-click a value to select it. The value appears in the Value text box.
Step 5 Click Apply.
Step 6 To save your changes, see Saving Customized Reports, page 25-38.
For more information:
See Filters, page A-38 of Appendix A, “User Interface Reference,”.
Modifying or Removing a Filter
After you create a filter for a report, it is easy to change or remove the filter, as shown in the following task.
Prerequisites
Before you begin, you should have successfully completed the task for Creating Filters, page 25-23.
To modify or remove a data filter, complete the following steps:
Step 1 Select the column that uses the filter, and do one of the following:
• Click the Filter icon on the toolbar.
• Right-click and choose Filter > Filter from the context menu.
The Filter dialog box appears, displaying the existing filter condition.
Step 2 To modify the filter, change the condition or values.
Step 3 To remove the filter, click Clear.
Step 4 Click Apply.
Step 5 To save your changes, see Saving Customized Reports, page 25-38.
For more information:
See Filters, page A-38 of Appendix A, “User Interface Reference,”.
Filtering for Highest or Lowest Values
When a table contains hundreds of rows, it can be helpful to display the highest or lowest values in a column. For example, you might want to view the ten sales representatives who produce the most revenue or the top 25 percent of energy consumers.
25-24Cisco Identity Services Engine User Guide, Release 1.1.x
OL-26134-01

Chapter 25 Reporting Organizing and Formatting Report Data
Prerequisites
Before you begin, you should have successfully completed the task for Creating Filters, page 25-23.
To filter for highest or lowest values, complete the following steps:
Step 1 Right-click inside a column and choose Filter >Top or Bottom N from the context menu. The Top or Bottom N dialog box appears.
Step 2 From the Filter drop-down list, choose a particular number or percentage of rows.
Step 3 Enter a value in the text box next to the Filter menu to specify the number or percentage of rows to display.
Step 4 Click Apply.
Step 5 To save your changes, see Saving Customized Reports, page 25-38.
For more information:
See Filters, page A-38 of Appendix A, “User Interface Reference,” for details on the fields.
Creating a Multiple Condition Filter
You can create a filter with more than one condition. For example, you can create a filter that retrieves the names of customers who have a specific credit rank and who have open orders totaling between US$250,000 and US$500,000.
Advanced Filter options provide flexibility in setting filter values. For conditions that test equality and for the Between condition, you can either set a literal value or you can base the value on another data column. For example, you can request actual shipping dates that are greater than the forecast shipping dates, or actual sales that are less than sales targets.
To create a filter with multiple conditions, complete the following steps:
Step 1 Open and run a report, as described in Running, Viewing, and Navigating Reports, page 25-3, and then click Launch Interactive Viewer.
Step 2 Select a column and do one of the following:
• Click the Filter icon on the toolbar.
• Right-click and choose Filter > Filter from the context menu.
The Filter dialog appears.
Step 3 Click Advanced Filter. The Advanced Filter dialog box appears. Filter By field displays the name of the first column in the report.
Step 4 From the Filter By menu, choose the column that contains the data that you want to filter.
Step 5 In the Condition field, choose a condition, such as Equal To, Between, or Less Than.
25-25Cisco Identity Services Engine User Guide, Release 1.1.x
OL-26134-01

Chapter 25 Reporting Organizing and Formatting Report Data
Step 6 Choose one of the following options for the Value:
• Specify Literal Value—This default value allows you to specify a literal value. To do so, enter a value in the text box provided. If you choose Select Values, a field appears that displays all data values for the specified column. For long lists, you can find a value by entering the value in the Filter Text text box and clicking Find.
• Use Value from Data Field—When you choose Use Value from Data Field, a drop-down list of columns appears. The columns in this list have the same data type as the column that you selected in the Filter By field.
Step 7 Click Add Condition, and then click Validate to validate the filter syntax. Repeat from Step 4 through Step 7 to create additional filter conditions.
Step 8 In the Filters area, adjust the filter conditions as needed. You can combine the conditions in the following ways:
• Using the AND, OR, and NOT operators. By default, the second filter condition is preceded by AND.
AND means that both conditions must be true for a data row to appear in the report. You can change AND to OR by choosing OR. OR means that only one condition has to be true for a data row to appear in the report. If you choose NOT, NOT appears after the AND or OR. NOT means that the condition must be false for a data row to appear in the report.
• If you add more than one condition, you can use parentheses to group conditions.
If you enclose two or more filter conditions in parentheses, the conditions in the parentheses are evaluated first. Then, the entire filter expression is evaluated. For example, A AND B OR C is evaluated from left to right, so A and B must be true, or C must be true for a data row to appear in the report. In the combination A AND (B OR C), B OR C is evaluated first, so A must be true, and B or C must be true for a data row to appear in the report.
Step 9 Click Apply.
Step 10 To save your changes, see Saving Customized Reports, page 25-38.
Deleting One Condition in a Multiple Condition Filter
If you created a filter with multiple conditions, it is easy to delete one of the conditions without deleting the entire filter.
Prerequisites
Before you begin, you should have successfully completed the task for Creating a Multiple Condition Filter, page 25-25.
To delete one condition in a multiple condition filter, complete the following steps:
Step 1 Click the column that uses the filter, and do one of the following:
• Click the Filter icon on the toolbar.
• Right-click and choose Filter > Filter from the context menu.
The Filter dialog box appears.
Step 2 Click Advanced Filter. The lower portion of the Advanced Filter dialog box displays the filter conditions.
25-26Cisco Identity Services Engine User Guide, Release 1.1.x
OL-26134-01

Chapter 25 Reporting Organizing and Formatting Report Data
Step 3 Click the filter condition that you want to remove, and then click Delete.
Step 4 Click Apply.
Step 5 To save your changes, see Saving Customized Reports, page 25-38.
Working with Aggregate DataAn aggregate row displays a total, average, or other summary data for a column. For example, you can display the total amount of the customer purchases or the average amount of each order. You can also create calculations, such as sums, standard deviations, rankings, and differences.
This section contains the following topics:
• Adding an Aggregate Row, page 25-27
• Adding Additional Aggregate Rows, page 25-28
• Deleting Aggregate Rows, page 25-28
Adding an Aggregate Row
Typically, the default formatting of the aggregate row comes from the template or the theme. You can modify the formatting of the aggregate data value and the formatting of the label that precedes the data value. You cannot modify the text of the label or the data value.
To create an aggregate data row, complete the following steps:
Step 1 Open and run a report, as described in Running, Viewing, and Navigating Reports, page 25-3, and then click Launch Interactive Viewer.
Step 2 Click a column, and then click Aggregation. The Aggregation dialog box appears. The name of the column that you selected is listed in the Selected Column field.
Step 3 From the Select Function menu, choose the appropriate function. The available functions depend on the type of data in the column:
• For text data, you can count all the values in the column, or count the distinct values in the column, for example.
• For numeric data, you can count values, get an average value or a weighted average, total the values in the column, and so on.
Step 4 In the Aggregate On field, do the following:
• Specify whether to display the aggregate value in the table header or footer. The default is to display the aggregate value in the table footer.
• If the selected column is a grouped column, specify whether to display the aggregate value in the group header or footer.
Step 5 Click Apply. The aggregate data appears in the report.
Step 6 To save your changes, see Saving Customized Reports, page 25-38.
25-27Cisco Identity Services Engine User Guide, Release 1.1.x
OL-26134-01

Chapter 25 Reporting Organizing and Formatting Report Data
Adding Additional Aggregate Rows
After you create a single aggregate row for a column, you can add up to two more aggregate rows for the same column. For an item total column, for example, you can create a sum of all the values, count all the values, and get the average order total.
To add additional aggregate rows to a report, complete the following steps:
Step 1 Open and run a report, as described in Running, Viewing, and Navigating Reports, page 25-3, and then click Launch Interactive Viewer.
Step 2 To add an aggregate row, click a calculated column that contains an aggregate row, and then click Aggregation. The Aggregation page appears.
Step 3 Click Add Aggregation. An additional section appears in the Aggregation dialog box.
Step 4 Create the second aggregate row, and then click Apply.
Step 5 To save your changes, see Saving Customized Reports, page 25-38.
Deleting Aggregate Rows
To delete an aggregate row, complete the following steps:
Step 1 Open and run a report, as described in Running, Viewing, and Navigating Reports, page 25-3, and then click Launch Interactive Viewer.
Step 2 Click the calculated column containing the aggregation to be removed, and then click Aggregation.
Step 3 The Aggregation dialog box appears, displaying the aggregations for the column.
Step 4 Click the aggregation that you want to remove, and then click Delete Aggregation and click Apply.
Step 5 To save your changes, see Saving Customized Reports, page 25-38.
Working with ChartsA chart is a graphical representation of data, or the relationships among data sets. Charts display complex data in an easy-to-assimilate format. A chart displays data as one or more sets of points, and organizes data points into sets of values called series. There are two types of series:
• Category series—The category series typically determines what text, numbers, or dates you see on the x-axis.
• Value series—The value series typically determines the text, numbers, or dates on the y-axis.
There are various chart types. Some types of data are best depicted with a specific type of chart. Charts can be used as reports in themselves, and they can be used together with tabular data report styles.
Note The basic characteristics of a chart are determined in the report design editor. Such things as the chart type and the data source are part of the report design and cannot be changed in the viewer.
25-28Cisco Identity Services Engine User Guide, Release 1.1.x
OL-26134-01

Chapter 25 Reporting Organizing and Formatting Report Data
This section contains the following topics:
• Filtering Chart Data, page 25-29
• Changing Chart Subtypes, page 25-29
• Changing Chart Formatting, page 25-30
Filtering Chart Data
The data that is displayed in the chart can be filtered similar to how a data column is filtered. You can filter a chart along either the x-axis or the y-axis.
To filter chart data, complete the following steps:
Step 1 Open and run a report, as described in Running, Viewing, and Navigating Reports, page 25-3, and then click Launch Interactive Viewer.
Step 2 Right-click the chart and choose Filter from the context menu. The Chart Filter dialog box appears.
Step 3 Make your selections from the Chart Filter dialog box, and click Apply.
Step 4 To save your changes, see Saving Customized Reports, page 25-38.
Changing Chart Subtypes
Many charts have two-dimensional subtypes that you can select from to change how the chart shape appears. Some charts are two-dimensional and appear as flat against the background, while others can be displayed with depth in 3-D.
The available chart subtypes include the following:
• Bar chart—Side-by-side, stacked, percent stacked
• Line chart—Overlay, stacked, percent stacked
• Area chart—Overlay, stacked, percent stacked
• Meter chart—Standard, superimposed
• Stock chart—Candlestick, bar stick
To specify a new chart subtype, complete the following steps:
Step 1 Open and run a report, as described in Running, Viewing, and Navigating Reports, page 25-3, and then click Launch Interactive Viewer.
Step 2 Right-click inside the chart, and choose Chart Subtype from the context menu.
Step 3 Choose the desired subtype from the Chart Subtype dialog box and click Apply.
Step 4 To save your changes, see Saving Customized Reports, page 25-38.
25-29Cisco Identity Services Engine User Guide, Release 1.1.x
OL-26134-01

Chapter 25 Reporting Organizing and Formatting Report Data
Changing Chart Formatting
Some chart formatting, such as the colors of the bars in a bar chart and the background color of the chart, come from the report template or theme. If the formatting comes from a report template, you are not allowed to change the formatting. If the formatting comes from a theme, you are allowed to change the formatting by changing the theme. For more information, see Formatting Reports, page 25-31.
This procedure shows you how to modify other chart format items, including fonts and font sizes for the chart title and axis labels; the height and width of the chart; how to hide axis labels; how to place labels at an angle relative to the axis; and how to hide the legend or determine where to display the legend in relation to the chart.
To modify the formatting of chart data, complete the following steps:
Step 1 Open and run a report, as described in Running, Viewing, and Navigating Reports, page 25-3, and then click Launch Interactive Viewer.
Step 2 Right-click inside the chart, and choose Chart Format from the context menu.
Step 3 From the Chart Format dialog, do any of the following:
• Edit and format the default chart title.
• Edit and format the default title for the category (x-axis).
• Modify settings for the labels on the x-axis in the following ways:
– Indicate whether to display x-axis labels.
– Indicate whether to rotate x-axis labels and set the degree of rotation.
– Indicate whether to stagger x-axis labels. For example, you can show data points for every third month, every 10 days, every other year, and so on.
– Set the interval for staggered x-axis labels.
• Edit and format the default title for the y-axis, if the chart uses a y-axis.
• Set the height and width of the chart.
• Select the dimension. The options are 2-dimensional and 2-dimensional with depth.
• Indicate whether to flip, or reverse, the chart’s x- and y-axes.
• Indicate whether to show a legend, and if so, whether to place it above the chart, below the chart, or to the left or right of the chart.
Step 4 Click Apply.
Step 5 To save your changes, see Saving Customized Reports, page 25-38.
25-30Cisco Identity Services Engine User Guide, Release 1.1.x
OL-26134-01

Chapter 25 Reporting Organizing and Formatting Report Data
Formatting ReportsThis section shows you the various ways in which you can format reports using the Interactive Viewer, and it contains the following topics:
• Editing and Formatting Labels, page 25-31
• Formatting Data Types, page 25-32
• Applying Conditional Formats, page 25-35
• Setting and Removing Page Breaks, page 25-36
Editing and Formatting Labels
Labels are fields that can contain static text, such as the report title and items of the footer. In a typical report, some labels are editable and others are not. If a label such as a column header is editable, you can modify properties such as the type of font, font size, background color, and the text of the label.
Editing Labels
The text of a column header comes from the data source. If the data source displays column headers in capital letters with no spaces between words, the report design displays column header names in the same way. You are allowed to change the content of the column header.
To edit report label text, complete the following steps:
Step 1 Open and run a report, as described in Running, Viewing, and Navigating Reports, page 25-3, and then click Launch Interactive Viewer.
Step 2 Right-click the label that you want to change.
Step 3 From the context menu, choose Change Text. The Edit Text dialog box appears.
Step 4 Modify the text, and click Apply.
Step 5 To save your changes, see Saving Customized Reports, page 25-38.
25-31Cisco Identity Services Engine User Guide, Release 1.1.x
OL-26134-01

Chapter 25 Reporting Organizing and Formatting Report Data
Formatting Labels
The formatting of the column header comes from the report template or from the theme. If the formatting comes from a report template, you are not allowed to change the formatting. If the formatting comes from a theme, you are allowed change the formatting by changing the theme.
To change report label formatting, complete the following steps:
Step 1 Open and run a report, as described in Running, Viewing, and Navigating Reports, page 25-3, and then click Launch Interactive Viewer.
Step 2 Click the Launch Interactive Viewer icon, and right-click the label.
Step 3 From the context menu, choose Style > Font. The Font dialog box appears.
Step 4 Modify the formats as necessary, and then click Apply.
Step 5 To save your customizations, see Saving Customized Reports, page 25-38.
Formatting Data Types
Reports can contain many different data types. A column can display numeric data, date-and-time data, or string data. Each data type has a range of unique formats. For more information on the various data types and how you can format them, see Reports, page A-15 of Appendix A, “User Interface Reference.”
This section contains the following topics:
• Formatting Numeric Data, page 25-32
• Formatting Custom Numeric Data, page 25-33
• Formatting String and Custom String Data, page 25-34
• Formatting Date and Time, page 25-34
• Formatting Boolean Data, page 25-35
Formatting Numeric Data
Numeric data can take several forms. A column of postal codes requires different formatting than a column of sales figures.
The data type of a column is determined by the data source. Keep in mind that a text or string data type can contain numeric digits. A telephone number, for example, is frequently string data in the data source. The title of the formatting dialog box tells you what data type the column contains.
To format numeric data, complete the following steps:
Step 1 Open and run a report, as described in Running, Viewing, and Navigating Reports, page 25-3, and then click Launch Interactive Viewer.
Step 2 Right-click inside a column containing numeric data, and choose Format from the context menu. The Number column format dialog box appears.
Step 3 In the Format Number As drop-down list, choose one of the following:
• General Number
• Currency
25-32Cisco Identity Services Engine User Guide, Release 1.1.x
OL-26134-01

Chapter 25 Reporting Organizing and Formatting Report Data
• Fixed
• Percent
• Scientific
The dialog options change to match the selected formatting type.
Step 4 Specify the following options, as appropriate for the selected formatting type:
• Symbol—Select a currency symbol.
• Symbol Position—Choose Before to place the currency or percentage symbol before the number. Choose After to place the symbol after the number.
• Decimal Places—Select the number of places to display after the decimal marker.
• Use 1000s Separator—Select to use a thousands separator such as a comma (,) or a period (.). Your locale determines the separator character.
• Negative Numbers—Select to display negative numbers. You can use a minus (-) sign before the number or parentheses around the number.
Step 5 Click Apply.
Step 6 To save your changes, see Saving Customized Reports, page 25-38.
Formatting Custom Numeric Data
To define a custom format, you can use special symbols to construct a format pattern. A format pattern shows where to place currency symbols, thousands separators, decimal points, or commas.
To format custom or numeric data, complete the following steps:
Step 1 Open and run a report, as described in Running, Viewing, and Navigating Reports, page 25-3, and then click Launch Interactive Viewer.
Step 2 Right-click inside a numeric data column, and choose Format from the context menu. The Number column format appears.
Step 3 In the Format Number As field, choose Custom from the drop-down list. The Format Code field appears.
Step 4 Enter a format pattern in the Format Code field.
Step 5 Click Apply.
Step 6 To save your changes, see Saving Customized Reports, page 25-38.
For more information:
See Data Formatting, page A-26 of Appendix A, “User Interface Reference,” for details on the fields.
25-33Cisco Identity Services Engine User Guide, Release 1.1.x
OL-26134-01

Chapter 25 Reporting Organizing and Formatting Report Data
Formatting String and Custom String Data
You can change the format of string data and even include special formatting, such as a space or a punctuation mark, at a specific place in the string. The following example shows the various ways that you can format the display of telephone numbers:
(415) 555-2121
415.555.2121
415-555-2121
To format string and custom string data, complete the following steps:
Step 1 Open and run a report, as described in Running, Viewing, and Navigating Reports, page 25-3, and then click Launch Interactive Viewer.
Step 2 Right-click inside a column containing string data, and choose Format from the context menu. The String column format dialog appears.
Step 3 Choose the appropriate option from the drop-down list, or choose Custom for custom formatting and enter a format pattern in the Format Code text box.
Step 4 Click Apply.
Step 5 To save your changes, see Saving Customized Reports, page 25-38.
For more information:
See Data Formatting, page A-26 of Appendix A, “User Interface Reference.”
Formatting Date and Time
A data source can provide both a date and a time, or only the date or time. If the data source provides both date and time data, you can format the column to display only a date, only a time, or both a date and a time. You can also specify the exact format for the date or time.
Standard Date and Time Formatting
The appearance of standard date and time formatting adheres to the locale standards in which you are viewing the report. For example, the following date and time format is correct for the U.S. English locale for the Pacific Standard Time zone:
March 5, 2007 11:00:00 AM PST
The following example shows the correct date and time format for a French (France) locale:
5 mars 2007 11:00:00 HNP (ÈUA)
Custom Date and Time Formatting
You should only use custom date formatting, if your report is intended for a single locale. Custom formats display dates in the format that you specify, and that format might be misinterpreted in other locales. For example, for the date format mm-dd-yy, the date January 10, 2006 appears as 01-10-06, regardless of the locale in which the report is viewed. For locales in which dates are typically displayed in date-month-year format, a 01-10-06 date would be interpreted as October 1, 2006.
25-34Cisco Identity Services Engine User Guide, Release 1.1.x
OL-26134-01

Chapter 25 Reporting Organizing and Formatting Report Data
To change the date and time format, complete the following steps:
Step 1 Open and run a report, as described in Running, Viewing, and Navigating Reports, page 25-3, and then click Launch Interactive Viewer.
Step 2 Right-click inside a column that contains date or time data, and choose Format from the context menu.
Step 3 To choose a standard format, choose an option from the Format Date or Time As drop-down list.
Note Selecting a standard date and time format ensures that the appropriate format is displayed for the locale, no matter where in the world the report is viewed.
Step 4 To specify a custom format, choose Custom from the Format Date or Time As drop-down list and enter a format pattern in the Format Code text box.
Step 5 Click Apply.
Step 6 To save your changes, see Saving Customized Reports, page 25-38.
For more information:
See Data Formatting, page A-26 of Appendix A, “User Interface Reference,” or details on the fields.
Formatting Boolean Data
A Boolean expression evaluates to true or false. For example, you create a calculated column with the following expression:
ActualShipDate <= TargetShipDate
If the actual ship date is before or on the target ship date, the expression = true. If the actual ship date is after the target ship date, the expression = false. If you do not format a Boolean data type column, it displays, by default, the values of true and false.
To specify labels for Boolean data other than the defaults of true and false, complete the following steps:
Step 1 Open and run a report, as described in Running, Viewing, and Navigating Reports, page 25-3, then click Launch Interactive Viewer.
Step 2 Right-click inside a Boolean data column and choose Format Data from the context menu.
Step 3 Enter the labels as you want them to appear in the Boolean Column Format text boxes.
Step 4 Click Apply.
Step 5 To save your changes, see Saving Customized Reports, page 25-38.
Applying Conditional Formats
Conditional formatting changes the formatting of data when a certain condition is true. For example, in a report that shows past-due invoices, you can highlight in red customer names with invoices that are 90 days or more past due. You can specify up to three conditional formatting rules for a single column. You can also remove or modify conditional formatting.
25-35Cisco Identity Services Engine User Guide, Release 1.1.x
OL-26134-01

Chapter 25 Reporting Organizing and Formatting Report Data
Conditional formatting allows you to set various types of comparisons, such as whether the data in the comparison column is null or false. You can also compare the column value to one or two other values. For example, you can specify that data less than or equal to a specified value triggers conditional formatting.
You can also create a condition to determine whether a value is between two other values, such as whether an order total is between US$10,000 and US$100,000. In this case, the names of the customers whose orders total between US$10,000 and US$100,000 would appear in conditional formatting.
After you create the condition, you specify the format in which the data is displayed when it meets the condition.
To set up conditional formatting for a column, complete the following steps:
Step 1 Open and run a report, as described in Running, Viewing, and Navigating Reports, page 25-3, and then click Launch Interactive Viewer.
Step 2 Right-click inside a column and choose Style > Conditional Formatting from the context menu. The Selected Column field displays the name of the column that will display the conditional format.
Step 3 Set the conditional formatting rule in the following way:
a. From the first drop-down list, choose the column that contains the values that determine whether the conditional format takes effect. The column that you choose can be the same as or different from the column in the Selected Column field.
b. In the next field, choose an operator from the drop-down list to apply to the column. You can choose Equal to, Less than, Less than or Equal to, and so on.
The fields that do or do not appear depend on your selection. If you choose Is Null, Is Not Null, Is True, or Is False, no fields appear. If you choose an operator that requires a comparison between values, one or more additional fields appear.
c. As needed, enter comparison values in each text box.
For example, if you choose Less than or Equal to a third field appears, or if you choose Between or Not Between, two comparison fields appear. Comparison values can be entered directly, or you can choose Change Value and select a value from the Value dialog.
Step 4 To change the display formatting, in the Conditional Formatting dialog box, choose Format.
You can set the font, font size, font color, and background color. You can also specify bold, italic, or underlined formatting.
Step 5 To add additional conditional formatting rules, in the Conditional Formatting dialog box, choose Add Rule, and repeat Step 3 and Step 4 for each new rule.
Step 6 Click Apply.
Step 7 To save your changes, see Saving Customized Reports, page 25-38.
Setting and Removing Page Breaks
By using the Interactive Viewer, you can force page breaks after a specified number of rows for detail and group columns. This section covers the following tasks:
• Setting and Removing Page Breaks for Detail Columns, page 25-37
• Setting and Removing Page Breaks in a Group Column, page 25-37
25-36Cisco Identity Services Engine User Guide, Release 1.1.x
OL-26134-01

Chapter 25 Reporting Organizing and Formatting Report Data
Setting and Removing Page Breaks for Detail Columns
You may want to break a column after a specified set of rows to keep related information together when a report is printed. You can use the Interactive Viewer to add page breaks to your reports or remove page breaks from them.
Note The following task is specific to detail columns. For group columns, use the Setting and Removing Page Breaks in a Group Column, page 25-37 procedure.
To set and remove page breaks in detail columns, complete the following steps:
Step 1 Open and run a report, as described in Running, Viewing, and Navigating Reports, page 25-3, and then click Launch Interactive Viewer.
Step 2 Right-click inside a detail column, and choose Group > Page Break from the context menu.
Step 3 In the Interval field, do one of the following:
• Enter the number of rows after which to place the page break. The default is 50.
• Change an existing page break by modifying the number that appears in the Interval field, or remove the number entirely.
Step 4 Click Apply.
Step 5 To save your changes, see Saving Customized Reports, page 25-38.
Setting and Removing Page Breaks in a Group Column
For reports with grouped data, you can set page breaks before or after the grouped data. These boundaries allow you to make sure grouped data stays together when it is printed, so it is easier to read and understand.
Note The following task is specific to group columns. For detail columns, use the Setting and Removing Page Breaks for Detail Columns, page 25-37 procedure.
To set and remove page breaks in a grouped column, complete the following steps:
Step 1 Open and run a report, as described in Running, Viewing, and Navigating Reports, page 25-3, and then create a group column as described in Adding Groups, page 25-13.
Step 2 Right-click inside a group column, and choose Group > Page Break from the context menu.
Step 3 Do one of the following:
• Under Before Group and After Group, click the appropriate radio button for the following:
– Always
– Always Except for First
– Always Except for Last
• To delete an existing page break, choose None for Before Group or After Group.
25-37Cisco Identity Services Engine User Guide, Release 1.1.x
OL-26134-01

Chapter 25 Reporting Working with Active RADIUS Sessions
Step 4 Click Apply.
Step 5 To save your changes, see Saving Customized Reports, page 25-38.
Saving Customized ReportsYou can save a report design from the Interactive Viewer for reuse at a later time.
Prerequisites
Create a customized report design, as described in the Organizing and Formatting Report Data, page 25-11 tasks.
To save a customized report under a unique name, complete the following steps:
Step 1 Click Save As. The Save As dialog box appears.
Step 2 Navigate to the location where you want to save the file, and enter a unique filename.
Step 3 Click Save, and then click OK.
Working with Active RADIUS SessionsCisco ISE provides a dynamic Change of Authorization (CoA) feature for the RADIUS Active Sessions report that allows you to dynamically control active RADIUS sessions. You can send reauthenticate or disconnect requests to a Network Access Device (NAD) to perform the following tasks:
• Troubleshoot issues related to authentication—You can use the Disconnect:None option to follow up with an attempt to reauthenticate again. However, you must not use the disconnect option to restrict access. To restrict access, use the shutdown option.
• Block a problematic host—You can use the Disconnect:Port Disable option to block an infected host that sends a lot of traffic over the network. However, the RADIUS protocol does not currently support a method for reenabling a port that has been shut down.
• Force endpoints to reacquire IP addresses—You can use the Disconnect:Port Bounce option for endpoints that do not have a supplicant or client to generate a DHCP request after VLAN change.
• Push an updated authorization policy to an endpoint—You can use the Re-Auth option to enforce an updated policy configuration, such as a change in the authorization policy on existing sessions based on the discretion of the administrator. For example, if posture validation is enabled, when an endpoint gains access initially, it is usually quarantined. After the identity and posture of the endpoint are known, it is possible to send the CoA Re-Auth command to the endpoint for the endpoint to acquire the actual authorization policy based on its posture.
For CoA commands to be understood by the device, it is important that you configure the options appropriately.
For CoA to work properly, you must configure (in Cisco ISE) the shared secret of each device that requires a dynamic change of authorization. Cisco ISE uses the shared secret configuration to request access from the device and issue CoA commands to it. For more information, see Chapter 5, “Managing External Identity Sources.”
25-38Cisco Identity Services Engine User Guide, Release 1.1.x
OL-26134-01
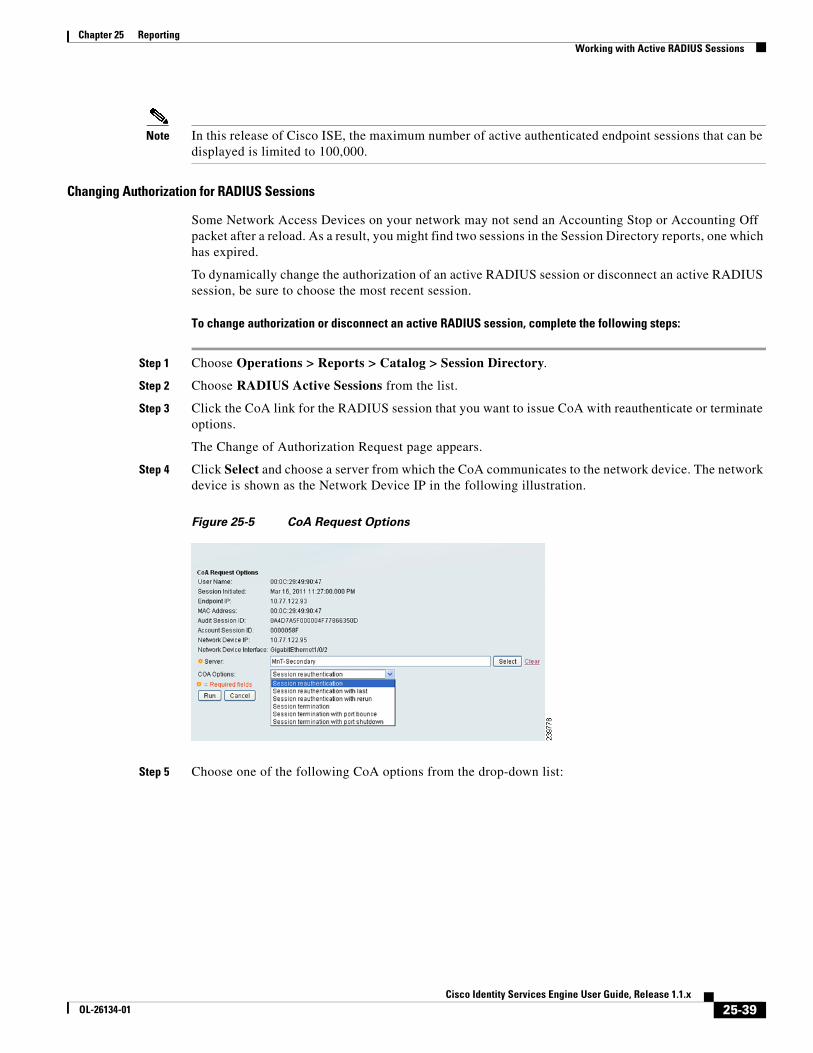
Chapter 25 Reporting Working with Active RADIUS Sessions
Note In this release of Cisco ISE, the maximum number of active authenticated endpoint sessions that can be displayed is limited to 100,000.
Changing Authorization for RADIUS Sessions
Some Network Access Devices on your network may not send an Accounting Stop or Accounting Off packet after a reload. As a result, you might find two sessions in the Session Directory reports, one which has expired.
To dynamically change the authorization of an active RADIUS session or disconnect an active RADIUS session, be sure to choose the most recent session.
To change authorization or disconnect an active RADIUS session, complete the following steps:
Step 1 Choose Operations > Reports > Catalog > Session Directory.
Step 2 Choose RADIUS Active Sessions from the list.
Step 3 Click the CoA link for the RADIUS session that you want to issue CoA with reauthenticate or terminate options.
The Change of Authorization Request page appears.
Step 4 Click Select and choose a server from which the CoA communicates to the network device. The network device is shown as the Network Device IP in the following illustration.
Figure 25-5 CoA Request Options
Step 5 Choose one of the following CoA options from the drop-down list:
25-39Cisco Identity Services Engine User Guide, Release 1.1.x
OL-26134-01

Chapter 25 Reporting Working with Active RADIUS Sessions
Note For Inline Posture nodes and where wireless LAN controllers (WLC) are in use, only two options are available: Session reauthentication and Session termination.
• Session reauthentication—Reauthenticate session.
• Session reauthentication with last—Use the last successful authentication method for this session.
• Session reauthentication with rerun—Run through the configured authentication method from the beginning.
Note Session reauthentication with last and Session reauthentication with rerun options are not currently supported in Cisco IOS software.
• Session termination—Just end the session. The switch reauthenticates the client in different session.
• Session termination with port bounce—Terminate session and restart port.
• Session termination with port shutdown—Terminate session and shutdown port.
Step 6 Click Run to issue CoA with selected reauthenticate or terminate option.
If your CoA fails, it could be for any of the following reasons:
• Device does not support CoA.
• Changes have occurred to the identity or authorization policy.
• There is a shared secret mismatch.
Step 7 To save your changes, see Saving Customized Reports, page 25-38.
For more information:
See Troubleshooting RADIUS Authentications, page 24-31. A failed dynamic CoA will be listed under failed RADIUS authentications.
For information on CoA, policies, and profiles, see the following:
• Cisco ISE Authorization Policies and Profiles, page 17-5
• Configuring Authorization Policies, page 17-14
• Chapter 18, “Configuring Endpoint Profiling Policies”
• Chapter 20, “Configuring Client Posture Policies”
Troubleshooting Topics
• Cisco ISE Does Not Issue CoA Following Authentication, page D-28
• CoA Not Initiating on Client Machine, page D-3
• RADIUS Server Error Message Entries Appearing in Cisco ISE, page D-14
• RADIUS Server Connectivity Issues (No Error Message Entries Appearing in Cisco ISE), page D-15
25-40Cisco Identity Services Engine User Guide, Release 1.1.x
OL-26134-01

Chapter 25 Reporting Available Reports
Available ReportsThe following table lists the preconfigured catalog reports, grouped according to their category. Descriptions of the report functionality and logging category are also provided.
Table 25-1 Available Reports
Report Name Description Logging Category
AAA Protocol
AAA_Diagnostics Provides AAA diagnostic details based on severity for a selected time period.
Policy diagnostics, Identity Stores Diagnostics, Authentication Flow Diagnostics, RADIUS Diagnostics
Authentication_Trend Provides RADIUS authentication summary information for a selected time period, along with a graphical representation.
Passed authentications, Failed attempts
RADIUS_Accounting Provides user accounting information that is based on RADIUS for a selected time period.
RADIUS accounting
RADIUS_Authentication Provides RADIUS authentication details for a selected time period.
Passed authentications, Failed attempts
Allowed Protocol
Allowed_Protocol_Authentication_Summary
Provides RADIUS authentication summary information for a particular allowed protocol for a selected time period, along with a graphical representation.
Passed authentications, Failed attempts
Top_N_Authentications_By_Allowed_Protocol
Provides the top n passed, failed, and total authentication count for RADIUS authentications with respect to the allowed protocol for a selected time period.
Passed authentications, Failed attempts
Server Instance
OCSP Monitoring Provides a summary of all the OCSP certificate validation operations performed by Cisco ISE.
System statistics
Server_Administrator_Entitlement Provides a list of administrators and their assigned entitlement roles.
Resources and privileges, configuration changes, logins
Server_Administrator_Logins Provides access-related events for administrators that includes login, logout, events, and information about excessive failed login attempts over standalone, and other distributed nodes when the account is locked or disabled in Cisco ISE.
Administrative and operational audit
25-41Cisco Identity Services Engine User Guide, Release 1.1.x
OL-26134-01

Chapter 25 Reporting Available Reports
Server_Authentication_Summary Provides RADIUS authentication summary information for a particular instance for a selected time period, along with a graphical representation.
This report could take several minutes to run, depending on the number of records in the database.
Note When you reload this report, if the rate of incoming syslog messages is around 150 messages per second or more, the total number of passed and failed authentications that appears above the graph and the passed and failed authentication count displayed in the table, do not match.
Passed authentications, Failed attempts
Server_Configuration_Audit Provides all the configuration changes made by the administrator for a selected time period.
Administrative and operational audit
Server_Health_Summary Provides the CPU, memory utilization, RADIUS data and throughput (in tabular and graphical formats), as well as process status, process downtime, and disk space utilization for a particular instance in a selected time period.
System statistics
Server_Operations_Audit Provides all the operational changes made by the administrator for a selected time period.
Administrative and operational audit
Server_System_Diagnostics Provides system diagnostic details that are based on severity for a selected time period.
Internal operations diagnostics, distributed management, administrator authentication and authorization
Top_N_Authentications_By_Server Provides the top n passed, failed, and total authentication count for RADIUS protocol with respect to a particular Cisco ISE instance for a selected time period.
Passed authentications, Failed attempts
User_Change_Password_Audit Provides the username of the internal user, identity store name, name of the instance, and time when the user password was changed. Helps track all changes that are made to internal user passwords across all interfaces.
Administrative and operational audit
Endpoint
Endpoint_MAC_Authentication_Summary
Provides the RADIUS authentication summary information for a particular MAC or MAB for a selected time period; along with a graphical representation.
Passed authentications, Failed attempts
Table 25-1 Available Reports (continued)
Report Name Description Logging Category
25-42Cisco Identity Services Engine User Guide, Release 1.1.x
OL-26134-01

Chapter 25 Reporting Available Reports
Endpoint_Profiler_Summary Provides profile information for endpoints that are accessing the network.
Note For endpoints that do not register a session time, such as a Cisco IP-Phone, the term Not Applicable is shown in the Endpoint session time field.
Profiler
Endpoint_Time_To_Profile Provides information on time taken to an endpoint that has an Unknown profile by using a particular MAC address for a selected time period.
Profiler
Top_N_Authentications_By_Endpoint_Calling _Station_ID
Provides the top n passed, failed, and total authentication count with respect to endpoint calling station IDs.
Passed authentications, Failed attempts
Top_N_Authentications_By_Machine Provides the top n passed, failed, and total authentication count for RADIUS protocol with respect to machine information for a selected time period.
Passed authentications, Failed attempts
Failure Reason
Authentication_Failure_Code_Lookup Provides the description and the appropriate resolution steps for a particular failure reason.
—
Failure_Reason_Authentication_Summary
Provides the RADIUS authentication summary information for a particular failure reason, along with a graphical representation for a selected time period.
Failed attempts
Top_N_Authentications_By_Failure_Reason
Provides the top n failed authentication count for RADIUS protocols with respect to the failure reason for a selected time period.
Failed attempts
Network Device
AAA_Down_Summary Provides the number of AAA unreachable events that a NAD logs within a selected time period.
Passed authentications, Failed attempts
Network_Device_Authentication_Summary
Provides the RADIUS authentication summary information for a particular network device for a selected time period, along with the graphical representation.
Passed authentications, Failed attempts
Network_Device_Log_Messages Provides the log information of a particular network device for a specified time period.
Passed authentications, Failed attempts
Table 25-1 Available Reports (continued)
Report Name Description Logging Category
25-43Cisco Identity Services Engine User Guide, Release 1.1.x
OL-26134-01

Chapter 25 Reporting Available Reports
Session_Status_Summary Provides the port sessions and status of a particular network device obtained by the Simple Network Management Protocol (SNMP).
Note If you have configured your network device with SNMPv3 parameters, you cannot generate the Network Device Session Status Summary report provided by the Monitoring service (Operations > Reports > Catalog > Network Device > Session Status Summary). You can generate this report successfully if your network device is configured with SNMPv1 or SNMPv2c parameters.
—
Top_N_AAA_Down_By_Network_Device
Provides the top n AAA down events that is encountered by each of the network devices.
—
Top_N_Authentications_By_Network_Device
Provides the top n passed, failed, and total authentication count for RADIUS protocols with respect to a network device for a selected time period.
Passed authentications, Failed attempts
User
Client_Provisioning Provides a summary of successful and unsuccessful client provisioning evaluation and download events, displayed according to the associated User ID.
Posture and Client Provisioning Audit, Posture and Client Provisioning Diagnostics
Guest_Accounting Provides session (login and log out) information for selected guests over a specified time period.
Passed authentications, RADIUS accounting
Guest_Activity Provides guest information for a selected time period.
Note For this report to collect and display the list of URLs visited by the guest user, you must enable guest access syslogging configuration on the NAD that inspects guest traffic in your Cisco ISE network.
Passed authentications
Guest_Sponsor_Summary Provides sponsor information along with a graphical representation, for a selected time period.
Passed authentications
Supplicant_Provisioning Provides information about a list of endpoints that are registered through the Asset Registration Portal (ARP) for a specific period of time.
—
Top_N_Authentications_By_User Provides top n passed, failed, and total authentication count for RADIUS protocol with respect to users for a selected time period.
Passed authentications, Failed attempts
Unique_Users Provides the count for the number of unique users. Passed authentications, Failed attempts
User_Authentication_Summary Provides RADIUS authentication summary information for a particular user for a selected time period, along with the graphical representation.
Passed authentications, Failed attempts
Table 25-1 Available Reports (continued)
Report Name Description Logging Category
25-44Cisco Identity Services Engine User Guide, Release 1.1.x
OL-26134-01

Chapter 25 Reporting Available Reports
Security Group Access
PAC Provisioning Provides a summary of SGA PAC generated. —
Policy CoA Provides the summary of the policy change request through policy CoA.
—
RBACL_Drop_Summary Provides a summary of RBAC drop events. —
SGT_Assignment_Summary Provides a summary of security group tag (SGT) assignments for a selected time period.
Passed authentications
Top_N_RBACL_Drops_By_Destination
Provides the top n role-based access control list (RBAC) drop event count with respect to destination for a selected time period.
—
Top_N_RBACL_Drops_By_User Provides the top n RBAC drop event count with respect to the user for a selected time period.
—
Top_N_SGT_Assignments Provides the top n SGT assignment count for a selected time period.
Passed authentications
Session Directory
RADIUS_Active_Sessions Provides information on RADIUS authenticated, authorized, and started sessions.
Dynamically control active RADIUS sessions. Send a reauthenticate or disconnect request to a NAD to perform the following CoA actions:
• Quarantine
• Session reauthentication
• Session reauthentication with last
• Session reauthentication with rerun
• Session termination
• Session termination with port bounce
• Session termination with port shut down
The RADIUS_Active_Sessions report will display WLC Roam status as N (N stands for No) for any wired active session.
Passed authentications, RADIUS accounting
RADIUS_Session_History Provides a summary of RADIUS session history, such as total authenticated and terminated sessions, as well as total and average session duration and throughput for a selected time period.
Passed authentications, RADIUS accounting
RADIUS_Terminated_Sessions Provides all the RADIUS terminated session information for a selected time period.
Passed authentications, RADIUS accounting
Posture
Posture_Detail_Assessment Provides a summary of all the endpoints that logged on for a selected period of time. Includes a detailed status of compliance against the posture policies that are used during posture assessment.
Posture and Client Provisioning Audit, Posture and Client Provisioning Diagnostics
Table 25-1 Available Reports (continued)
Report Name Description Logging Category
25-45Cisco Identity Services Engine User Guide, Release 1.1.x
OL-26134-01

Chapter 25 Reporting Available Reports
Posture_Trend Provides a graphical representation of posture compliance for a selected period of time. Includes a summary of compliant and noncompliant endpoints against which the posture policies were evaluated.
Posture and Client Provisioning Audit, Posture and Client Provisioning Diagnostics
Endpoint Protection Service
Endpoint_Operations_History Provides EPS action history information, comprised of these values: Timestamp, Endpoint MAC Address, Endpoint IP Address, Operation Type, Operation Status, Operation ID, Audit Session ID, Admin Username, Admin IP Address.
—
MyDevices
Registered Endpoints Provides information about a list of endpoints that are registered through the Asset Registration Portal (ARP) by a specific user for a selected period of time.
—
Table 25-1 Available Reports (continued)
Report Name Description Logging Category
25-46Cisco Identity Services Engine User Guide, Release 1.1.x
OL-26134-01