report and financial statements at 31 december 2009 · gianfranco viesti director supplementary...
TRANSCRIPT

Report and Financial Statements at 31 December 2009
2

Report and Financial Statements at 31 December 2009
3
Financial Statements 2009
Cassa depositi e prestiti società per azioni _____________________________________________________
REGISTERED OFFICE
ROME– Via Goito, 4
COMPANY REGISTER OF ROME
Entered in Company Register of Rome no. 80199230584
Registered with Chamber of Commerce of Rome at no. REA 1053767
SHARE CAPITAL
Share capital € 3,500,000,000.00 fully paid up
_____________________________________________________
Tax code 80199230584 - VAT registration no. 07756511007

Report and Financial Statements at 31 December 2009
4
Board of Directors (in office at 31 December 2009)
Franco Bassanini Chairman
Massimo Varazzani
Chief Executive Officer
Francesco Giovannucci
Director
Ettore Gotti Tedeschi
Director (1)
Vittorio Grilli
Director
Nunzio Guglielmino
Director
Fiorenzo Tasso
Director
Luisa Torchia
Director
Gianfranco Viesti
Director
Supplementary members for administration of Separate Account
(Article 5.8, Decree Law 269/2003, ratified with amendments by Law 326/03)
State Accountant General
Director (2)
Director General of the Treasury
Director (3)
Isaia Sales
Director
Francesco Scalia
Director
Giuseppe Pericu
Director
(1) At its meeting of 29 April 2009, the Board appointed Ettore Gotti Tedeschi to replace Gianfranco
Imperatori.
(2) Edoardo Grisolia, delegate of the State Accountant General.
(3) Maria Cannata, delegate of the Director General of the Treasury.

Report and Financial Statements at 31 December 2009
5
Preference Shareholders Support Committee (in office at 31 December 2009)
Mario Nuzzo Chairman
Teresio Barioglio
Member
Pier Giuseppe Dolcini
Member
Andrea Filtri
Member (4)
Amedeo Grilli
Member
Francesco Lorenzetti
Member
Antonio Marotti
Member
Massimo Paniccia
Member
Marco Parlangeli
Member
Stefano Poli
Member
Roberto Saro
Member
Steering Committee
Giuliano Segre
Chairman
Carlo Colaiacovo
Member
Adriano Giannola
Member
Matteo Melley
Member
Antonio Miglio
Member
Francesco Parlato
Member
Antimo Prosperi
Member
Massimo Varazzani
Member
(4) On 10 December 2009 Andrea Filtri was appointed to replace the resigning member Davide Tinelli.

Report and Financial Statements at 31 December 2009
6
Board of Auditors
Alberto Sabatini
Chairman
Mario Basili
Auditor
Biagio Mazzotta
Auditor
Fabio Alberto Roversi Monaco
Auditor
Antonio Angelo Arru
Auditor
Francesco Bilotti
Alternate
Gerhard Brandstätter
Alternate
Parliamentary Supervisory Committee
Tommaso Foti Chairman
Massimo Bitonci
Deputy Chairman
Salvatore Cultrera
Secretary for Confidential Matters
Pietro Franzoso
Parliamentary member
Oriano Giovannelli
Parliamentary member
Cinzia Bonfrisco
Parliamentary member
Paolo Franco
Parliamentary member
Giovanni Legnini
Parliamentary member
Valter Zanetta
Parliamentary member
Salvatore Giacchetti
Non-parliamentary member
Gaetano Trotta
Non-parliamentary member
Luigi Papiano
Non-parliamentary member
Judge of the State Audit Court (Article 5.17, Decree Law 269/2003 – attends meetings of the Board of Directors and the Board of Auditors)
Luigi Mazzillo
Independent auditors
KPMG S.p.A.

Report and Financial Statements at 31 December 2009
7
CONTENTS
REPORT ON OPERATIONS
REPORT OF THE BOARD OF AUDITORS
REPORT OF THE INDEPENDENT AUDITORS
CERTIFICATION OF THE SEPARATE FINANCIAL STATEMENTS
pursuant to Article 154-bis of Legislative Decree 58/98
SEPARATE FINANCIAL STATEMENTS
BALANCE SHEET
INCOME STATEMENT
STATEMENT OF COMPREHENSIVE INCOME
STATEMENT OF CHANGES IN EQUITY
CASH FLOW STATEMENT
NOTES TO THE FINANCIAL STATEMENTS
Annexes:
List of equity investments
Accounting separation statements

Report and Financial Statements at 31 December 2009
8

Report and Financial Statements at 31 December 2009
9
REPORT
ON
OPERATIONS
(YEAR ENDED 31 DECEMBER 2009)

Report and Financial Statements at 31 December 2009
10
CONTENTS OF THE REPORT ON OPERATIONS
FINANCIAL HIGHLIGHTS ......................................................................13
MAIN INDICATORS ...............................................................................13
1. PRESENTATION OF THE COMPANY .................................................16
11..11 CCDDPP’’SS RROOLLEE AANNDD MMIISSSSIIOONN ...................................................................................................................................................... 1166 1.1.1 PRESENTATION OF THE COMPANY AND THE NEW REGULATORY FRAMEWORK .................. 16 1.1.2 2009-2011 BUSINESS PLAN....................................................................... 20
11..22 DDEEVVEELLOOPPMMEENNTTSS IINN TTHHEE OORRGGAANNIISSAATTIIOONNAALL MMOODDEELL ............................................................................................ 2255
11..33 TTHHEE OORRGGAANNIISSAATTIIOONN CCHHAARRTT...................................................................................................................................................... 2266
11..44 OORRGGAANNIISSAATTIIOONNAALL AANNDD AACCCCOOUUNNTTIINNGG SSEEPPAARRAATTIIOONN ........................................................................................ 2266
2. THE GENERAL MACROECONOMIC SITUATION.................................29
22..11 TTHHEE MMAACCRROOEECCOONNOOMMIICC FFRRAAMMEEWWOORRKK ................................................................................................................................ 2299
22..22 TTHHEE FFIINNAANNCCIIAALL MMAARRKKEETT AANNDD RRAATTEESS................................................................................................................................ 3311
22..33 PPUUBBLLIICC FFIINNAANNCCEESS ............................................................................................................................................................................ 3333
22..44 PPUUBBLLIICC--IINNTTEERREESSTT IINNVVEESSTTMMEENNTTSS IINN PPUUBBLLIICC--PPRRIIVVAATTEE PPAARRTTNNEERRSSHHIIPPSS........................................ 3355
RESULTS OF CASSA DEPOSITI E PRESTITI ............................................39
3. PERFORMANCE AND FINANCIAL POSITION....................................39
33..11 RREECCLLAASSSSIIFFIIEEDD BBAALLAANNCCEE SSHHEEEETT ............................................................................................................................................ 4400 3.1.1 ASSETS ................................................................................................ 40 3.1.2 LIABILITIES AND EQUITY ............................................................................. 43 3.1.3 BALANCE SHEET RATIOS ............................................................................. 45
33..22 RREECCLLAASSSSIIFFIIEEDD IINNCCOOMMEE SSTTAATTEEMMEENNTT ................................................................................................................................ 4455 3.2.1 FINANCIAL PERFORMANCE ........................................................................... 45 3.2.2 PERFORMANCE INDICATORS ......................................................................... 49
33..33 RREECCOONNCCIILLIIAATTIIOONN OOFF TTHHEE RREECCLLAASSSSIIFFIIEEDD FFIINNAANNCCIIAALL SSTTAATTEEMMEENNTTSS .................................................... 5500
4. OPERATING PERFORMANCE ...........................................................52
44..11 FFIINNAANNCCIINNGG AACCTTIIVVIITTIIEESS AANNDD FFIINNAANNCCIIAALL SSEERRVVIICCEESS .......................................................................................... 5522 4.1.1 PERFORMANCE OF THE LOAN PORTFOLIO – PUBLIC ENTITIES.................................... 52

Report and Financial Statements at 31 December 2009
11
4.1.2 PERFORMANCE OF THE LOAN PORTFOLIO – FACILITATED CREDIT AND ECONOMIC
SUPPORT....................................................................................................... 58 4.1.3 PERFORMANCE OF THE LOAN PORTFOLIO – PROJECT FINANCE................................... 62 4.1.4 PERFORMANCE OF THE LOAN PORTFOLIO – ENTERPRISES ........................................ 64 4.1.5 THE EXPORT-BANK SYSTEM.......................................................................... 66 4.1.6 REAL-ESTATE INVESTMENT AND SERVICES......................................................... 67
44..22 TTRREEAASSUURRYY AANNDD FFUUNNDDIINNGG AACCTTIIVVIITTIIEESS ............................................................................................................................ 6699 4.2.1 TREASURY MANAGEMENT AND SHORT-TERM FUNDING ............................................ 69 4.2.2 DEVELOPMENTS IN MEDIUM AND LONG-TERM FUNDING .......................................... 71 4.2.3 DEVELOPMENTS IN POSTAL SAVINGS ............................................................... 73 4.2.4 RENEWAL OF THE AGREEMENT WITH POSTE ITALIANE S.P.A. ................................... 77
44..33 EEQQUUIITTYY IINNVVEESSTTMMEENNTTSS .................................................................................................................................................................. 7788 4.3.1 SUBSIDIARIES AND ASSOCIATES.................................................................... 81 4.3.2 OTHER EQUITY INVESTMENTS ....................................................................... 83 4.3.3 INVESTMENT FUNDS SUBSCRIBED................................................................... 85
44..44 RRIISSKK MMOONNIITTOORRIINNGG,, CCOONNTTRROOLLSS AANNDD SSUUPPPPOORRTT AACCTTIIVVIITTIIEESS........................................................................ 8877 4.4.1 RISK MONITORING.................................................................................... 87
4.4.1.1 Credit risk ................................................................................. 87 4.4.1.2 Counterparty risk associated with derivative transactions ................. 87 4.4.1.3 Interest rate risk ........................................................................ 87 4.4.1.4 Liquidity risk............................................................................. 88 4.4.1.5 Legal disputes........................................................................... 88
4.4.2 REPORT ON CORPORATE GOVERNANCE AND OWNERSHIP STRUCTURE: MAIN
CHARACTERISTICS OF THE RISK MANAGEMENT AND INTERNAL CONTROL SYSTEM WITH REGARD
TO SEPARATE AND CONSOLIDATED-LEVEL FINANCIAL DISCLOSURE, PURSUANT TO ARTICLE
123-BIS (2) POINT B) OF THE CONSOLIDATED LAW ON FINANCIAL INTERMEDIATION ............... 89 4.4.2.1 The internal control system.......................................................... 89 4.4.2.3 Compliance system pursuant to Legislative Decree 231/01 ............... 91 4.4.2.4 Key characteristics of the risk and internal control management systems with regard to the financial reporting process .............................................. 92 4.4.2.5 Independent auditors.................................................................. 94 4.4.2.6 Manager responsible for the preparation of the company’s financial reports ............................................................................................... 95 4.4.2.7 Insider register .......................................................................... 96 4.4.2.8 Code of Ethics............................................................................ 97
4.4.3 COMMUNICATIONS.................................................................................... 97 4.4.4 HUMAN RESOURCE MANAGEMENT ................................................................... 99
4.4.4.1 The workforce........................................................................... 99 4.4.4.2 Personnel training and management ............................................. 99 4.4.4.3 Industrial relations ..................................................................... 99
4.4.5 IT SYSTEMS AND INTERNAL PROJECTS............................................................ 100 4.4.6 STATE OF IMPLEMENTATION OF THE PROVISIONS OF LEGISLATIVE DECREE 196 OF 30
JUNE 2003.................................................................................................. 101
5. RELATIONS WITH THE MEF ..........................................................102
55..11 RREELLAATTIIOONNSS WWIITTHH TTHHEE CCEENNTTRRAALL SSTTAATTEE TTRREEAASSUURRYY ...................................................................................... 110022
55..22 AAGGRREEEEMMEENNTTSS WWIITTHH TTHHEE MMEEFF ............................................................................................................................................ 110022

Report and Financial Statements at 31 December 2009
12
55..33 MMAANNAAGGEEMMEENNTT OONN BBEEHHAALLFF OOFF TTHHEE MMEEFF.................................................................................................................... 110033
6. OUTLOOK FOR 2010 .....................................................................105
7. PROPOSED ALLOCATION OF NET INCOME FOR THE YEAR .............107

Report and Financial Statements at 31 December 2009
13
FINANCIAL HIGHLIGHTS
MAIN INDICATORS

Report and Financial Statements at 31 December 2009
14
Report and Financial Statements at 31 December 2009
15
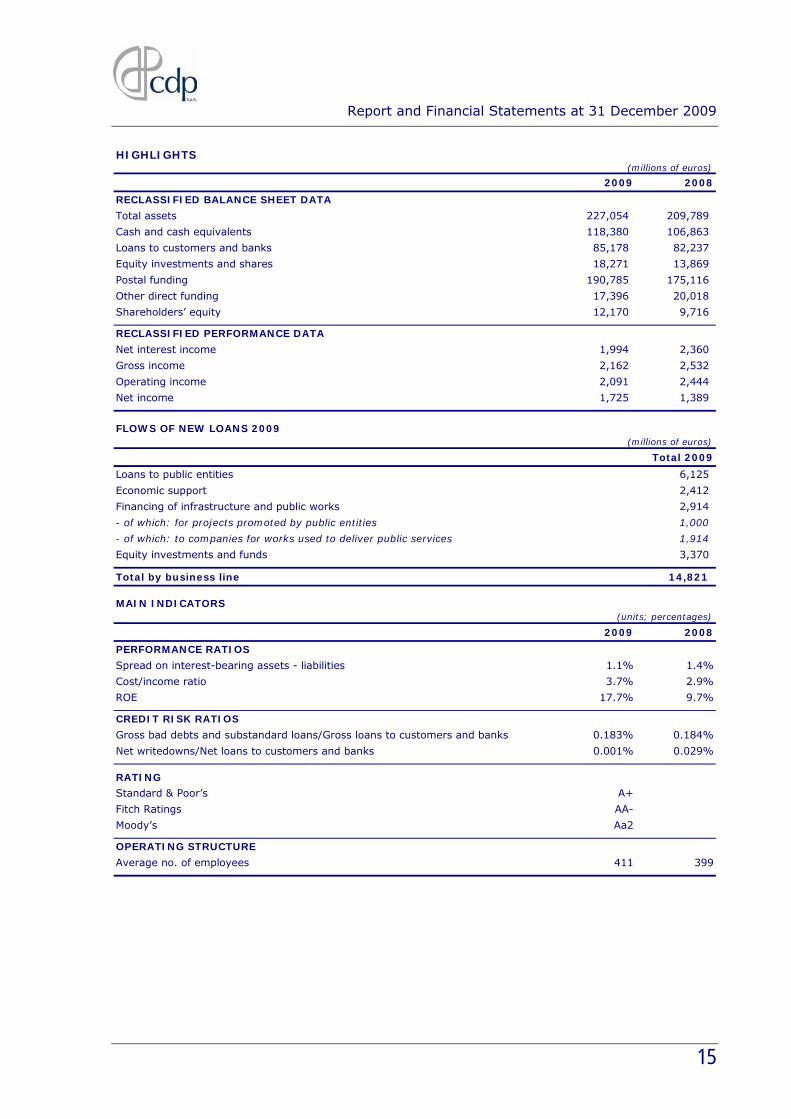
HIGHLIGHTS(millions of euros)
2009 2008
RECLASSIFIED BALANCE SHEET DATA
Total assets 227,054 209,789
Cash and cash equivalents 118,380 106,863
Loans to customers and banks 85,178 82,237
Equity investments and shares 18,271 13,869
Postal funding 190,785 175,116
Other direct funding 17,396 20,018
Shareholders’ equity 12,170 9,716
RECLASSIFIED PERFORMANCE DATA
Net interest income 1,994 2,360
Gross income 2,162 2,532
Operating income 2,091 2,444
Net income 1,725 1,389
FLOWS OF NEW LOANS 2009(millions of euros)
Total 2009
Loans to public entities 6,125
Economic support 2,412
Financing of infrastructure and public works 2,914
- of which: for projects promoted by public entities 1,000
- of which: to companies for works used to deliver public services 1,914
Equity investments and funds 3,370
Total by business line 14,821
MAIN INDICATORS(units; percentages)
2009 2008
PERFORMANCE RATIOS
Spread on interest-bearing assets - liabilities 1.1% 1.4%
Cost/income ratio 3.7% 2.9%
ROE 17.7% 9.7%
CREDIT RISK RATIOS
Gross bad debts and substandard loans/Gross loans to customers and banks 0.183% 0.184%
Net writedowns/Net loans to customers and banks 0.001% 0.029%
RATING
Standard & Poor’s A+
Fitch Ratings AA-
Moody’s Aa2
OPERATING STRUCTURE
Average no. of employees 411 399

Report and Financial Statements at 31 December 2009
16
1. PRESENTATION OF THE COMPANY
1.1 CDP’S ROLE AND MISSION
1.1.1 PRESENTATION OF THE COMPANY AND THE NEW REGULATORY FRAMEWORK Cassa Depositi e Prestiti S.p.A. is the result of the transformation of CDP S.p.A. from an agency that was part of general government into a joint-stock company pursuant to Article 5 of Decree Law 269 of 30 September 2003, ratified, with amendments, by Law 326 of 24 November 2003, as amended. Subsequent decrees issued by the Minister for the Economy and Finance implemented the decree law and established the assets and liabilities of CDP S.p.A., as well as the guidelines for organisational and accounting separation and the procedures to be followed in setting the terms and conditions of lending and funding under the Separate Account. The Decree Law outlines the new company’s main lines of activity, which maintain continuity with CDP S.p.A.’s mission prior to the transformation. Thereafter, CDP considerably expanded its institutional mission and areas of expertise to seize the opportunities presented by recent regulatory developments. Overall, these recent innovations have allowed the use of postal savings to directly finance private-sector parties involved in investment projects “promoted” by public entities (Decree Law 185/2008, ratified with Law 2/2009), to help small and medium-sized enterprises (“SMEs”) overcome the temporary lack of medium and long-term credit or to strengthen capital and foster aggregation initiatives (Decree Law 5/2009, ratified with Law 33/2009 and subsequently amended by the 2010 Finance Act, the text of which was approved with Law 191/2009), to support the areas of Abruzzo hit by the earthquake (Decree Law 39/2009, ratified with Law 77/2009), and to provide support for the international expansion of enterprises backed by SACE S.p.A. guarantees or insurance (Decree Law 78/2009, ratified with Law 102/2009). CDP took advantage of these new opportunities to expand the scope of its operations, amending its articles of association accordingly. Specifically, as to the funding of infrastructure and other public works, Article 22 of Decree Law 185/2008, ratified with Law 2/2009, allows the use of postal savings to finance all other operations set out in the articles of association that

Report and Financial Statements at 31 December 2009
17
are in the public interest and that are promoted by the state, local authorities, other public entities and public-law entities, taking into account the economic and financial sustainability of each such operation. The decree of 12 March 2009 of the Minister for the Economy and Finance identified the following categories of operations “promoted” by public bodies, assumed to be in the public interest:
• recipients of long-term grants and state or Community subsidies; • projects included in the promoters’ programmes, plans or other planning
mechanisms; • projects co-financed by the European Investment Bank (EIB); • projects carried out under agreements between EU member states or
institutions; • projects intended to accomplish the bodies’ institutional duties; • projects carried out through the concession of public assets, tenders for
works or services, public works; • projects carried out via public-private partnerships (PPP)
As regards economic support measures, Article 3.4-bis of Decree Law 5/2009, ratified with Law 33/2009, and subsequently amended by Law 191/2009, allows the use of postal savings to provide financing to small and medium-sized enterprises (SMEs). This will be accomplished through the banking system (to which CDP has made up to €8 billion available). Additional support will be provided through the subscription of investment funds that seek to strengthen the capital and promote the aggregation of smaller enterprises (for whom CDP has allocated €250 million). CDP will participate in investment funds whose purpose coincides with its own, such as the “Fondo Italiano di Investimento per le PMI”, a fund for investing in Italian SMEs. In addition, in order to promote the reconstruction of the areas of Abruzzo hit by earthquakes in April 2009, Article 3.3 of Decree Law 39/2009, ratified with Law 77/2009, authorises CDP to provide loans to banks operating in the stricken areas. Banks must use these funds to make loans to people affected by the earthquakes. These loans will be repaid using a tax credit mechanism and may be backed by the state. Finally, Article 8 of Decree Law 78/2009, ratified with Law 102/2009, authorizes and governs the activities of CDP in support of SACE S.p.A. to create an integrated “export-bank” system operating on market terms and conditions. The public-interest operations that CDP can engage in using postal savings include projects to support the international expansion of enterprises that are guaranteed or insured by SACE.

Report and Financial Statements at 31 December 2009
18
Therefore, CDP’s corporate purpose, as set out by Article 3.1 of the articles of association, includes the following activities. 1) Any sort of financing of the state, regions, local authorities, public entities and
public law bodies by using funds redeemable by way of postal savings passbooks and interest bearing postal bonds, guaranteed by the state and distributed through Poste Italiane S.p.A. or its subsidiaries, and funds deriving from the issue of notes, the taking on of loans and other financial transactions, which may be guaranteed by the state.
2) Any sort of financing using funds guaranteed by the state, directed at public-interest initiatives “promoted” by the entities referred to in the previous point, to support the international expansion of enterprises when such initiatives are secured by guarantees or insurance from SACE S.p.A., or carried out in favour of small and medium-sized enterprises for the purpose of supporting the economy. The financial transactions may be conducted either directly (if for an amount equal to or greater than €25 million) or through the banking system, with the exception of operations in favour of SMEs, which may only be conducted through the banking system or the subscription of investment funds managed by an asset management company whose corporate purpose achieves one or more of the institutional missions of CDP. Financial transactions carried out for operations “promoted” by the entities referred to in the point above or directed at supporting the international expansion of enterprises (when such initiatives are secured by guarantees or insurance from SACE S.p.A.), may be carried out in favour of public or private entities, with the exclusion of natural persons, having legal personality.
3) Any sort of financing of projects, plants, networks and other infrastructure intended to supply public services and for the reclaiming of land, using funds derived from the issue of notes, the taking on of loans and other financial transactions, without state guarantee, without raising funds first-hand and by means of fund-raising exclusively from institutional investors.
With regard to the acquisition of equity investments, on 27 January 2005 the Minister for the Economy and Finance issued, pursuant to Article 5.9 of Decree Law 269/2003 (regulating the minister’s policy-making powers for CDP S.p.A. activities), a decree establishing the criteria for determining which equity investments CDP S.p.A. may make. The decree makes reference to CDP S.p.A.’s articles of association, which at Article 3.2, establish that “The company may also carry out any other operations instrumental, related or accessory to the attainment of its corporate purpose, including inter alia: […] acquiring equity investments and interests in companies, other businesses, consortiums and

Report and Financial Statements at 31 December 2009
19
business groupings in Italy and abroad”. The decree specifies the definitions of instrumental, related and accessory to the corporate purpose of CDP S.p.A. Accordingly, CDP S.p.A. may acquire, using funds from postal savings if deemed appropriate, equity investments in companies whose business:
• is functional or auxiliary to the pursuit of CDP S.p.A.’s corporate purpose (instrumental equity investments);
• is interdependent with CDP S.p.A.’s corporate purpose (related equity investments);
• is complementary to CDP S.p.A.’s corporate purpose (accessory equity investments).
All of the activities established by the new regulatory framework in which CDP S.p.A. now operates must be conducted in a manner such that, within the context of a separate accounting and organisational system, they preserve the financial stability of the organisation over the long term while ensuring a return on investment for the shareholders. In accordance with Article 5.6 of Decree Law 269/2003, the provisions of Title V of the 1993 Banking Law also apply to CDP S.p.A., given its characteristics. During 2009, the shareholders amended the article of association to take advantage of the new business opportunities for CDP opened up by regulatory changes. The shareholders voted unanimously in favour of these amendments, with this support due in part to the need for a quorum of 85% of the share capital for Extraordinary Shareholders’ resolutions under the articles of association. The shareholders also decided to impose limitations on the use of postal savings that are stricter than the minimum requirements under the law, for example, a €25 million minimum is required for direct funding by CDP of operations promoted by public entities. On the operations side, the CDP Extraordinary Shareholders’ Meeting of 13 May 2009 approved the amendments to the corporate purpose section of CDP’s articles of association to take advantage of the opportunities offered by the provisions of Article 22 of Decree Law 185/2008, ratified with Law 2/2009 (financing for projects “promoted” by public entities) and Article 3.4-bis of Decree Law 5/2009, ratified with Law 33/2009 (funds for lending to SMEs) in particular. At their 23 September 2009 meeting, the shareholders further expanded the use of postal savings to support the international expansion of enterprises where

Report and Financial Statements at 31 December 2009
20
guaranteed or insured by SACE S.p.A. (pursuant to Article 8 of Decree Law 78/2009). Lastly, in January 2010 the shareholders once again amended the articles of association to take account of the new opportunities offered by the 2010 Finance Law (ratified with Law 191/2009). The articles of association were amended to allow CDP to participate in investment funds whose purpose coincides with those of CDP, such as the “Fondo Italiano di Investimento per le PMI”. Finally, the shareholders approved the following amendments to the articles of association in 2009:
• postponement of the date starting on which preferred shares will automatically be converted into ordinary shares by 3 years (1 January 2013) and elimination of the minimum preference dividend awarded to holders of these shares starting from 2009 (Article 34 of the articles of association);
• extension of the duration of the company from 2050 to 2100, consistent with CDP’s nature as a long-term investor;
• bringing the articles of association into compliance with the Consolidated Law on Financial Intermediation, as amended following the implementation of the Transparency Directive (Directive 2004/109/EC). Specifically, the changes regard the deadline for convening the Ordinary Shareholders’ Meeting (Article 11.4) and the manager responsible for the preparation of the corporate financial reports (Article 24-bis).
1.1.2 2009-2011 BUSINESS PLAN The recent extension of CDP’s scope of operations as a result of changes made to its articles of association in order to take advantage of the opportunities offered by regulatory changes has required the company to update its strategy and medium and long-term targets. These changes were incorporated into the 2009-2011 business plan approved by the Board of Directors in September 2009. The plan takes account of the above changes to the articles of association, which significantly expanded CDP’s scope of operations and set out the possibilities of the company’s new activities in addition to establishing the new organisational model and future investments. Specifically, alongside its institutional mission of providing direct financial support to public entities by financing projects for the delivery of local public services, and offering postal savings products (which are characterised by their low risk profile), CDP may also offer financing for infrastructure projects, keeping in mind

Report and Financial Statements at 31 December 2009
21
the consistency between the investment made and the general interest and acting as a complement to other private lending institutions. CDP therefore serves as a bridge between the government’s implementation of its planning decisions (without worsening the public debt) and the participation of private investors in these infrastructure projects (taking appropriate steps to achieve a balance between the time horizon and the level of risk of the investment).
To achieve these goals within the time horizon considered, the Plan requires CDP to make available direct resources of €50 billion (equal to more than 3% of Italy’s GDP). These resources could mobilise an additional €20-25 billion in private capital. In addition, it is conservatively estimated that the Public Works Guarantee Fund (FGOP) could provide a further €20 billion in guarantees for works.
(billions of euros)
Business linesAmounts available
2009-2011
Loans to public entities 18
Economic support 13
Financing of infrastructure and public works 12
- of which: for projects promoted by public entities 6
- of which: to companies for works used to deliver public services 6
Export bank with SACE 3
Equity investments and funds 3
Real estate investment and services 1
Total on-balance-sheet lending 50
Public Works Guarantee Fund (FGOP)* 2
* This would permit guarantees to be issued for a total amount estimated at €20 billion CDP is therefore committed to working in partnership with private investors, mainly with the banking system, to mobilise greater resources than those CDP makes available directly and to adequately spread out its exposure in order to diversify specific risks. From an organisational standpoint, CDP is striving to maintain a streamlined structure that is flexible and modular, but still capable of achieving its mission. To achieve these objectives, the company revamped and, where necessary, created various product lines that correspond to its lines of activity. Specifically:

Report and Financial Statements at 31 December 2009
22
Lending to public entities (€18 billion available for 2009-2011), through the use of postal savings, in compliance with the principles of accessibility, uniformity in treatment, pre-specification of terms and non-discrimination. CDP’s objective is to strengthen its position as a key partner for public entities, which remain CDP’s primary customer category. In an environment where public finance restrictions limit the ability of these entities to take on debt, CDP will pursue this goal by strengthening its relationship with its customers, by improving the range of products it offers and by achieving greater efficiency in the lending process. CDP aims to expand its market share in this area from 41% to over 44% by 2011. Financing for projects “promoted” by public entities (€6 billion available for 2009-2011), through the use of postal savings. Operations promoted under the decree of the Minister for the Economy and Finance specified above fall under a broader framework of projects carried out via public-private partnership concerning the construction of infrastructure and public works. CDP’s strategic priority focuses on investment in infrastructure and networks in the areas of transportation, energy, telecommunications and water services or those required for providing public services or performing a public body’s institutional mission, that are built or operated by non-government entities. Moreover, CDP provides industrial loans or funding for research to manufacturing and service firms, with preference given to those carried out in conjunction with the EIB. In carrying out these operations, CDP plays a complementary role to banks by offering financing amounting to no more than 50% for each project (in line with the EIB model). As stated in its article of association, CDP will only offer direct financing for major projects (greater than €25 million). Smaller operations will be funded by CDP through banks, which will be responsible for managing the relationship between the parties involved. CDP will assess the financial sustainability and the creditworthiness of the debtors and/or guarantors for each loan, with the power to determine how it will provide financing and the terms of the loan. Financing for works, plants, networks and other infrastructure for the delivery of public services and reclamation works (€6 billion available for 2009-2011), using funding without government guarantee. CDP continues to directly support enterprises in building works, plants, networks and other infrastructure for the delivery of public services and reclamation works, in line with Decree Law 269/2003.

Report and Financial Statements at 31 December 2009
23
It will continue to operate in the areas of providing funding for corporate customers (e.g. public utilities, companies operating in the transport and integrated logistics sector, universities, construction firms) and providing project financing for infrastructure works, that ensure an adequate return on the capital used in lending. CDP therefore strives to support major infrastructure projects, particularly in sectors requiring a high level of investment, such as highways, incinerator plants, regasifiers and subway systems. While until now operations have focused largely on medium and long-term financing, the option of offering short-term financing in preparation for a more extensive medium and long-term operation exists. CDP’s goal is to double its current market share to 7% by the end of 2011. Programmes to support the economy (€13 billion available for 2009-2011), primarily through postal savings. CDP intends to provide active support to national development policies through its management of economic support instruments, created under special legislation, acting primarily through the banking system. This line of activity encompasses new major financing made available through banks to support SMEs (€8 billion available) and for the reconstruction of the areas of Abruzzo hit by the earthquake (€2 billion available). The goal is to establish other funds alongside the existing Revolving Fund to support enterprises and investment in research (FRI), such as the Regional FRI (to promote investment in production and research) and the Revolving Fund for Strategic Infrastructures (FRIS) (for building strategic infrastructures of national importance contained in the Framework Infrastructure Act). To these are added the Kyoto Fund for financing measures meant to implement the terms of the Kyoto Protocol to the United Nations Framework Convention on Climate Change of 11 December 1997. CDP also plans to establish the Public Works Guarantee Fund (FGOP) (authorised with the 2008 Finance Act, Article 2.264 to provide guarantees on behalf of entities involved in building and operating these works in order to ensure the financial equilibrium of the projects. Financing for international expansion of enterprises with SACE guarantee (€3 billion available for 2009-2011), funded through postal savings. CDP finances operations for the international expansion of Italian enterprises, where guaranteed or insured by SACE (the integrated export bank system). A subsequent decree of the Minister for the Economy and Finance authorises and regulates the work done by CDP on behalf of SACE S.p.A. to render this system operational.

Report and Financial Statements at 31 December 2009
24
This work requires that the loan be structured based on the type of financing requested by the customer, that the terms offered by CDP do not distort competition, and SACE guarantees or insures each operation financed. Financing can be granted either directly (for amounts of at least €25 million) or indirectly through banks. Real estate investment and services (€1 billion available for 2009-2011), funded through postal savings. CDP directly invests funds for the development of social housing programmes, through funds managed by CDP Investimenti SGR, the new management company established for this purpose, and the provision of real estate advisory service to entities. In doing this, CDP operates in accordance with the “Housing Plan” (pursuant to Article 58 of Decree Law 112/2008, ratified with Law 133 of 6 August 2008), which aims to improve the local housing market and pro-actively support entities in developing the ability to enhance the value of, transform and manage their holdings. Equity investments and funds: in addition to managing the equity investments transferred in the course of transforming the company into a joint-stock company or purchased subsequently (Eni S.p.A., Poste Italiane S.p.A., Terna S.p.A. and STM), CDP pursued international initiatives in cooperation with other institutions under the “Long-Term Investors Club” project established by CDP, the EIB, Caisse des Dépôts et Consignations (CDC), and Kreditanstalt für Wiederaufbau (KfW) in April. The Club’s main goal is to underscore the importance of long-term investors for European financial stability and economic growth, a strategic role in the current crisis. Through the Club, members will reinforce their reciprocal ties by promoting common initiatives and will foster the search for long-term investments. Current initiatives include CDP’s participation in the Marguerite Fund, formed to finance programmes in the energy, environmental and transport sectors in the EU countries. The fund was formed with the support of the Italian government. EIB serves as the fund manager and CDP, CDC, KfW, Istituto de Crédito Oficial - ICO (Spain) and Powszechna Kasa Oszczędności Bank Polski - PKO (Poland) are sponsors. The European Commission is also expected to take part through an initial contribution. Likewise, CDP, in cooperation with CDC, CDG (Morocco) and EFG-Hermes (Egypt), is launching the InfraMed Infrastructure Fund (“IIF”) to finance

Report and Financial Statements at 31 December 2009
25
sustainable urban development and energy and transport infrastructures in countries, within the framework of the Mediterranean Union.
1.2 DEVELOPMENTS IN THE ORGANISATIONAL MODEL
The changes to CDP’s organisational model outlined in the business plan, to support the strategic lines it defines, fall within a broader project aimed at completing the transition to a form that is more in line with that required by a modern financial services enterprise, which must always be able to meet unplannable needs in a timely and efficient manner. In light of the foregoing, the organisational changes under the Plan consist in the shift from an approach that integrates the entire cycle of service to the customer within a single business unit, to a “service-centric” approach that calls for the specialisation and organisational separation of front-office and back-office activities. By centralising the latter under a more “industrial-scale” approach, savings can be achieved in providing the service to the customer and ensure benefits in terms of economies of scale and operational flexibility. The change will also make monitoring functions more effective and will curb the growth in the size of the structure even though CDP’s strategic duties have expanded. The complexity and sensitivity of the transformation and the simultaneous need to ensure continuity in daily operations and in the quality of the service provided customers made taking a gradual, stepped approach necessary in moving towards the new model, using sequential stages. During the first stage, which essentially coincided with the drawing up of the business plan, the “radical” changes involved in the new organisational design were identified, which were then translated into the current corporate organisation chart. The structure was completed in early 2010 and the lower-tier organisational relationships were defined. CDP also began a review of the main processes affected by these strategic and organisational changes, establishing operational and organisational guidelines for the new Credit Process. This is an integral part of the reorganisation effort, the final implementation of which involved the drafting and approval of CDP’s Lending Rules, in effect from 1 January 2010. The guidelines set out the standards that the units involved must follow in lending operations – in the different forms in which CDP may conduct its business – and define the criteria for access to credit, in light of the evolution of the corporate mission and the new

Report and Financial Statements at 31 December 2009
26
Board of Directors
Public Entities Real EstateProject FinanceFacilitated Credit
& EconomicSupport
Administration & Control
Legal & Corporate
Affairs
EquityInvestments
HumanResources
Enterprises
Finance, Operations &
Risks
Project AssessmentUnit
InternationalOperations –Research and
Analysis
Internal Auditing
External Relations
Business functions Business service functions Support, guidance and control functions
Chief Executive Officer
Separate Account Ordinary Account
Chairman
LocalAuthorities
ProjectCDPI SGR
organisational structure. The document represents the reference framework for the assumption and management of credit risks, establishing the main credit policies for the various business sectors and the roles, duties and responsibilities of the individual participants in the process.
1.3 THE ORGANISATION CHART
The CDP organisation chart as of 31 March 2010 is as follows.
1.4 ORGANISATIONAL AND ACCOUNTING SEPARATION
Article 5.8 of Decree Law 269/2003 established a system of organisational and accounting separation between the activities of general economic interest and the other activities performed by the company.
Report and Financial Statements at 31 December 2009
27
By the end of the 2004 financial year, CDP S.p.A. had completed the procedures to implement organisational and accounting separation after having obtained the opinion of the Bank of Italy and submitting the definitive criteria to the MEF pursuant to Article 8 of the MEF decree of 5 December 2003. As such, the organisational and accounting separation took full effect from 2005. CDP S.p.A.’s implementation of this system of organisational and accounting separation was necessary to ensure compliance with EU regulations regarding state aid and domestic competition, in light of the fact that certain forms of CDP S.p.A. funding, such as postal bonds and passbook savings accounts, benefit from an explicit state guarantee in the event of issuer default. The existence of this guarantee, which is justified, first and foremost, by the social and economic importance of postal savings (which was defined by the MEF decree of 6 October 2004 as a service of general economic interest on the same level as the activities of lending to public entities and public-law bodies under the Separate Account), makes it necessary to distinguish between activities that are not of general economic interest and are, therefore, potentially conducted in competition with other market players. More specifically, the separation arrangements put in place by CDP S.p.A. envisage:
• for accounting purposes, the establishment of three operating units called, respectively, the Separate Account, the Ordinary Account, and Joint Services, within which CDP S.p.A.’s existing organisational units have been re-grouped. The Separate Account includes, in general, the units responsible for providing financing to public entities and public-law bodies, the management of the assets and functions transferred to MEF with CDP S.p.A.’s transformation into a joint-stock company, and the provision of advisory services to government bodies. The Ordinary Account includes the units responsible for financing activities regarding infrastructure for the delivery of public services and related advisory, study, and research activities. Joint Services include the units responsible for shared functions of governance, steering, control and support for the company in the light of the company’s unique status;
• the existence of a double level of separation, with the first level envisaging the allocation of direct costs and revenues to the Accounts and Joint Services, and the second level the subsequent allocation to the Accounts of the costs and revenues of Joint Services on the basis of appropriate analytical accounting methods;

Report and Financial Statements at 31 December 2009
28
• the recognition and measurement of any internal transactions between the Separate Account and the Ordinary Account, or between the Accounts and Joint Services, using the respective market prices as a benchmark, with a view to preventing unauthorised transfers of resources;
• the preparation of distinct annual income statements on the basis of the levels of separation described above.
With regard to CDP S.p.A.’s lines of activity at 31 December 2009, which were partially revised under the business plan, the “lending to public entities”, “real estate investment and services”, “financing for projects promoted by public entities” and “programmes to support the economy” lines of business come under the Separate Account, while “financing for works, plant, networks and other infrastructure for the delivery of public services and reclamation works” come under the Ordinary Account. Joint Services include the service departments, the support, steering and control departments, and the governance and control bodies. From the very start of operations for the Ordinary Account, CDP S.p.A. chose to keep cash flows separated for the two Accounts, although such a strict division is not required by the system of accounting separation. In other words, the forms of funding, lending and liquidity management (deposits and current accounts) for the Separate Account are distinct and autonomous from the analogous instruments used for the Ordinary Account, with the sole exception of temporary and exceptional circumstances. The contribution of the Separate Account and the Ordinary Account to CDP S.p.A.’s performance is detailed in the annexes to the financial statements.

Report and Financial Statements at 31 December 2009
29
2. THE GENERAL MACROECONOMIC SITUATION
2.1 THE MACROECONOMIC FRAMEWORK
The recovery in the global economy, which nonetheless contracted by 0.8% in 2009 as a whole, began in the summer of 2009 and continued through the rest of the year.1 During the last four months of 2009, the decline in GDP slowed in the U.S. (-0.7%), the euro area (-1.8%) and Japan (-1.8%), while growth accelerated in the Asian emerging economies (+3.6%) and Latin America (+3.1%).2 Global trade also began expanding again, although it remained about 10% below the level of the previous year. In the fourth quarter, industrial production continued its recovery and confidence began to return. Strains lessened on international financial markets and banks began easing their lending conditions. In this environment, inflation remained moderate despite gradually rising prices for oil and other raw materials. Market expectations point to a continuation of the expansionary monetary policy stance of central banks. Interbank rates on the London market are expected to develop as follows: for the US dollar, from 1.1% in 2009 to 0.7% in 2010; for the euro, from 1.2% in 2009 to 1.3% in 2010; and for the yen, from 0.7% in 2009 to 0.6% in 2010.3 Thus, although the outlook for the global economy improved during the year, broad uncertainty remains as to the pattern and pace of the recovery, both for the financial markets and for the real economy. The main critical factors concern: the deterioration in the public finances of the more advanced economies; the high levels of private-sector debt (which could limit consumption); the difficulties on the labour market; the low level of capacity utilisation (which tends to hold back capital expenditure); and excess supply on the real estate market (which tends to discourage construction investment).
1 Source: IMF, World Economic Outlook, January 2010. 2 See previous note. 3 See previous note.

Report and Financial Statements at 31 December 2009
30
Nonetheless, the consensus forecasts for 2010 have been revised upwards. The latest forecasts of the International Monetary Fund are for growth of 3.9% in the global economy (compared with a contraction of 0.8% in 2009). Forecasts show growth of 2.1% for the more advanced economies (against a decline of 3.2% in 2009) and 6% for the emerging and developing economies (compared with 2.1% in 2009). Therefore, for 2010 and 2011, growth is expected to remain weak overall. In this context, Italy’s GDP returned to growth in the summer and continued expanding at a moderate pace in the autumn months as well (with GDP growth in the third quarter of 2009 of 0.6% over the previous quarter).4 Inflation rose in the latter part of the year, although it remained at 0.8% for the year (compared with 3.3% in 2008). The Bank of Italy expects inflation to remain below 2% over the next two years. However, the modest uptick in industrial production (+4.4% in the third quarter over the previous period) and in exports (+2.5% in the third quarter over the previous period) did not continue through the autumn, and both consumption (+0.3% in the third quarter over the previous period) and investment (+0.3% in the third quarter over the previous period) remained weak.5 Over the next two years, the domestic components of demand are not expected to contribute much to growth, which will therefore depend on the recovery in foreign demand, assuming that the global economy is able to return to rapid growth. Overall, the Bank of Italy expects the Italian economy to grow by 0.7% for the year, before accelerating to 1% in 2011. Bank lending has continued growing swiftly, although it is slowing due to greater prudence in demand for credit by businesses and consumers as a result of the recession. The slowdown was sharpest in lending to smaller businesses. The periodic survey on lending conducted by the Bank of Italy also shows a gradual tightening of lending conditions. Other surveys show that the percentage of businesses struggling to obtain financing is rising. Banks in Italy, as in other countries, are adapting their assets to the difficulties in funding and to the rising cost of such funding. The lessening of tensions on the financial and money markets and the strengthening of bank capital, facilitated by the measures taken by the Italian Government and the Bank of Italy, could help ease credit conditions.
4 Source: Bank of Italy, Economic Bulletin, January 2010. 5 See previous note.

Report and Financial Statements at 31 December 2009
31
The key critical issues for the banking industry in 2010 could therefore emerge not so much in the supply of credit, but rather in the risk of default of a significantly larger-than-normal number of businesses. In many industries, turnover has fallen by 20-30% (and by much more in the automotive and home appliance industries). As the Bank of Italy recently noted, the demand for credit, which posted a recovery in the second half of 2009, came in conjunction with a sharply negative contribution from investment. Loan applications have been driven by the need to finance working capital and by widespread recourse to the restructuring and consolidation of bank borrowing. Based on empirical data from the banking industry, it is estimated that about 1% of loans to SMEs could deteriorate into bad debts.6 This crisis would be a source of concern both in terms of margins for the banking industry (which would not be sufficient to absorb these losses without a further severe erosion of capital) and in terms of employment levels among SMEs, which would decline significantly.
2.2 THE FINANCIAL MARKET AND RATES
Conditions in the domestic and international financial markets are showing signs of improvement. At the end of the year, despite the fact that the balance sheets of the leading central banks have remained essentially unchanged, the Federal Reserve declared that it was no longer necessary to renew, beyond their February expiration, the majority of the facilities introduced during the crisis to provide liquidity to the markets. In the second half of February 2010, the US central bank raised the discount rate by a quarter point, to 0.75%. Conversely, the European Central Bank (ECB) kept its official policy rate at 1.0%. At the end of the year, the ECB also took a number of decisions regarding the implementation of monetary policy, so as to begin gradually removing extraordinary refinancing operations that are no longer considered indispensable, while confirming the commitment of the Eurosystem to provide the liquidity needed by the banking system within the euro area. The abundance of liquidity for short-term loans contributed to keeping interest rates on the interbank market at very low levels. Improvements continued in the capitalisation of the leading international banks, which, as a group, reported better-than-expected profits in the third quarter of
6 ABI, 2009 Annual Report.

Report and Financial Statements at 31 December 2009
32
2009. Announced or recognised writedowns of financial instruments declined significantly during the same period and were nil in the fourth quarter. In the second half of the year, several European banks carried out recapitalisation transactions, turning to the market in most cases. The premiums on credit default swaps of the leading international banks, which in October had already returned to the levels seen just prior to the Lehman Brothers collapse, continued to decline in the last quarter as well, but remain well above the levels of the first half of 2007. Since mid-October, yields on ten-year government bonds in the United States and United Kingdom rose by about 40 basis points to 3.8% and 4.2%, respectively. In the euro area and Japan, on the other hand, yields remained stable at around 3.4% and 1.3%, respectively. Equity prices in the leading industrial countries rose rapidly during the spring and summer before stabilising in the last quarter of 2009. From the lows reached in March, stock market indices posted gains of between 50% and 70%. Risk premiums on corporate bonds declined in all ratings classes and in all of the leading countries. The decline for non-financial, high-yield corporate bonds denominated in euros and in dollars was about 1.8 percentage points, falling to 6.7 and 6.0 points, respectively. Risk premiums on higher-rated bonds (BBB) declined by about 0.5 percentage points to return to levels near those seen at the start of 2008 (at 1.5 and 1.9 points). Financial conditions remained favourable in the leading emerging countries as well, as they continued to benefit from substantial inflows of portfolio investment from abroad, driven by both the improved growth outlooks in many of these economies, as well as by low interest rates in the more advanced countries and a general reduction in risk aversion. The period of weakness of the dollar was interrupted at the end of the year, with the dollar appreciating by some 5% against both the euro and the yen in early January. Conversely, the dollar has remained stable since October against the currencies of the leading emerging countries, whose tendency to appreciate was in many cases countered by central bank intervention. In general, over the medium to long term, uncertainty remains concerning the methods, timing and effects of the deleveraging process, both for private-sector debt (banks, businesses and households) and public debt.

Report and Financial Statements at 31 December 2009
33
2.3 PUBLIC FINANCES
The economic forecasts released in the autumn of 2009 by the European Commission point to a sharp worsening in the public finances in the euro area as a result of the international financial crisis, with an increase in public budget deficits from 2.3% in 2008 to 7.0% in 2009. This deterioration is due in part to the effect of the automatic stabilisers, as well as to the measures adopted by the various governments in order to support the economy, but also reflects a greater-than-expected decline in revenues following the economic slowdown. The deficit could fall slightly below 7% of GDP in 2011 with the recovery of economic activity and the conclusion of the temporary measures. Nonetheless, the ratio of debt-to-GDP will continue to rise. In Italy, the figures published by ISTAT in March 2010 show that net general government borrowing reached 5.3% of GDP in 2009, a significant worsening from the same period of 2008 (when the figure was 2.7% of GDP). Based on the forecast figures, in December 2009 the European Council had begun an excessive deficit procedure against Italy. At that time, the Council called for Italy to bring its deficit back to below 3% of GDP by 2012. Based on figures published by the Bank of Italy in the January 2010 issue of its Economic Bulletin, the debt-to-GDP ratio for 2009 is estimated to have risen by about 10 points (up from 105.8% in 2008). At 31 December 2009, the stock of loans to local and regional authorities reached €78 billion, an increase of 8.6% over the same figure posted at the end of 2008 (€71 billion).
As at the same date, the stock of securities issued by local and regional authorities came to €29 billion, for a reduction of 5.4% in 2009 compared with the figure at the end of 2008 (€30 billion) due to the progressive redemption of securities in issue, which was not offset by a corresponding volume of new issues. Total debt for these local and regional government entities therefore reached €111 billion, including the securitisation transactions recognised as debt in addition to the bonds and other securities issued. The total stock of debt rose 3.7% from its level at the end of 2008 (€107 billion). This increase was due to the rise in the stock of loans seen throughout 2009, which more than offset the decline in total securities issued.

Report and Financial Statements at 31 December 2009
34
At 31 December 2009, loans with costs borne by central government totalled €53 billion, for a decline of 5.1% from the stock at the end of 2008, due mainly to the repayment of principle, which was not offset by new debt.
Stock of regional and local authority debts and loans to central government (€ billions)
69 7178
31 30 29
10 5 5
58 56 53
169 163 164
End-2007 End-2008 End-2009
Reg./local authority loans Reg./local authority securities Reg./local authority securitizations Loans to central government Total
110 107 111
Local authority debt Local authority debt Local authority debt
Source: The Bank of Italy – supplements to the Statistical Bulletin
The breakdown of the debt of the local and regional authorities by financial instrument reveals the growing importance of loans issued by CDP S.p.A. and other monetary financial institutions (totalling 69.9% of total debt, compared with 66.8% at the end of 2008) and a decline in the stock of bond issues in 2009 (equal to 25.8% of all debt, compared with 28.2% at the end of 2008). At the same date, securitisation transactions by local authorities, which, according to Eurostat criteria, are to be considered as debt, decreased to 4.4% of total debt, compared with 5% at the end of 2008. With regard to legislative developments, with Law 42/2009 the Government received enabling authority to issue legislative decrees to implement Article 119 of the Italian constitution with regard to fiscal federalism. The measure defines the fundamental principles upon which the new system for financing local and regional government is to be based, as well as new criteria regarding the coordination of the public finances, tax resources and tax equalisation. For 2009, the rules of the domestic Stability Pact were defined with Decree Law 112/2008, ratified with amendments with Law 133/2008. Regarding the Pact objectives for the regions and the autonomous provinces, the use of the

Report and Financial Statements at 31 December 2009
35
“expenditure” criterion was retained pending the results of the testing of the financial balances envisaged under Law 296/2006. For the local authorities segment (provinces and municipalities with populations of more than 5,000 people), the “financial balance” of final revenues less final expenditure has been retained. This is calculated on a “mixed accounting” basis, using assessments and commitments (accrual accounting) for current expenditure and receipts and payments (cash accounting), net of loans received and granted, for capital expenditure. The target balance is obtained by summing the 2007 balance, calculated on a mixed basis, with an amount equal to the contribution of each local authority to the overall budget package for the segment, which depends on the sign of the balance for 2007 and compliance with the Pact in the same year. Law 133/2008 also touched on the unified treasury procedures for local authorities, extending, as of 1 January 2009, the mixed unified treasury system, as defined in Article 7 of Legislative Decree 279/1997, to local authorities. In addition, the legislation has redefined the revenues that must be paid into the state provincial treasury, specifying solely amounts originating from the state budget.
2.4 PUBLIC-INTEREST INVESTMENTS IN PUBLIC-PRIVATE PARTNERSHIPS
The public-private partnership (PPP) is one of the mechanisms that local authorities have, since the second half of the 1990s, turned to as a means of reviving public infrastructure, given the stringent budget constraints imposed on those authorities by the Stability and Growth Pact. PPPs represent a set of organisational procedures and solutions through which public and private entities join forces to execute and manage public works, thereby leveraging synergies in planning, organisation and financing. This approach includes project financing, which in other countries has been able to achieve the dual goal of containing public spending and increasing efficiency in the delivery of public services. The European Commission’s Green Paper on public-private partnerships states that PPPs “describe a form of cooperation between the public authorities and economic operators [which aims] to fund, construct, renovate or operate an infrastructure or the provision of a service”. It further states that PPPs are characterised by: (a) the duration of the relationship between partners; (b) the method of funding the project, which is ensured by the private section, at least in
Report and Financial Statements at 31 December 2009
36
part; (c) the role of the economic operator in the various phases of the project; (d) the distribution of risks between the public and private partner, based on the capacity of each party to assess, control and manage such risks. Generally speaking, a distinction may be made between: (a) PPPs of a purely contractual nature, in which the partnership is based solely on contractual links (public tenders and concessions); and (b) PPPs of an institutional nature, which involve cooperation within a distinct entity (a mixed company for the management of public services). The growth of PPPs in Europe over the last decade is, however, attributable not only to the need to tap private funding in order to cope with the budgetary restrictions imposed upon the Member States, but also a desire to benefit from the know-how and operating methods of the private sector in public life. The effects of the financial crisis on the public accounts of most of the advanced economies have, therefore, increased the propensity of governments to turn to financial instruments that can attract private capital. Nonetheless, the credit crunch and the prospects for future increases in interest rates on bank loans, together with the reduced availability of private-sector risk capital, has led to a slowdown in PPP and project finance (PF) initiatives, particularly in relation to large-scale projects. Despite these factors, last year the Italian PPP market posted strong rates of growth. At the end of 2009, the PPP market comprised 225 projects with an investment of €537 million. Compared with the previous year, the number of projects increased by 102, while their value rose by about €350 million (+186%). The cause of this growth in investment was the strong recovery in works worth more than €5 million: 19 projects totalling €450 million, compared with 8 totalling €114 million in 2008 and 14 totalling €294 million in 2009.7 One of the features of Italy’s PPP market is the growing use of build and operate concessions to award public works contracts. PPP calls for tenders accounted for about 14% of all public works tenders in 2003. Today, that proportion has grown to 20%, with 2,312 tenders for PPP operations with a total value in excess of €33 billion.8 During the same period, the ratio of PPP calls for tenders to the number of tenders adjudicated was an average of 53%. In terms of the various segments that make up the PPP market, of particular note is the period of expansion being seen in single-tender PF initiatives, which
7 Source: for the figures provided below, unless specified otherwise, Unioncamere and Rome Chamber of Commerce, Project Financing, National Observatory, CRESME figures, December 2009. 8 Source: Department of Economic Policy Planning & Coordination, Project Finance Unit, Partenariato Pubblico-Privato in Italia. Stato dell’arte, futuro e proposte, February 2010.

Report and Financial Statements at 31 December 2009
37
went from 5 projects totalling €12 million in 2008 to 18 tenders totalling €318 million in investment in 2009. The number of two-stage PF operations has declined sharply in conjunction with the growth in single-tender projects: the selection of proposals has declined from three to just one; tenders have declined from nine to three. As for the other segments of the PPP market, “traditional” build and operate concessions are also growing, as are service concessions, while other PPP tenders have declined in number but increased in value. At the end of 2009, activities at the municipal level saw 192 projects for a total investment of €317 million, an increase of 88 projects and €182 million over 2008. Such projects accounted for 85% of the total PPP market in terms of number of opportunities (the same as for the previous year), and 59% in terms of value. The numbers are also positive for the other local and national bodies promoting PPP initiatives, with 33 projects totalling €220 million, compared with 19 totalling €54 million in 2008. A snapshot of the potential PPP market by project value continues to show a majority of small to medium-sized projects. In addition, as mentioned previously, there are numerous medium to large-scale projects of greater than €5 million, and this number has grown from 8 to 19. By segment, in 2009 networks led the way in terms of both number of opportunities and amount of investment, with 62 projects and €250 million. As these figures show, PPP is becoming an established mechanism in Italy, although still less common than in other countries. A number of structural factors continue to hold back the rise of PPP in Italy: the absence, in certain cases, of a framework for the stable, independent rate regulation; imperfect institutional mechanisms for allocating project risks, which investors would like to overcome through public guarantees, which few bodies are able to provide. The uncertain development of the legislative framework has also been a critical issue, often disorienting the market. In any event, emphasis has been placed on aspects related to the construction of public works, to the detriment of a governance structure focused more closely on the operation of such works, which should be as efficient as possible and based on market principles. Finally, it is necessary to increase the capacity of a number of government bodies to identify needs and priorities in relation to the services to be provided, as well as to communicate their decisions to the market and to manage the complex procedures that PPPs entail, while interacting effectively with the private-sector partner. Useful ideas to boost the PPP market could come from an analysis of the success stories seen in many industrial and emerging countries, where over the last decade PPP programmes have been launched and helped to raise, in some cases substantially, the level of the country’s infrastructure endowment.

Report and Financial Statements at 31 December 2009
38
Indeed, although the approaches adopted differ in response to their specific institutional and legislative contexts, the common denominator of the successful experiences is the keen commitment of central and local government and the selection of projects at the local and segment level. In light of such experience, it is to be hoped that Italy can continue the process of reform aimed at enhancing the efficiency of the tools for coordinating and promoting PPPs, while also refining the “instrumentation” available to governments (e.g. guidelines for adopting consistent rules, standardised contracts).

Report and Financial Statements at 31 December 2009
39
RESULTS OF CASSA DEPOSITI E PRESTITI
3. PERFORMANCE AND FINANCIAL POSITION In order to facilitate understanding of our results for the period, the balance sheet and income statement shown below have been reclassified on the basis of operational criteria. For the sake of full disclosure, a reconciliation of the standard and reclassified statements is also provided, in accordance with Bank of Italy Circular no. 262/2005 as amended, with a detailed breakdown of the accounts and related reclassifications. Overall, in 2009 about €15 billion in resources were mobilised, helping to achieve results that generally exceeded the targets set out in the business plan for all lines of business. Flows of new loans 2009
(billions of euros)
2009 planned 2009 actual
Loans to public entities 5.4 6.1
Economic support* n/s 2.4
Financing of infrastructure and public works 2.2 2.9
- of which: for projects promoted by public entities 0.5 1.0
- of which: to companies for works used to deliver public services 1.7 1.9
Export bank with SACE* n/s -
Equity investments and funds 3.2 3.4
Total by business line 14.8
* In preparing the business plan, no forecasts were developed for the economic support and export bank lines concerning the temporal allocation of the amounts available for 2009-2011, equal to €13 billion and €3 billion respectively. Despite the significantly adverse economic environment, CDP’s performance was positive and better than expected. Due to a number of non-recurring factors, which are described in greater detail below, overall performance for 2009 posted a clear improvement over the previous year. The figures presented below regard both CDP as a whole and the individual business units responsible for the areas of business specified above. For more information on the methods of allocating results to the various units, see the notes to the financial statements (Operating segments).

Report and Financial Statements at 31 December 2009
40
Business lines Business unit responsible
Loans to public entities Public Entities
Economic support Facilitated Credit and Economic Support
Financing of infrastructure and public works
- of which: for projects promoted by public entities Project Finance
- of which: to companies for works used to deliver public services Enterprises
Equity investments and funds
3.1 RECLASSIFIED BALANCE SHEET
3.1.1 ASSETS The assets of CDP from the reclassified balance sheet can be grouped into the following aggregates: Reclassified balance sheet
(millions of euros)
31/12/2009 31/12/2008 % change
ASSETS
Cash and cash equivalents 118,380 106,863 10.8%
Loans to customers and banks 85,178 82,237 3.6%
Debt securities 692 662 4.5%
Equity investments and shares 18,271 13,869 31.7%
Assets held for trading and hedging derivatives 1,200 502 139.3%
Property, plant and equipment and intangible assets 210 214 -1.7%
Accrued income, prepaid expenses and other non-interest-bearing assets
2,450 4,770 -48.6%
Other assets 673 672 0.1%
Total assets 227,054 209,789 8.2%
As at the end of 2009, total assets came to €227 billion, an increase of 8% over the previous year, when the total was €210 billion. On the whole, this increase was due mainly to the change in cash and cash equivalents (particularly the balance on the treasury account), which exceeded €118 billion (+11% over 2008). This increase was due to the substantial flow of net funding from postal savings in 2009.
Report and Financial Statements at 31 December 2009
41
The stock of loans to customers and to banks, which came to just over €85 billion, increased from the end of 2008 (+3.6%), but at a slower pace than the previous year, which featured a number of large transactions that were not repeated in 2009.
The stock of debt securities came to €692 million, essentially unchanged, with the exception of the purchase of a new security, which had a residual value at 31 December 2009 of about €30 million.
There was a significant increase in the carrying amount of equity investments and shares, which went from approximately €14 billion at the end of 2008 to more than €18 billion by the end of 2009 (+32%). This change was due to the increase in CDP’s equity interest in Enel S.p.A. (including the portion attributable to the Ministry for the Economy and Finance, from which the related option rights were acquired), as well as to the rise in the market value of the shares in Eni S.p.A. and Enel S.p.A. and the increase in the investment in STMicroelectronics Holding N.V. Assets held for trading and hedging derivatives posted an increase of more than €700 million. This increase was due mainly to the new explicit options purchased to hedge the corresponding embedded component of equity-linked notes (indexed bonds and Premia bonds), as well as to the change in the fair value of all explicit options. The balance also reflects the positive performance of the fair value of derivative instruments used to hedge financial risks, which is offset in the value of the hedged underlyings. The total balance of non-current assets came to €210 million, €204 million related to property, plant and equipment and the remainder to intangible assets. More specifically, there was a generalised decline in capital expenditure during the year (in the amount of €5.3 million for 2009 compared with €9.2 million in 2008). This reduction was mainly the net result of a reduction in investment for the extraordinary renovation of properties owned by CDP and an increase in purchases of software licences during the year. Accrued income, prepaid expenses and other non-interest-bearing assets declined by more than €2 billion from 2008, due mainly to the reduction in CDP’s receivable for interest accrued on the balance of the treasury account. This aggregate also includes the fair value of the loans hedged for financial risk using derivative instruments (down on 2008), as well as the reduction in the receivable due from Poste Italiane related to the settlement of postal savings funding flows.

Report and Financial Statements at 31 December 2009
42
Finally, other assets include the balance of current and deferred tax assets, as well as payments on account for withholdings on interest related to postal passbook savings and other minor assets. On the whole, the volume of new lending for 2009 came to about €14,821 million. This figure is largely accounted for by new lending to public entities (€6 billion, or 41% of the total), as well as new equity investments and fund investments (more than €3 billion, or 23% of the total). In the other areas of business, new loans were granted to finance public works and infrastructure totalling some €3 billion (20% of the total), €1 billion of which related to public-interest projects “promoted” by public entities. In addition, new loans were granted in the amount of €2 billion (16% of the total) for new operations aimed at supporting the economy (SME financing and reconstruction in Abruzzo), in addition to the contribution of existing funds. Therefore, as at 31 December 2009, loans to customers and banks totalled €85,178 million, up on the level of 2008. The greatest contribution continued to come from the Public Entities business unit, although there was also an increase in the relative weight of lending for the Enterprises and the Facilitated Credit and Economic Support units.
Stock of loans to customers and banks(millions of euros)
31/12/2009 31/12/2008 % change
Public Entities 80,788 79,334 1.8%
Facilitated Credit and Economic Support 1,055 404 161.2%
Enterprises 3,336 2,306 44.7%
Other loans - 194 N/S
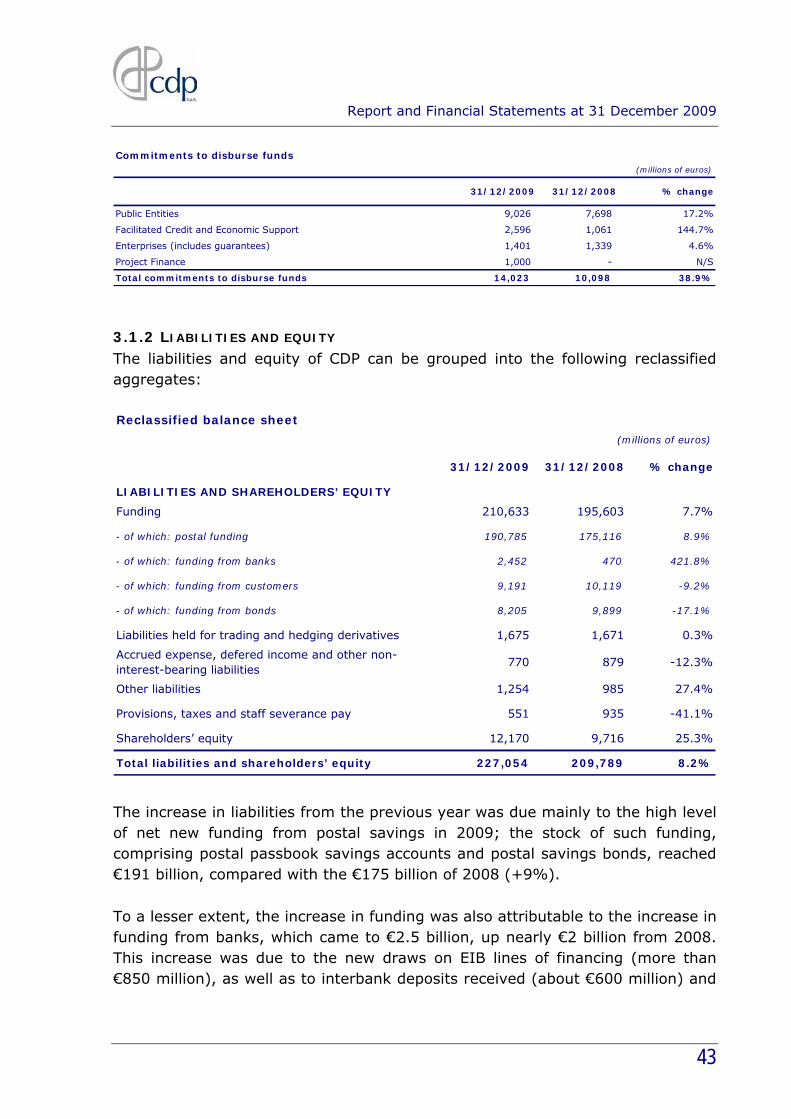
Total loans to customers and banks 85,178 82,237 3.6% The contribution of the new activities to support the economy is even more evident when considering commitments to be disbursed, with the balance reaching a total of €14,023 million at 31 December 2009, up 39% over 2008 due in part to the contribution of the commitments already undertaken within the Project Finance unit.
Report and Financial Statements at 31 December 2009
43
Commitments to disburse funds(millions of euros)
31/12/2009 31/12/2008 % change
Public Entities 9,026 7,698 17.2%
Facilitated Credit and Economic Support 2,596 1,061 144.7%
Enterprises (includes guarantees) 1,401 1,339 4.6%
Project Finance 1,000 - N/S
Total commitments to disburse funds 14,023 10,098 38.9%
3.1.2 LIABILITIES AND EQUITY The liabilities and equity of CDP can be grouped into the following reclassified aggregates: Reclassified balance sheet
(millions of euros)
31/12/2009 31/12/2008 % change
LIABILITIES AND SHAREHOLDERS’ EQUITY
Funding 210,633 195,603 7.7%
- of which: postal funding 190,785 175,116 8.9%
- of which: funding from banks 2,452 470 421.8%
- of which: funding from customers 9,191 10,119 -9.2%
- of which: funding from bonds 8,205 9,899 -17.1%
Liabilities held for trading and hedging derivatives 1,675 1,671 0.3%
Accrued expense, defered income and other non-interest-bearing liabilities
770 879 -12.3%
Other liabilities 1,254 985 27.4%
Provisions, taxes and staff severance pay 551 935 -41.1%
Shareholders’ equity 12,170 9,716 25.3%
Total liabilities and shareholders’ equity 227,054 209,789 8.2%
The increase in liabilities from the previous year was due mainly to the high level of net new funding from postal savings in 2009; the stock of such funding, comprising postal passbook savings accounts and postal savings bonds, reached €191 billion, compared with the €175 billion of 2008 (+9%). To a lesser extent, the increase in funding was also attributable to the increase in funding from banks, which came to €2.5 billion, up nearly €2 billion from 2008. This increase was due to the new draws on EIB lines of financing (more than €850 million), as well as to interbank deposits received (about €600 million) and

Report and Financial Statements at 31 December 2009
44
Credit Support Annex deposits received as part of collateral agreements (more than €500 million). Total postal savings and funding from banks more than offset the reduction in funding from customers and net funding from bonds. Funding from customers, related to the portion of specific-purpose loans in repayment as at 31 December 2009 and not yet disbursed, declined by about €1 billion due to the effect of the flow of disbursements that was not offset by a corresponding flow of new loans to be disbursed. The decline in net funding from bonds (in the amount of €1.7 billion) was due to the initial redemptions of covered bonds issued (in the amount of €2 billion), which was only partially offset by net funding through EMTN issues (+€300 million from 2008). Nonetheless, the flow of funding from the EMTN programme in 2009 continued in line with the related Ordinary Account lending. Liabilities held for trading and hedging derivatives were essentially stable compared with 2008. This aggregate includes both the negative fair value of derivative instruments used to hedge financial risks and the measurement of the options component to be unbundled from the indexed bonds and the Premia bonds. Accrued expenses, deferred income and other non-interest-bearing liabilities posted a decline compared with 2008, ascribable mainly to the reduction in certain liabilities to customers to be settled, the amount of which was only partially offset by an increase in the fair value of the funding being hedged. The change in other liabilities came to about €300 million, due mainly to the increase in CDP’s liability to Poste Italiane S.p.A. in respect of remuneration for placement services and accounting and administration services for postal savings for 2009. Provisions, taxes and staff severance pay totalled €551 million, attributable mainly to provisions for tax, which include payables related to current and deferred taxes for the year. The significant decline from 2008 is mostly due to the recognition in 2009 of the effects of the discharge of the tax liability on tax-deferred reserves resulting from off-ledger deductions made in 2004-2007 related to writedowns of loans to customers made for tax purposes only. This discharge of the liability, which is to be completed in 2010 with payment of a one-off tax, resulted in the elimination of the deferred taxes recognised in relation to such deductions. Nonetheless, in 2009 there was a lower tax effect

Report and Financial Statements at 31 December 2009
45
than in 2008, when there were certain negative income components in respect of writedowns of equity investments that were not deductible for tax purposes. Finally, shareholders’ equity at the end of 2009 came to more than €12 billion. The increase over 2008 (+25%) was due both to the growth in reserves related to retained earnings from the previous year and to the increase in the market value of the shares in Eni S.p.A. and Enel S.p.A.
3.1.3 BALANCE SHEET RATIOS Main indicators (reclassified data)
2009 2008
Loans to customers and banks/Total assets 37.5% 39.2%
Loans to customers and banks/Postal funding 44.6% 47.0%
Equity investments and shares/Shareholders’ equity 1.5x 1.4x
Gross bad debts and substandard loans/Gross loans to customers and banks 0.183% 0.184%
Net bad debts and substandard loans/Net loans to customers and banks 0.041% 0.038%
Net writedowns/Net loans to customers and banks 0.001% 0.029% In 2009, funding from postal savings again outpaced the increase in new loans to customers and banks. This resulted in an increase in CDP’s liquidity and a consequent increase in the ratio of liquidity to total assets, as well as growth in the ratio of the stock of postal savings funding to total loans to customers and banks. The ratio of equity investments and securities to the company’s total equity increased slightly due to new investments CDP made during the year, as well as to the increase in the market value in the investments in Eni S.p.A. and Enel S.p.A. Finally, writedowns related to the deterioration in the credit quality of counterparties were virtually zero and concerned cases that were essentially unrelated to CDP’s core lending activities.
3.2 RECLASSIFIED INCOME STATEMENT
3.2.1 FINANCIAL PERFORMANCE The following analysis of CDP’s performance is based on an income statement that have been reclassified on the basis of operational criteria, and specifically:

Report and Financial Statements at 31 December 2009
46
(millions of euros)
31/12/2009 31/12/2008 % change
Net interest income 1,994 2,360 -15.5%
Dividends 971 1,051 -7.6%
Net commissions (909) (729) 24.7%
Other net revenues 106 (149) -171.2%
Gross income 2,162 2,532 -14.6%
Net writedowns (1) (24) -94.9%
Overheads (80) (74) 8.0%
Operating income 2,091 2,444 -14.4%
Net income 1,725 1,389 24.1%
Reclassified income data
The results achieved in 2009 were, on the whole, positive and better than expected, considering the difficult macroeconomic environment and the negative impact, for both CDP and the entire banking system, of the decline in margins resulting from the low levels to which interest rates fell. Net interest income, in particular, came to €1,994 million, a decline of 16% from 2008 due to the reduction in the margin between lending and funding. In line with the trend in market interest rates, the decline in the return on assets was greater than and out of step with the decline in the cost of funding, given the all-time lows reached by the yields on postal savings. Gross income also declined (-15%) to €2,162 million. In addition to the change in net interest income, this reduction can be attributed to the decline in dividends (-8% due to a decrease in the earnings of the various equity investments and a general decline in payouts) and to an increase in commissions on postal savings (+25% in net commission expense). However, this was mitigated by the positive performance of hedging and trading activities (included among other net revenues), which was largely due to the non-recurring effect of the fair value measurement of certain derivative instruments, which were no longer treated under hedge accounting rules in view of their closure, which took place between the end of 2009 and the start of 2010. Overhead costs comprise staff costs and other administrative expenses, as well as writedowns of non-current assets.
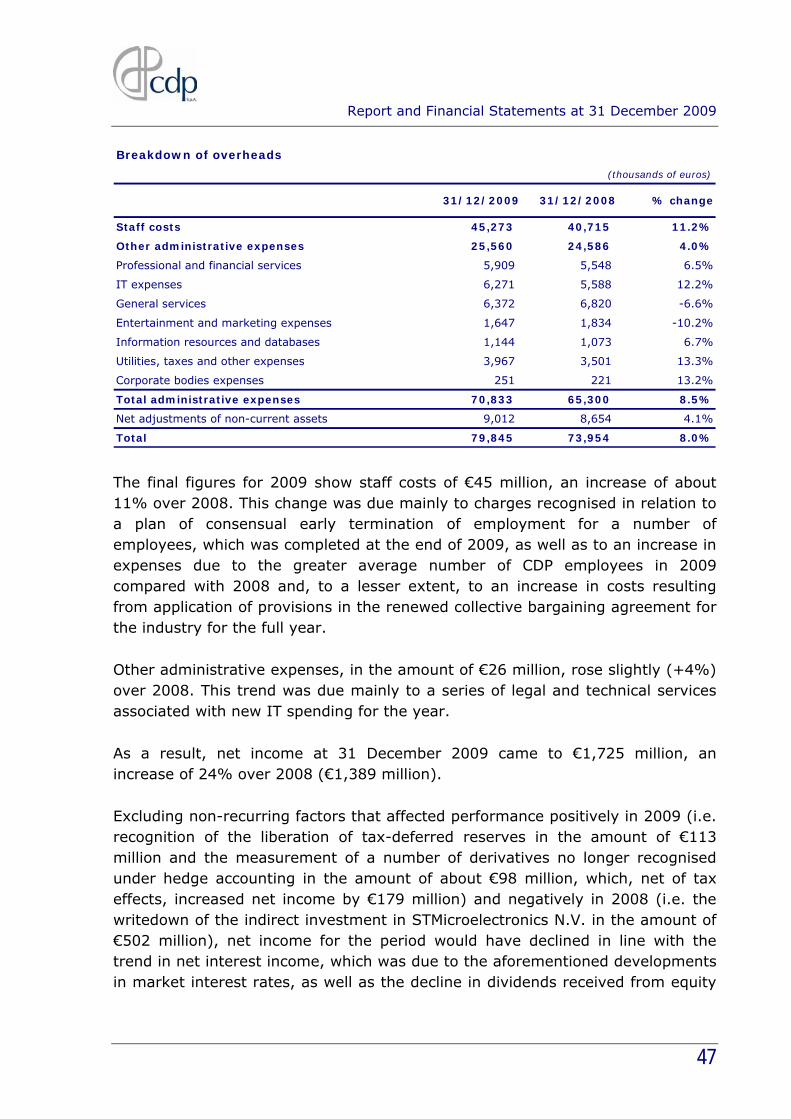
Report and Financial Statements at 31 December 2009
47
(thousands of euros)
31/12/2009 31/12/2008 % change
Staff costs 45,273 40,715 11.2%
Other administrative expenses 25,560 24,586 4.0%
Professional and financial services 5,909 5,548 6.5%
IT expenses 6,271 5,588 12.2%
General services 6,372 6,820 -6.6%
Entertainment and marketing expenses 1,647 1,834 -10.2%
Information resources and databases 1,144 1,073 6.7%
Utilities, taxes and other expenses 3,967 3,501 13.3%
Corporate bodies expenses 251 221 13.2%
Total administrative expenses 70,833 65,300 8.5%
Net adjustments of non-current assets 9,012 8,654 4.1%
Total 79,845 73,954 8.0%
Breakdown of overheads
The final figures for 2009 show staff costs of €45 million, an increase of about 11% over 2008. This change was due mainly to charges recognised in relation to a plan of consensual early termination of employment for a number of employees, which was completed at the end of 2009, as well as to an increase in expenses due to the greater average number of CDP employees in 2009 compared with 2008 and, to a lesser extent, to an increase in costs resulting from application of provisions in the renewed collective bargaining agreement for the industry for the full year. Other administrative expenses, in the amount of €26 million, rose slightly (+4%) over 2008. This trend was due mainly to a series of legal and technical services associated with new IT spending for the year. As a result, net income at 31 December 2009 came to €1,725 million, an increase of 24% over 2008 (€1,389 million). Excluding non-recurring factors that affected performance positively in 2009 (i.e. recognition of the liberation of tax-deferred reserves in the amount of €113 million and the measurement of a number of derivatives no longer recognised under hedge accounting in the amount of about €98 million, which, net of tax effects, increased net income by €179 million) and negatively in 2008 (i.e. the writedown of the indirect investment in STMicroelectronics N.V. in the amount of €502 million), net income for the period would have declined in line with the trend in net interest income, which was due to the aforementioned developments in market interest rates, as well as the decline in dividends received from equity

Report and Financial Statements at 31 December 2009
48
investments and the increase in commissions paid to Poste Italiane S.p.A. for the placement and management of postal savings products. CDP’s performance can also be analysed based on the contribution of each business unit to the main components of gross income, and specifically:
(millions of euros)
Public Entities
Facilitated Credit and Economic Support
EnterprisesCorporate
CentreTotal CDP
Net interest income 393 3 19 1,579 1,994Gross income 396 4 23 1,739 2,162Operating income 386 1 22 1,682 2,091
Reclassified income statement by business unit
The greatest contribution comes from the Public Entities unit, which contributed about 20% of net interest income and more than 18% of total operating income. The contribution of the Facilitated Credit and Economic Support and Enterprises units is still limited, although it did expand compared with previous years. In 2009, the contribution of the Project Finance unit to financial performance is still insignificant, given that it was launched in the latter part of the year. Finally, the Corporate Centre unites the components of earnings attributable to equity investments, treasury operations and funding activities, as well as costs related to the service and support units and other revenues and expenses not otherwise allocable.

Report and Financial Statements at 31 December 2009
49
3.2.2 PERFORMANCE INDICATORS
Main indicators (reclassified data)
2009 2008
Net interest income/Gross income 92.2% 93.2%
Net commissions/Gross income -42.1% -28.8%
Other revenues/Gross income 49.8% 35.6%
Commission expense/Postal funding 0.5% 0.4%
Spread interest-bearing assets - liabilities 1.1% 1.4%
Cost/income ratio 3.7% 2.9%
Cost/income ratio (including commission expense on postal funding) 32.4% 25.0%
Net income/Opening shareholders’ equity (ROE) 17.7% 9.7%
Net income/Average shareholders’ equity (ROAE) 15.8% 11.5%
Analysing these indicators, we see that the contribution of net interest income to CDP revenues remained essentially stable from 2008. While dividends for 2009 were almost entirely offset by the increase in commissions on postal savings management, a significant non-recurring contribution came from the net result on hedging and trading activities. There was also a narrowing of the spread between lending and funding from 2008 (going from 1.4% to 1.1%) due to the trend in market rates, with an imbalanced impact on assets and liabilities (including funding from postal savings, on which interest is at an all-time low). We have also seen a slight deterioration in the indicators of operating efficiency, such as in the cost-to-income ratio, due to the decline in revenues and the increase in operating costs. This effect is amplified if we include the postal savings management commissions, which also increased relative to revenues. Finally, return on equity (ROE) for 2009 came to 17.7%, a marked increase over the same figure for 2008 of 9.7%. This indicator reflects both the significant increase in net income in 2009 compared with 2008 and the reduction in equity recorded in 2008 due to developments in stock prices that year. The performance gain was smaller if measured in terms of return on average equity (ROAE), which went from 11.5% to 15.8%.

Report and Financial Statements at 31 December 2009
50
3.3 RECONCILIATION OF THE RECLASSIFIED FINANCIAL STATEMENTS
The following is a reconciliation between the financial statements required under Bank of Italy circular 262/2005, as amended, and the statements that have been reclassified on the basis of operational criteria. These reclassifications mainly concerned:
• the allocation of interest-bearing amounts into separate aggregates from the non-interest-bearing items;
• the revision of the portfolios for IAS/IFRS purposes, reclassifying them into uniform aggregates by both product and area of business.
Balance sheet - Assets
ASSETS - Reclassified schedules
(millions of euros) 31/12/2009Cash and cash
equivalents
Loans to customers and
banksDebt securities
Equity investments and shares
Assets held for trading and
hedging derivatives
Property, plant and equipment and intangible
assets
Accrued income, prepaid
expenses and other non-interest-
bearing assets
Other assets
ASSETS
10 Cash and cash equivalents 114,689 113,330 1,358
20 Financial assets held for trading 869 869
40 Financial assets available for sale 13,991 206 13,784 1
50 Financial assets held to maturity 205 200 6
60 Loans to banks 5,974 5,050 913 12
70 Loans to customers 85,624 84,265 285 1,073
80 Hedging derivatives 332 332
100 Equity investments 4,487 4,487
110 Property, plant and equipment 204 204
120 Intangible assets 7 7
130 Tax assets 600 600
150 Other assets 73 73
Total assets 227,054 118,380 85,178 692 18,271 1,200 210 2,450 673

Report and Financial Statements at 31 December 2009
51
Balance sheet - Liabilities and shareholders’ equity
LIABILITIES AND SHAREHOLDERS' EQUITY - Reclassified schedules
(millions of euros) 31/12/2009 Funding
Liabilities held for trading and
hedging derivatives
Accrued expenses, deferred
income and other non-interest-bearing
liabilities
Other liabilities
Provisions, taxes and staff severance pay
Shareholders’ equity
10 Due to banks 2,674 2,475 200
20 Due to customers 100,460 100,288 172
30 Securities issued 108,269 107,871 398
40 Financial liabilities held for trading 783 783
60 Hedging derivatives 826 826
70Adjustment of financial liabilities hedged generically
66 66
80 Tax liabilities 541 541
100 Other liabilities 1,254 1,254
110 Staff severance pay 1 1
120 Provisions 9 9
130 Valuation reserves 2,136 2,136
160 Reserves 4,809 4,809
180 Share capital 3,500 3,500
200 Net income for the period 1,725 1,725
227,054 210,633 1,675 770 1,254 551 12,170
Liabilities and shareholder’s equity
Total liabilities and shareholders’ equity
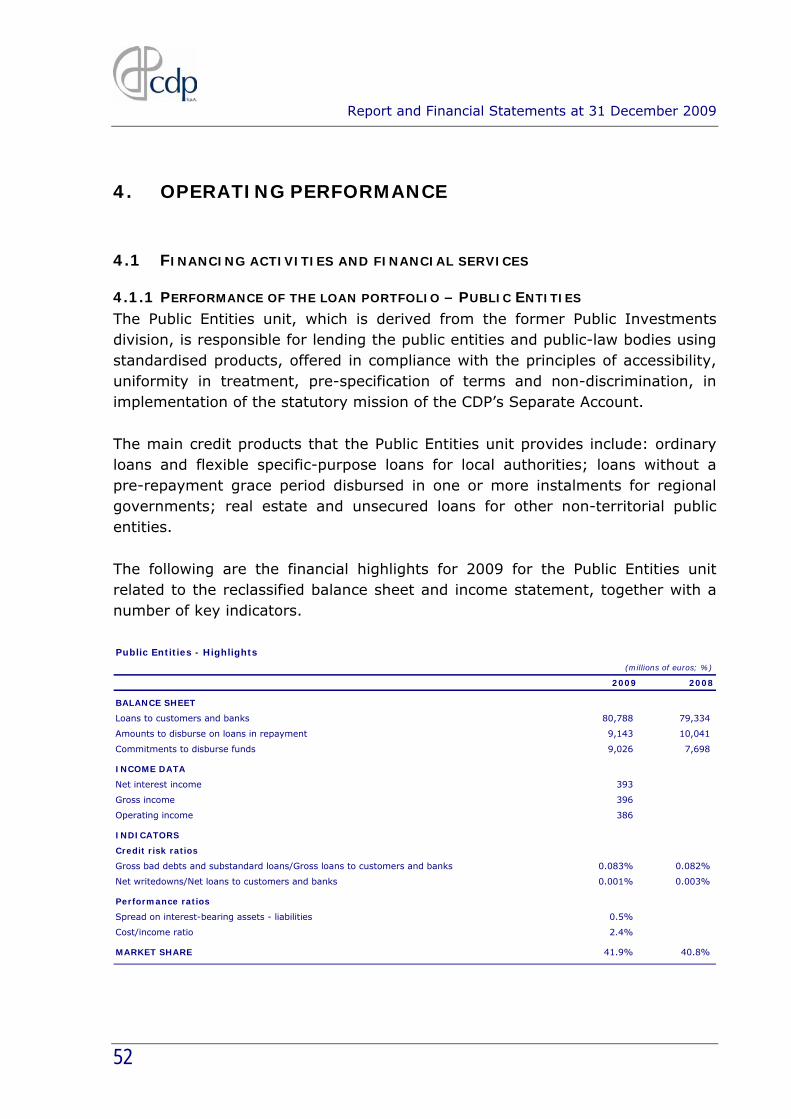
Report and Financial Statements at 31 December 2009
52
4. OPERATING PERFORMANCE
4.1 FINANCING ACTIVITIES AND FINANCIAL SERVICES
4.1.1 PERFORMANCE OF THE LOAN PORTFOLIO – PUBLIC ENTITIES The Public Entities unit, which is derived from the former Public Investments division, is responsible for lending the public entities and public-law bodies using standardised products, offered in compliance with the principles of accessibility, uniformity in treatment, pre-specification of terms and non-discrimination, in implementation of the statutory mission of the CDP’s Separate Account. The main credit products that the Public Entities unit provides include: ordinary loans and flexible specific-purpose loans for local authorities; loans without a pre-repayment grace period disbursed in one or more instalments for regional governments; real estate and unsecured loans for other non-territorial public entities. The following are the financial highlights for 2009 for the Public Entities unit related to the reclassified balance sheet and income statement, together with a number of key indicators. Public Entities - Highlights
(millions of euros; %)
2009 2008
BALANCE SHEET
Loans to customers and banks 80,788 79,334
Amounts to disburse on loans in repayment 9,143 10,041
Commitments to disburse funds 9,026 7,698
INCOME DATA
Net interest income 393
Gross income 396
Operating income 386
INDICATORS
Credit risk ratios
Gross bad debts and substandard loans/Gross loans to customers and banks 0.083% 0.082%
Net writedowns/Net loans to customers and banks 0.001% 0.003%
Performance ratios
Spread on interest-bearing assets - liabilities 0.5%
Cost/income ratio 2.4%
MARKET SHARE 41.9% 40.8%

Report and Financial Statements at 31 December 2009
53
At the end of 2009, loans to customers and banks totalled €80,788 million, including adjustments for IAS/IFRS purposes, for an increase of 1.8% over 2008 (€79,334 million). The pace of growth in the portfolio diminished compared with 2007-2008 due to a reduction in disbursements (of loans in the grace period or loans for immediate disbursement) in 2009 compared with the previous year, when there was a significant level of loans granted for immediate disbursement. Including disbursement commitments, excluding IAS/IFRS adjustments, the total stock came to €88,617 million, for a 3% increase over 2008 (€86,019 million). The change can be attributed to new lending, which contributed to increasing the total stock, more than offsetting payments received in 2009. Public Entities - Stock of loans to customers and banks by type of beneficiary
(millions of euros)
31/12/2009 31/12/2008 % change
Local authorities 44,219 43,143 2.5%
Regions and autonomous provinces 22,129 21,871 1.2%
Other public entities and public-law bodies 13,243 13,306 -0.5%
Total amounts disbursed or in repayment 79,591 78,321 1.6%
IAS/IFRS adjustments 1,197 1,013 18.1%
Total loans to customers and banks 80,788 79,334 1.8%
Total amounts disbursed or in repayment 79,591 78,321 1.6%
Commitments to disburse funds 9,026 7,698 17.2%
Total loans (including commitments) 88,617 86,019 3.0% At the end of 2009, in line with the objectives of the business plan, CDP’s market share, as a proportion of the total debt of local and regional authorities and loans with repayment charged to central government, increased to 41.9% from 40.8% at the end of 2008. Loan amounts to be disbursed, including commitments, increased by 2.4% (from €17,739 million at 31 December 2008 to €18,169 million at 31 December 2009). Public Entities - Stock of amounts to disburse
(millions of euros)
31/12/2009 31/12/2008 % change
Amounts to disburse on loans in repayment 9,143 10,041 -8.9%
Commitments to disburse funds 9,026 7,698 17.2%
Total amounts to disburse (including commitments) 18,169 17,739 2.4% This performance was the net effect of the increase in disbursement commitments (+17.2%) and the decrease in amounts to be disbursed on loans in repayment (-8.9%), which was the result of new loans granted exceeding total disbursements.

Report and Financial Statements at 31 December 2009
54
As the table below shows, nearly all loans to customers and banks continue to represented by specific-purpose loans. Public Entities - Stock of Loans to customers and banks by product
(millions of euros)
Product 31/12/2009 31/12/2008 % change
Specific-purpose loans 78,671 77,413 1.6%
Advances 15 27 -42.0%
Securities 904 881 2.6%
Total 79,591 78,321 1.6% In 2009, new lending granted declined with respect to the previous year, going from €8,046 million to €6,125 million, a reduction of around 24%. The decrease was essentially due to the smaller contribution of loans granted to regions and autonomous provinces in 2009 compared with 2008, when a number of large transactions were recognised at the end of the year. However, the local authorities segment performed well, with new lending going from €3,354 million in 2008 to €3,539 million in 2009, excluding the €478 million advance disbursed during the previous year to the City of Rome in accordance with Article 78.8 of Decree Law 112/08, which was also repaid during that year (+6%). The breakdown by type of borrower and by geographical area shows a prevalence of financing for local authorities (58%, for a total of €3,539 million, 30% of which for authorities in northern Italy). A total of €1,619 million in financing was granted to other beneficiaries (26% of the total and, again, primarily in northern Italy), with 16% of the total going to regions and autonomous provinces for a total of €966 million.
Public Entities - Flow of new loans by type of beneficiary
(millions of euros)
North Centre South Total 2009
Local authorities 1,854 532 1,153 3,539
Regions and autonomous provinces 800 16 150 966
Other public entities and public-law bodies 1,536 62 21 1,619
Total 4,190 610 1,324 6,125
A breakdown of financing by type of project shows that loans were mainly granted for projects with sundry purposes (largely comprising loans for large-scale works or differentiated investment programmes, accounting for 36% of the total), for road and transport projects (22% of the total compared with 16% in 2008), school and university building (11% of the total compared with 8% in

Report and Financial Statements at 31 December 2009
55
2008), and for social building projects (10% of the total compared with 8% in 2008). Public Entities - Flow of new loans by purpose
(millions of euros)
Total 2009
Public and social building 617
School and university building 695
Sports, recreational and lodging facilities 221
Healthcare building 127
Natural disaster restoration works 16
Road and transport 1,347
Water projects 38
Sanitation projects 92
Energy projects 105
Other public works 600
Loans for sundry projects * 2,210
Total investments 6,067
Recognised off-balance-sheet liabilities and other liabilities 58
Total 6,125
* Also includes loans for major public works not included in the other categories A breakdown of new loans granted by product shows that most were ordinary specific-purpose loans (both fixed and floating rate), which account for about 47% of the total. These are followed by loans without a pre-repayment grace period (39%), of which 21% related to operations charged to the state, which are granted based on public tenders awarded to CDP. A smaller contribution came from flexible loans (9%) and from unsecured and real estate loans (5%), with the latter going to non-territorial public entities.
Public Entities - Flow of new loans by product
(millions of euros)
Total 2009
Ordinary loans 2,897
Flexible loans 534
Unsecured and real estate loans 326
Loans without pre-repayment grace period 2,368
of which: loan contracts awarded in tenders 1,259
Total 6,125
In 2009, loan disbursements totalled €5,645 million, down 14% from 2008. However, excluding the extraordinary item related to the aforementioned advance to the City of Rome in the second quarter of 2008, the decline narrows to just 7%. In any event, the decrease is due to the reduced contribution in 2009 of new transactions for immediate disbursement.

Report and Financial Statements at 31 December 2009
56
Public Entities - Flow of disbursements by type of beneficiary
(millions of euros)
North Centre South Total 2009
Local authorities 1,633 762 1,238 3,634
Regions and autonomous provinces 970 66 200 1,237
Other public entities and public-law bodies 557 153 64 775
Total 3,161 981 1,503 5,645 Regarding other financing within the Public Entities unit, the balance of advances from the Revolving Fund for Project Development (equal to the amount disbursed from this fund) came to €15 million at 31 December 2009, compared with €27 million at the end of 2008. In 2009, the amount of financing granted from this fund came to about €5 million, with disbursements of about €4 million. The loan portfolio of the Public Entities unit also includes the subscription of securities issued by public entities and other public-law bodies as an alternative to specific-purpose loans. At the end of 2009, the stock of such securities totalled €904 million, a 2.6% increase over 2008. In 2009, CDP subscribed for a total of €43 million in newly issued securities, which more than offset the redemptions recorded for securities already held.
In terms of the Public Entities unit’s contribution to CDP’s performance in 2009, net interest income for the unit came to €393 million, in addition to €3 million in commission income for the period. Gross income thus totalled €396 million, accounting for 18% of the total for CDP as a whole. Taking account of overheads specific to the Public Entities unit, its overall contribution to income comes to €386 million. Translating this performance in terms of the spread between interest-bearing assets and interest-bearing liabilities, the margin came to 50 basis points, compared with 110 basis points for CDP. The cost-to-income ratio for the unit thereby comes to 2.4%, compared with 3.7% for CDP as a whole. Finally, the credit quality of the Public Entities unit’s loan portfolio in 2009 showed a low level of problem positions, essentially unchanged compared with 2008.
Customer-related initiatives in 2009 included efforts to support the public entities affected by the earthquake which struck the Abruzzo region in April. Specifically, CDP authorised:
1) the immediate deferment for one year of payment deadlines for loan instalments and grace-period interest due in 2009 on existing loans,

Report and Financial Statements at 31 December 2009
57
without the application of additional interest (the instalments due on 30 June and 31 December 2009 were thereby deferred by one year and are to be paid together with the payments due on 30 June and 31 December 2010);
2) the possibility of renegotiating said loans, including a significant extension of their term and the consequent reduction in the size of instalments;
3) the possibility of granting new financing based on subsidised terms and conditions compared with those normally applied for territorial authorities, with such financing to be used for the reconstruction in the affected areas, much like similar initiatives carried out in the past in response to other natural disasters.
RATE POLICY In 2009, the policy for setting interest rates for Separate Account financing continued to follow the line set down in previous years, which were introduced following the transformation of CDP into a joint-stock company and the issuance of the decree of the Ministry for the Economy and Finance of 6 October 2004, based on which the terms applied to the financial products under the Separate Account were adjusted to market conditions rapidly and flexibly, within the scope of the guidelines established for such purpose. In the latter part of the previous year, due to the financial crisis, there was a drastic increase in the spreads of medium and long-term government bonds against Euribor, which brought the rates and spreads offered on CDP’s specific-purpose loans up to the maximum cost allowed (set out in the notice of the Ministry for the Economy and Finance published in “Gazzetta Ufficiale” no. 168 of 19 July 2008, which had already raised the previous ceilings established in the Notice published in “Gazzetta Ufficiale” no. 262 of 8 November 1999). In response, on 9 April 2009, the MEF took action with a new notice regarding rate ceilings, introducing a new criterion for the calculation of the maximum total annual cost of loans. Based on this criterion, the cost for fixed-rate transactions cannot exceed that obtained, for the various maturities, from the product of the MTSIg index (based on the term of the loan) and a specific coefficient. For floating-rate transactions, the maximum cost is calculated based on 6-month Euribor plus a spread that varies with the term of the loan. The use of these new parameters translated into higher maximum interest rates and spreads than were previously in effect, but were in line with the changes in the market rates for the same period.

Report and Financial Statements at 31 December 2009
58
In July 2009, the MEF issued a further notice that made a number of changes both to the coefficients for fixed-rate loans and the spreads for floating-rate loans. Finally, on 12 November 2009, one last notice again changed the benchmark parameters, as well as the segmentation of loan maturities. Specifically, for fixed-rate loans, the maximum total annual cost is calculated on the basis of the swap rate plus a specific spread that varies in relation to the term of the loan. For floating-rate loans, 6-month Euribor has been retained, but the spreads have been changed. These changes brought about an average reduction in maximum interest rates and spreads compared with those previously in effect. Based on these notices, the interest rates and spreads for all products offered by CDP were updated, generally on a weekly basis and, in any event, maintaining the method adopted in 2008. This made it possible to ensure consistency among the financial conditions offered for each type of product, while complying with the above rules. During the year, CDP also conducted ad hoc pricings that were financially equivalent to those for standard loans for the purpose of participating in calls for tender for the assignment of financing with costs borne by the state, taking due account of the various financial structures and the type of borrower.
4.1.2 PERFORMANCE OF THE LOAN PORTFOLIO – FACILITATED CREDIT AND ECONOMIC SUPPORT The goal of CDP is to actively support Italy’s development policies through the management of subsidised lending, based on specific legislation, and economic support mechanisms, which CDP has implemented as a result of recent changes to its articles of association. Thus, the Facilitated Credit and Economic Support unit is responsible for managing the subsidised instruments using primarily CDP resources (the Revolving Fund to support enterprises and research investment), while also taking advantage of a lesser amount of public funding (Territorial Agreements and Area Contracts, Low Environmental Impact Vehicles Fund). These are flanked by “mass” programmes in support of the economy, with the launch of the business lines dedicated to SME financing (with total resources of €8 billion) and financing for the reconstruction of the areas of the Abruzzo region affected by the earthquake (resources of €2 billion). In this context, CDP acts as a vehicle for aid and incentives from the public sector to the private sector, while also providing broader support to the economy through the banking industry. This unit originated from the former Development

Report and Financial Statements at 31 December 2009
59
Policies Management and Support division and has been enhanced with new products and new areas of business. The following are the financial highlights for 2009 for the Facilitated Credit and Economic Support unit, summarised in the balance sheet and income statement reclassified on an operational basis, together with a number of indicators. Faciliated Credit and Economic Support - Highlights
(millions of euros; %)
2009 2008
BALANCE SHEET
Loans to customers and banks 1,055 404
Amounts to disburse 47 78
Commitments to disburse funds 2,596 1,061
INCOME DATA
Net interest income 3
Gross income 4
Operating income 1
INDICATORS
Credit risk ratios
Gross bad debts and substandard loans/Gross loans to customers and banks 0.269% 0.016%
Net writedowns/Net loans to customers and banks 0.010% 0.000%
Performance ratios
Spread on interest-bearing assets - liabilities 0.3%
Cost/income ratio 62.7% In 2009, in order to establish the general principles for disbursing loans to SMEs and to support the Abruzzo region, specific agreements were reached with the Italian Banking Association (ABI). In May 2009, CDP signed an agreement with ABI that governs the operation of the first €3 billion of financing for SMEs. Under the general principles of the agreement, CDP disburses financing to banks with funds originating from postal savings, thereby enabling the banks to provide businesses with medium-term liquidity. In addition, under a framework agreement reached in June between ABI and SACE S.p.A., the latter can issue guarantees of up to 50% to banks granting loans to businesses. Finally, in February 2010, a new agreement was signed by CDP and the ABI that establishes the criteria for allocating and using the second tranche of €5 billion, in addition to the remainder, as of 28 February 2010, of the initial €3 billion tranche. Under this new agreement, beginning on 1 March 2010, banks can sign new financing agreements with CDP and avoid interruptions in the disbursement of financing to businesses. The latter accord provides for: 1) the division of the
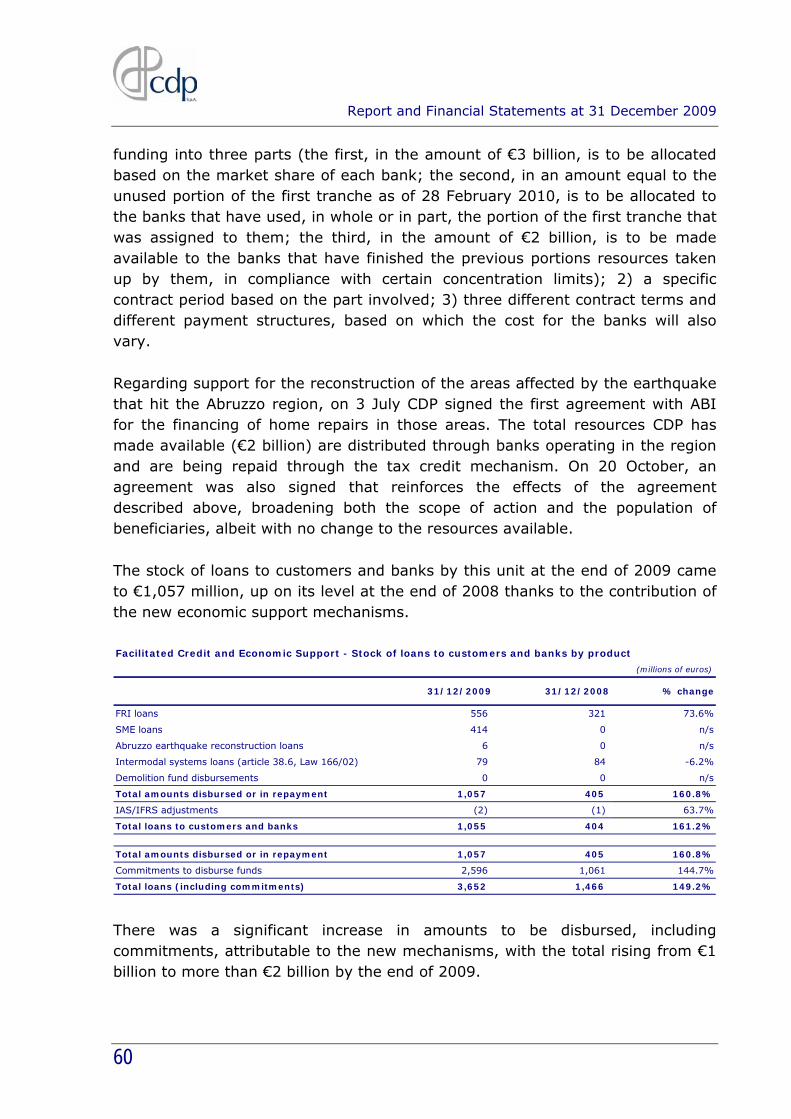
Report and Financial Statements at 31 December 2009
60
funding into three parts (the first, in the amount of €3 billion, is to be allocated based on the market share of each bank; the second, in an amount equal to the unused portion of the first tranche as of 28 February 2010, is to be allocated to the banks that have used, in whole or in part, the portion of the first tranche that was assigned to them; the third, in the amount of €2 billion, is to be made available to the banks that have finished the previous portions resources taken up by them, in compliance with certain concentration limits); 2) a specific contract period based on the part involved; 3) three different contract terms and different payment structures, based on which the cost for the banks will also vary. Regarding support for the reconstruction of the areas affected by the earthquake that hit the Abruzzo region, on 3 July CDP signed the first agreement with ABI for the financing of home repairs in those areas. The total resources CDP has made available (€2 billion) are distributed through banks operating in the region and are being repaid through the tax credit mechanism. On 20 October, an agreement was also signed that reinforces the effects of the agreement described above, broadening both the scope of action and the population of beneficiaries, albeit with no change to the resources available. The stock of loans to customers and banks by this unit at the end of 2009 came to €1,057 million, up on its level at the end of 2008 thanks to the contribution of the new economic support mechanisms. Facilitated Credit and Economic Support - Stock of loans to customers and banks by product
(millions of euros)
31/12/2009 31/12/2008 % change
FRI loans 556 321 73.6%
SME loans 414 0 n/s
Abruzzo earthquake reconstruction loans 6 0 n/s
Intermodal systems loans (article 38.6, Law 166/02) 79 84 -6.2%
Demolition fund disbursements 0 0 n/s
Total amounts disbursed or in repayment 1,057 405 160.8%
IAS/IFRS adjustments (2) (1) 63.7%
Total loans to customers and banks 1,055 404 161.2%
Total amounts disbursed or in repayment 1,057 405 160.8%
Commitments to disburse funds 2,596 1,061 144.7%
Total loans (including commitments) 3,652 1,466 149.2% There was a significant increase in amounts to be disbursed, including commitments, attributable to the new mechanisms, with the total rising from €1 billion to more than €2 billion by the end of 2009.
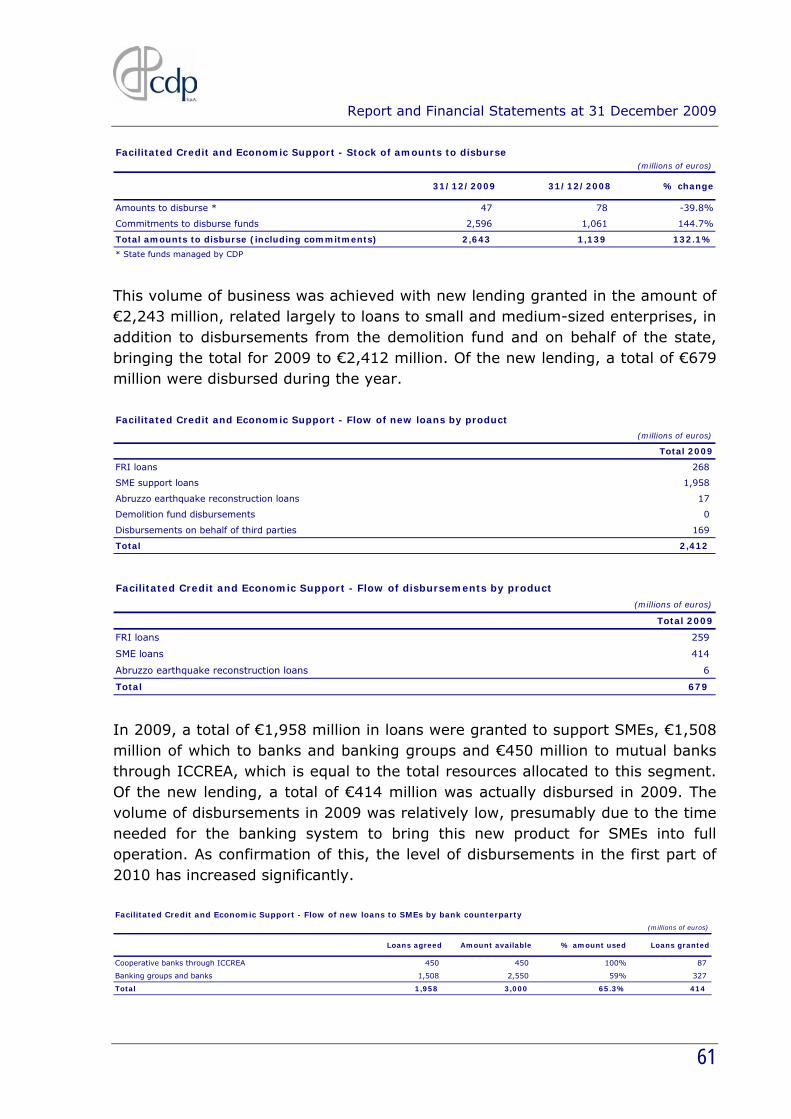
Report and Financial Statements at 31 December 2009
61
Facilitated Credit and Economic Support - Stock of amounts to disburse(millions of euros)
31/12/2009 31/12/2008 % change
Amounts to disburse * 47 78 -39.8%
Commitments to disburse funds 2,596 1,061 144.7%
Total amounts to disburse (including commitments) 2,643 1,139 132.1%
* State funds managed by CDP This volume of business was achieved with new lending granted in the amount of €2,243 million, related largely to loans to small and medium-sized enterprises, in addition to disbursements from the demolition fund and on behalf of the state, bringing the total for 2009 to €2,412 million. Of the new lending, a total of €679 million were disbursed during the year. Facilitated Credit and Economic Support - Flow of new loans by product
(millions of euros)
Total 2009
FRI loans 268
SME support loans 1,958
Abruzzo earthquake reconstruction loans 17
Demolition fund disbursements 0
Disbursements on behalf of third parties 169
Total 2,412 Facilitated Credit and Economic Support - Flow of disbursements by product
(millions of euros)
Total 2009
FRI loans 259
SME loans 414
Abruzzo earthquake reconstruction loans 6
Total 679 In 2009, a total of €1,958 million in loans were granted to support SMEs, €1,508 million of which to banks and banking groups and €450 million to mutual banks through ICCREA, which is equal to the total resources allocated to this segment. Of the new lending, a total of €414 million was actually disbursed in 2009. The volume of disbursements in 2009 was relatively low, presumably due to the time needed for the banking system to bring this new product for SMEs into full operation. As confirmation of this, the level of disbursements in the first part of 2010 has increased significantly. Facilitated Credit and Economic Support - Flow of new loans to SMEs by bank counterparty
(millions of euros)
Loans agreed Amount available % amount used Loans granted
Cooperative banks through ICCREA 450 450 100% 87
Banking groups and banks 1,508 2,550 59% 327
Total 1,958 3,000 65.3% 414
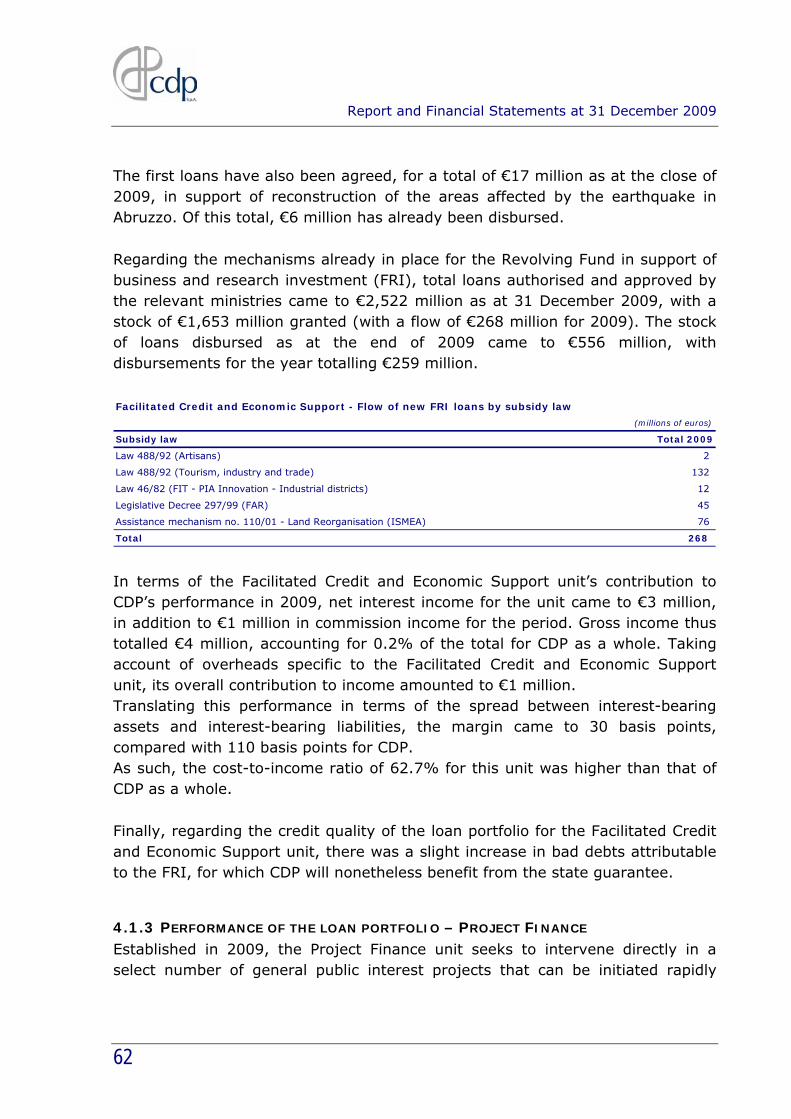
Report and Financial Statements at 31 December 2009
62
The first loans have also been agreed, for a total of €17 million as at the close of 2009, in support of reconstruction of the areas affected by the earthquake in Abruzzo. Of this total, €6 million has already been disbursed. Regarding the mechanisms already in place for the Revolving Fund in support of business and research investment (FRI), total loans authorised and approved by the relevant ministries came to €2,522 million as at 31 December 2009, with a stock of €1,653 million granted (with a flow of €268 million for 2009). The stock of loans disbursed as at the end of 2009 came to €556 million, with disbursements for the year totalling €259 million.
Facilitated Credit and Economic Support - Flow of new FRI loans by subsidy law
(millions of euros)
Subsidy law Total 2009
Law 488/92 (Artisans) 2
Law 488/92 (Tourism, industry and trade) 132
Law 46/82 (FIT - PIA Innovation - Industrial districts) 12
Legislative Decree 297/99 (FAR) 45
Assistance mechanism no. 110/01 - Land Reorganisation (ISMEA) 76
Total 268 In terms of the Facilitated Credit and Economic Support unit’s contribution to CDP’s performance in 2009, net interest income for the unit came to €3 million, in addition to €1 million in commission income for the period. Gross income thus totalled €4 million, accounting for 0.2% of the total for CDP as a whole. Taking account of overheads specific to the Facilitated Credit and Economic Support unit, its overall contribution to income amounted to €1 million. Translating this performance in terms of the spread between interest-bearing assets and interest-bearing liabilities, the margin came to 30 basis points, compared with 110 basis points for CDP. As such, the cost-to-income ratio of 62.7% for this unit was higher than that of CDP as a whole. Finally, regarding the credit quality of the loan portfolio for the Facilitated Credit and Economic Support unit, there was a slight increase in bad debts attributable to the FRI, for which CDP will nonetheless benefit from the state guarantee.
4.1.3 PERFORMANCE OF THE LOAN PORTFOLIO – PROJECT FINANCE Established in 2009, the Project Finance unit seeks to intervene directly in a select number of general public interest projects that can be initiated rapidly

Report and Financial Statements at 31 December 2009
63
(financing of projects sponsored by public entities), acting with a long-term vision and verifying financial sustainability. In this context, in July CDP reached a framework agreement with the EIB in order to develop and consolidate partnerships in Italy in the area of financing government agencies, public companies, local authorities and business groups. Within the framework of these co-financing activities, there is also the possibility of joint action in selecting projects (with a particular emphasis on infrastructure projects), conducting loan origination, identifying loan types, and providing the final beneficiaries with the funds needed on the best terms possible. The unit began operations at the end of 2009, with the first loan granted going to Autostrade per l’Italia S.p.A. The total amount was €1 billion, half of which backed by a SACE guarantee. New loans were also authorised for a total of €650 million related to regasification terminal projects and for motorway concession holders. As regards authorised loans to be executed, in February 2010, a transaction was finalised with Satap S.p.A. in the amount of €450 million. Towards the close of 2009, a number of applications were also received for infrastructure projects, which are to be verified and, if eligible, submitted for loan origination processing. During the year, the rules of the Public Works Guarantee Fund (FGOP) were approved, enabling operations to begin. The fund was established with the 2008 Finance Act (Article 2.264 et seq.) and is further governed by the decree of the Ministry for the Economy and Finance of 16 September 2009. The objective of the fund is to issue guarantees in favour of both public and private-sector entities involved in building and operating public works in order to safeguard the financial equilibrium of the projects. This guarantee is given in respect of obligations undertaken by a given contracting authority in accordance with an agreement for the granting of the concession for the construction and operation of infrastructure works, including works on which construction is already under way. Specifically, the guarantee given by CDP will, for the moment, be limited solely to the obligation of the contracting authority to pay the concession holder, upon expiration of the concession agreement and in the absence of a new concession holder, an amount commensurate to the value of the project that has not been depreciated by the end of the concession period. The rules, which were approved by the CDP Board of Directors on 26 October 2009, set a number of operating thresholds for the fund and specify the
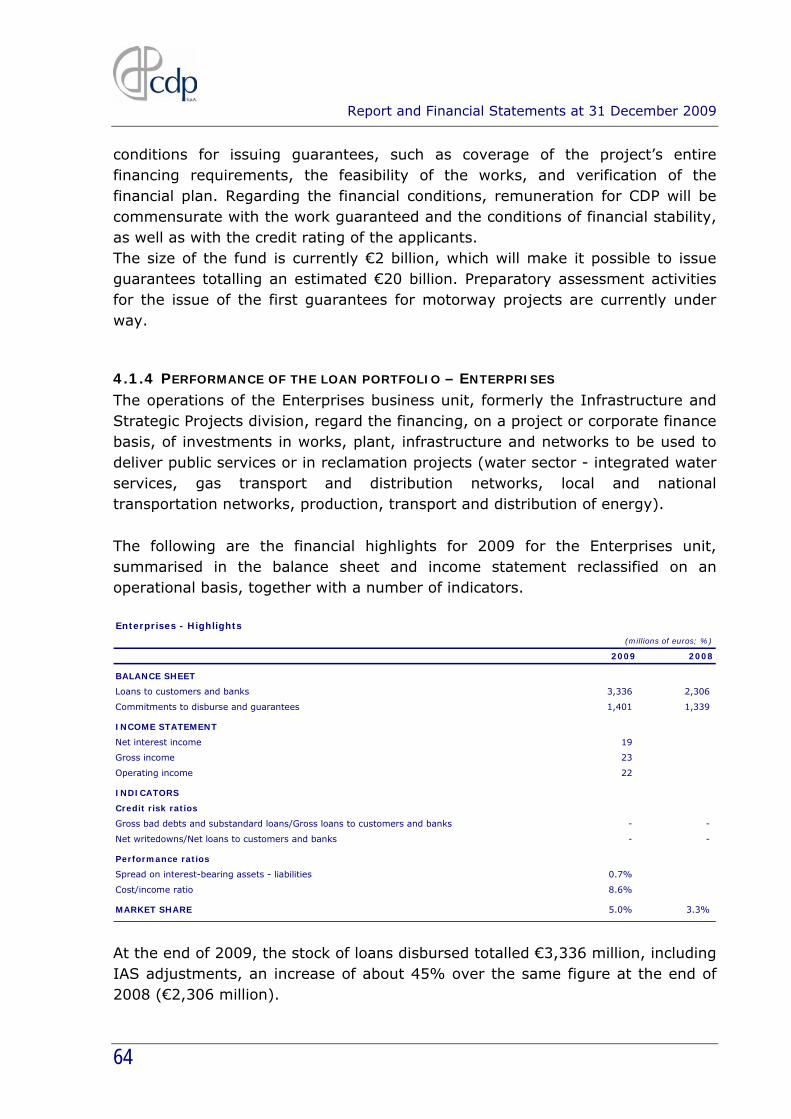
Report and Financial Statements at 31 December 2009
64
conditions for issuing guarantees, such as coverage of the project’s entire financing requirements, the feasibility of the works, and verification of the financial plan. Regarding the financial conditions, remuneration for CDP will be commensurate with the work guaranteed and the conditions of financial stability, as well as with the credit rating of the applicants. The size of the fund is currently €2 billion, which will make it possible to issue guarantees totalling an estimated €20 billion. Preparatory assessment activities for the issue of the first guarantees for motorway projects are currently under way.
4.1.4 PERFORMANCE OF THE LOAN PORTFOLIO – ENTERPRISES The operations of the Enterprises business unit, formerly the Infrastructure and Strategic Projects division, regard the financing, on a project or corporate finance basis, of investments in works, plant, infrastructure and networks to be used to deliver public services or in reclamation projects (water sector - integrated water services, gas transport and distribution networks, local and national transportation networks, production, transport and distribution of energy). The following are the financial highlights for 2009 for the Enterprises unit, summarised in the balance sheet and income statement reclassified on an operational basis, together with a number of indicators. Enterprises - Highlights
(millions of euros; %)
2009 2008
BALANCE SHEET
Loans to customers and banks 3,336 2,306
Commitments to disburse and guarantees 1,401 1,339
INCOME STATEMENT
Net interest income 19
Gross income 23
Operating income 22
INDICATORS
Credit risk ratios
Gross bad debts and substandard loans/Gross loans to customers and banks - -
Net writedowns/Net loans to customers and banks - -
Performance ratios
Spread on interest-bearing assets - liabilities 0.7%
Cost/income ratio 8.6%
MARKET SHARE 5.0% 3.3% At the end of 2009, the stock of loans disbursed totalled €3,336 million, including IAS adjustments, an increase of about 45% over the same figure at the end of 2008 (€2,306 million).

Report and Financial Statements at 31 December 2009
65
As at the same date, loans granted came to €4,691 million, for a 31% increase over 31 December 2008 (€3,594 million). This figure also includes disbursement commitments and guarantees. Enterprises - Stock of loans to customers and banks
(millions of euros)
31/12/2009 31/12/2008 % change
Project finance 193 118 63.9%
Corporate finance 3,047 2,087 46.0%
Securities 50 50 0.0%
Total amounts disbursed or in repayment 3,290 2,255 45.9%
IAS/IFRS adjustments 46 51 -9.8%
Total loans to customers and banks 3,336 2,306 44.7%
Total amounts disbursed or in repayment 3,290 2,255 45.9%
Commitments to disburse and guarantees 1,401 1,339 4.6%
Total loans (including commitments) 4,691 3,594 30.5% The operations of this area of business concern investments in works for the provision of public services, with a target market comparable to that of medium and long-term lending by banks and by CDP to non-financial companies in specific industries (public works, transport vehicles, energy-related projects, transport-related services, and land, sea and air transport), as reported in the supplement to the Bank of Italy’s Statistical Bulletin. At the end of 2009, CDP’s overall market share in this segment came to 5%, compared with 3.3% at the end of 2008. The significant increase in both loans granted and loans disbursed was due to the large flow of new lending throughout 2009, which remained at the same high levels reached in 2008 and more than offset the volume of repayments (which were also significant). As noted for the previous year as well, the greatest contribution came from corporate finance operations and was concentrated in a number of large-value transactions. More specifically, in 2009 new loans were granted totalling €1,914 million (+2.7% over 2008), nearly all of which in corporate loans. Enterprises - Flow of new loan agreements
(millions of euros)
Total 2009
Project finance 17
Corporate finance 1,897
Total 1,914

Report and Financial Statements at 31 December 2009
66
Disbursements for 2009 in respect of new loans and those from previous years totalled €1,744 million (+57% over 2008). Here, too, the largest increase in operations was seen mainly in the form of corporate loans.
Enterprises - Flow of new disbursements
(millions of euros)
Total 2009
Project finance 104
Corporate finance 1,640
Total 1,744 During the year, new financing granted was mainly to companies in the following industries: electrical power, local multi-utilities, airspace defence and safety, and water service management. On the disbursement side, drawings on financing granted in 2008 were completed in favour of companies working on high-speed, high-capacity railway lines. Disbursements also concerned financing granted both in previous years and during the year under review (primarily in electrical power, aerospace defence and security, and local multi-utilities).
In terms of the Enterprises unit’s contribution to CDP’s performance in 2009, net interest income for the unit came to €19 million, in addition to €4 million in commission income for the period. Gross income thus totalled €23 million, accounting for 1.1% of the total for CDP as a whole. Taking account of overheads specific to the Enterprises unit, its overall contribution to total CDP income decreases to €22 million. Translating this performance in terms of the spread between interest-bearing assets and interest-bearing liabilities, the margin came to 70 basis points, compared with 110 basis points for CDP. The cost-to-income ratio for the unit thereby comes to 8.6%, compared with 3.7% for CDP as a whole. Finally, the Enterprise unit’s loan portfolio has no problem positions.
4.1.5 THE EXPORT-BANK SYSTEM In February 2010, pending publication of the decree of the Minister for the Economy and Finance implementing Decree Law 78/2009 (ratified with Law 102/2009), an agreement was signed with SACE S.p.A. regarding “export-bank” operations. This system makes it possible to finance the international expansion and export operations of Italian businesses and their foreign subsidiaries at competitive

Report and Financial Statements at 31 December 2009
67
costs, as well as other operations of strategic importance to Italy’s economy in terms of economic security and the stimulation of production and employment. The agreement establishes the type of operations that fall within SACE’s scope of business that can be financed by CDP, as well as the procedures for joint action, and provides for CDP to provide banks with the funds needed to finance eligible operations, on the condition that they are insured or guaranteed by SACE. In order to make the final cost of the operation more competitive, the funding agreement between CDP and the bank will specify the maximum spread, inclusive of any commissions and fees, that the bank may add to the cost of funding. The agreement also establishes that CDP may finance, either directly or through SACE and including by way of subscription of bonds, operations with a value of more than €25 million in the event that the banking system is unable to do so given the timing or size of the operations or when such operations are of strategic importance to the country. This, too, is subject to SACE issuing guarantees or insurance to back CDP’s financing. The signing of the agreement was preceded by an initial financing transaction by CDP in support of SACE S.p.A., which took place in the latter part of 2009. The transaction involved Fincantieri Group supplies to the Carnival Group abroad totalling about €1.5 billion.
4.1.6 REAL ESTATE INVESTMENT AND SERVICES Increasingly stringent budget constraints have made it necessary for government, and local authorities in particular, to adopt – taking advantage of the options made available by the new legislative framework – new approaches for raising funds without new borrowing, but rather through programmes to develop and/or dispose of real estate not used for operations. Article 58 of Decree Law 112/2008 (the “Housing Plan”), ratified with Law 133/2008, contains measures to foster the development and disposal of property owned by territorial authorities. In order to support local authorities in the process of leveraging their real estate assets, in the first part of 2009 the Real Estate unit was created with the mission of assisting public bodies in the technical, financial, administrative and procedural activities needed to manage the projects.

Report and Financial Statements at 31 December 2009
68
CDP provides assistance through specific protocols of understanding, while investments can be channelled through funds managed by CDP Investimenti SGR, which was established specifically for such purpose. In 2009, efforts continued in support of the local authorities in Italy with the signing of additional protocols of understanding, following the first experience of working with the City of Milan, which began in 2007. The local authorities with which CDP signed protocols in 2009 were:
1. the City of Venice; 2. the City of Palermo.
On 27 February 2009, the protocol was signed with the City of Venice in order to leverage a portion of the city’s real estate portfolio, which was enacted by establishing a seeded real estate investment fund. More specifically, the assets selected are in need of significant levels of development, making this a “development” real estate fund. The total value of the operation is about €85 million. In this case as well, a portion of the property portfolio (worth €42 million, or 50% of the total) was transferred to the fund in exchange for the city subscribing for the corresponding fund units. Whereas the remainder was sold to the fund for cash. The City of Venice has also expressed its intention to hold the units in the fund until at least 31 December 2012, while reserving the option to place them with qualified investors following said date. On 23 September 2009, the protocol of understanding was signed with the City of Palermo regarding a feasibility study by CDP to identify potential means of developing a portfolio of real estate assets specified by the city. Work on the preparation of this feasibility study is currently under way. Regarding real estate investment activities, in 2009 CDP Investimenti SGR was established, with CDP holding a 70% controlling interest and the remainder divided equally between Associazione delle Fondazioni Bancarie e Casse di Risparmio (ACRI) and the Italian Banking Association (ABI). In January 2010, the Bank of Italy authorised the company to provide collective asset management services and it is therefore entered in the register of asset management companies (Articles 34 and 35 of Legislative Decree 58/98). The management company promotes and manages the Fondo Investimenti per l’Abitare fund, the rules of which were approved by the Bank of Italy in March 2010. The fund is to invest around 90% of its assets in units of real estate funds, while the remainder may be invested in real estate directly. The fund may operate throughout Italy, taking significant minority stakes in local social housing

Report and Financial Statements at 31 December 2009
69
investment funds in which bank foundations, local authorities and private parties are allowed to invest. In addition to CDP, this fund also calls for the participation of other public and private investors, and the management fund intends to participate in the public procedure for the subscription of part of the fund by the Ministry for Infrastructure, so as to achieve total commitments to the fund of at least €2 billion. In order to facilitate the imminent start of operations, the first round of fund-raising for the fund is to take place with the subscription of a €1 billion stake by CDP, which has already been approved by the Board of Directors.
4.2 TREASURY AND FUNDING ACTIVITIES
4.2.1 TREASURY MANAGEMENT AND SHORT-TERM FUNDING With regard to the investment of financial resources, provided below are the aggregates related to cash and cash equivalents, along with an indication of the alternative forms of investing financial resources, such as debt securities not related to customer financing activities. Stock of investments of financial resources
(millions of euros)
31/12/2009 31/12/2008 % change
Cash and cash equivalents 118,380 106,863 10.8%- Treasury current account, other liquidity and deposits - Separate Account
113,330 102,615 10.4%
- Reserve requirement 3,701 3,354 10.4%
- Deposits (assets) - Ordinary Account 441 264 66.7%
- Deposits (assets) on Credit Support Annex transactions 908 630 44.0%
Debt securities 692 662 4.5%
Total 119,071 107,525 10.7% Stock of short-term funding from banks
(millions of euros)
31/12/2009 31/12/2008 % change
Deposits and repurchase agreements - Separate Account 141 0 n/s
Deposits and repurchase agreements - Ordinary Account 450 0 n/s
Deposits (liabilities) on Credit Support Annex transactions 625 85 637.1%
Total 1,217 85 n/s
Net interbank position - Ordinary Account -10 264 n/s
Net deposits on Credit Support Annex transactions 283 546 -48.2%

Report and Financial Statements at 31 December 2009
70
Funds raised by CDP through the Separate Account, which comes mainly from postal savings, are deposited in a current account with the Central State Treasury pending disbursements of loans to customers, unless they are used for other forms of investment of liquidity discussed below. At the end of 2009, the balance of this account came to €113 billion, a marked increase (+10.4%) over 2008 (when the balance was €103 billion). Most of the change was due to the increase in net funding from postal savings products, which was greater than the growth in loans to customers. CDP has been subject to the minimum reserve requirement since 2006. It came to €3,701 million at the end of 2009, an increase of 10.4% over 2008 (about €3,354 million). Here, too, the increase was due mainly to the significant increase in postal savings. The liabilities of CDP S.p.A. that are currently subject to the reserve requirement continue to be deposits with a maturity of less than two years, as well as deposits owned by monetary financial institutions that are not subject to the reserve requirement. The management of the reserve requirement and its remuneration is designed to ensure the internal accounting separation of the Separate Account and the Ordinary Account. Regarding the deposits in respect of transactions supported by Credit Support Annexes (CSA), which were established under guarantee agreements to limit the counterparty risk associated with transactions in derivative instruments, at the end of 2009 there was a net creditor balance of €283 million, down from the €546 million posted at the end of 2008. This change is attributable both to new guarantee agreements signed during the year and to the change in fair value of the derivative instruments associated with these deposits. CSA deposits are also managed in a manner that ensures the accounting separation between the two Accounts. For treasury management operations under the Ordinary Account, CDP uses money market instruments such as current accounts and repurchase agreements in order to optimise funding and investment. In order to invest any excess liquidity at short term, CDP has also used floating-rate government securities. The net position in deposits and repurchase agreements at the end of 2009 was a negative €10 million, compared with the positive €264 million at the end of 2008. For the Separate Account, investments in asset-backed securities and securities issued by public entities were maintained in the portfolio from the end of 2008, for a carrying amount of €206 million, in addition to inflation-linked bonds with a carrying amount of €455 million. In 2009, as part of the closure of a portfolio of

Report and Financial Statements at 31 December 2009
71
loans that had previously been securitised, CDP also purchased a security issued by the special-purpose vehicle CPG and guaranteed by loans from another securitised portfolio, for a residual value of about €30 million as at 31 December 2009. CDP also financed the inflation-linked bonds with repurchase agreements. The balance of this aggregate was €141 million at the end of 2009.
4.2.2 DEVELOPMENTS IN MEDIUM AND LONG-TERM FUNDING With regard to funding under the Separate Account other than postal savings, no new issues were made as part of the covered bond programme in 2009. Conversely, on 31 July 2009, a total of €2 billion in bonds were redeemed when the first issue reached its natural maturity (having been issued on 15 February 2006). Repayment of the bonds is secured by assets and rights in the segregated asset pool established pursuant to Article 5.18 of Decree Law 269/2003; these and the debt covered by the assets are shown separately in the CDP S.p.A. financial statements.
As regards funding not backed by state guarantee, which falls under the Ordinary Account, new issues in 2009 under the Euro Medium-Term Notes (EMTN) programme had a total nominal value of €1,550 million, with the characteristics shown in the table below. Flow of new medium/long-term funding
(millions of euros)
EMTN issuesIssue/
funding dateNominal value
Financial terms and conditions
(post hedging)
Issue (maturing 02-Feb-2010) 12/Feb/09 700 2-month Euribor + 0.65%
Issue (maturing 24-Apr-2012) 24/Apr/09 500 6-month Euribor + 1.28%
Issue (maturing 28-Jan-2011) 28/Jul/09 100 6-month Euribor + 0.55%
Issue (maturing 15-Dec-2014) 15/Dec/09 250 6-month Euribor + 0.48%
Total 1,550
* Value in euros of issue of $376.5 million
*
The new funding is to be used to finance infrastructure projects under the Ordinary Account. During the year, a partial buyback of previously issued securities was carried out in the amount of €450 million, while €800 million in securities were redeemed, bringing total net funding in 2009 to €300 million. Other developments in 2009 included the first issue in dollars for a total of $377 million (€250 million), as well as a fixed-rate yen-denominated bond with a nominal value of ¥13 billion (about €102 million), which took effect as from January 2010.

Report and Financial Statements at 31 December 2009
72
During the year, an agreement was reached with the EIB for the financing of the three-year development plan for Enel’s distribution network. Under the agreement, the EIB will provide CDP with €800 million in funds (disbursed in their entirety at year end, €85 million of which drawn on previous lines of financing), which will be lent to the Enel Group for investments scheduled to be made by Enel Distribuzione during the period 2009-2011. A similar agreement was also reached to finance the four-year development plan of Terna, the independent operator of Italy’s power grid. Under the agreement, the EIB will provide CDP with €500 million in funds to be lent to the Terna Group for investments scheduled to be made during the period 2008-2011. Finally, in October, CDP signed an agreement with the EIB to finance the investments of Autostrade per l’Italia in order to expand the Florence-Bologna section of the A1 motorway. Under the agreement, the EIB will provide CDP with €500 million in funds (€150 million of which were disbursed as at December 2009) to help finance the execution of the works, the total cost of which is estimated at some €3 billion. In 2009 CDP also requested new disbursements on the existing lines of credit with the EIB for a total of €854 million, as reported in the table below. Flow of new medium/long-term funding
(millions of euros)
EIB credit lineIssue/
funding dateNominal value
Financial terms and conditions
Drawing (maturing 29-Dec-2028) 10/Jul/09 300 6-month Euribor + 0.60%
Drawing (maturing 29-Dec-2028) 15/Oct/09 400 6-month Euribor + 0.51%
Drawing (maturing 15-Jun-2029) 10/Dec/09 4 fixed rate of 4.068%
Drawing (maturiing 19-Dec-2034) 29/Dec/09 150 6-month Euribor + 0.431%
Total 854 For the sake of full disclosure, the table below shows CDP’s overall position in terms of medium and long-term funding as at 31 December 2009, compared with the end of 2008, by product type. The changes in the balances represent the net effect of new drawings and the consequent increase in nominal values less principal repayments, as discussed above.
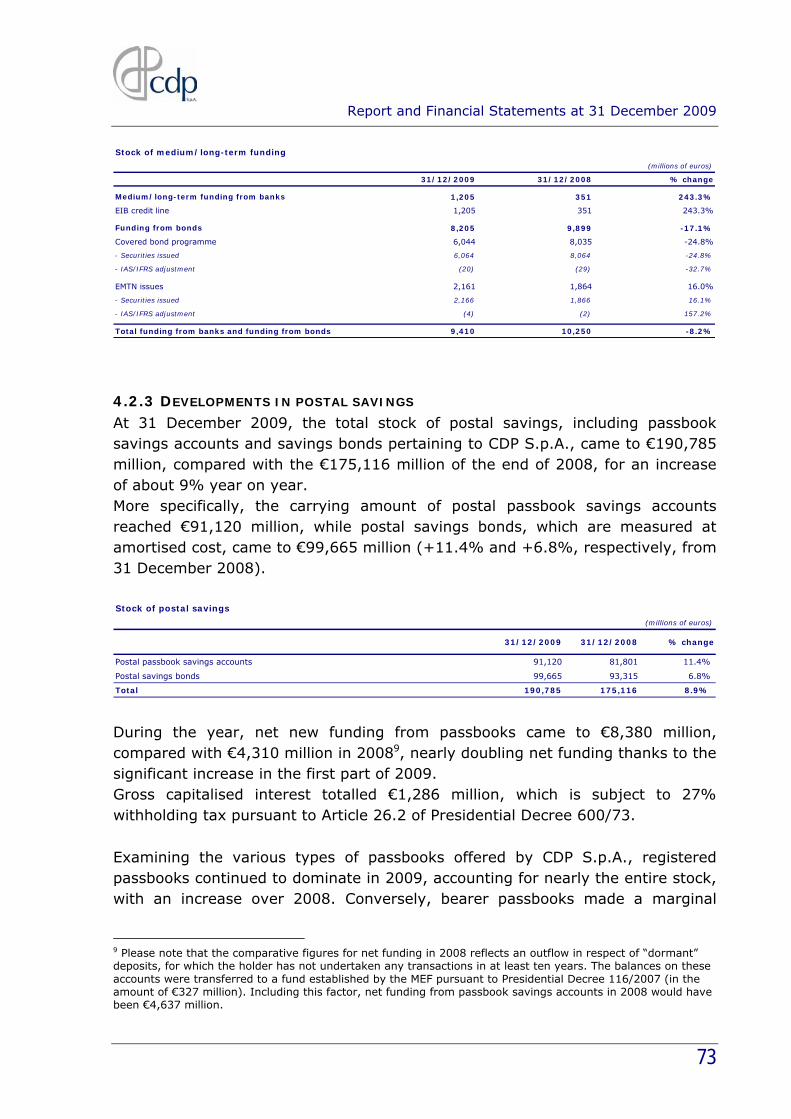
Report and Financial Statements at 31 December 2009
73
Stock of medium/long-term funding
(millions of euros)
31/12/2009 31/12/2008 % change
1,205 351 243.3%
EIB credit line 1,205 351 243.3%
8,205 9,899 -17.1%
Covered bond programme 6,044 8,035 -24.8%
- Securities issued 6,064 8,064 -24.8%
- IAS/IFRS adjustment (20) (29) -32.7%
EMTN issues 2,161 1,864 16.0%
- Securities issued 2,166 1,866 16.1%
- IAS/IFRS adjustment (4) (2) 157.2%
Total funding from banks and funding from bonds 9,410 10,250 -8.2%
Medium/long-term funding from banks
Funding from bonds
4.2.3 DEVELOPMENTS IN POSTAL SAVINGS At 31 December 2009, the total stock of postal savings, including passbook savings accounts and savings bonds pertaining to CDP S.p.A., came to €190,785 million, compared with the €175,116 million of the end of 2008, for an increase of about 9% year on year. More specifically, the carrying amount of postal passbook savings accounts reached €91,120 million, while postal savings bonds, which are measured at amortised cost, came to €99,665 million (+11.4% and +6.8%, respectively, from 31 December 2008). Stock of postal savings
(millions of euros)
31/12/2009 31/12/2008 % change
Postal passbook savings accounts 91,120 81,801 11.4%
Postal savings bonds 99,665 93,315 6.8%
Total 190,785 175,116 8.9% During the year, net new funding from passbooks came to €8,380 million, compared with €4,310 million in 20089, nearly doubling net funding thanks to the significant increase in the first part of 2009. Gross capitalised interest totalled €1,286 million, which is subject to 27% withholding tax pursuant to Article 26.2 of Presidential Decree 600/73. Examining the various types of passbooks offered by CDP S.p.A., registered passbooks continued to dominate in 2009, accounting for nearly the entire stock, with an increase over 2008. Conversely, bearer passbooks made a marginal
9 Please note that the comparative figures for net funding in 2008 reflects an outflow in respect of “dormant” deposits, for which the holder has not undertaken any transactions in at least ten years. The balances on these accounts were transferred to a fund established by the MEF pursuant to Presidential Decree 116/2007 (in the amount of €327 million). Including this factor, net funding from passbook savings accounts in 2008 would have been €4,637 million.

Report and Financial Statements at 31 December 2009
74
negative contribution to net funding, with the end-period stock falling to €416 million. Passbook savings accounts
(millions of euros)
31/12/2008 Net fundingReclassifications and adjustments
Interest 01/01/2009-31/12/2009
Withholdings 31/12/2009
Registered passbook accounts 81,367 8,402 0 1,281 -346 90,704
Bearer passbook accounts 433 -22 0 6 -2 416
Total 81,801 8,380 0 1,286 -347 91,120 For registered passbooks, 2009 saw the continuation of the expansion in passbooks for minors (+21%) and in ordinary passbooks (+12%). However, the stock data also reflect reclassifications of about €100 million due to passbook holders reaching adulthood, with the transformation of their accounts into ordinary passbooks. Registered passbook accounts - Stock
(millions of euros)
31/12/2008 Net fundingReclassifications and adjustments
Interest 01/01/2009-31/12/2009
Withholdings 31/12/2009
Ordinary 78,191 8,190 100 1,228 -332 87,378
Time deposits 5 0 0 0 0 4
Minors 1,536 398 -100 33 -9 1,858
Judicial 1,635 -186 0 20 -5 1,464
Total 81,367 8,402 0 1,281 -346 90,704 Bearer passbooks, on the other hand, declined by around 4% from their 2008 level.
Bearer passbook accounts - Stock
(millions of euros)
31/12/2008 Net fundingReclassifications and adjustments
Interest 01/01/2009-31/12/2009
Withholdings 31/12/2009
Ordinary 433 -22 0 6 -2 415
Time deposits 1 0 0 0 0 1
Total 433 -22 0 6 -2 416 Ordinary registered passbooks continue to make the greatest contribution to net funding, increasing by 93% over 2008. The contribution from passbooks for minors also grew (+33% over 2008), while net funding from judicial passbooks was negative.

Report and Financial Statements at 31 December 2009
75
Registered passbook accounts - Net funding
(millions of euros)
Deposits WithdrawalsNet funding
2009
Ordinary 77,136 68,946 8,190
Time deposits 0 0 0
Minors 663 265 398
Judicial 469 655 -186
Total 78,268 69,866 8,402 Net flows for bearer passbooks were negative, although their contribution was marginal compared with the other passbook types.
Bearer passbook accounts - Net funding
(millions of euros)
Deposits WithdrawalsNet funding
2009
Ordinary 130 152 -22
Time deposits 0 0 0
Total 130 152 -22 There was an overall increase of 7% in the stock of postal savings bonds from 2008 thanks to positive net funding in 2009, although funding levels declined from the previous year (going from €10,234 million in 2008 to €4,205 million in 2009). The substantial level of funding in 2008 was due to the replacement of new CDP bonds in the presence of large redemptions of MEF bonds, the amount of which was lower in 2009. The 2009 stock also includes transaction costs resulting from the application of the IAS/IFRS, consisting of the distribution commissions for all types of bond and the value of the embedded options separated out of indexed bonds and Premia bonds. The carrying amount at 31 December 2009 reached about €100 billion. Postal savings bonds - CDP stock
(millions of euros)
31/12/2008 Net funding Withholdings Transaction costs Accrued for year 31/12/2009
Ordinary bonds 63,494 2,834 -49 -346 2,293 68,226
Fixed-term bonds 2,886 -1,875 -65 0 71 1,016
Indexed bonds 4,909 887 -2 -132 194 5,855
Premia bonds 1,957 2,439 0 -314 100 4,182
Inflation indexed bonds 8,828 2,669 -10 -166 279 11,599
Bonds for minors 1,392 576 0 -11 67 2,024
18-month bonds 9,849 -3,326 -32 -19 290 6,761
Total 93,315 4,205 -159 -990 3,294 99,665
The total volume of subscriptions for the year came to €21,551 million, a decline of around 22% from the previous year (€27,692 million). This decrease was due to the aforementioned reduction in the amount of redemptions of MEF bonds in 2009, which contribute to the level of new subscriptions for CDP.

Report and Financial Statements at 31 December 2009
76
Postal savings bonds - CDP net funding
(millions of euros)
Subscriptions RedemptionsNet funding
2009
Ordinary bonds 8,446 5,611 2,834
Fixed-term bonds 2 1,877 -1,875
Indexed bonds 1,556 669 887
Premia bonds 2,811 371 2,439
Inflation indexed bonds 5,370 2,701 2,669
Bonds for minors 619 43 576
18-month bonds 2,748 6,075 -3,326
Total 21,551 17,347 4,205
* The figure regards recovery of amounts in respect of old subscriptions of postal savings bonds
*
More specifically, investors continue to show a great deal of interest in inflation-linked bonds (with subscriptions of €5,370 million and net funding of €2,669 million) and in the equity-linked products related to the indexed bonds and Premia bonds (with total subscriptions of €4,366 million and net funding in excess of €3,326 million). Nonetheless, traditional ordinary bonds continue to be well received, with subscriptions of €8,446 million and net funding for CDP of €2,834 million, although overall net funding (CDP+MEF) was a negative €2,779 million. By contrast, investor interest in 18-month bonds diminished, with subscriptions coming to €2,748 million and net redemptions of €3,326 million. Postal savings bonds - Total net funding (CDP+MEF)
(millions of euros)
CDP Subscriptions CDP Redemptions MEF redemptionsNet funding
2009(CDP+MEF)
Ordinary bonds 8,446 5,611 5,613 -2,779
Fixed-term bonds 2 1,877 1,432 -3,307
Indexed bonds 1,556 669 0 887
Premia bonds 2,811 371 0 2,439
Inflation indexed bonds 5,370 2,701 0 2,669
Bonds for minors 619 43 0 576
18-month bonds 2,748 6,075 0 -3,326
Total 21,551 17,347 7,045 -2,840
* The figure regards recovery of amounts in respect of old subscriptions of postal savings bonds
*
Redemptions of bonds held by the MEF totalled more than €7 billion, a significant decline from 2008 (-64%), the figures for which also included ordinary redemptions totalling €4.9 billion of fixed-term bonds represented by physical certificates without a specified denomination belonging to the AE series held by financial institutions, for which there were no plans for replacement with new CDP bonds.
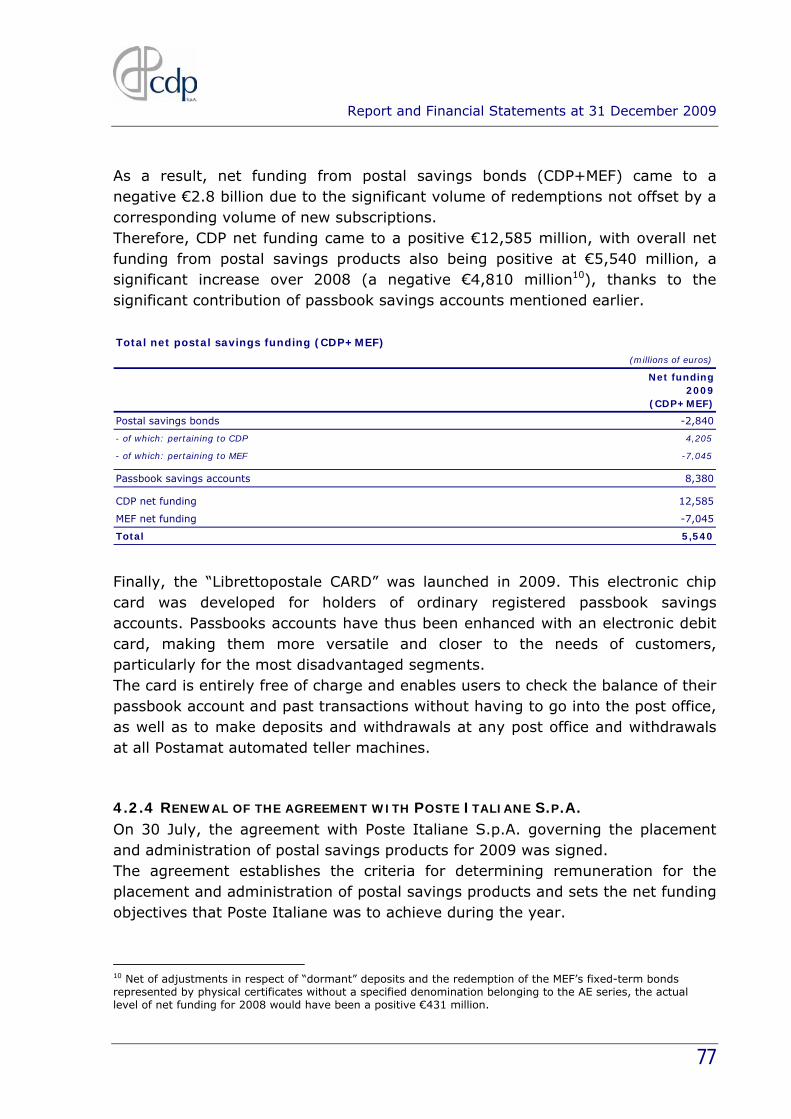
Report and Financial Statements at 31 December 2009
77
As a result, net funding from postal savings bonds (CDP+MEF) came to a negative €2.8 billion due to the significant volume of redemptions not offset by a corresponding volume of new subscriptions. Therefore, CDP net funding came to a positive €12,585 million, with overall net funding from postal savings products also being positive at €5,540 million, a significant increase over 2008 (a negative €4,810 million10), thanks to the significant contribution of passbook savings accounts mentioned earlier. Total net postal savings funding (CDP+MEF)
(millions of euros)
Net funding 2009
(CDP+MEF)
Postal savings bonds -2,840
- of which: pertaining to CDP 4,205
- of which: pertaining to MEF -7,045
Passbook savings accounts 8,380
CDP net funding 12,585
MEF net funding -7,045
Total 5,540 Finally, the “Librettopostale CARD” was launched in 2009. This electronic chip card was developed for holders of ordinary registered passbook savings accounts. Passbooks accounts have thus been enhanced with an electronic debit card, making them more versatile and closer to the needs of customers, particularly for the most disadvantaged segments. The card is entirely free of charge and enables users to check the balance of their passbook account and past transactions without having to go into the post office, as well as to make deposits and withdrawals at any post office and withdrawals at all Postamat automated teller machines.
4.2.4 RENEWAL OF THE AGREEMENT WITH POSTE ITALIANE S.P.A. On 30 July, the agreement with Poste Italiane S.p.A. governing the placement and administration of postal savings products for 2009 was signed. The agreement establishes the criteria for determining remuneration for the placement and administration of postal savings products and sets the net funding objectives that Poste Italiane was to achieve during the year.
10 Net of adjustments in respect of “dormant” deposits and the redemption of the MEF’s fixed-term bonds represented by physical certificates without a specified denomination belonging to the AE series, the actual level of net funding for 2008 would have been a positive €431 million.

Report and Financial Statements at 31 December 2009
78
As concerns placement activity, the criteria adopted in the agreement continue to link the funding within a framework of specified objectives. For accounting and administrative services, on the other hand, remuneration is based on the average daily stock for passbook savings accounts, while the placement commission for savings bonds includes accounting and administration services. Nonetheless, total remuneration falls within a broader framework linked to the overall performance of net funding. More specifically, a range of compensation has been established which specifies a minimum total commission (to cover the costs incurred by Poste Italiane in providing the service) and a maximum (to safeguard CDP’s profitability and financial stability) based on the levels of total net funding achieved by the end of the year. Therefore, the total amount paid to Poste Italiane is equal to the sum of the commissions for the placement of each type of postal savings bond and the management of passbooks, adjusted up or down in relation to the actual level of total net funding for the year. As a result, the total commission expense accrued in relation to postal savings payable to Poste Italiane for 2009 came to €1,600 million. Finally, on 10 March 2010, a new agreement was reached between CDP and Poste Italiane. The accord establishes the remuneration to Poste Italiane S.p.A. for the current year for the placement and administration of postal savings products. The calculation of payment is subject to achieving specific net funding targets, plus a premium linked to the composition of gross funding achieved through savings bonds.
4.3 EQUITY INVESTMENTS
CDP’s portfolio of equity investments at 31 December 2009 consisted principally of: 1) equity interests in Enel S.p.A., Eni S.p.A. and Poste Italiane S.p.A., which were transferred to CDP S.p.A. from the Ministry for the Economy and Finance when CDP was transformed into a joint-stock company at the end of 2003; 2) a 29.99% stake in Terna S.p.A., acquired from Enel S.p.A. in September 2005; 3) an indirectly-held stake of around 14% of STMicroelectronics N.V., which was acquired from Finmeccanica S.p.A. in December 2004 (around 10%) and December 2009 (around 4%).

Report and Financial Statements at 31 December 2009
79
Equity investments and financial assets available for sale(thousands of euros)
% holding
Book valuefrom inv./disinv.
(*)from
measurement%
holdingBook value
A. Listed companies
1 Eni S.p.A. 9.99% 6,700,827 - 424,306 9.99% 7,125,132
2 Enel S.p.A. 10.14% 2,837,997 3,158,366 611,684 17.36% 6,608,047
3 Terna S.p.A. 29.99% 1,315,200 - - 29.99% 1,315,200
B. Unlisted companies
1 Poste Italiane S.p.A. 35.00% 2,518,744 - - 35.00% 2,518,744
2 STMicroelectronics Holding N.V. 30.00% 446,787 179,202 - 50.00% 625,990
3 Galaxy S.àr.l. SICAR 40.00% 24,523 1,047 - 40.00% 25,569
4 SINLOC S.p.A. 11.85% 5,507 - - 11.85% 5,507
5 F2i SGR S.p.A. 14.29% 2,143 - - 14.29% 2,143
6 Istituto per il Credito Sportivo 21.62% 2,066 - - 21.62% 2,066
7 CDP Investimenti SGR S.p.A. n.a. n.a. 1,400 n.a. 70.00% 1,400
8 2020 European Fund for Energy, Climate Change and Infrastructure SICAV-FIS Sa (Marguerite Fund)
n.a. n.a. 500 n.a. 16.67% 500
9 Europrogetti & Finanza S.p.A. in liquidation 31.80% - - - 31.80% -
10 Tunnel di Genova S.p.A. 33.33% - - - 33.33% -
Total 13,853,793 3,340,514 1,035,990 18,230,297
(*) Increase/decrease in equity investment
31/12/2008 Change 31/12/2009
The entire portfolio is worth a total of €18,230 million, an increase of around €4,377 million (31.6%) compared with 31 December 2008. This change may essentially be ascribed to a number of investments made over the year: 1) subscription of the Enel S.p.A. capital increase in June 2009; 2) acquisition of a 20% stake in STMicroelectronics Holding N.V. (“STH”) from Finmeccanica S.p.A; 3) a start-up investment of 70% of CDP Investimenti SGR S.p.A.; 4) subscription of CDP’s share of the capital increases undertaken by Galaxy S.àr.l. SICAR; 5) joining other European institutional investors in establishing the “2020 European Fund for Energy, Climate Change and Infrastructure SICAV-FIS Sa” (the “Marguerite Fund”), including the payment for the fund’s first call up of funds from investors. As regards the Enel capital increase, in May 2009 the Enel Board of Directors resolved to increase the company’s share capital up to a ceiling of €8 billion. The company subscribed the capital increase in June, prior to its July 2009 closure, which concluded with the full subscription of newly-issued ordinary shares amounting to around €8 billion. After acquiring the rights held by the Ministry for the Economy and Finance for a total value of around €666 million, CDP subscribed newly-issued Enel shares worth a total of around €2.5 billion, thereby increasing the company’s overall investment to 17.36% of Enel’s share capital. As regards the acquisition of STH shares, on 22 December 2009 CDP and Finmeccanica S.p.A. signed a contract for CDP to acquire shares corresponding to around 3.7% of STM’s share capital for a total of around €172 million (in addition

Report and Financial Statements at 31 December 2009
80
to an earn-out for Finmeccanica that will be triggered if, in March 2011, the STM share price exceeds an agreed threshold). Following completion of this transaction, CDP owns 50% of STH and, indirectly, 13.77% of STM. CDP’s consolidated financial statements are prepared using the formats established for banks in Bank of Italy Circular no. 262 of 22 December 2005, consolidating the assets, liabilities, costs and revenues of CDP Investimenti SGR and the Terna Group on a line-by-line basis, even though Terna prepares its own consolidated accounts on the basis of the formats envisaged for non-financial companies under applicable accounting standards. For other equity investments in companies over which CDP S.p.A. does not exercise control, the following accounting rules apply: fair value measurement for investments classified as available-for-sale assets, and equity accounting for investments in associated companies. In the separate financial statements, equity investments in subsidiaries and associates are recognised at cost and adjusted for any impairment, while investments classified as available-for-sale assets continue to be carried at fair value. As regards the income statement, in the separate financial statements, dividends from equity investments are recognised as revenues regardless of classification, rather than recognising CDP S.p.A.’s share of the net income of the investee. The current portfolio of equity investments held by CDP S.p.A. can be classified for the purposes of the separate financial statements as follows:
• the investments in Terna S.p.A. and in CDP Investimenti SGR S.p.A. are classified as investments in subsidiaries and carried at purchase cost;
• the investments in Poste Italiane S.p.A., STMicroelectronics Holding N.V., Galaxy S.àr.l. SICAR, Europrogetti & Finanza S.p.A. in liquidation and Tunnel di Genova S.p.A. are classified as investments in associates and are therefore carried at purchase cost, net of writedowns;
• investments in Eni S.p.A., Enel S.p.A., SINLOC S.p.A., F2i SGR S.p.A., Istituto per il Credito Sportivo and the 2020 European Fund for Energy, Climate Change and Infrastructure SICAV-FIS Sa do not constitute investments in subsidiaries or associates. These investments therefore continue to be classified as available-for-sale financial assets and are measured at fair value, with changes taken to a specific equity reserve. Although the investment in Istituto per il Credito Sportivo (ICS) is equal to 21.62%, under the terms of ICS’s articles of association it does not carry a corresponding share of voting rights. For this reason, CDP cannot exercise a significant influence over ICS’s administrative and operating policies.

Report and Financial Statements at 31 December 2009
81
As concerns the separation of organisation and accounting, shareholdings in the CDP S.p.A. portfolio as of 31 December 2009, regardless of their classification for financial reporting purposes, fall within the scope of the Separate Account, with the exception of the shares held in Galaxy S.àr.l. SICAR, F2i SGR S.p.A. and CDP Investimenti SGR S.p.A., which fall under the Ordinary Account. Dividends regard the accrued share for 2009 of €971 million (out of total dividends collected of €975 million), primarily attributable to the equity investments held in Eni S.p.A. (€460 million), Enel S.p.A. (€345 million), Terna S.p.A. (€101 million) and Poste Italiane S.p.A. (€52 million). Though this remains a substantial amount, the figure decreased by 7.8% compared with the previous year (€1,051 million) as a result of lower profits at the individual investee companies, and general downward trend in payouts.
4.3.1 SUBSIDIARIES AND ASSOCIATES Terna - Rete Elettrica Nazionale S.p.A. (“Terna”) Terna Rete Elettrica Nazionale S.p.A. is responsible for the transmission and dispatching of electricity in Italy over high and very-high voltage networks throughout the country. It is also the primary owner of the country’s electricity transmission grid (NTN). As from 1 November 2005, in compliance with the provisions of the Prime Minister’s Decree of 11 May 2004, Terna received the business unit of the Italian Independent System Operator (ISO) comprising electricity transmission and dispatching operations, and NTN planning and development activities. At the end of 2008, Terna acquired a very large portion of high voltage network from Enel S.p.A., which brought its total electricity line network to over 61,700 kilometres. This transaction made Terna one of the world’s leading transmission operators (in terms of the number of kilometres of power lines owned). Terna also provides services related to its skills in the design, construction, operation, and maintenance of high and very-high voltage electricity infrastructure, as well as services related to the development of its own assets in the telecommunications industry. The company’s shares are traded on the Milan Stock Exchange. CDP Investimenti SGR S.p.A. (“CDPI SGR”) The asset management company CDP Investimenti SGR S.p.A. was established in February 2009 in order to boost the social housing sector in Italy through the establishment and management of a real estate fund reserved for institutional investors who operate in this sector. CDP S.p.A. holds a 70% shareholding in the company’s capital, which amounts to a total of €2 million. The Associazione delle

Report and Financial Statements at 31 December 2009
82
Fondazioni Bancarie e Casse di Risparmio (ACRI), and the Italian Banking Association (ABI) each hold a 15% stake. In January 2010, the company received Bank of Italy authorisation to engage in collective asset management, and the company was entered in the register of asset management companies (pursuant to Articles 34 and 35 of Legislative Decree 58/98). CDPI SGR is therefore now promoting and managing the newly-established Fondo Investimenti per l’Abitare fund, after the fund regulations received Bank of Italy approval in March 2010. Poste Italiane S.p.A. (“Poste Italiane”) Poste Italiane operates the universal postal service in Italy and engages in commercial activities through its various product divisions and group companies in the two main business areas of postal services and BancoPosta (postal banking and financial services). Postal services include the Mail, Express Delivery, Logistics and Parcels, and Philately divisions. BancoPosta operations consist essentially of the provision of payment services and financial products (including products on behalf of CDP S.p.A., i.e. postal passbook savings accounts and postal savings bonds). The Poste Italiane Group also operates in the insurance market through Poste Vita S.p.A., a company that places insurance policies through more than 14,000 post offices in the Poste Italiane network. The Group has also entered the telecommunications industry as a virtual mobile operator through its subsidiary PosteMobile S.p.A. STMicroelectronics Holding N.V. (“STH”) STH, a Dutch firm with Italian and French shareholders, manages – through its wholly-owned subsidiary STMicroelectronics Holding II B.V. – a 27.5% stake in the Dutch firm STMicroelectronics N.V. (“STM”), which is a world leader in semiconductor research and production. The STM Group was established in June 1987 following the merger of the Italian company SGS Microelettronica and the French firm Thomson Semiconducteurs. Galaxy S.àr.l. SICAR (“Galaxy”) Galaxy, a Luxembourg firm, makes equity or quasi-equity investments in transportation infrastructure, particularly within Italy, Europe and other OECD countries. Its main segments of investment are roadways, rail, airports and harbours. Galaxy operates in a manner typical of a private equity fund. The current Galaxy shareholders are Caisse des Dépôts et Consignations (“CDC”), Kreditanstalt für Wiederaufbau (“KfW”) and CDP S.p.A. Shareholders made a total commitment of €250 million, of which CDP subscribed €100 million. At 31 December 2009, the total investment called up by the fund amounted to €64

Report and Financial Statements at 31 December 2009
83
million, with an investment period that closed in July 2008. In July 2009, the company adopted the legal form of a venture capital investment company (SICAR), pursuant to Article 1(1) of the Luxembourg law of 15 June 2004. Europrogetti & Finanza S.p.A. in liquidation (“EPF”) This company, in which leading banks and financial institutions hold stakes, was established in 1995 pursuant to Decree Law 26/1995 (ratified under Law 95 of 29 March 1995). In view of the company’s lack of growth prospects, on 28 January 2009 the Shareholders’ Meeting resolved to place EPF into voluntary liquidation pursuant to Article 2484.1, 6), of the Italian Civil Code. Tunnel di Genova S.p.A. (“TdG”) This company was established to coordinate activities for the design, construction and operation of underground and underwater links between the western and eastern sections of Genoa.
4.3.2 OTHER EQUITY INVESTMENTS Eni S.p.A. (“Eni”) Eni is an integrated company operating in the oil and natural gas industries, as well as power generation and distribution, engineering and construction, and in the petrochemical industry. The company is known for the excellence of its skill base and its strong international market position. Eni has a presence in some 70 countries, and has about 79,000 employees. Its primary lines of business are: Exploration & Production, Gas & Power, Refining & Marketing, Petrochemicals, and Engineering & Construction The company’s shares are listed on the Milan Stock Exchange and the New York Stock Exchange. Enel S.p.A. (“Enel”) Enel is Italy’s leader in electricity generation, distribution, and sales. The company is also involved in the import, distribution and sale of natural gas. Following its acquisition of Spanish electricity company Endesa, Enel has become Europe’s second largest electricity enterprise. Enel now has a presence in 23 countries, an installed capacity of around 95 GW, and serves around 61 million consumers with electricity and gas. Group businesses are handled by the following divisions: Generation and Energy Management; Engineering and Innovation; Sales; Infrastructure and Networks; International; Iberia and Latin America; and Renewable Energy. The company’s shares are traded on the Milan Etock Exchange.

Report and Financial Statements at 31 December 2009
84
Sistema Iniziative Locali S.p.A. (“SINLOC”) SINLOC, whose shareholders include numerous bank foundations, is a company that was established to support local territorial development initiatives. It also provides financial and legal consulting services to local authorities, banking foundations and other government bodies, with a focus on urban regeneration and socio-economic development projects. Fondi Italiani per le Infrastrutture SGR S.p.A. (“F2i SGR”) F2i SGR provides asset management services through the promotion, creation, and organisation of closed-end mutual funds specialising in infrastructure. In July 2007, F2i SGR was entered at number 247 on the register of asset management companies maintained by the Bank of Italy. In December 2007, F2i SGR launched the Italian infrastructure fund (Fondo Italiano per le Infrastrutture), the first fund specialising in infrastructure assets. Istituto per il Credito Sportivo (“ICS”) ICS, which was reformed under Presidential Decree no. 453 of 20 October 2000, is a residual public-law bank in accordance with Article 151 of the 1993 Banking Act. It provides medium- and long-term financing to public and private borrowers for the design and construction of sports facilities. Since 2004, it has also been authorised to provide financing for cultural initiatives. 2020 European Fund for Energy, Climate Change and Infrastructure SICAV-FIS Sa (“Marguerite Fund”) Together with other European public financial institutions, on 3 December 2009 CDP S.p.A. launched the “2020 European Fund for Energy, Climate Change and Infrastructure SICAV-FIS Sa”, a Luxembourg-registered closed-end variable capital investment fund which has been set up to act as a catalyst for investment in infrastructure associated with climate change, energy security and European-wide networks. The fund will undertake equity or quasi-equity investments in companies that own or manage infrastructure in the transportation and energy sectors, with a special focus on renewable energy. CDP S.p.A. has committed to a maximum investment of €100 million, out of the fund’s expected total of around €1.5 billion once the current fund-raising round has been completed.

Report and Financial Statements at 31 December 2009
85
4.3.3 INVESTMENT FUNDS SUBSCRIBED
Investment funds
(thousands of euros)
31/12/2008 31/12/2009
SectorNumber of
unitsBook value
from inv./disinv.
from measurement
Book value
1. PPP ItaliaInfrastructure
and PPP projects350 580 1,038 (265) 1,353
2. Abitare Sociale 1 Social housing 98 4,949 0 (42) 4,906
3. F2i Fondi Italiani per le Infrastrutture SGR Infrastructure
- A Units 150 9,589 28,462 (4,189) 33,862
- C Units 16 n.a. 203 (23) 180
Total 15,118 29,702 (4,519) 40,301
Change
CDP S.p.A.’s participation as a subscriber to investment funds is designed to facilitate investments in physical and social infrastructure at various levels:
• local, in cooperation with local authorities and foundations, who have a close understanding of the local area. In this sphere, CDP also promotes public-private partnerships (PPPs);
• national, focusing on major works in cooperation with Italian and foreign institutional investors;
• international, in support of infrastructure projects and networks involving more than one country, not only at the European level, cooperating with European institutions and comparable foreign entities (such as CDC, KfW and the EIB).
CDP has subscribed the following investment funds: PPP Italia, Abitare Sociale 1, and Fondi Italiani per le Infrastrutture (F2i). Units held in these funds are recognised as available-for-sale financial assets. For the purposes of the separation of organisation and accounting, investments in investment funds and private equity funds come under the Ordinary Account and are therefore wholly financed by funding raised under that Account. Below is a brief description of the activities of each of the funds in which CDP S.p.A. holds subscribed units. PPP Italia PPP Italia is a closed-end fund specialised in public-private partnerships (PPPs). The Fund’s purpose is to make equity or quasi-equity investments through selected minority stakes in the following sectors: (i) civil construction (schools, hospitals, public office buildings, etc.), (ii) the environment and urban regeneration, (iii) transportation and public utilities, and (iv) power generation

Report and Financial Statements at 31 December 2009
86
projects that use renewable sources. The fund totals €120 million, of which CDP S.p.A. has subscribed units totalling €17.5 million. The fund started up operations in 2006 and is currently in the investment stage, which will be completed in December 2012 (unless extended for a further year). At 31 December 2009, the fund had called up around €17.2 million, corresponding to 14.3% of the overall commitment. Abitare Sociale 1 The Fondo Abitare Sociale 1 is an Italian closed-end ethical real estate fund promoted by the Cariplo Foundation in partnership with the Lombardy regional government and the Lombardy branch of the National Association of Italian Municipalities. The financial resources of the fund are to be used for the construction of housing and services in the Lombardy region, so as to contribute to solving the housing problem with a particular emphasis on the socially or financially disadvantaged, in partnership with the service and public sectors. This will also include rent control for properties built using fund assets. The initiative primarily targets students, senior citizens, single-income families, immigrants and other socially or financially disadvantaged parties. The fund has total assets of €85 million. As at 31 December 2009, around €21.3 million of this total had been called up, corresponding to 25.0% of the total commitment; CDP is involved through a financial commitment of €20 million. The Fund started up operations in 2007 and is currently in the investment stage, which is scheduled to be completed in March 2012. F2i - Fondi Italiani per le Infrastrutture (“F2i”) The purpose of the F2i fund is to invest in infrastructure, particularly in the areas of transportation, gas and energy transport, media and telecommunications, power generation (from renewable sources), and social and local public services. The F2i fund was authorised by the Bank of Italy in August 2007. On completion of fund-raising in February 2009, the fund had total resources of around €1.85 billion. CDP S.p.A. subscribed A-class units in the F2i fund corresponding to a financial commitment of €150 million. As a sponsor of the initiative, CDP S.p.A. also subscribed F2i C-class units corresponding to a financial commitment of €0.8 million. The fund is currently in its investment phase, which is scheduled to be completed in February 2013 (unless extended by up to a maximum of two years). At 31 December 2009, around €470 million had been committed to the fund, corresponding to 25.4% of the total commitment.

Report and Financial Statements at 31 December 2009
87
4.4 RISK MONITORING, CONTROLS AND SUPPORT ACTIVITIES
4.4.1 RISK MONITORING
4.4.1.1 Credit risk In 2009, CDP drafted new Lending Rules establishing the principles to be followed in lending to public sector borrowers and private or mixed public/private enterprises. The Lending Rules came into effect on 1 January 2010 and therefore also regulate the new lines of business outlined in the 2009-2011 business plan. In 2009, CDP also developed a credit scoring model to improve assessment of the creditworthiness of counterparties, including local and regional governments. The amount of problem loans remains limited with respect to the overall stock of loans.
4.4.1.2 Counterparty risk associated with derivative transactions Over the year, the number of counterparties involved in Credit Support Annexes increased significantly with a view to mitigating risks through the exchange of collateral. Steps were also taking during the year to increase the frequency of exchanges between CDP and counterparties; on some contracts, settlement of margin payments were increased from a monthly basis to a fortnightly or weekly basis.
4.4.1.3 Interest rate risk The markets gradually normalised during the course of 2009, after the severe strains that affected the market from September 2008 onwards. Though not without the occasional setback, this process has continued but has yet to reach completion, despite the substantial flow of liquidity injected into the system by central banks. Swap rates for the most significant maturities for CDP closed 2009 up very slightly on year-end 2008, having fluctuated over the course of the year. Against this backdrop, CDP gradually accrued a moderately positive exposure to a rise in interest rates, owing both to developments in rate-sensitive assets and liabilities, and the company’s decision to close the hedge portfolio against ordinary bonds early.

Report and Financial Statements at 31 December 2009
88
Overall exposure to interest rates11 rose from -€0.5 million at year-end 2008 to +€9 million at year-end 2009. Exposure to inflation, mainly regarding issues of postal savings bonds indexed to the consumer price index for blue-collar and office worker households expanded from -€2.3 million at the end of 2008 to -€4.9 million at the end of 2009. Despite the fact that CDP had accrued a moderately positive exposure to parallel shifts in the yield curve, interest rate VaR12 (entirely associated with the banking book exposure, as there was no trading activity) has gradually diminished, reflecting an end of the exceptional market conditions experienced in 2008. The number of overshoots found during backtesting for 2009 and the two-year period 2008-2009 was statistically in line with the confidence interval adopted (99%).
4.4.1.4 Liquidity risk CDP’s main source of funding is state-backed postal savings funds, which is wholly repayable on demand (passbook savings accounts) or in any event redeemable early (bonds). In 2009, despite the significant impetus that CDP gave to lending, the balance held on the treasury current account, on which this funding is held, increased further, ensuring ample coverage of the funding liability. The conditions on CDP’s fund-raising on the capital market, which is used to finance lending under the Ordinary Account, improved substantially compared with the acute stage of the credit crisis, though spreads continue to be relatively high compared with the period prior to the crisis. For more information on risks and related hedging policies, see the notes to the financial statements.
4.4.1.5 Legal disputes As concerns pending litigation, it should be noted that the total number of disputes remained insignificant in absolute terms. The potential liabilities that might be generated by disputes with customers and employees are also insignificant. 11 Defined as exposure to an increase of 1 basis point in zero-coupon yields across all maturities. 12 Value at Risk, a metric that takes into account exposure to all risk factors, their volatility and how they interact. CDP calculates VaR to over a confidence interval of 99% at a 10-day horizon. This means that CDP’s VaR represents a loss of value that would only be exceeded in the least favourable 1% of cases over a 10-day time horizon. VaR calculations adopt a statistical model that uses historic market data to estimate the distribution of future profits and losses.

Report and Financial Statements at 31 December 2009
89
With regard to Separate Account customers, at 31 December 2009, 38 suits were pending with a total estimated liability of no more that €40 thousand. There are no situations that concern serial disputes that could suggest the presence of critical issues in procedures or compliance with related laws and regulations. There are currently no pending disputes in relation to the Ordinary Account and, therefore, no potential liabilities for CDP. As regards company disputes not related to customer operations, as at 31 December 2009, 47 lawsuits were pending (of which 43 regarding labour issues), for which the total estimated liability does not exceed €1.6 million.
4.4.2 REPORT ON CORPORATE GOVERNANCE AND OWNERSHIP STRUCTURE: MAIN CHARACTERISTICS OF THE RISK MANAGEMENT AND INTERNAL CONTROL SYSTEM WITH REGARD TO SEPARATE AND CONSOLIDATED-LEVEL FINANCIAL DISCLOSURE, PURSUANT TO ARTICLE 123-BIS.2 B) OF THE CONSOLIDATED LAW ON FINANCIAL INTERMEDIATION
4.4.2.1 The internal control system CDP has developed an internal control system consisting of a set of rules, procedures, and organisational structures designed to detect, measure, monitor, and control the risks associated with the company’s activities, in compliance with corporate strategies and targets set by company management. First level controls (line controls) are conducted by operational and administrative units. These controls are built into organisational procedures and are designed to ensure that operations are carried out correctly. Second level controls (risk management controls) are carried out by separate organisational units and are designed to help establish risk measurement methodologies and verify that the limits set for operational departments are respected, as well as verifying that operational activities and results achieved by production units comply with their allocated risk objectives and performance targets. Finally, third level controls are performed by the Internal Auditing unit, which reports directly to the Chief Executive Officer and the Chairman of the Board of Directors. These controls consist of ongoing independent verification of CDP’s operational activities and processes, with the objective of preventing or identifying risks and irregularities. The Internal Auditing unit assesses the overall internal control system and its ability to ensure that corporate processes are efficient and effective, safeguard

Report and Financial Statements at 31 December 2009
90
company and investor assets, guarantee the reliability and integrity of accounting and management information, and compliance with internal and external regulations and management guidelines. Internal Auditing draws on the available information to assess the risks generated by corporate activities and processes in terms of their potential to negatively impact the ability to achieve the company’s strategic, operational, reporting and compliance objectives. The Internal Auditing unit subsequently uses this assessment to prepare an audit plan, which is approved by the Board of Directors. Critical issues identified during examinations are quickly brought to the attention of the relevant company units so that they can implement corrective actions. These actions are subsequently checked by Internal Auditing in its follow-up activities. The Board of Directors and the Board of Auditors are briefed on a quarterly basis of the unit’s assessments of the internal control system and the findings of inspections. Finally, Internal Auditing advises CDP units on enhancing the effectiveness of internal control activities, and assists the manager in charge of preparing company financial reports (the financial reporting manager) and the Supervisory Body established pursuant to Legislative Decree 231/01.
4.4.2.2 Systems for managing financial and operational risks The guidelines governing CDP’s risk management policies are summarised in the Risk Management Rules and approved by the Board of Directors. They envisage the separation of roles and responsibilities in the assumption and control of risks; the organisational independence of risk control from the operational management of risks; and rigorous risk measurement and control systems. The Risk Management unit ensures compliance with these Rules. In order to manage risks regarding positions under the Ordinary Account and Separate Account lending to private borrowers pursuant to Decree Law 185 of 29 November 2008, CDP uses a validated proprietary model to calculate portfolio credit risk, taking account of Separate Account exposures to public entities. Counterparty risk associated with derivative transactions is monitored on a weekly basis by the Risk Management unit using a proprietary tool.

Report and Financial Statements at 31 December 2009
91
The Risk Management unit monitors interest rate risk on the structural portfolio on a daily basis, using a proprietary system based on an economic value approach. CDP also uses a dynamic ALM system (DALM) to generate multi-year simulations of risk exposure and net interest income, using a variety of interest rate scenarios. In order to monitor the liquidity risk of the Separate Account, Risk Management regularly analyses the volume of liquid assets compared with the volume of demand liabilities and liabilities exposed to the risk of early repayment, verifying compliance with the limits established under the Risk Management Rules. A new proprietary tool was added in 2009 to generate liquidity gap analyses for the Ordinary Account in order to identify short-, medium- and long-term imbalances. Finally, towards the end of 2009 an operational risk assessment project was launched with a view to identifying appropriate mitigation mechanisms, where necessary.
4.4.2.3 Compliance system pursuant to Legislative Decree 231/01 CDP S.p.A. has adopted a compliance system (an “organisation, management and control model pursuant to Legislative Decree 231/2001”). Approved by the Board of Directors in January 2006, the model identifies the company areas and operations that are most exposed to the risk of criminal activity as defined in the decree, along with the principles, rules and regulations for the control system introduced to supervise “sensitive” operating activities. The Supervisory Board is tasked with overseeing the operation of and compliance with the model and with updating its content and assisting the competent company bodies in the task of implementing the model correctly and effectively. CDP’s Supervisory Body has three members: an expert in legal affairs, an expert in economic issues, and the head of Internal Auditing, who are appointed by the Chairman of the Board of Directors. The Supervisory Body was first established in 2004 and reappointed in 2007 at the end of its three-year term. In 2008, a new external member joined the Board to replace a member who had resigned. The Supervisory Body has drafted its own internal rules and defined the approach to be followed in supervising the model. As noted above, it has been supported by the Internal Auditing unit in ongoing, independent monitoring of the appropriate operation of company processes, as well as oversight of the
Report and Financial Statements at 31 December 2009
92
internal control system as a whole. The Supervisory Body met on six occasions during 2009. The principles of Cassa Depositi e Prestiti’s compliance model can be viewed in the “Chi siamo” section of the corporate website at: http://www.cassaddpp.it/cdp/Areagenerale/Chisiamo/index.htm.
4.4.2.4 Key characteristics of the risk and internal control management systems with regard to the financial reporting process 1) Introduction Cassa Depositi e Prestiti S.p.A. is fully aware that financial reporting plays a key role in establishing and maintaining positive relations between the company and its stakeholders. The internal control system, which oversees the company’s reporting processes, is set up to ensure that information is reliable, accurate and timely, in compliance with the applicable accounting standards. The company’s control system is structured to comply with the model adopted in the CoSO Report,13 and as such is subdivided into five components (control environment, risk assessment, control activity, information and communication, and monitoring), which function at the organisational unit and/or operating/administrative process level, depending on their characteristics. In line with the model, the controls are monitored on a periodic basis in order to assess their operational effectiveness and efficiency over time. The company has adopted the internationally-recognised Control Objectives for Information and related Technology (CObIT) framework to assess and organise its internal control system in the information and communication technology area. The initial phase of system implementation is now complete, following the definition of the maturity model. This model has been used to gauge CDP’s general level of maturity, and to draw up strategies that ensure alignment. The upgrade process is currently under way. 2) Description of the key characteristics of the existing risk management and internal control system with regard to financial reporting A risk-based approach has been chosen for the internal control system applied to the financial reporting process, in which the focus is on the key administrative and accounting procedures for CDP financial reporting. In addition to administrative and accounting procedures in the strict sense, business, management, control and support processes with a significant impact on the accounts are also taken into consideration.
13 Committee of Sponsoring Organisations of the Treadway Commission.

Report and Financial Statements at 31 December 2009
93
The control model is based on an initial company-wide analysis of the control system in order to verify that the environment is, generally speaking, organised to reduce the risk of error or improper conduct with regard to the disclosure of accounting and financial information. This analysis is undertaken by verifying the presence of appropriate elements, ranging from adequate governance systems to ethical and integrity-based standards of conduct, effective organisational structures, clear assignment of powers and responsibilities, an appropriate risk management policy, disciplinary systems for personnel, and effective codes of conduct. At process level, the approach consists of an assessment phase to identify specific risks which, if the risk event were to occur, might prevent the rapid and accurate identification, measurement, processing and representation of corporate events in the accounts. This process involves the development of risk and control association matrices that are used to analyse processes on the basis of their risk profiles and the associated control activities. The process level analysis is structured as follows:
• an initial phase identifies risks and defines control objectives in order to mitigate those risks;
• a second phase regards identification and evaluation of controls by: - identifying the type of control;
- evaluating the potential effectiveness of the control activity in risk mitigation terms;
- assessment/presence of control record; - formulation of an overall judgement by correlating the control’s potential effectiveness and the traceability of the control;
- identification of key controls; • the third phase consists of identifying areas of improvement regarding the
control: - traceability of the control; - design of the control. Monitoring the effective operation of the control system is another key component of the CoSO Report framework. This activity is undertaken on a regular basis, addressing the periods covered by the reporting. The CDP S.p.A. monitoring phase is structured as follows:
• sampling of items for testing; • test execution; • weighting of any anomalies detected, and an associated assessment.

Report and Financial Statements at 31 December 2009
94
In order to ensure that the system described above functions properly, CDP has established a system for the integrated action of multiple units/functions. The Organisational Development unit is responsible for process design and formalisation; the financial reporting manager’s function is involved during the risk assessment phase; and the Internal Auditing unit is responsible for the monitoring and assessment phase. The Board of Directors and the Board of Auditors are briefed on a quarterly basis of Internal Auditing’s assessments of the internal control system and the findings of inspections. In compliance with the related internal rules, at every balance sheet date the financial reporting manager reports to the Board of Directors on the outcome of his activities, any shortcomings that may have been detected, and initiatives undertaken to address them.
4.4.2.5 Independent auditors CDP’s financial statements are audited by KPMG S.p.A. During the course of the financial year, the independent auditors are responsible for verifying that the company keeps its accounts properly and that it appropriately records events that occur during the year in the company’s accounts. Furthermore, the independent auditors check that the individual and consolidated financial statements are consistent with the records in the accounts and audits conducted, and that these documents comply with applicable regulations. The independent auditors issue an opinion on the individual and consolidated financial statements, and on the half-year interim report. The independent auditors are appointed by the Shareholders’ Meeting in ordinary session, acting on a reasoned proposal put forward by the control body. The current independent auditors were appointed in execution of a resolution of the April 2007 Shareholders’ Meeting, which engaged the company to audit the financial statements and accounts for the 2007-2010 period.

Report and Financial Statements at 31 December 2009
95
4.4.2.6 Manager responsible for the preparation of the company’s financial reports As of closure of the 2009 financial year, the manager responsible for the preparation of the financial reports (the financial reporting manager) was the head of the Administration and Control department. For more information on the experience requirements and methods for appointing and substituting the financial reporting manager, the provisions of Article 24-bis of CDP S.p.A.’s articles of association are reported below. Article 24-bis CDP S.p.A. articles of association
1. Subject to the prior opinion of the Board of Auditors, the Board of Directors appoints the manager responsible for the preparation of the financial reports for a period of time not shorter than the term of office of the Board of Directors and not longer than six financial years to perform the duties assigned to such manager under Article 154-bis of Legislative Decree 58 of 24 February 1998.
2. The manager responsible for the preparation of the financial reports shall meet the integrity requirements provided for the Directors.
3. The manager responsible for the preparation of the financial reports shall be chosen in accordance with criteria of professional experience and competence from among the managers who have global experience of at least 3 years in the administrative area at consulting firms or companies or professional firms.
4. The manager responsible for the preparation of the financial reports may be replaced by the Board of Directors only for just subject, having obtained the prior opinion of the Board of Auditors.
5. The appointment of the manager responsible for the preparation of the financial reports shall lapse if such manager should not continue to meet any of the requirements for the office. The Board of Directors shall declare such lapse within thirty days from the date on which they become aware of the supervening failure to meet the requirements.
In order to ensure that the financial reporting manager has resources and powers commensurate with the nature and complexity of the activities to be performed and with the size of the company, and to ensure that such manager is able to perform the duties of the position, including in relations with other company bodies, in July 2007 the Board Of Directors approved the “Internal Rules for the Financial Reporting Manager Function”.

Report and Financial Statements at 31 December 2009
96
In addition to holding a senior management position reporting directly to top management, the financial reporting manager may:
• access without restriction all company information considered relevant to the performance of his duties;
• interact on a regular basis with the company’s administrative and control bodies;
• audit any company process that impacts the reporting process; • make use of other company units to design and amend processes
(Organisational Development) and check the adequacy and effective application of procedures (Internal Auditing);
• have at his disposal dedicated personnel and independent powers of expenditure within an approved overall budget.
4.4.2.7 Insider register In 2007, in its role as a party with a controlling relationship over Terna S.p.A. (listed on the stock exchange organised by Borsa Italiana S.p.A.) and in compliance with Article 115-bis of the Consolidated Law on Financial Intermediation, CDP has set up a “Register of persons with access to Terna S.p.A. privileged information”, and approved the rules for maintaining this register. Subsequently, in compliance with requirements of Luxembourg law applicable to instruments listed in Luxembourg (regarding the bonds issued under the EMTN programme), CDP also set up a “Register of persons with access to Cassa Depositi e Prestiti S.p.A. privileged information”, governed by the related rules. In both cases, the rules governing these registers comply with regulations and procedures for storing and updating the register concerned. Among other things, the rules establish criteria for identifying which parties, owing to their position or the duties that they perform on a regular or occasional basis, have access to privileged information directly or indirectly concerning CDP, Terna and their subsidiaries. They also set out criteria regarding the prerequisites and timing of entry in the register, as well as obligations on registered parties, and penalties applicable to breaches of such obligations under each set of regulations and applicable law. The Legal and Corporate Affairs unit is responsible for maintaining and updating both of these registers.

Report and Financial Statements at 31 December 2009
97
4.4.2.8 Code of Ethics With a resolution taken by the Board of Directors on 17 January 2006, CDP adopted a Code of Ethics that establishes a set of values accepted and shared throughout the entire organisation that inform how CDP conducts its business. The principles and provisions enshrined in the Code provide a cornerstone for all activities undertaken in pursuit of the company’s mission. According to the Code, in-house and external relations shall be conducted on the principles of honesty, moral integrity, transparency, reliability and a sense of responsibility. The Code is binding on all directors, all CDP employees and everybody who works for the company, regardless of the nature or duration of their relationship. The principles and provisions of the Code disseminated primarily through publication on the corporate intranet. A copy of the Code is also given to all new employees. Compliance with the Code is an essential part of contractual obligations, and is governed by a disciplinary code. In 2009 there were no breaches of the Code by CDP employees or associates.
4.4.3 COMMUNICATIONS An “External Relations” unit was established in 2009. The new unit absorbed the previous External Communication area, and further extended its activities. The unit’s objective is to enhance and promote the company’s image, activities and products through relations with institutions, key stakeholders and the media. Institutional relations This area involves management of relations with key institutional stakeholders (shareholders, ministries, members of Parliament, investee companies, and supervisory authorities), and building long-term working relationships with domestic and international institutional bodies. The main objective is to raise the profile of the “new CDP” among stakeholders, highlighting Cassa’s enhanced capacity for funding investments and public interest works. These activities have given rise to a number of initiatives, including advertising campaigns and company roadshows. External communication The focus here is on consolidating CDP’s image among traditional customers, public entities and postal savers, as well as promoting new initiatives for financing public interest projects and the opportunities that these initiatives open up for private enterprise. External communication activities span media relations, corporate communications and web communication.

Report and Financial Statements at 31 December 2009
98
In 2009, media relations featured campaigns through the main media explaining new laws that affect CDP, including interviews and press conferences. During the year, CDP ran the “Reacting to the Crisis” advertising campaign, in partnership with ABI and SACE, under the patronage of the Ministry for the Economy and Finance. The campaign was conceived to inform the public about new opportunities for Italian companies and families to improve access to credit and liquidity, at a critical time for the domestic and international economy. These instruments were activated and bolstered by the government in 2009, and delivered via CDP and SACE, with support from banks. In support of postal funding activities, the unit supported Poste Italiane in a marketing campaign designed to improve perceptions of the safety of postal savings bonds and passbooks by focusing on the reliability of the issuer (CDP) and the state guarantee. Similar initiatives were undertaken to develop the image and launch of the “Librettopostale CARD”, an electronic chip card for holders of ordinary registered postal passbook accounts. CDP’s participation at events confirmed the company’s focus on its traditional clientele. Once again in 2009, CDP was at its headline events, including the annual assembly of the National Association of Italian Municipalities (ANCI), the National Association of Small Italian Municipalities (ANCI Piccoli Comuni), and the Association of Local Authority Accounting Professionals (ARDEL). CDP was also the main sponsor of the MEF-OECD workshop on “development opportunities to boost the L’Aquila regional economy in the wake of the earthquake”, and held corporate events associated with its participation (together with the EIB and other leading European public financial institutions) in the “Marguerite” and “Inframed” infrastructure funds, and in the Long-Term Investors Club. Finally, in 2009 a press campaign ensured the constant presence of CDP in the financial press, specialist business press and on multimedia information platforms. As regards mandatory financial publicity, the goal of achieving complete transparency of financial terms and conditions for customers (loans to local authorities) and savers (postal savings bonds and passbooks) was pursued through a constant presence in major economic and financial media. Targeted investments were also made in communication directed at traditional customers. As regards web communication, in 2009 an initial radical overhaul of CDP’s website was completed, covering both its graphics and the adoption of a more

Report and Financial Statements at 31 December 2009
99
functional navigation model, as well as the creation of reserved access areas to enable interactive customer relationships.
4.4.4 HUMAN RESOURCE MANAGEMENT
4.4.4.1 The workforce At 31 December 2009 CDP S.p.A. had 414 employees:
• 37 executives
• 146 middle managers
• 231 office staff.
The workforce increased by nine employees compared with the previous year. The average age of employees was 47. The percentage of university graduates increased by two points to 46% of the total. Staff recruitment in 2009 focused on strengthening company skills by adding specialist employees and high-potential young employees to a number of units. Recruitment benefited from a constant increase in the number of candidates who applied on their own initiative and were added to the company database. Finally, following the liquidation of Europrogetti & Finanza, in application of the agreement reached with the other shareholders, CDP S.p.A. began hiring the first employees from that company in proportion to its share.
4.4.4.2 Personnel training and management During the course of 2009, CDP S.p.A. continued its assessment, management and training activities. Training focused on updating specialist knowledge and providing technical training to foster the development of professional skills within the company. A further focus was on the corporate training development path for managerial staff, with the support of the national fund for continuous training in the banking and insurance industries. A total of around 6,000 hours of training were provided in 2009.
4.4.4.3 Industrial relations In implementation of the accord reached with the unions on 24 July 2008, 2009 saw full application to company employees of the national collective bargaining agreement for executives and professional employees of banks, financial and ancillary services companies.

Report and Financial Statements at 31 December 2009
100
In implementation of the business plan, in the final quarter of the year early retirement incentive procedures were begun for employees who will be eligible as at 31 December 2010 for seniority or old-age pensions. Twenty-seven employees applied for early retirement, and will be leaving active service by 30 September 2010.
4.4.5 IT SYSTEMS AND INTERNAL PROJECTS Projects undertaken in 2009 were targeted at implementing application solutions to support CDP’s new lines of activity, and increasing automation in existing operational processes. In the lending sector, the allocation of funds to support SMEs and urgent interventions in favour of those affected by the earthquake in the Abruzzo Region prompted a number of changes to systems, notably upgrades to procedures for managing relations with the banking sector. As part of this process, loans were renegotiated with municipalities affected by the earthquake via a web application which enabled these towns to file applications and access simulations that interfaced directly with the CDP system. Support functions for managing the Revolving Fund for enterprises were completed, as were initiatives to manage a number of loans granted out of the fund. Also in 2009, research work began on designing and implementing an application solution to support management of Kyoto Fund loans. In the finance sector, a feasibility study was completed for the “Finance Systems Integration” project, while the related project for completing the front-office system and achieving integration with the finance operations back-office system began. Other work was carried out to support treasury activities and management of open market operations with the ECB. A reporting function was implemented for postal savings, and the forecasting subsystem underwent further refinement. In the Risk Management sector, work was completed on systems for date input to the proprietary credit risk monitoring model. Work is close to completion on the measures needed to ensure compliance with statutory reporting obligations and on the outsourcing of services for management of the entire money laundering, tax register and financial investigations reporting process prior to the Bank of Italy’s 1 June 2010 deadline.

Report and Financial Statements at 31 December 2009
101
In the sphere of security, contracts have been awarded for the first stage of the Identity and Access Management (IAM) project. Identity and access management is a core part of data security. The main objectives of the project are to define and standardise identity management procedures and centralise data input from a variety of system technologies in order to manage this information centrally and in a unified manner (during this initial stage, the process covers procedures which use “standard” authentication systems). System testing is now close to completion.
4.4.6 STATE OF IMPLEMENTATION OF THE PROVISIONS OF LEGISLATIVE DECREE 196 OF 30 JUNE 2003 Article 26 of Annex B to the Data Protection Act (Legislative Decree 196 of 30 June 2003) requires data controllers to state in the report accompanying the financial statements, if required, whether the Security Policy Document has been drafted or amended. CDP S.p.A. prepared its Security Policy Document and in subsequent years has disclosed in its report accompanying the financial statements when the Document was drafted and amended. The main amendments to the Security Policy Document in 2009 concerned elements introduced under the Data Protection Authority measure of 27 November 2008, as amended in a later provision dated 25 June 2009 (“Measures for data controllers involved in processing data by electronic means with regard to the functions of system administrators”). In the measure, the Authority regulates the assignment of the functions of “system administrators”, setting out requirements for those with administrator privileges, the methods to be used in designating system administrators, and further requirements connected with the position. The measure, however, excludes from its scope “controllers of data procedures that pose only minor risks to the parties to whom they refer, as they are covered by the simplification measures” (Article 29 of Decree Law 112/2008; Law 133/2008). In view of its findings, and regardless of the possible application of simplified measures, the company monitored new regulatory developments (Law 166 of 20 November 2009, and Law 15 of 4 March 2009) and Authority guidelines, and updated its Security Policy Document, which the company views as a useful data security enhancement tool.

Report and Financial Statements at 31 December 2009
102
5. RELATIONS WITH THE MEF
5.1 RELATIONS WITH THE CENTRAL STATE TREASURY
CDP S.p.A. has an interest-bearing current account, no. 29814 denominated “Cassa DP SPA – Gestione Separata”, with the Central State Treasury on which it deposits its liquidity. Pursuant to Article 6.2 of the decree of the Minister for the Economy and Finance (MEF) of 5 December 2003, interest on the funds is paid half-yearly at a floating rate equal to the simple arithmetic mean between the gross yield on six-month Treasury bills and the monthly Rendistato index.
5.2 AGREEMENTS WITH THE MEF
In accordance with the above MEF decree CDP continued to manage the administrative and accounting aspects of the relationships transferred to the MEF at the end of 2003. These activities are governed by two agreements with the MEF that set out the guidelines for the exercise of the functions performed by CDP and the fees due for such services. Both of these agreements came to an end during the year, and were renewed on 23 December 2009, retaining the existing terms and conditions. These new agreements are currently undergoing Supervisory Body approval. The first agreement governs the methods by which CDP manages existing relations as of the transformation date, resulting from the postal savings bonds transferred to the MEF (Article 3.4, c) under the ministerial decree cited above). Based on this agreement, in addition to settling cash flows and managing relations with Poste Italiane S.p.A., CDP provides the following services to the MEF:
• financial reporting; • the periodic provision of information, both actual and forecasts, on bond
redemptions and stocks; • monitoring and management of the treasury accounts established for the
purpose.

Report and Financial Statements at 31 December 2009
103
The second agreement concerns the management of the loans and relations transferred to the MEF pursuant to Article 3.4, a), b), e), g), h) and i) in the above ministerial decree. Here, too, guidelines were provided to help with the management activities by surveying such activities. In line with Article 4.2 of the aforementioned decree, CDP’s role as defined by this agreement includes carrying out disbursement, payment, and credit collection transactions, to represent the MEF in legal and other matters, to fulfil obligations, and to exercise powers and rights in the management of relations connected with the activities transferred. CDP also provides the MEF with the following services:
• a detailed report on the activities performed; • the periodic provision of information on developments in the transferred
loans and relationships, both actual and forecasts; • monitoring and management of the treasury accounts established for this
purpose. The MEF pays CDP €3 million annually for the performance of these services.
5.3 MANAGEMENT ON BEHALF OF THE MEF
With the procedures defined in these agreements, and in line with the provisions of the MEF decree of 5 December 2003, in 2009 CDP continued to conduct the activities of disbursement, collection and reporting for the assets and liabilities transferred to the MEF. On the asset side, one of the most important activities is managing the loans and other financing granted by CDP and transferred to the MEF, the residual debt of which came to €18,311 million at 31 December 2009, compared with €20,172 million at year-end 2008. The liability side includes the management of postal savings bonds assigned to the MEF, which at year-end totalled €89,713 million, compared with €89,846 million at 31 December 2008. In accordance with the above-mentioned ministerial decree, CDP continues to handle a number of activities related to specific legislative provisions, most of which are financed with state funds. The funds appropriated for these activities are deposited in non-interest-bearing treasury accounts held in the name of the MEF, although CDP is authorised to use them for the purposes envisaged in the laws establishing the programmes.

Report and Financial Statements at 31 December 2009
104
Major programmes include the following: residential building, which had funds amounting to €3,261 million at 31 December 2009; the natural gas infrastructure programme for the South, which had resources totalling €336 million; and resources for territorial agreements and area contracts, which came to €564 million.

Report and Financial Statements at 31 December 2009
105
6. OUTLOOK FOR 2010 As regards the outlook, CDP S.p.A. will continue along the path outlined in the 2009-2011 business plan, in accordance with the company’s mission and the strategic objectives defined therein. The 2010 budget essentially confirms the plan targets and trends for growth and development across CDP’s various lines of business. On the asset side, we expect liquidity to increase in 2010 as a result of higher amounts of net funding from postal savings, and reasonably strong growth in loans. This conclusion is drawn partly on the basis of the large number of loan transactions approved in 2009 (the contracts for which are being completed in early 2010) and good levels of disbursements associated with the newly-introduced measures to support the economy, the effects of which are already being felt in early 2010. Furthermore, pursuant to Antitrust Authority instructions, CDP must dispose of its equity stake in Enel S.p.A. by 1 July 2010. On the liability side, CDP expects overall funding to increase compared with 2009, almost entirely as a result of the forecast for positive postal funding performance, as MEF-issued bonds are gradually replaced by new CDP-issued bonds. On the other hand, 2010 earnings are forecast to reflect a further narrowing in margins between lending and funding compared with 2009, as a result of the significant and prolonged fall in market interest rates, which leaves no latitude for further reductions in the rates offered on funding (which are already at historic lows). That said, the company confirms the overall earnings targets set in the 2009-2011 business plan, particularly in view of the fact that the 2009 results exceeded expectations. After the downturn in early 2009, the market prices of shares held by CDP recovered over the remainder of the year. As a result, market values now exceed book values for all of CDP’s equity investments. Nevertheless, given the persistent uncertainty surrounding the world economy, share prices could experience another downturn in 2010. This might entail significant writedowns on equity investments, which may be of sufficient size to require a reduction in the company’s level of capitalisation.
Report and Financial Statements at 31 December 2009
106
Furthermore, a renewed reduction in the level of remuneration of assets compared with expectations would directly result in a drop in earnings, given the lack of scope for further reductions in funding costs mentioned above.

Report and Financial Statements at 31 December 2009
107
7. PROPOSED ALLOCATION OF NET INCOME FOR THE
YEAR We hereby submit for shareholder approval the financial statements for 2009, consisting of the balance sheet, the income statement, the statement of comprehensive income, the statement of changes in equity, the cash flow statement, and the notes to the financial statements with related annexes. The financial statements are accompanied by the directors’ report on operations. We also submit for shareholder approval the following proposal for the allocation of 2009 earnings, which total €1,724,620,650. Pursuant to Article 30 of the articles of association, having deducted the amount to be allocated to the legal reserve, we propose to allocate the net income to holders of ordinary and preference shares proportionate to the capital represented, for a total of €300,000,000. Of this, €90,000,000 is to be distributed to preference shareholders and €210,000,000 to ordinary shareholders. Furthermore, pursuant to the articles of association empowering the Shareholders’ Meeting to allocate a portion of net income to reserves, we propose the establishment of a stabilisation reserve for equity investments totalling €300,000,000. It is further proposed to retain a total of €1,038,389,617 in earnings. The Shareholders’ Meeting may make that amount available to the Board of Directors for any appropriate future uses.
ALLOCATION OF NET INCOME FOR THE YEAR (euros)
Net income 1,724,620,650
Legal reserve 86,231,032
Income available for distribution 1,638,389,617
Dividend: 300,000,000
- of which: income attributable to preference shares 90,000,000
- of which: income attributable to ordinary shares 210,000,000
Equity investment stabilisation reserve 300,000,000
Retained earnings 1,038,389,617
RESIDUAL INCOME 0
Dividend per share 0.857Dividend as percentage of share capital 8.57%
Rome, 28 April 2010 The Chairman Franco Bassanini

Report and Financial Statements at 31 December 2009
108

Report and Financial Statements at 31 December 2009
109
REPORT OF THE BOARD OF AUDITORS

Report and Financial Statements at 31 December 2009
110
Shareholders, in the course of the financial year ending 31 December 2009, we carried out our statutory supervisory activity in accordance with the standards recommended by the National Council of the Italian accounting profession, taking account of the recommendations of Consob in its communications, to the extent compatible with the status of CDP S.p.A., and in particular Communication no. DEM/1025564 of 6 April 2001 and subsequent updates.
We preface our remarks as follows:
A) the financial statements for 2009 have been prepared in accordance with the international accounting standards issued by the International Accounting Standards Board (IASB), adopted with Regulation (EC) no. 1606 on 19 July 2002, and transposed into Italian legislation with Legislative Decree 38 of 28 February 2005. The preparation of the financial statements complies with the provisions concerning bank financial statements in Bank of Italy Circular 262 of 22 December 2005 as amended;
B) the accurate recognition of operational events in the accounts and their representation in the financial statements in accordance with the IASs/IFRSs have been examined by KPMG in the performance of its auditing activities pursuant to Article 155 of Legislative Decree 58/98 (the Consolidated Law on Financial Intermediation);
C) the financial statements include both the activity of the Ordinary Account and that of the Separate Account, although the cash flows of the two accounts and their recognition are separate. The separation of these two accounts, pursuant to Article 16, paragraphs 5 and 6, of the MEF decree of 6 October 2004, involves the preparation of separate accounting statements for the sole use of the MEF and the Bank of Italy. At the end of the year, shared costs incurred by the Separate Account are computed and subsequently reimbursed on a pro-rated basis by the Ordinary Account;
D) in the separate financial statements the value of the preference shares is included, as in previous years, under “Share capital” together with that of ordinary shares. The equal accounting treatment of the two classes is justified on the basis of the preference shareholders’ repeated expression of their intent to proceed with the conversion, which the amendments to the articles of association approved in 2009 postponed until 1 January 2013;
E) in March 2009, the Competition Authority approved the request to extend the deadline it had set for the sale of the equity investment in

Report and Financial Statements at 31 December 2009
111
Enel S.p.A. by twelve months to 1 July 2010: by that date CDP will have to sell its entirely stake in Enel.
F) the financial statements for 2009 report net income of €1,725 million and shareholders’ equity of €12,170 million.
Given the above, we report that the Board of Auditors:
- participated in the Shareholders’ Meetings, as well as all meetings of the Board of Directors held during the year, and received periodic information from the directors on the activities carried out and the most significant operations conducted by the company;
- continued our monitoring of the activities undertaken by CDP S.p.A., which, in addition to attending the meetings of the Board of Directors, also included periodic meetings with the heads of the main company departments, as well as the exchange of information with the financial reporting manager and with the independent auditors, KPMG, whose audit records we examined;
- monitored the operation of the internal control and administrative/accounting systems with a view to assessing their appropriateness to company needs, as well as their reliability in representing operational facts and events;
- monitored compliance with the law and the articles of association, conformity with the principles of sound administration and in particular the appropriateness of the organisational, administrative and accounting arrangements adopted by the company with respect to its effective operations;
- verified compliance with statutory requirements concerning the preparation of the financial statements and the report on operations, also obtaining specific information and assurances from the independent auditors.
In addition, with reference to the consob communications cited earlier, we report the following information.
1. The most significant economic, financial and capital operations undertaken by the company were conducted in conformity with applicable law and the company’s articles of association. In particular, the following are to be noted:
a) in September 2009 the Board of Directors approved the company’s 2009-2011 business plan, which takes account of the regulatory changes that significantly expanded CDP’s activity in favour of the economic and social development of the country. The Plan sets out the prospects of the various CDP business lines, establishes the organisational model and the investments required to support the pursuit of its mission;

Report and Financial Statements at 31 December 2009
112
b) the portfolio of equity investments amounted to €18,230 million, an increase of around €4,377 million (31.6%) compared with 31 December 2008. This change can essentially be ascribed to a number of investments made over the year: i) subscription of the Enel S.p.A. capital increase in June 2009, with the exercise of its own option rights and those acquired from the Ministry for the Economy and Finance (for a total of around €666 million). Following the subscription of the capital increase for a price of around €2.5 billion, CDP S.p.A. held about 17.36% of Enel’s share capital. ii) acquisition, in December 2009, of a 20% stake in STMicroelectronics Holding N.V. from Finmeccanica S.p.A, corresponding to about 3.7% of STM, for a price of €172 million. Following completion of this transaction, CDP S.p.A. owns 50% of STH. The indirect holding of CDP in STM, held through STH and STMicroelectronics Holding II N.V., therefore comes to 13.77%; iii) the establishment in February 2009 of CDP Investimenti SGR S.p.A., an asset management company intended to promote rent-controlled residential housing (social housing) in Italy. CDP S.p.A. holds a 70% shareholding in the company’s capital, which amounts to a total of €2 million. On 11 January 2010, CDPI SGR received Bank of Italy authorisation to engage in collective asset management, and was therefore entered in the register of asset management companies;
c) during 2009, major amendments were made to the articles of association to bring CDP's corporate purpose into line with the changes introduced with Decree Law 185/2008 (Article 22), ratified with Law 2 of 28 January 2009, Decree Law 5/2009 (Article 3.4-bis), ratified with Law 33 of 9 April 2009 and subsequently amended by Law 191/2009, and Decree Law 78/2009 (Article 8 - “export-bank system”), ratified with Law 102 of 3 August 2009.
In essence, CDP S.p.A. can also use postal savings to grant loans to public or private entities for operations envisaged in the articles of association that are in the public interest and that are promoted by entities belonging to the public sector, taking account of the economic and financial sustainability of each such project and the creditworthiness of the parties involved. Within the new scope of operations envisaged in the law and the articles of association, an initial loan of €1,000 million was granted to Autostrade per l’Italia

Report and Financial Statements at 31 December 2009
113
S.p.A., of which half secured by a SACE guarantee, and loans totalling €1,958 million were granted through banks to support SMEs;
d) at the end of 2009, the stock of postal savings, comprising postal passbook savings accounts and postal savings bonds pertaining to CDP S.p.A., reached €191 billion, an increase of more than 9% compared with the €175 billion posted at 31 December 2008. Net funding through bonds and passbooks rose by the substantial amount of €12,585 million in the year;
e) with regard to funding under the Separate Account other than postal savings, no new issues were made as part of the covered bond programme in 2009. Conversely, on 31 July 2009, a total of €2 billion in bonds were redeemed when the first issue reached its natural maturity.
Repayment of outstanding bonds is secured by assets and rights in the segregated asset pool established pursuant to Article 5.18 of Decree Law 269/2003; these and the debt covered by the assets are shown separately in the CDP S.p.A. financial statements;
f) within the Ordinary Account, new issues under the Euro Medium-Term Notes programme amounted to €1,550 million, while buybacks under the same programme came to €450 million and redemptions to €800 million. During 2009 CDP requested new disbursements from the credit facilities held with the European Investment Bank totalling €854 million;
g) the financial statements for 2009 also report the effects of the discharge of the tax liability on tax-deferred reserves resulting from off-ledger deductions made in 2004-2007 related to writedowns of loans to customers made for tax purposes only.
This discharge of the liability, which is to be completed in 2010 with payment of a special one-off tax, resulted in the elimination of the deferred taxes recognised in relation to such deductions;
h) net income for 2009 rose by 24.1% on the previous year. The improvement was attributable to the effect of the writedown of €502 million recognised on the equity investment in STMicroelectronics Holding N.V. in 2008;
i) the substantial stock of liquidity at the end of the year, which under the statements reclassified on an operational basis came to €118,380 million, including the reserve requirement, is consistent with the role performed by CDP S.p.A. pursuant to Article 5.7 of Decree Law 269 of 30 September 2003.

Report and Financial Statements at 31 December 2009
114
2. No atypical or unusual transactions were conducted with third parties, related parties or group companies. The report on operations and the notes to the financial statements describe the main transactions conducted with third parties, outlining their characteristics and their economic impact. We also ascertained the existence of appropriate operating procedures for ensuring that commercial transactions are conducted on market terms and conditions and that they are reported in full to the Board of Directors.
3. The information provided by the directors in their report on operations is felt to be adequate.
4. The report of the independent auditors was prepared by KPMG in accordance with Article 156 of Legislative Decree 58/98 (the Consolidated Law of Financial Intermediation). The auditors have made no specific observations that might be reflected in comments or qualifications in their report.
5. The Board of Auditors received no complaints pursuant to Article 2408 of the Italian Civil Code.
6. The Board of Auditors received no reports or complaints of alleged irregularities.
7. No other engagements were awarded to KPMG in 2009 other than those regarding auditing and certification services associated with the auditing engagement.
8. During the period, no engagements were awarded to parties with ongoing relationships with KPMG.
9. The Board of Auditors was not asked to provide opinions mandated by law during the year.
10. In 2009, there were a total of 11 meetings of the Board of Directors and 3 Shareholders’ Meetings, all of which were attended by the Board of Auditors. The Board of Auditors held 12 meetings. All of the latter’s meetings were attended by the judge assigned by the State Audit Court, who participated actively with comments that were always much appreciated by the Board. During the meetings, the Board examined the minutes prepared by the Support Committee, while also preparing our own minutes, which were sent to the Chairman of the company, the MEF, and the State Audit Court. The Board also examined, and took specific account of, the report of the State Audit Court on the findings of the examination performed on the financial operations of the Cassa Depositi e Prestiti S.p.A for the 2007 and 2008 financial years.
11. We have no comments on compliance with the principles of sound administration, which appear to have been respected at all times.

Report and Financial Statements at 31 December 2009
115
12. In order to handle the intense activity undertaken and new scope of operations envisaged in the expanded articles of association following the changes in the legislative framework, in 2009 CDP S.p.A. continued to renew and develop its structure, including its organisational model, which now consists of 5 business functions, 9 business support functions and 7 support, guidance and control functions, with a workforce of 414 people, of whom 37 executives, 146 middle managers and 231 office staff. In addition, in the final quarter of the year early retirement incentive procedures were begun for employees who will be eligible as at 31 December 2010 for seniority or old-age pensions.
In 2009 work continued on assessing training needs and implementing training projects.
Training focused on updating specialist knowledge and providing technical training as well as developing positions skills. Training investment was aimed not only at professional skills but also at instilling values, boosting motivation and improving organisational behaviour, with the objective of fostering the development and integration of CDP S.p.A.’s staff.
Some 6,000 hours of total training were provided. The initiatives mainly regarded:
- updating on the regulatory and financial issues directly pertaining to the activity of CDP;
- specific professional updating on the basis of job duties; - institutional role training; - procedural training to support process innovation; - IT and language training.
During the year an institutional training programme was designed and implemented for the professional development of management with the support of the national fund for continuous training in the banking and insurance industries.
The training programme involved management staff and the first two modules were conducted during the year.
13. We monitored the adequacy of the internal control system and can report that during 2009 control and follow-up activities by Internal Auditing proceeded normally. The unit’s work was based on the preliminary analysis of company risks, in line with the objectives set out in the annual plan approved by the Board of Directors on 27 January 2009. In implementation of Article 154-bis of the Consolidated Law on Financial Intermediation (the manager responsible for the preparation of corporate financial reports), CDP S.p.A. continued its activities to ensure compliance with Law

Report and Financial Statements at 31 December 2009
116
262/2005, which in relation to the 2009 financial statements envisaged the preparation of a testing plan to ascertain the effectiveness of the internal control system for financial reporting, to be performed by Internal Auditing. The latter also continued to provide support to the Supervisory Body envisaged in Legislative Decree 231/01, and was designated as the unit responsible for exchanging information with the supervisory authorities on “suspicious” transactions for the purposes of the transposition of the 3rd EC Directive referred to in Legislative Decree 231/07 concerning the prevention of money laundering.
14. The administrative/accounting system appears sufficiently reliable in presenting operational facts, including in the light of the statements in that regard by KPMG, although there is room for improvement and initiatives are already being studied by the appropriate CDP S.p.A. units.
15. Where necessary, the company issued appropriate instructions to subsidiaries to ensure compliance with statutory disclosure requirements.
16.No significant matters emerged during the course of the periodic exchanges of information between the Board of Auditors and the independent auditing firm that would require comment here.
17. As it is not listed on an exchange, the company has not applied the Corporate Governance Code for listed companies.
18. Within the scope of our supervisory activities, we did not find any omissions, censurable facts or irregularities that would need to be reported to the control bodies or in this document.
19. Considering the preliminary information received from the financial reporting manager concerning the activities performed, which indicate the absence of critical issues, we affirm that, within the scope of our functions, our supervisory activities did not reveal any omissions, censurable facts or irregularities that would need to be reported to the shareholders and, therefore, there are no impediments to approving the financial statements for the 2009 financial year together with the report on operations submitted by the Board of Directors.
Rome, 8 April 2010
THE BOARD OF AUDITORS
Alberto SABATINI Chairman

Report and Financial Statements at 31 December 2009
117
Mario BASILI Auditor
Biagio MAZZOTTA Auditor
Antonio Angelo ARRU Auditor
Francesco BILOTTI Auditor

Report and Financial Statements at 31 December 2009
118

Report and Financial Statements at 31 December 2009
119
REPORT OF THE INDEPENDENT AUDITORS

Report and Financial Statements at 31 December 2009
120

Report and Financial Statements at 31 December 2009
121

Report and Financial Statements at 31 December 2009
122

Report and Financial Statements at 31 December 2009
123
CERTIFICATION OF THE SEPARATE FINANCIAL
STATEMENTS pursuant to Article 154-bis of Legislative Decree 58/98

Report and Financial Statements at 31 December 2009
124
Certification of the separate financial statements pursuant to Article 81-ter of Consob Regulation no. 11971 of 14 May 1999 as amended 1. The undersigned Massimo Varazzani, in his capacity as Chief Executive Officer, and Andrea Novelli, in his capacity as the manager responsible for the preparation of the financial reports of Cassa Depositi e Prestiti S.p.A., hereby certify, taking account of the provisions of Article 154-bis, paragraphs 3 and 4, of Legislative Decree 58 of 24 February 1998:
• the appropriateness with respect to the characteristics of the company and • the effective adoption
of the administrative and accounting procedures for the preparation of the separate financial statements in 2009. 2. In this regard: 2.1 the assessment of the appropriateness of the administrative and accounting procedures followed in preparing the separate financial statements at 31 December 2009 was based on a process developed by Cassa Depositi e Prestiti S.p.A. in line with the Internal Control – Integrated Framework issued by the Committee of Sponsoring Organisations of the Treadway Commission, which is a generally accepted framework at the international level; 2.2 in 2009 the manager responsible for the preparation of the financial reports of Cassa Depositi e Prestiti S.p.A. assessed the adequacy and effective adoption of existing administrative and accounting procedures, with reference to the internal control system for financial reporting, and continued the upgrading of administrative and accounting procedures, beginning to extend the scope of the process to encompass specific activities concerning information technology. The process of upgrading these procedures therefore requires further activities for its completion. 3. In addition, we certify that: 3.1 the separate financial statements: a) have been prepared in compliance with the international accounting standards adopted in the European Union pursuant to Regulation (EC) no. 1606/2002 of the European Parliament and of the Council of 19 July 2002; b) correspond to the information in the books and other accounting records; c) provide a true and fair representation of the performance and financial position of the issuer; 3.2 the report on operations contains a reliable analysis of operations and performance, as well as the situation of the issuer, together with a description of the main risks and uncertainties to which it is exposed. Rome, 12 April 2010 Chief Executive Officer Manager responsible for the preparation of the financial reports Massimo Varazzani Andrea Novelli
This report has been translated into the English language solely for the convenience of international readers.

Report and Financial Statements at 31 December 2009
125
FINANCIAL STATEMENTS
(YEAR ENDED 31 DECEMBER 2009)

Report and Financial Statements at 31 December 2009
126
FORM AND CONTENT
OF THE FINANCIAL STATEMENTS AT 31 DECEMBER
2009
The financial statements at 31 December 2009 have been prepared in conformity
with the applicable regulations and are composed of:
BALANCE SHEET;
INCOME STATEMENT;
STATEMENT OF COMPREHENSIVE INCOME;
STATEMENT OF CHANGES IN EQUITY;
CASH FLOW STATEMENT;
NOTES TO THE FINANCIAL STATEMENTS.
The notes to the financial statements are composed of:
INTRODUCTION
PART A – Accounting policies
PART B – Information on the balance sheet
PART C – Information on the income statement
PART D – Comprehensive income
PART E – Information on risks and related hedging policies
PART F – Capital
PART H – Transactions with related parties
PART L – Operating segments
The section “Annexes”, which is an integral part of the notes to the financial
statements, includes a list of equity investments held by CDP and the separate

Report and Financial Statements at 31 December 2009
127
schedules showing the contribution of the Separate Account and the Ordinary
Account to company results.

Report and Financial Statements at 31 December 2009
128

Report and Financial Statements at 31 December 2009
129
FINANCIAL STATEMENTS
AT 31 DECEMBER 2009
Balance sheet
Income statement
Statement of comprehensive income
Statement of changes in equity
Cash flow statement

Report and Financial Statements at 31 December 2009
130
(euros)
BALANCE SHEET
Assets 31/12/2009 31/12/2008
10. Cash and cash equivalents 114,688,739,285 105,269,043,064
20. Financial assets held for trading 868,511,043 400,990,768
40. Financial assets available for sale 13,991,312,479 9,775,231,397
50. Financial assets held to maturity 205,285,358 205,794,907
60. Loans to banks 5,974,479,656 4,784,305,085
70. Loans to customers 85,623,841,033 84,061,306,451
of which securing covered bonds 15,293,457,623 16,542,633,865
80. Hedging derivatives 331,603,338 100,620,152
100. Equity investments 4,486,902,309 4,305,253,564
110. Property, plant and equipment 203,917,935 207,859,820
120. Intangible assets 6,571,704 6,378,596
130. Tax assets 599,747,355 635,901,612
a) current 573,810,266 543,613,578
b) deferred 25,937,089 92,288,034
150. Other assets 72,970,939 36,245,997
Total assets 227,053,882,434 209,788,931,413

Report and Financial Statements at 31 December 2009
131
(euros)
BALANCE SHEET
10. Due to banks 2,674,297,280 693,603,829
20. Due to customers 100,459,935,780 92,281,092,694
of which amounts to be disbursed on loans securing covered bonds
1,099,699,241 1,476,182,991
30. Securities issued 108,268,862,199 103,507,258,860
of which covered bonds 6,382,221,908 8,287,062,673
40. Financial liabilities held for trading 782,976,639 382,376,686
60. Hedging derivatives 825,662,805 1,271,550,763
70. Adjustment of financial liabilities hedged generically (+/-) 66,477,577 16,699,410
80. Tax liabilities 541,399,082 926,680,468
a) current 410,472,190 570,807,543
b) deferred 130,926,892 355,872,925
100. Other liabilities 1,254,387,345 984,585,352
110. Staff severance pay 697,292 690,848
120. Provisions 8,974,217 8,005,040
b) other provisions 8,974,217 8,005,040
130. Valuation reserves 2,136,388,575 1,162,184,469
160. Reserves 4,809,202,993 3,664,760,473
180. Share capital 3,500,000,000 3,500,000,000
200. Net income for the period (+/-) 1,724,620,650 1,389,442,521
Total liabilities and shareholders’ equity 227,053,882,434 209,788,931,413
31/12/2009 31/12/2008Liabilities and shareholders’ equity

Report and Financial Statements at 31 December 2009
132
(euros)
INCOME STATEMENT
10. Interest income and similar revenues 7,559,832,232 8,139,036,190
20. Interest expense and similar charges (5,565,695,035) (5,779,535,533)
30. Net interest income 1,994,137,197 2,359,500,657
40. Commission income 8,248,760 6,708,765
50. Commission expense (917,567,977) (736,180,690)
60. Net commission income (909,319,217) (729,471,925)
70. Dividends and similar revenues 971,150,211 1,051,256,089
80. Net gain (loss) on trading activities 117,638,074 (12,084,862)
90. Net gain (loss) on hedging activities (26,116,592) (145,073,428)
100. Gains (losses) on disposal or repurchase of: 14,605,104 8,027,996a) loans 13,653,125 7,403,139b) financial assets available for sale 951,979 -
d) financial liabilities - 624,857
120. Gross income 2,162,094,777 2,532,154,527
130. Net impairment adjustments of: (1,218,345) (23,863,316)a) loans (1,218,345) (23,863,316)
140. Financial income (expense), net 2,160,876,432 2,508,291,211
150. Administrative expenses: (71,036,279) (65,562,076)a) staff costs (44,502,974) (40,102,503)b) other administrative expenses (26,533,305) (25,459,573)
160. Net provisions 374,188 (1,214,001)
170. Net adjustments of property, plant and equipment (6,662,052) (6,767,142)
180. Net adjustments of intangible assets (2,349,819) (1,886,654)
190. Other operating income (costs) 1,238,866 889,019
200. Operating costs (78,435,096) (74,540,854)
210. Gains (losses) on equity investments - (504,542,652)
250. Income (loss) before tax from continuing operations 2,082,441,336 1,929,207,705
260. Income tax for the period on continuing operations (357,820,686) (539,765,184)
270. Income (loss) after tax on continuing operations 1,724,620,650 1,389,442,521
290. Income (loss) for the period 1,724,620,650 1,389,442,521
31/12/2009 31/12/2008

Report and Financial Statements at 31 December 2009
133
(thousands of euros)
STATEMENT OF COMPREHENSIVE INCOME
31/12/2009 31/12/2008
10. Income (loss) for the period 1,724,621 1,389,443
Other comprehensive income net of taxes
20. Financial assets available for sale 973,580 (5,572,569)
60. Cash flow hedges 624 (1,531)
110. Total other comprehensive income net of taxes 974,204 (5,574,100)
120. Comprehensive income (items 10+110) 2,698,825 (4,184,657)

Report and Financial Statements at 31 December 2009
134
(thousands of euros)
STATEMENT OF CHANGES IN EQUITY
Rese
rves
Div
iden
ds
an
d o
ther
alloca
tion
s
Issu
e o
f n
ew
sh
are
s
Pu
rch
ase
of
ow
n s
hare
s
Sp
eci
al d
ivid
en
d d
istr
ibu
tio
n
Ch
an
ges
in e
qu
ity in
stru
men
ts
Deri
vati
ves
on
ow
n s
hare
s
Sto
ck o
pti
on
s
Share capital: a) ordinary shares 2,450,000 2,450,000 2,450,000 b) preference shares 1,050,000 1,050,000 1,050,000
Share premium reserve
Reserves: a) income 3,664,760 3,664,760 1,144,443 4,809,203 b) other
Valuation reserves: a) available for sale 994,036 994,036 973,580 1,967,616 b) cash flow hedges 576 576 624 1,200 c) other reserves - revaluation of property 167,572 167,572 167,572 Equity instruments
Treasury shares
Income (loss) for the period 1,389,443 1,389,443 (1,144,443) (245,000) 1,724,621 1,724,621
Shareholders’ equity 9,716,387 9,716,387 - (245,000) 2,698,825 12,170,212
Bala
nce
at
1.1
.09
Allocation of net income for previous year
Ch
an
ges
in o
pen
ing
bala
nce
Changes for the period
Sh
are
ho
lders
' eq
uit
y a
t 3
1.1
2.0
9
Ch
an
ges
in r
ese
rves
Equity transactions
Com
pre
hen
sive in
com
e f
or
20
09
Bala
nce
at
31
.12
.08

Report and Financial Statements at 31 December 2009
135
(thousands of euros)
STATEMENT OF CHANGES IN EQUITY
Rese
rves
Div
iden
ds
an
d o
ther
alloca
tion
s
Issu
e o
f n
ew
sh
are
s
Pu
rch
ase
of
ow
n s
hare
s
Sp
eci
al d
ivid
en
d d
istr
ibu
tio
n
Ch
an
ges
in e
qu
ity in
stru
men
ts
Deri
vati
ves
on
ow
n s
hare
s
Sto
ck o
pti
on
s
Share capital: a) ordinary shares 2,450,000 2,450,000 2,450,000 b) preference shares 1,050,000 1,050,000 1,050,000
Share premium reserve
Reserves: a) income 2,746,235 2,746,235 918,525 3,664,760 b) otherValuation reserves: a) available for sale 6,566,605 6,566,605 (5,572,569) 994,036 b) cash flow hedges 2,107 2,107 (1,531) 576 c) other reserves - revaluation of property 167,572 167,572 167,572 Equity instruments
Treasury shares
Income (loss) for the period 1,373,525 1,373,525 (918,525) (455,000) 1,389,443 1,389,443
Shareholders’ equity 14,356,044 14,356,044 - (455,000) (4,184,657) 9,716,387
Bala
nce
at
31
.12
.07
Sh
are
hold
ers
' eq
uit
y a
t 3
1.1
2.0
8
Ch
an
ges
in r
ese
rves
Equity transactions
Com
pre
hen
sive in
com
e f
or
20
08
Bala
nce
at
1.1
.08
Allocation of net income for previous
year
Ch
an
ges
in o
pen
ing
bala
nce
Changes for the period

Report and Financial Statements at 31 December 2009
136
(thousands of euros)CASH FLOW STATEMENT (indirect method)
1. Operations 1,803,417 2,627,651 - net income for the year (+/-) 1,724,621 1,389,443 - gains (losses) on financial assets held for trading and on (117,638) - financial assets/liabilities at fair value (-/+) - 12,085 - gains (losses) on hedging activities (-/+) 26,117 145,073 - net impairment adjustments (+/-) 1,218 23,863 - net value adjustments to property, plant and equipment and intangible assets (+/-) 9,012 8,654 - net provisions and other costs/revenues (+/-) 7,418 7,506 - unpaid taxes and duties (+) 357,821 539,765 - net impairment adjustments of disposal groups held for sale net of tax effect (+/-) - - - writedowns/writebacks of equity investments (+/-) - 504,543 - other adjustments (+/-) (205,152) (3,281)
2. Cash generated by/used in financial assets (6,380,249) (5,077,815) - financial assets held for trading (263,405) (337,910) - financial assets at fair value - - - financial assets available for sale (3,187,346) (13,852) - loans to banks: on demand - - - loans to banks: other (1,018,508) (849,829) - loans to customers (1,680,358) (3,876,224) - other assets (230,632) -
3. Cash generated by/used in financial liabilities 14,602,423 17,024,239 - due to banks: on demand - - - due to banks: other 1,981,922 (569,530) - due to customers 8,178,843 4,664,010 - securities issued 4,674,964 12,976,756 - financial liabilities held for trading 314,123 298,497 - financial liabilities at fair value - - - other liabilities (547,429) (345,494)
Cash generated by/used in operating activities 10,025,591 14,574,075 B. INVESTING ACTIVITIES1. Cash generated by - - - sale of equity investments - - - dividends from equity investments - - - sale of property, plant and equipment - -
2. Cash used in (186,912) (215,033) - purchase of equity investments (181,649) (3,300) - purchase of financial assets held to maturity - (202,514) - purchase of property, plant and equipment (2,720) (6,422) - purchase of intangible assets (2,543) (2,797)
Cash generated by/used in investing activities (186,912) (215,033) C. FINANCING ACTIVITIES - dividend distribution and other allocations (245,000) (455,000)
Cash generated by/used in financing activities (245,000) (455,000) CASH GENERATED/USED DURING THE YEAR 9,593,679 13,904,042
RECONCILIATION
Cash and cash equivalents at beginning of year 105,539,039 91,634,997 Total cash generated/used during the year 9,593,679 13,904,042 Cash and cash equivalents: effects of changes in exchange rates - - Cash and cash equivalents at end of year 115,132,718 105,539,039
31/12/2008A. OPERATING ACTIVITIES 31/12/2009
Report and Financial Statements at 31 December 2009
137
NOTES TO THE
FINANCIAL STATEMENTS
(FINANCIAL STATEMENTS AT 31 DECEMBER 2009)

Report and Financial Statements at 31 December 2009
138
NOTES TO THE FINANCIAL STATEMENTS
INTRODUCTION ..................................................................................143
PART A – ACCOUNTING POLICIES .......................................................146
A.1 – GENERAL INFORMATION............................................................146
SSEECCTTIIOONN 11 –– DDEECCLLAARRAATTIIOONN OOFF CCOONNFFOORRMMIITTYY WWIITTHH TTHHEE IINNTTEERRNNAATTIIOONNAALL AACCCCOOUUNNTTIINNGG
SSTTAANNDDAARRDDSS ............................................................................................................................................................................................................ 114466
SSEECCTTIIOONN 22 –– GGEENNEERRAALL PPRREEPPAARRAATTIIOONN PPRRIINNCCIIPPLLEESS .......................................................................................................... 114466
SSEECCTTIIOONN 33 –– EEVVEENNTTSS SSUUBBSSEEQQUUEENNTT TTOO TTHHEE BBAALLAANNCCEE SSHHEEEETT DDAATTEE .................................................................... 114477
SSEECCTTIIOONN 44 –– OOTTHHEERR IISSSSUUEESS .................................................................................................................................................................. 114477
A.2 – THE MAIN FINANCIAL STATEMENT ACCOUNTS ...........................149
11 -- FFIINNAANNCCIIAALL AASSSSEETTSS HHEELLDD FFOORR TTRRAADDIINNGG.............................................................................................................................. 114499
22 -- FFIINNAANNCCIIAALL AASSSSEETTSS AAVVAAIILLAABBLLEE FFOORR SSAALLEE.......................................................................................................................... 115500
33 -- FFIINNAANNCCIIAALL AASSSSEETTSS HHEELLDD TTOO MMAATTUURRIITTYY.............................................................................................................................. 115522
44 -- LLOOAANNSS ................................................................................................................................................................................................................ 115533
66 -- HHEEDDGGIINNGG TTRRAANNSSAACCTTIIOONNSS ................................................................................................................................................................ 115555
77 -- EEQQUUIITTYY IINNVVEESSTTMMEENNTTSS ........................................................................................................................................................................ 115566
88 -- PPRROOPPEERRTTYY,, PPLLAANNTT AANNDD EEQQUUIIPPMMEENNTT ...................................................................................................................................... 115577
99 –– IINNTTAANNGGIIBBLLEE AASSSSEETTSS ............................................................................................................................................................................ 115588
1111 -- CCUURRRREENNTT AANNDD DDEEFFEERRRREEDD TTAAXXAATTIIOONN.................................................................................................................................. 115599
1122 -- PPRROOVVIISSIIOONNSS ............................................................................................................................................................................................ 115599
1133 -- DDEEBBTT AANNDD SSEECCUURRIITTIIEESS IISSSSUUEEDD .............................................................................................................................................. 116600
1144 -- FFIINNAANNCCIIAALL LLIIAABBIILLIITTIIEESS HHEELLDD FFOORR TTRRAADDIINNGG ............................................................................................................ 116611
1166 -- FFOORREEIIGGNN CCUURRRREENNCCYY TTRRAANNSSAACCTTIIOONNSS ................................................................................................................................ 116622
1177 -- OOTTHHEERR IINNFFOORRMMAATTIIOONN ...................................................................................................................................................................... 116622
A.3 – DISCLOSURES ON FAIR VALUE MEASUREMENT...........................164

Report and Financial Statements at 31 December 2009
139
A.3.2 Hierarchy of fair value inputs ............................................................... 164 A.3.2.1 Portfolios: breakdown by level of fair value inputs ............................... 164 A.3.2.2 Change for the year in financial assets at fair value (Level 3)................. 165 A.3.2.3 Change for the year in financial liabilities at fair value (Level 3) ............. 166
PART B – INFORMATION ON THE BALANCE SHEET...............................167
ASSETS .................................................................................................167
SSEECCTTIIOONN 11 –– CCAASSHH AANNDD CCAASSHH EEQQUUIIVVAALLEENNTTSS –– IITTEEMM 1100............................................................................................ 116677 1.1 Cash and cash equivalents: composition ................................................ 167
SSEECCTTIIOONN 22 –– FFIINNAANNCCIIAALL AASSSSEETTSS HHEELLDD FFOORR TTRRAADDIINNGG –– IITTEEMM 2200...................................................................... 116688 2.1 Financial assets held for trading: composition by type ................................ 168 2.2 Financial assets held for trading: composition by debtor/issuer .................... 169
SSEECCTTIIOONN 44 –– FFIINNAANNCCIIAALL AASSSSEETTSS AAVVAAIILLAABBLLEE FFOORR SSAALLEE –– IITTEEMM 4400.................................................................. 117700 4.1 Financial assets available for sale: composition by type .............................. 170 4.2 Financial assets available for sale: composition by debtor/issuer .................. 171 4.4 Financial assets available for sale: change for the year ............................... 172
SSEECCTTIIOONN 55 –– FFIINNAANNCCIIAALL AASSSSEETTSS HHEELLDD TTOO MMAATTUURRIITTYY –– IITTEEMM 5500 ...................................................................... 117733 5.1 Financial assets held to maturity: composition by type ............................... 173 5.2 Financial assets held to maturity: composition by debtor/issuer ................... 174 5.4 Financial assets held to maturity: change for the year ................................ 175
SSEECCTTIIOONN 66 –– LLOOAANNSS TTOO BBAANNKKSS –– IITTEEMM 6600 .............................................................................................................................. 117766 6.1 Loans to banks: composition by type ....................................................... 176 6.2 Loans to banks: assets hedged specifically................................................ 177
SSEECCTTIIOONN 77 –– LLOOAANNSS TTOO CCUUSSTTOOMMEERRSS –– IITTEEMM 7700 ................................................................................................................ 117788 7.1 Loans to customers: composition by type ................................................. 178 7.2 Loans to customers: composition by debtor/issuer ..................................... 179 7.3 Loans to customers: assets hedged specifically ......................................... 179
SSEECCTTIIOONN 88 –– HHEEDDGGIINNGG DDEERRIIVVAATTIIVVEESS –– IITTEEMM 8800.............................................................................................................. 118800 8.1 Hedging derivatives: composition by type of hedge and level of inputs.......... 180 8.2 Hedging derivatives: composition by hedged portfolio and type of hedge ...... 180
SSEECCTTIIOONN 1100 –– EEQQUUIITTYY IINNVVEESSTTMMEENNTTSS –– IITTEEMM 110000.......................................................................................................... 118822 10.1 Equity investments in subsidiaries, joint ventures and companies subject to significant influence: information on investments ........................................ 182 10.2 Equity investments in subsidiaries, joint ventures and companies subject to significant influence: accounting data ........................................................ 183 10.3 Equity investments: change for the year................................................. 183 10.6 Obligations relating to companies subject to significant influence ............... 184
SSEECCTTIIOONN 1111 –– PPRROOPPEERRTTYY,, PPLLAANNTT AANNDD EEQQUUIIPPMMEENNTT –– IITTEEMM 111100........................................................................ 118855 11.1 Property, plant and equipment: composition of assets measured at cost ..... 185 11.3 Operating property, plant and equipment: change for the year .................. 186
SSEECCTTIIOONN 1122 –– IINNTTAANNGGIIBBLLEE AASSSSEETTSS –– IITTEEMM 112200.............................................................................................................. 118877

Report and Financial Statements at 31 December 2009
140
12.1 Intangible assets: composition by category ............................................. 187 12.2 Intangible assets: change for the year.................................................... 188 12.3 Other information................................................................................ 188
SSEECCTTIIOONN 1133 –– TTAAXX AASSSSEETTSS AANNDD LLIIAABBIILLIITTIIEESS –– IITTEEMM 113300 OOFF AASSSSEETTSS AANNDD IITTEEMM 8800 OOFF
LLIIAABBIILLIITTIIEESS ............................................................................................................................................................................................................ 118899 13.1 Deferred tax assets: composition........................................................... 189 13.2 Deferred tax liabilities: composition ....................................................... 189 13.3 Changes in deferred tax assets (recognised in income statement) .............. 190 13.4 Changes in deferred tax liabilities (recognised in income statement)........... 191 13.5 Changes in deferred tax assets (recognised in shareholders’ equity) ........... 192 13.6 Changes in deferred tax liabilities (recognised in shareholders’ equity)........ 193 13.7 Other information................................................................................ 194
SSEECCTTIIOONN 1155 –– OOTTHHEERR AASSSSEETTSS –– IITTEEMM 115500 ............................................................................................................................ 119955 15.1 Other assets: composition .................................................................... 195
LIABILITIES...........................................................................................196
SSEECCTTIIOONN 11 –– DDUUEE TTOO BBAANNKKSS –– IITTEEMM 1100 .................................................................................................................................... 119966 1.1 Due to banks: composition by type.......................................................... 196
SSEECCTTIIOONN 22 –– DDUUEE TTOO CCUUSSTTOOMMEERRSS –– IITTEEMM 2200 ...................................................................................................................... 119977 2.1 Due to customers: composition by type.................................................... 197
SSEECCTTIIOONN 33 –– SSEECCUURRIITTIIEESS IISSSSUUEEDD –– IITTEEMM 3300 ...................................................................................................................... 119988 3.1 Securities issued: composition by type..................................................... 198 3.3 Securities issued: securities hedged specifically ......................................... 199
SSEECCTTIIOONN 44 –– FFIINNAANNCCIIAALL LLIIAABBIILLIITTIIEESS HHEELLDD FFOORR TTRRAADDIINNGG –– IITTEEMM 4400.......................................................... 220000 4.1 Financial liabilities held for trading: composition by type............................. 200
SSEECCTTIIOONN 66 –– HHEEDDGGIINNGG DDEERRIIVVAATTIIVVEESS –– IITTEEMM 6600.............................................................................................................. 220011 6.1 Hedging derivatives: composition by type of hedge and level of inputs.......... 201 6.2 Hedging derivatives: composition by hedged portfolio and type of hedge ...... 201
SSEECCTTIIOONN 77 –– VVAALLUUEE AADDJJUUSSTTMMEENNTTSS OOFF LLIIAABBIILLIITTIIEESS CCOOVVEERREEDD BBYY MMAACCRROO--HHEEDDGGEESS –– IITTEEMM 7700220022 7.1 Value adjustments of hedged financial liabilities ........................................ 202 7.2 Liabilities covered by macro-hedges against interest rate risk: composition ... 202
SSEECCTTIIOONN 88 –– TTAAXX LLIIAABBIILLIITTIIEESS –– IITTEEMM 8800 .............................................................................................................................. 220033
SSEECCTTIIOONN 1100 –– OOTTHHEERR LLIIAABBIILLIITTIIEESS –– IITTEEMM 110000................................................................................................................ 220044 10.1 Other liabilities: composition................................................................. 204
SSEECCTTIIOONN 1111 –– SSTTAAFFFF SSEEVVEERRAANNCCEE PPAAYY –– IITTEEMM 111100 ........................................................................................................ 220055 11.1 Staff severance pay: change for the year................................................ 205
SSEECCTTIIOONN 1122 –– PPRROOVVIISSIIOONNSS –– IITTEEMM 112200.................................................................................................................................. 220066 12.1 Provisions: composition........................................................................ 206 12.2 Provisions: change for the year ............................................................. 206 12.4 Provisions – Other provisions ................................................................ 207

Report and Financial Statements at 31 December 2009
141
SSEECCTTIIOONN 1144 –– SSHHAARREEHHOOLLDDEERRSS’’ EEQQUUIITTYY –– IITTEEMMSS 113300,, 115500,, 116600,, 117700,, 118800,, 119900 AANNDD 220000 220088
14.1 “Share capital” and “Treasury shares”: composition ................................. 208 14.2 Share capital - Number of shares: change for the year ............................. 208 14.4 Income reserves: additional information ................................................. 209
OOTTHHEERR IINNFFOORRMMAATTIIOONN.................................................................................................................................................................................... 221100 1. Guarantees issued and commitments......................................................... 210 2. Assets pledged as collateral for own debts and commitments ........................ 211
PART C – INFORMATION ON THE INCOME STATEMENT ........................212
SSEECCTTIIOONN 11 –– IINNTTEERREESSTT –– IITTEEMMSS 1100 AANNDD 2200 ........................................................................................................................ 221122 1.1 Interest income and similar revenues: composition .................................... 212 1.4 Interest expense and similar charges: composition .................................... 213 1.5 Interest expense and similar charges: differences on hedging transactions.... 214
SSEECCTTIIOONN 22 –– CCOOMMMMIISSSSIIOONNSS -- IITTEEMMSS 4400 AANNDD 5500 ............................................................................................................ 221155 2.1 Commission income: composition............................................................ 215 2.3 Commission expense: composition .......................................................... 216
SSEECCTTIIOONN 33 –– DDIIVVIIDDEENNDDSS AANNDD SSIIMMIILLAARR RREEVVEENNUUEESS -- IITTEEMM 7700.............................................................................. 221177 3.1 Dividends and similar revenues: composition ............................................ 217
SSEECCTTIIOONN 44 –– NNEETT GGAAIINN ((LLOOSSSS)) OONN TTRRAADDIINNGG AACCTTIIVVIITTIIEESS -- IITTEEMM 8800 ............................................................ 221188 4.1 Net gain (loss) on trading activities: composition....................................... 218
SSEECCTTIIOONN 55 –– NNEETT GGAAIINN ((LLOOSSSS)) OONN HHEEDDGGIINNGG AACCTTIIVVIITTIIEESS -- IITTEEMM 9900 ............................................................ 221199 5.1 Net gain (loss) on hedging activities: composition...................................... 219
SSEECCTTIIOONN 66 –– GGAAIINNSS ((LLOOSSSSEESS)) OONN DDIISSPPOOSSAALL OORR RREEPPUURRCCHHAASSEE –– IITTEEMM 110000 .......................................... 222200 6.1 Gains (losses) on disposal or repurchase: composition ............................... 220
SSEECCTTIIOONN 88 –– NNEETT IIMMPPAAIIRRMMEENNTT AADDJJUUSSTTMMEENNTTSS –– IITTEEMM 113300 .................................................................................. 222211 8.1 Net impairment adjustments of loans: composition .................................... 221
SSEECCTTIIOONN 99 –– GGEENNEERRAALL AANNDD AADDMMIINNIISSTTRRAATTIIVVEE EEXXPPEENNSSEESS –– IITTEEMM 115500 ........................................................ 222222 9.1 Staff costs: composition......................................................................... 222 9.2 Average number of employees by category............................................... 223 9.4 Other employee benefits ........................................................................ 223 9.5 Other administrative expenses: composition ............................................. 224
SSEECCTTIIOONN 1100 –– NNEETT PPRROOVVIISSIIOONNSS –– IITTEEMM 116600...................................................................................................................... 222255 10.1 Net provisions: composition .................................................................. 225
SSEECCTTIIOONN 1111 –– NNEETT AADDJJUUSSTTMMEENNTTSS OOFF PPRROOPPEERRTTYY,, PPLLAANNTT AANNDD EEQQUUIIPPMMEENNTT –– IITTEEMM 117700.............. 222266 11.1 Net adjustments of property, plant and equipment: composition ................ 226
SSEECCTTIIOONN 1122 –– NNEETT AADDJJUUSSTTMMEENNTTSS OOFF IINNTTAANNGGIIBBLLEE AASSSSEETTSS –– IITTEEMM 118800.................................................... 222277 12.1 Net adjustments of intangible assets: composition ................................... 227
SSEECCTTIIOONN 1133 –– OOTTHHEERR OOPPEERRAATTIINNGG CCOOSSTTSS AANNDD IINNCCOOMMEE–– IITTEEMM 119900 .............................................................. 222288 13.1 Other operating costs: composition........................................................ 228

Report and Financial Statements at 31 December 2009
142
13.2 Other operating income: composition ..................................................... 228
SSEECCTTIIOONN 1144 –– GGAAIINNSS ((LLOOSSSSEESS)) OONN EEQQUUIITTYY IINNVVEESSTTMMEENNTTSS –– IITTEEMM 221100.................................................... 222299 14.1 Gains (losses) on equity investments: composition................................... 229
SSEECCTTIIOONN 1188 -- IINNCCOOMMEE TTAAXX FFOORR TTHHEE PPEERRIIOODD OONN CCOONNTTIINNUUIINNGG OOPPEERRAATTIIOONNSS –– IITTEEMM 226600 ........ 223300 18.1 Income tax for the period on continuing operations: composition ............... 230 18.2 Reconciliation of theoretical tax liability and actual tax liability recognised ... 231
PART D – COMPREHENSIVE INCOME.....................................................232
PART E – INFORMATION ON RISKS AND RELATED HEDGING POLICIES ................233
SECTION 1 – CREDIT RISK........................................................................234
SECTION 2 – MARKET RISKS .....................................................................247
SECTION 3 – LIQUIDITY RISK ...................................................................259
SECTION 4 – OPERATIONAL RISKS .............................................................262
PART F – CAPITAL ..................................................................................264
SECTION 1 – CAPITAL .............................................................................264
PART H – TRANSACTIONS WITH RELATED PARTIES ........................................265
PART L – OPERATING SEGMENTS................................................................270
ANNEXES ............................................................................................275

Report and Financial Statements at 31 December 2009
143
INTRODUCTION STRUCTURE AND CONTENT OF THE FINANCIAL STATEMENTS
As in previous years, the CDP S.p.A. financial statements have been prepared in accordance with the regulations of the Bank of Italy, which are set out in its circular concerning banking and financial service supervision of 22 December 2005, updated to 18 November 2009, which set out the formats and rules for compiling bank financial statements, incorporating the introduction of International Financial Reporting Standards (IFRSs) for bank financial reporting. With Regulation (EC) 1606/2002 of 19 July 2002, the European Union made it compulsory, as of the 2006 financial year, to adopt the IFRSs in preparing the financial statements of EU companies that issue equity or debt securities on a regulated market in the European Union. Legislative Decree 38 of 20 February 2005 was then issued in Italy in order to govern the application of: • the International Financial Reporting Standards (IFRSs) issued by the
International Accounting Standards Board (IASB); • the International Accounting Standards (IASs) issued by the International
Accounting Standards Committee (IASC); as well as the Implementation Guidance and Basis for Conclusions adopted by the International Financial Reporting Interpretations Committee (IFRIC, formerly the Standing Interpretations Committee, or SIC) and by the IASB. The financial statements are expressed in euros and include the balance sheet, the income statement, the statement of comprehensive income, the statement of changes in equity, the cash flow statement and these explanatory notes to the financial statements and related annexes, as well as the directors’ report on operations. Pursuant to IAS 1 Revised, the financial statements also include the statement of comprehensive income with the related comparative figures. The financial statements present a clear, true and fair overview of the company’s financial performance and standing. The account balances correspond with the company’s accounting records and fully reflect the transactions conducted during the year.
Report and Financial Statements at 31 December 2009
144
BASIS OF PRESENTATION The balance sheet and the income statement are expressed in euros, whereas the other financial statements and the tables in the notes to the financial statements are expressed in thousands of euros. Accounts with zero balances for both the current and prior period have been excluded. In the income statement, revenues are indicated without a sign, while costs are shown in parentheses. The figures in the other financial statements and the tables of the notes to the financial statements have been rounded to the nearest thousand, and the rounded totals for the various figures are obtained by summing the rounded balances of the items making up such totals. The cash and cash equivalents reported in the cash flow statement comprise the balance of item 10 “Cash and cash equivalents” of the balance sheet and the positive balance on bank accounts reported under item 60 “Loans to banks” net of current accounts with a negative balance reported under item 20 “Due to banks” of liabilities.
COMPARISON AND DISCLOSURE As detailed below, the notes to the financial statements provide all of the information required by law, as well as any supplemental information deemed necessary in order to provide a true and fair presentation the company’s financial performance and standing. The tables and other details required by the Bank of Italy have been numbered in accordance with the parts and sections specified in Annex “A” of the supervisory instructions issued by the Bank of Italy. For the purposes of comparison, the tables in the notes to the financial statements present the figures for both the 2009 and 2008 financial years. Tables with no amounts for either 2009 or 2008 have been omitted.
CDP SEGREGATED ASSET POOLS CDP holds the covered bond segregate asset pool. This is not a segregated asset pool as defined by the Italian Civil Code, but rather a separation related to certain CDP assets (loans to local authorities) for which CDP has established guarantees/liens on the cash flows for the holders of the covered bonds issued, which enables the bond itself to have a higher rating than that of the issuer. The separation concerns the flows related to the portfolio of loans that constitute the collateral of the related bond issue. The assets are in the accounts with an “of which” indication on the financial
Report and Financial Statements at 31 December 2009
145
statements, and the transaction is described in the notes to the financial statements under Part B – Information on the balance sheet – Other information.
AUDITING OF THE FINANCIAL STATEMENTS The CDP financial statements have been audited by KPMG S.p.A. in execution of the shareholder resolution of April 2007, which engaged this firm to audit the financial statements and accounts for the period 2007-2010.
ANNEXES In order to enhance disclosure, a detailed list of the equity investments held by CDP is annexed to this report. Statements showing the contribution of the Separate Account and the Ordinary Account are also annexed to this report.
Report and Financial Statements at 31 December 2009
146
PART A – ACCOUNTING POLICIES
A.1 – GENERAL INFORMATION
SECTION 1 – DECLARATION OF CONFORMITY WITH THE INTERNATIONAL
ACCOUNTING STANDARDS
These financial statements have been prepared in accordance with the International Financial Reporting Standards (IFRSs) issued by the IASB (and related IFRIC and SIC interpretations) endorsed by the European Commission as of 31 December 2009 and with the Bank of Italy circular of 22 December 2005 updated to 18 November 2009, which establishes the required format of the financial statements and related methods of preparation, as well as the content of the related notes.
SECTION 2 – GENERAL PREPARATION PRINCIPLES
The financial statements have been prepared in accordance with the IFRSs issued by the IASB (including the SIC and IFRIC interpretations) endorsed by the European Commission pursuant to Regulation (EC) 1606 of 19 July 2002. For the purposes of interpretation and to provide support in applying these standards, the following documents have also been considered, although they have not been endorsed by the European Commission: • the Framework for the Preparation and Presentation of Financial Statements
(issued by the International Accounting Standards Board in 2001); • Implementation Guidance, Basis for Conclusions, IFRIC interpretations, and
any other documentation prepared by the IASB or IFRIC to supplement the IFRSs;
• interpretation documents concerning the application of the IFRSs in Italy, prepared by the Organismo Italiano di Contabilità (Italian Accounting Board; OIC) and by the Italian Banking Association (ABI).
Where the information required by the IFRSs and the regulations of the Bank of Italy is deemed to be inadequate in presenting the company’s financial standing in a true and fair manner, the notes to the financial statements also include

Report and Financial Statements at 31 December 2009
147
supplemental information for such purpose.
The financial statements have been prepared on an accruals and going-concern basis. The general principles of the materiality and significance of information and the prevalence of substance over form have also been taken into account. Pursuant to the provisions of joint Bank of Italy/Consob/Isvap document no. 2 of 6 February 2009 concerning disclosures on business continuity and in compliance with the requirements on the same issue contained in IAS 1 Revised, CDP has conducted an assessment of its ability to continue to operate as a going concern, considering all available information over a medium-term time horizon. Based on an analysis of the information and the results achieved in previous years, CDP feels that it is appropriate to prepare its financial statements on a going-concern basis. No assets have been offset with liabilities, nor revenues with costs, unless expressly required or allowed by the instructions of the Bank of Italy or by an accounting standard or a related interpretation.
SECTION 3 – EVENTS SUBSEQUENT TO THE BALANCE SHEET DATE
During the period between the reporting date for the financial statements and their approval by the Board of Directors on 31 March 2010, no events occurred that would require an adjustment to the figures approved or the provision of additional information.
SECTION 4 – OTHER ISSUES
RECLASSIFICATION OF DATA In compliance with the amendments made to Bank of Italy circular 262/2005 in 2009 and in order to ensure comparability with the previous year, the comparative figures for 2008 in respect of remuneration paid to members of the Board of Auditors were reallocated to item “150.a Staff costs” of the income statement from item “150.b Other administrative expenses”.

Report and Financial Statements at 31 December 2009
148
FIRST-TIME ADOPTION/RECENTLY ADOPTED ACCOUNTING STANDARDS The company adopted the following international accounting standards and interpretations for the first time as from 1 January 2009: “Amendments to IAS 1 - Presentation of financial statements”: this introduces a new method of presentation of financial statements, with a particular impact on the presentation of income statement data for the period through “comprehensive income”, which provides for separate reporting of profit and loss for the period and of profit and loss recognised as a change in equity (“other comprehensive income”). The standard gives companies the option of presenting this information in one “statement of comprehensive income”, or in two separate statements presented together: • one statement (“income statement”), which shows the components of profit
and loss for the period; and • a second statement (“statement of comprehensive income”) which, starting
with the net income (loss) for the period, includes gains and losses recognised directly in equity (OCI - other comprehensive income).
The company, in line with the instructions issued by the Bank of Italy, has elected to present comprehensive income for the year in two separate statements. IAS 1 Revised also eliminated the option of disclosing changes in shareholders’ equity items and transactions with owners in the notes to the financial statements and rather requires this information to be presented in a separate statement. “Amendments to IFRS 7 - Financial instruments: disclosures”: the amendments introduce a three-level hierarchy for classifying assets and liabilities measured at fair value and providing the related disclosures. This hierarchy reflects the availability of observable market data to be used in determining fair value. The amendments also introduce new disclosure requirements, with the information to be presented in table form, for assets and liabilities measured at fair value for each of the three levels in the hierarchy, with the extension of disclosure requirements for financial instruments measured at fair value on the basis of inputs not based on observable market data. The disclosure requirements for liquidity risk were also amended to reflect the manner in which such risk is managed. The application of the amendments on a prospective basis did not have a material impact for the company. OTHER INFORMATION The separate financial statements for 2009 of CDP S.p.A. are subject to approval and authorisation for publication by the Shareholders’ Meeting of 28 April 2010.

Report and Financial Statements at 31 December 2009
149
A.2 – THE MAIN FINANCIAL STATEMENT
ACCOUNTS The pages provide a description of the accounting policies adopted in preparing the financial statements.
1 - FINANCIAL ASSETS HELD FOR TRADING
“Financial assets held for trading” (item 20) includes all financial assets, regardless of type (debt securities, equity, loans, derivatives, etc.), allocated to the trading portfolio and held for the purpose of generating profits over the short term as a result of changes in the price of such instruments, as well as the derivative contracts operationally connected with financial liabilities measured at fair value (under the fair value option) and derivatives with a positive value, including those resulting from the separation of embedded derivatives, that are not deemed to be effective for hedging purposes. Financial assets held for trading meet the following prerequisites: a) they are purchased with the intention of being sold in the short term; b) they are a part of a portfolio of identified financial instruments that are
managed together and for which there is evidence of a recent actual pattern of short-term profit-taking;
c) they are derivatives (with the exception of derivatives that are designated and effective hedging instruments).
Such financial assets are initially recognised at fair value, which generally equals the amount paid or received net of transactions costs or income. Where the amount paid is different from the fair value, the financial asset is recognised at fair value, and the difference between the two amounts is recognised through profit or loss. Initial recognition is carried out at the subscription date for derivative contracts and on the settlement date for debt and equity securities, with the exception of those for which delivery is governed by conventions on the market concerned, for which initial recognition is at the settlement date. Financial assets held for trading also include derivative contracts embedded in other financial instruments or contracts and which have financial and risk characteristics that are not correlated with the host instrument or which meet the requirements to be classified themselves as derivative contracts, recognising them separately after separating the embedded derivative from the main

Report and Financial Statements at 31 December 2009
150
contract, which is then treated in accordance with the accounting rules for its own category. This is not done in cases in which the compound instrument containing the derivative is measured at fair value through profit or loss. The financial instruments are measured subsequently at fair value based on the official prices as of the balance sheet date if they are listed on active markets. For financial instruments, including equity, not listed on active markets, fair value is determined by using measurement techniques and information available on the market, such as the price of similar instruments on an active market, discounted cash flows, option pricing models and values registered in recent similar transactions. For equity securities and related derivative instruments, if the fair value obtained using such measurement techniques cannot be reliably determined, the financial instruments are measured at cost and written down in the event of impairment losses. If the fair value of a financial asset becomes negative, it is recognised as a financial liability held for trading. Financial assets held for trading are derecognised when payment is received, when the contractual rights to the cash flows expire, or a sale transfers all the risks and rewards connected with ownership to a third party. Conversely, when a prevalent share of the risks and rewards associated with the financial asset is retained, the asset remains on the balance sheet even if official title has been transferred. The gains and losses on sale or redemption and unrealised gains and losses resulting from the fair value measurement of the trading portfolio are reported under “Net gain (loss) on trading activities” (item 80). The income components are recognised following the results of the measurement of the financial assets held for trading.
2 - FINANCIAL ASSETS AVAILABLE FOR SALE
“Financial assets available for sale” (item 40) are non-derivative financial assets (debt securities, equity, etc.) that are classified as being available for sale and not as (a) loans and receivables, (b) held-to-maturity investments, or (c) financial assets at fair value through profit or loss. Available-for-sale financial assets are initially recognised on the contract date for all financial assets, with the exception of those for which delivery is governed by conventions on the market concerned, for which initial recognition is carried out at the settlement date and on the disbursement date in the case of loans. The financial assets are initially recognised at fair value, which generally equals the amount paid or received net of transactions costs or gains. Where the amount paid is different from the fair value, the financial asset is recognised at

Report and Financial Statements at 31 December 2009
151
fair value, and the difference between the two amounts is recognised through profit or loss. Initial recognition is carried out at the subscription date for derivative contracts and at the settlement date for debt and equity securities, with the exception of those for which delivery is governed by conventions on the market concerned, for which initial recognition is at the settlement date. Investments in equity instruments that are not listed on an active market and for which it is not possible to measure fair value reliably, as well as derivatives connected to such instruments and/or that must be settled with the delivery of such instruments, are measured at cost. Unrealised gains or losses on available-for-sale securities are recorded in a specific equity reserve, net of tax effects, until the investment is sold or written down. Subsequent measurement is done at fair value based on the official prices as of the balance sheet date if the financial instruments are listed on active markets. For financial instruments, including equity securities, not listed on active markets, fair value is determined by using measurement techniques and information available on the market, such as the price of similar instruments on an active market, discounted cash flows, option pricing models and values registered in recent similar transactions. For equity securities and related derivative instruments, if the fair value obtained using such measurement techniques cannot be reliably determined, the financial instruments are measured at cost and written down in the event of impairment losses. Available-for-sale financial assets undergo impairment testing to determine whether there is objective evidence of impairment. Where the decline in the fair value of an available-for-sale security with respect to its initial cost value is significant or prolonged, an impairment is recognised through profit or loss regardless of other valuation considerations. Whether the decrease in fair value is “significant” or “prolonged” is assessed separately using appropriate thresholds. Where an available-for-sale security is impaired, the cumulative, unrealised change in value recorded in the equity reserve is recognised in the income statement under “Net impairment adjustments of financial assets available for sale” (item 130.b). The impairment is recognised when the purchase cost (net of any amortisation and repayments of principal) of an available-for-sale financial asset exceeds its recoverable amount. The amount of this loss is measured using specific valuation techniques and models for equity securities. Any writebacks of investments in equity instruments are not recognised in the income statement but in an equity reserve, while any writebacks of investments in debt instruments go through the income statement. The amount of the writeback shall
Report and Financial Statements at 31 December 2009
152
in any event not exceed the amortised cost that the instrument would have had in the absence of the prior adjustments. Dividends on equity instruments that are available for sale are recognised as income when the right to receive payment is established. In addition to the recognition of impairment losses, the cumulative gains or losses in the equity reserve are, as mentioned above, recognised in the income statement at the time of the sale of the asset. Accordingly, in the event of the disposal of an investment in available-for-sale securities, the related cumulative, unrealised change in value recorded in equity is recognised in the income statement as “Gains (losses) on the disposal or repurchase of financial assets available for sale” (item 100.b). Available-for-sale financial assets are derecognised when payment is received, when the contractual rights to the cash flows expire, or a sale transfers all the risks and rewards connected with ownership to a third party. Conversely, when a prevalent share of the risks and rewards associated with the financial asset is retained, the asset remains on the balance sheet even if official title has been transferred.
3 - FINANCIAL ASSETS HELD TO MATURITY
Financial assets held to maturity include financial assets other than derivatives with fixed or determinable payments and fixed maturity that an entity has the positive intention and ability to hold to maturity. If, following a change in such intention or ability, it is no longer appropriate to continue to classify an investment as held to maturity, it is reclassified under financial assets available for sale. Held-to-maturity financial assets are initially recognised at fair value, which is normally equal to the price paid or received. In cases where the price differs from fair value, the asset is recognised at fair value and the difference between the price and the fair value is taken to the income statement. The value at which such assets are recognised includes incidental costs and revenues attributable to the transaction. Following initial recognition, financial assets held to maturity are measured at amortised cost and undergo impairment testing. The amortised cost of a financial asset is equal to the amount at which it is measured at initial recognition minus principal repayments, plus or minus the cumulative amortisation using the effective interest rate method of any difference between the initial amount and the maturity amount, and minus any reduction (directly or through the use of an allowance account) for impairment or uncollectibility. Such assets are derecognised when the contractual rights to the cash flows from the assets

Report and Financial Statements at 31 December 2009
153
expire or when the assets are divested by transferring substantially all the risks and rewards of ownership of the assets.
4 - LOANS
The term “loans” refers to a portfolio of financial instruments, including debt securities, that are not listed on an active market and which IAS 39 refers to as “loans and receivables”, for which the company has a right to receive future cash flows. Loans are initially recognised at the disbursement date or, in the case of debt securities, at the settlement date. Loans are recognised when the contract is executed, i.e. upon the unconditional acquisition of a right to payment of the amounts agreed, and are initially measured at fair value, which equals the amount disbursed including directly related transaction costs and commissions. Where the net amount disbursed does not equal the loan’s fair value because the interest rate is lower than the market rate or the rate normally applied for similar loans, initial measurement is effected by discounting the future cash flows using an appropriate rate. The loans made to public entities and public-law bodies under CDP’s Separate Account portfolio have a number of features that distinguish them from loans granted by banks, which normally disburse the entire amount of the loan to its beneficiary at the time the loan is granted. Such loans are special-purpose loans generally granted to public entities for public works and are disbursed to the beneficiaries only after detailed verification of the progress of the works in question. Therefore, disbursements are intended to meet the debts actually accumulated by the entities in respect of suppliers as the work is performed. Upon signing the finance agreement, the debtor assumes the obligation to repay the entire principal granted, and this amount is used to determine an amortisation schedule separately from the amount actually disbursed. Amounts still to be disbursed by CDP earn interest that can be treated as a reimbursement of the interest income earned by CDP on the non-disbursed portion. CDP’s special-purpose loans normally have an initial grace period, during which, in the absence of disbursements on the loan granted, the loan does not bear interest. With certain exceptions, the loan repayment plan begins as from the 1 July or 1 January following the execution of the loan contract. CDP’s accounting policy for special-purpose loans is to recognise a commitment to disburse the sums granted upon signing the loan agreement and to recognise a receivable (with a consequent reduction in the disbursement commitments) for the entire amount granted only when repayment begins.

Report and Financial Statements at 31 December 2009
154
Any disbursements requested by borrowers during the grace period effectively reduce the commitment and result in a “short-term” receivable for the amount actually disbursed, with this amount accruing interest at the rate agreed upon by contract. The short-term receivable for advances on loans in their grace period is measured at cost in accordance with international accounting standards. When repayment begins on a loan that has not yet been disbursed, both a payable and a receivable are recognised for the same amount in respect of the party responsible for repaying the loan. In accordance with the IASs/IFRSs, the receivable is measured at amortised cost (which, given the lack of transaction costs on the loans granted and with certain exceptions, equals cost), and the payable is a demand liability that decreases as the amounts are actually disbursed. Loans granted by CDP to borrowers other than public entities or public-law bodies are treated in a manner analogous to that for loans granted by banks. The interest on loans and default interest is recognised as interest income and similar revenues on loans to banks and customers and are recognised on an accruals basis. The carrying amount of loans is subject to periodic testing for impairment that could reduce their expected realisable value. This reduction becomes material when it is deemed probable that the amount due will not be paid in full, based on the original terms of the agreement, or that an equivalent asset will not be received. Loans classified as bad debts, substandard or restructured are measured individually for positions that exceed a given value threshold. In view of the lack of time series of loss data on loans, as well as the creditworthiness of CDP’s leading borrowers, no general writedowns of the portfolio are recorded. The measurement of writedowns of loans is based on discounting the expected future cash flows of principal and interest net of collection costs, taking account of any guarantees securing the positions and any advances received. The key to determining the value of the future cash flows is in defining the estimated collections, the related timing, and the discount rate to be applied. The impairment of problem loans is then written back only when the quality of the loan improves to the point that there is a reasonable certainty of a greater recovery of principal and interest and/or greater receipts have been recorded than the previously recorded carrying amount of the loan. In any event, given the method used to measure impairment losses, as the due dates for credit collection approach with the passing of time, the value of the loan is “written back”, given that there is a reduction in the implicit finance costs previously recognised as a reduction in the value of the loans.
Report and Financial Statements at 31 December 2009
155
Recovery of all or a part of previously written down loans is recognised as a reduction to “Net impairment adjustments of loans” (item 130.a). Loans are derecognised when paid in full, when all of the related risks and rewards have been transferred, or when a loan is deemed to be definitively uncollectible. The amount of the loss is recognised in the income statement net of previously recognised impairment losses. Loans represented by positions with parties that are not classified under any of the risk categories listed above, but which are more than 180-days past due, also undergo individual impairment testing. “Loans to customers” include unlisted financial assets in respect of customers (loans, debt securities, operating receivables, etc.) that are allocated to the “loans” portfolio. This also includes receivables from Italian post offices and variation margins with clearing bodies for derivatives transactions. “Loans to banks” include unlisted financial assets in respect of banks (current accounts, security deposits, debt securities, operating receivables, etc.) that are allocated to the “loans” portfolio. This also includes the amounts receivable from central banks other than free deposits (i.e. the reserve requirement).
6 - HEDGING TRANSACTIONS
According to IAS 39, hedging instruments are designated derivatives or (limited to the hedging of foreign currency risk) non-derivative financial assets or liabilities the fair value or cash flows of which are expected to offset the changes in fair value or cash flows of a designated position (IAS 39, paragraphs 72-77 and Annex A, paragraph AG94). A hedged item is an asset, liability, firm commitment, a highly probable forecast transaction, or a net investment in a foreign operation that (a) exposes the organisation to the risk of a change in fair value or future cash flows and (b) is designated as being hedged (paragraphs 78-84 and Annex A, paragraphs AG98-AG101). The effectiveness of the hedge is the extent to which the change in fair value or cash flows of the hedged position that is attributable to a hedged risk are offset by the change in fair value or cash flows of the hedging instrument (Annex A, paragraphs AG105-AG113). When a financial instrument is classified as a hedging instrument, the following are to be formally documented: 1. the relationship between the hedging instrument and the position hedged,
including the risk management objectives; 2. the hedging strategy, which must be in line with established risk management
policies; 3. the methods to be used in order to verify the effectiveness of the hedge.

Report and Financial Statements at 31 December 2009
156
Accordingly, both at the inception of the hedge and throughout its life, the change in the fair value of the derivative is analysed in order to determine whether it is highly effective in offsetting the changes in fair value of the hedged position. A hedge is deemed to be highly effective if, both at inception and throughout its life, the changes in fair value of the hedged position or in the expected cash flows attributable to the risk being hedged are almost entirely offset by the changes in fair value of the hedging derivative, with the relationship of these changes falling within a range of between 80% and 125%. If the hedge is not effective as described above, the hedging instrument is reclassified under trading instruments, while the hedged item is measured in accordance with the criteria for its category and, in the case of cash flow hedges, any reserve is reversed to profit or loss. Hedge accounting also ceases in the event the hedging instrument expires, is sold or exercised or where the hedged item expires, is sold or is repaid. Asset item 80 and liability item 60 report hedging derivatives (when not considered guarantees received in accordance with IAS 39), which at the balance sheet date have either a positive or negative value.
7 - EQUITY INVESTMENTS
The term “equity investments” refers to investments in subsidiaries (IAS 27), in joint ventures (IAS 31), and associates subject to significant influence (IAS 28) other than financial assets held for trading (item 20) and financial assets at fair value through profit or loss (item 30) in accordance with IAS 28, paragraph 1, and IAS 31, paragraph 1. Subsidiaries are companies in which CDP holds, either directly or indirectly, more than half of the voting rights for the purpose of appointing dependent directors or, in any event, when CDP exercises the power to determine financial and operating policies. Joint ventures are companies in which control is shared with other parties by contract. Associates are companies in which CDP holds, either directly or indirectly, at least 20% of the voting rights or, independently of the proportion of voting rights, companies over which CDP has significant influence, which is defined as the power to participate in determining financial and operating policies, but without exercising either control or joint control. Minority interests are recognised as “Financial assets available for sale” (item 40) and are treated as described above. In accordance with IAS 27, paragraph 37, equity investments are initially recognised and subsequently carried at cost at the settlement date, including costs and revenues that are directly attributable to the transaction.
Report and Financial Statements at 31 December 2009
157
Where there is evidence that the value of an equity investment may be impaired, its recoverable value is determined, taking account of both its market value and the present value of future cash flows. If this value is lower than the carrying amount, the difference is recognised in the income statement as an impairment loss. This loss is only recognised when the loss in value is significant or prolonged. Impairment losses on investments listed on active markets, unless there are additional, specifically justified reasons, are recognised when the impairment is deemed to be significant or prolonged. In the absence of market prices or valuation models, the value of the equity investment is prudentially written down by the amount of the loss reported in the financial statements of the investee where the loss is considered to be a reliable indicator of impairment. Equity investments are derecognised when the contractual rights to the cash flows of the business terminate or when the financial asset is sold, transferring substantially all risks and rewards connected with it.
8 - PROPERTY, PLANT AND EQUIPMENT
“Property, plant and equipment” includes all non-current tangible assets used in operations governed by IAS 16 and investment property (land and buildings) governed by IAS 40. These include assets under finance leases (for the lessee) and operating leases (for the lessor), as well as leasehold improvement costs. In order to determine whether a contract contains a lease, the provisions of IFRIC 4 are applied. Property, plant and equipment is recognised at purchase cost including incidental expenses and VAT, increased by revaluations carried out under the provisions of specific laws. The carrying amount represents the book value of the assets net of depreciation. The depreciation rates used are felt to reflect the remaining useful economic lives of the assets. Newly acquired assets are depreciated as from the period in which they enter service. Land and buildings are treated as separate assets for accounting purposes, even if purchased together. Therefore, with the transition to the IFRSs, CDP separated the value of land from the value of buildings based on appraisals that were previously used in 2005 for the purpose of revaluing company properties that had been recognised in the 2004 financial statements, pursuant to the provisions of the 2006 Finance Act. Land is considered to have an indefinite life and, as such, is not depreciated. Buildings are depreciated over a 33-year period, which is considered to be the

Report and Financial Statements at 31 December 2009
158
useful life of the buildings themselves. Assets whose use or nature classifies them as capital equipment are depreciated on a straight line basis over their remaining useful lives. Newly acquired assets are depreciated as from the period in which they enter service. In the event an asset should suffer a lasting impairment of value, independently of depreciation, it is written down. The original value is restored where the conditions that had prompted the writedown should cease to obtain. Maintenance and repair costs that do not increase the utility or useful lives of assets are charged directly to income for the year. “Assets under construction and advances” are composed of advances or expenses incurred in respect of assets and materials that have not been completed or are undergoing testing before entering service. Since they have not yet entered the company’s production cycle, depreciation is suspended.
9 – INTANGIBLE ASSETS
“Intangible assets” include goodwill and other intangibles governed by IAS 38. Intangible assets are recognised at purchase or development cost including incidental expenses and are amortised over their estimated useful lives, which, at the end of each year, is subject to impairment testing in order to verify the appropriateness of the estimates. An intangible asset is only recognised under the following conditions: (a) CDP can control the future economic benefits generated by the asset; (b) it is probable that the expected future economic benefits that are attributable to the asset will flow to the company; (c) the cost of the asset can be measured reliably. Intangible assets are therefore derecognised when sold or when future economic benefits are no longer expected. CDP’s intangible assets essentially consist of software. Costs incurred for the purchase and development of software by third parties are amortised, usually on a straight-line basis, over the residual useful lives of the assets, which is no greater than 5 years. Costs incurred for software development before the year in which the project is completed are capitalised when the development/implementation of the project is likely to be successful and the utility of the product extends over more than one year. In this case, the costs are amortised over a period of no more than 5 years. In the year in which the software is completed, the costs incurred and not yet amortised are imputed to the asset and the cost is amortised over 5 years. “Assets under construction and advances” are composed of advances or expenses incurred in respect of assets that have not been completed or are

Report and Financial Statements at 31 December 2009
159
undergoing testing before entering service. Since they have not yet entered the company’s production cycle, depreciation is suspended.
11 - CURRENT AND DEFERRED TAXATION
Corporate income tax (IRES) and the regional tax on business activities (IRAP) are recognised on an accruals basis using a realistic estimate of the negative and positive tax components for the year and were calculated on the basis of the tax rates currently in force (27.5% for IRES and 4.82% for IRAP). Deferred tax items regard the recognition of the effects of temporary differences between the valuation of accounting items under tax regulations (which are used to determine taxable income) and that under statutory reporting regulations (which seek to quantify the result for the year). More specifically, “taxable temporary differences” between statutory and tax values are those that will give rise to taxable amounts in future tax periods, while “deductible temporary differences” are those that will give rise to deductible amounts in the future. Deferred tax items are recognised in the tax provision where they represent liabilities, i.e. where they are related to items that will become taxable in future tax periods. Where they represent assets, i.e. the are related to items that will be deductible in future tax periods, they are recognised under “Deferred tax assets” in the balance sheet. If the deferred tax items regard operations that directly affected shareholders’ equity, they are recognised in shareholders’ equity.
12 - PROVISIONS
“Provisions” (item 120) are recognised solely under following conditions: (a) there is a present (legal or constructive) obligation resulting from a past
event; (b) it is probable that an outflow of resources embodying economic benefits
will be required to settle the obligation; (c) a reliable estimate can be made of the amount of the obligation.
When the financial impact of the time factor is significant and the dates of payment of the obligation can be estimated reliably, the provision is measured as the present value (discounted at market rates as of the balance sheet date) of the charges that are expected to be incurred in order to settle the obligation. CDP has no “provisions for retirement and similar obligations”, while “other provisions” includes the provisions for liabilities and contingencies established in

Report and Financial Statements at 31 December 2009
160
observance of international accounting standards, with the exception of writedowns due to the impairment of guarantees issued and credit derivatives treated as such in accordance with IAS 39, which, where applicable, are recognised under “other liabilities”. The provisions are only used when the charges for which they were originally established are incurred. When the outlay to fulfil the obligation is no longer deemed to be probable, the provision is reversed through the income statement.
13 - DEBT AND SECURITIES ISSUED
“Amounts due to banks” (item 10) and “Amounts due to customers” (item 20) include all forms of interbank and customer funding. In particular, these items include all debt of any kind (deposits, current accounts, loans) other than “Financial liabilities held for trading” (item 40), “Financial liabilities at fair value through profit or loss” (item 50), and debt securities under item 30 (“Securities issued”). This includes operating payables. In particular, CDP includes in these items the amounts still to be disbursed for loans being repaid. Securities issued, both listed and unlisted, are measured at amortised cost. The item is reported net of repurchased securities. It also includes securities which, as of the balance sheet date, have matured but have not yet been redeemed. It does not include the portion of the company’s own debt securities issued but not yet placed with third parties. These are initially measured at fair value including the costs incurred to issue the securities, which normally coincides with the issue price. Subsequent measurement is at amortised cost using the effective interest rate method. The payables are eliminated when they mature or are extinguished. Securities issued include the postal savings bonds issued by CDP. These bonds are zero-coupon securities (where the interest accrued is paid when the principal is redeemed) with a step-up interest structure (the interest rate increases as the period for which the bond is held increases) and with principal and interest redeemed in a single payment upon maturity, although the bonds may be redeemed at any time prior to the bond’s contractual maturity, with principal and interest paid in accordance with the period for which the bond was held. For financial instruments such as postal savings bonds, IAS 39 calls for the adoption of the amortised cost method and states that the effective interest rate to be used in calculating amortised cost must be equal to the internal rate of return of the estimated (not contractual) cash flows throughout the expected (and not contractual) life of the instrument. Given the aforementioned option of early redemption, the expected life of postal savings bonds is, on average, less than their contractual life. CDP has therefore developed a statistical model for

Report and Financial Statements at 31 December 2009
161
forecasting early redemption of savings bonds based on a time series of redemptions, which is used to price the new issues. The forecasting model used at the time of the bond issue is also used to determine the initial estimated amortisation plan for each series of savings bonds. Based on these estimated flows, the effective interest rate and the amortised cost to be recognised in the balance sheet are then calculated. Differences between the actual early redemptions and these estimates result in an adjustment to the remaining amortisation schedule. In such cases, the IFRSs state that the amortised cost of the instrument being measured is to be equal to the present value of the new estimated future cash flows using the unchanging effective interest rate calculated upon issuing each series of savings bonds as the discount rate. It is also necessary to recognise distribution commissions paid to Poste Italiane S.p.A. as transaction costs. These fees are therefore considered along with the other cash flows for the savings bonds for the purpose of determining the effective interest rate.
14 - FINANCIAL LIABILITIES HELD FOR TRADING
This item includes all forms of financial liabilities (debt securities, loans, etc.) designated as being held for trading purposes. It does not include the portion of the company’s own debt securities issued but not yet placed with third parties. The financial liabilities are initially recognised at fair value, which generally equals the amount received net of transactions costs or revenues. In cases in which the amount paid differs from the fair value, the financial liability is recognised at fair value, and the difference between the two amounts is recognised through profit or loss. Initial recognition is effected at the signing date for derivative contracts and at the settlement date for debt and equity securities, with the exception of those for which delivery is governed by conventions on the market concerned, for which initial recognition is at the settlement date. Financial liabilities held for trading also include derivative contracts embedded in other financial instruments or contracts and which have financial and risk characteristics that are not correlated with the host instrument or which meet the requirements to be classified themselves as derivative contracts, recognising them separately after separating the embedded derivative from the main contract, which is then treated in accordance with the accounting rules for its own category. This is not done in cases in which the compound instrument containing the derivative is measured at fair value through profit or loss. Subsequent measurement is at fair value. If the fair value of a financial liability becomes positive, it is recognised as a financial asset held for trading.

Report and Financial Statements at 31 December 2009
162
Financial liabilities held for trading are derecognised when the contractual rights to the cash flows expire or a sale transfers all the risks and rewards connected with ownership to a third party. Conversely, when a prevalent share of the risks and rewards associated with the financial liability are retained, the liability remains on the balance sheet even if official title has been transferred. The gains and losses on sale or redemption and unrealised gains and losses resulting from the fair value measurement of the trading portfolio are reported under “Net gain (loss) on trading activities” (item 80). The income components are recognised following the results of the measurement of the financial liability held for trading.
16 - FOREIGN CURRENCY TRANSACTIONS
Transactions in a foreign currency are initially recognised in euros by translating the amount in the foreign currency into euros at the spot exchange rate prevailing on the date of the transaction. In preparing the financial statements, assets denominated in a foreign currency are accounted for as follows:
- in the case of monetary instruments, at the spot exchange rate prevailing at the preparation date of the financial statements, recognising exchange rate differences under “Net gain (loss) on trading activities” in the income statement;
- in the case of non-monetary instruments, at cost using the exchange rate for the original transaction;
- in the case of non-monetary instruments measured at fair value, at the spot exchange rate prevailing at the preparation date of the financial statements.
Exchange rate differences in respect of non-monetary items are treated using the same rules for gains and losses on the original instruments.
17 - OTHER INFORMATION
CASH AND CASH EQUIVALENTS (ITEM 10 OF ASSETS) Liquid assets are recognised at fair value. Liquidity is composed of cash on hand at the company and the balances on the current accounts held with the Central State Treasury. The balance is increased for accrued interest that has not yet been settled on these current accounts. Interest accrues semi-annually at a floating rate determined (pursuant to the decree of the Minister for the Economy and Finance

Report and Financial Statements at 31 December 2009
163
of 5 December 2003) on the basis of the gross yield on 6-month Treasury bills and the monthly level of the Rendistato index. STAFF SEVERANCE PAY This provision covers the entire entitlement accrued by employees at the end of the financial year, in conformity with the provisions of law (Article 2120 of the Italian Civil Code) and applicable employment contracts. In accordance with IAS 19, the staff severance pay scheme (TFR) is considered a defined-benefit plan and, therefore, is recognised as the present value of the accumulating obligation (both the present value of the expected future payments related to benefits accrued during the current year and the present value of future payments resulting from amounts accrued in previous years). It should also be noted that the provision for staff severance pay is negligible given that employees maintained their participation the INPDAP pension scheme after the transformation; therefore, contributions are paid to that institution. As such, the amount shown for TFR is related solely to newly hired employees (under the INPS pension scheme) for amounts accrued until 2006, given that the amounts accrued subsequently were not applied to this fund, but to the supplemental pension fund or to INPS in accordance with the applicable legislation. Therefore, the effects of the application of IAS 19 are not significant.
INTEREST INCOME AND EXPENSE Interest income and expense is recognised in the income statement for all instruments based on amortised cost using the effective interest method. Interest also includes the net positive or negative balance of the differences and margins related to financial hedging derivative. COMMISSIONS Commissions are recognised in the income statement on an accruals basis. This excludes commissions considered when calculating amortised cost for the purpose of determining the effective interest rate, which are recognised under interest. DIVIDENDS Dividends are recognised as income in the period in which they are approved for distribution.

Report and Financial Statements at 31 December 2009
164
A.3 – DISCLOSURES ON FAIR VALUE
MEASUREMENT
A.3.2 Hierarchy of fair value inputs
A.3.2.1 Portfolios: breakdown by level of fair value inputs
(thousands of euros)
A.3.2.1 PORTFOLIOS: BREAKDOWN BY LEVEL OF FAIR VALUE INPUTS
Level 1 Level 2 Level 3 Level 1 Level 2 Level 3
1. Financial assets held for trading 868,551 400,991
2. Financial assets at fair value
3. Financial assets available for sale 13,932,295 8,500 50,517 9,740,837 9,560 24,834
4. Hedging derivatives 331,026 577 100,620
Total 13,932,295 1,208,077 51,094 9,740,837 511,171 24,834
1. Financial liabilities held for trading 9,135 773,842 382,377
2. Financial liabilities at fair value
3. Hedging derivatives 825,663 1,271,495 56
Total 834,798 773,842 1,271,495 382,433
31/12/2009 31/12/2008

Report and Financial Statements at 31 December 2009
165
A.3.2.2 Change for the year in financial assets at fair value (Level 3)
(thousands of euros)
held for trading
at fair valueavailable for
salehedging
1. Opening balance 24,834 - 2. Increases 30,202 577
2.1 Purchases 30,202 2.2 Profits taken to: 577
2.2.1 Income statement 577 - of which: capital gains 577
2.2.2 Shareholders’ equity x x2.3 Transfers to other levels2.4 Other increases3. Decreases
3.1 Sales3.2 Repayments3.3 Losses taken to: 4,519
3.3.1 Income statement - of which: capital losses
3.3.2 Shareholders’ equity x x 4,519 3.4 Transfers to other levels3.5 Other decreases
4. Closing balance 50,517 577
FINANCIAL ASSETS
A.3.2.2 CHANGE FOR THE YEAR IN FINANCIAL ASSETS AT FAIR VALUE (LEVEL 3)

Report and Financial Statements at 31 December 2009
166
A.3.2.3 Change for the year in financial liabilities at fair value (Level 3)
(thousands of euros)
held for trading
at fair value hedging
1. Opening balance 382,377 56 2. Increases 391,465
2.1 Purchases 306,829 2.2 Losses taken to: 84,636
2.2.1 Income statement 84,636 - of which: capital losses 84,636
2.2.2 Shareholders’ equity x x2.3 Transfers to other levels2.4 Other increases3. Decreases 56
3.1 Sales3.2 Repayments3.3 Profits taken to: 56
3.3.1 Income statement 56 - of which: capital gains 56
3.3.2 Shareholders’ equity x x3.4 Transfers to other levels3.5 Other decreases4. Closing balance 773,842 -
FINANCIAL LIABILITIES
A.3.2.3 CHANGE FOR THE YEAR IN FINANCIAL LIABILITIES AT FAIR VALUE (LEVEL 3)

Report and Financial Statements at 31 December 2009
167
PART B – INFORMATION ON THE BALANCE SHEET
ASSETS
SECTION 1 – CASH AND CASH EQUIVALENTS – ITEM 10
The liquid assets of CDP S.p.A. are mainly held in the interest-bearing treasury current account no. 29814 denominated “Cassa DP S.P.A.- Gestione Separata”, which holds all liquid balances associated with the operations conducted by CDP in its activities under the Separate Account. At the end of 2009 the balance on the account was about €113,330 million.
As envisaged by Article 6.2 of the MEF decree of 5 December 2003, the Ministry for the Economy and Finance pays semi-annual interest on account no. 29814 at a floating rate equal to the simple arithmetic mean between the gross yield on 6-month Treasury bills and the monthly level of the Rendistato index.
Interest accrued on account no. 29814 and paid subsequent to the reporting date amounted to about €1,358 million.
1.1 Cash and cash equivalents: composition
The following table summarises liquidity at 31 December 2009, including interest accrued and not yet credited on amounts deposited in interest-bearing accounts.
(thousands of euros)
1.1 CASH AND CASH EQUIVALENTS: COMPOSITION
a) Cash 7 6
b) Free deposits with central banks 114,688,732 105,269,037
Total 114,688,739 105,269,043
31/12/2009 31/12/2008

Report and Financial Statements at 31 December 2009
168
SECTION 2 – FINANCIAL ASSETS HELD FOR TRADING – ITEM 20
2.1 Financial assets held for trading: composition by type
(thousands of euros)
Level 1 Level 2 Level 3 Level 1 Level 2 Level 3A On-balance-sheet financial assets1. Debt securities 1.1 Structured securities 1.2 Other debt securities2. Equity securities3. Units in collective investment undertakings4. Loans 4.1 Repurchase agreements 4.2 Other
Total A
B Derivatives1. Financial derivatives: 868,511 400,991 1.1 trading 868,511 400,991 1.2 associated with fair value option 1.3 other2. Credit derivatives 2.1 trading 2.2 associated with fair value option 2.3 other
Total B 868,511 400,991 Total (A+B) 868,511 400,991
31/12/200831/12/2009
2.1 FINANCIAL ASSETS HELD FOR TRADING: COMPOSITION BY TYPE
The financial derivatives set out in the table regard options purchased to hedge the embedded option component of bonds indexed to baskets of shares. This option component was separated from the host instrument and was classified among financial liabilities held for trading.
The item also includes the interest rate swaps entered into to hedge the postal savings bonds classified under financial assets held for trading with a view to their closure.
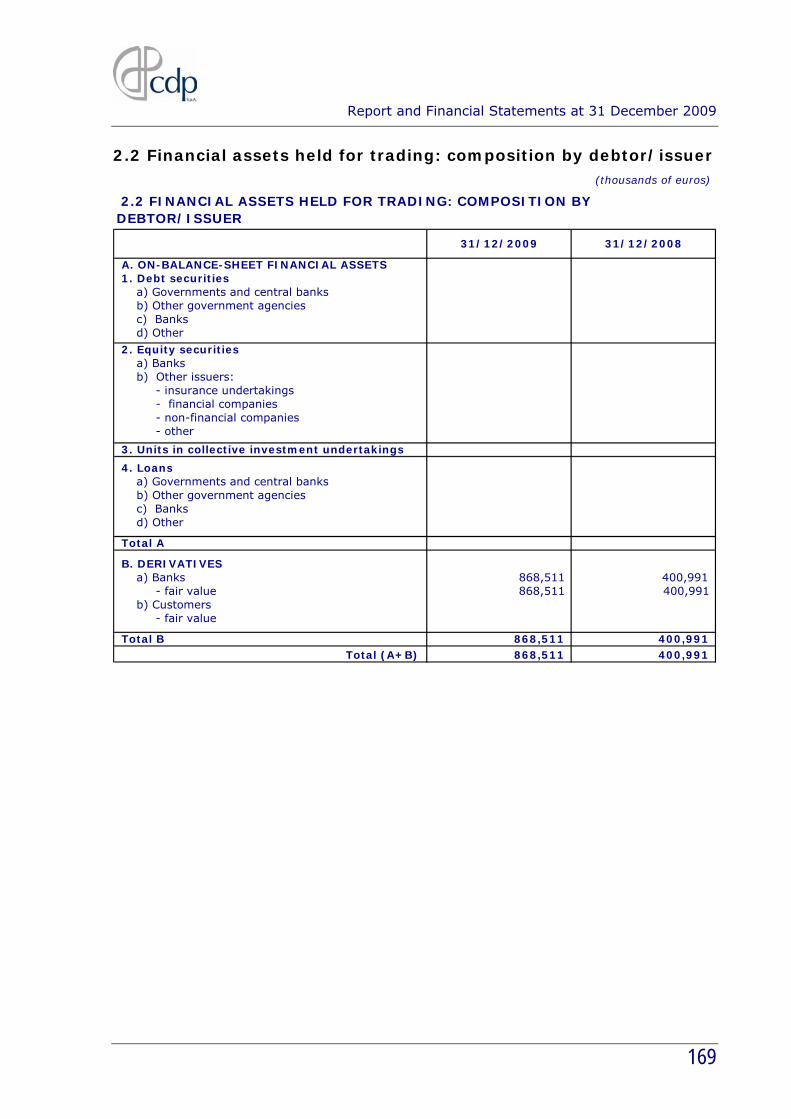
Report and Financial Statements at 31 December 2009
169
2.2 Financial assets held for trading: composition by debtor/issuer (thousands of euros)
A. ON-BALANCE-SHEET FINANCIAL ASSETS1. Debt securities a) Governments and central banks b) Other government agencies c) Banks d) Other
2. Equity securities a) Banks b) Other issuers: - insurance undertakings - financial companies - non-financial companies - other
3. Units in collective investment undertakings
4. Loans a) Governments and central banks b) Other government agencies c) Banks d) Other
Total A
B. DERIVATIVES a) Banks 868,511 400,991 - fair value 868,511 400,991 b) Customers - fair value
Total B 868,511 400,991 Total (A+B) 868,511 400,991
31/12/2009 31/12/2008
2.2 FINANCIAL ASSETS HELD FOR TRADING: COMPOSITION BY DEBTOR/ISSUER

Report and Financial Statements at 31 December 2009
170
SECTION 4 – FINANCIAL ASSETS AVAILABLE FOR SALE – ITEM 40
4.1 Financial assets available for sale: composition by type
(thousands of euros)
Level 1 Level 2 Level 3 Level 1 Level 2 Level 3
1. Debt securities 1.1 Structured securities 1.2 Other debt securities 199,116 8,500 202,014 9,560 2. Equity securities 2.1 At fair value 13,733,179 9,538,823 2.2 At cost 10,216 9,716 3. Units in collective investment undertakings 40,301 15,118 4. Loans
Total 13,932,295 8,500 50,517 9,740,837 9,560 24,834
31/12/2009 31/12/2008
4.1 FINANCIAL ASSETS AVAILABLE FOR SALE: COMPOSITION BY TYPE

Report and Financial Statements at 31 December 2009
171
4.2 Financial assets available for sale: composition by debtor/issuer
(thousands of euros)
1. Debt securities 207,616 211,574 a) Governments and central banks b) Other government agencies 8,500 9,560 c) Banks d) Other 199,116 202,014
2. Equity securities 13,743,395 9,548,539 a) Banks 2,066 2,066 b) Other issuers 13,741,329 9,546,473 - insurance undertakings - financial companies 8,150 7,650 - non financial companies 13,733,179 9,538,823 - other
3. Units in collective investment undertakings 40,301 15,118
4. Loans a) Governments and central banks b) Other government agencies c) Banks d) Other
Total 13,991,312 9,775,231
4.2 FINANCIAL ASSETS AVAILABLE FOR SALE: COMPOSITION BY DEBTOR/ISSUER
31/12/2009 31/12/2008
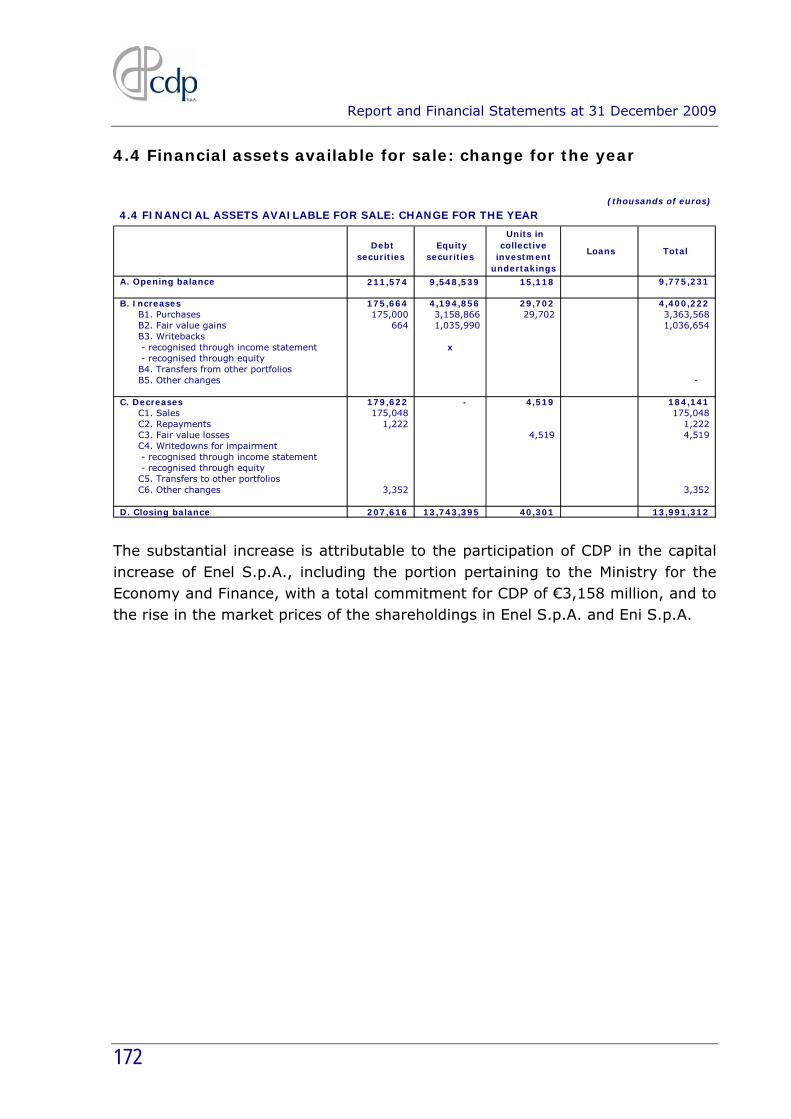
Report and Financial Statements at 31 December 2009
172
4.4 Financial assets available for sale: change for the year
(thousands of euros)
A. Opening balance 211,574 9,548,539 15,118 9,775,231
B. Increases 175,664 4,194,856 29,702 4,400,222 B1. Purchases 175,000 3,158,866 29,702 3,363,568 B2. Fair value gains 664 1,035,990 1,036,654 B3. Writebacks - recognised through income statement x - recognised through equity B4. Transfers from other portfolios B5. Other changes -
C. Decreases 179,622 - 4,519 184,141 C1. Sales 175,048 175,048 C2. Repayments 1,222 1,222 C3. Fair value losses 4,519 4,519 C4. Writedowns for impairment - recognised through income statement - recognised through equity C5. Transfers to other portfolios C6. Other changes 3,352 3,352
D. Closing balance 207,616 13,743,395 40,301 13,991,312
4.4 FINANCIAL ASSETS AVAILABLE FOR SALE: CHANGE FOR THE YEAR
Debt securities
Equity securities
Units in collective
investment undertakings
Loans Total
The substantial increase is attributable to the participation of CDP in the capital increase of Enel S.p.A., including the portion pertaining to the Ministry for the Economy and Finance, with a total commitment for CDP of €3,158 million, and to the rise in the market prices of the shareholdings in Enel S.p.A. and Eni S.p.A.

Report and Financial Statements at 31 December 2009
173
SECTION 5 – FINANCIAL ASSETS HELD TO MATURITY – ITEM 50
5.1 Financial assets held to maturity: composition by type
(thousands of euros)
FV FV
Level 1 Level 2 Level 3 Level 1 Level 2 Level 3
1. Debt securities - structured - other 205,285 215,133 205,795 197,132 2. Loans
Total 205,285 215,133 205,795 197,132
KeyFV = fair valueBV = book value
5.1 FINANCIAL ASSETS HELD TO MATURITY: COMPOSITION BY TYPE
31/12/2009 31/12/2008
BV BV
The item includes inflation-linked Treasury bonds with a nominal value of €200 million acquired in 2008 in response to the increasing exposure of the balance sheet to Italian inflation due to the issue of postal savings bonds indexed to inflation.

Report and Financial Statements at 31 December 2009
174
5.2 Financial assets held to maturity: composition by debtor/issuer
(thousands of euros)
31/12/2009 31/12/2008
1. Debt securities 205,285 205,795 a) Governments and central banks 205,285 205,795 b) Other government agencies c) Banks d) Other
2. Loans to a) Governments and central banks b) Other government agencies c) Banks d) Other
5.2 FINANCIAL ASSETS HELD TO MATURITY: COMPOSITION BY DEBTOR/ISSUER

Report and Financial Statements at 31 December 2009
175
5.4 Financial assets held to maturity: change for the year (thousands of euros)
A. Opening balance 205,795 205,795 B. Increases - - B1. Purchases B2. Writebacks B3. Transfers from other portfolios B4. Other changes
C. Decreases 510 510 C1. Sales C2. Repayments C3. Writedowns C4. Transfers to other portfolios C5. Other changes 510 510
D. Closing balance 205,285 205,285
5.4 FINANCIAL ASSETS HELD TO MATURITY: CHANGE FOR THE YEAR
Debt securities
Loans Total
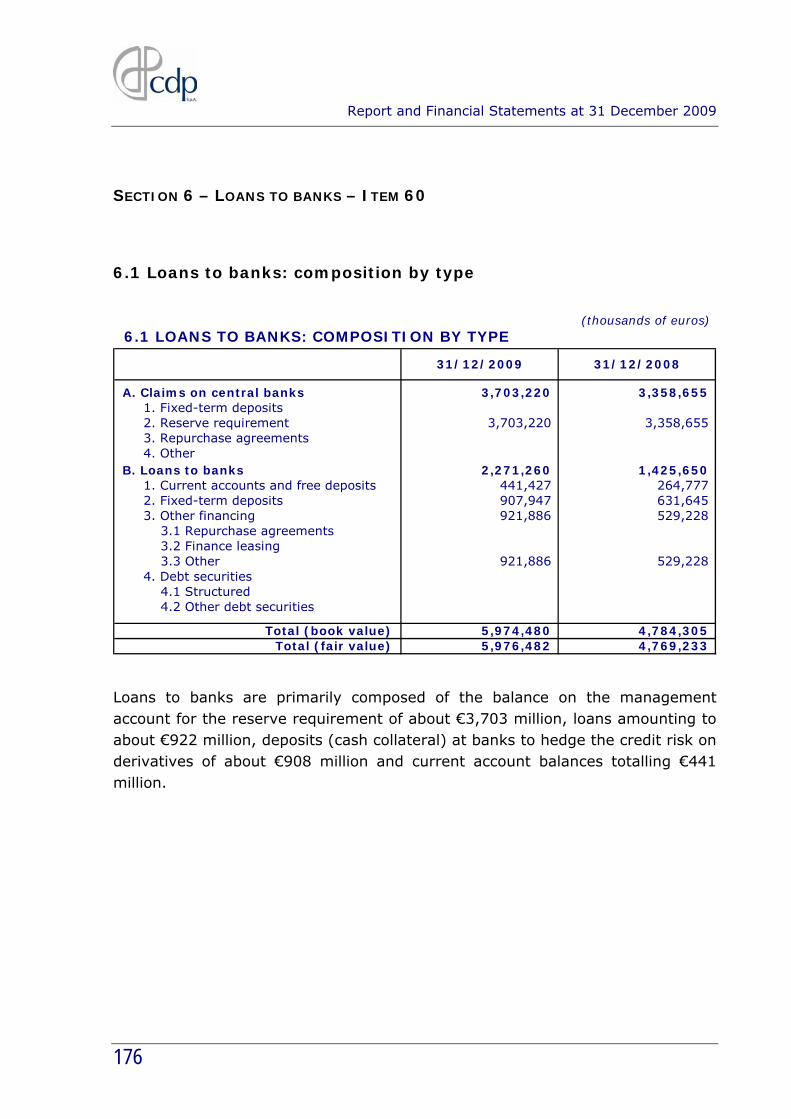
Report and Financial Statements at 31 December 2009
176
SECTION 6 – LOANS TO BANKS – ITEM 60
6.1 Loans to banks: composition by type
(thousands of euros)
6.1 LOANS TO BANKS: COMPOSITION BY TYPE
A. Claims on central banks 3,703,220 3,358,655 1. Fixed-term deposits 2. Reserve requirement 3,703,220 3,358,655 3. Repurchase agreements 4. OtherB. Loans to banks 2,271,260 1,425,650 1. Current accounts and free deposits 441,427 264,777 2. Fixed-term deposits 907,947 631,645 3. Other financing 921,886 529,228 3.1 Repurchase agreements 3.2 Finance leasing 3.3 Other 921,886 529,228 4. Debt securities 4.1 Structured 4.2 Other debt securities
Total (book value) 5,974,480 4,784,305 Total (fair value) 5,976,482 4,769,233
31/12/2009 31/12/2008
Loans to banks are primarily composed of the balance on the management account for the reserve requirement of about €3,703 million, loans amounting to about €922 million, deposits (cash collateral) at banks to hedge the credit risk on derivatives of about €908 million and current account balances totalling €441 million.

Report and Financial Statements at 31 December 2009
177
6.2 Loans to banks: assets hedged specifically
(thousands of euros)
1. Loans with specific fair value hedges: 107,853 116,221 a) interest rate risk 107,853 116,221 b) exchange rate risk c) credit risk d) multiple risks
2. Loans with specific cash flow hedges: a) interest rate risk b) exchange rate risk c) other
Total 107,853 116,221
6.2 LOANS TO BANKS: ASSETS HEDGED SPECIFICALLY
31/12/2009 31/12/2008
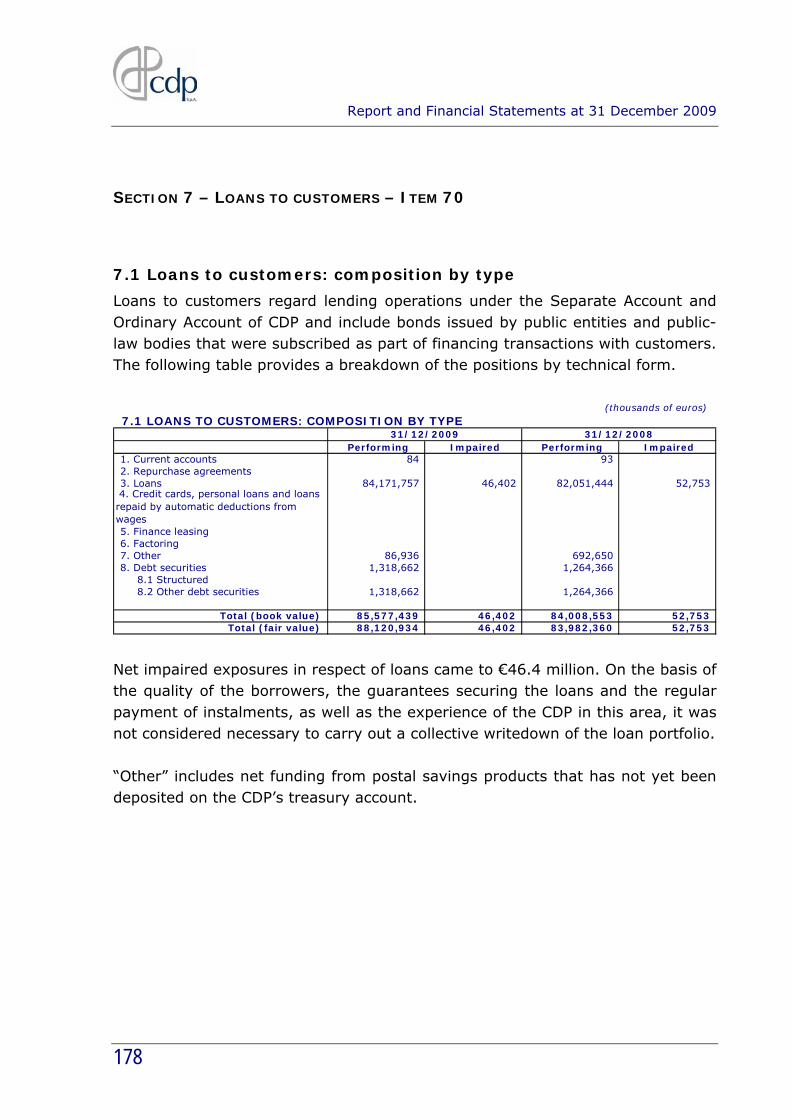
Report and Financial Statements at 31 December 2009
178
SECTION 7 – LOANS TO CUSTOMERS – ITEM 70
7.1 Loans to customers: composition by type
Loans to customers regard lending operations under the Separate Account and Ordinary Account of CDP and include bonds issued by public entities and public-law bodies that were subscribed as part of financing transactions with customers. The following table provides a breakdown of the positions by technical form.
(thousands of euros)
7.1 LOANS TO CUSTOMERS: COMPOSITION BY TYPE
Performing Impaired Performing Impaired 1. Current accounts 84 93 2. Repurchase agreements3. Loans 84,171,757 46,402 82,051,444 52,753
4. Credit cards, personal loans and loans repaid by automatic deductions from wages 5. Finance leasing6. Factoring7. Other 86,936 692,650 8. Debt securities 1,318,662 1,264,366 8.1 Structured 8.2 Other debt securities 1,318,662 1,264,366
Total (book value) 85,577,439 46,402 84,008,553 52,753 Total (fair value) 88,120,934 46,402 83,982,360 52,753
31/12/2009 31/12/2008
Net impaired exposures in respect of loans came to €46.4 million. On the basis of the quality of the borrowers, the guarantees securing the loans and the regular payment of instalments, as well as the experience of the CDP in this area, it was not considered necessary to carry out a collective writedown of the loan portfolio. “Other” includes net funding from postal savings products that has not yet been deposited on the CDP’s treasury account.

Report and Financial Statements at 31 December 2009
179
7.2 Loans to customers: composition by debtor/issuer
(thousands of euros)
Performing Impaired Performing Impaired 1. Debt securities: 1,318,662 - 1,264,366 a) Governments 274,312 274,234 b) Other government agencies 609,151 532,607 c) Other issuers 435,199 457,525 - non financial companies 49,358 457,525 - financial companies 385,841 - insurance undertakings - other
2. Loans to: 84,258,777 46,402 82,744,187 52,753 a) Governments 33,231,368 33,934,883 b) Other government agencies 44,278,780 5,466 42,312,526 23,676 c) Other 6,748,629 40,936 6,496,778 29,077 - non financial companies 6,701,434 18,783 6,262,323 7,248 - financial companies - 21,829 193,749 21,829 - insurance undertakings - other 47,195 324 40,706
Total 85,577,439 46,402 84,008,553 52,753
7.2 LOANS TO CUSTOMERS: COMPOSITION BY DEBTOR/ISSUER 31/12/200831/12/2009
7.3 Loans to customers: assets hedged specifically
(thousands of euros)
1. Loans with specific fair value hedges: 16,808,271 18,527,794 a) interest rate risk 16,808,271 18,527,794 b) exchange rate risk c) credit risk d) multiple risks
2. Loans with specific cash flow hedges: a) interest rate risk b) exchange rate risk c) other
Total 16,808,271 18,527,794
31/12/2009 31/12/2008
7.3 LOANS TO CUSTOMERS: ASSETS HEDGED SPECIFICALLY

Report and Financial Statements at 31 December 2009
180
SECTION 8 – HEDGING DERIVATIVES – ITEM 80
8.1 Hedging derivatives: composition by type of hedge and level of inputs
(thousands of euros)
L1 L2 L3 L1 L2 L3
A. Financial derivatives 331,026 577 7,648,103 100,620 3,470,791 1) Fair value 319,100 577 7,573,005 85,365 3,391,514 2) Cash flow 11,926 75,098 15,255 79,277 3) Investment in foreign operation
B. Credit derivatives 1) Fair value 2) Cash flow
Total 331,026 577 7,648,103 100,620 3,470,791
Key NV = notional value L1 = Level 1L2 = Level 2L3 = Level 3
NV 31/12/2008
8.1 HEDGING DERIVATIVES: COMPOSITION BY TYPE OF HEDGE AND LEVEL OF INPUTS NV
31/12/2009 31/12/2009 31/12/2008
8.2 Hedging derivatives: composition by hedged portfolio and type of hedge
(thousands of euros)8.2 HEDGING DERIVATIVES: COMPOSITION BY HEDGED PORTFOLIO AND TYPE OF HEDGE
interest rate risk
exchange rate risk
credit risk price risk multiple
risks
1. Financial assets available for sale
x x x
2. Loans 969 x x x x 3. Financial assets held to maturity
x x x x x
4. Portfolio x x x x x x x 5. Other x x
Total assets 969 1. Financial liabilities 309,716 x 8,992 x 11,926 x x 2. Portfolio x x x x x x x
Total liabilities 309,716 8,992 11,926 1. Forecast transactions x x x x x x x x 2. Portfolio of financial assets and liabilities
x x x x x x
Investment in foreign operation
Fair value Cash flow
Specific
Generic Specific Generic
At 31 December 2009, the only open cash flow hedge regarded a fixed-rate covered bond in yen, which was hedged with a cross currency swap to counter

Report and Financial Statements at 31 December 2009
181
the uncertainty concerning cash flows due to possible exchange rate variations. The hedge converts the original exposure into a fixed rate in euros.

Report and Financial Statements at 31 December 2009
182
SECTION 10 – EQUITY INVESTMENTS – ITEM 100
10.1 Equity investments in subsidiaries, joint ventures and companies subject to significant influence: information on investments
A. Wholly-owned subsidiaries 1. Terna S.p.A. Rome 29.99% 29.99% 2. CDP Investimenti SGR S.p.A. Rome 70.00% 70.00%
B. Joint ventures 1. STMicroelectronics Holding N.V. Amsterdam 50.00% 50.00%
C. Companies under significant influence 1. Poste Italiane S.p.A. Rome 35.00% 35.00% 2. Galaxy S.àr.l. SICAR Luxembourg 40.00% 40.00% 3. Europrogetti & Finanza S.p.A. in liquidation Rome 31.80% 31.80% 4. Tunnel di Genova S.p.A. Genoa 33.33% 33.33%
10.1 EQUITY INVESTMENTS IN SUBSIDIARIES, JOINT VENTURES AND COMPANIES SUBJECT TO SIGNIFICANT INFLUENCE: INFORMATION ON INVESTMENTS
% of votesName Registered
office% holding

Report and Financial Statements at 31 December 2009
183
10.2 Equity investments in subsidiaries, joint ventures and companies subject to significant influence: accounting data
(thousands of euros)
A. Wholly-owned subsidiaries 9,321,579 1,789,180 770,660 2,503,181 1,316,600 1. Terna S.p.A. (1) 9,319,649 1,789,172 770,954 2,501,475 1,315,200 x
2. CDP Investimenti SGR S.p.A. (1) 1,930 8 (294) 1,706 1,400 x
B. Joint ventures 770,012 2 (81,942) 768,065 625,990 1. STMicroelectronics Holding N.V. (1) 770,012 2 (81,942) 768,065 625,990 x
C. Companies under significant influence 86,007,936 9,573,633 430,153 4,020,079 2,544,312
1. Poste Italiane S.p.A. (2) 85,896,520 9,530,622 467,645 3,944,747 2,518,744 2. Galaxy S.àr.l. SICAR (2) 93,133 37,347 (34,967) 67,702 25,568 3. Europrogetti & Finanza S.p.A. in liquidation (3) 13,497 5,614 (2,476) 7,355 - 4. Tunnel di Genova S.p.A. (3) 4,786 50 (49) 275 -
Total 96,099,527 11,362,815 1,118,871 7,291,325 4,486,902
(1) Figures from financial statements at 31/12/09(2) Figures from financial statements at 30/06/09(3) Figures from financial statements at 31/12/07
10.2 EQUITY INVESTMENTS IN SUBSIDIARIES, JOINT VENTURES AND COMPANIES SUBJECT TO SIGNIFICANT INFLUENCE: ACCOUNTING DATA
Fair value Total assets Total
revenues Net income
(loss) Shareholders’
equity Book value
Name
10.3 Equity investments: change for the year
(thousands of euros)
10.3 EQUITY INVESTMENTS: CHANGE FOR THE YEAR
A. Opening balance 4,305,254 4,806,496
B. Increases 181,648 3,300 B.1 Purchases 181,648 3,300 B.2 WritebacksB.3 RevaluationsB.4 Other increases
C. Decreases 504,542 C.1 SalesC.2 Writedowns 504,542 C.3 Other decreases
D. Closing balance 4,486,902 4,305,254 E. Total revaluations - F. Total writedowns 976,445 976,445
31/12/200831/12/2009
At the end of 2009 CDP acquired about 3.7% of STMicroelectronics N.V. from Finmeccanica S.p.A. for a total of about €172 million (as well as the grant to Finmeccanica of an earn-out if the price of STM should exceed the agreed threshold level in March 2011). Following completion of the transaction, CDP holds 50% of STMicroelectronics Holding N.V.

Report and Financial Statements at 31 December 2009
184
10.6 Obligations relating to companies subject to significant influence
CDP is a shareholder of Galaxy S.àr.l. SICAR, a Luxembourg company that makes equity or quasi-equity investments in projects and infrastructure in the transportation sector. At 31 December 2009, a total of some €25.6 million had been paid in. Under the shareholders agreement, as from the end of the investment period, which terminated on 9 July 2008, additional payments can be requested from the shareholders only for: (i) payment of the company’s running costs (such as, for example, operating expenses and management commissions) and (ii) the completion of investments already approved.

Report and Financial Statements at 31 December 2009
185
SECTION 11 – PROPERTY, PLANT AND EQUIPMENT – ITEM 110
11.1 Property, plant and equipment: composition of assets measured at cost
Property, plant and equipment includes all of the movable and immovable property of Cassa Depositi e Prestiti, net of depreciation, and at period-end breaks down as follows:
(thousands of euros)
A. Operating assets
1.1 owned 203,918 207,860 a) land 117,406 117,406 b) buildings 69,874 72,172 c) movables 3,317 3,458 d) electrical plant 3,143 4,659 e) other 10,178 10,165
1.2 acquired under finance leases a) land b) buildings c) movables d) electrical plant e) other
Total A 203,918 207,860
B. Investment property
2.1 owned a) land b) buildings
2.2 acquired under finance leases a) land b) buildings
Total B - - Total (A+B) 203,918 207,860
31/12/2009 31/12/2008
11.1 PROPERTY, PLANT AND EQUIPMENT: COMPOSITION OF ASSETS MEASURED AT COST

Report and Financial Statements at 31 December 2009
186
11.3 Operating property, plant and equipment: change for the year
(thousands of euros)
11.3 OPERATING PROPERTY, PLANT AND EQUIPMENT: CHANGE FOR THE YEAR
A. Opening gross balance 117,406 82,805 11,357 17,684 24,610 253,862 A.1 Total net writedowns - (10,633) (7,899) (13,025) (14,445) (46,002) A.2 Opening net balance 117,406 72,172 3,458 4,659 10,165 207,860
B. Increases - 189 544 195 1,792 2,720 B.1 Purchases 189 544 195 1,792 2,720 B.2 Capitalised improvement costsB.3 WritebacksB.4 Fair value gains recognised in a) equity b) income statementB.5 Positive exchange rate differencesB.6 Transfers from investment propertyB.7 Other changes
C. Decreases - 2,487 685 1,711 1,779 6,662 C.1 SalesC.2 Depreciation 2,487 685 1,711 1,779 6,662 C.3 Writedowns for impairment recognised in a) equity b) income statementC.4 Fair value losses recognised in a) equity b) income statementC.5 Negative exchange rate differencesC.6 Transfers to
a) investment property b) assets held for saleC.7 Other changes
D. Closing net balance 117,406 69,874 3,317 3,143 10,178 203,918 D.1 Total net writedowns - (13,120) (8,584) (14,736) (16,224) (52,664)
D.2 Closing gross balance 117,406 82,994 11,901 17,879 26,402 256,582 E. Measurement at cost
Other Total Electrical
plant Land Buildings Movables

Report and Financial Statements at 31 December 2009
187
SECTION 12 – INTANGIBLE ASSETS – ITEM 120
12.1 Intangible assets: composition by category
Intangible assets break down as follows:
(thousands of euros)
12.1 INTANGIBLE ASSETS: COMPOSITION BY CATEGORY
A.1 Goodwill x x
A.2 Other intangible assets 6,572 6,379
A.2.1 Assets carried at cost 6,572 6,379 a) internally-generated intangible assets b) other assets 6,572 6,379
A.2.2 Assets recognised at fair value: a) internally-generated intangible assets b) other assets
Total 6,572 6,379
31/12/2009 31/12/2008
Indefinite life
Definite life Indefinite
life Definite life

Report and Financial Statements at 31 December 2009
188
12.2 Intangible assets: change for the year (thousands of euros)
12.2 INTANGIBLE ASSETS: CHANGE FOR THE YEAR
A. Opening balance 11,876 11,876 A.1 Total net writedowns (5,497) (5,497) A.2 Opening net balance 6,379 6,379
B. Increases 2,543 2,543 B.1 Purchases 2,543 2,543 B.2 Increases in internally generated intangible assets xB.3 Writebacks xB.4 Fair value gains - equity x - income statement x
B.5 Positive exchange rate differences B.6 Other changes
C. Decreases 2,350 2,350 C.1 SalesC.2 Writedowns - Amortisation x 2,350 2,350 - Impairment + equity x + income statementC.3 Fair value losses - equity x - income statement x
C.4 Transfer to non-current assets held for sale C.5 Negative exchange rate differencesC.6 Other changes
D. Closing net balance 6,572 6,572 D.1 Total net writedowns (7,847) (7,847) E. Closing gross balance 14,419 14,419 F. Measurement at cost
KeyDEF: definite lifeINDEF: indefinite life
Other intangible assets: other
Total
DEF INDEF DEF INDEF
Goodwill
Other intangible assets: internally
generated
12.3 Other information
With regard to the disclosures required under international accounting standards, it should be noted that: a) intangible assets were not revalued; b) no intangible assets acquired by way of government grants are held (IAS 38, paragraph 122, letter c); c) no intangible assets are pledged as security for liabilities (IAS 38, paragraph 122, letter d); d) there are no contractual commitments for the purchase of intangible assets (IAS 38, paragraph 122, letter e); e) no intangible assets are the object of leasing transactions.

Report and Financial Statements at 31 December 2009
189
SECTION 13 – TAX ASSETS AND LIABILITIES – ITEM 130 OF ASSETS AND ITEM
80 OF LIABILITIES
13.1 Deferred tax assets: composition
Deferred tax assets arise in respect of taxes calculated on temporary differences in the values reported for tax purposes and those used for financial reporting that will become deductible in periods following the period in which they are recognised. They mainly regard accruals to the provision for risks and the provision for future employee expenses, depreciation/amortisation charges with deferred deductibility, fair value measurement of non-current available-for-sale financial assets and the fair value measurement of derivatives hedging debt securities, performed in application of international accounting standards.
13.2 Deferred tax liabilities: composition
Conversely, deferred tax liabilities arise in respect of taxes calculated on temporary differences in the values reported for tax purposes and those used for financial reporting that will fall due in periods following the period in which they are recognised. They regard the fair value measurement of available-for-sale investments and securities and derivatives hedging cash flows in respect of financial liabilities (cash flow hedges).

Report and Financial Statements at 31 December 2009
190
13.3 Changes in deferred tax assets (recognised in income statement)
(thousands of euros)
1. Opening balance 75,941 325,395
2. Increases 2,069 8,014 2.1 Deferred tax assets recognised during the year a) in respect of previous periods b) due to change in accounting policies c) writebacks 2,069 8,009 d) other2.2 New taxes or increases in tax rates 5 2.3 Other increases
3. Decreases 54,369 257,468 3.1 Deferred tax assets derecognised during the year a) reversals 54,369 257,468 b) writedowns for supervening non-recoverability c) due to change in accounting policies3.2 Reduction in tax rates3.3 Other decreases
4. Closing balance 23,641 75,941
13.3 CHANGES IN DEFERRED TAX ASSETS (RECOGNISED IN INCOME STATEMENT)
31/12/2009 31/12/2008

Report and Financial Statements at 31 December 2009
191
13.4 Changes in deferred tax liabilities (recognised in income statement)
(thousands of euros)
1. Opening balance 269,775 545,830
2. Increases 28 73 2.1 Deferred tax liabilities recognised during the year a) in respect of previous periods b) due to change in accounting policies c) other 28 73 2.2 New taxes or increases in tax rates2.3 Other increases
3. Decreases 269,775 276,128 3.1 Deferred tax liabilities derecognised during the year a) reversals 73 276,128 b) due to change in accounting policies c) other 269,702 3.2 Reduction in tax rates3.3 Other decreases
4. Closing balance 28 269,775
13.4 CHANGES IN DEFERRED TAX LIABILITIES (RECOGNISED IN INCOME STATEMENT)
31/12/2009 31/12/2008
The decrease mainly regard deferred tax liabilities in respect of tax-suspended reserves that will be discharged in 2010 with payment of the one-off tax envisaged under current regulations.

Report and Financial Statements at 31 December 2009
192
13.5 Changes in deferred tax assets (recognised in shareholders’ equity)
(thousands of euros)
1. Opening balance 16,347 807
2. Increases 1,461 15,701 2.1 Deferred tax assets recognised during the year
a) in respect of previous periods
b) due to change in accounting policies
c) other 1,461 15,701 2.2 New taxes or increases in tax rates2.3 Other increases
3. Decreases 15,512 161 3.1 Deferred tax assets derecognised during the year
a) reversals 15,512 161
b) writedowns for supervening non-recoverability
c) due to changes in accounting policies3.2 Reduction in tax rates3.3 Other decreases
4. Closing balance 2,296 16,347
13.5 CHANGES IN DEFERRED TAX ASSETS (RECOGNISED IN SHAREHOLDERS’ EQUITY)
31/12/2009 31/12/2008
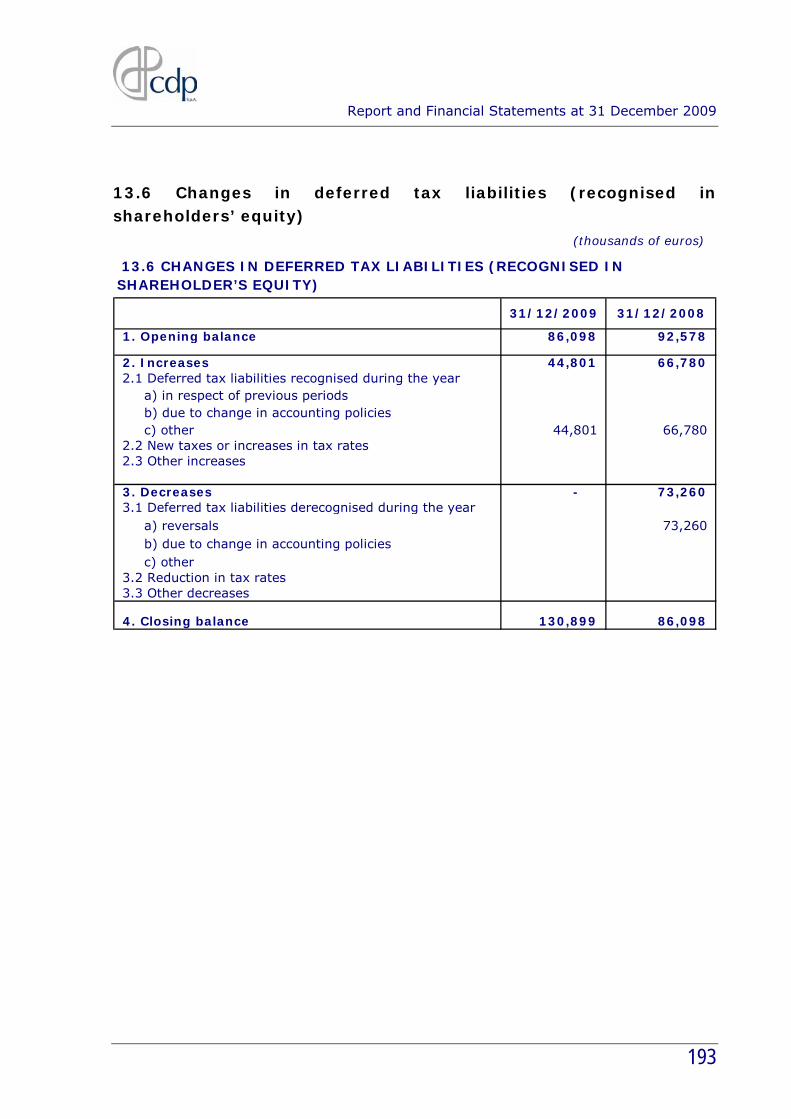
Report and Financial Statements at 31 December 2009
193
13.6 Changes in deferred tax liabilities (recognised in shareholders’ equity)
(thousands of euros)
1. Opening balance 86,098 92,578
2. Increases 44,801 66,780 2.1 Deferred tax liabilities recognised during the year a) in respect of previous periods b) due to change in accounting policies c) other 44,801 66,780 2.2 New taxes or increases in tax rates2.3 Other increases
3. Decreases - 73,260 3.1 Deferred tax liabilities derecognised during the year a) reversals 73,260 b) due to change in accounting policies c) other3.2 Reduction in tax rates3.3 Other decreases
4. Closing balance 130,899 86,098
13.6 CHANGES IN DEFERRED TAX LIABILITIES (RECOGNISED IN SHAREHOLDER’S EQUITY)
31/12/2009 31/12/2008

Report and Financial Statements at 31 December 2009
194
13.7 Other information
(thousands of euros)
Provisions for liabilities and contingencies 2,467 8,203Depreciation and amortisation 3,616 3,642Financial instruments 13,167 58,243Payables 4,360 5,804Financial assets available for sale 1,649 15,539Securities holding 646 808Other 32 49
Total 25,937 92,288
13.7.1 DEFERRED TAX ASSETS: COMPOSITION
31/12/200831/12/2009
(thousands of euros)
Financial assets available for sale 130,251 85,874Securities holding 75 22Financial instruments 573 275Provision for impaired loans - 269,702Other 28
Total 130,927 355,873
31/12/2009
13.7.2 DEFERRED TAX LIABILITIES: COMPOSITION
31/12/2008
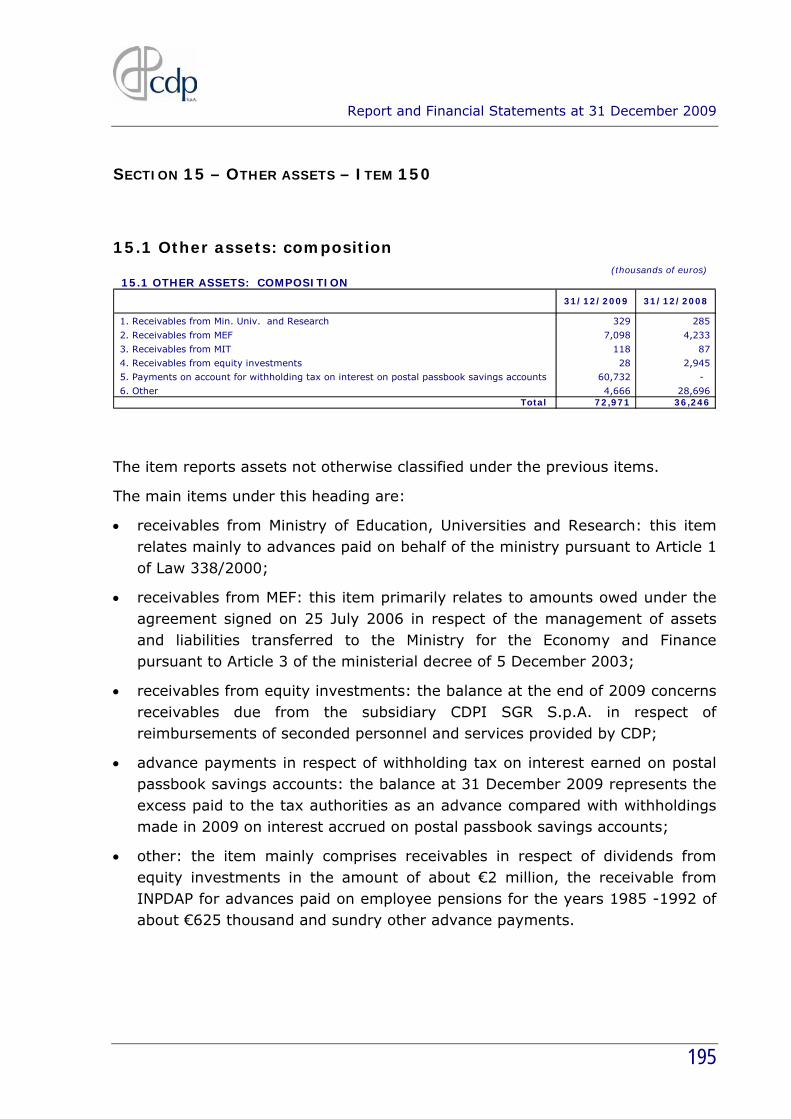
Report and Financial Statements at 31 December 2009
195
SECTION 15 – OTHER ASSETS – ITEM 150
15.1 Other assets: composition (thousands of euros)
15.1 OTHER ASSETS: COMPOSITION
1. Receivables from Min. Univ. and Research 329 285
2. Receivables from MEF 7,098 4,233
3. Receivables from MIT 118 87
4. Receivables from equity investments 28 2,945
5. Payments on account for withholding tax on interest on postal passbook savings accounts 60,732 -
6. Other 4,666 28,696 Total 72,971 36,246
31/12/2009 31/12/2008
The item reports assets not otherwise classified under the previous items.
The main items under this heading are:
• receivables from Ministry of Education, Universities and Research: this item relates mainly to advances paid on behalf of the ministry pursuant to Article 1 of Law 338/2000;
• receivables from MEF: this item primarily relates to amounts owed under the agreement signed on 25 July 2006 in respect of the management of assets and liabilities transferred to the Ministry for the Economy and Finance pursuant to Article 3 of the ministerial decree of 5 December 2003;
• receivables from equity investments: the balance at the end of 2009 concerns receivables due from the subsidiary CDPI SGR S.p.A. in respect of reimbursements of seconded personnel and services provided by CDP;
• advance payments in respect of withholding tax on interest earned on postal passbook savings accounts: the balance at 31 December 2009 represents the excess paid to the tax authorities as an advance compared with withholdings made in 2009 on interest accrued on postal passbook savings accounts;
• other: the item mainly comprises receivables in respect of dividends from equity investments in the amount of about €2 million, the receivable from INPDAP for advances paid on employee pensions for the years 1985 -1992 of about €625 thousand and sundry other advance payments.

Report and Financial Statements at 31 December 2009
196
LIABILITIES
SECTION 1 – DUE TO BANKS – ITEM 10
1.1 Due to banks: composition by type
(thousands of euros)
1.1 DUE TO BANKS: COMPOSITION BY TYPE
1. Due to central banks 24,128 19,449
2. Due to banks 2,650,169 674,155 2.1 Current accounts and demand deposits 425,852 7,429 2.2 Fixed-term deposits 625,165 85,046 2.3 Borrowings 1,582,372 565,540 2.3.1 Repurchase agreements 188,660 2.3.2 Other 1,393,712 565,540
2.4 Liabilities in respect of commitments to repurchase own equity instruments 2.5 Other payables 16,780 16,140
Total 2,674,297 693,604 Fair value 2,674,297 693,604
31/12/2009 31/12/2008
The item “Due to central banks” includes the payable to the Bank of Italy for unpaid direct debits equal to €24 million settled in early 2010.
Fixed-term deposits refer to cash collateral under Credit Support Annexes securing the credit risk on derivatives.
Other borrowings regard loans from the EIB and amounts to be transferred to counterparties in a non-recourse assignment of receivables.
Other amounts due to banks include the payable for options with deferred premiums.
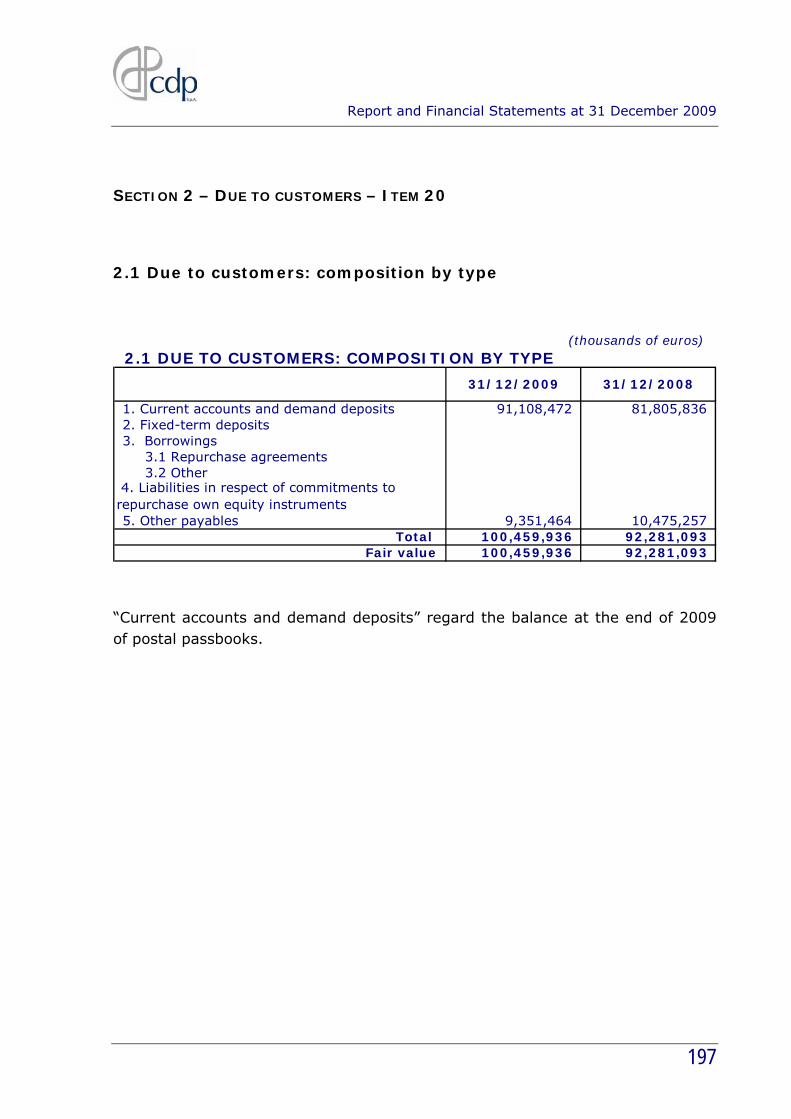
Report and Financial Statements at 31 December 2009
197
SECTION 2 – DUE TO CUSTOMERS – ITEM 20
2.1 Due to customers: composition by type
(thousands of euros)2.1 DUE TO CUSTOMERS: COMPOSITION BY TYPE
1. Current accounts and demand deposits 91,108,472 81,805,836 2. Fixed-term deposits3. Borrowings 3.1 Repurchase agreements 3.2 Other
4. Liabilities in respect of commitments to repurchase own equity instruments 5. Other payables 9,351,464 10,475,257
Total 100,459,936 92,281,093 Fair value 100,459,936 92,281,093
31/12/2009 31/12/2008
“Current accounts and demand deposits” regard the balance at the end of 2009 of postal passbooks.
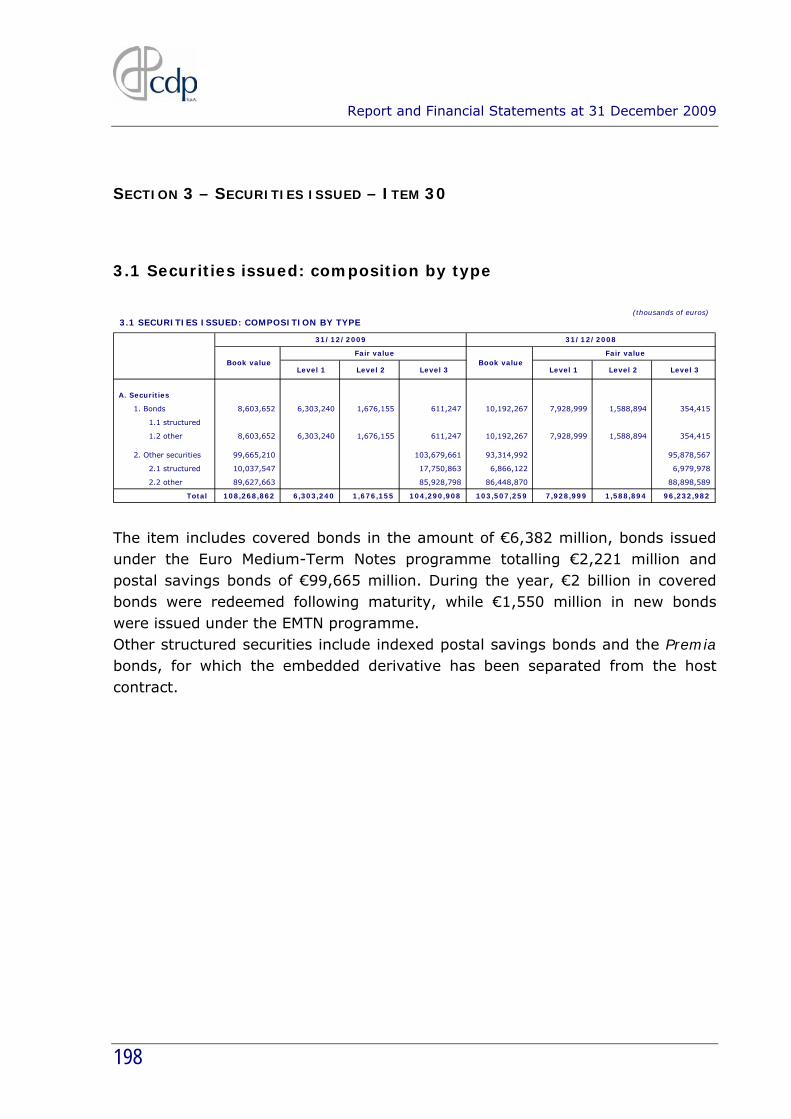
Report and Financial Statements at 31 December 2009
198
SECTION 3 – SECURITIES ISSUED – ITEM 30
3.1 Securities issued: composition by type
(thousands of euros)
3.1 SECURITIES ISSUED: COMPOSITION BY TYPE
Level 1 Level 2 Level 3 Level 1 Level 2 Level 3
A. Securities
1. Bonds 8,603,652 6,303,240 1,676,155 611,247 10,192,267 7,928,999 1,588,894 354,415
1.1 structured
1.2 other 8,603,652 6,303,240 1,676,155 611,247 10,192,267 7,928,999 1,588,894 354,415
2. Other securities 99,665,210 103,679,661 93,314,992 95,878,567
2.1 structured 10,037,547 17,750,863 6,866,122 6,979,978
2.2 other 89,627,663 85,928,798 86,448,870 88,898,589
Total 108,268,862 6,303,240 1,676,155 104,290,908 103,507,259 7,928,999 1,588,894 96,232,982
31/12/2008
Fair value Book value Book value
Fair value
31/12/2009
The item includes covered bonds in the amount of €6,382 million, bonds issued under the Euro Medium-Term Notes programme totalling €2,221 million and postal savings bonds of €99,665 million. During the year, €2 billion in covered bonds were redeemed following maturity, while €1,550 million in new bonds were issued under the EMTN programme. Other structured securities include indexed postal savings bonds and the Premia bonds, for which the embedded derivative has been separated from the host contract.
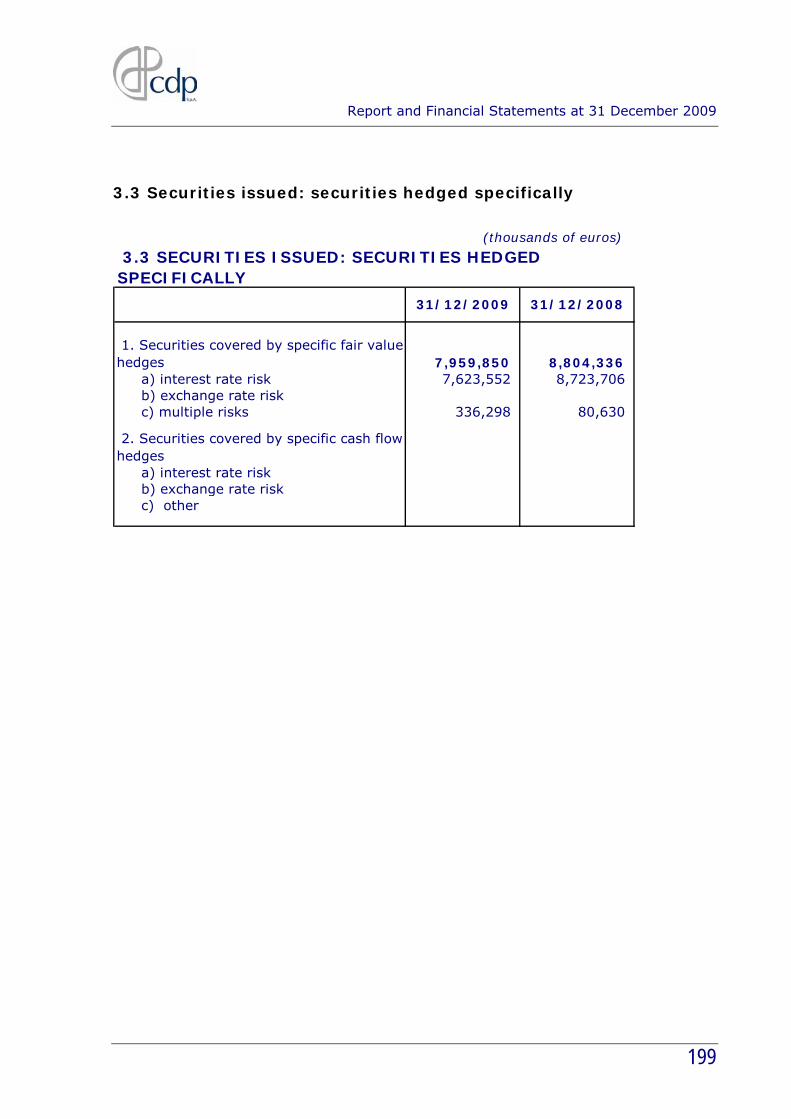
Report and Financial Statements at 31 December 2009
199
3.3 Securities issued: securities hedged specifically
(thousands of euros)
1. Securities covered by specific fair value hedges 7,959,850 8,804,336 a) interest rate risk 7,623,552 8,723,706 b) exchange rate risk c) multiple risks 336,298 80,630
2. Securities covered by specific cash flow hedges a) interest rate risk b) exchange rate risk c) other
31/12/2009 31/12/2008
3.3 SECURITIES ISSUED: SECURITIES HEDGED SPECIFICALLY
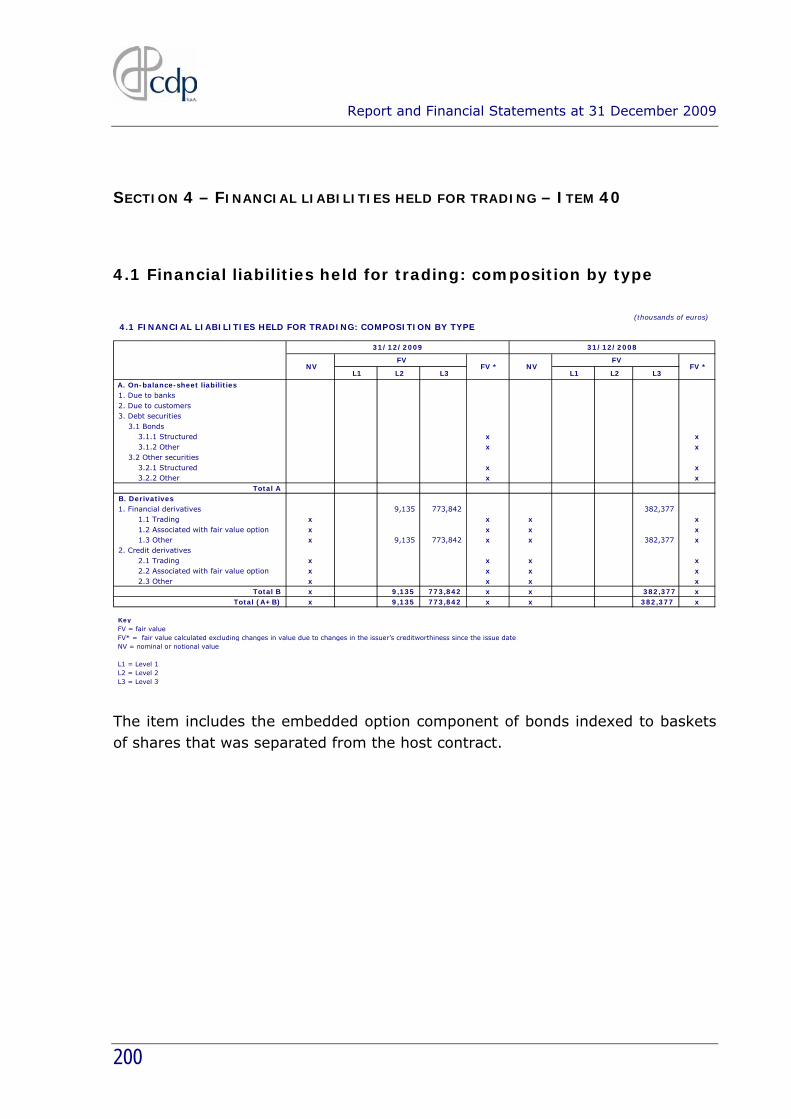
Report and Financial Statements at 31 December 2009
200
SECTION 4 – FINANCIAL LIABILITIES HELD FOR TRADING – ITEM 40
4.1 Financial liabilities held for trading: composition by type
(thousands of euros)
4.1 FINANCIAL LIABILITIES HELD FOR TRADING: COMPOSITION BY TYPE
L1 L2 L3 L1 L2 L3
A. On-balance-sheet liabilities 1. Due to banks2. Due to customers3. Debt securities 3.1 Bonds 3.1.1 Structured x x 3.1.2 Other x x 3.2 Other securities 3.2.1 Structured x x 3.2.2 Other x x
Total AB. Derivatives1. Financial derivatives 9,135 773,842 382,377 1.1 Trading x x x x 1.2 Associated with fair value option x x x x 1.3 Other x 9,135 773,842 x x 382,377 x2. Credit derivatives 2.1 Trading x x x x 2.2 Associated with fair value option x x x x 2.3 Other x x x x
Total B x 9,135 773,842 x x 382,377 xTotal (A+B) x 9,135 773,842 x x 382,377 x
KeyFV = fair valueFV* = fair value calculated excluding changes in value due to changes in the issuer’s creditworthiness since the issue dateNV = nominal or notional value
L1 = Level 1L2 = Level 2L3 = Level 3
NV FV * NV
31/12/2009
FV
31/12/2008
FV FV *
The item includes the embedded option component of bonds indexed to baskets of shares that was separated from the host contract.

Report and Financial Statements at 31 December 2009
201
SECTION 6 – HEDGING DERIVATIVES – ITEM 60
6.1 Hedging derivatives: composition by type of hedge and level of inputs
(thousands of euros)
L1 L2 L3 L1 L2 L3
A. Financial derivatives 825,663 17,164,524 1,271,495 56 30,475,650
1) Fair value 825,663 17,164,524 1,271,495 56 30,475,650
2) Cash flow
3) Investment in foreign operation
B. Credit derivatives
1) Fair value
2) Cash flow
Total 825,663 17,164,524 1,271,495 56 30,475,650
Key NV = notional value L1 = Level 1L2 = Level 2L3 = Level 3
31/12/2009 NV 31/12/2009
31/12/2008 6.1 HEDGING DERIVATIVES: COMPOSITION BY TYPE OF HEDGE AND LEVEL OF INPUTS
NV 31/12/2008
6.2 Hedging derivatives: composition by hedged portfolio and type of hedge
(thousands of euros)6.2 HEDGING DERIVATIVES: COMPOSITION BY HEDGED PORTFOLIO AND TYPE OF HEDGE
interest rate risk
exchange rate risk
credit risk
price risk multiple
risks
1. Financial assets available for sale x x x 2. Loans 824,940 x x x x 3. Financial assets held to maturity x x x x x 4. Portfolio x x x x x x x 5. Other x x
Total assets 824,940 1. Financial liabilities 446 x 277 x x x 2. Portfolio x x x x x x x
Total liabilities 446 277 1. Forecast transactions x x x x x x x x
2. Portfolio of financial assets and liabilities x x x x x x
Fair value Cash flow
Investment in foreign operation
Specific
Generic Specific Generic

Report and Financial Statements at 31 December 2009
202
SECTION 7 – VALUE ADJUSTMENTS OF LIABILITIES COVERED BY MACRO-HEDGES
– ITEM 70
7.1 Value adjustments of hedged financial liabilities
(thousands of euros)
1. Positive adjustments of financial liabilities
2. Negative adjustment of financial liabilities 66,478 16,699
Total 66,478 16,699
7.1 VALUE ADJUSTMENTS OF HEDGED FINANCIAL LIABILITIES
31/12/200831/12/2009
7.2 Liabilities covered by macro-hedges against interest rate risk: composition
This item reports the net change in the value of the postal savings bonds portfolio hedged generically against interest rate risk. The hedging relationship was interrupted in the second half of 2009 in view of the closure of the derivative hedging instruments. The change in the fair value of the hedged bonds, determined up to the date of the validity of the hedging relationship, was subsequently accounted for on the basis of the amortised cost of the bonds.
Report and Financial Statements at 31 December 2009
203
SECTION 8 – TAX LIABILITIES – ITEM 80
For information concerning this item, refer to Section 13 of “Assets”.

Report and Financial Statements at 31 December 2009
204
SECTION 10 – OTHER LIABILITIES – ITEM 100
10.1 Other liabilities: composition
(thousands of euros)10.1 OTHER LIABILITIES: COMPOSITION
1. Items being processed 4,445 11,408 2. Charges for postal funding service 918,044 659,775 3. Tax payables 317,212 300,092 4. Other 14,686 13,310
Total 1,254,387 984,585
31/12/2009 31/12/2008
The item reports liabilities not otherwise classified under the previous items.
The main items under this heading are:
• the payable to Poste Italiane S.p.A. of about €918 million, in respect of the management and placement of postal savings products;
• tax payables totalling about €317 million, mainly regarding the tax on interest paid on postal savings bonds and the tax to discharge the tax liability on tax-suspended reserves, which will be paid in June 2010;
• other items are mainly composed of trade payables and sundry amounts due to employees.

Report and Financial Statements at 31 December 2009
205
SECTION 11 – STAFF SEVERANCE PAY – ITEM 110
11.1 Staff severance pay: change for the year
(thousands of euros)
A. Opening balance 691 738
B. Increases 823 725 B.1 Provision for the year 823 725 B.2 Other increases
C. Decreases 817 772 C.1 Severance payments 2 89 C.2 Other decreases 815 683
D. Closing balance 697 691
31/12/2009 31/12/2008
11.1 STAFF SEVERANCE PAY: CHANGE FOR THE YEAR

Report and Financial Statements at 31 December 2009
206
SECTION 12 – PROVISIONS – ITEM 120
12.1 Provisions: composition
(thousands of euros)
12.1 PROVISIONS: COMPOSITION
1 Company pension plans
2. Other provisions 8,974 8,005
2.1 legal disputes 1,589 2,373
2.2 staff costs 6,975 5,632
2.3 other 410
Total 8,974 8,005
31/12/200831/12/2009
12.2 Provisions: change for the year
(thousands of euros)
A. Opening balance 8,005 8,005
B. Increases 7,444 7,444 B.1 Provision for the year 7,385 7,385 B.2 Changes due to passage of time 47 47 B.3 Changes due to changes in discount rate 12 12 B.4 Other increases
C. Decreases 6,475 6,475 C.1 Use during the year 5,292 5,292 C.2 Changes due to changes in discount rate 29 29 C.3 Other decreases 1,154 1,154
D. Closing balance 8,974 8,974
12.2 PROVISIONS: CHANGE FOR THE YEAR
Total Pensions Other
provisions

Report and Financial Statements at 31 December 2009
207
12.4 Provisions – Other provisions
Other provisions regard provisions accrued for likely tax liabilities.

Report and Financial Statements at 31 December 2009
208
SECTION 14 – SHAREHOLDERS’ EQUITY – ITEMS 130, 150, 160, 170, 180, 190 AND 200
14.1 “Share capital” and “Treasury shares”: composition
The share capital of €3,500,000,000 is fully paid up and is composed of 245,000,000 ordinary shares and 105,000,000 preference shares with a par value of €10 each. The company does not hold treasury shares.
14.2 Share capital - Number of shares: change for the year
Ordinary Other
A. Shares at start of the year 245,000,000 105,000,000 - fully paid 245,000,000 105,000,000 - partly paidA.1 Treasury shares (-)A.2 Shares in circulation: opening balance 245,000,000 105,000,000 B. IncreasesB.1 New issues - for consideration: - business combinations - conversion of bonds - exercise of warrants - other - bonus issues: - to employees - to directors - otherB.2 Sale of own sharesB.3 Other changesC. DecreasesC.1 CancellationC.2 Purchase of own sharesC.3 Disposal of companiesC.4 Other changesD. Shares in circulation: closing balance 245,000,000 105,000,000 D.1 Treasury shares (+)D.2 Shares at end of the year 245,000,000 105,000,000 - fully paid 245,000,000 105,000,000 - partly paid
14.2 SHARE CAPITAL - NUMBER OF SHARES: CHANGE FOR THE YEAR

Report and Financial Statements at 31 December 2009
209
14.4 Income reserves: additional information
(thousands of euros)
14.4 INCOME RESERVES: ADDITIONAL INFORMATION
31/12/2009 31/12/2008
Income reserves 4,809,203 3,664,760
Legal reserve 301,615 232,143
Other 4,507,588 3,432,617
We provide the following information required by Article 2427.7-bis of the Italian Civil Code.
(thousands of euros)
Share capital 3,500,000 -
Reserves 4,809,203 - Legal reserve 301,615 B 232,142 - Other income reserves 4,507,588 A, B, C 3,432,618
Valuation reserves 2,136,389 - AFS reserve 1,967,616 - - - Property revaluation reserve 167,572 A, B - CFH reserve 1,201 - -
Total 10,445,592 3,664,760
(*) A = capital increase; B = loss coverage; C = distribution to shareholders
Possible uses (*)Amount available
Balance at 31/12/2009
Following the company’s decision to discharge – through payment of a specific one-off tax in 2010 – the tax liability in respect of tax-suspended reserves arising from loan writedowns not taken to the income statement but reported in section EC of the income tax return, reserves in the amount of about €711 million will be freed of tax liabilities.
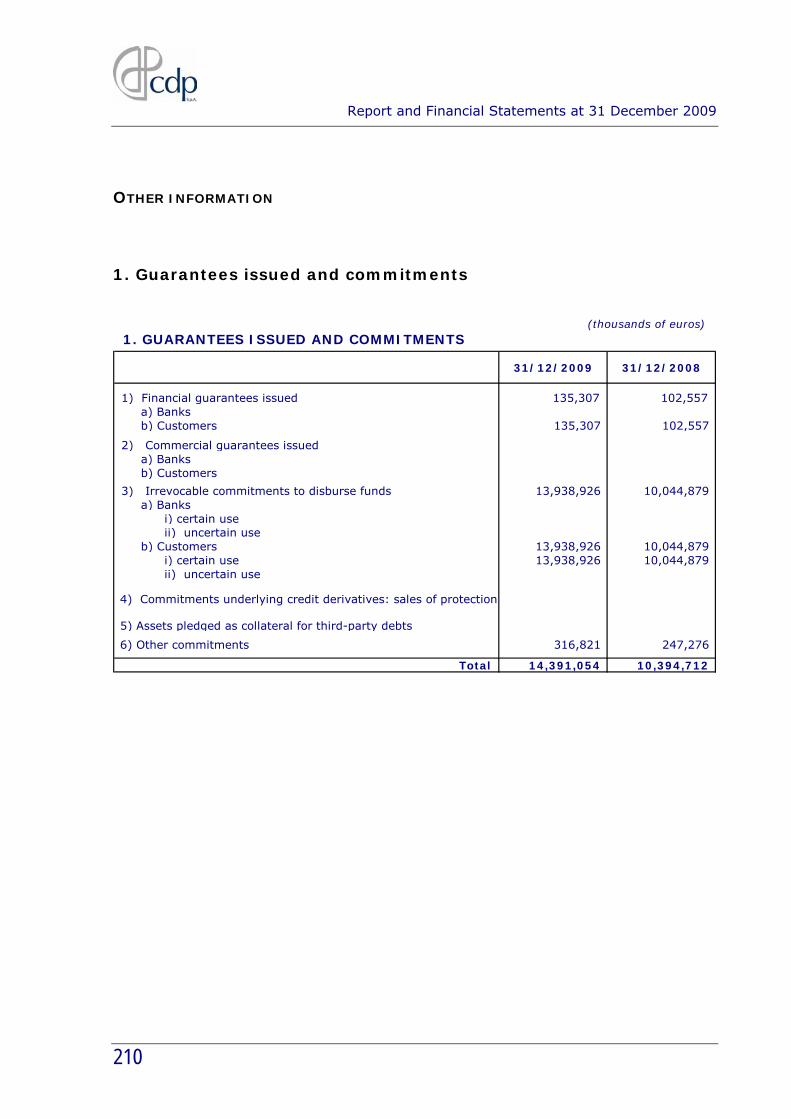
Report and Financial Statements at 31 December 2009
210
OTHER INFORMATION
1. Guarantees issued and commitments
(thousands of euros)
1. GUARANTEES ISSUED AND COMMITMENTS
31/12/2009 31/12/2008
1) Financial guarantees issued 135,307 102,557 a) Banks b) Customers 135,307 102,557
2) Commercial guarantees issued a) Banks b) Customers
3) Irrevocable commitments to disburse funds 13,938,926 10,044,879 a) Banks i) certain use ii) uncertain use b) Customers 13,938,926 10,044,879 i) certain use 13,938,926 10,044,879 ii) uncertain use
4) Commitments underlying credit derivatives: sales of protection
5) Assets pledged as collateral for third-party debts
6) Other commitments 316,821 247,276
Total 14,391,054 10,394,712

Report and Financial Statements at 31 December 2009
211
2. Assets pledged as collateral for own debts and commitments
(thousands of euros)
2. ASSETS PLEDGED AS COLLATERAL FOR OWN DEBTS AND COMMITMENTS
Portfolio 31/12/2009 31/12/2008
1. Financial assets held for trading2. Financial assets at fair value3. Financial assets available for sale4. Held-to-maturity financial assets 131,000 5. Loan to banks6. Loan to customers 15,424,458 16,542,634 7. Property, plant and equipment
In past years CDP issued bonds secured by a diversified portfolio of receivables in respect of loans with repayment charged to local authorities and regional governments (covered bonds). The list of pledged loans (the segregated portfolio) is deposited with the Rome Company Register and is updated with each new issue and whenever CDP modifies its composition.
CDP’s balance sheet reports separately the amount of loans pledged as collateral for the issuance of covered bonds (included among loans to customers) and the corresponding residual amount to be disbursed (included among amounts due to customers).
The covered bond programme was implemented on the basis of Article 5.18 of the transformation decree, pursuant to which CDP may pledge its property and rights as security for the rights of the holders of the securities it issues. The same decree also requires that a separate set of the accounting ledgers and records mandated by Articles 2214 et seq. of the Italian Civil Code be kept for the segregated portfolio.

Report and Financial Statements at 31 December 2009
212
PART C – INFORMATION ON THE INCOME
STATEMENT
SECTION 1 – INTEREST – ITEMS 10 AND 20
1.1 Interest income and similar revenues: composition
(thousands of euros)
1.1 INTEREST INCOME AND SIMILAR REVENUES: COMPOSITION
Debt securities
Borrowings Other 31/12/2009 31/12/2008
1 Financial assets held for trading 2 Financial assets available for sale 4,943 4,943 10,265 3 Financial assets held to maturity 4,266 4,266 5,687 4 Loan to banks 20,916 54,975 75,891 146,512 5 Loan to customers 48,418 3,924,069 3,972,487 3,860,878 6 Financial assets at fair value 7 Hedging derivatives x x8 Other assets x x 3,502,245 3,502,245 4,115,694
Total 57,627 3,944,985 3,557,220 7,559,832 8,139,036
The item reports the remuneration of the activities of CDP with regard to:
- loans to banks and customers: interest income on loans by CDP amounted to about €3,945 million;
- debt securities: interest income on debt securities amounted to about €57.6 million;
- other interest income: this is primarily composed of interest income on current account no. 29814, equal to about €3,502 million.

Report and Financial Statements at 31 December 2009
213
1.4 Interest expense and similar charges: composition
(thousands of euros)
1.4 INTEREST EXPENSE AND SIMILAR CHARGES: COMPOSITION
1 Due to central banks x
2 Due to banks 14,080 x 14,080 36,149
3 Due to customers 1,584,644 x 1,584,644 2,195,958
4 Securities issued x 3,614,231 3,614,231 3,452,969
5 Financial liabilities held for trading 640 640 617
6 Financial liabilities at fair value
7 Other liabilities and funds x x 325 325 281
8 Hedging derivatives x x 351,775 351,775 93,562
1,598,724 3,614,231 352,740 5,565,695 5,779,536
31/12/2009 31/12/2008
Total
Payables Securities Other
Interest expense on amounts due to customers mainly regards interest on passbook savings accounts, totalling about €1,286 million and interest on loans being repaid but not yet disbursed by CDP, equal to about €297 million. Interest on debt securities regarded bond issues for about €315 million and postal savings bonds for about €3,294 million. The negative differences on hedges amounted to about €352 million.
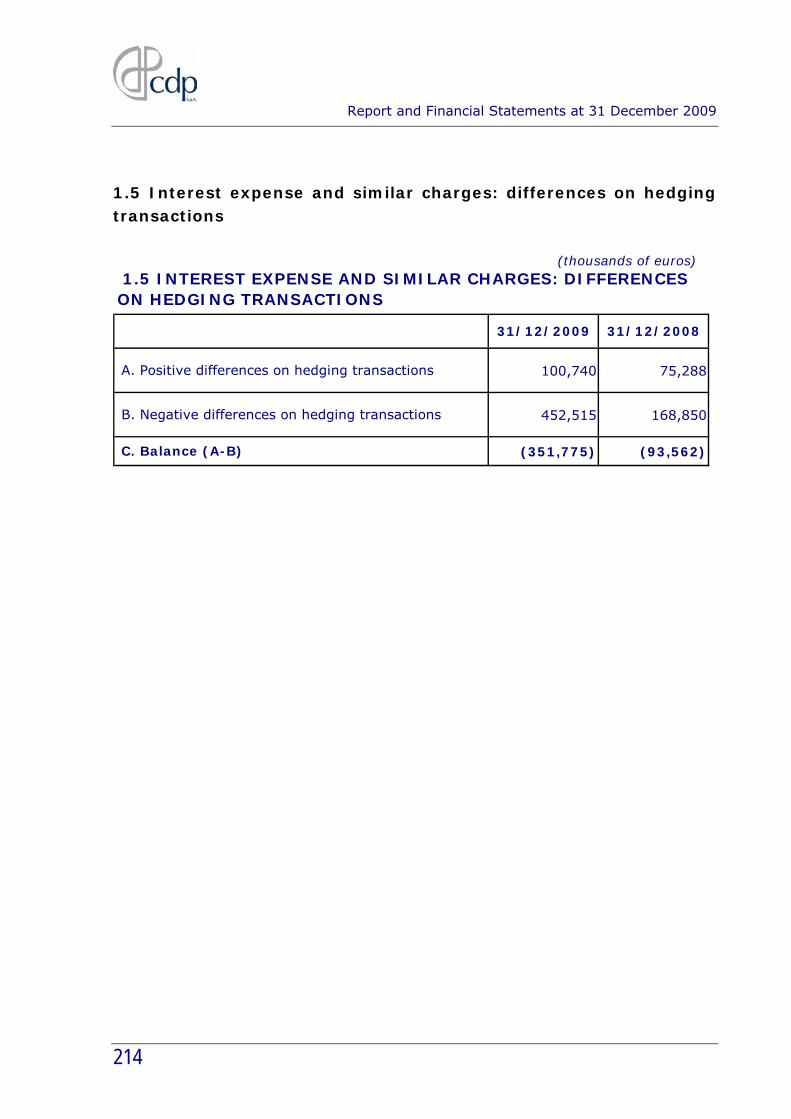
Report and Financial Statements at 31 December 2009
214
1.5 Interest expense and similar charges: differences on hedging transactions
(thousands of euros)
100,740 75,288
452,515 168,850
(351,775) (93,562) C. Balance (A-B)
B. Negative differences on hedging transactions
A. Positive differences on hedging transactions
1.5 INTEREST EXPENSE AND SIMILAR CHARGES: DIFFERENCES ON HEDGING TRANSACTIONS
31/12/2009 31/12/2008

Report and Financial Statements at 31 December 2009
215
SECTION 2 – COMMISSIONS - ITEMS 40 AND 50
2.1 Commission income: composition
During the period, CDP earned commission income on lending operations amounting to about €4.6 million and commission income of €3 million relating to the agreement signed with the Ministry for the Economy and Finance in respect of assets and liabilities transferred to the MEF pursuant to Article 3 of the ministerial decree of 5 December 2003.
(thousands of euros)
31/12/2009 31/12/2008
324
7,925 6,709
Total 8,249 6,709
6. securities placement 7. order collection and transmission 8. advisory services
9. distribution of third-party services
8.1. concerning investments 8.2. concerning financial structure
3.1. individual 3.2. collective
4. securities custody and administration 5. depository services
3. asset management
2.1 COMMISSION INCOME: COMPOSITION
a) guarantees issued b) credit derivatives c) management, intermediation and advisory services:
1. trading in financial instruments 2. foreign exchange
j) other services i) holding and management of current accounts
9.3. other d) collection and payment services e) servicing activities for securitizations f) services for factoring transactions g) tax collection services h) management of multilateral trading systems
9.1. asset management 9.1.1. individual 9.1.2. collective
9.2. insurance products
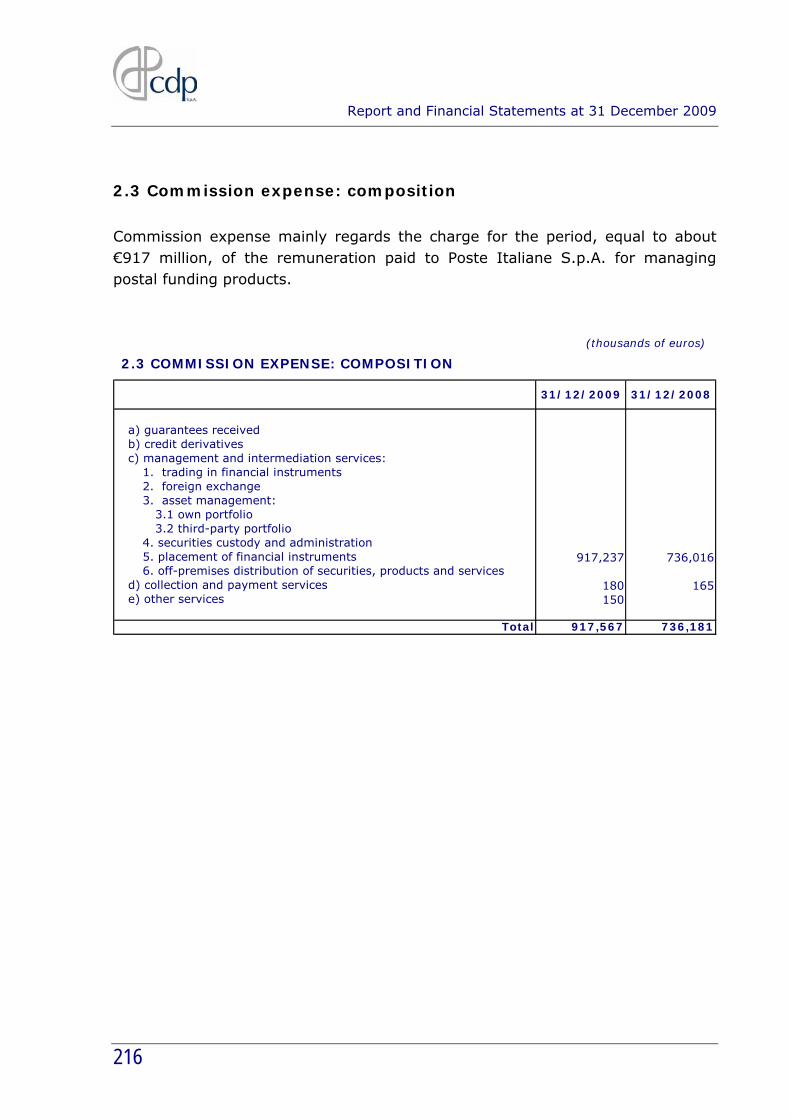
Report and Financial Statements at 31 December 2009
216
2.3 Commission expense: composition
Commission expense mainly regards the charge for the period, equal to about €917 million, of the remuneration paid to Poste Italiane S.p.A. for managing postal funding products.
(thousands of euros)
917,237 736,016
180 165 150
Total 917,567 736,181
d) collection and payment services e) other services
2. foreign exchange 3. asset management:
3.1 own portfolio 3.2 third-party portfolio
4. securities custody and administration 5. placement of financial instruments 6. off-premises distribution of securities, products and services
c) management and intermediation services: 1. trading in financial instruments
2.3 COMMISSION EXPENSE: COMPOSITION
b) credit derivatives a) guarantees received
31/12/2009 31/12/2008

Report and Financial Statements at 31 December 2009
217
SECTION 3 – DIVIDENDS AND SIMILAR REVENUES - ITEM 70
3.1 Dividends and similar revenues: composition
(thousands of euros)
3.1 DIVIDENDS AND SIMILAR REVENUES: COMPOSITION
dividends
income from units in
collective investment
undertakings
dividends
income from units in
collective investment
undertakings
A Financial assets held for trading B Financial assets available for sale 808,550 850,319 C Financial assets at fair value D Equity investments 162,600 x 200,937 x
Total 971,150 1,051,256
31/12/2009 31/12/2008
Dividends mainly regard the accrued share attributable to CDP S.p.A. from its equity investments in Istituto per il Credito Sportivo (about €2.5 million), Eni S.p.A. (about €460 million), Enel S.p.A. (about €345 million), Poste Italiane S.p.A. (€52.5 million), Terna S.p.A. (about €101 million), STMicroelectronics Holding N.V. (about €8 million) and SINLOC S.p.A. (€474 thousand).
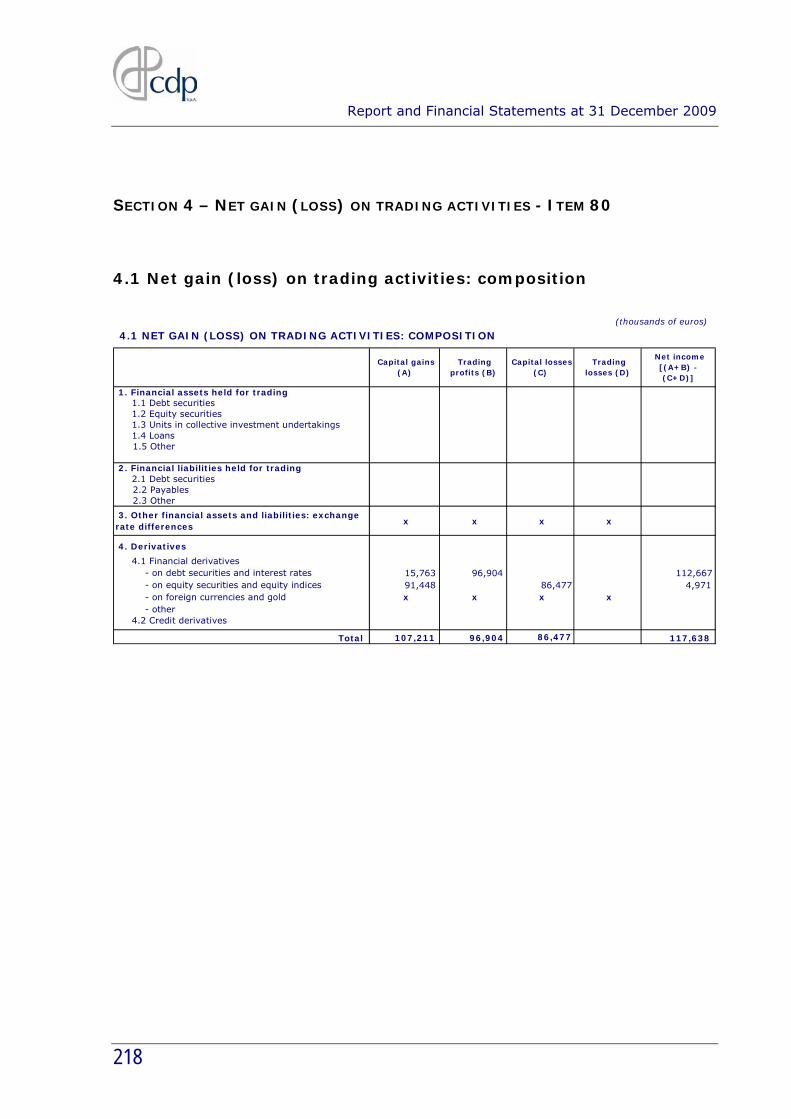
Report and Financial Statements at 31 December 2009
218
SECTION 4 – NET GAIN (LOSS) ON TRADING ACTIVITIES - ITEM 80
4.1 Net gain (loss) on trading activities: composition
(thousands of euros)
1.5 Other
2.2 Payables2.3 Other
x x x x
- on debt securities and interest rates 15,763 96,904 112,667 - on equity securities and equity indices 91,448 86,477 4,971 - on foreign currencies and gold x x x x - other
Total 107,211 96,904 86,477 117,638
Trading losses (D)
Net income [(A+B) - (C+D)]
4.1 NET GAIN (LOSS) ON TRADING ACTIVITIES: COMPOSITION
Capital gains (A)
Trading profits (B)
Capital losses (C)
1. Financial assets held for trading 1.1 Debt securities 1.2 Equity securities 1.3 Units in collective investment undertakings
4. Derivatives
4.1 Financial derivatives
4.2 Credit derivatives
1.4 Loans
2. Financial liabilities held for trading 2.1 Debt securities
3. Other financial assets and liabilities: exchange rate differences

Report and Financial Statements at 31 December 2009
219
SECTION 5 – NET GAIN (LOSS) ON HEDGING ACTIVITIES - ITEM 90
5.1 Net gain (loss) on hedging activities: composition
(thousands of euros)5.1 NET GAIN (LOSS) ON HEDGING ACTIVITIES: COMPOSITION
31/12/2009 31/12/2008
A. Income on: A.1 Fair value hedges 446,608 796,808 A.2 Hedged financial assets (fair value) 8,171 1,918,429 A.3 Hedged financial liabilities (fair value) A.4 Cash flow hedges A.5 Assets and liabilities in foreign currencies 7,095 3,055
461,874 2,718,292
B. Expense on: B.1 Fair value hedges 9,344 1,883,108 B.2 Hedged financial assets (fair value) 302,559 56,299 B.3 Hedged financial liabilities (fair value) 168,993 920,903 B.4 Cash flow hedges B.5 Assets and liabilities in foreign currencies 7,095 3,055
487,991 2,863,365
C. Net gain (loss) on hedging activities (A-B) (26,117) (145,073)
Total income on hedging activities (A)
Total expense on hedging activities (B)

Report and Financial Statements at 31 December 2009
220
SECTION 6 – GAINS (LOSSES) ON DISPOSAL OR REPURCHASE – ITEM 100
6.1 Gains (losses) on disposal or repurchase: composition
(thousands of euros)
Gains Losses Net gain
(loss) Gains Losses
Net gain (loss)
1 Loans to banks 2 Loans to customers 13,653 13,653 7,403 7,403 3 Financial assets available for sale 952 952
3.1 Debt securities 952 952 3.2 Equity securities 3.3 Units in collective investment undertakings 3.4 Loans
4 Financial assets held to maturity
14,605 14,605 7,403 7,403
1 Due to banks 2 Due to customers 3 Securities issued 625 625
Total liabilities 625 625
Financial liabilities
31/12/2009 31/12/2008
6.1 GAINS (LOSSES) ON DISPOSAL OR REPURCHASE: COMPOSITION
Financial assets
Total assets

Report and Financial Statements at 31 December 2009
221
SECTION 8 – NET IMPAIRMENT ADJUSTMENTS – ITEM 130
8.1 Net impairment adjustments of loans: composition
(thousands of euros)
A B A B
A. Loans to banks
- Borrowings
- Debt securities B. Loans to customers (1,752) 534 (1,218) (23,863) - Borrowings (1,752) 534 (1,218) (23,863)
- Debt securities
C. Total (1,752) 534 (1,218) (23,863)
A = interestB = other writebacks
8.1 NET IMPAIRMENT ADJUSTMENTS OF LOANS: COMPOSITION
31/12/2009 31/12/2008
Writedowns Writebacks
Specific
Portfolio
Specific Portfolio
Wri
teo
ffs
Oth
er

Report and Financial Statements at 31 December 2009
222
SECTION 9 – GENERAL AND ADMINISTRATIVE EXPENSES – ITEM 150
9.1 Staff costs: composition
(thousands of euros)
31/12/2009 31/12/2008
42,576 38,862 a) wages and salaries 29,781 28,458 b) social security contributions 140 126 c) severance pay d) pensions 7,927 7,656 e) allocation to staff severance pay provision 823 725 f) allocation to provision for pensions and similar liabilities - defined contribution - defined benefit g) payments to external pension funds - defined contribution 796 695 - defined benefit h) costs in respect of agreements to make payments in own equity instruments i) other employee benefits 3,109 1,202
622 344 1,254 995
(44) (172) 95 74
Total 44,503 40,103
9.1 STAFF COSTS: COMPOSITION
1) Employees
2) Other personnel in service 3) Board of Directors and Board of Auditors 4) Retired personnel 5) Recovery of expenses for employees seconded to other companies 6) Reimbursement of expenses for third-party employees seconded to the company
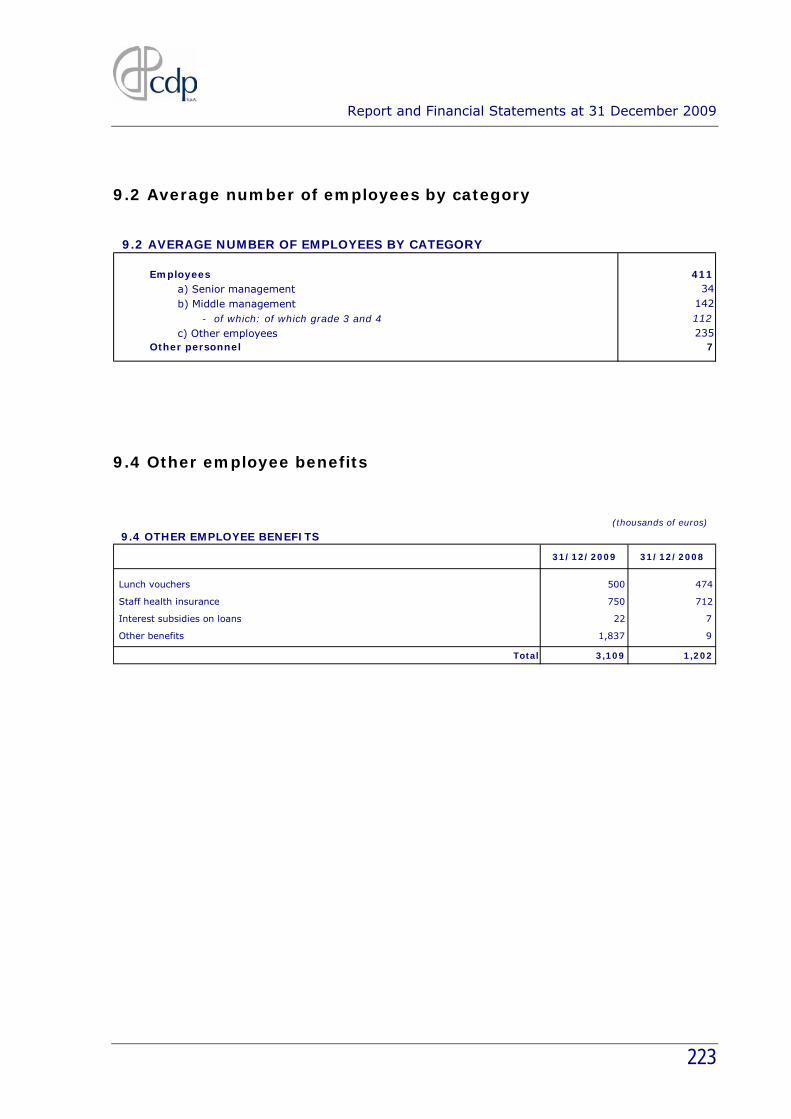
Report and Financial Statements at 31 December 2009
223
9.2 Average number of employees by category
9.2 AVERAGE NUMBER OF EMPLOYEES BY CATEGORY
Employees 411 a) Senior management 34 b) Middle management 142 - of which: of which grade 3 and 4 112 c) Other employees 235Other personnel 7
9.4 Other employee benefits
(thousands of euros)
9.4 OTHER EMPLOYEE BENEFITS
31/12/2009 31/12/2008
Lunch vouchers 500 474
Staff health insurance 750 712
Interest subsidies on loans 22 7
Other benefits 1,837 9
Total 3,109 1,202

Report and Financial Statements at 31 December 2009
224
9.5 Other administrative expenses: composition
(thousands of euros)
9.5 OTHER ADMINISTRATIVE EXPENSES: COMPOSITION
31/12/2009 31/12/2008
IT costs (licences, maintenance and consulting) 6,590 6,034
Property expenses 2,892 3,415 Leased land and buildings 62 47 Owned land and buildings 2,830 3,368 - maintenance of owned land and buildings 1,583 2,296 - operating expenses 1,247 1,072
Utilities 1,437 1,672
General expenses 6,612 6,334 - consumables and other 1,128 947 - services 5,484 5,387
Entertainment and marketing 401 274
Professional and insurance expenses 5,660 5,168
Professional and service costs for personnel 1,386 1,152
Corporate bodies other than BoD 251 221
Indirect taxes and duties 1,304 1,190
26,533 25,460 Total
Pursuant to Article 149-duodecies of the Consob Issuers Regulation, the following table reports the fees for 2009 paid for services provided by KPMG S.p.A., the external auditor.
(thousands of euros)
Service provider Fees for the year
Auditing and financial statements KPMG S.p.A. 256 Certification KPMG S.p.A. 15
Total 271
FEES FOR AUDITING AND NON-AUDIT SERVICES
The fees paid in 2009 to the auditing firm regard auditing of the annual separate and consolidated financial statements, auditing of the separate and consolidated half-year financial statements and certification of the statements for the separated accounts.

Report and Financial Statements at 31 December 2009
225
SECTION 10 – NET PROVISIONS – ITEM 160
10.1 Net provisions: composition
(thousands of euros)
10.1 NET PROVISIONS: COMPOSITION
31/12/2009 31/12/2008
Review of existing provision and discounting (374) 1,214
Other pending litigation
Total (374) 1,214

Report and Financial Statements at 31 December 2009
226
SECTION 11 – NET ADJUSTMENTS OF PROPERTY, PLANT AND EQUIPMENT – ITEM
170
11.1 Net adjustments of property, plant and equipment: composition
(thousands of euros)
A Property, plant and equipment 6,662 6,662 A.1 owned 6,662 6,662 - operating assets 6,662 6,662 - investment property
A.2 Acquired under finance leases - operating assets - investment property
Total 6,662 6,662
11.1 NET ADJUSTMENTS OF PROPERTY, PLANT AND EQUIPMENT: COMPOSITION
Net income(a+b-c)
Depreciation (a) Writedowns for impairment (b)
Writebacks (c)

Report and Financial Statements at 31 December 2009
227
SECTION 12 – NET ADJUSTMENTS OF INTANGIBLE ASSETS – ITEM 180
12.1 Net adjustments of intangible assets: composition
(thousands of euros)
Amortisation (a) Writedowns for impairment (b)
Writebacks(c)
Net gain (loss)
(a+b-c)
A Intangible assets 2,350 2,350 A.1 Owned 2,350 2,350 - internally generated - other 2,350 2,350
A.2 Acquired under finance leases
Total 2,350 2,350
12.1 NET ADJUSTMENTS OF INTANGIBLE ASSETS: COMPOSITION
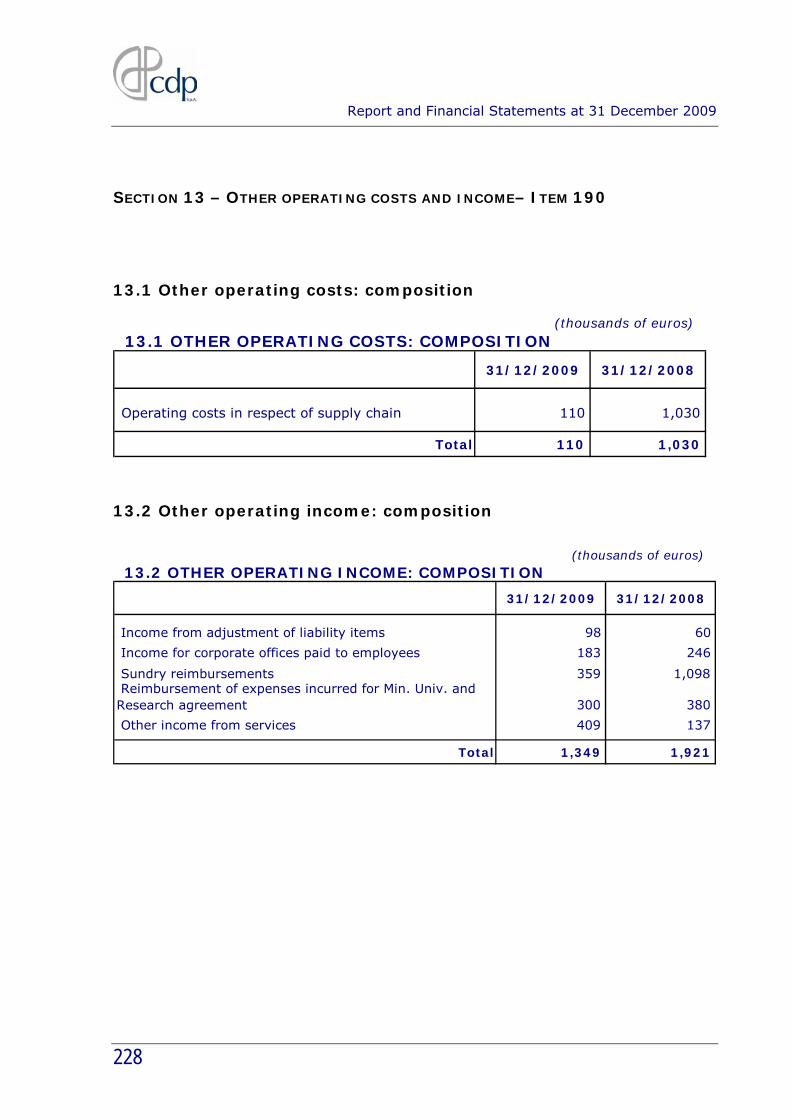
Report and Financial Statements at 31 December 2009
228
SECTION 13 – OTHER OPERATING COSTS AND INCOME– ITEM 190
13.1 Other operating costs: composition
(thousands of euros)13.1 OTHER OPERATING COSTS: COMPOSITION
31/12/2009 31/12/2008
Operating costs in respect of supply chain 110 1,030
Total 110 1,030
13.2 Other operating income: composition
(thousands of euros)
13.2 OTHER OPERATING INCOME: COMPOSITION
31/12/2009 31/12/2008
Income from adjustment of liability items 98 60
Income for corporate offices paid to employees 183 246
Sundry reimbursements 359 1,098 Reimbursement of expenses incurred for Min. Univ. and Research agreement 300 380
Other income from services 409 137
Total 1,349 1,921

Report and Financial Statements at 31 December 2009
229
SECTION 14 – GAINS (LOSSES) ON EQUITY INVESTMENTS – ITEM 210
14.1 Gains (losses) on equity investments: composition
(thousands of euros)14.1 GAINS (LOSSES) ON EQUITY INVESTMENTS: COMPOSITION
31/12/2009 31/12/2008
1. Revaluations 2. Gains on disposals 3. Writebacks 4. Other
- 504,543 1. Writedowns 2. Impairments 504,543 3. Losses on disposals 4. Other
Net gain (loss) - 504,543
A. Gains
B. Losses

Report and Financial Statements at 31 December 2009
230
SECTION 18 - INCOME TAX FOR THE PERIOD ON CONTINUING OPERATIONS –
ITEM 260
18.1 Income tax for the period on continuing operations: composition
(thousands of euros)
18.1 INCOME TAX FOR THE PERIOD ON CONTINUING OPERATIONS: COMPOSITION
1 Current taxes (-) (567,088) (570,828)
2 Change in current taxes from previous periods (+/-) (8,180) 4,463
3 Reduction of current taxes for the year (+)
4 Change in deferred tax assets (+/-) (52,300) (249,454)
5 Change in deferred tax liabilities (+/-) 269,747 276,054
6 Taxes for the year (-) (-1+/-2+3+/-4+/-5) (357,821) (539,765)
31/12/2009 31/12/2008
Current taxation regards IRES (corporate income tax) and IRAP (regional business tax) for the year, calculated on the basis of the current tax rates of 27.5% and 4.82% respectively. The change in current taxes with respect to previous years reflects the adjustment of the provision for taxes, estimated in preparing the financial statements, to the actual tax liability due on the basis of the tax return subsequently submitted to the Revenue Agency, which regarded the recognition of positive income components in 2009. The change in deferred taxes for 2009 shows a substantial decrease in both deferred tax assets and provisions for deferred tax liabilities. The reduction in deferred tax assets (€66 million) is essentially attributable to the reversal of temporary differences deductible in subsequent years in respect of the fair value measurement of macro-hedges of postal savings bonds (€51 million) and the elimination of the fair value measurements, recognised in equity, of the investment in Enel S.p.A. (€15 million). As regards deferred tax liabilities, the decline in 2009 (€225 million) is largely ascribable to the combined effect of the reduction in deferred taxes (€270 million) in respect of the off-ledger accruals on loans to customers (which the company decided to realign to their statutory values by way of payment, by 16 June 2010, of the related one-off tax) and the recognition of additional deferred
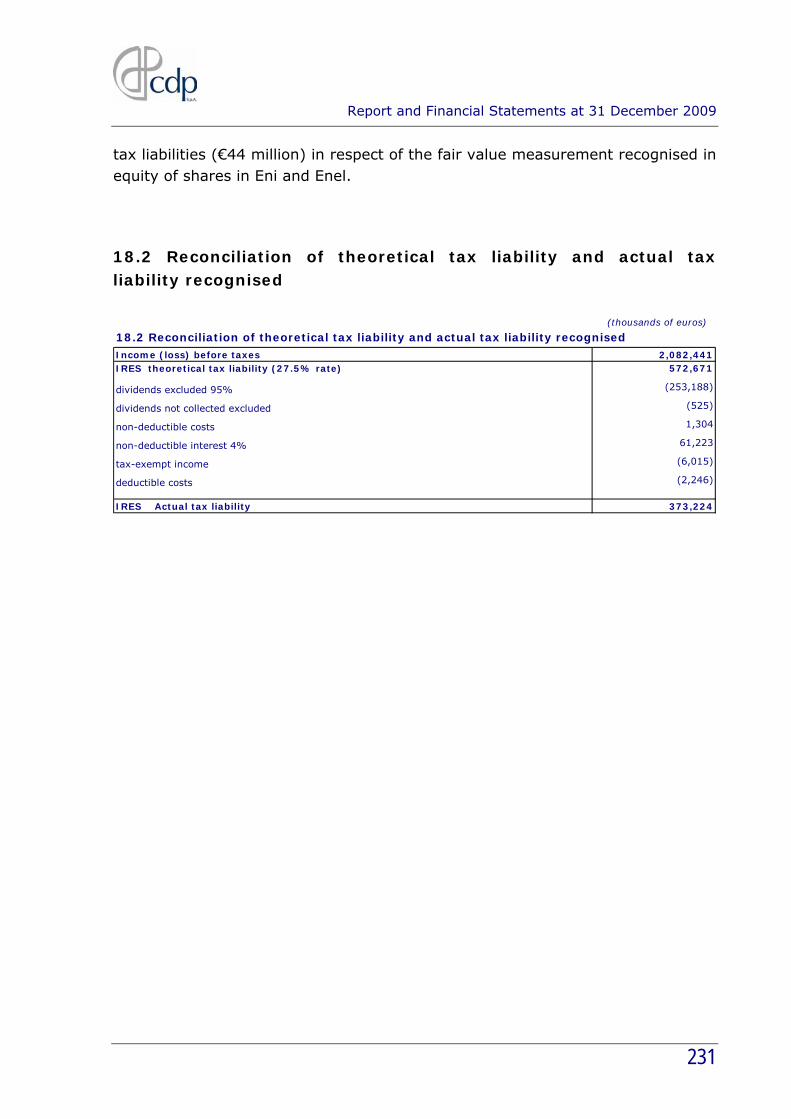
Report and Financial Statements at 31 December 2009
231
tax liabilities (€44 million) in respect of the fair value measurement recognised in equity of shares in Eni and Enel.
18.2 Reconciliation of theoretical tax liability and actual tax liability recognised
(thousands of euros)
18.2 Reconciliation of theoretical tax liability and actual tax liability recognisedIncome (loss) before taxes 2,082,441IRES theoretical tax liability (27.5% rate) 572,671
dividends excluded 95% (253,188)
dividends not collected excluded (525)
non-deductible costs 1,304
non-deductible interest 4% 61,223
tax-exempt income (6,015)
deductible costs (2,246)
IRES Actual tax liability 373,224

Report and Financial Statements at 31 December 2009
232
PART D – COMPREHENSIVE INCOME (thousands of euros)
DETAILED BREAKDOWN OF COMPREHENSIVE INCOME
Gross amount Income taxes Net amount
10. Net income (loss) for the period 2,082,442 (357,821) 1,724,621
Other comprehensive income
20. Financial assets available for sale:
a) fair value changes 1,032,134 (58,554) 973,580
b) reversal to income statement - impairment adjustments - gain/loss on realisation c) other changes
30. Property, plant and equipment
40. Intangible assets
50. Hedging of investment in foreign operation:
a) fair value changes
b) reversal to income statement
c) other changes
60. Cash flow hedges:
a) fair value changes 922 (298) 624
b) reversal to income statement
c) other changes
70. Exchange rate differences:
a) fair value changes
b) reversal to income statement
c) other changes
80. Non-current assets held for sale:
a) fair value changes
b) reversal to income statement
c) other changes
90.Actuarial gains (losses) on defined benefit plans
100.Valuation reserves of equity investments accounted for with equity method (pro rata)
a) fair value changes
b) reversal to income statement
- impairment adjustments - gain/loss on realisation
c) other changes
110. Total other comprehensive income 1,033,056 (58,852) 974,204
120. Comprehensive income (items 10+110) 3,115,498 (416,673) 2,698,825

Report and Financial Statements at 31 December 2009
233
PART E – INFORMATION ON RISKS AND RELATED HEDGING
POLICIES The Risk Management department is responsible for measuring and controlling actual and prospective exposures to interest rate, price, exchange rate, credit, liquidity and operational risks, enforcing compliance with the limits approved by the Board of Directors. Risk Management also monitors use of economic capital and participates in capital management activities, as well as providing the company with certified calculation models. The guidelines governing CDP’s risk management policies are summarised in the Risk Management Rules approved by the Board of Directors. They envisage: - the separation of roles and responsibilities in the assumption and control of
risks; - organisational independence of risk control from the operational management
of risks; - rigorous risk measurement and control systems.
Report and Financial Statements at 31 December 2009
234
SECTION 1 – CREDIT RISK
QUALITATIVE DISCLOSURES
1. General aspects
Credit risk arises primarily in relation to lending activity – both under the Separate Account and the Ordinary Account – and on a secondary level in derivatives operations for hedging purposes on financial markets (in the form of counterparty risk).
The Separate Account, which easily has the largest stock of assets, is primarily exposed to the Italian government and local authorities.
Although currently limited, exposures under the Separate Account to the main banking groups operating in Italy (through which CDP channels various types of financing envisaged in the 2009-2011 business plan) are expected to become substantial, as are those to private-sector parties involved in public interest projects promoted by public entities.
The Ordinary Account grants corporate and project financing for initiatives concerning the delivery of public services, drawing on funding not guaranteed by the State, in competition with the banking system.
2. Credit risk management policies
2.1 Organisational aspects As part of pre-lending assessments, the Risk Management department focuses on risk-adjusted pricing, monitoring risk-adjusted returns and identifying exposure concentrations. Risk Management also monitors overall developments in the risk level of the loan portfolio with a view to identifying any necessary corrective actions to optimise the risk/return profile. It is also responsible for validating and/or developing rating models and methods. Ultimate responsibility for the assignment of ratings is held by the Credit department. The principles followed by CDP in its lending activities are set out in the Lending Rules.
Report and Financial Statements at 31 December 2009
235
2.2 Management, measurement and control systems As part of its credit risk management and control policies for the Separate Account, CDP adopts a system for lending to regional and local governments, under which each loan is allocated to a uniform risk category, defining the level of risk associated with individual authorities appropriately with the aid of specific quantitative parameters for each type and size of authority. The lending system makes it possible to identify cases in which a more extensive assessment of the borrower’s creditworthiness is necessary, using qualitative and quantitative criteria. A new system, already examined by the CDP Board of Directors, is currently being implemented within the new Lending Rules. For the Ordinary Account and lending for projects promoted by public entities pursuant to Decree Law 185 of 29 November 2008, CDP uses a validated proprietary model to calculate portfolio credit risk. Risk Management regularly monitors the limits for counterparty risk in derivatives transactions for hedging purposes. As well as a minimum rating requirement for counterparties, the system also establishes absolute and concentration limits based on the gross nominal amounts of transactions and credit equivalents. 2.3 Credit risk mitigation techniques CDP mitigates the credit risk in respect of lending operations using techniques commonly adopted in the banking industry. In addition to normal guarantee requirements, mainly in operations under the Ordinary Account and those for non-public entities under the Separate Account, other options include contractual clauses requiring borrowers to comply with financial covenants that make it possible to monitor credit risk more closely over the life of an operation. As regards bank counterparties in transactions in hedging derivatives, in view of the ISDA contracts signed, netting arrangements are also used. All the contracts are based on the 2002 ISDA agreement. Credit Support Annexes, which involve the periodic exchange of collateral, are also used to strengthen credit risk mitigation. The arrangement is based on the standard format recommended by ISDA.

Report and Financial Statements at 31 December 2009
236
2.4 Impaired financial assets In 2009 the new organisational process for the end-period measurement of the CDP loan portfolio became operational. In addition to Administration and Control, participants in the process include the functions involved in loan monitoring and the assessment of the creditworthiness of counterparties. CDP’s approach to credit assessment is essentially based on analytical analyses of counterparties in financial difficulty that are behind on their loan repayments. The decision to adopt such an approach is justified by the absence of time series on bad debts, owing to the type of customer (public entities) in CDP’s traditional lending activity. The main credit events monitored in analysing the financial soundness of counterparties and the consequent valuation of the exposure in the financial statements regard failure to make payments (or other contractual breaches), declarations of financial crisis by local authorities or the initiation of bankruptcy proceedings for other borrowers. The measurement of impaired positions is based on an estimate of the loan recovery plan, discounted at the effective interest rate of the specific loan. In estimating the recovery plan and the consequent writedown, account is taken of any collateral or unsecured guarantees received. These include amounts granted but not yet disbursed on specific-purpose loans, which are disbursed on a state-of-completion basis. Borrowers with substantial arrears are disqualified from accessing new CDP financing and any remaining amounts to be disbursed are frozen. The assessment is reviewed whenever new information is received on events that might modify the outlook for recovery. In order to ensure that such events are reflected promptly, the information on borrowers is monitored periodically and developments in out-of-court arrangements and the various stages of court proceedings are tracked constantly. The identification of impaired positions is carried out on the basis of supervisory instructions using prudent materiality thresholds. The restoration of impaired exposures to performing status is subject to verification that the problem conditions or insolvency have been eliminated and to the binding opinion, where envisaged, of the credit monitoring unit.

Report and Financial Statements at 31 December 2009
237
QUANTITATIVE DISCLOSURES
A. CREDIT QUALITY
A.1 IMPAIRED AND PERFORMING EXPOSURES: STOCKS, WRITEDOWNS, CHANGES
AND DISTRIBUTION BY SECTOR AND GEOGRAPHICAL AREA
(thousands of euros)
1. Financial assets held for trading 868,511 868,511 2. Financial assets available for sale 207,616 207,616 3. Financial assets held to maturity 205,285 205,285 4. Loan to banks 5,974,480 5,974,480 5. Loan to customers 25,538 9,709 11,155 85,577,439 85,623,841 6. Financial assets at fair value 7. Financial assets being divested 8. Hedging derivatives 331,603 331,603
Total at 31/12/2009 25,538 9,709 - 11,155 93,164,934 93,211,336 Total at 31/12/2008 24,130 7,181 - 21,441 89,711,839 89,764,591
A.1.1 DISTRIBUTION OF CREDIT EXPOSURES BY PORTFOLIO AND CREDIT QUALITY (BOOK VALUE)
Past due positions
Total Bad debts Substandard
loans Restructured
positions Other assets
(thousands of euros)
1. Financial assets held for trading x x 868,511 868,511
2. Financial assets available for sale 207,616 207,616 207,616
3. Financial assets held to maturity 205,285 205,285 205,285
4. Loan to banks 5,974,480 5,974,480 5,974,480
5. Loan to customers 167,533 (121,130) 46,402 85,577,439 85,577,439 85,623,841
6. Financial assets at fair value x x
7. Financial assets being divested
8. Hedging derivatives x x 331,603 331,603
Total at 31/12/2009 167,533 (121,130) 46,402 91,964,820 - 93,164,934 93,211,336
Total at 31/12/2008 129,007 (76,255) 52,752 89,210,228 - 89,711,839 89,764,591
Gross exposure
Portfolio adjustments
Net exposure
A.1.2 DISTRIBUTION OF CREDIT EXPOSURES BY PORTFOLIO AND CREDIT QUALITY (GROSS AND NET VALUES)
Net exposure
Total (net exposure) Gross
exposure Specific
adjustments
Impaired assets Performing
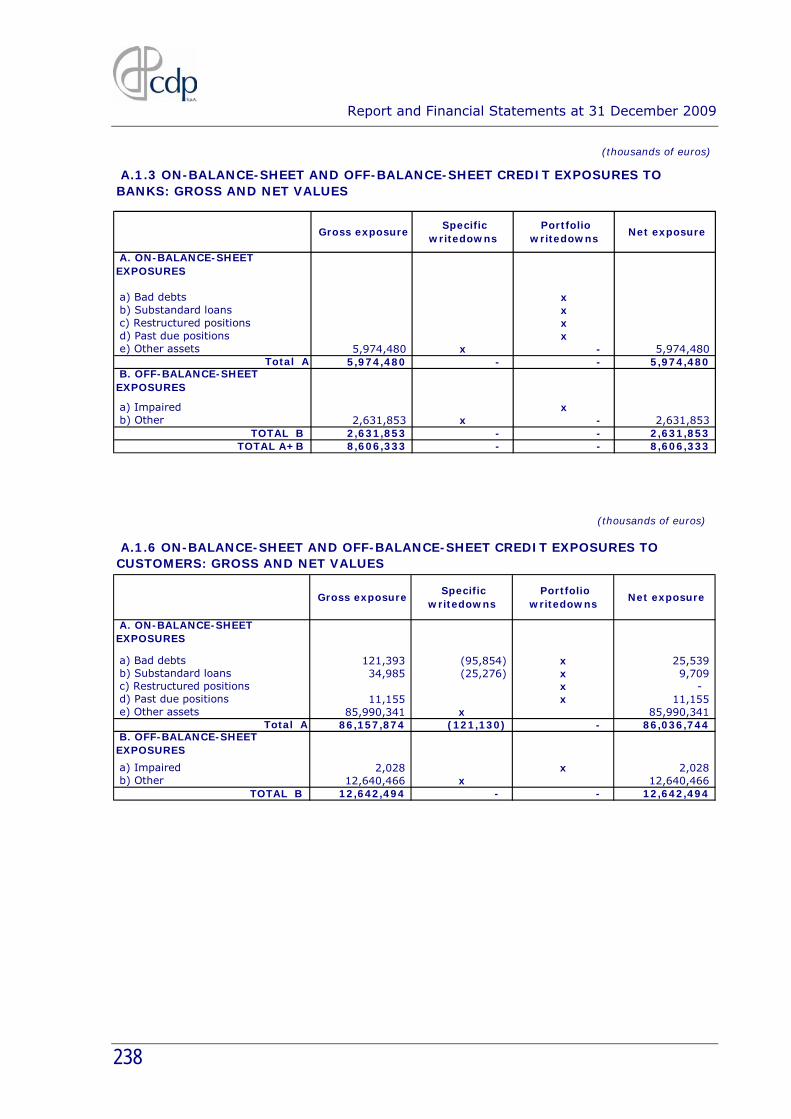
Report and Financial Statements at 31 December 2009
238
(thousands of euros)
A. ON-BALANCE-SHEET EXPOSURES
a) Bad debts x b) Substandard loans x c) Restructured positions x d) Past due positions x e) Other assets 5,974,480 x - 5,974,480
Total A 5,974,480 - - 5,974,480 B. OFF-BALANCE-SHEET EXPOSURES
a) Impaired x b) Other 2,631,853 x - 2,631,853
TOTAL B 2,631,853 - - 2,631,853 TOTAL A+B 8,606,333 - - 8,606,333
A.1.3 ON-BALANCE-SHEET AND OFF-BALANCE-SHEET CREDIT EXPOSURES TO BANKS: GROSS AND NET VALUES
Gross exposure Specific
writedowns Portfolio
writedowns Net exposure
(thousands of euros)
A. ON-BALANCE-SHEET EXPOSURES
a) Bad debts 121,393 (95,854) x 25,539 b) Substandard loans 34,985 (25,276) x 9,709 c) Restructured positions x - d) Past due positions 11,155 x 11,155 e) Other assets 85,990,341 x 85,990,341
Total A 86,157,874 (121,130) - 86,036,744 B. OFF-BALANCE-SHEET EXPOSURES
a) Impaired 2,028 x 2,028 b) Other 12,640,466 x 12,640,466
TOTAL B 12,642,494 - - 12,642,494
A.1.6 ON-BALANCE-SHEET AND OFF-BALANCE-SHEET CREDIT EXPOSURES TO CUSTOMERS: GROSS AND NET VALUES
Gross exposure Specific
writedowns Portfolio
writedowns Net exposure
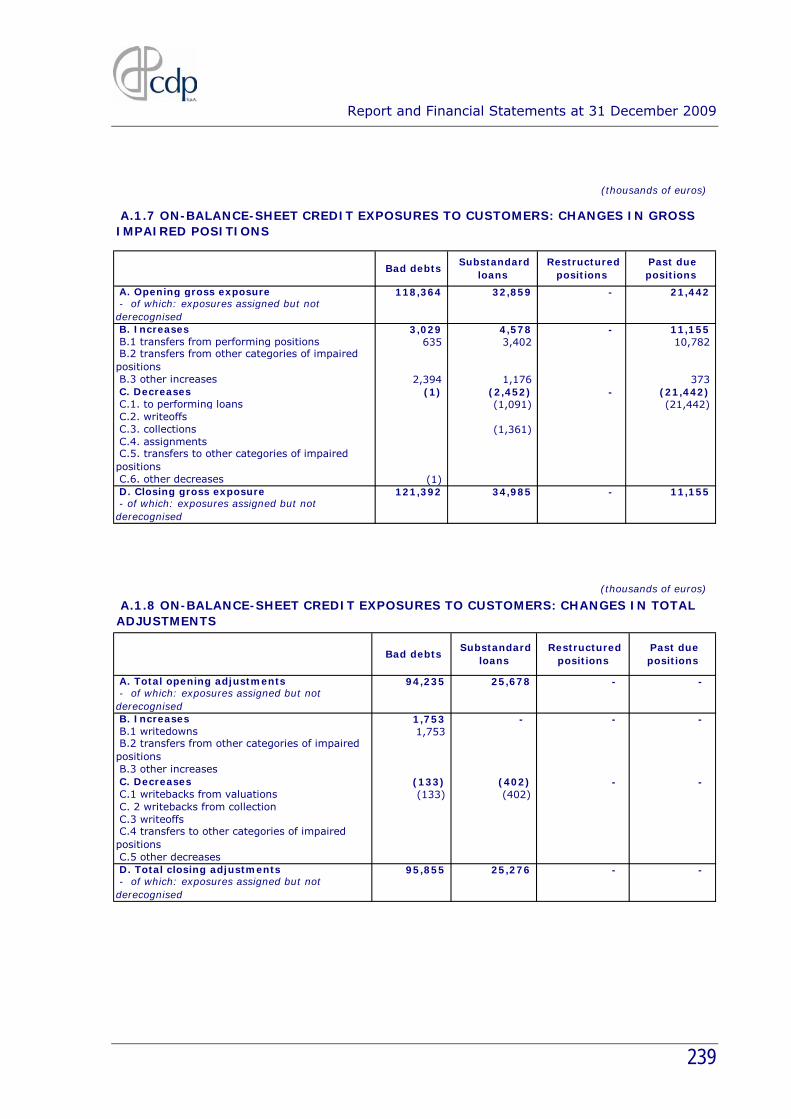
Report and Financial Statements at 31 December 2009
239
(thousands of euros)
A. Opening gross exposure 118,364 32,859 - 21,442 - of which: exposures assigned but not derecognised B. Increases 3,029 4,578 - 11,155 B.1 transfers from performing positions 635 3,402 10,782 B.2 transfers from other categories of impaired positions B.3 other increases 2,394 1,176 373 C. Decreases (1) (2,452) - (21,442) C.1. to performing loans (1,091) (21,442) C.2. writeoffs C.3. collections (1,361) C.4. assignments C.5. transfers to other categories of impaired positions C.6. other decreases (1) D. Closing gross exposure 121,392 34,985 - 11,155 - of which: exposures assigned but not derecognised
A.1.7 ON-BALANCE-SHEET CREDIT EXPOSURES TO CUSTOMERS: CHANGES IN GROSS IMPAIRED POSITIONS
Bad debts Substandard
loans Restructured
positions Past due positions
(thousands of euros)
A. Total opening adjustments 94,235 25,678 - - - of which: exposures assigned but not derecognised B. Increases 1,753 - - - B.1 writedowns 1,753 B.2 transfers from other categories of impaired positions B.3 other increases C. Decreases (133) (402) - - C.1 writebacks from valuations (133) (402) C. 2 writebacks from collection C.3 writeoffs C.4 transfers to other categories of impaired positions C.5 other decreases D. Total closing adjustments 95,855 25,276 - - - of which: exposures assigned but not derecognised
Past due positions
A.1.8 ON-BALANCE-SHEET CREDIT EXPOSURES TO CUSTOMERS: CHANGES IN TOTAL ADJUSTMENTS
Bad debts Substandard
loans Restructured
positions

Report and Financial Statements at 31 December 2009
240
A.2 CLASSIFICATION OF EXPOSURES ON THE BASIS OF EXTERNAL AND INTERNAL
RATINGS
(thousands of euros)
class 1 class 2 class 3 class 4 class 5 class 6
A. On-balance-sheet exposures 39,710,631 15,391,116 713,059 20,359 35,064 36,140,994 92,011,223
B. Derivatives 557,021 639,881 3,212 1,200,114
B.1 Financial derivatives 557,021 639,881 3,212 1,200,114
B.2 Credit derivatives -
C. Guarantees issued 135,307 135,307
D. Commitments to disburse funds 3,779,614 4,325,198 162,167 7,572 - - 5,664,375 13,938,926
Total 44,047,266 20,356,195 875,226 27,931 - 35,064 41,943,888 107,285,570
A.2.1 DISTRIBUTION OF ON-BALANCE-SHEET AND OFF-BALANCE-SHEET CREDIT EXPOSURES BY EXTERNAL RATING GRADES
Total External rating grades
Not rated
A.3 DISTRIBUTION OF SECURED EXPOSURES BY TYPE OF GUARANTEE
(thousands of euros)
A.3.2 SECURED CREDIT EXPOSURES TO CUSTOMERS
1. Secured on-balance-sheet credit exposures:
1.1 fully secured 2,499,764 147,653 57,597 110,325 755,587 180,700 51,590 1,239,111 2,542,563
- of which: impaired 5,334 5,334 5,334
1.2 partially secured 77,104,913 9,143,402 6,021 9,149,423
- of which: impaired 2,367
2. Secured off-balance-sheet credit exposures:
2.1 fully secured 1,554,847 37,290 157,403 36,300 1,004,113 344,759 55,680 1,635,545
- of which: impaired
2.2 partially secured
- of which: impaired
Govern
men
ts a
nd
cen
tral b
an
ks
Oth
er
go
vern
men
t ag
en
cies
Ban
ks
Unsecured guarantees (2)
Lan
d a
nd
bu
ild
ing
s
Secu
riti
es
Oth
er
ass
ets
Net
exp
osu
re
Collateral (1)
Total (1)+(2)
CL N
Credit derivatives
Guarantees
Oth
er
Govern
men
ts a
nd
cen
tral
ban
ks
Oth
er
go
vern
men
t ag
en
cies
Ban
ks
Oth
er
Other derivatives

Report and Financial Statements at 31 December 2009
241
B. DISTRIBUTION AND CONCENTRATION OF LENDING
B.1 ON-BALANCE-SHEET AND OFF-BALANCE-SHEET CREDIT EXPOSURES TO
CUSTOMERS BY SECTOR (BOOK VALUE)
(thousands of euros)
A. On-balance-sheet exposures A.1 Bad debts x 2,367 (1,087) x 21,829 (65,486) x x 1,342 (29,281) x x A.2 Substandard loans x 661 (25,061) x x x 9,048 (215) x x
A.3 Restructured positions x x x x x x A.4 Past due positions x 2,438 - x x x 8,393 - x 324 x A.5 Other 33,710,965 x - 44,896,431 x - 584,957 x - x 6,750,792 x - 47,195 x - Total A 33,710,965 - - 44,901,897 (26,148) - 606,786 (65,486) - - - - 6,769,575 (29,496) - 47,519 - - B. Off-balance-sheet exposures B.1 Bad debts x x x x x x B.2 Substandard loans x x x x 586 - x x B.3 Other impaired assets x x x x 1,442 x x B.4 Other 1,902,669 x - 6,842,268 x - 122,913 x - x 3,745,916 x - 26,700 x - Total B 1,902,669 - - 6,842,268 - - 122,913 - - - - - 3,747,944 - - 26,700 - -
Total (A+B) at 31/12/2009
35,613,634 - - 51,744,165 (26,148) - 729,699 (65,486) - - - - 10,517,519 (29,496) - 74,219 - -
Total (A+B) at 31/12/2008
35,606,380 - - 49,423,512 (26,281) - 704,881 (21,829) - - - - 9,095,406 (28,146) - 74,714 - -
Net
exp
osu
re
Sp
eci
fic
wri
ted
ow
ns
Po
rtfo
lio
wri
ted
ow
ns
B.1 ON-BALANCE-SHEET AND OFF-BALANCE-SHEET CREDIT EXPOSURES TO CUSTOMERS BY SECTOR (BOOK VALUE) Insurance
undertakings Non-financial companies Other
Net
exp
osu
re
Sp
eci
fic
wri
ted
ow
ns
Po
rtfo
lio
wri
ted
ow
ns
Net
exp
osu
re
Sp
eci
fic
wri
ted
ow
ns
Po
rtfo
lio
wri
ted
ow
ns
Governments Other government agencies Financial companies
Net
exp
osu
re
Sp
eci
fic
wri
ted
ow
ns
Po
rtfo
lio
wri
ted
ow
ns
Po
rtfo
lio
wri
ted
ow
ns
Net
exp
osu
re
Sp
eci
fic
wri
ted
ow
ns
Net
exp
osu
re
Sp
eci
fic
wri
ted
ow
ns
Po
rtfo
lio
wri
ted
ow
ns

Report and Financial Statements at 31 December 2009
242
B.2 ON-BALANCE-SHEET AND OFF-BALANCE-SHEET CREDIT EXPOSURES TO
CUSTOMERS BY GEOGRAPHICAL AREA (BOOK VALUE)
(thousands of euros)
A. On-balance-sheet exposures A.1 Bad debts 3,709 (30,368) 21,829 (65,486) A.2 Substandard loans 9,709 (25,276) A.3 Restructured positions A.4 Past due positions 11,155 A.5 Other 85,982,753 7,588 - Total A 86,007,326 (55,644) 29,417 (65,486) - - - - - - B. Off-balance-sheet exposures B.1 Bad debts B.2 Substandard loans 586 B.3 Other impaired assets 1,442 B.4 Other 12,516,158 - 49,344 - 74,964 Total B 12,518,186 - 49,344 - 74,964 - - - - -
Total (A+B) at 31/12/2009 98,525,512 (55,644) 78,761 (65,486) 74,964 - - - - -
Total (A+B) at 31/12/2008 94,759,447 (54,426) 130,448 (21,829) 14,998 - - - - -
B.2 ON-BALANCE-SHEET AND OFF-BALANCE-SHEET CREDIT EXPOSURES TO CUSTOMERS BY GEOGRAPHICAL AREA (BOOK VALUE)
Italy Other European
countries Americas Asia Rest of world
Net
exp
osu
re
Tota
l w
rite
do
wn
s
Net
exp
osu
re
Tota
l w
rite
do
wn
s
Net
exp
osu
re
Tota
l w
rite
do
wn
s
Tota
l w
rite
do
wn
s
Net
exp
osu
re
Tota
l w
rite
do
wn
s
Net
exp
osu
re
B.3 ON-BALANCE-SHEET AND OFF-BALANCE-SHEET CREDIT EXPOSURES TO BANKS
BY GEOGRAPHICAL AREA (BOOK VALUE)
(thousands of euros)
A. On-balance-sheet exposures A.1 Bad debts A.2 Substandard loans A.3 Restructured positions A.4 Past due positions A.5 Other 5,066,502 - 907,977 Total A 5,066,502 - 907,977 - - - - - - - B. Off-balance-sheet exposures B.1 Bad debts B.2 Substandard loans B.3 Other impaired assets B.4 Other 1,684,371 - 947,482 Total B 1,684,371 - 947,482 - - - - - - -
Total (A+B) at 31/12/2009 6,750,873 - 1,855,459 - - - - - - - Total (A+B) at 31/12/2008 4,196,713 - 1,051,256 -
To
tal w
rite
do
wn
s
Net
exp
osu
re
To
tal w
rite
do
wn
s
To
tal w
rite
do
wn
s
Net
exp
osu
re
To
tal w
rite
do
wn
s
Net
exp
osu
re
B.3 ON-BALANCE-SHEET AND OFF-BALANCE-SHEET CREDIT EXPOSURES TO BANKS BY GEOGRAPHICAL AREA (BOOK VALUE)
Italy Other European
countries Americas Asia Rest of world
Net
exp
osu
re
To
tal w
rite
do
wn
s
Net
exp
osu
re

Report and Financial Statements at 31 December 2009
243
C. SECURITISATIONS AND ASSET DISPOSALS C.1 SECURITISATIONS
QUALITATIVE DISCLOSURES
At the end of 2002, CDP carried out a securitisation with the assignment without recourse of six portfolios of claims on customers in respect of loans to the following types of borrowers: 1. special corporations or consortiums operated by local authorities,
consortiums of local authorities, and public or private limited companies operating public services (portfolio extinguished on 1 July 2009);
2. departments of the state, the regions, the autonomous provinces or local authorities;
3. AEM Elettricità S.p.A.; 4. Acea Distribuzione S.p.A. (portfolio extinguished at the end of 2005); 5. TAV S.p.A.; 6. Poste Italiane S.p.A. As regard the obligations of CDP, which are defined in the assignment contract, under which CDP has made certain representations and guarantees to CPG, taking on specified costs, expenses and liabilities associated with the portfolios, please note that the operation and the flows linked to all the securitised portfolios are proceeding regularly. The loans underlying the transaction were fully derecognised, since CDP applied the provisions of paragraph 27 of IFRS 1, which requires first-time adopters to apply the derecognition rules for financial assets prospectively for transactions carried out as from 1 January 2004. In 2009, with the extinguishment of the bonds issued in respect of the securitised portfolio of loans to the operators of public services, the portfolio was closed and the residual assets were transferred to CDP as the deferred price for the transaction. In addition to liquidity, the residual assets transferred to CDP include loans not yet past due to operators of public services and a security issued by the securitised portfolio of receivables due from AEM Elettricità S.p.A., the value of which at the end of 2009 came to €29.9 million. As regards securitisations conducted by third parties, the CDP holds a bond issued by the INPS - S.C.C.I. S.p.A. securitisation vehicle.

Report and Financial Statements at 31 December 2009
244
QUANTITATIVE DISCLOSURES
(thousands of euros)
Gro
ss e
xp
osu
re
Net
exp
osu
re
Gro
ss e
xp
osu
re
Net
exp
osu
re
Gro
ss e
xp
osu
re
Net
exp
osu
re
Gro
ss e
xp
osu
re
Net
exp
osu
re
Gro
ss e
xp
osu
re
Net
exp
osu
re
Gro
ss e
xp
osu
re
Net
exp
osu
re
Gro
ss e
xp
osu
re
Net
exp
osu
re
Gro
ss e
xp
osu
re
Net
exp
osu
re
Gro
ss e
xp
osu
re
Net
exp
osu
re
A. With own underlying assets: 29,888 a) Impaired b) Other 29,888
B. With third-party underlying assets: 199,116 199,116 a) Impaired b) Other 199,116 199,116
C.1.1 EXPOSURES IN RESPECT OF SECURITISATIONS BY QUALITY OF SECURITISED ASSETS
Credit lines
Senior Mezzanine Junior
On-balance-sheet exposures Guarantees issued
Senior Mezzanine Junior Junior Senior Mezzanine
(thousands of euros)
Bo
ok v
alu
e
Wri
ted
ow
ns/
wri
teb
ack
s
Bo
ok v
alu
e
Wri
ted
ow
ns/
wri
teb
ack
s
Bo
ok v
alu
e
Wri
ted
ow
ns/
wri
teb
ack
s
Net
exp
osu
re
Wri
ted
ow
ns/
wri
teb
ack
s
Net
exp
osu
re
Wri
ted
ow
ns/
wri
teb
ack
s
Net
exp
osu
re
Wri
ted
ow
ns/
wri
teb
ack
s
Net
exp
osu
re
Wri
ted
ow
ns/
wri
teb
ack
s
Net
exp
osu
re
Wri
ted
ow
ns/
wri
teb
ack
s
Net
exp
osu
re
Wri
ted
ow
ns/
wri
teb
ack
s
A. Fully derecognised A.1 CPG - Società di cartolarizzazione a r.l. 29,888 - Long-term loans B. Partially derecognised B.1 name of securitisation 1 - type of asset B.2 name of securitisation 2 - type of asset B.3 name of securitisation .. - type of asset C. Not derecognised C.1 name of securitisation 1 - type of asset C.2 name of securitisation 2 - type of asset C.3 name of securitisation .. - type of asset
C.1.2 EXPOSURES IN RESPECT OF MAIN OWN SECURITISATIONS BY TYPE OF SECURITISED ASSETS AND TYPE OF EXPOSURE
Mezzanine Junior On-balance-sheet exposures Guarantees issued Credit lines
Senior Mezzanine Junior Senior Mezzanine Junior Senior
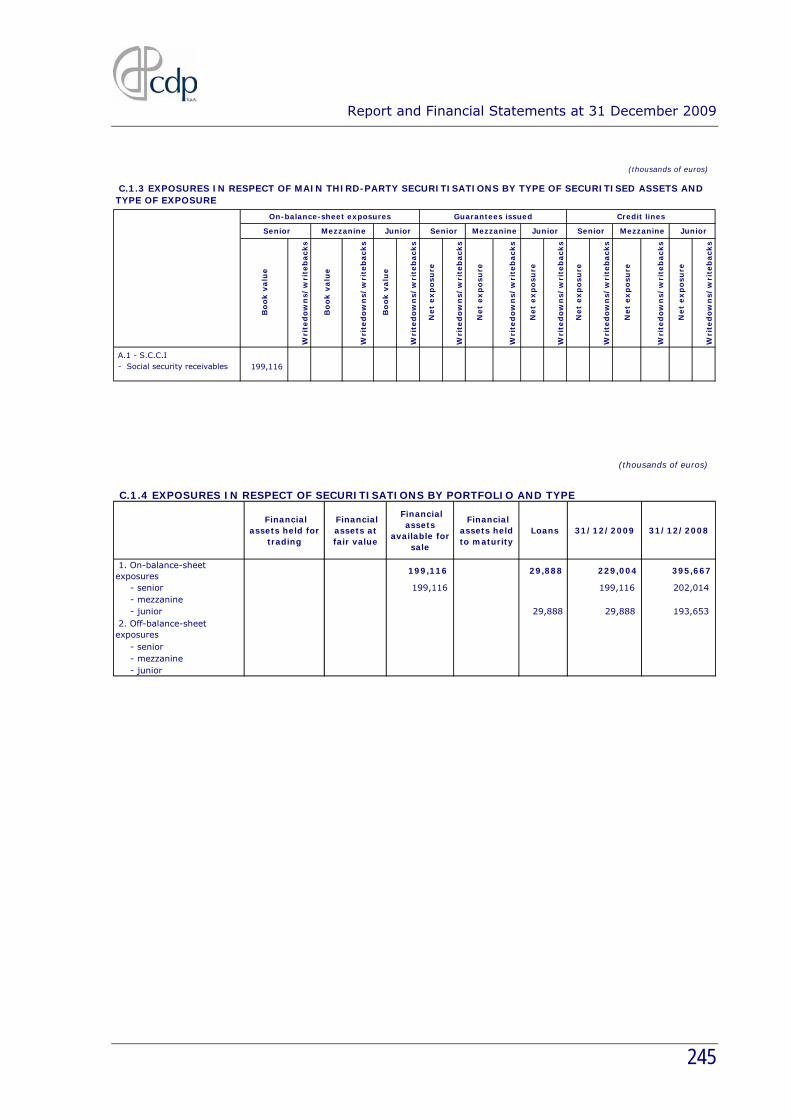
Report and Financial Statements at 31 December 2009
245
(thousands of euros)
Bo
ok v
alu
e
W
rite
do
wn
s/w
rite
back
s
Bo
ok v
alu
e
W
rite
do
wn
s/w
rite
back
s
Bo
ok v
alu
e
W
rite
do
wn
s/w
rite
back
s
Net
exp
osu
re
W
rite
do
wn
s/w
rite
back
s
Net
exp
osu
re
W
rite
do
wn
s/w
rite
back
s
Net
exp
osu
re
W
rite
do
wn
s/w
rite
back
s
Net
exp
osu
re
W
rite
do
wn
s/w
rite
back
s
Net
exp
osu
re
W
rite
do
wn
s/w
rite
back
s
Net
exp
osu
re
W
rite
do
wn
s/w
rite
back
s
A.1 - S.C.C.I - Social security receivables 199,116
Mezzanine Junior Senior Senior
C.1.3 EXPOSURES IN RESPECT OF MAIN THIRD-PARTY SECURITISATIONS BY TYPE OF SECURITISED ASSETS AND TYPE OF EXPOSURE
Mezzanine Junior
On-balance-sheet exposures Guarantees issued Credit lines
Senior Mezzanine Junior
(thousands of euros)
Financial assets held for
trading
Financial assets at fair value
Financial assets
available for sale
Financial assets held to maturity
Loans 31/12/2009 31/12/2008
1. On-balance-sheet exposures
199,116 29,888 229,004 395,667
- senior 199,116 199,116 202,014 - mezzanine - junior 29,888 29,888 193,653 2. Off-balance-sheet exposures - senior - mezzanine - junior
C.1.4 EXPOSURES IN RESPECT OF SECURITISATIONS BY PORTFOLIO AND TYPE

Report and Financial Statements at 31 December 2009
246
(thousands of euros)
im
pair
ed
ass
ets
perf
orm
ing
ass
ets
im
pair
ed
ass
ets
perf
orm
ing
ass
ets
im
pair
ed
ass
ets
perf
orm
ing
ass
ets
334,254 154,110
C.1.7 SERVICER ACTIVITIES - COLLECTIONS ON SECURITISED ASSETS AND REDEMPTION OF SECURITIES ISSUED BY VEHICLE
% of securities redeemed (end-period figure)
senior mezzanine
Securitised assets (end-
period figure)
Collections in the year
junior
Im
pair
ed
Im
pair
ed
Perf
orm
ing
Perf
orm
ing
CPG - Società di cartolarizzazione a r.l.
C.3 COVERED BOND TRANSACTIONS
To fund its lending activities under the Separate Account, in 2004 CDP launched a programme for the emission of up to €20 billion in covered bonds secured by assets consisting of CDP loans to or guaranteed by Italian regional and local governments. The operation was conducted on the basis of Article 5.18 of Decree Law 269/03, pursuant to which CDP “may pledge its assets and legal relationships to satisfy the rights of the holders of securities it issues”. This instrument limited the exposure to market and refinancing risks, ensuring a closer matching of assets and liabilities (thanks to the relatively long-term maturities of the fixed-rate securities issued), with a consequent reduction of the cost of related hedging transactions. It also gave CDP access to a broad, diversified pool of investors not to be found among traditional subscribers of postal savings products. This form of funding does not benefit from a State guarantee, but its cost is still lower than the cost of any unsecured bonds the company might issue. Since the start of the programme, four public issues have been carried out with a total overall value of €8 billion (at present, following the redemption of €2 billion on 31 July 2009, the nominal value of the securities issued comes to €6 billion) as well as a privately-placed yen-denominated issue equal to about €64 million.

Report and Financial Statements at 31 December 2009
247
Since 2007, issues under the programme have been suspended and under current conditions there appear to be no market opportunities that would counsel additional issues of covered bonds.
SECTION 2 – MARKET RISKS
2.1 INTEREST RATE AND PRICE RISK – SUPERVISORY TRADING BOOK
QUALITATIVE DISCLOSURES
A. General aspects
CDP did not undertake any transactions qualifying for allocation to the supervisory trading book.
2.2 INTEREST RATE AND PRICE RISK – BANKING BOOK
QUALITATIVE DISCLOSURES
A. General aspects, management and measurement of interest rate risk and price risk
As part of its maturity transformation activities, CDP is exposed to interest rate risk in all its forms: repricing, yield curve, basis and optionality. This risk can affect the profits and economic value of CDP. Since its transformation into a company limited by shares, Cassa Depositi e Prestiti has faced unusual circumstances in terms of controlling and measuring interest rate risk, both in respect of the substantial volumes of existing unhedged positions and the special characteristics of its products. This situation has made it necessary, as well as advisable, to adopt best practices in dealing with interest rate risk. Traditional measurement techniques for interest rate risk on the banking book, based on gap analysis, are not sufficient to capture the risk profile of interest-bearing postal savings bonds: the presence of large volumes of assets with an early redemption option is one of the recognised cases in which such models are not recommended.

Report and Financial Statements at 31 December 2009
248
CDP calculates exposure and risk metrics on the basis of the measurement of all balance sheet items – an approach termed the “economic value perspective” – and measures the changes in the value of those items in response to small changes (sensitivity analysis) and large changes (stress testing) in risk factors. The transition from the exposure measurements obtained from the sensitivity and stress analyses to the risk metrics involves assigning a probability to possible market scenarios: this gives a statistical distribution of the value of the balance sheet items. This monitoring structure is translated into the calculation of value at risk (VaR), which summarises the outcome of the simulations performed in a single value. While aware of the limits of any composite metric, CDP uses VaR because it has two significant strengths: - it captures the consequences of complex characteristics of the markets and
products (volatility, correlation, optionality and asymmetry) in a single value; - it makes it possible, by way of backtesting, to check the hypotheses
underpinning the calculations and simulations. CDP supplements the VaR approach, which offers a view of risk exposure on an unchanged-portfolio basis, with a dynamic ALM system (DALM). The system enables the company to simulate, under various market scenarios, the impact of corrective hedging on the exposure to risk and on net interest income within the long-term horizon of the business plan, given the pricing strategies adopted for its products. Under the Separate Account, CDP seeks to exploit “natural hedge relationships” between fixed-rate assets and liabilities. Hedging therefore regards subsets of asset or liabilities depending on the sign of the net exposure, with a view to limiting the overall VaR. Operational responsibility for managing interest rate risk lies with the Finance department. The measurement and monitoring of interest rate risk are performed by the Risk Management department for top management, which reports periodically to the Board of Directors. The components of price risk associated with large listed equity investments regard adverse movements in stock prices. This could produce – as it did in 2008 and the first part of 2009 – a significant decrease in their value, with a potentially adverse impact on the balance sheet and/or income statement. An additional source of price risk is the indexation of indexed postal savings bonds and the Premia bonds to the Dow Jones EUROSTOXX 50 index.

Report and Financial Statements at 31 December 2009
249
B. Fair value hedges
The strategies underlying the fair value hedging are aimed at reducing interest rate risk metrics and differ in part for the two Accounts. The lending and funding of the Ordinary Account are normally hedged against interest rate risk at the origination stage. As regards the liability side, structured floating-rate issues were hedged with interest rate swaps (IRSs) linked to 6-month Euribor plus a spread, while on the asset side fixed-rate loans were hedged with amortising IRSs in which CDP pays fixed and receives floating. All the hedges under the Ordinary Account are micro fair value hedges. In the case of bond issues, the hedges are specific to the issue; for loans, hedges may regard a uniform aggregate of loans. The Separate Account faces special circumstances in view of the substantial volume of unhedged exposures that pre-dated the transformation of CDP into a joint-stock company. As regards financial liabilities, in 2005, with a negative exposure to a reduction in interest rates, CDP undertook a programme of hedging interest rate risk (qualified as a macro fair value hedge) on a portfolio of postal savings bonds using roller-coaster IRSs in which CDP receives fixed and pays 12-month Euribor plus a spread. Between the end of 2009 and early 2010, CDP terminated all hedges of the portfolio, realising a mark-to-market gain. This move, which was only partially offset by the termination of a number of hedges of assets, enabled CDP to obtain a moderate positive exposure to a rise in interest rates, an optimal situation given the overall ALM position and macroeconomic conditions. Issues of fixed-rate covered bonds in euros were systematically transformed into floating rates using IRSs at the origination stage. As regard financial assets, at the start of 2006, following the renegotiation of fixed-rate loans charged to the state, CDP had a negative exposure to a rate increase. CDP responded with a programme of micro-hedges of the interest rate risk on portfolios of loans with uniform rate and maturity features. The programme was implemented using amortising IRSs in which CDP pays fixed and receives 6-month Euribor plus a spread. In 2007 and 2008, part of new fixed-rate lending continued to be hedged, together with transactions regarding existing fixed-rate loans.

Report and Financial Statements at 31 December 2009
250
The price risk associated with issues of indexed savings bonds and the Premia series is systematically hedged using options that match those embedded in the bonds. These transactions are not subject to hedge accounting: the embedded options sold and the options purchased are both recognised at fair value. The notional of the options purchased for each issue is calculated on the basis of the proprietary model of customer redemption behaviour.
C. Cash flow hedges
At 31 December 2009, the only open cash flow hedge regarded the issue of a fixed-rate covered bond in yen, which was hedged with a cross currency swap to counter the uncertainty concerning cash flows due to possible exchange rate variations. The hedge converts the original exposure into a fixed rate in euros.
QUANTITATIVE DISCLOSURES
1. Banking book: distribution of financial assets and liabilities by residual maturity (repricing date)
The following figure shows an analysis of interest rate risk sensitivity developed on the basis of internal models.

Report and Financial Statements at 31 December 2009
251
Sen
siti
vit
y t
o e
uro
zero
-co
up
on
rate
s b
y m
atu
rity
Mark
et
data
at
31
Dece
mb
er
20
09
Ris
k F
act
ors
Delt
aO
N-5
mo
-28,4
38
6m
o-11m
o-7
23,8
54
12m
o-12m
o409,5
98
18m
o-18m
o227,9
07
2yr
-2yr
273,8
33
3yr
-3yr
828,6
53
4yr
-4yr
1,2
27,8
09
5yr
-5yr
1,6
52,9
20
6yr
-6yr
1,6
23,6
02
7yr
-7yr
2,1
26,0
78
8yr
-8yr
1,8
20,4
16
9yr
-9yr
3,1
40,9
28
10yr
-10yr
-1,2
54,0
05
12yr
-12yr
9,8
48,5
91
15yr
-15yr
4,0
91,0
89
20yr
-20yr
-8,2
77,2
18
25yr
-25yr
-6,7
68,5
26
30yr
-50yr
-1,1
15,1
44
Ag
gre
gate
Port
foli
os
- D
elt
a
-10
,00
0,0
00
-8,0
00
,00
0
-6,0
00
,00
0
-4,0
00
,00
0
-2,0
00
,00
00
2,0
00
,00
0
4,0
00
,00
0
6,0
00
,00
0
8,0
00
,00
0
10
,00
0,0
00
12
,00
0,0
00
ON-5mo
6mo-11mo
12mo-12mo
18mo-18mo
2yr-2yr
3yr-3yr
4yr-4yr
5yr-5yr
6yr-6yr
7yr-7yr
8yr-8yr
9yr-9yr
10yr-10yr
12yr-12yr
15yr-15yr
20yr-20yr
25yr-25yr
30yr-50yr

Report and Financial Statements at 31 December 2009
252
2.3 EXCHANGE RATE RISK
QUALITATIVE DISCLOSURES
A. General aspects, management and measurement of exchange rate risk
In 2009 CDP accrued a temporary exposure in dollars associated with the deferred payment of a part of the dividends of STMicroelectronics Holding N.V. B. Hedging exchange rate risk
The exchange rate risk in respect of foreign-currency issues (a covered bond issue and two bond issues under the EMTN programme) was hedged with cross currency swaps.
QUANTITATIVE DISCLOSURES
1. Distribution by currency of assets, liabilities and derivatives
(thousands of euros)
A. Financial assetsA.1 Debt securitiesA.2 Equity securitiesA.3 Loans to banksA.4 Loans to customersA.5 Other financial assetsB. Other assets C. Financial liabilitiesC.1 Due to banksC.2 Due to customersC.3 Debt securities 259,756 76,379 C.4 Other financial liabilitiesD. Other liabilities 259,756 76,379 E. Financial derivatives:
- Options+ long positions+ short positions
- Other derivatives+ long positions 259,756 76,379 + short positions
Total assets 259,756 76,379 Total liabilities 259,756 76,379 Difference (+/-) - -
1. DISTRIBUTION BY CURRENCY OF ASSETS, LIABILITIES AND DERIVATIVES
Currency
US dollar Pound sterling
Yen Canadian
dollar Swiss franc Other

Report and Financial Statements at 31 December 2009
253
2.6 DERIVATIVES
A. FINANCIAL DERIVATIVES
A.2 Banking book: end-period and average notional values
(thousands of euros)
A.2.1 HEDGING
Over the counter
Central counterparties
Over the counter
Central counterparties
1. Debt securities and interest rates a) Options b) Swaps 24,390,885 34,017,266 c) Forwards d) Futures e) Other2. Equity securities and equity indices a) Options b) Swaps c) Forwards d) Futures e) Other3. Exchange rates and gold a) Options b) Swaps c) Forwards d) Futures e) Other 434,000 79,277 4. Commodities5. Other underlyings
Total 24,824,885 34,096,543 Average values 29,460,714 30,007,378
31/12/2009 31/12/2008
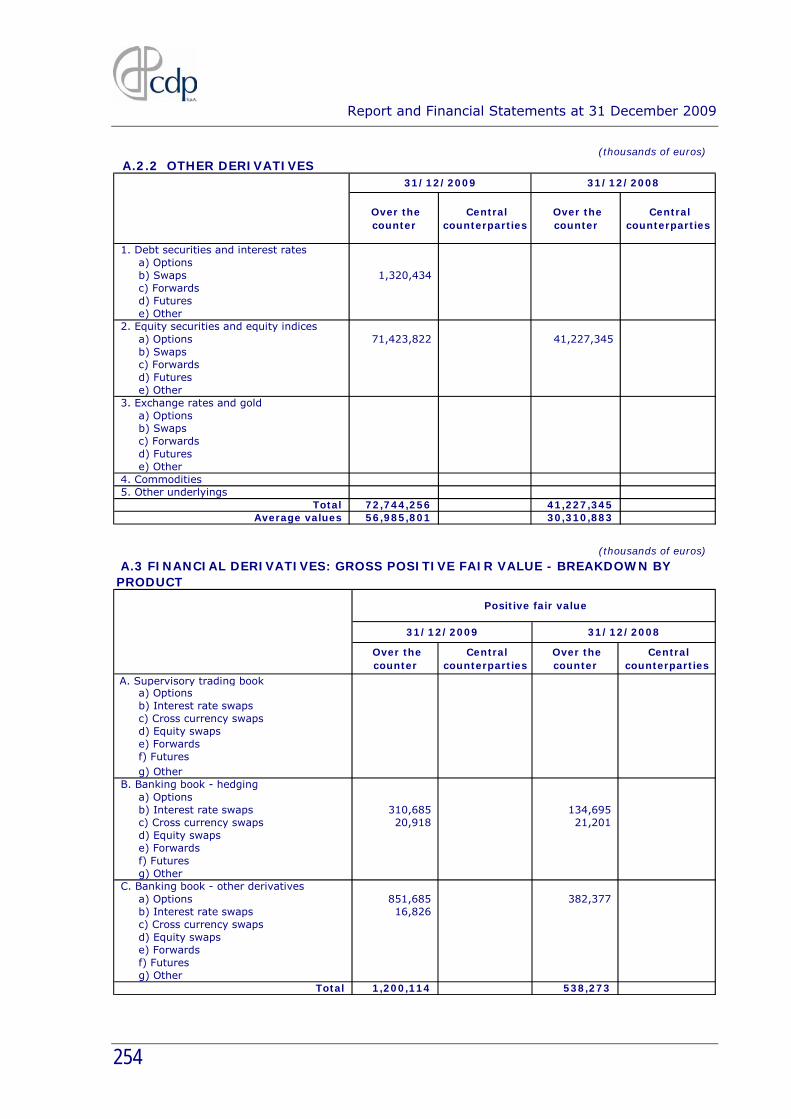
Report and Financial Statements at 31 December 2009
254
(thousands of euros)A.2.2 OTHER DERIVATIVES
Over the counter
Central counterparties
Over the counter
Central counterparties
1. Debt securities and interest rates a) Options b) Swaps 1,320,434 c) Forwards d) Futures e) Other2. Equity securities and equity indices a) Options 71,423,822 41,227,345 b) Swaps c) Forwards d) Futures e) Other3. Exchange rates and gold a) Options b) Swaps c) Forwards d) Futures e) Other4. Commodities5. Other underlyings
Total 72,744,256 41,227,345 Average values 56,985,801 30,310,883
31/12/2009 31/12/2008
(thousands of euros)
Over the counter
Central counterparties
Over the counter
Central counterparties
A. Supervisory trading book a) Options b) Interest rate swaps c) Cross currency swaps d) Equity swaps e) Forwards f) Futures g) OtherB. Banking book - hedging a) Options b) Interest rate swaps 310,685 134,695 c) Cross currency swaps 20,918 21,201 d) Equity swaps e) Forwards f) Futures g) OtherC. Banking book - other derivatives a) Options 851,685 382,377 b) Interest rate swaps 16,826 c) Cross currency swaps d) Equity swaps e) Forwards f) Futures g) Other
Total 1,200,114 538,273
31/12/2009 31/12/2008
A.3 FINANCIAL DERIVATIVES: GROSS POSITIVE FAIR VALUE - BREAKDOWN BY PRODUCT
Positive fair value
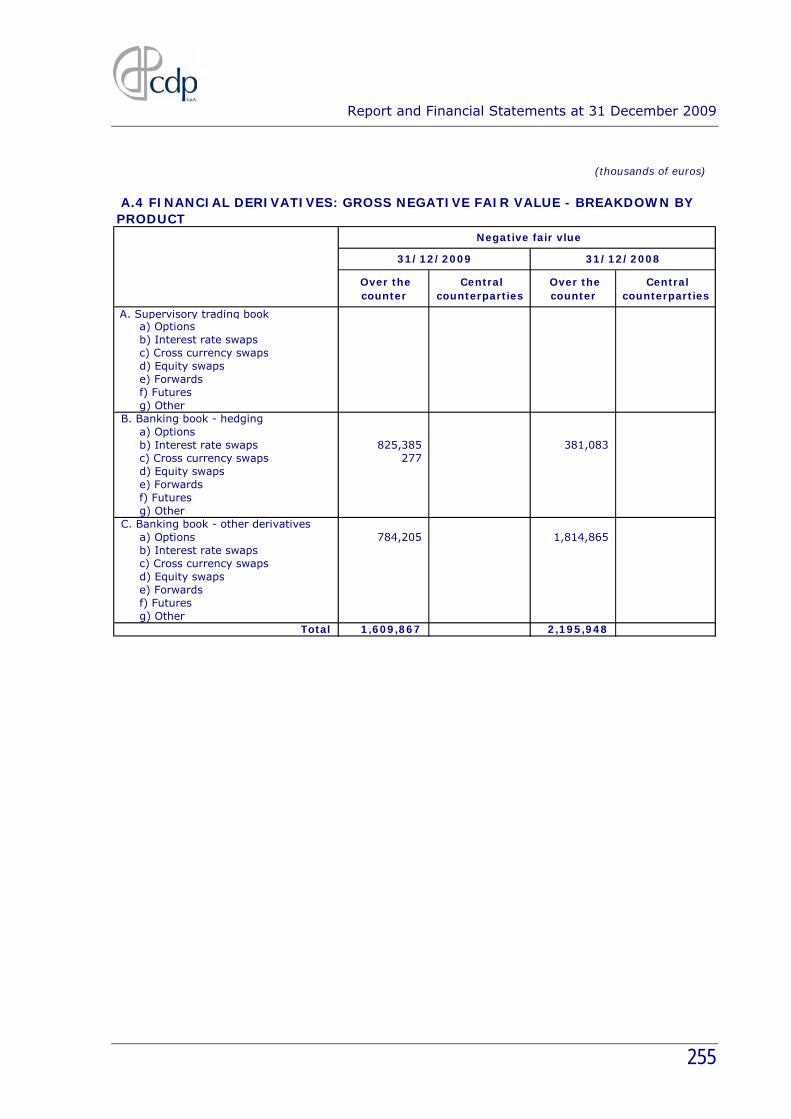
Report and Financial Statements at 31 December 2009
255
(thousands of euros)
Over the counter
Central counterparties
Over the counter
Central counterparties
A. Supervisory trading book a) Options b) Interest rate swaps c) Cross currency swaps d) Equity swaps e) Forwards f) Futures g) OtherB. Banking book - hedging a) Options b) Interest rate swaps 825,385 381,083 c) Cross currency swaps 277 d) Equity swaps e) Forwards f) Futures g) OtherC. Banking book - other derivatives a) Options 784,205 1,814,865 b) Interest rate swaps c) Cross currency swaps d) Equity swaps e) Forwards f) Futures g) Other
Total 1,609,867 2,195,948
A.4 FINANCIAL DERIVATIVES: GROSS NEGATIVE FAIR VALUE - BREAKDOWN BY PRODUCT
31/12/2009 31/12/2008
Negative fair vlue

Report and Financial Statements at 31 December 2009
256
(thousands of euros)
Contracts not covered by netting arrangements
Go
vern
men
ts a
nd
cen
tral
ban
ks
Oth
er
go
vern
men
t ag
en
cies
Ban
ks
Fin
an
cial co
mp
an
ies
In
sura
nce
un
dert
akin
gs
No
n-f
inan
cial co
mp
an
ies
Oth
er
1) Debt securities and interest rates - notional value - positive fair value - negative fair value - future exposure
2) Equity securities and equity indices - notional value 28,983,474 - positive fair value - negative fair value 784,204 - future exposure3) Exchange rates and gold - notional value - positive fair value - negative fair value - future exposure4) Other - notional value - positive fair value - negative fair value - future exposure
A.7 OVER-THE-COUNTER FINANCIAL DERIVATIVES - BANKING BOOK: NOTIONAL VALUES, GROSS POSITIVE AND NEGATIVE FAIR VALUES BY COUNTERPARTY - CONTRACTS NOT COVERED BY NETTING ARRANGEMENTS

Report and Financial Statements at 31 December 2009
257
(thousands of euros)
Contracts covered by netting arrangements
Go
vern
men
ts a
nd
ce
ntr
al b
an
ks
Oth
er
go
vern
men
t ag
en
cies
Ban
ks
Fin
an
cial co
mp
an
ies
In
sura
nce
u
nd
ert
akin
gs
No
n-f
inan
cial
com
pan
ies
Oth
er
1) Debt securities and interest rates - notional value 22,096,699 3,614,620 - positive fair value 219,402 108,109 - negative fair value 723,539 101,846
2) Equity securities and equity indices - notional value 36,824,600 388,000 - positive fair value 831,105 20,580 - negative fair value3) Exchange rates and gold - notional value 434,000 - positive fair value 20,918 - negative fair value 277 4) Other - notional value - positive fair value - negative fair value
A.8 OVER-THE-COUNTER FINANCIAL DERIVATIVES - BANKING BOOK: NOTIONAL VALUES, GROSS POSITIVE AND NEGATIVE FAIR VALUES BY COUNTERPARTY - CONTRACTS COVERED BY NETTING ARRANGEMENTS
(thousands of euros)
A.9 RESIDUAL LIFE OF OVER-THE-COUNTER FINANCIAL DERIVATIVES: NOTIONAL VALUES
To 1 year From 1 to 5
years More than 5
years Total
A. Supervisory trading book A.1 Financial derivatives on debt securities and interest ratesA.2 Financial derivatives on equity securities and equity indicesA.3 Financial derivatives on exchange rates and goldA.4 Financial derivatives on other assets
B. Banking bookB.1 Financial derivatives on debt securities and interest rates 1,379,282 8,117,073 16,214,964 25,711,319 B.2 Financial derivatives on equity securities and equity indices 4,756,427 47,271,333 8,154,015 60,181,775 B.3 Financial derivatives on exchange rates and gold 261,275 172,724 433,999 B.4 Financial derivatives on other assets
Total 31/12/2009 6,135,709 55,649,681 24,541,703 86,327,093 Total 31/12/2008 4,282,021 30,583,904 31,459,348 66,325,273

Report and Financial Statements at 31 December 2009
258
C. FINANCIAL AND CREDIT DERIVATIVES
(thousands of euros)
Go
vern
men
ts a
nd
ce
ntr
al b
an
ks
Oth
er
go
vern
men
t ag
en
cies
Ban
ks
Fin
an
cial co
mp
an
ies
In
sura
nce
un
dert
akin
gs
No
n-f
inan
cial
com
pan
ies
Oth
er
1) Bilateral financial derivatives agreements - positive fair value 674,181 120,823 - negative fair value 326,572 93,980 - future exposure 1,455,132 25,642 - net counterparty risk 2,067,104 93,521 2) Bilaterial credit derivatives agreements - notional value - positive fair value - negative fair value - future exposure - net counterparty risk3) Cross product agreements - notional value - positive fair value - negative fair value - future exposure - net counterparty risk
C.1 OVER-THE-COUNTER FINANCIAL AND CREDIT DERIVATIVES: NET FAIR VALUE AND FUTURE EXPOSURE BY COUNTERPARTY

Report and Financial Statements at 31 December 2009
259
SECTION 3 – LIQUIDITY RISK
QUALITATIVE DISCLOSURES
A. General aspects, management and measurement of liquidity risk
In managing liquidity risk, CDP benefits from the mitigating effect of the state guarantee on postal savings and the stable and large surplus of liquid assets. Considering the nature of postal savings, it is nevertheless a priority to hold sufficient liquidity to cover possible temporary surges in redemptions. To this end, a lower limit on the stock of liquid assets has been established, which is monitored by the Risk Management department. As regards the Ordinary Account, CDP raises funds through the market or the EIB, adopting an approach similar to that of ordinary banks. Risk Management prepares liquidity gap analyses that identify any potential shortfalls at short, medium and long term. Current management of treasury activities by Finance enables CDP to raise funds on the interbank market as well, using deposits and repos, for both the Separate and Ordinary Accounts.
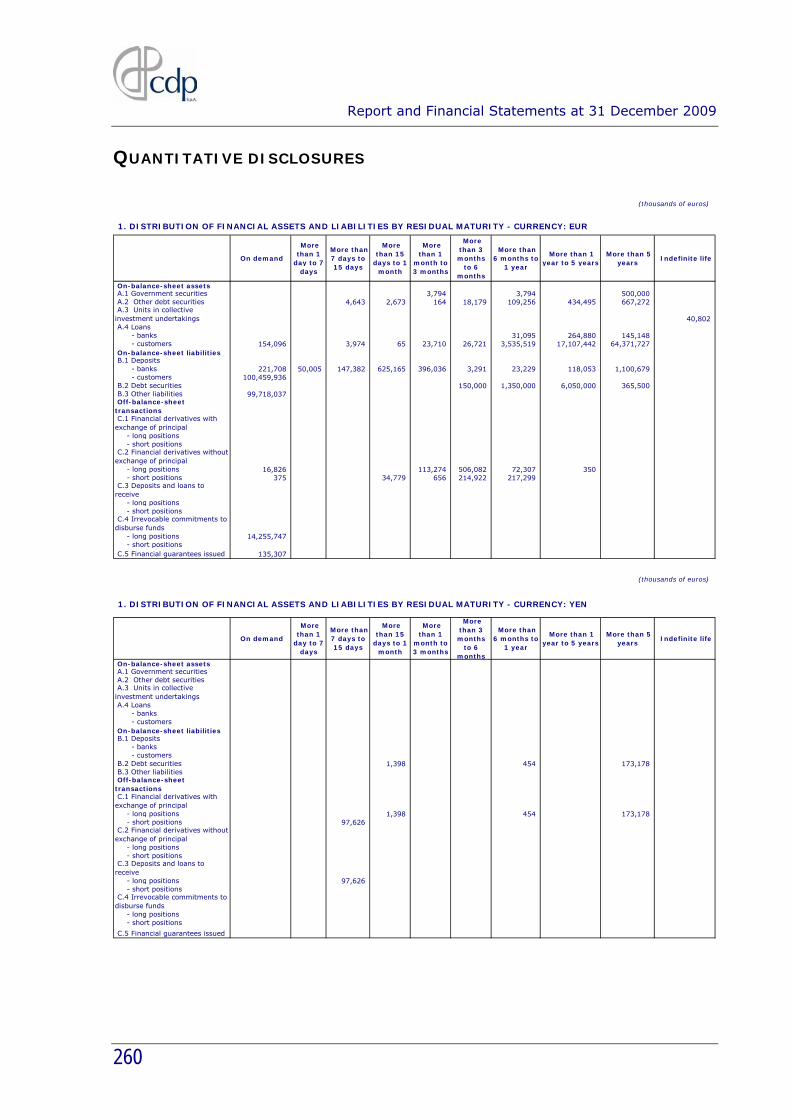
Report and Financial Statements at 31 December 2009
260
QUANTITATIVE DISCLOSURES
(thousands of euros)
On demand
More than 1
day to 7 days
More than 7 days to 15 days
More than 15
days to 1 month
More than 1
month to 3 months
More than 3 months
to 6 months
More than 6 months to
1 year
More than 1 year to 5 years
More than 5 years
Indefinite life
On-balance-sheet assets A.1 Government securities 3,794 3,794 500,000 A.2 Other debt securities 4,643 2,673 164 18,179 109,256 434,495 667,272 A.3 Units in collective investment undertakings 40,802 A.4 Loans - banks 31,095 264,880 145,148 - customers 154,096 3,974 65 23,710 26,721 3,535,519 17,107,442 64,371,727 On-balance-sheet liabilities B.1 Deposits - banks 221,708 50,005 147,382 625,165 396,036 3,291 23,229 118,053 1,100,679 - customers 100,459,936 B.2 Debt securities 150,000 1,350,000 6,050,000 365,500 B.3 Other liabilities 99,718,037 Off-balance-sheet transactions C.1 Financial derivatives with exchange of principal - long positions - short positions C.2 Financial derivatives without exchange of principal - long positions 16,826 113,274 506,082 72,307 350 - short positions 375 34,779 656 214,922 217,299 C.3 Deposits and loans to receive - long positions - short positions C.4 Irrevocable commitments to disburse funds - long positions 14,255,747 - short positions C.5 Financial guarantees issued 135,307
1. DISTRIBUTION OF FINANCIAL ASSETS AND LIABILITIES BY RESIDUAL MATURITY - CURRENCY: EUR
(thousands of euros)
On demand
More than 1
day to 7 days
More than 7 days to 15 days
More than 15
days to 1 month
More than 1
month to 3 months
More than 3 months
to 6 months
More than 6 months to
1 year
More than 1 year to 5 years
More than 5 years
Indefinite life
On-balance-sheet assets A.1 Government securities A.2 Other debt securities A.3 Units in collective investment undertakings A.4 Loans - banks - customers On-balance-sheet liabilities B.1 Deposits - banks - customers B.2 Debt securities 1,398 454 173,178 B.3 Other liabilities Off-balance-sheet transactions C.1 Financial derivatives with exchange of principal - long positions 1,398 454 173,178 - short positions 97,626 C.2 Financial derivatives without exchange of principal - long positions - short positions C.3 Deposits and loans to receive - long positions 97,626 - short positions C.4 Irrevocable commitments to disburse funds - long positions - short positions
C.5 Financial guarantees issued
1. DISTRIBUTION OF FINANCIAL ASSETS AND LIABILITIES BY RESIDUAL MATURITY - CURRENCY: YEN

Report and Financial Statements at 31 December 2009
261
(thousands of euros)
On demand
More than 1
day to 7 days
More than 7 days to 15 days
More than 15
days to 1 month
More than 1
month to 3 months
More than 3 months
to 6 months
More than 6 months to
1 year
More than 1 year to 5 years
More than 5 years
Indefinite life
On-balance-sheet assets A.1 Government securities A.2 Other debt securities A.3 Units in collective investment undertakings A.4 Loans - banks - customers On-balance-sheet liabilities B.1 Deposits - banks - customers B.2 Debt securities 558 261,745 B.3 Other liabilities Off-balance-sheet transactions C.1 Financial derivatives with exchange of principal - long positions 558 261,746 - short positions C.2 Financial derivatives without exchange of principal - long positions - short positions C.3 Deposits and loans to receive - long positions - short positions C.4 Irrevocabile commitments to disburse funds - long positions - short positions C.5 Financial guarantees issued
1. DISTRIBUTION OF FINANCIAL ASSETS AND LIABILITIES BY RESIDUAL MATURITY - CURRENCY: USD

Report and Financial Statements at 31 December 2009
262
SECTION 4 – OPERATIONAL RISKS
QUALITATIVE DISCLOSURES
A. General aspects, management and measurement of operational risks
CDP has taken measures to mitigate operational risks in specific areas of its business, although it has not implemented systems for tracking events that could generate operating losses. In both its derivatives transactions and traditional funding and lending business CDP is exposed to model risk, i.e. the possibility that the model used to quantify the market risks associated with the execution of transactions is inappropriate. This risk has a number of sources: • input data (market, identification information, position), which could be
inaccurate; • estimation of the parameters underlying historical data; • model choice; • implementation in source code. CDP has adopted a number of solutions to reduce the impact of model risk: • periodic integrity checks with the departments/divisions providing the data; • redundant providers and control algorithms for market data; • use of alternative models; • extensive testing of new models; • detailed documentation of processes, models and codes. In 2007 and 2008, CDP reviewed internal procedures as part of the “Manager responsible for preparing corporate financial reports” project. The most significant sources of risk, mitigation and control measures and related documentation were all identified. In the final part of 2009 an operational risk assessment and mitigation project was launched, which will also draw on the information already collected as part of internal audit activities and the financial reporting manager project.

Report and Financial Statements at 31 December 2009
263
As regards the potential losses that could be caused by the interruption of operations or the unavailability of systems, CDP is planning a project to develop an emergency plan to limit losses in situations of serious interruptions.
Report and Financial Statements at 31 December 2009
264
PART F – CAPITAL
SECTION 1 – CAPITAL
QUALITATIVE DISCLOSURES
Pending the issuance of specific measures in this area by the Bank of Italy, CDP is subject to “informational” supervision only. Accordingly, in 2009, in agreement with the Bank of Italy, CDP did not calculate supervisory capital or the related supervisory capital requirements.

Report and Financial Statements at 31 December 2009
265
PART H – TRANSACTIONS WITH RELATED PARTIES
1. Information on the compensation of key management personnel
(thousands of euros)
REMUNERATION OF DIRECTORS AND STATUTORY AUDITORS
31/12/2009
a) directors 1,100
b) statutory auditors 107
Total 1,207
(thousands of euros)
REMUNERATION OF KEY MANAGEMENT
31/12/2009
(a) short-term benefits 4,932
(b) post-employment benefits 69
(c) other long-term benefits -
(d) severance benefits 199
(e) share-based payments -
Total 5,200

Report and Financial Statements at 31 December 2009
266
(thousands of euros)
REMUNERATION PAID TO DIRECTORS AND STATUTORY AUDITORS
Position Period in officeEnd of
term (*)Compensation and bonuses
DirectorsFranco Bassanini Chairman 01/01/09-31/12/09 2009 228
Massimo Varazzani Chief Executive Officer 01/01/09-31/12/09 2009 533
Vittorio Grilli Director 01/01/09-31/12/09 2009 (**)
Nunzio Guglielmino Director 01/01/09-31/12/09 2009 35
Luisa Torchia Director 01/01/09-31/12/09 2009 35
Fiorenzo Tasso Director 01/01/09-31/12/09 2009 35
Francesco Giovannucci Director 01/01/09-31/12/09 2009 35
Gianfranco Imperatori Director 01/01/09-23/04/09 11
Ettore Gotti Tedeschi Director 29/04/09-31/12/09 2009 24
Gianfranco Viesti Director 01/01/09-31/12/09 2009 35
Supplementary members for administration of Separate Account (Article 5.8, Decree Law 269/03)Edoardo Grisolia Director (1) 01/01/09-31/12/09 2009 (**)
Maria Cannata Director (2) 01/01/09-31/12/09 2009 (**)
Isaia Sales Director 01/01/09-31/12/09 2009 35
Francesco Scalia Director 01/01/09-31/12/09 2009 35
Giuseppe Pericu Director 01/01/09-31/12/09 2009 35
Board of AuditorsAlberto Sabatini Chairman 01/01/09-31/12/09 2009 27
Mario Basili Auditor 01/01/09-31/12/09 2009 (**)
Fabio Alberto Roversi Monaco Auditor 01/01/09-31/12/09 2009 20
Antonio Angelo Arru Auditor 01/01/09-31/12/09 2009 20
Biagio Mazzotta Auditor 01/01/09-31/12/09 2009 (**)
(*) Date of Shareholders’ Meeting called to approve financial statements for the year.
(**) The remuneration is paid to the Ministry for the Economy and Finance
(1) Delegate of State Accountant General
(2) Delegate of Director General of the Treasury
Name
2. Information on transactions with related parties
Certain transactions between CDP and related parties, notably those with the Ministry for the Economy and Finance and Poste Italiane S.p.A., arise as a result of legislative provisions. In any event, CDP did not carry out any atypical or unusual transactions with related parties whose size could have an impact on the assets and liabilities or performance of the company. All transactions with related parties were carried out on an arm’s length basis and form part of CDP’s ordinary operations. At the end of 2009 CDP had the following transactions with the parent, subsidiaries and associates.

Report and Financial Statements at 31 December 2009
267
Transactions with the Ministry for the Economy and Finance The main transactions conducted with the Ministry for the Economy and Finance regarded the liquidity held on the treasury account and lending transactions. Specifically, CDP’s liquidity is deposited on the interest-bearing account no. 29814 at the State Treasury and earns interest, as envisaged by Article 6.1 of the decree of the Minister for the Economy and Finance of 5 December 2003, at a floating 6-month rate equal to the simple arithmetic mean between the gross yield on 6-month Treasury bills and the monthly level of the Rendistato index. As regards receivables in respect of loans, it should be noted that more than 40% of CDP’s portfolio is repaid by the state. CDP also manages loans and postal savings products owned by the MEF, for which it receives a fee established in a specific contract. Outstanding transactions and the related financial effects at year-end were as follows:
(thousands of euros)
Transactions with Ministry for the Economy and Finance 31/12/2009
Cash and cash equivalents 114,688,733
Financial assets held to maturity 205,285
Loans to customers 33,723,232
Other assets 7,545
Due to customers 3,978,787
Other liabilities 55
Interest income and similar revenues 5,046,313
Commission income 3,031
Interest expense and similar charges (116,394)

Report and Financial Statements at 31 December 2009
268
Transactions with subsidiaries Transactions with Terna S.p.A. In 2009, Terna S.p.A. subscribed EMTN bonds issued by CDP in the nominal amount of €700 million, which were repaid in full during the year. Also during the year, CDP granted financing of up to €500 million to Terna S.p.A., which had not been disbursed as of 31 December 2009. Outstanding transactions and the related financial effects at year-end were as follows:
(thousands of euros)
Transactions with Terna S.p.A. 31/12/2009
Other assets 1,153
Commission income 1,653
Interest expense (3,075)
Commitments in respect of loans to disburse 500,000 Transactions with CDPI SGR S.p.A. The only transactions with the subsidiary CDPI SGR S.p.A. regarded administrative and accounting services provided by CDP and CDP personnel seconded to CDPI. Outstanding transactions and the related financial effects at year-end were as follows:
(thousands of euros)
Transactions with CDPI SGR S.p.A. 31/12/2009
Other assets 29
Administrative expenses (reimbursement expenses - seconded personnel) 9
Other operating income 20 Transactions with associates Transactions with associates are entirely accounted for by relations with Poste Italiane S.p.A., including both the placement and management service for postal savings products and loans granted by CDP. The service provided by Poste Italiane is remunerated with an annual commission set in a specific agreement between the parties.

Report and Financial Statements at 31 December 2009
269
Outstanding transactions and the related financial effects at year-end were as follows:
(thousands of euros)
Transactions with Poste Italiane S.p.A. 31/12/2009
Loans to customers 766,537
Other liabilities 918,044
Interest income and similar revenues 32,712
Commission expense (1,600,000)
of which: subject to amortisation (682,763)

Report and Financial Statements at 31 December 2009
270
PART L – OPERATING SEGMENTS This section of the notes to the financial statements has been drafted in compliance with IFRS 8 - Operating Segments, in force since 1 January 2009 in replacement of IAS 14 - Segment Information. CDP is organised into five business units through which the company pursues its activities. More specifically:
• direct lending to public entities (“Public Entities” business unit); • financing for projects sponsored by public entities ("Project Finance"
business unit); • financing for works, plant, networks and other infrastructure used to
deliver public services or for reclamation projects (“Enterprises” business unit);
• management of facilitated credit and economic support mechanisms (“Facilitated Credit and Economic Support” business unit);
• real estate investment and services (“Real Estate” business unit). The above business units are supported by other units that perform service, support, guidance and control functions. They are grouped within the Corporate Centre. Public Entities The Public Entities unit is responsible for lending the public entities and public-law bodies using standardised products, offered in compliance with the principles of accessibility, uniformity in treatment, pre-specification of terms and non-discrimination, in implementation of the statutory mission of the CDP’s Separate Account. Project Finance Established in 2009, the Project Finance unit seeks to intervene directly in a select number of general public interest projects that can be initiated rapidly (financing of projects sponsored by public entities), acting with a long-term vision and verifying financial sustainability.

Report and Financial Statements at 31 December 2009
271
Enterprises The operations of the Enterprises business unit regard the financing, on a project or corporate finance basis, of investments in works, plant, infrastructure and networks to be used to deliver public services or in reclamation projects (water sector - integrated water services, gas transport and distribution networks, local and national transportation networks, production, transport and distribution of energy). Facilitated Credit and Economic Support The Facilitated Credit and Economic Support business unit is responsible for managing facilitated credit mechanisms that draw primarily on CDP resources (the Revolving Fund to support enterprises and investment in research) and, on a residual basis, State funds (Territorial Agreements and Area Contracts, Low Environmental Impact Vehicles Fund). In 2009 these were joined by general economic support programmes, with the start up of activities dedicated to lending to SMEs and the reconstruction of the areas of Abruzzo affected by the earthquake. Real Estate Investment and Services This unit helps local authorities leverage their real estate holdings. CDP acts as a direct investor in funds for the development of social housing initiatives and as a provider of real estate advisory services. Results by operating segment are presented on the basis of the above organisational structure. In line with the report on operations, the income statement presents reclassified data and is in line with the internal reporting system used by management in its decision-making process. This presentation makes it possible to determine the contribution of each business unit to the overall performance of CDP. Note that in 2009 the contribution of the Real Estate and Project Finance units (launched in the closing months of 2009) was marginal.

Report and Financial Statements at 31 December 2009
272
Construction of the balance sheet by business unit The balance sheet aggregates were constructed on the basis of the items directly attributable to the individual business units, with which the related revenues and expenses are correlated. More specifically, the aggregates for “loans to customers and banks” (for amounts disbursed or being repaid) and “cash and cash equivalents and interbank deposits” represent the stock of assets related to the specific operating activities of each business unit. The other aggregates of interest-bearing assets or liabilities pertain exclusively to the Corporate Centre. That aggregate includes a structure for the management of equity investments and investment funds held by CDP and a unit dedicated to funding and treasury operations. Construction of the income statement by business unit The operating result of the business units was constructed on the basis of the following criteria. As regards net interest income, the contribution of each business unit is calculated on the basis of internal transfer rates (“ITRs”) differentiated by product and maturity. In determining the ITRs, it is assumed that each lending transaction is funded using a hypothetical market transaction with the same financial characteristics but the opposite sign. This system is based on the CDP's organisational model, which has a specific structure devoted to treasury management (the treasury pool) within the Corporate Centre. For the other aggregates of the income statement, each business unit is allocated any directly attributable revenues and expenses. In addition, a share of indirect costs, initially recognised under the Corporate Centre, is allocated to each business unit on the basis of their actual use of resources or services. The Corporate Centre is allocated the revenues and expenses directly attributable to the units that make up the aggregate, as well as the costs for utilities, taxes and general services that were not allocated to any specific unit. In view of the significant development of the operations of CDP and individual lines of business planned for 2010, the rationale underlying the accounting procedures outlined here will be reviewed.

Report and Financial Statements at 31 December 2009
273
For more information on developments in the operations of the individual business units, please see the report on operations. Reclassified balance sheet
(thousands of euros)
Public Entities
Facilitated Credit and Economic
Support Enterprises
Corporate Centre
Total CDP
Cash and cash equivalents - 42,204 - 118,337,658 118,379,862
Loans to customers and banks 79,533,250 1,056,596 3,289,795 1,298,540 85,178,181
Debt securities - - - 691,520 691,520
Equity investments and shares - - - 18,270,598 18,270,598
Funding - - - 210,632,843 210,632,843
- of which: postal funding - - - 190,784,915 190,784,915
- of which: funding from banks - - - 2,451,858 2,451,858
- of which: funding from customers - - - 9,190,578 9,190,578
- of which: funding with bonds - - - 8,205,493 8,205,493
Reclassified income statement
(thousands of euros)
Public Entities
Facilitated Credit and Economic
Support Enterprises
Corporate Centre
Total CDP
Interest income 392,968 3,429 18,524 1,579,216 1,994,137
Dividends - - - 971,150 971,150
Net commissions 3,152 160 4,882 (917,513) (909,319)
Other net revenues - - - 106,127 106,127
Gross income 396,120 3,590 23,406 1,738,979 2,162,095
Net writedowns (1,109) (109) - - (1,218)
Overheads (9,509) (2,182) (2,024) (66,130) (79,845)
Operating income 385,917 1,299 21,771 1,682,093 2,091,079

Report and Financial Statements at 31 December 2009
274

Report and Financial Statements at 31 December 2009
275
ANNEXES
ANNEX 1
LIST OF EQUITY INVESTMENTS
ANNEX 2
ACCOUNTING SEPARATION STATEMENTS

Report and Financial Statements at 31 December 2009
276
Annex 1
(thousands of euros)
LIST OF EQUITY INVESTMENTSRegistered
office% holding Book value
A. Listed companies1. Eni S.p.A. Rome 9.99% 7,125,132 2. Enel S.p.A. Rome 17.36% 6,608,047 3. Terna S.p.A. Rome 29.99% 1,315,200
B. Unlisted companies1. Poste Italiane S.p.A. Rome 35.00% 2,518,744 2. STMicroelectronics Holding N.V. Amsterdam 50.00% 625,990 3. Galaxy S.àr.l. SICAR Luxembourg 40.00% 25,569 4. SINLOC S.p.A. Turin 11.85% 5,507 5. F2i SGR S.p.A. Milan 14.29% 2,143 6. Europrogetti & Finanza S.p.A. in liquidation Rome 31.80% - 7. Istituto per il Credito Sportivo Rome 21.62% 2,066 8. Tunnel di Genova S.p.A. Genoa 33.33% - 9. CDP Investimenti SGR S.p.A. Rome 70.00% 1,400 10. 2020 European Fund for Energy, Climate Change and Infrastructure SICAV-FIS Sa (Marguerite Fund)
Luxembourg 16.67% 500
Name

Report and Financial Statements at 31 December 2009
277
Annex 2 SEPARATION OF ACCOUNTS CDP is subject to a system of organisational and accounting separation under Article 5.8 of Decree Law 269 of 30 September 2003, ratified with amendments by Law 326 of 24 November 2003. In order to create an accounting separation system, the organisational structure of the company was therefore divided into three operating units called, respectively, Separate Account, Ordinary Account and Joint Services, within which CDP’s existing organisational units have been re-grouped. Separate Account The role of the Separate Account is to pursue the mission of general economic interest entrusted to CDP by law. The articles of association of CDP, in accordance with law, allocate the following activities to the Separate Account:
financing in any form, including the acquisition of trade receivables, for the state, regional governments, local authorities, public bodies and public-law entities using repayable funds raised from postal savings bonds and passbook savings accounts that benefit from state guarantees and are distributed through Poste Italiane S.p.A. or its subsidiaries, and funds raised from the issue of securities, borrowing and other financial operations with state guarantees. As part of this activity, the company may also carry out transactions in financial derivatives on own account in compliance with applicable law;
financing in any form, including the acquisition of trade receivables, the issue of guarantees, the acquisition of equity capital or debt capital, the subscription of investment fund units. Each of the above financial transactions shall be entered into with the entities referred to in the previous point or used for public interest operations promoted by the latter, in accordance with the criteria established in the decree of the Minister for the Economy and Finance adopted pursuant to Article 5.11, e) of the Decree Law or directed at the public-interest initiatives provided for in Article 8 of Decree Law 78 of 1 July 2009, ratified with amendments by Law 102 of 3 August 2009, as amended, to support the international expansion of enterprises when such initiatives are secured by guarantees or insurance from SACE S.p.A., or carried out in favour of small and medium-sized enterprises for the purpose of

Report and Financial Statements at 31 December 2009
278
supporting the economy. The financial transactions shall be carried out using the funds referred to in the previous point and may be conducted either directly or through the banking system, with the exception of operations in favour of small and medium-sized enterprises, which may only be conducted through the banking system or the subscription of investment funds managed by an asset management company as referred to in Article 33 of Legislative Decree 58 of 24 February 1998, as amended, whose corporate purpose achieves one of the institutional missions of Cassa Depositi e Prestiti S.p.A. Direct financial transactions must involve an amount equal to or greater than €25,000,000.00 (twentyfivemillion/00). Financial transactions carried out for operations promoted by the entities referred to in the previous point or directed at the public-interest initiatives provided for in Article 8 of Decree Law 78 of 1 July 2009, ratified with amendments by Law 102 of 3 August 2009, as amended, to support the international expansion of enterprises when such initiatives are secured by guarantees or insurance from SACE S.p.A., may be carried out in favour of public or private entities, with the exclusion of natural persons, having legal personality. The management of such activities is carried out pursuant to Article 6. As part of this activity, the company may also carry out transactions in financial derivatives on own account in compliance with applicable law;
the acquisition of equity investments transferred or contributed to CDP by one or more decrees of the Minister for the Economy and Finance pursuant to Article 5.3, b) of Decree Law 269, the management of which complies with the criteria provided for in the decree of the Minister for the Economy and Finance referred to in Article 5.11, d) of Decree Law 269, as well as any increase in the equity investments transferred during the transformation of CDP into a joint-stock company;
the management, where assigned by the Minister for the Economy and Finance, of the functions, assets and liabilities of CDP, prior to its transformation, transferred to the MEF pursuant to Article 5.3, a) of Decree Law 269, as well as the management of any other public function and activities of general interest assigned by act of law, administrative regulations or contract;
the provision of assistance and consulting to the parties listed in the first point or to support the operations or the parties listed in the first or second points.

Report and Financial Statements at 31 December 2009
279
As regards the organisational structure of CDP, the Separate Account includes the following units: Public Entities, Local Authorities Project, Facilitated Credit and Economic Support, Project Finance, Real Estate, the Parliamentary Supervisory Committee and the postal savings activities of the Finance unit. Ordinary Account All CDP’s other business activities that are not specifically attributed to the Separate Account are carried out by the Ordinary Account. While not specifically cited in Article 5 of Decree Law 269, the latter represents the range of activities carried out by CDP that are not assigned under statute to the Separate Account. Specifically, pursuant to Article 5.7, b) of Decree Law 269, CDP’s articles of association include among the activities designed to achieve its mission that are not assigned to the Separate Account:
• financing in any form, including the acquisition of trade receivables, of works, plant, networks, and other infrastructures intended for the delivery of public services and for reclamation projects using funds raised through the issue of securities, borrowing and other financial operations, without state guarantees and excluding demand funding and with funding exclusively from institutional investors. For this purpose, CDP may issue securities of any kind and may obtain financing from shareholders or third parties. CDP also obtains funding using grants provided in any form by the state, public or private entities or international bodies and any other of its own resources and financial revenues compatible with its mission. As part of this activity, the company may also carry out transactions in financial derivatives on own account in compliance with applicable law;
providing consulting services and conducting studies, research and analysis of economic and financial matters.
From an organisational standpoint, the activities of the Enterprises business unit are included in the Ordinary Account Joint Services Joint Services include the service units and units with support, guidance and control functions, the corporate bodies and bodies provided for in the articles of association (except for the Parliamentary Supervisory Committee, which regards the Separate Account), the offices of the Chairman, the Chief Executive Officer and the Director General, where the latter position is filled. With regard to the Equity Investments unit and the Finance unit, for the purposes of accounting separation, their costs and revenues are broken down into Separate Account, Ordinary Account and Joint Services depending on the specific activity to which they refer (with the exception of the postal savings activities performed within

Report and Financial Statements at 31 December 2009
280
the Finance unit, which belong exclusively to the Separate Account, as noted above). For more information on CDP’s system of accounting separation, please refer to the report on operations. Reclassified balance sheet
(thousands of euros)
Separate Account
Ordinary Account
Joint ServicesTotalCDP
Cash and cash equivalents 117,964,477 415,573 (188) 118,379,862
Loans to customers and banks 81,878,069 3,300,112 - 85,178,181
Debt securities 691,520 - - 691,520
Equity investments and shares 18,201,185 69,413 - 18,270,598
Funding 206,816,168 3,816,675 - 210,632,843
- of which: postal funding 190,784,915 - - 190,784,915
- of which: funding from banks 796,554 1,655,303 - 2,451,858
- of which: funding from customers 9,190,578 - - 9,190,578
- of which: funding from bonds 6,044,121 2,161,372 - 8,205,493
Reclassified income statement
(thousands of euros)
Separate Account
Ordinary Account
Joint ServicesTotalCDP
Net interest income 1,987,226 6,912 (1) 1,994,137
Dividends 971,150 - - 971,150
Net commissions (913,899) 4,705 (125) (909,319)
Other net revenues 102,833 3,293 - 106,127
Gross income 2,147,310 14,911 (126) 2,162,095
Net writedowns (1,218) - - (1,218)
Overheads (16,374) (3,071) (60,400) (79,845)
Operating income 2,130,258 12,229 (51,407) 2,091,079