report 197: zircon fingerprinting of magmatic–hydrothermal ... · report 197 zircon...
TRANSCRIPT

Government of Western AustraliaDepartment of Mines, Industry Regulationand Safety
ZIRCON FINGERPRINTING OF MAGMATIC–HYDROTHERMAL SYSTEMS
IN THE ARCHEAN YILGARN CRATON
by Y Lu, RH Smithies, MTD Wingate, NJ Evans, TC McCuaig, DC Champion and M Outhwaite
REPORT 197
Geological Survey of Western Australia

REPORT 197
ZIRCON FINGERPRINTING OF MAGMATIC–HYDROTHERMAL SYSTEMS IN THE ARCHEAN YILGARN CRATON
byY Lu, RH Smithies, MTD Wingate, NJ Evans1, TC McCuaig2, DC Champion3 and M Outhwaite4
PERTH 2019
Government of Western AustraliaDepartment of Mines, Industry Regulation and Safety
1 School of Earth and Planetary Sciences / John de Laeter Centre, Curtin University, Kent Street, Bentley WA 61052 BHP, 125 St Georges Terrace, Perth WA 60003 Geoscience Australia, GPO Box 378, Canberra ACT 26014 Model Earth Pty Ltd, Unit 2, 80 Colin Street, West Perth WA 6005

MINISTER FOR MINES AND PETROLEUMHon Bill Johnston MLA
DIRECTOR GENERAL, DEPARTMENT OF MINES, INDUSTRY REGULATION AND SAFETYDavid Smith
EXECUTIVE DIRECTOR, GEOLOGICAL SURVEY AND RESOURCE STRATEGYJeff Haworth
REFERENCEThe recommended reference for this publication is:Lu, Y, Smithies, RH, Wingate, MTD, Evans, NJ, McCuaig, TC, Champion, DC and Outhwaite, M 2019, Zircon fingerprinting of
magmatic–hydrothermal systems in the Archean Yilgarn Craton: Geological Survey of Western Australia, Report 197, 22p.
ISBN 978-1-74168-864-1ISSN 1834-2280
A catalogue record for this book is available from the National Library of Australia
Grid references in this publication refer to the Geocentric Datum of Australia 1994 (GDA94). Locations mentioned in the text are referenced using Map Grid Australia (MGA) coordinates, Zone 50. All locations are quoted to at least the nearest 100 m.
About this publication Zircon U–Pb and trace element compositions were measured using LA-ICP-MS instruments at the GeoHistory Facility, John de Laeter Centre, Curtin University, funded via an Australian Geophysical Observing System grant provided to AuScope Pty Ltd by the AQ44 Australian Education Investment Fund program. Analyses were funded by the Western Australian Government’s Exploration Incentive Scheme (EIS). We thank Neal McNaughton for providing zircon samples from the Boddington gold mine, Brad McDonald for technical assistance with LA-ICP-MS analysis, and Paul Morris for assistance with compilation of Yilgarn Craton granitic rocks geochemistry.
Disclaimer This product was produced using information from various sources. The Department of Mines, Industry Regulation and Safety (DMIRS) and the State cannot guarantee the accuracy, currency or completeness of the information. Neither the department nor the State of Western Australia nor any employee or agent of the department shall be responsible or liable for any loss, damage or injury arising from the use of or reliance on any information, data or advice (including incomplete, out of date, incorrect, inaccurate or misleading information, data or advice) expressed or implied in, or coming from, this publication or incorporated into it by reference, by any person whosoever.
Published 2019 by the Geological Survey of Western AustraliaThis Report is published in digital format (PDF) and is available online at <www.dmp.wa.gov.au/GSWApublications>.
© State of Western Australia (Department of Mines, Industry Regulation and Safety) 2019
With the exception of the Western Australian Coat of Arms and other logos, and where otherwise noted, these data are provided under a Creative Commons Attribution 4.0 International Licence. (http://creativecommons.org/licenses/by/4.0/legalcode)
Further details of geoscience publications are available from:Information CentreDepartment of Mines, Industry Regulation and Safety100 Plain StreetEAST PERTH WESTERN AUSTRALIA 6004Telephone: +61 8 9222 3459 Facsimile: +61 8 9222 3444www.dmp.wa.gov.au/GSWApublications
Cover photograph: Separated zircon crystals viewed with crossed polarizers

iii
Contents
Abstract ..................................................................................................................................................................1Introduction ............................................................................................................................................................1Archean barren and fertile granitic rocks in the Yilgarn Craton ............................................................................1Methods ..................................................................................................................................................................3
Sample preparation .........................................................................................................................................3Zircon chemistry .............................................................................................................................................3Geochronology ................................................................................................................................................4
Results ....................................................................................................................................................................5Rayleigh fractionation model .................................................................................................................................5
Calculation of model partition coefficients .....................................................................................................5Rayleigh fractionation of single mineral model ..............................................................................................5Rayleigh fractionation of amphibole:apatite and plagioclase:apatite model ..................................................5
Eu/Eu* in zircon: a discriminant between barren and fertile Archean granitic rocks ............................................5Implications for exploration ...................................................................................................................................9Implications for Archean geodynamics ..................................................................................................................9Conclusions ............................................................................................................................................................9References ............................................................................................................................................................21
Figures1. Granitic whole-rock and zircon sample locations superimposed on a gravity image of
the Yilgarn Craton ........................................................................................................................................22. Whole-rock compositions of Archean granitic rocks in the Yilgarn Craton ...............................................33. Zircon Eu/Eu* vs Yb/Gd ratios for Yilgarn Craton granitic rocks, and global Phanerozoic
fertile and infertile igneous rocks ................................................................................................................44. Zircon Eu/Eu* vs Yb/Gd ratios of mineralized samples from Calingiri Cu–Mo granitic rocks and
regional barren Yilgarn Craton granitic rocks .............................................................................................65. Zircon Eu/Eu* vs Th/U ratios, with decreasing Th/U indicating increasing differentiation .......................66. Zircon Ce/Ce* ratios of Archean granitic rocks in the Yilgarn Craton .......................................................7 7. Partition coefficients of REE between mineral and melt ............................................................................7
Tables1. Summary statistics of primary igneous zircon geochemistry from Archean granitic rocks of
the Yilgarn Craton .....................................................................................................................................102. Partition coefficient (Kd) values used in the Rayleigh fractionation model .............................................113. Results of the amphibole crystallization model ........................................................................................124. Results of the apatite crystallization model ...............................................................................................135. Results of the titanite crystallization model ..............................................................................................146. Results of the plagioclase crystallization model .......................................................................................157. Results of the zircon crystallization model ...............................................................................................168. Results of the garnet crystallization model ...............................................................................................179. Results of the amphibole:apatite (99.8 : 0.2) crystallization model ..........................................................1810. Results of the plagioclase:apatite (98.7 : 1.3) crystallization model using a hypothetical melt as
starting composition ...................................................................................................................................1911. Results of the plagioclase:apatite (98.7 : 1.3) crystallization model using BODD-2 as
starting composition ...................................................................................................................................20

iv

1
Zircon fingerprinting of magmatic–hydrothermal systems in the Archean Yilgarn Craton
by
Y Lu, RH Smithies, MTD Wingate, NJ Evans1, TC McCuaig2, DC Champion3 and M Outhwaite4
AbstractPorphyry Cu±Au±Mo deposits throughout the world are mostly Phanerozoic in age and are genetically associated with high-Sr/Y (≥40) granitic rocks. Although these high-Sr/Y granitic rocks dominate Archean terranes, Archean porphyry deposits are extremely rare. The reasons for this have not yet been resolved. Here we compare the zircon trace element content of barren granitic rocks to that of fertile granitic rocks (defined as paragenetically associated with mineralization) from the Calingiri Cu–Mo and Boddington Au–Cu–Mo deposits in the Archean Yilgarn Craton. We compare zircon compositions for Archean granitic rocks with their global Phanerozoic counterparts. Zircons from Archean and Phanerozoic fertile granitic rocks have distinctly high Eu anomaly values (Eu/Eu*>0.4), mainly due to zircons in fertile systems crystallizing from hydrous melts. In addition, Eu/Eu* can be combined with Yb/Gd and Th/U ratios to track the crystallization of different minerals prior to, or concurrent with, zircon crystallization — a process that is not resolvable using whole-rock geochemical data. We propose that the zircon Eu anomaly and trace element ratios can be used to distinguish fertile from barren granitic rocks in Archean and Phanerozoic terranes, providing an effective geochemical exploration tool to assess the fertility of granitic rocks over geological time.
KEYWORDS: Archean, magma fertility, porphyry Cu deposit, Yilgarn Craton, zircon
1 School of Earth and Planetary Sciences / John de Laeter Centre, Curtin University, Kent Street, Bentley WA 6105
2 BHP, 125 St Georges Terrace, Perth WA 6000
3 Geoscience Australia, GPO Box 378, Canberra ACT 2601
4 Model Earth Pty Ltd, Unit 2, 80 Colin Street, West Perth WA 6005
IntroductionPorphyry Cu±Mo±Au deposits associated with high-Sr/Y (≥40) granitic rocks supply nearly 75% of the world’s Cu, about 50% of its Mo, and about 25% of its Au (Sillitoe, 2010). They range in age from Archean to recent, although most are Jurassic or younger (e.g. Cooke et al., 2005; Sinclair, 2007). High-Sr/Y granitic rocks dominate the exposed Archean crust worldwide (Moyen and Martin, 2012), yet Archean porphyry deposits are rare, and the reasons for this remain unclear. Nevertheless, the largest known Au deposits in Australia and Canada, the Boddington and Malartic deposits, respectively, are Neoarchean aged and genetically associated with granitic intrusions. The Boddington deposit in the South West Terrane of the Yilgarn Craton contains more than 720 t of Au and significant quantities of Cu and Mo (McCuaig et al., 2001), whereas the Malartic deposit in the Abitibi greenstone belt of the Superior Craton contains 520 t of Au (Helt et al., 2014). Other Archean porphyry-like deposits include the Calingiri Cu–Mo and Granny Smith Au deposits in the Yilgarn Craton (Mueller et al., 2008; Outhwaite, 2018; Witt et al., 2018), the Hemlo and Lac Bachelor Au deposits in the Superior Craton (Lin and
Beakhouse, 2013; Fayol and Jebrak, 2017), Malanjkhand Cu–Mo–Au deposit in the Indian Craton (Stein et al., 2004), and the 3.3 Ga Spinifex Ridge Mo–Cu deposit in the Pilbara Craton, which is the oldest known porphyry deposit in the world (Barley, 1982; Stein et al., 2007).
Archean magmatic–hydrothermal metal deposits are extremely challenging to discover due to widespread weathering, burial by transported cover, deformation and metamorphism in ancient terranes, thus their potential occurrence in Archean cratons may not have been fully recognized. Chemical fingerprinting and/or fertility assessment of granitic intrusions from terrane to deposit scale will help predict potential exploration targets (e.g. Hronsky et al., 2012; Loucks, 2014; McCuaig and Hronsky, 2014; Dilles et al., 2015; Lu et al., 2016; Williamson et al., 2016; Loader et al., 2017). Here we present the first craton-wide study to systematically examine zircons from granitic rocks in the Yilgarn Craton as potential metallogenic fertility indicators of Archean magmatic–hydrothermal systems.
Archean barren and fertile granitic rocks in the
Yilgarn CratonTo identify chemical signatures diagnostic of metallogenic fertility in Archean granitic rocks, we have undertaken a systematic study of zircon crystals from both mineralized (fertile; defined as paragenetically associated with

2
Lu et al.
mineralization) and unmineralized (barren) granitic rocks in the Yilgarn Craton of Western Australia (Fig. 1). We compiled geochronology and whole-rock geochemistry data for 251 granitic rocks (246 barren and 5 fertile) across the Yilgarn Craton (Fig. 1; Supplementary Table 1). The whole-rock geochemistry of these compiled samples has been published in the Geological Survey of Western Australia’s (GSWA) Western Australian Geochemistry database (WACHEM; which can be accessed via GeoChem Extract at <www.dmp.wa.gov.au/launch/geochemistry>). The dataset has been filtered to include only samples with loss on ignition (LOI) values <3.5 wt%, SiO2 >63 wt% and Al2O3 <20 wt% (oxides on an anhydrous basis) to remove samples that are strongly altered or have non-granitic compositions (i.e. mafic to intermediate lithologies and plagioclase cumulates). The barren granitic rocks are divided into four groups (Fig. 2), based on their Sr/Y and K2O/Na2O ratios:
• Potassic high-Sr/Y granitic rocks with K2O/Na2O ≥1 and Sr/Y ≥40
• Potassic low-Sr/Y granitic rocks with K2O/Na2O ≥1 and Sr/Y <40
• Sodic high-Sr/Y granitic rocks with K2O/Na2O <1 and Sr/Y ≥40
• Sodic low-Sr/Y granitic rocks with K2O/Na2O <1 and Sr/Y <40.
Geochemistrysample
Zirconsample
Potassic high-Sr/Y granite
Potassic low-Sr/Y granite
Sodic high-Sr/Y granite (~TTG)
Sodic low-Sr/Y granite
YL29 24/07/19
126°
122°118°114°E
28°
32°S
230 km
INDIAN OCEAN
PERTH
Murchison
Youanmi
South West
Kalg
oo
rlie
Yamarna
Burtville
Kurnalpi
Narryer
SouthernCross
Calingiri
Boddington
Figure 1. Granitic whole-rock and zircon sample locations superimposed on a gravity image of the Yilgarn Craton (modified after Brett, 2019). Terrane boundaries (black lines) and names are after Pawley et al. (2012). Zircon samples include only those yielding primary trace element data
A Sr/Y ratio of 40 is used to distinguish between high- and low-Sr/Y groups because Phanerozoic porphyry Cu deposits are typically associated with granitic rocks that have Sr/Y ≥40 (Chiaradia et al., 2012; Loucks, 2014), and the average Archean tonalite–trondhjemite–granodiorite (TTG) has Sr/Y >40 (Moyen and Martin, 2012). A K2O/Na2O ratio of 1 is used to distinguish between potassic and sodic groups. The studied sodic high-Sr/Y granitic rocks in the Yilgarn Craton all have <1.5 ppm Yb, with an average of 0.52 ppm (Supplementary Table 1), and are broadly equivalent to typical Archean TTG series rocks (e.g. Moyen and Martin, 2012).
The fertile granitic rock group includes two granitic rocks from the Calingiri Cu–Mo deposit (with crystallization ages of c. 3010 Ma), and three diorite to dacite porphyry samples from the Boddington Au–Cu–Mo mine (crystallization ages of c. 2700 Ma; McCuaig et al., 2001). We also include two barren, late granite samples (crystallization ages of c. 2670 Ma) that post-date the mineralization event at Calingiri and one late granite (with a crystallization age of c. 2613 Ma) that post-dates mineralization at Boddington for comparison (Supplementary Table 1).

3
GSWA Report 197 Zircon fingerprinting of magmatic–hydrothermal systems in the Archean Yilgarn Craton
a)
c)
b)
YL26 21/08/19
50
100
150
200
60 70 80
Yilgarn potassic high-Sr/Y granite
Yilgarn sodic high-Sr/Y granite (TTG)
Yilgarn sodic low-Sr/Y granite
Yilgarn potassic low-Sr/Y granite
Boddington 2700 Ma syn-ore diorites and dacite
high Sr/Y
low Sr/Y
0.0
1.0
2.0
60 70 80
potassic
sodic
-1
0
1
0 2 4 6 8 10
use o
ther
cri
teri
a
very strongly oxidized
strongly oxidized
moderately oxidized
moderately reducedstrongly reduced
0
Sr/
Y
SiO (wt%)2 SiO (wt%)2
FeO (wt%)total
KO
/Na
O2
2
Lo
g (
Fe
O/F
eO
)1
02
3
Figure 2. Whole-rock compositions of Archean granitic rocks in the Yilgarn Craton: a) Sr/Y vs SiO2; b) K2O/Na2O vs SiO2. SiO2 on anhydrous basis: c) Log10 (Fe2O3/FeO) vs FeOtotal. Note that for samples with FeOtotal <2 wt%, criteria other than whole-rock Fe2O3 and FeO data should be used to assess oxidation state (Blevin, 2004). Whole-rock geochemistry data is provided in Supplementary Table 1
Methods
Sample preparationZircon samples were selected from rocks that had previously been dated by GSWA using the sensitive high-resolution ion microprobe (SHRIMP; available from <www.dmp.wa.gov.au/geochron>). Zircons were extracted using heavy liquid and magnetic separation techniques. Representative grains were handpicked under a binocular microscope, mounted in epoxy resin disks, then polished to approximately half-grain thickness and coated with Au. The internal structures of zircon crystals were examined using cathodoluminescence (CL) techniques. Details of sample preparation and U–Pb analysis are described in Lu et al. (2019).
Zircon chemistryThe samples were analysed by laser ablation inductively coupled plasma mass spectrometry (LA-ICP-MS) at the John de Laeter Centre, Curtin University, Western
Australia. Individual zircons were ablated using a Resonetics RESOlution M-50A-LR sampling system, incorporating a Compex 102 excimer laser. Samples were ablated for 30 s using a 7-Hz repetition rate, 33 μm beam spot and laser energy of 1.5 J/cm2 (measured at the sample surface). The sample cell was flushed by ultrahigh purity He (680 ml/min) and N2 (2.8 ml/min). Intensities of isotope peaks were measured using an Agilent 7700s quadrupole ICP-MS, with high-purity Ar as the plasma gas. The masses analysed were: 29Si, 31P, 43Ca, 45Sc, 49Ti, 51V, 57Fe, 63Cu, 88Sr, 89Y, 91Zr, 93Nb, 95Mo, 118Sn, 139La, 140Ce, 141Pr, 146Nd, 147Sm, 151Eu, 157Gd, 159Tb, 163Dy, 165Ho, 166Er, 169Tm, 172Yb, 175Lu, 178Hf, 181Ta, 182W, 204Pb, 206Pb, 207Pb, 208Pb, 232Th and 238U. In each scan of the mass spectrum, the dwell time for most elements was 0.01 s, with the exception of 88Sr (0.02 s), 139La (0.04 s), 141Pr (0.04 s), 204Pb, 206Pb, 207Pb, 208Pb (all Pb 0.03 s each), 232Th (0.0125 s) and 238U (0.0125 s). These settings are generally the same as those in Lu et al. (2016), which reported the zircon compositions of global Phanerozoic fertile and infertile igneous rocks (Fig. 3). Therefore, the new results are comparable with those from global Phanerozoic zircons in Lu et al. (2016). Given the inability to correct for the double-charged 90Zr interference on 45Sc, data for Sc were not used.

4
Lu et al.
International glass standard NIST 610 was used as the primary standard to calculate elemental concentrations and to correct for instrument drift. Secondary standards were analysed after every 15 to 20 unknown samples (i.e. 3–4% of total analyses). Analytical accuracy is estimated to be ±10% (except for Fe, which is ±20%) based on multiple analyses of NIST 612 (secondary standard; Jochum et al., 2005), whereas analytical precision (coefficient of variation) was better than ±4% for most elements.
Intersecting small mineral inclusions at depth in an ablation pit is common in LA-ICP-MS analysis of zircons. We used the criteria proposed by Lu et al. (2016) to systematically exclude analyses contaminated by inclusions: La >1 ppm is taken to reflect apatite contamination, which is the most commonly recognized contaminant in zircon; Fe >5000 ppm reflects contamination by Fe oxides; Ti >50 ppm indicates contamination by Ti-(Fe-)-oxides. Ca >500 ppm also suggests inclusion contamination such as feldspar (Burnham and Berry, 2017). We also applied the Light Rare Earth Element Index (LREE-I = [Dy/Nd]+[Dy/Sm]) proposed by Bell et al. (2016), who considered analyses with LREE-I <10 to be clearly altered and those with LREE-I between 10 and 30 to be uncertain, whereas LREE-I >30 indicates primary zircons that have not undergone contamination or hydrothermal alteration. No common-Pb corrections were performed on the U–Pb isotope ratios, and analyses with age discordance >10% were excluded (discordance [%] = 100 × [(207Pb/206Pb date) – (238U/206Pb date)] / [207Pb/206Pb date]; Lu et al., 2019). Zircons that were excluded commonly failed more
YL17 21/08/19
Phanerozoic infertile suites Phanerozoic fertile suites
Potassic low-Sr/Y granite (2676–2626 Ma)
Sodic low-Sr/Y granite (2832–2658 Ma)
Sodic high-Sr/Y granite (TTG; 2932–2666 Ma)
Boddington syn-ore diorites and dacite (c. 2700 Ma)
Calingiri Cu–Mo granitic rocks (c. 3010 Ma)
Boddington c. 2700 Ma syn-ore dacite (BODD-3)
Boddington c. 2700 Ma syn-ore diorite (BODD-2)
Boddington c. 2700 Ma syn-ore diorite (BODD-5)
Am:Ap of 99.8 : 0.2
Pl:Ap of 98.7 : 1.3
Am
Ap
Ttn
Zrn
Grt
Pl:Ap(98.7 : 1.3)
0.0
1.0
0.8
0.6
0.4
0.2
0 10 20 30 400.0
0.8
0.6
0.4
0.2
1.0
100 20 30 40
Pl
10%
50%
0.2%1%
90%
50%
70%50%30%
0.25%
0.30%
0.1%
1.6%
1.4%
70%
60%
Pl:Ap(98.7 : 1.3)
60%50%40%
Barr
en
Fert
ile
Boddington c. 2613 Ma granite (BODD-1)
increasing differentiation
incr
ea
sin
gly
hyd
rou
s a
nd
oxi
diz
ed
Zircon (Yb/Gd)
Zir
co
n (
Eu
/Eu
*)
Zircon (Yb/Gd)
a) b)
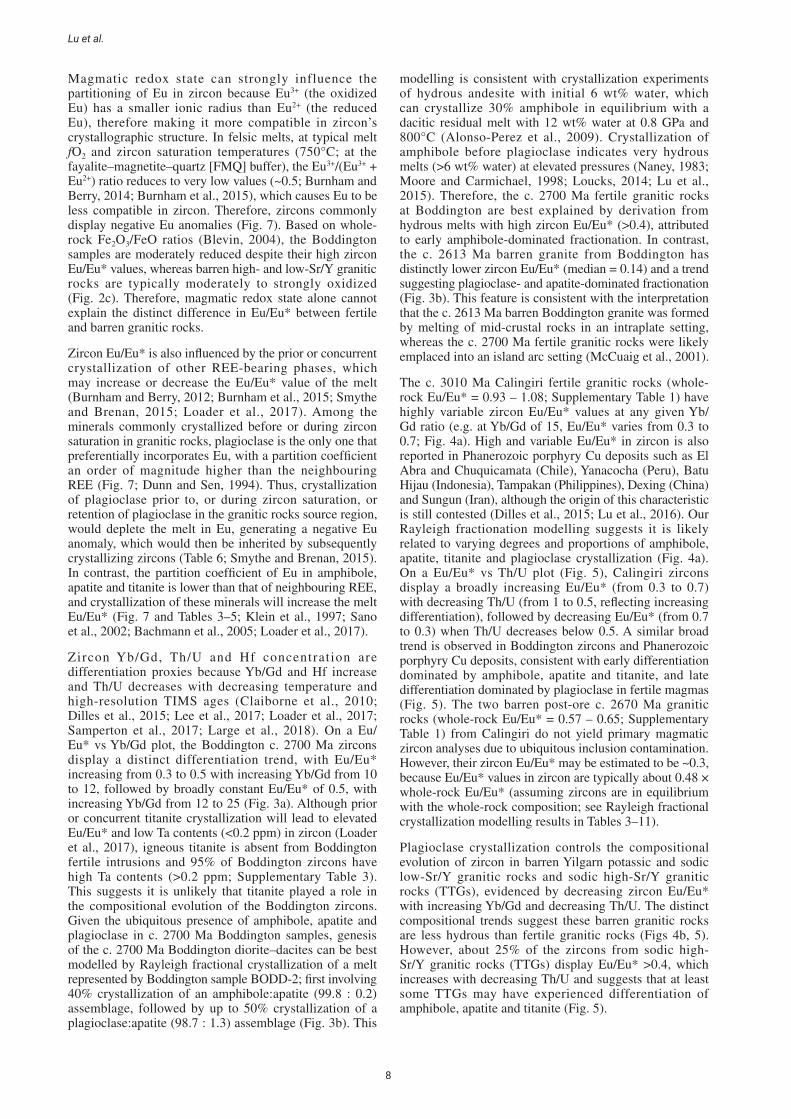
Figure 3. Zircon Eu/Eu* vs Yb/Gd ratios: a) all primary magmatic zircon analyses from Archean fertile and barren granitic rocks in the Yilgarn Craton (Supplementary Table 3) and global Phanerozoic fertile and infertile igneous rocks (Lu et al., 2016); b) four individual samples from Boddington Au mine showing within-sample variation and Rayleigh fractionation modelling curves of various minerals, with the numbers indicating percentage of crystallization of the related mineral or mineral assemblage. Refer to the text for modelling details. Abbreviations: Am, amphibole; Ap, apatite; Grt, garnet; Pl, plagioclase; Ttn, titanite; Zrn, zircon
than one of the criteria above. Dates based on 207Pb/206Pb ratios for compositions <10% discordant were used to identify and exclude xenocrystic zircons or inherited zircon cores. After excluding contaminated zircon signals and xenocrysts, only data relating to magmatic zircons free of contamination are plotted and discussed in the text. All analyzed zircon data are reported in Supplementary Table 2, and the primary zircon data are reported in Supplementary Table 3.
GeochronologyThe primary reference material used for U–Pb dating in this study was zircon standard GJ-1 (601.7 ± 1.4 Ma; Jackson et al., 2004; Kylander-Clark et al., 2013), with secondary standard zircons 91500 (1062.4 ± 0.4 Ma; Wiedenbeck et al., 1995) and OGC1 (3465.4 ± 0.6 Ma; Stern et al., 2009). OGC1 is the zircon standard obtained by Curtin University from the same rock from that standard OG1 was described by Stern et al. (2009). The 207Pb/206Pb ages of the OGC1 standard were used to check the accuracy of dated samples and all fall within uncertainty of the accepted value. For example, the weighted mean 207Pb/206Pb age determined for OGC1 across all runs was 3468 ± 5 Ma (n = 60, MSWD = 1.4), consistent with the recommended value within uncertainty (3465 Ma; Stern et al., 2009). Time-resolved mass spectra were reduced using the U_Pb_Geochronology4 and Trace_Elements_IS data reduction schemes in Iolite (Paton et al., 2011, and references therein).

5
GSWA Report 197 Zircon fingerprinting of magmatic–hydrothermal systems in the Archean Yilgarn Craton
ResultsIndividual zircon crystals were analysed by LA-ICP-MS for U–Pb age and 33 trace elements. The complete results of 2612 zircon analyses for 50 representative granitic rocks samples from across the Yilgarn Craton are reported in Supplementary Table 2. Screening for the effects of alteration and mineral inclusion contamination leaves 458 primary zircon analyses (Supplementary Table 3), which is about four times the amount of published primary zircon data for Archean granitic rocks globally. This new primary zircon chemistry dataset includes chemical compositions of:
• 201 magmatic zircons from 30 regional barren granitic rocks, including sodic high-Sr/Y granitic rocks (TTGs), sodic low-Sr/Y granitic rocks, and potassic low-Sr/Y granitic rocks (no primary data was obtained from potassic high-Sr/Y granitic rocks)
• 233 magmatic zircons from six granitic rocks from the Calingiri and Boddington deposits
• 24 analyses of xenocrystic zircons (not plotted or discussed).
Summary statistics of primary igneous zircon compositions for these samples are included in Table 1, and presented in Figures 3–6.
Rayleigh fractionation modelZircon compositions are strongly influenced by the prior or concurrent crystallization of other rare earth element (REE)-bearing phases (Burnham and Berry, 2012; Burnham et al., 2015; Smythe and Brenan, 2015; Loader et al., 2017). To illustrate the geochemical impact of minerals crystallized prior to or concurrent with zircon crystallization, we present the Rayleigh fractionation model of single minerals and mineral assemblages following the approach of Loader et al. (2017).
Calculation of model partition coefficientsPartition coefficients (Kd) were selected from the GERM database (http://earthref.org/GERM). The following Kd values (Fig. 7; Table 2) were used: titanite (Bachmann et al., 2005), plagioclase (Dunn and Senn, 1994), zircon and apatite (Sano et al., 2002), amphibole (Klein et al., 1997) and garnet (Burnham and Berry, 2017). The Boddington diorite sample (BODD-2) whole-rock value was used as the starting composition (Table 2).
Rayleigh fractionation of single mineral modelRayleigh fractionation of a single mineral, such as amphibole, apatite, titanite, plagioclase, zircon and garnet, was calculated using the following formula (Loader et al., 2017):
where Cl is the concentration of an element in the liquid, is the initial element concentration in the melt, F is the fraction of melt remaining, and Kd m is the partition coefficient of a specific mineral above. For example, in the case of the amphibole fractionation model (where only amphibole crystallization from BODD-2 composition was considered), this was done for melt fractions from 1 to 0.01 (i.e. 0–99% amphibole crystallization), in increments of 10%. Zircon in equilibrium with these hypothetical melts was calculated. The results of the fractionation model of amphibole, apatite, titanite, plagioclase, zircon and garnet are presented in Tables 3–8 and illustrated in Figures 3 and 4.
Rayleigh fractionation of amphibole:apatite and plagioclase:apatite modelRayleigh fractionation of plagioclase:apatite and amphibole:apatite mineral assemblages was calculated using the following formula (Loader et al., 2017):
where Cl is the concentration of an element in the liquid, is the initial element concentration in the melt, F is the fraction of melt remaining, and Kd bulk is the bulk partition coefficient.
Bulk Kd values of the plagioclase:apati te and amphibole:apatite assemblages were calculated using:
Kd bulk = (Dam * Xm) + (Da
ap * Xap)
where Dam and Da
ap are the partition coefficients for element a in phase m (plagioclase or amphibole) and apatite (ap), and X is the fraction of each phase individually.
The fractionation of amphibole:apatite (99.8 : 0.2) was modelled using sample BODD-2 as a starting composition and the results are presented in Table 9 and illustrated in Figure 3.
Two plagioclase:apatite (98.7 : 1.3) fractionations were modelled, using two starting compositions: 1) model melt after 40% crystallization of amphibole:apatite (99.8 : 0.2) in Table 9; and 2) sample BODD-2. The model results are presented in Tables 10 and 11, respectively, and illustrated in Figures 3 and 4.
Eu/Eu* in zircon: a discriminant between
barren and fertile Archean granitic rocks
Europium anomaly (Eu/Eu*) values in zircon are shown in Figures 3–5. The fertile Boddington and Calingiri granitic rocks have higher zircon Eu/Eu* (>0.4 in ~80% of zircons with a median of 0.49 for Boddington and 0.47 for Calingiri) than barren Yilgarn granitic rocks with Eu/Eu* >0.4 only in about 10% in zircons from barren sodic
Cl = Cl * F (Kd m–1)0
Cl = Cl * F (Kd bulk –1)0
Cl 0
Cl 0

6
Lu et al.
Figure 4. Zircon Eu/Eu* vs Yb/Gd ratios: a) two mineralized samples from Calingiri Cu–Mo granitic rocks; b) seven individual samples from regional barren Yilgarn Craton granitic rocks with only samples yielding more than 10 primary zircon analyses plotted. Rayleigh fractionation modelling curves and abbreviations are the same as in Figure 3. Abbreviations: Bt, biotite; Hbl, hornblende
Am±Ap±Ttn
Pl
Phanerozoic infertile suites
Barr
en
Fert
ile
Phanerozoic fertile suites
Potassic low-Sr/Y granite (2676–2626 Ma)
Sodic low-Sr/Y granite (2832–2658 Ma)
Sodic high-Sr/Y granite (TTG; 2932–2666 Ma)
Boddington syn-ore porphyry and dacite (c. 2700 Ma)
Calingiri porphyry Cu–Mo granitic rocks (c. 3010 Ma)
0.0
1.0
0.8
0.6
0.4
0.2
1.5 1.0 0.5 0.0
Zir
co
n (
Eu
/Eu
*)
Zircon (Th/U)
YL19 15/08/19
Figure 5. Zircon Eu/Eu* vs Th/U ratios, with decreasing Th/U indicating increasing differentiation. The schematic vectors showing effect of crystallization of plagioclase and amphibole±apatite±titanite. Data source is the same as in Figure 3
Calingiri 3010 Ma syn-ore syenogranitic gneiss (205931)
Calingiri 3010 Ma syn-ore monzogranitic gneiss (205930)
Am
Ap
Ttn
Zrn
Grt
Pl:Ap (98.7 : 1.3)
2658 Ma Hbl–Bt granodiorite, Kurnalpi Terrane (118951, Sr/Y = 3, Eu/Eu* = 0.51)
2832 Ma metatonalite, Yarmana Terrane (179450, Sr/Y = 2, Eu/Eu* = 0.68)
2724 Ma Bt–Hbl tonalite gneiss, Murchison Domain (185923, Sr/Y = 13, Eu/Eu* = 0.90) 2733 Ma Bt–Hbl metatonalite, Murchison Domain (185928, Sr/Y = 25, Eu/Eu* = 0.81)
Potassic low-Sr/Y 2626 Ma monzogranite, Murchison Domain (207630, Sr/Y = 3, Eu/Eu* = 0.26)
TTG 2675 Ma Bt–Hbl monzogranite, Kurnalpi Terrane (101381, Sr/Y = 58)
TTG 2681 Ma Bt–Hbl tonalite, Yamarna Terrane (183146, Sr/Y = 45, Eu/Eu* = 0.95)
Am
Ap
Ttn
Zrn
Grt
Pl:Ap (98.7 : 1.3)
0.0
1.0
0.8 0.8
0.6 0.6
0.4 0.4
0.2 0.2
0 10 20 30 40
Zir
co
n (
Eu
/Eu
*)
Zircon (Yb/Gd)
0.0
1.0
10 20 30 400
Zir
co
n (
Eu
/Eu
*)
Zircon (Yb/Gd)
a) b)
YL18 21/08/19
Am
PlPl

7
GSWA Report 197 Zircon fingerprinting of magmatic–hydrothermal systems in the Archean Yilgarn Craton
Phanerozoic infertile suites (Lu et al., 2016) Phanerozoic fertile suites (Lu et al., 2016)
Yilgarn 2676–2626 Ma potassic low-Sr/Y granite Yilgarn 2832–2658 Ma sodic low-Sr/Y granite
Yilgarn 2932–2666 Ma sodic high-Sr/Y granite (TTG) Boddington 2700 Ma syn-ore porphyry and dacite
Calingiri c. 3010 Ma porphyry Cu–Mo granitic rocks
0 10 20 30 40
Zir
co
n (
Ce
/Ce
*)
Zircon (Yb/Gd)
1.5 1.0 0.5 0.0
Zir
co
n (
Ce
/Ce
*)
Zircon (Th/U)
a) b)
10
100
1000
11
10
100
1000
YL24 21/08/19
Figure 6. Zircon Ce/Ce* ratios of Archean granitic rocks in the Yilgarn Craton: a) Ce/Ce* vs Yb/Gd; b) Ce/Ce* vs Th/U. Data source is the same as in Figure 3
0.001
0.01
0.1
1
10
100
1000
Ttn
Ap
Zrn
Grt
Am
Pl
La Ce Pr Nd Pm Sm Eu Gd Tb Dy Ho Er Tm Yb Lu
D (
min
era
l/m
elt
)
YL22 24/07/19
Figure 7. Partition coefficients of REE between mineral and melt. Values are provided in Table 2. Data sources: titanite (Bachmann et al., 2005); plagioclase (Dunn and Senn, 1994); zircon and apatite (Sano et al., 2002); amphibole (Klein et al., 1997); garnet (Burnham and Berry, 2017)
and potassic low-Sr/Y granitic rocks, and 25% in zircons from sodic high-Sr/Y granitic rocks (TTGs). The median zircon Eu/Eu* is 0.23 for potassic low-Sr/Y granitic rocks, 0.27 for sodic low-Sr/Y granitic rocks and 0.31 for sodic high-Sr/Y granitic rocks (Table 1). This difference is evident across the full age range of Yilgarn granitic rocks from 3.0 to 2.6 Ga (Figs 3, 4). Thus, Eu/Eu* in zircon is an effective discriminant between zircons from fertile and barren Yilgarn granitic rocks.
High Eu/Eu* (>0.4) in zircon has also been reported for Phanerozoic porphyry Cu deposits associated with hydrous and oxidized granitic rocks, typically in convergent margin settings (Fig. 3; Ballard et al., 2002; Dilles et al., 2015; Lu et al., 2016, Lee et al., 2017; Loader et al., 2017; Large et al., 2018). The global Phanerozoic fertile and infertile granitic rocks suites reported by Lu et al. (2016) are plotted for comparison (Figs 3, 5, 6). The Phanerozoic infertile suites are relatively reduced and dry S-, A-, and I-type magmatic rocks, including the Yellowstone rhyolite (Wyoming), Bandelier rhyolite (New Mexico), Bishop tuff rhyolite (California), Lucerne reduced granite (Maine), and Hawkins S-type dacite and Kadoona I-type dacite (Lachlan belt, Australia). The Phanerozoic fertile suites are more oxidized and hydrous I-type intrusions from porphyry and high-sulfidation epithermal Cu–Au deposits (Batu Hijau, Indonesia and Tampakan, Philippines), porphyry Cu–Mo–Au deposits (Sar Cheshmeh, Iran; Dexing, eastern China; and Jiama, southern Tibet), porphyry Cu–Mo deposits (Sungun, Iran and Qulong, southern Tibet) and porphyry Mo deposits (Nannihu and Yuchiling, central China).
8
Lu et al.
Magmatic redox state can strongly influence the partitioning of Eu in zircon because Eu3+ (the oxidized Eu) has a smaller ionic radius than Eu2+ (the reduced Eu), therefore making it more compatible in zircon’s crystallographic structure. In felsic melts, at typical melt fO2 and zircon saturation temperatures (750°C; at the fayalite–magnetite–quartz [FMQ] buffer), the Eu3+/(Eu3+ + Eu2+) ratio reduces to very low values (~0.5; Burnham and Berry, 2014; Burnham et al., 2015), which causes Eu to be less compatible in zircon. Therefore, zircons commonly display negative Eu anomalies (Fig. 7). Based on whole-rock Fe2O3/FeO ratios (Blevin, 2004), the Boddington samples are moderately reduced despite their high zircon Eu/Eu* values, whereas barren high- and low-Sr/Y granitic rocks are typically moderately to strongly oxidized (Fig. 2c). Therefore, magmatic redox state alone cannot explain the distinct difference in Eu/Eu* between fertile and barren granitic rocks.
Zircon Eu/Eu* is also influenced by the prior or concurrent crystallization of other REE-bearing phases, which may increase or decrease the Eu/Eu* value of the melt (Burnham and Berry, 2012; Burnham et al., 2015; Smythe and Brenan, 2015; Loader et al., 2017). Among the minerals commonly crystallized before or during zircon saturation in granitic rocks, plagioclase is the only one that preferentially incorporates Eu, with a partition coefficient an order of magnitude higher than the neighbouring REE (Fig. 7; Dunn and Sen, 1994). Thus, crystallization of plagioclase prior to, or during zircon saturation, or retention of plagioclase in the granitic rocks source region, would deplete the melt in Eu, generating a negative Eu anomaly, which would then be inherited by subsequently crystallizing zircons (Table 6; Smythe and Brenan, 2015). In contrast, the partition coefficient of Eu in amphibole, apatite and titanite is lower than that of neighbouring REE, and crystallization of these minerals will increase the melt Eu/Eu* (Fig. 7 and Tables 3–5; Klein et al., 1997; Sano et al., 2002; Bachmann et al., 2005; Loader et al., 2017).
Zircon Yb/Gd, Th/U and Hf concentration are differentiation proxies because Yb/Gd and Hf increase and Th/U decreases with decreasing temperature and high-resolution TIMS ages (Claiborne et al., 2010; Dilles et al., 2015; Lee et al., 2017; Loader et al., 2017; Samperton et al., 2017; Large et al., 2018). On a Eu/Eu* vs Yb/Gd plot, the Boddington c. 2700 Ma zircons display a distinct differentiation trend, with Eu/Eu* increasing from 0.3 to 0.5 with increasing Yb/Gd from 10 to 12, followed by broadly constant Eu/Eu* of 0.5, with increasing Yb/Gd from 12 to 25 (Fig. 3a). Although prior or concurrent titanite crystallization will lead to elevated Eu/Eu* and low Ta contents (<0.2 ppm) in zircon (Loader et al., 2017), igneous titanite is absent from Boddington fertile intrusions and 95% of Boddington zircons have high Ta contents (>0.2 ppm; Supplementary Table 3). This suggests it is unlikely that titanite played a role in the compositional evolution of the Boddington zircons. Given the ubiquitous presence of amphibole, apatite and plagioclase in c. 2700 Ma Boddington samples, genesis of the c. 2700 Ma Boddington diorite–dacites can be best modelled by Rayleigh fractional crystallization of a melt represented by Boddington sample BODD-2; first involving 40% crystallization of an amphibole:apatite (99.8 : 0.2) assemblage, followed by up to 50% crystallization of a plagioclase:apatite (98.7 : 1.3) assemblage (Fig. 3b). This
modelling is consistent with crystallization experiments of hydrous andesite with initial 6 wt% water, which can crystallize 30% amphibole in equilibrium with a dacitic residual melt with 12 wt% water at 0.8 GPa and 800°C (Alonso-Perez et al., 2009). Crystallization of amphibole before plagioclase indicates very hydrous melts (>6 wt% water) at elevated pressures (Naney, 1983; Moore and Carmichael, 1998; Loucks, 2014; Lu et al., 2015). Therefore, the c. 2700 Ma fertile granitic rocks at Boddington are best explained by derivation from hydrous melts with high zircon Eu/Eu* (>0.4), attributed to early amphibole-dominated fractionation. In contrast, the c. 2613 Ma barren granite from Boddington has distinctly lower zircon Eu/Eu* (median = 0.14) and a trend suggesting plagioclase- and apatite-dominated fractionation (Fig. 3b). This feature is consistent with the interpretation that the c. 2613 Ma barren Boddington granite was formed by melting of mid-crustal rocks in an intraplate setting, whereas the c. 2700 Ma fertile granitic rocks were likely emplaced into an island arc setting (McCuaig et al., 2001).
The c. 3010 Ma Calingiri fertile granitic rocks (whole-rock Eu/Eu* = 0.93 – 1.08; Supplementary Table 1) have highly variable zircon Eu/Eu* values at any given Yb/Gd ratio (e.g. at Yb/Gd of 15, Eu/Eu* varies from 0.3 to 0.7; Fig. 4a). High and variable Eu/Eu* in zircon is also reported in Phanerozoic porphyry Cu deposits such as El Abra and Chuquicamata (Chile), Yanacocha (Peru), Batu Hijau (Indonesia), Tampakan (Philippines), Dexing (China) and Sungun (Iran), although the origin of this characteristic is still contested (Dilles et al., 2015; Lu et al., 2016). Our Rayleigh fractionation modelling suggests it is likely related to varying degrees and proportions of amphibole, apatite, titanite and plagioclase crystallization (Fig. 4a). On a Eu/Eu* vs Th/U plot (Fig. 5), Calingiri zircons display a broadly increasing Eu/Eu* (from 0.3 to 0.7) with decreasing Th/U (from 1 to 0.5, reflecting increasing differentiation), followed by decreasing Eu/Eu* (from 0.7 to 0.3) when Th/U decreases below 0.5. A similar broad trend is observed in Boddington zircons and Phanerozoic porphyry Cu deposits, consistent with early differentiation dominated by amphibole, apatite and titanite, and late differentiation dominated by plagioclase in fertile magmas (Fig. 5). The two barren post-ore c. 2670 Ma granitic rocks (whole-rock Eu/Eu* = 0.57 – 0.65; Supplementary Table 1) from Calingiri do not yield primary magmatic zircon analyses due to ubiquitous inclusion contamination. However, their zircon Eu/Eu* may be estimated to be ~0.3, because Eu/Eu* values in zircon are typically about 0.48 × whole-rock Eu/Eu* (assuming zircons are in equilibrium with the whole-rock composition; see Rayleigh fractional crystallization modelling results in Tables 3–11).
Plagioclase crystallization controls the compositional evolution of zircon in barren Yilgarn potassic and sodic low-Sr/Y granitic rocks and sodic high-Sr/Y granitic rocks (TTGs), evidenced by decreasing zircon Eu/Eu* with increasing Yb/Gd and decreasing Th/U. The distinct compositional trends suggest these barren granitic rocks are less hydrous than fertile granitic rocks (Figs 4b, 5). However, about 25% of the zircons from sodic high-Sr/Y granitic rocks (TTGs) display Eu/Eu* >0.4, which increases with decreasing Th/U and suggests that at least some TTGs may have experienced differentiation of amphibole, apatite and titanite (Fig. 5).

9
GSWA Report 197 Zircon fingerprinting of magmatic–hydrothermal systems in the Archean Yilgarn Craton
The Ce anomaly in zircon (Ce/Ce*) has previously been proposed to distinguish between fertile and barren granitic rocks (e.g. Ballard et al., 2002). The zircon Ce/Ce* is sensitive to magmatic oxidation state and temperature (Burnham and Berry, 2012, 2014; Loucks et al., 2018). However, our comprehensive data show that it is not very effective in discriminating fertile from barren granitic rocks, as shown by significant overlap between fertile and barren samples in both Archean and Phanerozoic systems (Fig. 6). This is probably because, in natural systems, oxygen fugacity and water contents have the opposite effect on Ce/Ce* (high oxidation state will increase Ce/Ce* but high water content will decrease Ce/Ce*; Smythe and Brenan, 2015, 2016).
Implications for explorationMagma fertility is highly dependent on water content, sulfur content and oxidation state (Rohrlach and Loucks, 2005; Richards, 2011; Loucks, 2014). High water content is the primary control on magma fertility and determines whether or not a magmatic–hydrothermal metal system can form. Hydrous magmas can exsolve a water-rich volatile phase during upper-crustal emplacement, a requirement for formation of an ore system (Burnham, 1979; Richards, 2011). The oxidation state and sulfur content of the magma are secondary to the requirement for sufficient water, although they may influence the metal ratios and endowment (Richards, 2011). The distinctly high zircon Eu/Eu* (>0.4) in fertile granitic rocks is a function of early amphibole crystallization, which confirms their hydrous nature (Fig. 3a).
Because zircon can survive intense hydrothermal alteration, weathering, metamorphism and long-distance detrital transport, it can be used as an indicator for Au–Cu–Mo fertility in weathered and metamorphosed terranes. Previous work has indicated that zircon chemistry is an effective prospectivity tool in Phanerozoic terranes (Ballard et al., 2002; Dilles et al., 2015; Lu et al., 2016) and the results of this study confirm similar potential for prospectivity analysis in Archean terranes. Furthermore, we envisage the use of detrital zircon chemistry from sedimentary rocks as a regional exploration tool for magmatic–hydrothermal metal deposits in Archean terranes, with the potential to identify fertile granitic rocks over large detrital source areas.
Implications for Archean geodynamics
These results not only provide a new exploration tool for Archean magmatic–hydrothermal systems, but also have implications for models of the evolution of Archean crust. Specifically, the results provide a means for determining whether the parental melts of granitic
rocks have undergone a water-enriching process, which in turn indicates particular geodynamic settings. For example, Phanerozoic porphyry systems are derived via high-pressure melting and fractionation above subducting oceanic crust in convergent settings (Loucks, 2014). This tectonic process increases water content in the melt. Hence, it may be that fertile Archean granitic rocks, with similar compositional characteristics, also formed in subduction settings. Indeed, the c. 2700 Ma intrusive and volcanic rocks (diorite–andesite–dacite) at the Boddington Au mine have previously been interpreted as having been emplaced in an island arc setting (McCuaig et al., 2001), which is supported by our Boddington zircon Eu/Eu* results (Fig. 3).
Comprehensive trace element data sets for Precambrian zircons are scarce (Burnham and Berry, 2017). The Hadean (4.02 Ga) Idiwhaa tonalitic gneiss of the Acasta Gneiss Complex (Canada) is the oldest intact terrestrial rock unit, and yielded very low zircon Eu/Eu* values (median = 0.18, n = 16; Reimink et al., 2014), consistent with their generation in a non-subduction setting, such as in an Iceland-like setting (Reimink et al., 2014) or via meteorite impact melting (Johnson et al., 2018). The 4.4 – 3.3 Ga detrital zircons from the Jack Hills in Western Australia, which include the oldest known mineral grains on Earth, also yielded low zircon Eu/Eu* values, with 92% of zircons having Eu/Eu* <0.4 (median = 0.19, n = 258; Bell et al., 2016). In contrast, the limited available zircon compositions from 2.7 Ga TTGs and sanukitoid rocks from the Superior Craton exhibit higher zircon Eu/Eu* values (median of 0.59 for TTGs, n = 13 and 0.52 for sanukitoids, n = 18; Bouvier et al., 2012) indicating a hydrous, amphibole-rich parent melt, which is consistent with a subduction-related origin (Percival et al., 2006). However, a systematic study of zircon compositions from the Superior Craton is required to fully test this possibility.
ConclusionsThis Report documents the first craton-wide study to systematically examine zircons from granitic rocks in the Archean Yilgarn Craton as potential metallogenic fertility indicators of Archean magmatic–hydrothermal systems. The fertile granitic rocks from the Calingiri Cu–Mo and Boddington Au–Cu–Mo deposits in the Yilgarn Craton show distinctly higher zircon Eu anomaly values (>0.4) and amphibole-dominated fractionation in hydrous melts, similar to Phanerozoic fertile granitic rocks. By contrast, the barren granitic rocks from across the Yilgarn Craton display lower zircon Eu/Eu* values (<0.4) and plagioclase-dominated fractionation. These results suggest that the zircon Eu anomaly and trace element ratios can be used to distinguish fertile from barren granitic rocks in Archean and Phanerozoic terranes, providing an effective geochemical exploration tool to assess the metallogenic fertility of granitic rocks over geological time.

10
Lu et al.
SuiteSodic low-Sr/Y
granite (n = 107)Sodic high-Sr/Y granite (n = 52)
Potassic low-Sr/Y granite (n = 41)
Calingiri fertile granite (n = 51)
Boddington fertile granite (n = 176)
Phanerozoic fertile granite (n = 337)
Phanerozoic infertile granite (n = 93)
Age (Ma) 2832–2658 2932–2660 2676–2626 3010 2703–2701 170–4 430 – 0.6
Trace element min med max min med max min med max min med max min med max min med max min med max
Ti 2.30 6.15 26.60 1.60 7.70 18.10 4.00 10.85 19.30 2.80 4.80 10.30 1.86 5.80 34.00 0.30 3.80 37.00 0.50 3.80 20.00
Y 343 980 3530 63 520 1620 203 594 1615 282 557 2077 266 632 1850 126 577 5830 581 3434 20 290
Nb 0.36 1.39 6.24 0.36 0.91 3.29 0.60 1.66 3.52 0.43 0.85 2.47 0.35 0.69 1.31 0.18 1.78 59.20 0.83 6.14 570.60
Mo 0.26 0.66 1.61 0.27 1.46 3.59 0.10 0.50 1.67 0.65 1.10 1.41 0.70 1.08 1.95 0.08 0.80 9.40 0.06 0.62 1.15
La 0.01 0.13 0.93 0.01 0.16 0.89 0.01 0.09 0.99 0.01 0.13 0.89 0.00 0.05 0.94 0.00 0.01 0.99 0.00 0.03 0.89
Ce 2.58 9.34 41.00 2.76 11.48 34.50 4.04 8.98 36.10 2.63 7.70 23.20 3.22 8.02 39.30 1.88 22.00 154.00 0.83 15.53 216.90
Pr 0.010 0.149 1.086 0.010 0.075 0.472 0.020 0.088 0.720 0.020 0.137 1.030 0.017 0.099 1.190 0.001 0.050 1.530 0.013 0.129 0.923
Nd 0.58 2.22 10.92 0.16 1.05 4.35 0.29 1.35 6.13 0.30 1.38 7.10 0.29 1.49 11.80 0.03 0.72 23.30 0.25 2.20 13.90
Sm 1.26 3.74 13.50 0.38 1.97 6.88 1.05 2.57 10.72 0.75 1.82 9.03 0.74 2.63 15.30 0.09 1.48 34.90 1.39 6.03 31.40
Eu 0.22 0.74 3.43 0.11 0.42 2.67 0.14 0.48 3.20 0.22 0.67 2.92 0.24 0.95 5.83 0.07 0.75 12.09 0.001 0.20 3.86
Gd 7.20 20.30 79.00 2.01 11.05 42.00 5.63 15.20 43.20 4.61 11.10 47.30 4.54 13.24 54.80 1.31 9.08 137.00 12.00 37.30 205.10
Tb 2.51 6.53 26.10 0.65 3.65 12.86 1.76 4.80 13.47 1.61 3.51 14.09 1.65 4.33 16.50 0.49 3.07 39.20 4.29 14.50 80.50
Dy 30.90 80.50 316.00 6.90 44.85 155.70 19.60 54.30 149.90 20.10 46.50 179.40 19.70 52.05 180.00 7.11 40.60 433.00 51.80 208.30 1035.00
Ho 11.08 31.40 110.30 1.95 17.28 56.20 6.75 19.97 53.50 9.00 17.37 66.10 8.05 20.31 63.80 3.30 16.91 161.30 19.10 83.20 381.20
Er 53.40 157.10 507.00 7.84 84.80 257.30 29.00 88.60 239.00 44.20 88.50 319.00 41.20 93.50 265.00 20.75 93.00 747.00 92.30 394.00 1765.00
Tm 10.53 31.22 96.70 1.37 17.92 50.40 5.65 18.08 47.60 9.67 18.92 64.50 9.82 20.64 51.60 5.30 22.26 148.00 18.24 79.20 341.70
Yb 96 273 814 11 166 452 48 163 425 99 181 570 102 202 449 67 233 1334 155 703 2911
Lu 19.4 58.9 155.6 2.0 34.8 87.0 9.5 33.3 84.1 22.4 39.8 116.0 24.0 45.6 94.2 17.2 57.1 277.7 30.8 137.4 522.0
Hf 6960 8350 10 750 7110 8655 11 270 7270 8650 10 050 7560 9170 12 600 7500 9970 12 060 6016 9062 13 350 6394 10 540 12 560
Ta 0.17 0.53 1.54 0.09 0.34 1.13 0.20 0.59 1.30 0.09 0.30 0.64 0.14 0.32 0.57 0.03 0.50 9.34 0.49 1.85 80.50
Pb 97.3 272.0 2409.0 61.4 190.7 1487.0 65.6 184.1 1029.0 149.2 481.2 1430.0 155.4 496.0 1091.0 0.0 0.8 16.4 0.0 1.0 24.3
Th 15 80 403 11 50 367 21 46 338 26 100 594 38 111 567 4 266 6400 34 159 9850
U 43 109 1020 29 85 634 32 81 452 62 202 586 76 243 519 12 439 4616 72 394 15 710
Eu/Eu* 0.14 0.27 0.53 0.14 0.31 0.72 0.07 0.23 0.65 0.25 0.47 0.67 0.22 0.49 0.80 0.227 0.57 1.46 0.0001 0.06 0.31
Ce/Ce* 3.8 16.6 177.4 4.1 45.3 946.4 2.5 36.5 252.4 3.5 28.2 196.3 3.0 21.6 100.5 6.6 125.2 11 021.0 2.3 41.7 356.9
Yb/Gd 7.0 13.0 25.4 5.3 14.4 32.1 3.5 10.4 20.4 10.3 16.2 26.8 6.6 15.9 25.8 4.2 25.0 93.7 5.3 14.2 45.9
Th/U 0.22 0.55 1.38 0.15 0.61 0.91 0.38 0.58 2.54 0.30 0.51 1.01 0.23 0.44 1.24 0.16 0.59 3.76 0.11 0.53 1.18
T (°C) 651 734 889 624 755 844 696 789 851 667 712 784 635 729 920 517 692 931 547 692 855
NOTES: Eu/Eu* = EuN/(SmN × GdN)0.5, where N denotes chondrite-normalized values (Sun and McDonough, 1989); Ce/Ce*=CeN/(NdN*NdN/SmN) proposed by Loader et al. (2017); Phanerozoic fertile and infertile granitic rock data from Lu et al. (2016)
Table 1. Summary statistics of primary igneous zircon geochemistry from Archean granitic rocks of the Yilgarn Craton

11
GSWA Report 197 Zircon fingerprinting of magmatic–hydrothermal systems in the Archean Yilgarn Craton
Mineral Titanite Plagioclase Zircon Apatite Amphibole Garnet BODD-2 diorite (ppm, whole rock)
Rock Rhyolite Basaltic andesite Dacite Dacite Tonalite Unknown
La 113 0.18 0.00046 36 0.37 0.0109 27.4
Ce 223 0.14 0.36 48 0.73 0.0567 55.6
Pr 431 0.13 0.0172 64 – 0.2425 6.2
Nd 639 0.12 0.077 77 1.2 0.8519 22.6
Pm 785 0.1 0.2 – – – –
Sm 930 0.08 0.8 93 2.01 4.83 3.8
Eu 661 0.79 1.22 55 1.33 8.46 0.7
Gd 855 0.07 8 127 2.3 13.21 2.9
Tb 895 0.06 20.7 102 – 18.37 0.3
Dy 935 0.03 45.9 76 2.68 22.76 1.6
Ho 786 0.03 80 62 – 25.03 0.3
Er 636 0.02 136 57 2.47 25.05 0.9
Tm 515 0.02 197 53 – 23.33 –
Yb 393 0.01 277 48 2.1 20.64 0.8
Lu 300 0.01 325 33 1.7 17.67 0.1
Pressure (Mpa) ~200 0.1 unknown unknown 1000 unknown NA
Temp. (°C) 700–760 1100 unknown unknown 800 850 NA
Table 2. Partition coefficient (Kd) values used in the Rayleigh fractionation model. Italicized values were interpolated or extrapolated from neighbouring partition coefficients by Loader et al. (2017). The grey column is the Boddington diorite sample (BODD-2) whole-rock value used as the starting composition

12
Lu et al.
Amphibole fractionation (%)
0 10 20 30 40 50 60 70 80 90 99
F 1 0.9 0.8 0.7 0.6 0.5 0.4 0.3 0.2 0.1 0.01
Model melt compositions
La 27.40 29.28 31.54 34.30 37.80 42.40 48.80 58.50 75.53 116.88 498.60
Ce 55.60 57.20 59.05 61.22 63.82 67.04 71.21 76.96 85.86 103.53 192.79
Pr 6.20 6.89 7.75 8.86 10.33 12.40 15.50 20.67 31.00 62.00 620.00
Nd 22.60 22.13 21.61 21.04 20.41 19.67 18.82 17.76 16.38 14.26 9.00
Sm 3.80 3.42 3.03 2.65 2.27 1.89 1.51 1.13 0.75 0.37 0.04
Eu 0.70 0.68 0.65 0.62 0.59 0.56 0.52 0.47 0.41 0.33 0.15
Gd 2.90 2.53 2.17 1.82 1.49 1.18 0.88 0.61 0.36 0.15 0.01
Tb 0.30 0.33 0.38 0.43 0.50 0.60 0.75 1.00 1.50 3.00 30.00
Dy 1.60 1.34 1.10 0.88 0.68 0.50 0.34 0.21 0.11 0.03 0.00
Ho 0.30 0.33 0.38 0.43 0.50 0.60 0.75 1.00 1.50 3.00 30.00
Er 0.90 0.77 0.65 0.53 0.42 0.32 0.23 0.15 0.08 0.03 0.00
Yb 0.80 0.71 0.63 0.54 0.46 0.37 0.29 0.21 0.14 0.06 0.01
Lu 0.10 0.09 0.09 0.08 0.07 0.06 0.05 0.04 0.03 0.02 0.00
Yb/Gd (melt) 0.28 0.28 0.29 0.30 0.31 0.32 0.33 0.35 0.38 0.44 0.69
Eu/Eu* (melt) 0.64 0.70 0.77 0.87 0.98 1.14 1.37 1.74 2.43 4.31 28.80
Zircon in equilibrium with model melt compositions
La 0.013 0.013 0.015 0.016 0.017 0.020 0.022 0.027 0.035 0.054 0.229
Ce 20.02 20.59 21.26 22.04 22.98 24.14 25.63 27.70 30.91 37.27 69.40
Pr 0.107 0.118 0.133 0.152 0.178 0.213 0.267 0.355 0.533 1.066 10.664
Nd 1.74 1.70 1.66 1.62 1.57 1.51 1.45 1.37 1.26 1.10 0.69
Sm 3.04 2.73 2.43 2.12 1.81 1.51 1.20 0.90 0.60 0.30 0.03
Eu 0.85 0.82 0.79 0.76 0.72 0.68 0.63 0.57 0.50 0.40 0.19
Gd 23.20 20.23 17.36 14.59 11.94 9.42 7.05 4.85 2.86 1.16 0.06
Tb 6.21 6.90 7.76 8.87 10.35 12.42 15.53 20.70 31.05 62.10 621.00
Dy 73.44 61.53 50.48 40.34 31.13 22.92 15.75 9.72 4.92 1.53 0.03
Ho 24 27 30 34 40 48 60 80 120 240 2400
Er 122.40 104.84 88.17 72.46 57.76 44.18 31.83 20.85 11.49 4.15 0.14
Yb 221.60 197.35 173.37 149.68 126.34 103.38 80.88 58.94 37.73 17.60 1.40
Lu 32.50 30.19 27.80 25.32 22.73 20.01 17.11 13.99 10.53 6.48 1.29
Yb/Gd (zircon) 9.55 9.76 9.99 10.26 10.58 10.97 11.47 12.15 13.18 15.14 23.99
Eu/Eu* (zircon) 0.31 0.34 0.37 0.42 0.47 0.55 0.66 0.84 1.17 2.08 13.89
Table 3. Results of the amphibole crystallization model, with REE concentrations of model melt compositions and the zircon composition in equilibrium with that melt. The melt starting composition for all models is the BODD-2 whole-rock composition, unless otherwise specified. Abbreviation: F, melt fraction remaining

13
GSWA Report 197 Zircon fingerprinting of magmatic–hydrothermal systems in the Archean Yilgarn Craton
Apatite fractionation (%) 0 0.2 0.4 0.6 0.8 1 1.2 1.4 1.6 1.8 2
F 1 0.998 0.996 0.994 0.992 0.99 0.988 0.986 0.984 0.982 0.98
Model melt compositions
La 27.40 25.55 23.81 22.20 20.69 19.27 17.96 16.73 15.58 14.51 13.51
Ce 55.60 50.61 46.05 41.90 38.12 34.67 31.52 28.66 26.05 23.68 21.51
Pr 6.20 5.47 4.82 4.24 3.74 3.29 2.90 2.55 2.24 1.97 1.74
Nd 22.60 19.41 16.67 14.30 12.27 10.53 9.03 7.74 6.63 5.68 4.87
Sm 3.80 3.16 2.63 2.18 1.81 1.51 1.25 1.04 0.86 0.71 0.59
Eu 0.70 0.63 0.56 0.51 0.45 0.41 0.36 0.33 0.29 0.26 0.24
Gd 2.90 2.25 1.75 1.36 1.05 0.82 0.63 0.49 0.38 0.29 0.23
Tb 0.30 0.25 0.20 0.16 0.13 0.11 0.09 0.07 0.06 0.05 0.04
Dy 1.60 1.38 1.18 1.02 0.88 0.75 0.65 0.56 0.48 0.41 0.35
Ho 0.30 0.27 0.23 0.21 0.18 0.16 0.14 0.13 0.11 0.10 0.09
Er 0.90 0.80 0.72 0.64 0.57 0.51 0.46 0.41 0.36 0.33 0.29
Yb 0.80 0.73 0.66 0.60 0.55 0.50 0.45 0.41 0.37 0.34 0.31
Lu 0.10 0.09 0.09 0.08 0.08 0.07 0.07 0.06 0.06 0.06 0.05
Yb/Gd (melt) 0.28 0.32 0.38 0.44 0.52 0.61 0.72 0.84 0.99 1.16 1.36
Eu/Eu* (melt) 0.64 0.72 0.80 0.90 1.00 1.12 1.25 1.40 1.57 1.75 1.96
Zircon in equilibrium with model melt compositions
La 0.013 0.012 0.011 0.010 0.010 0.009 0.008 0.008 0.007 0.007 0.006
Ce 20.02 18.22 16.58 15.08 13.72 12.48 11.35 10.32 9.38 8.52 7.74
Pr 0.107 0.094 0.083 0.073 0.064 0.057 0.050 0.044 0.039 0.034 0.030
Nd 1.74 1.49 1.28 1.10 0.95 0.81 0.70 0.60 0.51 0.44 0.37
Sm 3.04 2.53 2.10 1.75 1.45 1.21 1.00 0.83 0.69 0.57 0.47
Eu 0.85 0.77 0.69 0.62 0.55 0.50 0.44 0.40 0.36 0.32 0.29
Gd 23.20 18.03 14.00 10.87 8.43 6.54 5.07 3.93 3.04 2.35 1.82
Tb 6.21 5.07 4.14 3.38 2.76 2.25 1.83 1.50 1.22 0.99 0.81
Dy 73.44 63.20 54.37 46.76 40.21 34.56 29.70 25.51 21.91 18.81 16.14
Ho 24.00 21.24 18.79 16.63 14.70 13.00 11.49 10.16 8.97 7.93 7.00
Er 122.40 109.42 97.79 87.38 78.06 69.72 62.25 55.58 49.60 44.26 39.49
Yb 221.60 201.70 183.55 167.01 151.92 138.17 125.65 114.23 103.83 94.36 85.74
Lu 32.50 30.48 28.59 26.81 25.13 23.56 22.09 20.70 19.40 18.17 17.03
Yb/Gd (zircon) 9.55 11.19 13.11 15.37 18.02 21.13 24.79 29.09 34.16 40.11 47.12
Eu/Eu* (zircon) 0.31 0.35 0.39 0.43 0.48 0.54 0.60 0.68 0.75 0.84 0.94
Table 4. Results of the apatite crystallization model, with REE concentrations of model melt compositions and the zircon composition in equilibrium with that melt

14
Lu et al.
Titanite fractionation (%) 0 0.05 0.1 0.15 0.2 0.25 0.3 0.35 0.4 0.45 0.5
F 1 0.9995 0.999 0.9985 0.998 0.9975 0.997 0.9965 0.996 0.9955 0.995
Model melt compositions
La 27.40 25.91 24.50 23.16 21.90 20.70 19.57 18.50 17.49 16.53 15.63
Ce 55.60 49.76 44.53 39.84 35.65 31.90 28.54 25.53 22.84 20.43 18.27
Pr 6.20 5.00 4.03 3.25 2.62 2.11 1.70 1.37 1.11 0.89 0.72
Nd 22.60 16.43 11.94 8.67 6.30 4.58 3.32 2.41 1.75 1.27 0.92
Sm 3.80 2.39 1.50 0.94 0.59 0.37 0.23 0.15 0.09 0.06 0.04
Eu 0.70 0.50 0.36 0.26 0.19 0.13 0.10 0.07 0.05 0.04 0.03
Gd 2.90 1.89 1.23 0.80 0.52 0.34 0.22 0.15 0.09 0.06 0.04
Tb 0.30 0.19 0.12 0.08 0.05 0.03 0.02 0.01 0.01 0.01 0.00
Dy 1.60 1.00 0.63 0.39 0.25 0.15 0.10 0.06 0.04 0.02 0.01
Ho 0.30 0.20 0.14 0.09 0.06 0.04 0.03 0.02 0.01 0.01 0.01
Er 0.90 0.66 0.48 0.35 0.25 0.18 0.13 0.10 0.07 0.05 0.04
Yb 0.80 0.66 0.54 0.44 0.36 0.30 0.25 0.20 0.17 0.14 0.11
Lu 0.10 0.09 0.07 0.06 0.05 0.05 0.04 0.04 0.03 0.03 0.02
Yb/Gd (melt) 0.28 0.35 0.44 0.55 0.70 0.88 1.11 1.39 1.76 2.22 2.80
Eu/Eu* (melt) 0.64 0.72 0.81 0.91 1.02 1.15 1.29 1.45 1.63 1.83 2.06
Zircon in equilibrium with model melt compositions
La 0.013 0.012 0.011 0.011 0.010 0.010 0.009 0.009 0.008 0.008 0.007
Ce 20.02 17.91 16.03 14.34 12.83 11.48 10.27 9.19 8.22 7.35 6.58
Pr 0.107 0.086 0.069 0.056 0.045 0.036 0.029 0.024 0.019 0.015 0.012
Nd 1.74 1.26 0.92 0.67 0.49 0.35 0.26 0.19 0.13 0.10 0.07
Sm 3.04 1.91 1.20 0.75 0.47 0.30 0.19 0.12 0.07 0.05 0.03
Eu 0.85 0.61 0.44 0.32 0.23 0.16 0.12 0.08 0.06 0.04 0.03
Gd 23.20 15.14 9.87 6.44 4.20 2.74 1.78 1.16 0.76 0.49 0.32
Tb 6.21 3.97 2.54 1.62 1.04 0.66 0.42 0.27 0.17 0.11 0.07
Dy 73.44 46.03 28.85 18.07 11.32 7.09 4.44 2.78 1.74 1.09 0.68
Ho 24.00 16.21 10.94 7.39 4.99 3.36 2.27 1.53 1.03 0.70 0.47
Er 122.40 89.10 64.84 47.19 34.33 24.97 18.16 13.21 9.60 6.98 5.08
Yb 221.60 182.15 149.71 123.03 101.10 83.07 68.25 56.06 46.05 37.82 31.06
Lu 32.50 27.99 24.10 20.75 17.86 15.38 13.24 11.39 9.80 8.44 7.26
Yb/Gd (zircon) 9.55 12.03 15.16 19.11 24.09 30.36 38.28 48.26 60.85 76.74 96.79
Eu/Eu* (zircon) 0.31 0.35 0.39 0.44 0.49 0.55 0.62 0.70 0.79 0.88 0.99
Table 5. Results of the titanite crystallization model, with REE concentrations of model melt compositions and the zircon composition in equilibrium with that melt

15
GSWA Report 197 Zircon fingerprinting of magmatic–hydrothermal systems in the Archean Yilgarn Craton
Plagioclase fractionation (%)
0 10 20 30 40 50 60 70 80 90 99
F 1 0.9 0.8 0.7 0.6 0.5 0.4 0.3 0.2 0.1 0.01
Model melt compositions
La 27.40 29.87 32.90 36.71 41.65 48.37 58.08 73.54 102.54 181.03 1196.05
Ce 55.60 60.87 67.36 75.56 86.27 100.92 122.27 156.59 221.92 402.79 2917.93
Pr 6.20 6.80 7.53 8.46 9.67 11.33 13.76 17.67 25.15 45.96 340.72
Nd 22.60 24.80 27.50 30.93 35.43 41.59 50.62 65.20 93.15 171.44 1300.49
Sm 3.80 4.19 4.67 5.28 6.08 7.19 8.83 11.50 16.70 31.61 262.90
Eu 0.70 0.72 0.73 0.75 0.78 0.81 0.85 0.90 0.98 1.14 1.84
Gd 2.90 3.20 3.57 4.04 4.66 5.53 6.80 8.89 12.96 24.68 210.09
Tb 0.30 0.33 0.37 0.42 0.48 0.58 0.71 0.93 1.36 2.61 22.76
Dy 1.60 1.77 1.99 2.26 2.63 3.13 3.89 5.14 7.62 14.93 139.35
Ho 0.30 0.33 0.37 0.42 0.49 0.59 0.73 0.96 1.43 2.80 26.13
Er 0.90 1.00 1.12 1.28 1.48 1.78 2.21 2.93 4.36 8.59 82.08
Yb 0.80 0.89 1.00 1.14 1.33 1.59 1.98 2.63 3.94 7.82 76.40
Lu 0.10 0.11 0.12 0.14 0.17 0.20 0.25 0.33 0.49 0.98 9.55
Yb/Gd (melt) 0.28 0.28 0.28 0.28 0.28 0.29 0.29 0.30 0.30 0.32 0.36
Eu/Eu* (melt) 0.64 0.60 0.55 0.50 0.45 0.39 0.33 0.27 0.20 0.12 0.02
Zircon in equilibrium with model melt compositions
La 0.013 0.014 0.015 0.017 0.019 0.022 0.027 0.034 0.047 0.083 0.550
Ce 20.02 21.91 24.25 27.20 31.06 36.33 44.02 56.37 79.89 145.00 1050.45
Pr 0.107 0.117 0.129 0.145 0.166 0.195 0.237 0.304 0.433 0.791 5.860
Nd 1.74 1.91 2.12 2.38 2.73 3.20 3.90 5.02 7.17 13.20 100.14
Sm 3.04 3.35 3.73 4.22 4.86 5.75 7.06 9.20 13.36 25.29 210.32
Eu 0.85 0.87 0.89 0.92 0.95 0.99 1.04 1.10 1.20 1.39 2.25
Gd 23.20 25.59 28.55 32.33 37.31 44.20 54.40 71.08 103.64 197.46 1680.69
Tb 6.21 6.86 7.66 8.68 10.04 11.91 14.69 19.26 28.19 54.09 471.08
Dy 73 81 91 104 121 144 179 236 350 685 6396
Ho 24 27 30 34 39 47 58 77 114 224 2090
Er 122 136 152 174 202 241 300 398 593 1169 11 163
Yb 222 246 276 315 367 440 549 730 1090 2166 21 163
Lu 33 36 41 46 54 65 81 107 160 318 3104
Yb/Gd (zircon) 9.55 9.61 9.68 9.76 9.85 9.96 10.09 10.27 10.52 10.97 12.59
Eu/Eu* (zircon) 0.31 0.29 0.27 0.24 0.22 0.19 0.16 0.13 0.10 0.06 0.01
Table 6. Results of the plagioclase crystallization model, with REE concentrations of model melt compositions and the zircon composition in equilibrium with that melt

16
Lu et al.
Zircon fractionation (%) 0 0.2 0.4 0.6 0.8 1 1.2 1.4 1.6 1.8 2
F 1 0.998 0.996 0.994 0.992 0.99 0.988 0.986 0.984 0.982 0.98
Model melt compositions
La 27.40 27.45 27.51 27.57 27.62 27.68 27.73 27.79 27.85 27.90 27.96
Ce 55.60 55.67 55.74 55.81 55.89 55.96 56.03 56.10 56.18 56.25 56.32
Pr 6.20 6.21 6.22 6.24 6.25 6.26 6.27 6.29 6.30 6.31 6.32
Nd 22.60 22.64 22.68 22.73 22.77 22.81 22.85 22.90 22.94 22.98 23.03
Sm 3.80 3.80 3.80 3.80 3.81 3.81 3.81 3.81 3.81 3.81 3.82
Eu 0.70 0.70 0.70 0.70 0.70 0.70 0.70 0.70 0.70 0.70 0.70
Gd 2.90 2.86 2.82 2.78 2.74 2.70 2.66 2.63 2.59 2.55 2.52
Tb 0.30 0.29 0.28 0.27 0.26 0.25 0.24 0.23 0.22 0.21 0.20
Dy 1.60 1.46 1.34 1.22 1.12 1.02 0.93 0.85 0.78 0.71 0.65
Ho 0.30 0.26 0.22 0.19 0.16 0.14 0.12 0.10 0.08 0.07 0.06
Er 0.90 0.69 0.52 0.40 0.30 0.23 0.18 0.13 0.10 0.08 0.06
Yb 0.80 0.46 0.26 0.15 0.09 0.05 0.03 0.02 0.01 0.01 0.00
Lu 0.10 0.05 0.03 0.01 0.01 0.00 0.00 0.00 0.00 0.00 0.00
Yb/Gd (melt) 0.28 0.16 0.09 0.05 0.03 0.02 0.01 0.01 0.00 0.00 0.00
Eu/Eu* (melt) 0.64 0.65 0.65 0.66 0.66 0.67 0.67 0.67 0.68 0.68 0.69
Zircon in equilibrium with model melt compositions
La 0.013 0.013 0.013 0.013 0.013 0.013 0.013 0.013 0.013 0.013 0.013
Ce 20.02 20.04 20.07 20.09 20.12 20.15 20.17 20.20 20.22 20.25 20.28
Pr 0.107 0.107 0.107 0.107 0.107 0.108 0.108 0.108 0.108 0.109 0.109
Nd 1.74 1.74 1.75 1.75 1.75 1.76 1.76 1.76 1.77 1.77 1.77
Sm 3.04 3.04 3.04 3.04 3.04 3.05 3.05 3.05 3.05 3.05 3.05
Eu 0.85 0.85 0.85 0.85 0.85 0.85 0.85 0.85 0.85 0.85 0.85
Gd 23.20 22.88 22.56 22.24 21.93 21.62 21.32 21.02 20.72 20.43 20.14
Tb 6.21 5.97 5.74 5.52 5.30 5.09 4.90 4.70 4.52 4.34 4.17
Dy 73.44 67.13 61.34 56.05 51.20 46.77 42.71 38.99 35.60 32.49 29.65
Ho 24.00 20.49 17.49 14.92 12.72 10.85 9.25 7.88 6.71 5.72 4.86
Er 122.40 93.41 71.25 54.32 41.39 31.52 23.99 18.25 13.87 10.54 8.00
Yb 221.60 127.53 73.31 42.09 24.14 13.83 7.92 4.52 2.58 1.47 0.84
Lu 32.50 16.99 8.87 4.62 2.41 1.25 0.65 0.34 0.17 0.09 0.05
Yb/Gd (zircon) 9.55 5.57 3.25 1.89 1.10 0.64 0.37 0.22 0.12 0.07 0.04
Eu/Eu* (zircon) 0.31 0.31 0.31 0.32 0.32 0.32 0.32 0.33 0.33 0.33 0.33
Table 7. Results of the zircon crystallization model, with REE concentrations of model melt compositions and the zircon composition in equilibrium with that melt

17
GSWA Report 197 Zircon fingerprinting of magmatic–hydrothermal systems in the Archean Yilgarn Craton
Garnet fractionation (%)
0 5 10 15 20 25 30 35 40 45 50
F 1 0.95 0.9 0.85 0.8 0.75 0.7 0.65 0.6 0.55 0.5
Model melt compositions
La 27.40 28.83 30.41 32.18 34.17 36.42 38.99 41.96 45.41 49.50 54.39
Ce 55.60 58.36 61.41 64.81 68.63 72.93 77.84 83.48 90.02 97.72 106.92
Pr 6.20 6.45 6.72 7.01 7.34 7.71 8.12 8.59 9.13 9.75 10.48
Nd 22.60 22.77 22.96 23.15 23.36 23.58 23.83 24.09 24.38 24.69 25.04
Sm 3.80 3.12 2.54 2.04 1.62 1.26 0.97 0.73 0.54 0.38 0.27
Eu 0.70 0.48 0.32 0.21 0.13 0.08 0.05 0.03 0.02 0.01 0.00
Gd 2.90 1.55 0.80 0.40 0.19 0.09 0.04 0.02 0.01 0.00 0.00
Tb 0.30 0.12 0.05 0.02 0.01 0.00 0.00 0.00 0.00 0.00 0.00
Dy 1.60 0.52 0.16 0.05 0.01 0.00 0.00 0.00 0.00 0.00 0.00
Ho 0.30 0.09 0.02 0.01 0.00 0.00 0.00 0.00 0.00 0.00 0.00
Er 0.90 0.26 0.07 0.02 0.00 0.00 0.00 0.00 0.00 0.00 0.00
Yb 0.80 0.29 0.10 0.03 0.01 0.00 0.00 0.00 0.00 0.00 0.00
Lu 0.10 0.04 0.02 0.01 0.00 0.00 0.00 0.00 0.00 0.00 0.00
Yb/Gd (melt) 0.28 0.19 0.13 0.08 0.05 0.03 0.02 0.01 0.01 0.00 0.00
Eu/Eu* (melt) 0.64 0.66 0.68 0.71 0.73 0.76 0.79 0.82 0.86 0.90 0.95
Zircon in equilibrium with model melt compositions
La 0.013 0.013 0.014 0.015 0.016 0.017 0.018 0.019 0.021 0.023 0.025
Ce 20.02 21.01 22.11 23.33 24.71 26.26 28.02 30.05 32.41 35.18 38.49
Pr 0.107 0.111 0.115 0.121 0.126 0.133 0.140 0.148 0.157 0.168 0.180
Nd 1.74 1.75 1.77 1.78 1.80 1.82 1.83 1.85 1.88 1.90 1.93
Sm 3.04 2.50 2.03 1.63 1.29 1.01 0.78 0.58 0.43 0.31 0.21
Eu 0.85 0.58 0.39 0.25 0.16 0.10 0.06 0.03 0.02 0.01 0.00
Gd 23.20 12.40 6.41 3.19 1.52 0.69 0.30 0.12 0.05 0.02 0.00
Tb 6.21 2.55 1.00 0.37 0.13 0.04 0.01 0.00350 0.00087 0.00019 0.00004
Dy 73.44 24.06 7.42 2.14 0.57 0.14 0.03 0.00625 0.00109 0.00016 0.00002
Ho 24.00 7.00 1.91 0.48 0.11 0.02 0.005 0.0008 0.00011 0.00001 0.000001
Er 122.40 35.65 9.71 2.46 0.57 0.12 0.02 0.00388 0.00057 0.00007 0.00001
Yb 221.60 80.91 27.98 9.10 2.77 0.78 0.20 0.04686 0.00973 0.00176 0.00027
Lu 32.50 13.82 5.61 2.16 0.79 0.27 0.08 0.02470 0.00650 0.00152 0.00031
Yb/Gd (zircon) 9.55 6.52 4.36 2.85 1.82 1.13 0.67 0.39 0.21 0.11 0.06
Eu/Eu* (zircon) 0.31 0.32 0.33 0.34 0.35 0.36 0.38 0.40 0.41 0.43 0.46
Table 8. Results of the garnet crystallization model, with REE concentrations of model melt compositions and the zircon composition in equilibrium with that melt

18
Lu et al.
Fractionation (%) 0 5 10 15 20 25 30 35 40 45 50
F 1 0.95 0.9 0.85 0.8 0.75 0.7 0.65 0.6 0.55 0.5
Model melt compositions
La 27.40 28.20 29.06 30.00 31.04 32.18 33.44 34.86 36.45 38.27 40.36
Ce 55.60 56.10 56.64 57.21 57.82 58.48 59.19 59.97 60.81 61.75 62.79
Pr 6.20 6.48 6.80 7.14 7.53 7.97 8.46 9.03 9.68 10.44 11.35
Nd 22.60 22.20 21.78 21.34 20.89 20.43 19.94 19.42 18.88 18.32 17.71
Sm 3.80 3.57 3.35 3.13 2.91 2.70 2.48 2.27 2.07 1.86 1.66
Eu 0.70 0.68 0.67 0.65 0.63 0.62 0.60 0.58 0.56 0.54 0.52
Gd 2.90 2.68 2.46 2.25 2.05 1.86 1.67 1.49 1.31 1.15 0.99
Tb 0.30 0.31 0.33 0.34 0.36 0.38 0.40 0.42 0.45 0.48 0.52
Dy 1.60 1.46 1.32 1.19 1.06 0.95 0.83 0.73 0.63 0.54 0.45
Ho 0.30 0.31 0.33 0.35 0.36 0.39 0.41 0.44 0.47 0.51 0.55
Er 0.90 0.83 0.76 0.70 0.63 0.57 0.51 0.46 0.40 0.35 0.30
Yb 0.80 0.75 0.71 0.66 0.61 0.57 0.52 0.48 0.44 0.39 0.35
Lu 0.10 0.10 0.09 0.09 0.08 0.08 0.08 0.07 0.07 0.06 0.06
Yb/Gd (melt) 0.28 0.28 0.29 0.29 0.30 0.31 0.31 0.32 0.33 0.34 0.35
Eu/Eu* (melt) 0.64 0.68 0.71 0.75 0.79 0.84 0.90 0.96 1.04 1.13 1.23
Zircon in equilibrium with model melt compositions
La 0.013 0.013 0.013 0.014 0.014 0.015 0.015 0.016 0.017 0.018 0.019
Ce 20.02 20.20 20.39 20.59 20.82 21.05 21.31 21.59 21.89 22.23 22.60
Pr 0.107 0.112 0.117 0.123 0.130 0.137 0.146 0.155 0.166 0.180 0.195
Nd 1.74 1.71 1.68 1.64 1.61 1.57 1.54 1.50 1.45 1.41 1.36
Sm 3.04 2.86 2.68 2.50 2.33 2.16 1.99 1.82 1.65 1.49 1.33
Eu 0.85 0.84 0.82 0.80 0.77 0.75 0.73 0.71 0.68 0.66 0.63
Gd 23.20 21.43 19.71 18.04 16.42 14.86 13.35 11.90 10.51 9.19 7.93
Tb 6.21 6.47 6.75 7.07 7.42 7.81 8.25 8.75 9.33 9.99 10.78
Dy 73.44 66.87 60.58 54.58 48.86 43.42 38.28 33.43 28.89 24.64 20.70
Ho 24.00 25.10 26.32 27.67 29.18 30.88 32.80 35.00 37.54 40.52 44.05
Er 122.40 112.88 103.64 94.70 86.05 77.71 69.69 62.00 54.63 47.62 40.97
Yb 221.60 208.46 195.45 182.58 169.85 157.28 144.86 132.62 120.55 108.68 97.01
Lu 32.50 31.25 29.99 28.71 27.41 26.10 24.76 23.40 22.01 20.60 19.16
Yb/Gd (zircon) 9.55 9.73 9.92 10.12 10.35 10.59 10.85 11.14 11.47 11.83 12.24
Eu/Eu* (zircon) 0.31 0.33 0.34 0.36 0.38 0.41 0.43 0.46 0.50 0.54 0.59
Table 9. Results of the amphibole:apatite (99.8 : 0.2) crystallization model, with REE concentrations of model melt compositions and the zircon composition in equilibrium with that melt. The column in bold (40% crystallization) was the hypothetical melt used as starting composition for one plagioclase:apatite (98.7 : 1.3) fractionation (Table 10)

19
GSWA Report 197 Zircon fingerprinting of magmatic–hydrothermal systems in the Archean Yilgarn Craton
Fractionation (%) 0 10 20 30 40 50 60 70 80 90 99
F 1 0.9 0.8 0.7 0.6 0.5 0.4 0.3 0.2 0.1 0.01
Model melt compositions
La 36.45 37.84 39.45 41.36 43.68 46.60 50.43 55.84 64.47 82.42 186.37
Ce 60.81 62.36 64.13 66.20 68.67 71.71 75.62 80.98 89.17 105.15 181.82
Pr 9.68 9.72 9.77 9.82 9.88 9.95 10.04 10.15 10.32 10.61 11.62
Nd 18.88 18.65 18.39 18.10 17.77 17.38 16.93 16.36 15.58 14.34 10.89
Sm 2.07 2.01 1.94 1.87 1.78 1.69 1.59 1.46 1.30 1.07 0.55
Eu 0.56 0.53 0.50 0.47 0.43 0.40 0.36 0.31 0.25 0.18 0.06
Gd 1.31 1.22 1.12 1.02 0.91 0.80 0.68 0.55 0.41 0.25 0.05
Tb 0.45 0.43 0.41 0.39 0.37 0.34 0.32 0.28 0.24 0.19 0.08
Dy 0.63 0.63 0.63 0.63 0.62 0.62 0.62 0.62 0.61 0.60 0.58
Ho 0.47 0.48 0.49 0.50 0.51 0.53 0.55 0.57 0.61 0.69 1.00
Er 0.40 0.41 0.42 0.44 0.45 0.47 0.50 0.54 0.59 0.70 1.21
Yb 0.44 0.45 0.47 0.50 0.52 0.56 0.61 0.68 0.78 1.01 2.35
Lu 0.07 0.07 0.08 0.08 0.09 0.10 0.11 0.13 0.17 0.25 0.90
Yb/Gd (melt) 0.33 0.37 0.42 0.49 0.58 0.70 0.90 1.22 1.90 4.04 49.26
Eu/Eu* (melt) 1.04 1.04 1.04 1.04 1.04 1.05 1.05 1.05 1.05 1.06 1.08
Zircon in equilibrium with model melt compositions
La 0.017 0.017 0.018 0.019 0.020 0.021 0.023 0.026 0.030 0.038 0.086
Ce 21.89 22.45 23.09 23.83 24.72 25.82 27.22 29.15 32.10 37.85 65.46
Pr 0.166 0.167 0.168 0.169 0.170 0.171 0.173 0.175 0.177 0.182 0.200
Nd 1.45 1.44 1.42 1.39 1.37 1.34 1.30 1.26 1.20 1.10 0.84
Sm 1.65 1.60 1.55 1.49 1.43 1.35 1.27 1.17 1.04 0.85 0.44
Eu 0.68 0.65 0.61 0.57 0.53 0.48 0.43 0.38 0.31 0.22 0.07
Gd 10.51 9.75 8.95 8.13 7.28 6.38 5.44 4.42 3.30 2.00 0.38
Tb 9.33 8.95 8.56 8.13 7.66 7.14 6.55 5.86 5.02 3.84 1.58
Dy 28.89 28.83 28.77 28.71 28.63 28.54 28.42 28.28 28.08 27.74 26.64
Ho 37.54 38.20 38.95 39.81 40.83 42.08 43.65 45.76 48.92 54.82 80.04
Er 54.63 56.03 57.63 59.50 61.74 64.49 68.03 72.87 80.30 94.78 164.43
Yb 120.55 125.29 130.81 137.37 145.34 155.38 168.60 187.33 217.31 280.09 650.77
Lu 22.01 23.35 24.95 26.89 29.32 32.48 36.81 43.26 54.31 80.14 291.72
Yb/Gd (zircon) 11.47 12.86 14.61 16.89 19.97 24.34 31.02 42.40 65.86 139.84 1705.51
Eu/Eu* (zircon) 0.50 0.50 0.50 0.50 0.50 0.50 0.51 0.51 0.51 0.51 0.52
Table 10. Results of the plagioclase:apatite (98.7 : 1.3) crystallization model, using melt starting composition of the hypothetical melt after 40% crystallization of the amphibole:apatite (99.8 : 0.2) fractionation in Table 9

20
Lu et al.
Fractionation (%) 0 10 20 30 40 50 60 70 80 90 99
F 1 0.9 0.8 0.7 0.6 0.5 0.4 0.3 0.2 0.1 0.01
Model melt compositions
La 27.40 28.44 29.65 31.09 32.84 35.03 37.91 41.98 48.46 61.96 140.10
Ce 55.60 57.01 58.63 60.52 62.78 65.56 69.14 74.03 81.53 96.14 166.23
Pr 6.20 6.23 6.26 6.29 6.33 6.37 6.43 6.50 6.61 6.79 7.44
Nd 22.60 22.32 22.01 21.66 21.26 20.80 20.26 19.57 18.65 17.17 13.04
Sm 3.80 3.69 3.56 3.43 3.28 3.11 2.92 2.69 2.39 1.96 1.01
Eu 0.70 0.66 0.63 0.59 0.54 0.50 0.44 0.39 0.32 0.22 0.07
Gd 2.90 2.69 2.47 2.24 2.01 1.76 1.50 1.22 0.91 0.55 0.11
Tb 0.30 0.29 0.28 0.26 0.25 0.23 0.21 0.19 0.16 0.12 0.05
Dy 1.60 1.60 1.59 1.59 1.59 1.58 1.57 1.57 1.56 1.54 1.48
Ho 0.30 0.31 0.31 0.32 0.33 0.34 0.35 0.37 0.39 0.44 0.64
Er 0.90 0.92 0.95 0.98 1.02 1.06 1.12 1.20 1.32 1.56 2.71
Yb 0.80 0.83 0.87 0.91 0.96 1.03 1.12 1.24 1.44 1.86 4.32
Lu 0.10 0.11 0.11 0.12 0.13 0.15 0.17 0.20 0.25 0.36 1.33
Yb/Gd (melt) 0.28 0.31 0.35 0.41 0.48 0.59 0.75 1.02 1.58 3.36 41.03
Eu/Eu* (melt) 0.64 0.65 0.65 0.65 0.65 0.65 0.65 0.65 0.65 0.66 0.67
Zircon in equilibrium with model melt compositions
La 0.013 0.013 0.014 0.014 0.015 0.016 0.017 0.019 0.022 0.029 0.064
Ce 20.02 20.52 21.11 21.79 22.60 23.60 24.89 26.65 29.35 34.61 59.84
Pr 0.107 0.107 0.108 0.108 0.109 0.110 0.111 0.112 0.114 0.117 0.128
Nd 1.74 1.72 1.69 1.67 1.64 1.60 1.56 1.51 1.44 1.32 1.00
Sm 3.04 2.95 2.85 2.74 2.62 2.49 2.33 2.15 1.91 1.57 0.81
Eu 0.85 0.81 0.76 0.72 0.66 0.61 0.54 0.47 0.39 0.27 0.09
Gd 23.20 21.50 19.76 17.95 16.06 14.08 11.99 9.75 7.28 4.42 0.84
Tb 6.21 5.96 5.70 5.41 5.10 4.75 4.36 3.91 3.34 2.56 1.05
Dy 73.44 73.30 73.15 72.98 72.78 72.55 72.26 71.90 71.39 70.52 67.72
Ho 24.00 24.42 24.90 25.45 26.10 26.90 27.90 29.25 31.27 35.04 51.17
Er 122.40 125.52 129.11 133.30 138.31 144.48 152.40 163.26 179.89 212.34 368.38
Yb 221.60 230.32 240.46 252.51 267.17 285.62 309.93 344.36 399.47 514.87 1196.27
Lu 32.50 34.48 36.84 39.70 43.29 47.95 54.35 63.87 80.19 118.31 430.67
Yb/Gd (zircon) 9.55 10.71 12.17 14.07 16.64 20.28 25.84 35.32 54.87 116.49 1420.76
Eu/Eu* (zircon) 0.31 0.31 0.31 0.31 0.31 0.31 0.31 0.31 0.32 0.32 0.32
Table 11. Results of the plagioclase:apatite (98.7 : 1.3) crystallization model using melt starting composition of BODD-2 sample

21
GSWA Report 197 Zircon fingerprinting of magmatic–hydrothermal systems in the Archean Yilgarn Craton
ReferencesAlonso-Perez, R, Müntener, O and Ulmer, P 2009, Igneous garnet and
amphibole fractionation in the roots of island arcs: experimental constraints on andesitic liquids: Contributions to Mineralogy and Petrology, v. 157, p. 541–558.
Bachmann, O, Dungan, MA and Bussy, F 2005, Insights into shallow magmatic processes in large silicic magma bodies: the trace element record in the Fish Canyon magma body, Colorado: Contributions to Mineralogy and Petrology, v. 149, p. 338–349.
Ballard, JR, Palin, JM and Campbell, IH 2002, Relative oxidation states of magmas inferred from Ce(IV)/Ce(III) in zircon: Application to porphyry copper deposits of northern Chile: Contributions to Mineralogy and Petrology, v. 144, p. 347–364.
Barley, ME 1982, Porphyry-style mineralization associated with early Archaean calc-alkaline igneous activity, eastern Pilbara, western Australia: Economic Geology, v. 77, p. 1230–1236.
Bell, EA, Boehnke, P and Harrison, TM 2016, Recovering the primary geochemistry of Jack Hills zircons through quantitative estimates of chemical alteration: Geochimica et Cosmochimica Acta, v. 191, p. 187–202.
Blevin, PL 2004, Redox and compositional parameters for interpreting granitoid metallogeny of eastern Australia: implications for gold-rich ore systems: Resource Geology, v. 54, p. 241–252.
Brett, JW 2019, 400 m Bouguer gravity merged grid of Western Australia 2019 version 1: Geological Survey of Western Australia, <www.dmp.wa.gov.au/geophysics>.
Bouvier, A, Ushikubo, T, Kita, NT, Cavosie, AJ, Kozdon, R and Valley, JW 2012, Li isotopes and trace elements as a petrogenetic tracer in zircon: Insights from Archean TTGs and sanukitoids: Contributions to Mineralogy and Petrology, v. 163, p. 745–768.
Burnham, CW, 1979, Magmas and hydrothermal fluids, in Geochemistry of hydrothermal ore deposits edited by HL Barnes: New York, Wiley, p. 71–136.
Burnham, AD and Berry, AJ 2012, An experimental study of trace element partitioning between zircon and melt as a function of oxygen fugacity: Geochimica et Cosmochimica Acta, v. 95, p. 196–212.
Burnham, AD and Berry, AJ 2014, The effect of oxygen fugacity, melt composition, temperature and pressure on the oxidation state of cerium in silicate melts: Chemical Geology, v. 366, p. 52–60.
Burnham, AD, Berry, AJ, Halse, HR, Schofield, PF, Cibin, G and Mosselmans, JFW 2015, The oxidation state of Eu in silicate melts as a function of oxygen fugacity, composition and temperature: Chemical Geology, v. 411, p. 248–259.
Burnham, AD and Berry, AJ 2017, Formation of Hadean granites by melting of igneous crust: Nature Geoscience, v. 10, p. 457–461.
Chiaradia, M, Ulianov, A, Kouzmanov, K and Beate, B 2012, Why large porphyry Cu deposits like high Sr/Y magmas?: Scientific Reports 2, no. 685, 7p., doi:10.1038/srep00685.
Claiborne, LL, Miller, CF and Wooden, JL 2010, Trace element composition of igneous zircon: a thermal and compositional record of the accumulation and evolution of a large silicic batholith, Spirit Mountain, Nevada: Contributions to Mineralogy and Petrology, v. 160, p. 511−531.
Cooke, DR, Hollings, P and Walshe, JL 2005, Giant porphyry deposits: characteristics, distribution and tectonic controls: Economic Geology, v. 100, p. 801–818.
Dilles, JH, Kent, AJR, Wooden, JL, Tosdal, RM, Koleszar, A, Lee, RG and Farmer, LP 2015, Zircon compositional evidence for sulfur-degassing from ore-forming arc magmas: Economic Geology, v. 110, p. 241–251.
Dunn, T and Sen, C 1994, Mineral/matrix partition coefficients for orthopyroxene, plagioclase, and olivine in basaltic to andesitic systems: a combined analytical and experimental study: Geochimica et Cosmochimica Acta, v. 58, p. 717–733.
Fayol, N and Jebrak, M 2017, Archean sanukitoid gold porphyry deposits: A new understanding and genetic model from the Lac Bachelor gold deposit, Abititi, Canada: Economic Geology, v. 112, p. 1913–1936.
Helt, KM, Williams-Jones, AE, Clark, JR, Wing, BA and Wares, RP 2014, Constraints on the genesis of the Archean oxidized, intrusion-related Canadian Malartic gold deposit, Quebec, Canada: Economic Geology, v. 109, p. 713–735.
Hronsky, JMA, Groves, DI, Loucks, RR and Begg, GC 2012, A unified model for gold mineralization in accretionary orogens and implications for regional-scale exploration targeting methods: Mineralium Deposita, v. 47, p. 339–358.
Jackson, SE, Pearson, NJ, Griffin, WL and Belousova, EA 2004, The application of laser ablation-inductively coupled plasma-mass spectrometry to in situ U/Pb zircon geochronology: Chemical Geology, v. 211, p. 47–69.
Jochum, KP, Nohl, U, Herwig, K, Lammel, E, Stoll, B and Hofmann, AW 2005, GeoReM: A new geochemical database for reference materials and isotopic standards: Geostandards and Geoanalytical Research, v. 29, p. 333–338.
Johnson, TE, Gardiner, NJ, Miljkovic, K, Spencer, CJ, Kirkland, CL, Bland, PA and Smithies, H 2018, An impact melt origin for Earth’s oldest known evolved rocks: Nature Geoscience, v. 11, p. 795–799.
Klein, M, Stosch, HG and Seck, HA 1997, Partitioning of high field-strength and rare earth elements between amphibole and quartz-tonalitic melts: an experimental study: Chemical Geology, v. 138, p. 257–271.
Kylander-Clark, ARC, Hacker, BR and Cottle, JM 2013, Laser-ablation split-stream ICP petrochronology: Chemical Geology, v. 345, p. 99–112.
Large, SJE, van Quadt, A, Wotzlaw, J, Guillong, M and Heinrich, CA 2018, Magma evolution leading to porphyry Au–Cu mineralization at the OK Tedi deposit, Papua New Guinea: Trace element geochemistry and high-precision geochronology of igneous zircon: Economic Geology, v. 113, p. 39–61.
Lee, RG, Dilles, JH, Tosdal, RM, Wooden, JL and Mazdab, FK 2017, Magmatic evolution of granodiorite intrusions at the El Salvador porphyry copper deposit, Chile, based on trace element composition and U/Pb age of zircons: Economic Geology, v. 112, p. 245–273.
Lin, S and Beakhouse, GP 2013, Synchronous vertical and horizontal tectonism at late stages of Archean cratonization and genesis of Hemlo gold deposit, Superior Craton, Ontario, Canada: Geology, v. 41, p. 359–362.
Loader, MA, Wilkinson, JJ and Armstrong, RN 2017, The effect of titanite crystallisation on Eu and Ce anomalies in zircon and its implications for the assessment of porphyry Cu deposit fertility: Earth and Planetary Science Letters, v. 472, p. 107–119.
Loucks, RR 2014, Distinctive composition of copper-ore-forming arc magmas: Australian Journal of Earth Sciences, v. 61, p. 5–16.
Loucks, RR, Fiorentini, ML and Rohrlach, BD, 2018, Divergent T-fO2 paths during crystallization of H2O-rich and H2O-poor magmas as recorded by Ce and U in zircon, with implications for TitaniQ and TitaniZ geothermometry: Contributions to Mineralogy and Petrology, v. 173, no. 104, doi:org/10.1007/s00410-018-1529-3.
Lu, Y, Fielding, IOH and Wingate, MTD 2019, Introduction to geochronology information 2019, in Compilation of geochronology information, 2019: Geological Survey of Western Australia, digital data package, 8p.
Lu, Y, Loucks, RR, Fiorentini, ML, Yang, Z-M and Hou, Z-Q 2015, Fluid flux melting generated post-collisional high-Sr/Y copper-ore-forming water-rich magmas in Tibet: Geology, v. 43, p. 583–586.
Lu, Y, Loucks, RR, Fiorentini, ML, McCuaig, TC, Evans, NJ, Yang, ZM, Hou, ZQ, Kirkland, CL, Parra-Avila, LA and Kobussen, A 2016, Zircon compositions as a pathfinder for porphyry Cu ± Mo ± Au deposits: Society of Economic Geologists Special Publication 19, p. 329–347.

22
Lu et al.
McCuaig, TC, Behn, M, Stein, S, Hagemann, SG, McNaughton, NJ, Cassidy, KF, Champion, DC and Wyborn, LAI 2001, The Boddington gold mine: A new style of Archean Au–Cu deposit, in 4th International Archean Symposium, Extended Abstracts edited by KF Cassidy, JM Dunphy MJ and Van Kranendonk: AGSO Record 2001/37, p. 453–455.
McCuaig, TC and Hronsky, JMA 2014, The mineral system concept: The key to exploration targeting: Society of Economic Geologists Special Publication 18, p. 153–175.
Moore, G and Carmichael, ISE 1998, The hydrous phase equilibria (to 3 kbar) of an andesite and basaltic andesite from western Mexico: constraints on water content and conditions of phenocryst growth: Contributions to Mineralogy and Petrology, v. 130, p. 304–319.
Moyen, JF and Martin, H 2012, Forty years of TTG research: Lithos, v. 148, p. 312–336.
Mueller, AG, Hall, GC, Nemchin, AA, Stein, HJ, Creaser, RA and Mason, DR 2008, Archean high-Mg monzodiorite–syenite, epidote skarn, and biotite–sericite gold lodes in the Granny Smith–Wallaby district, Australia: U–Pb and Re–Os chronometry of two intrusion-related hydrothermal systems: Mineralium Deposita, v. 43, p. 337– 362.
Naney, MT, 1983, Phase equilibria of rock-forming ferromagnesian silicates in granitic systems: American Journal of Science, v. 283, p. 993–1033.
Outhwaite, MD 2018, Metamorphosed Mesoarchean Cu– Mo– Ag mineralization: evidence from the Calingiri deposits, southwest Yilgarn Craton: Geological Survey of Western Australia, Report 183, 216p.
Paton, C, Hellstrom, J, Paul, B, Woodhead, J and Hergt, J 2011, Iolite: Freeware for the visualization and processing of mass spectrometer data: Journal of Analytical Atomic Spectrometry, v. 26, p. 2508–2518.
Pawley, MJ, Wingate, MTD, Kirkland, CL, Wyche, S, Hall, CE, Romano, SS and Doublier, MP 2012, Adding pieces to the puzzle: episodic crustal growth and a new terrane in the northeast Yilgarn Craton, Western Australia: Australian Journal of Earth Sciences, v. 59, p. 603–623.
Percival, JA, Sanborn-Barrie, M, Skulski, T, Stott, GM, Helmstaedt, H and White, DJ 2006, Tectonic evolution of the western Superior Province from NATMAP and Lithoprobe studies: Canadian Journal of Earth Sciences, v. 43, p. 1085–1117.
Reimink, JR, Chacko, T, Stern, RA and Heaman, LM 2014, Earth’s earliest evolved crust generated in an Iceland-like setting: Nature Geoscience, v. 7, p. 529–533.
Richards, JP 2011, High Sr/Y arc magmas and porphyry Cu ± Mo ± Au deposits: Just add water: Economic Geology, v. 106, p. 1075–1081.
Rohrlach, BD and Loucks, RR 2005, Multi-million-year cyclic ramp-up of volatiles in a lower crustal magma reservoir trapped below the Tampakan copper–gold deposit by Mio–Pliocene crustal compression in the southern Philippines, in Super porphyry copper and gold deposits—a global perspective edited by TM Porter: PCG Publishing, Adelaide, v. 2, p. 369–407.
Samperton, KM, Bell, EA, Barboni, M, Keller, CB and Schoene, B 2017, Zircon age–temperature–compositional spectra in plutonic rocks: Geology, v. 45, p. 983–986.
Sano, Y, Terada, K and Fukuoka, T 2002, High mass resolution ion microprobe analysis of rare earth elements in silicate glass, apatite and zircon: lack of matrix dependency: Chemical Geology, v. 184, p. 217–230.
Sillitoe, RH 2010, Porphyry copper systems: Economic Geology, v. 105, p. 3–41.
Sinclair, WD 2007, Porphyry deposits, in Mineral Deposits of Canada: A Synthesis of Major Deposit-Types, District Metallogeny, the Evolution of Geological Provinces, and Exploration Methods edited by WD Goodfellow: Geological Association of Canada, Mineral Deposits Division, Special Publication no. 5, p. 223–243.
Smythe, DJ and Brenan, JM 2015, Cerium oxidation state in silicate melts: Combined ƒO2, temperature and compositional effects: Geochimica et Cosmochimica Acta, v. 170, p. 173–187.
Smythe, DJ and Brenan, JM 2016, Magmatic oxygen fugacity estimated using zircon–melt partitioning of cerium: Earth and Planetary Science Letters, v. 453, p. 260–266.
Stein, HJ, Barley, ME, Zimmerman, A and Cummins, B 2007, A 3.3 Ga Mo–Cu porphyry-style deposit at Spinifex Ridge, East Pilbara, Western Australia: Re–Os dating of Paleoarchean molybdenite: Goldschmidt Conference Abstract, A970, Goldschmidt 2007, Cologne, Germany, 19–24 August 2007.
Stein, HJ, Hannah, JL, Zimmerman, A, Markey, RJ, Sarkar, SC and Pal, AB 2004, A 2.5 Ga porphyry Cu–Mo–Au deposit at Malanjkhand, central India: implications for Late Archean continental assembly: Precambrian Research, v. 134, p. 189–226.
Stern, RA, Bodorkos, S, Kamo, SL, Hickman, AH and Corfu, F 2009, Measurement of SIMS instrumental mass fractionation of Pb isotopes during zircon dating: Geostandards and Geoanalytical Research, v. 33, p. 145–168.
Sun, S-S and McDonough, WF 1989, Chemical and isotopic systematics of oceanic basalts: implications for mantle compositions and processes, in Magmatism In Ocean Basins edited by AD Saunders and MJ Norry: Geological Society of London, Special Publicaiton, v. 42, p. 313–345.
Wiedenbeck M, Allé P, Corfu F, Griffin WL, Meier M, Oberli F, von Quadt A, Roddick JC and Spiegel W 1995, Three natural zircon standards for U–Th–Pb, Lu–Hf, trace element and REE analyses: Geostandards Newsletter, v. 19, p. 1–23.
Williamson, BJ, Herrington, RJ and Morris, A 2016, Porphyry copper enrichment linked to excess aluminium in plagioclase: Nature Geoscience, v. 9, p. 237–241.
Witt, W, Cassidy, K, Lu, Y-J and Hagemann, S 2018, Syenitic group intrusions of the Archean Kurnalpi Terrane, Yilgarn Craton: Hosts to ancient alkali porphyry gold deposits?: Ore Geology Reviews, v. 96, p. 262–268.

ZIRCON FINGERPRINTING OF MAGM
ATIC–HYDROTHERMAL
SYSTEMS IN THE ARCHEAN YILGARN CRATON
REPORT 197LU et al.
Further details of geoscience products are available from:
Information Centre Department of Mines, Industry Regulation and Safety 100 Plain Street EAST PERTH WA 6004 Phone: (08) 9222 3459 Fax: (08) 9222 3444www.dmp.wa.gov.au/GSWApublications
This Report presents the results of the first craton-wide study to systematically examine zircons from granitic rocks in the Archean Yilgarn Craton as potential metallogenic fertility indicators of Archean magmatic–hydrothermal systems. The fertile granitic rocks from the Calingiri Cu–Mo and Boddington Au–Cu–Mo deposits in the Yilgarn Craton show distinctly higher zircon Eu anomaly values (Eu/Eu*>0.4), which are mainly due to amphibole-dominated fractionation in hydrous melts, similar to Phanerozoic fertile granitic rocks. By contrast, the barren granitic rocks from across the Yilgarn Craton display lower zircon Eu/Eu* values (Eu/Eu*<0.4) and plagioclase-dominated fractionation. These results suggest that the zircon Eu anomaly and trace element ratios can be used to distinguish fertile from barren granitic rocks in Archean and Phanerozoic terranes, providing an effective geochemical exploration tool to assess the metallogenic fertility of granitic rocks over geological time.