rep 5 repnet manual - university of calgary in albertapages.cpsc.ucalgary.ca/~gaines/manuals/rep 5...
TRANSCRIPT

Rep 5 Conceptual Representation Software
RepNet Manual for Version 1.0
March 2010
Copyright © 2010, Brian R Gaines and Mildred L G Shaw Centre for Person-Computer Studies
3635 Ocean View, Cobble Hill, BC V0R 1L1, Canada mailto:[email protected]
http://repgrid.com

Contents 1 RepNet visual language for construct networks.............................................................................................. 1-1
1.1 Net syntax of node and line types......................................................................................................... 1-1
2 Creating and editing nets ................................................................................................................................ 2-1 2.1 Entering nodes ...................................................................................................................................... 2-1 2.2 Selecting, positioning and deleting....................................................................................................... 2-2 2.3 Entering and deleting lines ................................................................................................................... 2-3 2.4 Editing and resizing individual nodes................................................................................................... 2-4 2.5 Editing the state of individual nodes .................................................................................................... 2-4 2.6 Enclosure nodes .....................................................................................................................................2-?
3 Copy/paste and drag/drop ............................................................................................................................... 3-1 3.1 Copy and paste...................................................................................................................................... 3-1 3.2 Drag and drop ....................................................................................................................................... 3-1 3.3 Dragging files to a net........................................................................................................................... 3-1
4 Contextual menus............................................................................................................................................ 4-1 4.1 Contextual menu when cursor is over a node....................................................................................... 4-1 4.2 Contextual menu when cursor is outside a node .................................................................................. 4-2 4.3 Graphic layers in a net .......................................................................................................................... 4-4
5 Net syntax and appearance defining and editing ............................................................................................ 5-1 5.1 Lines ..................................................................................................................................................... 5-1 5.2 States..................................................................................................................................................... 5-2 5.3 Background........................................................................................................................................... 5-2 5.4 Nodes .................................................................................................................................................... 5-2 5.5 Color selection ...................................................................................................................................... 5-3
6 Printing and saving nets .................................................................................................................................. 6-1 6.1 Printing nets .......................................................................................................................................... 6-1 6.2 Saving nets............................................................................................................................................ 6-2
7 Integration with other applications ................................................................................................................. 7-1 7.1 Integration between RepGrid and RepNet ............................................................................................ 7-1 7.2 Grid analyses in RepNet........................................................................................................................ 7-2 7.3 Changing the color scheme of RepGrid analyses within RepNet ......................................................... 7-3 7.4 Integration of RepGrid and RepNet with other applications ................................................................ 7-4 7.5 Integration with web browsers—accessing URL’s by clicking nodes ................................................. 7-4 7.6 Integration with web servers—saving images and web maps .............................................................. 7-5 7.7 Monitoring and managing research projects and programs in RepNet ................................................. 7-5
8 References....................................................................................................................................................... 8-1

1-1
1 RepNet visual language for construct networks The RepNet tool in Rep 5 allows visual languages to be specified and representations within those languages to be constructed, edited and programmed to support user interaction. RepNet may be used on its own for entering, editing and sharing graphic representations of construct networks, and also in conjunction with RepGrid, for example in element elicitation. The content of nodes in nets may be dragged to RepGrid panes to become elements or construct poles (as can text from documents), and vice versa. In addition, RepGrid graphic analyses are output as RepNet nets which allows them to be edited in RepNet and stored as editable graphics. The theory and application of a wide variety of construct representation techniques is described in the literature on argument forms, entailment meshes, bond graphs, concept maps, petrinets, influence diagrams, causal maps, belief nets, semantic networks and so on (Toulmin, 1958; Pask, 1976; Blundell, 1982; Novak and Gowin, 1984; Reisig, 1985; Oliver and Smith, 1990; Sowa, 1991; Lehmann, 1992; Mintzes, Wandersee and Novak, 1998; Novak, 1998; Mintzes, Wandersee and Novak, 2000; Bryson, Ackermann, Eden and Finn, 2004). Nets and grids are complementary constructivist techniques, and may be used together to help people to explore their ideas about a topic, make them more explicit and discuss them with others (Gaines and Shaw, 1994; Gaines and Shaw, 1995).
1.1 Net syntax of node and line types Nets consist of nodes which may be joined by lines. Each node has a named type which determines the appearance of nodes of that type, a textual label which names it and is generally displayed, a textual note which annotates them and is not generally displayed, and a state indicated by a visual marker. The label or note, or both, may be an empty string. Lines between nodes may be decorated in various ways, usually as directed arrows. The collection of node and line types available provide a syntax in which can be represented the semantics of the kind of net that can be drawn. Here are some examples of constructions from the literature visually represented in RepNet. First, below is a Toulmin-style “argument diagram” in a net syntax having six types of nodes: ‘Grounds,’ ‘Modality,’ ‘Claim,’ ‘Backing,’ ‘Warrant’ and ‘Rebuttal.
RepNet “argument diagram” example from Toulmin (1958)

1-2
Second, below is a Novak-style “concept map” in a net syntax having three types of nodes: ‘Ideas’ as text with an oval surround, ‘Examples’ of them as text with a rectangular surround and ‘Link’ labels as text without a surround that labels the link between nodes formed by two lines.
RepNet “concept map” example from Novak and Gowin (1984)
Third, below is a “semantic network” for an ontology of family relationships (Donini, 2003) in a net supporting a visual language for description logics (Gaines, 2009). The node types used are ovals for concepts, rectangles for cardinality constraints and unenclosed text for relations. The arrow types used signify “defined by” or “defined by opposite” if there is a cross mark.
RepNet “semantic network” for a family ontology

1-3
Fourth, below is a “construct net” frame structure (Gaines, 2009) representing the conceptual dimensions of art objects as defined by Gaut (2000; 2005). Just one node type is used to represent a templet that might be fitted to experience, and two arrows signifying either “entails” or “opposite” if there is a cross mark.
aesthetics
emotion
complexity coherence individuality skillintellect
emotion
imagination
imagination
complexitycoherence
skill
complexmeaning
showingindividuality
intention
art form
art form
individuality
meaning
coherentcreative
high skillestablished
form
intend tocreate art
complexform
challenging
expressive
aestheticallypositive
aesthetics
intellect
meaning
ideal artobject
artobject
intention
aestheticallypositive
aestheticallynegative
expressive unexpressive
challenging unchallenging
complexform
simpleform coherent incoherent
creative uncreative
high skill low skill
complexmeaning
simplemeaning
showingindividuality
lackingindividuality
establishedform
unestablishedform
intend tocreate art
otherintention
RepNet “construct net” for contact lens prescription
Fifth, below is a “construct net” frame structure representing an expert system solution to a contact less prescription problem that has been used as a standard test case in the artificial intelligence literature (Cendrowska, 1987). An additional rectangular node type is used to indicate a link to grid data for testing anticipatory inference. A RepScript program that supports interaction with such construct nets and inference based on them can be used to infer the appropriate prescription based on the way in which a client is construed in terms of the constructs. It can also check the inferences for sets of test cases held in grids.

1-4
none
hypermetrope
softsoft prescribesoft 1
normal
prescribehard 1
none none
myope
astigmaticnot
presbyopic
hard
young
normal
presbyopic
normal
hard
normal
prescribehard 2
young
exceptionhard
astigmatic
old
hypermetropemyope
Schemata
prescribesoft 2
prescribenone
none lens
soft
pre-presbyopic
presbyopia prescriptionastigmatism
oldnotpresbyopic
myopia
astigmatic notastigmatic
myope hypermetrope
reducednormal
presbyopic
contact lensclient
reduced
hard
astigmatic
prescribesoft 2
prescribesoft 1
prescribehard 1
prescribehard 2
prescribenone
prescriptiontearproduction
astigmatism presbyopiamyopia
Frame
notastigmatic
exceptionsoft
notastigmatic
Grids oftest cases
tearproduction
notastigmatic
Constructs
GridContactLensCategories
GridContactLensRatings
exceptionhard
exceptionsoft
RepNet “construct net” for contact lens prescription
2-1
2 Creating and editing nets This section is concerned with creating and editing nets when a specific syntax of node and lines types has already been specified. RepNet keeps track of all the operations that change nets and supports multi-level undo by the “Undo” item at the top of the “Edit” menu (CMD-Z).
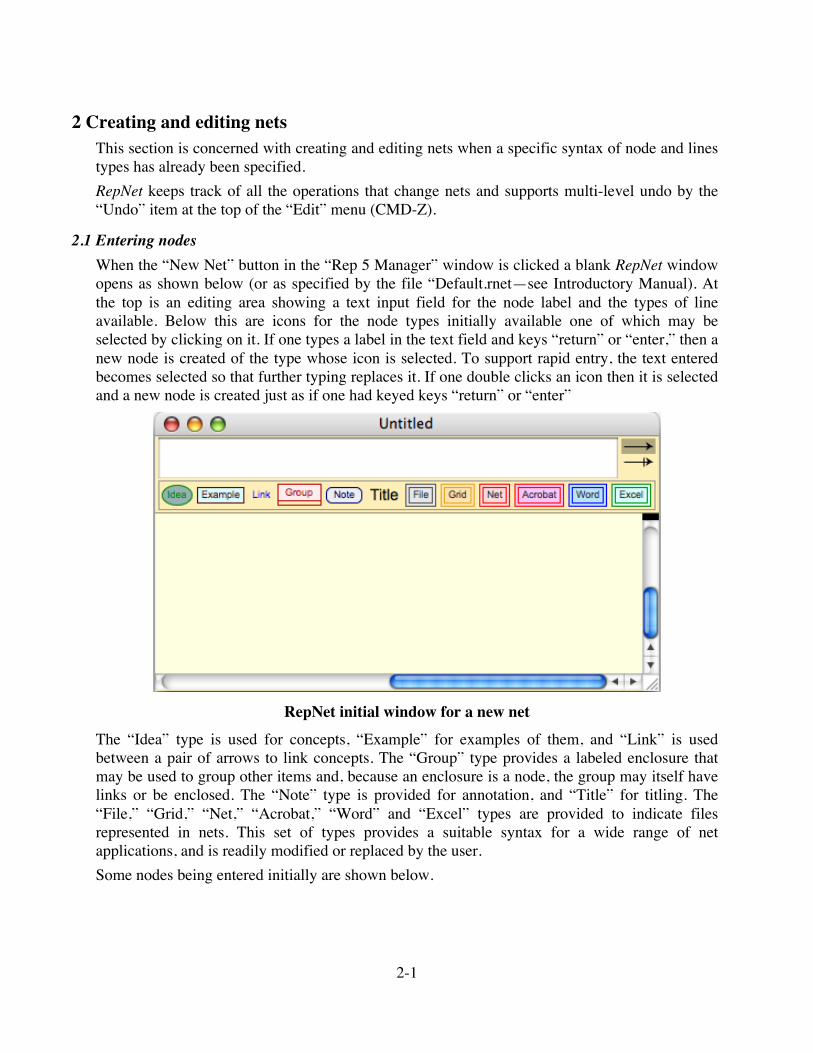
2.1 Entering nodes When the “New Net” button in the “Rep 5 Manager” window is clicked a blank RepNet window opens as shown below (or as specified by the file “Default.rnet—see Introductory Manual). At the top is an editing area showing a text input field for the node label and the types of line available. Below this are icons for the node types initially available one of which may be selected by clicking on it. If one types a label in the text field and keys “return” or “enter,” then a new node is created of the type whose icon is selected. To support rapid entry, the text entered becomes selected so that further typing replaces it. If one double clicks an icon then it is selected and a new node is created just as if one had keyed keys “return” or “enter”
RepNet initial window for a new net
The “Idea” type is used for concepts, “Example” for examples of them, and “Link” is used between a pair of arrows to link concepts. The “Group” type provides a labeled enclosure that may be used to group other items and, because an enclosure is a node, the group may itself have links or be enclosed. The “Note” type is provided for annotation, and “Title” for titling. The “File,” “Grid,” “Net,” “Acrobat,” “Word” and “Excel” types are provided to indicate files represented in nets. This set of types provides a suitable syntax for a wide range of net applications, and is readily modified or replaced by the user. Some nodes being entered initially are shown below.

2-2
RepNet nodes being entered
The label text is wrapped automatically to be enclosed in a rectangle with its width about forty per cent more than its height, and the surrounding shape specified by the node type is fitted around this. You can take control of the wrapping by inserting a SHIFT-return character at places where you want to break the line. You can specify an unbroken line by putting a SHIFT-return character at the end of it.
2.2 Selecting, positioning and deleting Nodes may be selected by clicking in them, and are then highlighted to show they have been selected. Multiple selections may be made by holding down the SHIFT key while clicking. All nodes may be selected through “Select All” on the “Edit” menu or keying CMD-A. A set of contiguous nodes may be selected by clicking outside them to draw a temporary “selection rectangle” around them as shown below.
Selection rectangle being used to select enclosed nodes

2-3
A node may be repositioned by clicking in it and dragging it to a new position. All the selected nodes may be repositioned together by clicking and dragging one while holding down the “shift” key to prevent the other nodes from being deselected. Nodes may be deleted by pressing the “delete” or “backspace” key after selecting them.
2.3 Entering and deleting lines As shown below, as the mouse is used to move the cursor across a node, the cursor changes shape to indicate what action may be performed by clicking and dragging. In the center it becomes a hand to indicate that the node can be grabbed and repositioned. At the right edge of a node it becomes a line (with an arrow head or other decoration if appropriate) to indicate that a line may be drawn from that node to another. At the left edge of a node it becomes an eraser to indicate that the same action will erase any line drawn.
Hand, line and eraser cursors with the mouse at different positions over a node
Clicking in the node when the cursor indicates a line and dragging to another node until the cursor changes to a star indicating the second node has been detected enters a line connecting the two nodes. Below is shown a line in process of being drawn between the nodes labeled “water” and “changes.”
Lines with arrowheads being entered
Note that “changes” is essentially a link label for the link between the idea of “water” and that of “states.” RepNet supports the labeling of links between concepts by treating the link label as a node in its own right. This is the most general and flexible way of supporting link labels (and bipartite graphs), enabling links to have types if appropriate, and several links to share the same label if appropriate. As shown below where “can be” and “as in” are used as shared labels this facility avoids the duplication of link labels and simplifies and clarifies the meaning of the net.

2-4
solid gas liquid
icesteam fog
snowlake
can be
as inas in as in
states
A node “link” type being used to support shared link labels
RepNet supports several styles of line and, if more than one is available, buttons appear at the top right of the edit area allowing the style of line to be selected as shown below where a line without arrow heads has been selected.
Selection of style of a line
Clicking in a line style button selects it, and the cursor will show the line style when at the right edge of a node. Dragging from one node to another as described above enters a line based on the selected line style. Lines are drawn from one of eight positions around a node that are selected automatically to minimize the length of the line and to ensure that it is always in the direction of the relative positions of the node. When nodes are dragged its lines are recomputed automatically, and when a node is deleted its lines are also deleted. A line between nodes may be over-written by entering a line with a different style. A line between nodes may be erased by dragging the eraser symbol between the nodes.
2.4 Editing and resizing individual nodes A node may be opened for editing in the edit area by double-clicking in it. This changes the background color of the node to a distinctive shade, opens the editing area if it is closed, selects the appropriate node type icon and displays the node label in the text input field. The editing area normally shows three panels that may also be exposed by dragging the dark rectangle on the right down. The top one allows a node label to be entered or edited and a line type to be selected; the second a node type to be selected; and the third allows a hidden note associated with a node to be entered or edited. This note may be entered or edited in the same way as the label. One use for the note field is to store the URL of a document that will be accessed when the node is clicked with the net locked (Section 7.5). The type, label or note may be changed as required and then pressing the “return” or “enter” key will update the node appropriately.

2-5
RepNet editing panes after the node “water” was double-clicked
When a node is open for editing it may also be changed in size. As shown above the cursor changes to a pair of resizing arrows as the mouse approaches the corner of a node. Clicking and dragging then resizes the node from that corner leaving the diagonally opposite corner fixed and the label centered in the node.
Clicking and dragging to resize a node
When the cursor is released the links to other nodes rejoin appropriately.
Lines rejoined after node has been resized
When editing is complete the editing area may be covered by clicking in the dark rectangle at the top of the vertical scroll bar on the right of the net window and dragging it upwards. This drags the net up to cover the edit area, and it may be dragged down again at any time to expose the edit area. When a normal net file is opened from a file the edit area is covered, and when a new net is

2-6
created by opening a “master” file (Section 6.2) or clicking on the “New Net” button the edit area is partially exposed.
2.5 Editing the state of individual nodes Each node also has an individual state indicated by a named style and eight binary flags that can be on or off. These are normally set through scripts to indicate the outcome of some processing activity, but they may also be edited manually. As shown below, dragging the black marker to the right down further exposes a fourth editing panel that enables the state of the open node to be edited. The panel provides a popup menu for the style, a check box for each flag, and a ninth check box that offers a convenient way to set all the flags to their off state.
Lines rejoined after node has been resized
The popup menu on the left selects a style specifying a solid color and a fill color. The eight check boxes specify flags with visual indicators, the first seven of which are in the solid color and the eight in the fill color: a vertical line across the node; a horizontal line across the node; a back diagonal line across the node; a forward diagonal line across the node; a central dot in the node; an annulus around the node; the node frame and the node fill. An example of a marked node is shown below.
A node with state flags set
The flags are usually set programmatically through associated scripts and used for a variety of purposes dependent on the application, for example, in anticipatory inference from construct nets to indicate that a node representing a templet is asserted or inferred to fit, or not to fit, a situation. An example of using scripted node states to indicate the results of inference is shown below.

2-7
none
hypermetrope
softsoft prescribesoft 1
normal
prescribehard 1
none none
myope
astigmaticnot
presbyopic
hard
young
normal
presbyopic
normal
hard
normal
prescribehard 2
young
exceptionhard
astigmatic
old
hypermetropemyope
Schemata
prescribesoft 2
prescribenone
none lens
soft
pre-presbyopic
presbyopia prescriptionastigmatism
oldnotpresbyopic
myopia
astigmatic notastigmatic
myope hypermetrope
reducednormal
presbyopic
contact lensclient
reduced
hard
astigmatic
prescribesoft 2
prescribesoft 1
prescribehard 1
prescribehard 2
prescribenone
prescriptiontearproduction
astigmatism presbyopiamyopia
Frame
notastigmatic
exceptionsoft
notastigmatic
Grids oftest cases
tearproduction
notastigmatic
Constructs
GridContactLensCategories
GridContactLensRatings
exceptionhard
exceptionsoft
RepNet “construct net” for contact lens prescription with states set to show inferences
A vertical bar in a node indicates that the templet represented by that node fits the experience under consideration, a horizontal bar that it does not. Green bars represent the original construction of the experience. Other colors represent anticipatory inferences based on the past experience represented by the seven schemata in the bottom half of the net. Blue indicates inference by superordination, red by opposition, black by subordination from a templet that does not fit (irrelevancy). Turquoise represents inference by abduction from experience, that one of the experiential schemata must fit the experience under consideration.
2.5 Enclosure nodes One of the possible node types supported by RepNet is an ‘enclosure node’ where a node can act as a container for other nodes. An enclosure node is created in the normal way, but it takes account of any selected nodes and positions itself to contain them. When it is dragged to a different position it repositions the enclosed nodes. Lines may be drawn between an enclosure node and other nodes in the normal way. The “Group” node type in the default syntax for nets is an enclosure, and its application is illustrated below.

2-8
Enclosure nodes used to group other nodes
Enclosure nodes may be resized even when they are not open for editing. The cursor changes to a double arrow symbol at each corner of and enclosure node, and clicking and dragging may be used to resize the node.

3-1
3 Copy/paste and drag/drop
3.1 Copy and paste Selected nodes and the lines between them can be copied into the clipboard through the “Copy” command in the “Edit” menu or by keying CMD-C. RepNet puts both the net data and an image in the clip in such a way that it is able to paste the data back into a net whereas other programs, such as word processors, paste the image in their documents. The image is normally in a vector graphics format, but if the shift key is held down while selecting the “Copy” command in the “Edit” menu then a high-resolution bitmap image will be placed in the clipboard. The vector graphics format generally supports higher quality printing and scaling and allows the image to be pasted into a graphics package and edited as vector data. The bitmap option is useful for nets containing non-Roman Unicode characters that may not print correctly or paste correctly in some applications. The bitmap is created at a 300 dpi resolution to provide a quality when printed that is similar to that of vector graphics. Net data in the clipboard may be pasted into another net through the “Paste” command in the “Edit” menu or by keying CMD-V. Nodes pasted may change appearance if the node type in the receiving net has a different graphic representation. If a node type with the same name does not exist in the receiving net then the node type data is also copied to the receiving net (making it possible to copy node types between nets). Text data in the clipboard may be pasted into a net. Each line of text creates a new node of the type selected in the popup menu, and places the text in both the label and the note fields. This enables the user to edit the label, for example to shorten a journal citation, while retaining the full text in the note field. Tab characters in the data (typically from spreadsheet columns) are replaced by return characters in the label field, and hence generate new lines when the node label layout is calculated. When you paste data into a net, RepNet centers it at the point where you last clicked in the net. Hence, to set the location for pasting, click in the net before you paste.
3.2 Drag and drop Drag and drop of net data behaves much the same as cut and paste except that RepNet puts the net data in the drag item for its own use, and the text of the node labels in for use by other applications. To distinguish between repositioning selected nodes and dragging copies of them, one must hold the “alt” or “option” key down when dragging in a node to indicate that it should become a drag item. When this is done the drag item is indicated by a gray rectangle initially surrounding the selected nodes. Dragging a selected node, or nodes, and dropping them into the same net is a rapid way of duplicating those nodes. When you drag data into a net, RepNet places it at the point where you drop it.
3.3 Dragging files to a net Files may also be dragged to a net. RepNet automatically converts them into a text item containing a URL commencing with “file://” that provides a link to the file together with additional identification data, and will be processed as a URL as noted in the previous section. If

3-2
there is a node type specified for the file extension then a node of that type will be created. If not, and there is a node type specified for the extension “*” then that type will be created. If not the selected node type will be created. Below is shown a net into which files have been dragged having some of the extensions normally made available in a net. The node on the far right is one where there was no match for the extension and the default file type was used.
Files dragged and dropped into a net
The note field shows the URL created for the net file referenced by the node on the left. The first text item is an absolute path to the file, and the next three items are the file size, creation date and modification date used in file searches. Rep 5’s file search algorithm first attempts to find the file relative to the net file containing the node, then through the absolute path, and then through a search that takes into account the file name, size and dates. This makes it possible to link to files even if their location has been changed. If files are dragged to a net that has not been saved, or a net containing file references is saved to another location, then the file references in the net are automatically updated to be relative to the location where the file has been saved.

4-1
4 Contextual menus and layers When the cursor is moved around a net it become a hand when over the central area of a node and an arrow when outside a node. The hand cursor symbol has a menu icon on its right indicating that a menu is available if one holds the “control” key down and clicks, right-clicks with a two-button mouse, or clicks and holds the mouse down without moving it.
4.1 Contextual menu when cursor is over a node Shown below are the contextual menu and submenus that appear when this is done while the cursor is over the top node of the net being used as an example.
Contextual menu when cursor is over a node—“Align” submenu
Selecting the top menu item, “Align,” causes RepNet to align any selected nodes with the node under the cursor. It aligns the node centers either horizontally or vertically according to which requires the least movement, which usually corresponds to the user’s intentions. The most important visual effect is that any lines between the nodes become horizontal or vertical lines giving the net a neater appearance. The submenu off the second “Align” item provides options to align the left, horizontal centers, right, top, vertical centers or bottom of the selected nodes.
Contextual menu when cursor is over a node—“Spread” submenu

4-2
The “Spread” submenu provides the options to space the selected nodes evenly between the two extreme nodes, horizontally, vertically or both.
Contextual menu when cursor is over a node—“Same size” submenu
The “Same size” submenu provides the options to set the size of the selected nodes to be the same as the node under the cursor, horizontally, vertically or both. If any selected node has a minimum size that is already larger than that of the node under the cursor then it determines the size used.
Contextual menu when cursor is over a node—“Send” submenu
The “Send” submenu controls the position of the node within RepNet’s graphic layers and these are described in Section 4.3. Selecting the “Edit Node” menu item opens the node for editing as if it had been double-clicked.
4.2 Contextual menu when cursor is outside a node Shown below is the contextual menu that appears when the cursor is not over a node.

4-3
Contextual menu when cursor is not over a node—“Save image” submenu
“Edit Syntax” brings up a floating dialog that may be used to edit the syntax of the net as detailed in Section 5. The “Save image” submenu brings up a file save dialog that may be used to save the image of the net in a number of different formats: scalable vector graphics (SVG), the W3C standard for high-precision vector graphics in XML format; portable network graphics (PNG), the W3C standard for bit-map graphics; joint photographic experts standard (JPEG), the standard for photographic images; and, under Windows, enhanced metafile (EMF), the Microsoft standard for high-precision vector graphics. The PNG and JPEG images are available 1, 2 or 3 times normal screen resolution. “Save master file” brings up a file save dialog that may be used to save the net as a master file (section 6.2). “Lock Net” changes the mode of interaction with the net and is indicated by the cursor becoming a button icon over a node and a star outside nodes. The net can be unlocked by double-clicking outside its nodes. One use of the lock feature is to fetch URL’s stored in the hidden note field as discussed in Section 7.5.
Contextual menu when cursor is not over a node—“Run” submenu
“Run CNet” runs a RepScript program “CNet” that sets up an interactive inference framework for construct nets. This is a dynamic item that keeps track of the last script run. The “Run”

4-4
submenu below shows all the scripts currently available. This is also a dynamic menu that lists scripts in directories named “NetScripts” in a number of locations: the application directory containing Rep 5; the Rep 5 directory in the user’s “Documents” or “My Documents” directories; the directory containing the net and any enclosing directories. In this example, the script “CNet” is in the “NetScripts” directory in the same directory as the net, and “Make Web Map,” “PrinGrid Trajectories” and “Show Net Structure” are in the “NetScripts” directory in the same directory as the Rep 5 application.
4.3 Graphic layers in a net There are five layers of graphics in nets that overlay one another as shown below.
1: Background Layer
2: Back Nodes Layer
3: Graphic Objects Layer
4: Lines Layer
5: Front Nodes Layer
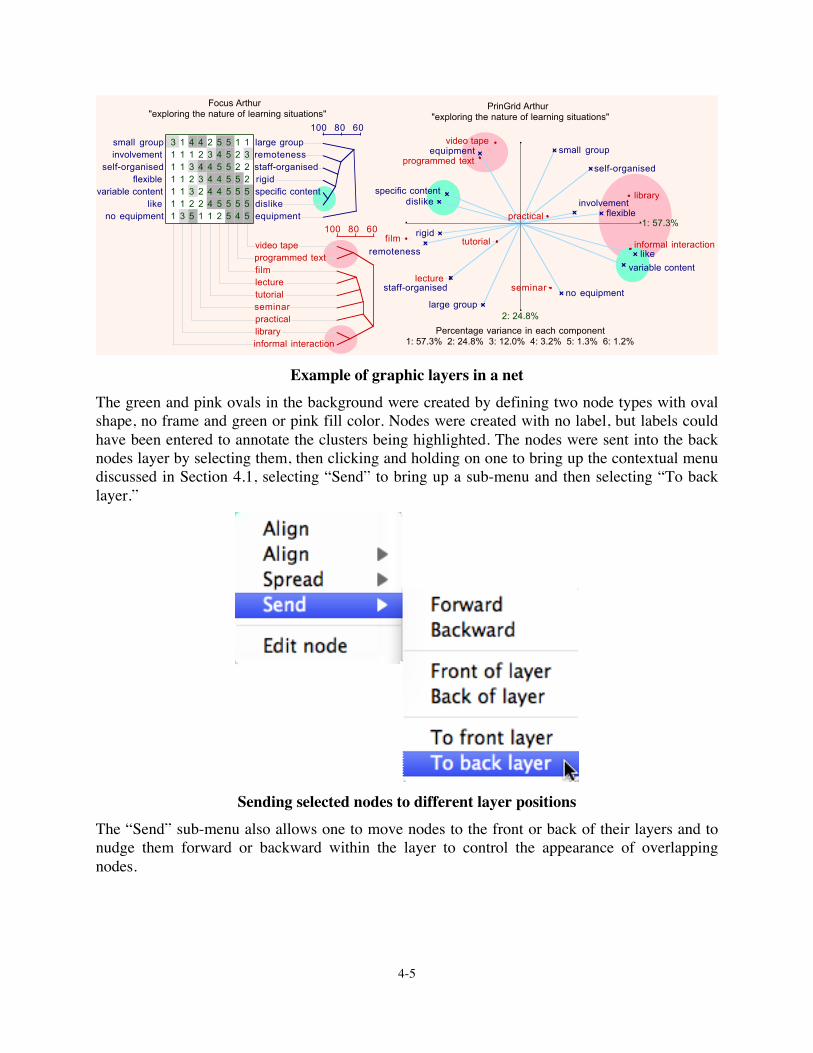
Graphic layers in nets The first layer is the background that may, or may not, be present, and that may be set to be colored if it is present. The second layer comprises the back nodes that appear behind all other graphic items. This layer is provided so that nodes may be used to indicate areas of the overall net that one wishes to mark. The third layer comprises the graphic objects generated by various analyses such as the “Display,” “Focus” and “Compare” analyses from RepGrid. The fourth layer comprises the lines. The fifth layer comprises the front nodes that appear in front of all other graphic items. When nodes are first created they are generally placed in this layer but may be moved to the back layer. The examples discussed in this manual so far have only involved the first, fourth and fifth layers. The figure below illustrates all five layers. The background layer is present and colored light pink. The back nodes layer holds six dark pink and light green ovals being used to mark specific clusters in the two RepGrid analyses. The graphic objects layer holds the Focus analysis on the left. The lines layer holds the axes and dimension lines of the PrinGrid analysis on the right. The front nodes layer holds the titles at the top left and right, the variance information at the bottom right, and the element and construct labels on the right.
4-5
100 80 60
100 80 60
informal interactionlibrarypracticalseminartutoriallecturefilmprogrammed textvideo tape
small group large groupinvolvement remoteness
self-organised staff-organisedflexible rigid
variable content specific contentlike dislike
no equipment equipment
3 1 4 4 2 5 5 1 11 1 1 2 3 4 5 2 31 1 3 4 4 5 5 2 21 1 2 3 4 4 5 5 21 1 3 2 4 4 5 5 51 1 2 2 4 5 5 5 51 3 5 1 1 2 5 4 5
Focus Arthur "exploring the nature of learning situations"
lecture
tutorial
seminar
practical
film
library
programmed text
video tape
informal interactionremoteness
involvement
rigid
flexible
no equipment
equipment
staff-organised
self-organised
large group
small group
specific content
variable content
dislike
like
1: 57.3%
2: 24.8%
PrinGrid Arthur "exploring the nature of learning situations"
Percentage variance in each component1: 57.3% 2: 24.8% 3: 12.0% 4: 3.2% 5: 1.3% 6: 1.2%
Example of graphic layers in a net The green and pink ovals in the background were created by defining two node types with oval shape, no frame and green or pink fill color. Nodes were created with no label, but labels could have been entered to annotate the clusters being highlighted. The nodes were sent into the back nodes layer by selecting them, then clicking and holding on one to bring up the contextual menu discussed in Section 4.1, selecting “Send” to bring up a sub-menu and then selecting “To back layer.”
Sending selected nodes to different layer positions
The “Send” sub-menu also allows one to move nodes to the front or back of their layers and to nudge them forward or backward within the layer to control the appearance of overlapping nodes.

5-1
5 Net syntax and appearance defining and editing The net syntax editing dialog that is activated by the “Edit Syntax” item in the contextual menu is shown below.
Syntax editor floating dialog
5.1 Lines The “Lines” panel at the top left may be used to define the line types that are available when editing a net. The line shape can be selected by clicking on any of the eighteen shapes shown in the top row. The available line types are named in the popup menu on the left below the line shapes which can be used to select the type for editing. A new line name may be typed in the text

5-2
box to the right of it, and the line color and arrow head color, if any, can be specified through the two color swatches on the right. The “Delete” button deletes the line type selected in the popup menu. The “New” button defines a new line type with the new name typed into the text box and the shape and colors specified. The “Apply” button changes the line type selected in the popup menu to have and the shape and colors specified. When arrows that have been used in a net are deleted or edited the net automatically changes to reflect this. If all the line types but one are deleted then the remaining line type cannot be deleted.
5.2 States Immediately below the “Lines” panel is a “States” panel having a popup menu of state color schemes, to the right of which is a text box in which the state color scheme names can be entered and edited. A new state color scheme name may be typed in the text box to the right of it, and the mark color and fill color can be specified through the two color swatches on the right. The “Delete” button deletes the state color scheme selected in the popup menu. The “New” button defines a new state color scheme with the new name typed into the text box and the mark and fill colors specified. The “Apply” button changes the state color scheme selected in the popup menu to have the colors specified. When state color schemes that have been used in a net are deleted or edited the net automatically changes to reflect this. If all the state color schemes types but one are deleted then the remaining state color scheme cannot be deleted.
5.3 Background Immediately below the “States” panel is a “Background” panel controlling whether the net has a background and, if so, its color. The background layer behind the net fills the window in which the net is displayed, and is sized to the net when it is output in any form. If it is not shown the window background will be white, and graphic output from the net pasted into another application will have no background layer so that any other graphics behind it will show through.
5.4 Nodes Immediately below the “Background” panel is a “Nodes” panel having a popup menu of node types, to the right of which is a text box in which the state color scheme names can be entered and edited. A new node type name may be typed in the text box to the right of it. Below these are popup menus for the font and size of text in the node, and a file extension text box in which may be entered the file extension associated with the node type, if any— “*” matches any file extension if there is no other match. The “Type” panel has a check box that controls whether the type name is shown at the top of a node. The “Line” check box controls whether a separator line will be drawn under it if it is shown. The “Italic” and “Bold” check boxes and the color swatch control the style and color of the type name if it is shown. The “Label” panel has a check box that controls whether the node label is shown. The “Wrap” check box controls whether the label text will be wrapped (if one or more SHIFT-return characters are embedded in the label these will be used to wrap it regardless of the “Wrap” check box). The “Italic” and “Bold” check boxes and the color swatch control the style and color of the label if it is shown.

5-3
The “Shape” panel allows one of twelve possible frames to be selected in which to display a node. The final shape at the bottom right is different from the others in that it indicates an “Enclosure” node (Section 2.5). The “Frame” panel has a check box that controls whether the frame is shown. The “Width” popup menu controls the width of the frame and the color swatch controls the color of the frame if it is shown. The “Fill” panel has a check box that controls whether the frame is filled. The color swatch controls the color of the fill if it is shown. The “Delete” button deletes the node type shown on the popup menu near the top. If there is only one node type it cannot be deleted. The “New” button creates a new node type with the name shown in the text box to the right of the popup menu near the top. The name must be different from that of any existing node type. The “Apply” button apples the specification of the node type shown on the popup menu near the top to nodes of that type in the associated net, updating the appearance of the nodes as appropriate. Note that when one node type is edited, the “Apply” button must be used before proceeding to edit another node type. The floating syntax editor dialog can be closed using the platform-dependent controls at the top.
5.5 Color selection The swatches used for color selection are such that clicking in the left half brings up a menu of standard colors whereas clicking in the right half brings up the standard color selection dialogs of the operating system under which Rep 5 is operating. The menu of standard colors provides the “Cascading Style Sheets” groups of colors classified by color type with names and values as defined in the W3C “CSS Color Module Level 3” specification (W3C, 2008).
Color selection menu when mouse is clicked on the left side of a color swatch

5-4
The standard color dialogs under OS X and Windows enable arbitrary colors to be specified.
Standard color selection dialogs when mouse is clicked on the right side of a color swatch
The table below shows the CSS3 color names and associated colors. Note that when the names are used on the web they have no spaces within them, but spaces have been inserted appropriately to make the names clearer in the menu.

5-5
Whites
White Ghost White White Smoke Ivory
Snow Floral White Seashell Linen
Old Lace Antique White Mint Cream Azure
Alice Blue
Grays
Gray Gainsboro Light Gray Silver
Dark Gray Dim Gray Light Slate Gray Slate Gray
Dark Slate Gray Black
Pinks
Pink Lavender Blush Misty Rose Light Pink
Hot Pink Deep Pink Pale Violet Red Medium Violet Red Reds
Red Indian Red Light Coral Light Salmon
Salmon Dark Salmon Crimson Fire Brick
Dark Red
Oranges
Orange Dark Orange Light Salmon Coral
Tomato Orange Red
Yellows
Yellow Light Yellow Lemon Chiffon Light Goldenrod Yellow
Papaya Whip Moccasin Peach Puff Pale Goldenrod
Khaki Dark Khaki Gold
Browns
Brown Beige Cornsilk Blanched Almond
Bisque Navajo White Wheat Burly Wood
Tan Rosy Brown Goldenrod Dark Goldenrod
Sandy Brown Chocolate Peru Sienna
Saddle Brown Maroon

5-6
Greens
Green Honeydew Green Yellow Yellow Green
Chartreuse Lawn Green Lime Lime Green
Pale Green Light Green Medium Spring Green Spring Green
Forest Green Dark Green Olive Drab Olive
Dark Olive Green Medium Aquamarine Light Sea Green Medium Sea Green
Sea Green Dark Sea Green Dark Cyan Teal
Blues
Blue Light Cyan Aquamarine Aqua/Cyan
Pale Turquoise Turquoise Medium Turquoise Dark Turquoise
Cadet Blue Light Steel Blue Steel Blue Powder Blue
Light Blue Light Sky Blue Sky Blue Deep Sky Blue
Cornflower Blue Royal Blue Dodger Blue Medium Slate Blue
Slate Blue Dark Slate Blue Medium Blue Dark Blue
Navy Midnight Blue Purples
Purple Lavender Thistle Plum
Violet Orchid Fuchsia Magenta
Medium Orchid Medium Purple Amethyst Blue Violet
Dark Violet Dark Orchid Dark Magenta Indigo
Standard color names and colors

6-1
6 Printing and Saving Nets
6.1 Printing nets The “Print” item in the “File” menu may be used to print the net image to the currently selected printer. The “Page Setup” item may be used to adjust the scale and orientation of printing, and Rep 5 stores whatever format is selected so that it will be retained when the application is terminated and restarted. Under Windows XP the page margins may be set, and “Page Setup” should be used when the application is first installed to ensure these are set up appropriately. If the net is too large to fit on one page it will be printed on multiple pages that may be glued together to form a larger page. As shown below, the page boundaries may be viewed by holding the “alt” or “option” key down while clicking in the net outside of any nodes.
Viewing the printing page boundaries on a large net

6-2
A large net may also be scaled down to fit a single page by using the “Print Fit” item in the “File” menu.
6.2 Saving nets When the data in a RepNet window is changed the “Save” item in the “File” menu becomes active as does the “Undo” item in the “Edit” menu. You can save the changed data under its original name through the “Save” command. The “Save As…” command in the “File” menu is always active and lets you save the net in a different file. The “New Net” button creates a new net with some predefined node types that provides a syntax adequate for many applications. However, a wide variety of sets of node types may be used to support many forms of nets for different purposes such as semantic networks, bond graphs, argument analysis, concept maps and so on. The “Save Master” item in the contextual menu enables new types of nodes to be created and stored as a syntactical structure in “master” files which behave like any other net file except that when they open a copy is made with the name “Untitled.” Thus master files are a way of distributing various syntactical structures for nets suited to different applications RepNet. Rep 5 is distributed with various sample nets from different disciplines together with master files for the syntax of those nets. Master files are useful for issuing syntax nets containing only the node and line types to be used for different representation systems. However, they can also contain a net and hence may also be used for other purposes, such as issuing student tests where some nodes are left blank to be filled by the student.

7-1
7 Integration with other applications The tools in Rep 5 have been designed to operate separately as stand-alone facilities, and also in an integrated way among themselves and in conjunction with other applications such as word processors, spreadsheets and web browsers.
7.1 Integration between RepGrid and RepNet Nodes in nets may be selected and then copied and pasted, or dragged and dropped, onto a RepGrid window, and the node labels are treated as text entries. The RepGrid elements pane shown below was populated by selecting, dragging and dropping some of the nodes at the lower right of the concept map about water shown in Section 1.1.
Net nodes selected, dragged and dropped into a grid elements pane
Similarly, items in grids may be selected and then copied and pasted, or dragged (while holding down the “alt” or “option” key) and dropped, into a RepNet window, and become the labels of new nodes having the type selected on the popup menu. The net below was populated by selecting, dragging and dropping the elements in the grid window shown above. Thus grids may be created from nets and nets from grids.
Grid elements selected, dragged and dropped into a net
7-2
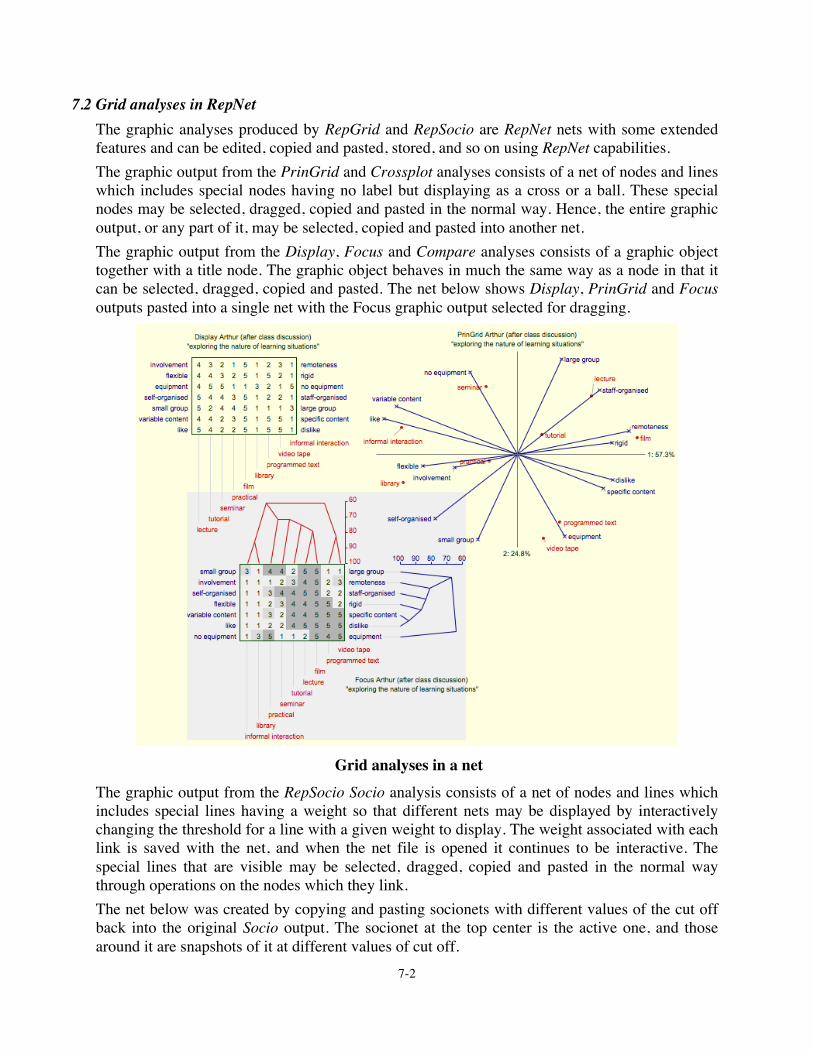
7.2 Grid analyses in RepNet The graphic analyses produced by RepGrid and RepSocio are RepNet nets with some extended features and can be edited, copied and pasted, stored, and so on using RepNet capabilities. The graphic output from the PrinGrid and Crossplot analyses consists of a net of nodes and lines which includes special nodes having no label but displaying as a cross or a ball. These special nodes may be selected, dragged, copied and pasted in the normal way. Hence, the entire graphic output, or any part of it, may be selected, copied and pasted into another net. The graphic output from the Display, Focus and Compare analyses consists of a graphic object together with a title node. The graphic object behaves in much the same way as a node in that it can be selected, dragged, copied and pasted. The net below shows Display, PrinGrid and Focus outputs pasted into a single net with the Focus graphic output selected for dragging.
Grid analyses in a net
The graphic output from the RepSocio Socio analysis consists of a net of nodes and lines which includes special lines having a weight so that different nets may be displayed by interactively changing the threshold for a line with a given weight to display. The weight associated with each link is saved with the net, and when the net file is opened it continues to be interactive. The special lines that are visible may be selected, dragged, copied and pasted in the normal way through operations on the nodes which they link. The net below was created by copying and pasting socionets with different values of the cut off back into the original Socio output. The socionet at the top center is the active one, and those around it are snapshots of it at different values of cut off.

7-3
Socionets analyses at different cut offs in a net (top center one is active)
7.3 Changing the color scheme of RepGrid analyses within RepNet The “Style” in the analysis button in RepGrid (see RepGrid Manual) is the most convenient way to define a color scheme for the graphic analysis of grid. However, sometimes one may wish to adjust the scheme in the output itself using the net syntax editing capabilities of RepNet (Section 5). If so, it is useful to know how the color scheme has been mapped into the four net styles defined in the analysis nets, “Title,” “Element,” “Construct” and “Rating.,” as given in the tables below. Label Frame Fill Type Title Title text Unused Background Unused Element Element text Element tree Element lines Unused Contruct Construct text Construct tree Construct lines Unused Rating Rating text Rating high Rating midle Rating low
Node types color scheme for Display, Focus and Compare analyses

7-4
Label Frame Fill Type Title Title text Unused Background Unused Element Element text Unused Unused Unused Contruct Construct text Unused Unused Unused Rating Unused Unused Unused Unused
Node types color scheme for PrinGrid and Crossplot analyses Links linking lines when labels displaced from locations Axes x, y and z axes Dimensions construct dimensions in PrinGrid Plane 3D plane and lines dropped to the plane
Line types color scheme for PrinGrid and Crossplot analyses
7.4 Integration of RepGrid and RepNet with other applications The copy and paste, and drag and drop, data interchange works equally well with material in other applications such as text files and spread sheets. For example, a document in a text editor that allows multiple discontiguous selections, such as Microsoft Word, may have various words selected which are then dragged to the elements pane of a grid to become its elements, or to a net to become its nodes.
7.5 Integration with web browsers—accessing URL’s by clicking nodes The hidden note field in each node supports node annotation for a wide variety of purposes. One application that is supported by RepNet is to store a URL in the note field and to access it through a web browser either when the node is clicked locally or when an image of the map is made part of a web page and clicked remotely. Below is shown a net representing American presidents with the hidden notes having a link to the White House web site page for the appropriate president.
Net with a URL stored in the note field of some nodes

7-5
If the net is locked by double-clicking in it outside the nodes or through the contextual menu and a node is clicked then a “ShowURL” command is generated to the operating system that causes the URL to be fetched through the user’s preferred web browser. Note that URL’s can also take other forms, such as “file://” to open local files, or “mailto:” to generate an email message. Files that are dragged to a net create nodes whose note field contains a “file://” URL linking to the file (Section 3.3). Hence it is simple to create a net of nodes containing links to documents on the web, or stored locally, such that the documents will be opened in the appropriate application when the node in the web is clicked. Note that grid and net files included in such documents include will open in RepGrid or RepNet when the node is clicked, so that one readily manage Rep 5 projects using Rep 5 nets.
7.6 Integration with web servers—saving images and web maps A graphic image of the net may be saved in PNG format for use on the web by selecting “Save Image” from the contextual menu. A web map in HTML may be generated by selecting and clicking on “Make Web Map” in the Script button/popup menu. The output for the net above is shown below. <!-- This is the client side image map -->
<MAP NAME="Presidents">
<AREA SHAPE="RECT" COORDS="2,25,53,48" HREF="http://www.whitehouse.gov/history/presidents/fr32.html" TARGET="Presidents">
<AREA SHAPE="RECT" COORDS="14,54,55,77" HREF="http://www.whitehouse.gov/history/presidents/ht33.html" TARGET="Presidents">
<AREA SHAPE="RECT" COORDS="24,82,79,105" HREF="http://www.whitehouse.gov/history/presidents/de34.html" TARGET="Presidents">
<AREA SHAPE="RECT" COORDS="48,109,91,132" HREF="http://www.whitehouse.gov/history/presidents/jk35.html" TARGET="Presidents">
<AREA SHAPE="RECT" COORDS="80,136,128,159" HREF="http://www.whitehouse.gov/history/presidents/lj36.html" TARGET="Presidents">
<AREA SHAPE="RECT" COORDS="199,137,245,160" HREF="http://www.whitehouse.gov/history/presidents/gf38.html" TARGET="Presidents">
<AREA SHAPE="RECT" COORDS="138,145,189,168" HREF="http://www.whitehouse.gov/history/presidents/rn37.html" TARGET="Presidents">
<AREA SHAPE="RECT" COORDS="234,108,269,131" HREF="http://www.whitehouse.gov/history/presidents/jc39.html" TARGET="Presidents">
<AREA SHAPE="RECT" COORDS="259,80,301,103" HREF="http://www.whitehouse.gov/history/presidents/rr40.html" TARGET="Presidents">
<AREA SHAPE="RECT" COORDS="275,54,313,77" HREF="http://www.whitehouse.gov/history/presidents/gb41.html" TARGET="Presidents">
<AREA SHAPE="RECT" COORDS="284,27,330,50" HREF="http://www.whitehouse.gov/history/presidents/bc42.html" TARGET="Presidents">
</MAP>
<!-- This is the image -->
<IMG SRC="Presidents.png" USEMAP="#Presidents" WIDTH="332" HEIGHT="170">
Including this as part of a web HTML document will show the net as a clickable image, and clicking on a node that had a URL in its hidden note will fetch the document corresponding to that URL in a new window. The WebNet service in RepServe (see RepServe Manual) provides an alternative approach supports by serving nets directly, dynamically converting them to clickable images in PNG format, and responding to clicks on nodes by fetching the document specified by the URL in the note field.
7.7 Monitoring and managing research projects and programs in RepNet Since RepNet nodes may contain active links to local or remote files and can open these files in the appropriate application, RepNet can be used to monitor and manage research projects and programs. As the files can themselves be nets that will open in RepNet, it is possible to do this using a hierarchical or network structure of interlinked nets. As the files can also be grids that

7-6
will open in RepGrid it is possible to use RepNet to manage collections of grids and associated documentation. Since the nets with the associated links can be incorporated in HTML documents as clickable images with the links in associated wep maps, the whole, or part, of the network can be made available through the Internet or an intranet. The net below is the top level entry point for a structure of nets indexing a CD-ROM developed using a previous version of RepNet that documented an international program on intelligent manufacturing systems (Gaines, Norrie, Lapsley and Shaw, 1996). The node containing a group photograph of the project members has been clicked to open the photograph in another application as shown behind the net. Clicking the node headed “Movie” shows a movie about the program, “Report” open the final report in a document viewer, and so on. The nodes headed “Net” when clicked open other nets which give access to more detailed information about specific projects. These can in turn open further nets or open files in other applications such as AutoCAD.
Nets indexing a CD-ROM documenting an international research program
The net below represents the grids used to illustrate RepSocio (see RepSocio Manual), showing their roles in the research project (Shaw and Gaines, 1989). Clicking on a grid opens it in RepGrid.

7-7
GridPeter
Mary exchange
GridCharlie
Mary exchange
GridCharlie
Peter exchange
Initial study June 1987
GridPeter
GridCharlie
exchangeexchange
GridInitial
exchange
elicit elementsand constructs
GridMary
GridMary
Peter exchange
GridPeter
Charlie exchange
GridMary
Charlie exchange
agree a set ofelements
elicitconstructs
GridAgreed techniques
GridMary
Agreed techniques
GridPeter
Agreed techniques
GridCharlie
Agreed techniques
GridPeter
Peter (Agreed techniques) exchange
GridMary
Agreed techniques
GridCharlie
Agreed techniques
GridCharlie
Charlie (Agreed techniques) exchange
GridMary
Mary (Agreed techniques) exchange
GridPeter
Agreed techniques exchange
elicitconstructs
elicitconstructs
exchange
GridPeter
Peter (Agreed techniques) exchange
GridPeter
Agreed techniques
exchange exchange
Follow-up study August 1987
Follow-up study August 1990
Net indexing a set of grids from a research project
The net below provides a generic framework for graduate research projects (Shaw and Gaines, 1998), based on stating an aim, developing it into a series of objectives, and developing these into a series of activities necessary to achieve them. The seven objectives on the left also correspond to the chapter structure of many theses.

7-8
ObjectiveDetermination of
current state of theart relating to the aim
leads to
leads to
leads to
ObjectiveResearch
implementationbased on the
design
leads to
ObjectiveEvaluation of
researchimplementation
leads to
ObjectiveConclusions and
future directions ofresearch
ActivityDefinition of an
area ofresearch
requires
ActivityClose reading of
relevantliterature
ActivityDetailed
discussion withspecialist
researchers
ActivityDevelopment of
detailed researchobjectives
ActivityDocumentation ofresearch activities
and outcomes
ActivityClear statement
of basis ofevaluation
leads to
AimOverall aim ofcarrying out
research
ObjectivePresentation of
motivationunderlying the aim
ActivityImaginativeprojection ofworthwhile
developments
requires
ActivityCritical analysis ofown research and
comparison with stateof art
ActivityEvaluation of
state of the art
ActivityAttendance at
seminars,workshops &conferences
ActivityBroad readingof literature
ActivityDiscussionswith other
researchers
ActivitySynthesis offramework for
research issues
ActivityAnalysis ofresearchissues
requires
ActivityDevelopment of a
conceptualframework forresearch area
ActivityClear statement ofachievements &
problems
ActivityProjection ofnext steps
ActivityClear statement of
objectives ofexisting research
requires
requires
requiresObjective
Critical analysis ofthe current state
of the art
requires
requiresObjective
Research designbased on the
analysis
requires
requires
requires
requires
requires
requires
ActivityIntensepersonalresearchactivity
Net representing a generic framework for graduate research projects
The generic net can be linked to a more specific net in which abstract nodes have been replaced with instances of each that are applicable to a particular research project. Each node in the specific net can be linked to a more detailed net that links to specific project documents, research notes, results, draft thesis chapters, and so on.

8-1
8 References Some of the reports cited in the manual are available through http://repgrid.com
Blundell, A. J. (1982). Bond Graphs for Modelling Engineering Systems. Ellis Horwood, Chichester, UK.
Bryson, J. M., Ackermann, F., Eden, C. and Finn, C. B. (2004). Visible Thinking: Unlocking Causal Mapping for Practical Business Results. Wiley, Chichester, UK.
Cendrowska, J. (1987). An algorithm for inducing modular rules. International Journal of Man-Machine Studies 27, 349-370.
Donini, F. M. (2003). Complexity of reasoning. In The Description Logic Handbook Baader, F., Calvanese, D., McGuinness, D., Nardi, D. and Patel-Schneider, P., eds., pp. 96-136. Cambridge University Press, Cambridge.
Gaines, B. R. and Shaw, M. L. G. (1994). Using knowledge acquisition and representation tools to support scientific communities. In AAAI’94: Proceedings of the Twelfth National Conference on Artificial Intelligence, pp. 707-714. AAAI Press/MIT Press, Menlo Park, California.
Gaines, B. R. and Shaw, M. L. G. (1995). Concept maps as hypermedia components. International Journal Human-Computer Studies 43, 323-361.
Gaines, B. R., Norrie, D. H., Lapsley, A. Z. and Shaw, M. L. G. (1996). Knowledge management for distributed enterprises. In Proceedings of Tenth Knowledge Acquisition Workshop Gaines, B. R. and Musen, M. A., eds., pp. 37-1-37-18 (http://repgrid.com/reports/KM/KMDE/).
Gaines, B. R. (2009). Designing visual languages for description logics. Journal of Logic, Language and Information 18, 217-250.
Gaut, B. (2000). "Art" as a cluster concept. In Theories of Art Today Carroll, N., ed, pp. 25-44. University of Wisconsin Press, Madison, WI.
Gaut, B. (2005). The cluster account of art defended. The British Journal of Aesthetics 45, 273-288.
Lehmann, F. (1992). Semantic networks. Computers & Mathematics with Applications 23, 1-50.
Mintzes, J. J., Wandersee, J. H. and Novak, J. D., eds. (1998). Teaching Science for Understanding: A Human Constructivist View. Academic Press, San Diego.
Mintzes, J. J., Wandersee, J. H. and Novak, J. D., eds. (2000). Assessing Science Understanding: A Human Constructivist View. Academic Press, San Diego.
Novak, J. D. and Gowin, D. B. (1984). Learning How To Learn. Cambridge University Press, New York.
Novak, J. D. (1998). Learning, Creating, and Using Knowledge: Concept Maps as Facilitative Tools in Schools and Corporations. Lawrence Erlbaum, Mahwah.
Oliver, R. M. and Smith, J. Q. (1990). Influence Diagrams, Belief Nets, and Decision Analysis. Wiley, Chichester, UK.
Pask, G. (1976). Conversation Theory. Elsevier, Amsterdam. Reisig, W. (1985). Petri Nets: An Introduction. Springer, Berlin.

8-2
Shaw, M. L. G. and Gaines, B. R. (1989). Comparing conceptual structures: consensus, conflict, correspondence and contrast. Knowledge Acquisition 1, 341-363.
Shaw, M. L. G. and Gaines, B. R. (1998). A research-based masters program in the workplace. Proceedings of WCCCE'98: Western Canadian Conference on Computing Education http://repgrid.com/reports/LW/WCCE98/index.html.
Sowa, J. F., ed. (1991). Principles of Semantic Networks: Explorations in the Representation of Knowledge. Morgan-Kaufman, San Mateo, California.
Toulmin, S. (1958). The Uses of Argument. Cambridge University Press, Cambridge, UK. W3C. (2008). CSS Color Module Level 3: W3C Working Draft 21.
http://www.w3.org/TR/css3-color/.