renewables india 2017 - indiaenvironmentportal · 2017-12-12 · status of re development in india...
TRANSCRIPT

RENEWABLES INDIA 2017Towards Grid Parity
Status of RE Development in India in 2016-17
Report by

A Research Report by WISE i
Status of RE Development in India 2016-17
RENEWABLES INDIA 2017 Towards Grid Parity
Report by
World Institute of Sustainable Energy, Pune

ii A Research Report by WISE
About WISE
The World institute of Sustainable Energy (WISE) is a not-for-profit institute established in 2004, committed to the cause
of promoting sustainable development, with specific emphasis on renewable energy, energy efficiency, and climate
change. Mediating public policy through proactive action is the prime objective of the institute.
About Shakti Sustainable Energy Foundation
Shakti Sustainable Energy Foundation was established in 2009 and works to strengthen the energy security of India by
aiding the design and implementation of policies that support energy efficiency and renewable energy.
Acknowledgements
The World Institute of Sustainable Energy (WISE) would like to thank its team members for their significant contribution
in the research, writing and development of this report. Special thanks our due to G M Pillai, Founder Director General,
WISE, for his keen observations, valuable suggestions and overall guidance.
WISE would also like to thank Shakti Sustainable Energy Foundation for its insightful views, inputs, and valuable support
in the preparation of the report.
Disclaimer
The views and analysis expressed in this document are those of the World Institute of Sustainable Energy (WISE), based
on data/information collected from different sources, which is deemed reliable and correct to the knowledge of WISE.
They do not necessarily reflect the views of Shakti Sustainable Energy Foundation. The Foundation also does not
guarantee the accuracy of any data included in this publication nor does it accept any responsibility for the consequences
of its use.
While due care has been taken in compiling data from validated primary and secondary sources, WISE shall not be held
responsible for any errors or omissions or for the end results obtained from use of this information. WISE shall not have
any liability whatsoever, including financial, at any time, because of the use of information in this report.
© World Institute of Sustainable Energy (WISE), 2017
Copyright: Any part of this report can be reproduced for non-commercial use without prior permission, provided that
WISE is clearly acknowledged and a copy of the published document is sent to WISE.
Citation: WISE (2017). Renewables India 2017: Towards Grid Parity, Status of RE Development in India, 2016-17.
Contributors
Praveena Sanjay, Director, WISE, & Lead Coordinator; Surendra Pimparkhedkar, Fellow and Head, Regulation &
Policy, WISE; Satadru Chakraborty, Associate Fellow, Regulation & Policy, WISE; Anand Wagh, Associate Fellow, Wind
Power; Debarshi Gupta, Sr. Research Associate, Climate & Sustainability; and Vishwesh Pavnaskar, Sr. Research
Associate, Energy Efficiency.
Copy Editing & Proofreading: Noela Mendonza
Technical & Production Assistance: Vinita Phinehas, Research Officer, Communications & Coordination, WISE; Jyoti
Fulpagar, Dy. Librarian, WISE; Aoudumbar Tanpure, Manager, IT, WISE.
Printing: Shailesh Art Print, Pune.
For private circulation only.

A Research Report by WISE iii
CONTENTS
Foreword
List of Tables and Figures
Acronyms
Executive Summary
Introduction and Scope
CHAPTER 1 1
ELECTRICITY GENERATION
CHAPTER 2 14
POLICY LANDSCAPE
CHAPTER 3 35
REGULATORY FRAMEWORK
CHAPTER 4 49
MANUFACTURING INDUSTRY
CHAPTER 5 63
INVESTMENT FLOWS
CHAPTER 6 71
EMISSIONS SCENARIO
REFERENCES 78

iv A Research Report by WISE

A Research Report by WISE v
FOREWORD
he Government of India has ambitious plans to scale up renewable energy, and stakeholders
are deliberating cost-effective ways to integrate ever increasing quantum of renewables with
the power system. A challenge being faced today is the lack of robust data on renewable energy,
which limits the ability of stakeholders to develop solutions. The current data regime is weak
because of which it is difficult to obtain information on major trends and growth trajectories,
market outlook, bottlenecks to deployment and procurement of renewable energy.
This initiative attempts to bridge this gap by compiling robust and accurate data on renewable
energy from multiple sources and disseminating it through a comprehensive web-based portal, “All
About Renewables”. We are pleased to share that this report marks the launch of this portal. It is
the first report in a series that will assimilate data from the portal for presenting an annual review
of India’s renewable energy sector.
This report synthesizes a host of developments in the renewables sector during the year 2016-17
covering power generation from various renewable energy technologies, advances in policy and
regulatory frameworks, growth in manufacturing capacity and investment flows, and contribution
of renewables to emissions reduction. The analysis shows that 2016-17 has been a landmark year
for renewables in India – capacity addition surpassing capacity added from conventional sources
for the first time, quantum jump of generation from renewables, record low tariffs of solar and
wind power, India’s largest power utility, National Thermal Power Corporation, expanding its
renewables portfolio, as well as several policy developments.
While this is a status report, it also highlights the issues that can hinder the long-term
sustainability of the sector. We envision that the web portal and the subsequent reports in this
series will be more comprehensive and updated with each passing year.
This is a timely and much needed initiative contributing to improving the data regime in the sector,
which is critical to achieving the national energy and climate targets. We hope that the web portal
and the annual publications will be useful tools for all stakeholders engaged in advancing the
deployment of renewable energy.
(G M Pillai) (Krishan Dhawan) Founder-Director General Chief Executive Officer World Institute of Sustainable Energy Shakti Sustainable Energy Foundation
T

vi A Research Report by WISE

A Research Report by WISE vii
LIST OF TABLES AND FIGURES
Tables
1.1 Country Ranking by Capacity Addition in 2016 2
1.2 Country Ranking by Cumulative Installed Capacity (2016) 2
1.3 Year-wise and Technology-wise Capacity Addition Targets to 2022
(Grid-connected RE only)
4
1.4 Status of Grid-Connected Renewable Energy (as on 31 March 2017) 5
1.5 State and UT-wise Targets and Installed Capacity (as of 31 March 2017) 6
1.6 Capacity Addition in 2016-17 (Grid Power only) 7
1.7 India Electricity Capacity-Mix 8
1.8 Renewable Electricity Generation (BU) with % Share in Total RE Electricity
(2014-15 to 2016-17)
10
1.9 Generation from Conventional and RE Sources 10
1.10 State/UT-wise Status of Off-Grid Renewable Energy Systems 12
2.1 Policies Enacted in Various States and Union Territories 16
2.2 CAGR of Cumulative Wind Installed Capacity in Wind-Dominant States
(1 April 2014 to 31 December 2016)
18
2.3 Cumulative Installed Capacity of Solar Power under Central and State Policies
(upto 31 December 2015)
19
2.4 CAGR of Cumulative Solar Power Installed Capacity in Solar-Dominant States
(1 April 2014 to 31 December 2016)
20
2.5 Phase-wise Solar Targets as per JNNSM 20
2.6 Achievements of Phase I Targets: JNNSM 22
2.7 Summary of Schemes in Phase II: JNNSM 23
2.8 Achievements of JNNSM Phase II Targets 25
2.9 State-wise Incentives/Exemptions in Renewable Energy 27
2.10 GBI (Wind) Registration Status and Disbursement as on 15 April 2017 28
2.11 Goods and Services Tax for Renewable Energy 29
2.12 Allocation of Clean Energy Cess Among Various Ministries (2016-17) 30
2.13 Main Provisions under Draft National Micro/Minigrid policy 31
2.14 Summary of Minigrid Regulations of UP, J&K and MP 33-34
3.1 Comparison of CERC and SERC declared Solar Tariff (INR/kWh) 35
3.2 Comparison of CERC and SERC declared Wind Tariff (INR/kWh) 36
3.3 REC price for 2016-17 41
3.4 Regulations Prevailing in States with high RE Potential under Open Access 44
3.5 Comparison of Deviation Charges, Centre vs Karnataka 45
3.6 Net Metering Regulations of States with Highest Rooftop Capacity Addition Targets
(Until 2022)
47-48
4.1 Solar Cell Manufacturing Capacity in India 50
4.2 Solar Module Manufacturing Capacity in India 50-52
4.3 WTG Manufacturers and Models Registered with NIWE (as on October 2016) 53-54
4.4 Wind Turbine Manufacturer-wise Manufacturing Capacity and Product Portfolio 54
4.5 Top Five Wind Turbine Manufacturers with Annual Installed Capacity (2016-17) 55
5.1 Capital Cost for Different Technologies for 2016-17 64
5.2 Summary of Statistics of External Commercial Borrowings in 2016-17 67
5.3 Lending by Multilateral Development Banks in 2016-17* 68
6.1 GHG Emissions by Sector in India (1994 and 2007) 74
6.2 CO2 Emissions in Metric Tonnes per MWh Generated 77

viii A Research Report by WISE
Figures
1.1 Top Six Countries and their RE Installed Capacity (2016) 2
1.2 Renewable Energy Potential vs 2022 Target (GW) 3
1.3 Region-wise Targets to Achieve 175 GW by 2022 3
1.4 Annual Capacity Addition and Cumulative Installed Capacity of Grid-Connected RE
12th Plan Period (2012 – 2017)
5
1.5 Source-wise Installed Capacity (March 2017) 8
1.6 Peak Power and Energy Deficit Trend (2009-10 to 2016-17) 9
1.7 Electricity Generation from Conventional Sources (2009-10 to 2016-17) 9
1.8 Capacity Addition in 12th Five Year Plan Period (2012-2017) 11
1.9 Growth Trajectory of Off-Grid Home Lighting Systems (Numbers) 13
1.10 Growth Trajectory of Off-grid Power Plants (Capacity) 13
2.1 Organisational Framework of the Power Sector 15
2.2 Key Policies Instrumental in Development of RE in India - Timeline 15
2.3 Historical Growth of Renewable Energy in India 16
2.4 Average Wind Power Installed Capacity Addition, Pre- and Post-implementation of
State Policies
18
2.5 Average Solar Power Installed Capacity Addition, Pre- and Post-implementation of
State Policies
19
2.6 Year-wise Revised Solar Targets to meet 100 GW by 2022 21
2.7 State-wise and Year-wise Proposed Capacity Addition Targets for Achieving 40 GW
Rooftop Solar by 2022
26
3.1 Solar Bid Tariff Trends (2012-2017) 37
3.2 Decreasing Trend of Solar Benchmark Capital Cost (2010-11 to 2016-17) 38
3.3 State-wise RPO Target (Solar and Non-solar) in 2015-16 39
3.4 State-wise RPO Compliance in 2015-16 40
3.5 State-wise RPO Targets vis-à-vis National Targets for 2016-17 40
3.6 RPO Trajectory (2016-17 to 2018-19) 41
3.7 Increasing REC Inventory (upto March 2017) 42
3.8 Technology-wise Accredited and Registered Projects under RECs (upto March 2017) 42
3.9 Technology-wise REC Liquidity (upto March 2017) 43
4.1 Wind and Solar Industry Supply Chain 56
4.2 The PV Value Chain (multi-crystalline) 56
4.3 Solar PV Installed Capacity vis-a-vis Import of Panels 60
4.4 Solar PV Imports (in Million USD) 60
4.5 Solar PV Exports (in Million USD) 61
4.6 Wind Electric Generator Exports (in Million USD) 61
4.7 Wind Electric Generator Imports (in Million USD) 62
5.1 Growth Trend in RE Investments (2006 to 2015) 63
5.2 Debt and Equity Investments in Renewable Energy in India (2016-17) 64
5.3 Banks and NBFCs providing Debt in 2016-17 65
5.4 Sanction and Disbursement of Loans by Major NBFCs (2011-12 to 2015-16) 66
5.5 Funding Share of Different MDBs in the RE Sector (2016-17) 68
5.6 Investments by Major Domestic Investors in Renewable Energy in 2016-17 69
6.1 India’s Position in International Climate Negotiations 72
6.2 Global Cumulative GHG Emissions between 1990 and 2011 73
6.3 Global Per Capita GHG Emissions between 1990 and 2014 74
6.4 Global Top 10 Emitters of GHGs (2011) 75
6.5 Global Per Capita Emission of GHGs by top 10 Emitters (2011) 75
6.6 Distribution of Emissions in India’s Energy Sector in 2010 76

A Research Report by WISE ix
ACRONYMS
ADB Asian Development Bank AHEC Alternate Hydro Energy Centre APPC Average Power Purchase Cost
bn Billion BNEF Bloomberg New Energy Finance BoS Balance of System BP British Petroleum BU Billing Unit CAGR Compound Annual Growth Rate CBDR Common but Differentiated Responsibilities CEA Central Electricity Authority CERC Central Electricity Regulatory Commission CO2e Carbon dioxide equivalent Cogen Cogeneration COP Conference of Parties CPSUs Central Public Sector Undertakings CSP Concentrated Solar Power CSS Cross Subsidy Surcharge DCR Domestic Control Requirement DDUGJY Deendayal Upadhyaya Gram Jyoti Yojana DISCOM Distribution Companies DNES Department of Non-conventional Energy Sources DPR Detailed Project Report ECB External Commercial Borrowing EPC Engineering, Procurement, Commissioning ERC Electricity Regulatory Commission ESCO Energy Service Company ESMAP Energy Sector Management Assistance Programme FA Franchise Agreement FDI Foreign Direct Investment FIT Feed-in tariff FOR Forum of Regulators FY Financial Year GBI Generation Based Incentives GDP Gross Domestic Product GERC Gujarat Electricity Regulatory Commission GHG Greenhouse Gas GoI Government of India GST Goods and Services Tax Gt Gigatonnes GW Giga Watt HVRT High Voltage Ride Through IEA International Energy Agency IIT Indian Institute of Technology IMG Inter-Ministerial Group INDC Intended Nationally Determined Contribution INR Indian Rupee InvITs Infrastructure Investment Trusts IPCC Intergovernmental Panel on Climate Change IREDA Indian Renewable Energy Development Agency

x A Research Report by WISE
IRENA International Renewable Energy Agency JNNSM Jawaharlal Nehru National Solar Mission Kw Kilowatt kWh Kilowatt Hour kWp Kilowatt – peak LCR Local Content Requirement LULUCF Land Use, Land-use Change and Forestry LVRT Low Voltage Ride Through MCLR Marginal Cost of Funds based Lending Rate MDB Multilateral Development Bank MGO Mini Grid Operator mn Million MNES Ministry of Non-Conventional Energy Sources MNRE Ministry of New and Renewable Energy MoP Ministry of Power MOSPI Ministry of Statistics and Programme Implementation M-SIPS Modified Special Incentive Package Scheme MW Mega Watt NAPCC National Action Plan on Climate Change NBFC Non-Banking Financial Company NCEEF National Clean Energy and Environment Fund NEP National Energy Policy/ National Electricity Plan NHPC National Hydroelectric Power Corporation NISE National Institute of Solar Energy NITI Aayog National Institution for Transforming India Aayog NIWE National Institute of Wind Energy NLDC National Load Dispatch Centre NRDC National Resources Defence Council NTP National Tariff Policy NTPC National Thermal Power Corporation NVVN NTPC Vidyut Vyapar Nigam Ltd O&M Operation and Maintenance OA Open Access OEM Original Equipment Manufacturer PDN Public Distribution Network PFC Power Finance Corporation PGCIL Power Grid Corporation of India Limited PPA Power Purchase Agreement PSU Public Sector Undertaking PTC Power Trading Corporation of India PV Photovoltaic PwC Price Waterhouse Cooper RBI Reserve Bank of India RE Renewable energy REC Rural Electrification Corporation REC Renewable Energy Certificate RGGVY Rajiv Gandhi Grameen Vidyutikaran Yojana RLDC Regional Load Dispatch Centre RLMM Revised List of Models and Manufacturers RPO Renewable Purchase Obligation RPSSGP Rooftop PV & Small Solar Power Generation Programme SBI State Bank of India SECI Solar Energy Corporation of India

A Research Report by WISE xi
SERC State Electricity Regulatory Commission SHP Small Hydro Power SNA State Nodal Agency SSS NIRE Sardar Swaran Singh National Institute of Renewable Energy TCD Tonnes of Cane per Day TPA Tonnes per Annum TWh Terawatt Hours UK United Kingdom UNEP United Nations Environment Programme UNEP SEFI UNEP Sustainable Energy Finance Initiative UNFCCC United Nations Framework Convention on Climate Change UPERC Uttar Pradesh Electricity Regulatory Commission US United States USD United States Dollar VAT Value Added Tax VGF Viability Gap Funding WB West Bengal/World Bank WDV Written Down Value WRI World Resources Institute WtE Waste-to-Energy WTG Wind Turbine Generator WTO World Trade Organisation

xii
EXECUTIVE SUMMARY
India’s estimated potential for electricity generation from renewables is 900 GW. The target set by
the Government of India for capacity addition from RE-based electricity generation is 175 GW by
2022. This comprises 100 GW from solar (60 GW from ground-mounted and 40 GW from rooftop),
60 GW from wind, 10 GW from biomass and 5 GW from small hydro. If this target is realized, the 327
billion units (BU) of electricity thus generated will cover 20% of total demand by 2022.
ELECTRICITY GENERATION
As of 31 March 2017, the installed power generation capacity from renewables in India was 57.24
GW (57,244 MW). This comprised 32.2 GW (32,279 MW) of wind (56.39%), 12.2 GW (12,288 MW) of
solar (21.47%), 4.3 GW (4,379 MW) of small hydro (7.65%), 8.1 GW (8,181 MW) of bio-power
(14.29%) and 0.11 GW (114 MW of waste-to-energy) (0.2%). The capacity added during 2016-17
was a record 11,320 MW (5525 MW solar, 5502 MW wind, 161 MW bio-power, 106 MW small
hydro and 23 MW waste-to-energy). In 2016-17, electricity generation from renewables was
81.88 BU, a 24.47% increase from 67.58 BU generated in 2015-16. For the first time in India,
capacity addition from renewables (11.3 GW) surpassed the capacity added from
conventional sources (10.3 GW) in 2016-17.
Renewables now contribute 6.59% of the electricity generated in the country. A major development
is the decision to allot setting up of 15,000 MW of grid-connected solar PV plants to the National
Thermal Power Corporation (NTPC). Of this, total 3,000 MW capacity has been allotted across
Andhra Pradesh, Karnataka, Rajasthan, Telangana and Uttar Pradesh, as on 31 December 2016.
NTPC is also executing EPC projects for installing grid-connected solar projects under various
schemes.
POLICY AND REGULATION
2016-17 was a year of major policy initiatives in India. Two important developments that took place
were the policy for repowering of wind projects and the draft wind-solar hybrid policy. The
repowering policy provides similar incentives to old wind power projects of capacity 1 MW or below
as those provided to new projects, while the draft wind-solar hybrid policy aims to achieve wind-
solar hybrid capacity of 10 GW by 2022. The year also marked the introduction of the first national-
level draft mini/microgrid policy which aims to address the concerns of energy service companies
regarding future extension of the grid in their area of operation. Another important development
was the inclusion of renewable energy into the GST tax regime which annulled all previous
individual taxes levied on renewable energy. While the 2015 decision to confer priority sector
lending status to renewables continued to have a positive impact on the sector, the decisions to

xiii
reduce accelerated depreciation benefit on renewables from 80% to 40%, do away with generation
based incentives for wind power from 1 April 2018, and divert the proceeds collected from the
National Clean Energy and Environment Fund to compensate the states for GST losses, could
negatively impact development of renewables in the short-term.
The migration from the feed-in tariff mechanism to competitive bidding for solar power
procurement under JNNSM Phase I and II was a major policy shift. Tariff discovery of solar power
continued from 2012 through 2017 and was successful in moving solar power towards grid parity.
In 2012, under JNNSM Batch-I of Phase-I, the quoted tariff was `10.95 per kWh. In the last bid in
2017 (REWA Project in Madhya Pradesh), the tariff discovered was `3.3 per kWh which was one-
third of the Phase-I tariff. These low rates were also facilitated by a drastic reduction in capital costs
from `17 lakhs/MW in 2012 to `5.3 lakhs/MW in 2016-17. The tariff policy announced by the
Ministry of Power, Government of India, on 28 January 2016, went one step further in prescribing
procurement of power by all states from all RE sources through competitive bidding, except for
waste-to-energy projects. Consequently, in February 2017, competitive bidding for wind power
procurement was also introduced by SECI at the national level, in which wind tariffs touched a
record low of `3.46 per kWh. Thereafter, this trend picked up at state levels too. Overall, it can be
said that renewables are moving towards grid parity. Pursuant to the revised Tariff Policy on 22
July 2016, the Ministry of Power notified the long-term growth trajectory of RPO for solar and non-
solar sectors for the next three years viz. 2016-17 to 2018-19. This was another significant positive
development during the year.
MANUFACTURING
Solar power is now the fastest growing RE technology in India. However, it has only two main types
of manufacturing industries in the country viz. solar cell manufacturing (installed capacity 1,468
MW) and assembling of solar PV modules (installed capacity of 4,307 MW). Considering the installed
capacity of 5,525 MW in 2016-17, the industrial capacity in the sector is very inadequate. More
significantly, manufacturing of upstream elements in the supply chain, like polysilicon and wafers
are absent in India. Creating such a vertically integrated supply chain would be critical to future
sustainability of the sector. In contrast, wind has an installed manufacturing capacity of 12,000 MW;
however, the supply chain of components needs to be augmented. Special policy focus is therefore
needed to support domestic RE manufacturing and export. In both solar and wind, exports declined
drastically from 2008 to 2016, with almost 84% of solar panels being imported during 2016-17.
INVESTMENT FLOWS
An estimated `7,11,533 million was invested as debt and `3,04,943 million was invested as equity in
the renewable energy sector. The largest estimated investment is seen in the solar sector with
`3,34,602 million debt and `1,43,401 million equity. Interest rates on loans offered by NBFCs were
xiv
marginally lower than that by banks. While ECB was US$429 million, multilateral development
banks contributed significantly viz. ADB (57%), World Bank (32%) and European Investment Bank
(11%). In a major development, NTPC and IREDA went ahead to issue green bonds during FY 2016-
17.
EMISSIONS SECNARIO
With India committing to 33-35% emissions intensity reduction by 2030 (INDCs), renewable power
generation is seen as an important contributor to emissions reduction. Based on the assumption that
wind and solar (the largest contributors to capacity addition in renewables in 2016-17) replaced
coal-based generation, it is estimated that avoided CO2 emissions were approximately 62.72 million
metric tonnes in the current year. Further, around 256.95 million metric tonnes of CO2 emissions
could be reduced if India achieves its target of generating 160 GW from wind and solar by 2022.
*********

xv
INTRODUCTION AND SCOPE
Renewables India 2017: Towards Grid Parity, provides a holistic snapshot of the status of grid-
connected renewable energy in India for the year 2016-17. The report aims to provide policy
makers, government officials, renewable energy professionals, civil society and other key
stakeholders with insights on developments taking place in the RE sector on an annual basis,
enabling them to make informed decisions, and aiding the transition to a low-carbon and sustainable
economy. It is based on validated data sourced from government reports, industry and think-tank
chronicles and publications, and other relevant journals and market updates. The report reviews the
financial year 2016-17 from April 2016 to March 2017.
Chapter 1 provides the status of renewable electricity (grid and off-grid) in 2016-17. Starting with a
brief global overview of RE and moving on to presenting India’s targets and achievements in
capacity addition and installed capacity, the chapter provides a critical overview of grid-based
electricity generation in India (conventional and renewable), concluding with a summary on off-grid
electricity in the country.
Chapter 2 summarizes the policy landscape of grid-connected renewables in 2016-17, reviewing the
status of different policies and fiscal/financial incentives across states, along with their impact on RE
development in India. A section on the status of off-grid policy and regulation is also included.
The regulatory framework for grid-connected renewables has been evolving rapidly with the
increasing share of renewables in the total energy mix. Chapter 3 delves into the different regulatory
processes that guided grid-connected renewable energy development in India in 2016-17, namely
tariff regulations, Renewable Energy Obligation (RPO) and Renewable Energy Certificate (REC)
Mechanism, Open Access (OA) regulations, and forecasting and scheduling regulations, besides net
metering regulations for decentralized rooftop solar projects. A brief analysis of state RPO
compliance for the year is also made in the chapter.
The announcement of the ‘Make in India’ initiative by the Government of India to promote
indigenous manufacturing has spurred huge opportunities of growth for renewable energy
manufacturing. Whilst an area of critical development, the topic finds very little mention in printed
literature. An attempt has thus been made in Chapter 4 to capture data on wind and solar
manufacturing—the two sectors that were responsible for the largest capacity addition in 2016-
17—focusing on the wind and solar industry supply chains and exports/imports in the wind and
solar sectors.
Chapter 5 dwells on the investment flows in renewables in 2016-17. For the first time, an effort has
been made to provide a holistic overview of investments made in the RE sector, both through debt as
well as equity funding. The chapter showcases and reviews the basket of investments that were
provided for renewables in 2016-17, and analyses its adequacy in financing RE development in
India.
Chapter 6 is a slight deviation from the rest of the report. The growing concerns of rapidly increasing
greenhouse gas emissions, especially from the use and production of energy, has positioned climate
change as a focal point in India’s energy discourse. It was, therefore, considered essential to provide
a brief perspective of this critical interlinkage (between energy and climate), since energy is key to
India’s current and future developmental goals. The chapter focuses on India’s emissions scenario
(especially from the energy sector) and the role of renewable energy (wind and solar) in emissions
reduction.

xvi

1
1.
ELECTRICITY GENERATION
The energy sector worldwide is on the cusp of a major transition. This is triggered by long-term
concerns of fossil fuel depletion, energy security, climate change and sustainability of development.
India is also a major participant in this global transition. In this chapter, in the background of an
overview of global developments in the renewable sector, the chapter analyses renewables in India
as it evolved during financial year 2016-17 by juxtaposing it with historical developments in the
country.
1.1 RENEWABLE ENERGY: GLOBAL OVERVIEW
In 2016, an estimated 161 GW (including large hydro) of renewable energy capacity was added
worldwide. This is the largest annual increase till date, up almost 9% compared to 2015, taking the
cumulative installed renewable capacity to nearly 2,017 GW (including large hydro) at the end of
2016.[1] Solar PV dominated the landscape with 47% of newly installed renewable power capacity,
while wind and hydropower accounted for about 34% and 15.5% respectively. Thus, renewables
accounted for an estimated 62% of net additions to global power generating capacity in 2016. In
India, wind power and solar PV capacity increased substantially, and bio-power generation was up
8% as compared to 2015. Top 6 RE countries is summarised in Fig.1.1.
If large hydro is accounted for, top countries for total installed renewable electric capacity continued
to be China, the United States, Brazil, Germany and Canada. Excluding hydro, the top countries were
China, the United States and Germany, followed by Japan, India and Italy, and Spain and the United
Kingdom.
In 2016, global new investments in renewables (excluding large hydro) fell by 23% to $241.6 billion,
the lowest since 2013, but roughly double that of fossil fuel generation for the fifth consecutive year.
New investment in solar totalled $113.7 billion, down 34% from 2015. Wind followed closely at
$112.5 billion globally, down 9% from 2015, biofuels $2.2 billion (down 37%), biomass and waste
$6.8 billion (remained steady) and small hydro $3.5 billion. A combination of two factors, viz. lower
costs of technologies (a positive trend), and considerable slowdown of renewable energy financing
in some emerging markets like China and Japan (a negative trend), were the key reasons for fall in
investments in 2016. The bright spot in investments was seen in assets financing, which totalled
$110.3 billion, up 17% from 2015. Purchase of assets such as wind farms and solar parks reached a
highest-ever figure of $72.7 billion, while corporate takeovers reached $27.6 billion, 58% up from
2015.[1]
Tables 1.1 and 1.2 ranks countries as per capacity addition in 2016 and cumulative installed capacity
till end 2016 respectively. China is undoubtedly seen as the leader in the RE sector, topping both in
cumulative and annual capacity addition (solar, wind, and hydro), while India ranks 4th in terms of
cumulative installed capacity of wind, and annual capacity addition of solar PV and wind in 2016.

Electricity Generation
2
Figure 1.1: Top Six Countries and their RE Installed Capacity (2016)
Source: Renewables 2017, Global Status Report
Table 1.1: Country Ranking by Capacity Addition in 2016
1 2 3 4 5 World
GW GW GW GW GW GW
Geothermal Indonesia 0.2 Turkey 0.2 Kenya 0.03 Mexico .015 Japan .001 0.447
Hydropower China 8.9 Brazil 5.3 Ecuador 2.0 Ethiopia 1.5 Vietnam 1.1 25
Solar PV China 34.5 US 14.8 Japan 8.6 India 4.1 UK 2 75
Wind China 23.4 US 8.2 Germany 5 India 3.6 Brazil 2 55
Bio-Diesel US - Brazil - Argentina - Germany - Indonesia - -
Source: Renewables 2017, Global Status Report
Table 1.2: Country Ranking by Cumulative Installed Capacity (2016)
1 2 3 4 5 World
GW GW GW GW GW GW
Geothermal US 3.6 Philippines 1.9 Indonesia 1.6 New
Zealand
1.0 Mexico 0.9 13.5
Hydropower China 305 Brazil 97 US 80 Canada 79 Russia 48 1096
Solar PV China 77.4 Japan 42.8 Germany 41.3 US 40.9 Italy 19.3 303
Wind China 168.7 US 82.1 Germany 49.5 India 28.7 Spain 23.1 487
Bio-Power US - China - Germany - Brazil - Japan - -
Source: Renewables 2017, Global Status Report
1.2 INDIA: RE POTENTIAL, TARGETS & ACHIEVEMENTS
1.2.1 Renewable Energy Potential
MNRE has revised and raised the renewable energy potential for India to an estimated 900 GW. Solar
is seen to have the largest potential, with a revised estimate of 750 GW (considering use of 3%
wasteland for solar installations) followed by wind with 102 GW (at 80-meter mast height). The
National Institute of Wind Energy (NIWE) has revised the estimate for wind power to 302 GW at
100m mast height. Potential for small hydro and bioenergy is 20 GW and 25 GW respectively. [2]

Electricity Generation
3
1.2.2 Renewable Targets and Achievements
In the 2015 union budget, the Government of India set the target of achieving 175 GW by 2022. The
target comprises 60 GW from wind, 100 GW from solar, 10 GW from biomass, and 5 GW from small
hydro. Out of 100 GW solar, 40 GW is estimated from rooftop solar while remaining 60 GW is from
ground-mounted, grid-connected medium and large solar projects. Fig 1.2 gives the potential for
renewable energy vis-à-vis the RE target. Region-wise targets have also been detailed as shown in
Fig. 1.3. Similarly, Table 1.3. shows the annual capacity addition targets from 2014-15 to 2021-22.[2]
Figure 1.2: Renewable Energy Potential vs 2022 Target (GW)
Source: WISE, 2017 (compiled from MNRE Annual Report 2017)
Figure 1.3: Region-wise Targets to Achieve 175 GW by 2022
Source: WISE, 2017 (compiled from MNRE data)

Electricity Generation
4
Table 1.3: Year-wise and Technology-wise Capacity Addition Targets to 2022
(Grid-connected RE only)
Source: Report on 175 GW RE by 2022, NITI Aayog, 2015
If the target of 175 GW by 2022 is achieved, it would contribute to achieving 19.44% of the total RE
potential of 900 GW and about 20.3% of electricity in the total demand. This would mean generation
of around 327 BU of electricity (162 BU from solar, 112 BU from wind, 38 BU from biomass, 15 BU
from SHP).[3]
Southern, western, and northern regions of India are expected to install more than 91% of the total
target while remaining is expected to be contributed by north-eastern and eastern regions.
Maharashtra has the highest target of 22 GW followed by Tamil Nadu with 21.5 GW (Fig 1.3).
For the 12th Plan period (2012-17) a capacity addition target of 30,000 MW was set by the
Government of India, which included 10 GW from solar, 15 GW from wind and 5 GW from other
renewable energy sources. Against this target, India achieved 32.7 GW of grid-connected renewable
energy capacity addition. This included 15 GW wind, 11.3 GW solar, 5.3 GW bio-power and WTE, and
1 GW SHP.
From 27.5 GW in 2012-13, total installed grid-connected renewable energy capacity reached 57.2
GW at the end of 2016-17, with over 20% annual average growth rate in the last five years. (Fig.1.4).
With this, RE now contributes 17.51% of the total installed power generation capacity in the
country. Wind accounted for 32.2 GW (32,279.77 MW) or 56.39% of renewable installed capacity,
followed by solar with 12.28 GW (12,288.83 MW) or 21.47%, small hydro 4.37 GW (4,379.86 MW)
(7.65%), while biomass with cogeneration and waste-to-energy (WTE) comprised 8.18 GW
(8,181.70 MW) (14.29%) and 0.11 GW (114.08 MW) (0.2%) respectively (Table 1.4).[4]
Year
Rooftop
Solar
Ground-Mounted
Solar Solar Wind
Small
Hydro Biomass Total
(GW) (GW) (GW) (GW) (GW) (GW) (GW)
Cumulative
installed capacity
by 2014-15 3 24 4.1 4.4 35.5
2015-16 0.2 1.8 2 3.2 0.14 0 5.3
2016-17 4.8 7.2 12 3.6 0.14 0.9 16.7
2017-18 5 10 15 4.1 0.14 0.9 20.2
2018-19 6 10 16 4.7 0.14 0.9 21.8
2019-20 7 10 17 5.4 0.14 0.9 23.5
2020-21 8 9.5 17.5 6.1 0.14 0.9 24.7
2021-22 9 8.5 17.5 8.9 0.14 0.9 27.5
Total 40 60 100 60 5.08 9.98 175

Electricity Generation
5
Figure 1.4: Annual Capacity Addition and Cumulative Installed Capacity of Grid-Connected RE
12th Plan Period (2012-2017)
Source: WISE, 2017 (compiled from MOSPI, CEA data)
Table 1.4: Status of Grid-Connected Renewable Energy
(as on 31 March 2017) Sector Achievements
(MW)
Share in
Total RE
Capacity (%)
Wind Power 32,279.77 56.39%
Solar Power 12,288.83 21.47%
Small Hydro Power 4,379.86 7.65%
Bio Power (Biomass & Gasification and
Bagasse Cogeneration)
8,181.70 14.29%
Waste to Energy 114.08 0.2%
Total 57,244.24 100%
Source: Installed Capacity March 2017, CEA
State-wise, Tamil Nadu topped the list with 10.6 GW (10,625 MW) RE installed capacity, followed by
Maharashtra with 7.6 GW (7,647.60 MW) and Karnataka 7.4 GW (7,457.97 MW). List of state-
wise/UT-wise installed capacity is provided in Table 1.5.

Electricity Generation
6
Table.1.5: State & U.T. Wise Targets and Installed Capacity
(As of 31 March 2017)
RE Target 2022 Installed Capacity by March 2017 (MW)
State Sector Private Sector Total
1 Delhi 2,762 - 56.27 56.3
2 Haryana 4,376 59.30 192.00 251.3
3 Himachal Pradesh 2,276 256.61 575.93 832.5
4 Jammu & Kashmir 1,305 108.03 51.36 159.4
5 Punjab 5,066 127.80 1,025.30 1,153.1
6 Rajasthan 14,362 23.85 6,213.95 6,237.8
7 Uttar Pradesh 14,221 25.10 2,274.73 2,299.8
8 Uttarakhand 1,797 62.87 452.94 515.8
9 Chandigarh 153 - 17.32 17.3
Northern Region Total 46,318 663.56 10,859.80 11,523.4
10 Goa 358 0.05 0.71 0.8
11 Gujarat 17,133 8.00 6,663.89 6,671.9
12 Chhattisgarh 1,808 11.05 421.81 432.9
13 Madhya Pradesh 12,018 83.96 3,453.93 3,537.9
14 Maharashtra 22,045 208.13 7,439.47 7,647.6
15 D&N Haveli 449 - 2.97 3.0
16 Daman & Diu 199 - 10.46 10.5
Western Region Total 54,010 311.19 17,993.24 18,304.4
17 Andhra Pradesh 18,477 89.50 6,074.92 6,164.4
18 Telangana 2,000 - 1,545.88 1,545.9
19 Karnataka 14,817 155.33 7,302.64 7,458.0
20 Kerala 1,970 145.02 193.70 338.7
21 Tamil Nadu 21,508 122.70 10,502.30 10,625.0
22 Puducherry 246 - 0.08 0.1
Southern Region Total 59,018 512.55 25,619.52 26,132.1
23 Bihar 2,762 70.70 221.52 292.2
24 Jharkhand 2,005 4.05 23.27 27.3
25 Odisha 2,377 6.30 188.15 194.5
26 West Bengal 5,386 91.95 332.69 424.6
27 Sikkim 86 52.11 - 52.1
Eastern Region Total 12,616 225.11 765.63 991.7
28 Assam 688 30.01 15.88 45.9
29 Manipur 105 5.45 0.03 5.5
30 Meghalaya 211 31.03 0.01 31.0
31 Nagaland 76 30.67 0.50 31.2
32 Tripura 105 16.01 5.09 21.1
33 Arunachal 539 104.61 0.27 104.9
34 Mizoram 97 41.47 0.10 41.6
North Eastern Region Total 1,821 259.25 21.88 281.1
35 Andaman & Nicobar 27 5.25 6.56 11.8
36 Lakshadweep 4 - 0.7 0.7
Islands Total 31.0 5.25 6.73 12.5
37 Others 720
All India Total 174,534.0 1,976.91 55,267.33 57,244.24
Source: CEA, Installed Capacity, March 2017

Electricity Generation
7
1.2.3 Capacity addition in 2016-17
For 2016-17, the capacity addition target for grid-connected power was 16,660 MW: wind 4000 MW,
solar 12,000 MW, small hydro 250 MW, bio-power 400 MW and waste-to-energy 10 MW. As against
this, the actual capacity installed in 2016-17 was 11,320 MW, the technology-wise break-up of which
is in Table 1.6. [2]
Table.1.6: Capacity Addition in 2016-17
(Grid Power only)
Sr.
No.
Technology Capacity Installed
(MW)
1. Solar 5525.98
2. Wind 5502.37
3. Biomass 161.95
4. Small Hydro 106.39
5. Waste to Energy 23.50
Total 11320
Source: WISE, 2017 (compiled from CEA data)
Out of the total 5502.37 MW of wind power, maximum installations took place in the following top
six states: Andhra Pradesh (2179.45 MW), Gujarat (1391.65 MW), Karnataka (905.55 MW), Madhya
Pradesh (356.70 MW), Rajasthan (287.70 MW) and Tamil Nadu (256.13 MW). The balance was
added in Maharashtra, Telangana and Kerala. While Andhra Pradesh (445%), Gujarat (255%) and
Karnataka (292%) registered massive growth, Madhya Pradesh (-72%), Rajasthan (-58%),
Maharashtra (-55%) and Telangana (-70%) registered huge decline compared to the previous year.
With the addition of 5502.37 MW, wind power reached cumulative installations of 32,279.77 MW in
2016-17 with a total of 27,720 MW to be installed to achieve the 60 GW target upto 2022.[5]
With the installation of 5525 MW in 2016-17, cumulative installed capacity of solar power in India
reached 12,288.83 MW. This was a quantum jump over the previous year. The six leading solar
power states in India, in terms of installed capacity are Tamil Nadu, Rajasthan, Gujarat, Telangana,
Andhra Pradesh and Madhya Pradesh. During the next five years, 87,712 MW capacity will have to
be installed to achieve the 100 GW target by 2022. According to the Bridge to India report, out of the
12,288 MW installed so far, the investor profile and share is as follows: Indian corporates (47%),
private equity backed IPPs (25%), international developers (18%) and public sector developers
(10%). Public sector companies like NTPC have started investing in the sector, which is a good
development.[6]
1.3 ELECTRICITY GENERATION
1.3.1 Installed Capacity Mix
India is the world’s third largest producer of electricity, having total installed capacity of 326,832.55
MW. Of this, 66.80% is from thermal energy (58.79% from coal, 7.75% from gas and 0.26% from oil),
2.07% from nuclear power, 13.61% from large hydro, and 17.51% from other renewables (Fig 1.5
and Table 1.7).

Electricity Generation
8
Figure 1.5: Source-wise Installed Capacity (March 2017)
Source: CEA, Installed Capacity, March 2017
Table 1.7: India Electricity Capacity–Mix
Source: CEA, Installed Capacity, March 2017
Peak power deficit in India reduced from 15.1 GW (15,157 MW) (12.7%) in 2009-10 to 2.6 GW
(2,608 MW) (1.6%) in 2016-17, and total energy deficit fell from 83.95 BU (10.1%) in 2009-10 to
7.59 BU (0.7%) in 2016-17. The power supply trend from 2009-10 to 2016-17 is represented in
Figure 1.6. [7]
Source Installed
Capacity (MW)
% of Total
Installed Capacity
Coal 192,162.88 58.79%
Gas 25,329.38 7.75%
Diesel 837.63 0.26%
Total Thermal 218,329.89 66.80%
Nuclear 6,780.00 2.07%
Hydro 44,478.42 13.61%
Small Hydro 4,379.86 1.34%
Wind 32,279.77 9.88%
Biomass/Cogen 8,181.70 2.50%
Waste to Energy 114.08 0.03%
Solar Power 12,288.83 3.76%
Total Renewable
(Excluding Hydro)
57,244.24 17.51%
Grand Total India 326,832.55 100.00%

Electricity Generation
9
Figure 1.6: Peak Power and Energy Deficit Trend (2009-10 to 2016-17)
Source: Minstry of Power website, 2017
1.3.2 Generation from Conventional Sources
The total electricity generation from conventional sources in India in 2016-17 was 1,160.141 BU.
This was a growth of 4.72% over the 1107.8 BU generated in 2015-16. The performance of
conventional sources in electricity generation during the last decade is shown in Fg.1.7.[7]
Figure 1.7: Electricity Generation from Conventional Sources (2009-10 to 2016-17)
Source: Minstry of Power website, 2017
1.3.3 Generation from Renewable Energy
For the last three years, electricity generation from renewable energy sources has been rising
rapidly. In 2016-17, total RE generation in India was 81.88 BU, up from 65.78 BU in 2015-16. This
marked a 24.47% growth from 2015-16. Though electricity generation from solar almost doubled in

Electricity Generation
10
2016-17, wind continued to dominate renewable electricity generation in India. Share of wind in
total RE electricity generation increased from 50.21% in 2015-16 to 56.19% in 2016-17. In the same
period, share of solar increased from 11.32% to 16.49%, with biomass, small hydro and waste-to-
energy accounting for 17.28%, 9.68% and 0.37% respectively. (Table 1.8).
Table 1.8: Renewable Electricity Generation (BU) with % Share in Total RE Electricity
(2014-15 to 2016-17)
Wind Solar Biomass Small Hydro Waste-to-
Energy
Total %
Growth
BU % BU % BU % BU % BU % BU
2014-15 33.77 54.65 4.60 7.44 14.95 24.19 8.06 13.04 0.41 0.67 61.79 -
2015-16 33.03 50.21 7.45 11.32 16.68 25.36 8.35 12.70 0.27 0.41 65.78 6.47
2016-17 46.00 56.19 13.50 16.49 14.15 17.28 7.92 9.68 0.30 0.37 81.88 24.47
Source: WISE, 2017 (compiled from CEA reports)
1.3.4 Renewables vis-à-vis Conventional Electricity Generation
During 2015-16 and 2016-17 the share of electricity generation from renewable energy improved
from 5.61% to 6.59% of the total generation. The significant point is the growth in generation from
renewables which achieved a quantum jump of 24.47% in 2016-17 compared to the previous year.
In contrast, the growth in generation from conventional sources declined from 5.64% in 2015-16 to
4.72% in 2016-17 (Table 1.9).
Table 1.9: Generation from Conventional & RE Sources
Total
Generation
(BU)
Conventional
Sources
(BU)
Growth in
Conventional
(%)
Renewable
Sources
(BU)
Growth in
Renewables
(%)
Conventional
share in total
%
Renewable
share in
total %
2014-15 1110.45 1048.67 - 61.78 - 94.44 -
2015-16 1173.65 1107.82 5.64 65.78 6.47 94.39 5.61
2016-17 1242.01 1160.14 4.72 81.88 24.47 93.41 6.59
Source: WISE, 2017 (compiled from CEA reports and Ministry of Power website)
According to the recent report published by the Ministry of Power, Govt. of India, for the first time in
2016-17, renewable capacity addition at 11.3 GW exceeded that of conventional energy, which was
only 10.3 GW. (Figure 1.8). [8]

Electricity Generation
11
Figure 1.8: Capacity Addition in 12th Five-Year Plan Period
(2012 – 2017)
Source: WISE, 2017 (compiled from Ministry of Power and CEA data)
1.4 OFF-GRID RENEWABLE POWER
With the advent of the Rajiv Gandhi Grameen Vidyutikaran Yojana (Now Deen Dayal Upadhyay Gram
Jyoti Yojana) in 2005, India achieved rapid electrification of villages across the country. However,
even after grid extension in the identified regions, a large number of households still remain without
access to electricity. India currently has approximately 77 million households who lack adequate
access to grid-connected electricity and about 20 million underserved households who receive less
than four hours of electricity in a day (Census 2011, India). While grid connectivity is expected to
improve over the next 10 years, at the current rate of grid expansion, urbanization and population
growth, a large share of households will still not have access to reliable electricity in the near future.
Thus, expansion of renewable-based, off-grid electricity in India assumes an important role in India’s
electrification process.
MNRE offers incentives and subsidies for promotion of off-grid electricity solutions. However, these
systems have been promoted by private players also who sell their products through dealers in the
rural sector. Given the huge demand for electricity in electrified areas, private players will need to
play a more significant role in expansion of off-grid systems in these areas in the years to come.
As per MNRE data, presently, there are more than 13.9 lakh home lighting systems, while renewable
energy-based stand-alone power plants have an installed capacity of about 172 MWp. State/UT-wise
status is given in Table 1.10.[9]

Electricity Generation
12
Table 1.10: State/UT-wise Status of Off-Grid Renewable Energy Systems
State / UT Solar Home Lighting
Systems
Stand-Alone Renewable Energy-
Based Power Plants
Nos kWp
1 Andhra Pradesh 22,972 3,785.595
2 Arunachal Pradesh 18,945 600.1
3 Assam 6,926 1,605
4 Bihar 12,303 3,968.6
5 Chhattisgarh 7,754 27,867.72
6 Delhi 0 1,269
7 Goa 393 32.72
8 Gujarat 9,253 13,576.6
9 Haryana 56,727 2,321.25
10 Himachal Pradesh 22,592 1,390.5
11 Jammu & Kashmir 65,319 7,719.85
12 Jharkhand 9,450 3,539.9
13 Karnataka 49,644 4,676.41
14 Kerala 40,412 13,894.39
15 Madhya Pradesh 4,016 3,654
16 Maharashtra 3,497 3,857.7
17 Manipur 3,900 1,241
18 Meghalaya 7,844 884.5
19 Mizoram 6,801 1,719
20 Nagaland 1,045 1,506
21 Odisha 5,274 567.515
22 Punjab 8,626 1,950
23 Rajasthan 1,51,964 10,850
24 Sikkim 15,059 850
25 Tamil Nadu 2,26,946 12,752.6
26 Telangana 0 5,368
27 Tripura 32,723 612
28 Uttar Pradesh 2,35,909 10,041.46
29 Uttarakhand 91,595 1,534.03
30 West Bengal 1,45,332 1,730
31 Andaman &
Nicobar
468 167
32 Chandigarh 275 730
33 Lakshadweep 0 2,190
34 Puducherry 25 121
35 Others 24,047 23,885
36 NABARD 1,08,000 0
Total 13,96,036 1,72,458
Source: MNRE Annual Report 2016-17
1.4.1 Growth Trajectory of Off-Grid RE Electricity
Like grid-connected RE, a major leap in installations can also be seen in the off-grid sector (Figures
1.9 and 1.10). With rapid decline in the cost of off-grid RE systems coupled with increased level of
awareness among the rural masses, private and self-sponsored off-grid RE system installations are
picking up due to market economics. From 603 systems with 2.92 MWp in 2009-10 to 1396 systems
with 172 MWp, the growth has been significant. Such huge increase in capacity with fewer number
of systems also signifies growth of larger sized rooftop solar systems in the country in the last few
years.

Electricity Generation
13
Figure 1.9: Growth Trajectory of Off-Grid Home Lighting Systems (Numbers)
Source: WISE, 2017 (compiled from India Energy Statistics, MOSPI)
Figure 1.10: Growth Trajectory of Off-grid Power Plants (Capacity)
Source: WISE, 2017 (compiled from India Energy Statistics, MOSPI)
***

14
2.
POLICY LANDSCAPE
Policy initiatives by government are major catalysts in triggering technology transition. India has been
an early mover in initiating policies for development of renewables, as also in establishing
institutional structures for the same. Beginning with institutional structures in the power sector, this
section surveys critical policy developments relating to renewables both at the national and state
levels. While the national policy framework is the umbrella under which states operate, the real action
takes place at the state level. Hence a detailed survey of state polices is included here. The year under
review has been notable for many new policy initiatives spurring the growth of the sector. Here we
try to capture the essence of it all.
NATIONAL POLICY FRAMEWORK
The planned development of renewable energy in India started in 1982, when the Department of Non-
Conventional Energy Sources (DNES) was created in the Ministry of Energy to look after all aspects
relating to new and renewable energy. The department was upgraded to a separate Ministry of Non-
Conventional Energy Sources (MNES) in 1992 and was re-christened Ministry of New and Renewable
Energy (MNRE) in October 2006. The current organizational structure of the power sector in India is
represented in Figure 2.1.
The introduction of feed-in tariff for wind power during the early 1990s was a milestone in India’s
journey towards mainstreaming renewable energy. With the enactment of the Electricity Act, 2003,
(which is considered the ‘umbrella’ legislation for the power sector), renewable energy and the entire power sector got a major boost. The Act was the first legislation to give a clear direction on the
development and integration of renewable energy into the grid.[1] In 2006, India got its National Tariff
Policy through which the respective state commissions were entrusted with the responsibility of
determining renewable purchase obligations for distribution companies at preferential tariff.[2] In 2008, the renewable energy sector got a further impetus with the advent of the National Action Plan
on Climate Change (NAPCC).[3] The plan identified eight, core ‘national missions’ for sustainable
development, of which one was the ‘National Solar Mission’, targeting a 20 GW solar capacity addition by 2022 (later revised to 100 GW). The national mission brought solar to the centre of the Indian
renewable energy mix. While the annual capacity addition in wind power continued to dominate the
RE scenario, the trend was reversed during 2016-17, when the capacity addition for solar power
(5525 MW) exceeded wind power (5502 MW)[4], and the trend is likely to continue in future. A
historical timeline of key policies instrumental in the development of RE is given in Figure 2.2. Figure
2.3 gives a representation of the historical growth of energy (RE and conventional) in India.

Policy Landscape
15
Figure 2.1: Organisational Framework of the Power Sector
(Source: WISE, 2016)
Source: WISE, 2016
Figure 2.2: Key Policies Instrumental in Development of RE in India - Timeline
Source: ESMAP, World Bank, 2010
National RPO Trajectory (2016)
NITI Aayog
(Planning
Commission)
Power and
Energy
Division
CERC
REC
PTC
NHPC
Ministry of Power
CEA
NTPC
PFC
PGCI
L
Government of India
Ministry of New
and Renewable Energy
IREDA
NISE
(SECI)
NIWE (C-WET)
State Nodal Agency
SSS NIRE
Provincial / State
Government
Department of
Energy/Power
SERC

Policy Landscape
16
Figure 2.3: Historical Growth of Renewable Energy in India
Source: CEA, 2017
POLICY SCENARIO ACROSS STATES
In India, besides the Electricity Act, 2003, the development of renewables is guided by two sets of
policies: state government policies and central government policies. Of the 29 states and 6 union
territories, 27 states and 2 union territories have declared state-level policies for renewable energy,
some of which are integrated and some of which are technology-specific. Table 2.1 summarizes the
policy landscape in India.[5]
Table 2.1: Policies Enacted in Various States and Union Territories
State Wind Solar
thermal
Solar
PV
Small
hydro
Biomass MSW Integrated Net
metering
Micro/Mini
Grid
Andaman
and Nicobar √
Andhra
Pradesh √ √ √
Arunachal
Pradesh √
Assam √
Bihar √
Chandigarh
Chhattisgarh √ √ √
Dadra and
Nagar Haveli
Daman and
Diu
Delhi √
Gujarat √ √ √ √
Haryana √ √ √
Himachal
Pradesh √ √
Jammu and
Kashmir √ √ √
Jharkhand √ √
Karnataka √ √ √† √
0
50
100
150
200
250
300
350
19
47
19
50
19
56
19
61
19
66
19
69
19
74
19
79
19
80
19
85
19
90
19
92
19
97
20
02
20
07
20
12
20
13
20
14
20
15
20
16
20
17
GW
Renewables
Nuclear
Diesel
Gas
Coal/Lignite
Hydro

Policy Landscape
17
State Wind
Solar
Thermal
Solar
PV
Small
Hydro Biomass MSW Integrated
Net
metering Micro/MiniGrid
Kerala à à à à
Lakshadweep
Madhya
Pradesh √ √ √ √ √
Maharashtra √
Manipur √ √† √
Meghalaya √
Mizoram à à à à
Nagaland
Odisha à à à
Puducherry √ √
Punjab √
Rajasthan √ √ √ √
Sikkim
Tamil Nadu √ √
Telangana √ √ √
Tripura √
Uttar
Pradesh √ √ √ √ √
Uttarakhand √ √
West Bengal √
Source: WISE, 2016 † Karnataka has published integrated RE policy and solar policy in 2014 but the integrated RE policy does not cover
solar technologies. Kerala’s integrated RE policy holds for all technologies other than wind and solar. Manipur
integrated RE policy does not cover small hydro and rooftop. In Mizoram, small hydro and solar policies are not covered
under integrated RE policy. Odisha RE integrated policy has superseded the Odisha solar policy.
Impact of State Policy on Wind and Solar
Impact on Wind
Most times, state policies work hand-in-hand with central policies to boost RE development. Also,
other factors such as greater awareness about RE, financial assistance and fiscal incentives, etc., also
contribute towards RE development. In this section, the contribution of state policies in enhancing RE
installed capacity is analysed. Figure 2.4 provides the status of wind power development before
implementation (-3 years) and after implementation (+3 years/till date) of state policies.

Policy Landscape
18
Figure 2.4: Average Wind Power Installed Capacity Addition
Pre- and Post-implementation of State Policies
Source: WISE, 2016
As is evident from Figure 2.4, the average installed wind capacity addition after policy implementation
almost doubled in Andhra Pradesh, more than doubled in Gujarat and increased almost eight times in
Madhya Pradesh. Further, Figure 2.4 shows that although development of wind started much earlier
in India (with the introduction of accelerated depreciation benefit and generation-based incentives),
state policies played a major role in accelerating growth of wind power in the states.
According to latest data, compound annual growth rate (CAGR) of cumulative wind power installed
capacity across the states varied from a mere 2% to 75% between 1 April 2014 and 31 December
2016. The significant growth in CAGR can be attributed to state policies. Highest growth of 75.42%
was observed in Madhya Pradesh and lowest growth of 1.91% was registered in Tamil Nadu. The
CAGR of cumulative installed wind capacity in wind-dominant states, between April 2014 and
December 2016, is depicted in Table 2.2.
Table 2.2: CAGR of Cumulative Wind Installed Capacity in
Wind-Dominant States (1 April 2014 to 31 December 2016)
States Cumulative Capacity as
on 01.04.2014
Cumulative Capacity
as on 31.12.2016
CAGR (%)
Andhra Pradesh 746 2,092.5 41.03
Gujarat 3,454 4,441.57 8.74
Karnataka 2,318 3,154.2 10.81
Kerala 35 43.5 7.52
Madhya Pradesh 424 2,288.6 75.42
Maharashtra 4,096 4,666.03 4.44
Rajasthan 2,785 4,216.72 14.83
Tamil Nadu 7,270 7,694.33 1.91
Source: MNRE, Annual Report 2013-14 to 2016-17
Impact on Solar
Figure 2.5 shows the average installed capacity addition before implementation (-3 years) and after
implementation (+3 years/till date) of state policies.
590565
99
392
477
304261
0
59
487
0
100
200
300
400
500
600
700
AndhraPradesh(2015)
Gujarat(2016)
Telangana(2016)
MadhyaPradesh(2012)
Rajasthan(2012)
Cap
acit
y A
dd
itio
n (
MW
)
Average Wind CapacityAddition after Policy
Average Wind CapacityAddition before Policy
(Year)-Year of Policy
Implementation

Policy Landscape
19
Figure 2.5: Average Solar Power Installed Capacity Addition
Pre- and Post-implementation of State Policies
Source: WISE, 2016
Andhra Pradesh, Tamil Nadu and Telangana show significant growth after implementation of state
policies. This growth could further be attributed to the introduction of JNNSM as well. While state
policies were the dominant force for annual installed capacity addition till 31 December 2015,
thereafter, most of the installed capacity in solar technology may be attributed to the Jawaharlal Nehru
National Solar Mission, as several projects were awarded under JNNSM then. Cumulative solar power
installed capacity under central and state policies up to 31 December 2015 is shown in Table 2.3.
Table 2.3: Cumulative Installed Capacity of Solar Power under Central and State Policies
(upto 31 December 2015)
States JNNSM
(MW)
State Policy
(MW)
Andhra Pradesh 94.75 211.07
Chhattisgarh 4.00 64.08
Gujarat 40.00 877.15
Karnataka 15.00 66.00
Kerala 0.025 12.00
Madhya Pradesh 225.25 307.55
Maharashtra 72.00 126.00
Odisha 22.00 30.00
Punjab 10.50 182.05
Rajasthan 944.10 67.65
Tamil Nadu 26.00 182.075
Telangana -- 61.95
Uttar Pradesh 12.00 110.74
Total 1465.63 2298.32
Source: MNRE, 2016
0.00
100.00
200.00
300.00
400.00
500.00
600.00
700.00C
apac
ity
Ad
dit
ion
(M
W)
Average Solar CapacityAddition after Policy
Average Solar CapacityAddition before Policy
(Year)-Year of Policy Implementation

Policy Landscape
20
According to the latest data, the CAGR in cumulative installed solar capacity has been nearer to or over
100% for many states between 1 April 2014 and 31 December 2016. A Significant jump in cumulative
installed capacity can be seen in almost all the states. Growth in solar has been mainly observed in the
last two years due to increased bidding activities by SECI, India. The CAGR of cumulative installed
solar power capacity in solar-dominant states of India between April 2014 and December 2016 is
depicted in Table 2.4.
Table 2.4: CAGR of Cumulative Solar Power Installed Capacity in Solar-Dominant States
(1 April 2014 to 31 December 2016)
States Cumulative Capacity
as on 01.04.2014
Cumulative Capacity
as on 31.12.2016
CAGR (%)
Andhra Pradesh 131.84 979.65 95.14%
Chhattisgarh 7.1 135.19 167.03%
Delhi 5.1538 38.78 95.96%
Gujarat 916.4 1,158.5 8.13%
Haryana 10.3 53.27 72.93%
Karnataka 31 327.53 119.43%
Madhya Pradesh 347.17 840.35 34.27%
Maharashtra 249.25 430.46 19.98%
Orissa 30.5 77.64 36.54%
Punjab 16.845 545.43 218.73%
Rajasthan 730.1 1317.64 21.75%
Tamil Nadu 98.36 1590.97 152.90%
Uttar Pradesh 21.08 239.26 124.73%
Uttarakhand 5.05 45.1 107.47%
Source: MNRE, 2014-2016
JAWAHARLAL NEHRU NATIONAL SOLAR MISSION
Launched as an initiative under India's National Action Plan on Climate Change (NAPCC) in 2008, the
Jawaharlal Nehru National Solar Mission (JNNSM) aims at establishing India as a global leader in solar
energy by creating a favorable policy environment for its deployment across the country.
Under the original plan of 2010, the Indian government sought to achieve total installed solar capacity
of 20 GW by 2022.[6] Table 2.5 depicts the details of the targets to be achieved.
Table 2.5: Phase-wise Solar Targets as per JNNSM
Sr.
No. Segment
Target for Phase I
(2010 - 2013)
Target for Phase II
(2013 - 2017)
Target for Phase III
(2017 – 2022)
1. Utility Scale Solar including
rooftop 1,100 MW 10,000 MW 20,000 MW
2. Off-grid Solar applications 200 MW 1000 MW 2000 MW
3. Solar collectors 7 million sq. metres 15 million sq. metres 20 million sq.
metres
Source: MNRE, 2010
In 2015, the government revised the solar target for 2022 from 20 GW to 100 GW. To reach 100 GW,
the yearly targets from 2015-16 onwards were also revised upwards. Details are shown in Figure 2.6.

Policy Landscape
21
Figure 2.6: Year-wise Revised Solar Targets to meet 100 GW by 2022
Source: MNRE, 2016
India’s cumulative installed solar capacity including rooftop is 12,288.83 MW (as on 31 March 2017).
This implies that 87,711.17 GW of solar capacity needs to be installed during the remaining five years
to reach the 100 GW target. This amounts to 17,542 MW per year of installed capacity up to 2021-22.
India added just above 5,000 MW solar capacity in 2016-17, which is still far below the average
capacity addition required per year. Nevertheless, with intensified policies and programmes initiated
by the government, the country is definitely expected to see a surge in solar installed capacity in the
future. The policy initiatives have been fuelled by falling interest rates and tariff. However, it will be
difficult to predict if the country will be able to achieve the 100 GW mark or not, especially, given the
fact that module prices may go up as demand picks up in USA and China, and India’s New Energy Policy
(as on 27 June), 2017 anticipates withdrawal of incentives and support mechanisms for renewable
energy over time.[7]
JNNSM Phase I (2010-13)
Under JNNSM Phase I, solar projects were allotted through a process of ‘reverse bidding’+. Bids were
invited in two batches: Batch-I of 150 MW Solar PV and 470 MW solar thermal, and Batch-II of 350
MW Solar PV.[8] A ‘Migration Scheme’ was also introduced to provide projects an option to migrate
from their existing arrangements to JNNSM, subject to the consent of distribution licensee, state
government and willingness of the developer. Rooftop PV and Small Solar Power Generation
Programme (RPSSGP) was also introduced under the mission. Table 2.6 shows the achievements made
in Phase I against the targets. It can be seen that the targets for Phase I were surpassed as on 31 March
2016.
_____________________________________
+In reverse bidding, solar power generators quote the minimum tariff/minimum viability gap funding for the power that they sell
to the buyers.
200012000 15000 16000 17000 17500 175005000
17000
3200048000
65000
82500
100000
0
20000
40000
60000
80000
100000
120000
2015-16 2016-17 2017-18 2018-19 2019-20 2020-21 2021-22
Yearly Target (MW) Cumulative capacity

Policy Landscape
22
Table 2.6: Achievements of Phase I Targets: JNNSM
Application segment
Targets for Phase 1 (2010-2013)
*Achieved as on
31 March 2016
Grid-connected (large plants, rooftop &
distribution grid-connected plants)
1100 MW 1686.44 MW
Off-grid solar applications
200 MW 252.5 MW
Solar Thermal Collectors (solar water
heaters, solar cookers, solar cooling,
industrial process heat applications, etc.)
7 million sq. metres 7.01 million sq.metres
Source: MNRE, 2016
*Realization of the projects takes 13 to 18 months after being sanctioned. This is the reason that achievement dates
are different from target dates.
JNNSM Phase II (2013-17)
Following the success of Phase I, the solar industry witnessed a great momentum wherein grid-
connected and off-grid projects were commissioned throughout the country. Phase II thus aimed at
achieving higher targets. Several schemes like bundling, Viability Gap Funding (VGF) schemes for
defense establishments, etc., were made available in this phase. These have been summarized in Table
2.7.

Policy Landscape
23
Table 2.7: Summary of Schemes in Phase II: JNNSM
Viability Gap
Funding
formerly through,
National Thermal
Power Corporation/
NTPC Vidyut Vyapar
Nigam Ltd
Defence
Schemes
Development of
Solar Parks
Canal
Top/Canal
Bank
Decentralised solar
rooftop, off-grid &
decentralised solar
applications
Salient Features 750 MW (Batch I);
3,000 MW (Batch
II); 2,000 MW
(Batch III); 5,000
MW (Batch IV);
1,000 MW (Batch V)
by Central Public
Sector Undertakings
(CPSUs) and
Government of India
organizations under
various
central/state
schemes/self-
use/3rd party
sale/merchant sale
of grid-connected
solar power
projects.
Solar Energy
Corporation of India
(SECI) has been
designated the
implementing
agency for these
schemes.
Projects will be
selected separately
based on domestic
15,000 MW of grid-
connected solar PV
power plants through
NTPC/NVVN in three
tranches as follows:
Tranche-I: 3,000 MW,
2014-15 to 2016-17.
Tranche-II: 5,000 MW,
2015-16 to 2017-18.
Tranche-III: 7,000 MW,
2016-17 to 2018-19.
Currently, Tranche-I is
under implementation.
In Tranche-I, which is
Batch-II of Phase-II of
National Solar Mission,
3000 MW capacity of
solar PV power plants
will be based on
bundling of solar power
(3000 MW) with
unallocated thermal
power (1500 MW) in
the ratio of 2:1 (in MW
terms).
To be set up in
various
establishments
of the Ministry
of Defence, Govt.
of India.
Project capacity
shall be, at least,
1 MW and up to
a maximum
capacity of 20
MW.
The capacity of the
solar parks shall be
500 MW and above.
The choice of
implementing agency
for developing and
maintaining the park
is left to the state
government.
The solar parks will
provide suitable
developed land with
all clearances,
transmission system,
water access, road
connectivity,
communication
network, etc.
100 MW grid-
connected solar
PV power plants
on canal banks
and canal tops
(50 MW on canal
tops and 50 MW
on canal banks).
The scheme includes
grid-connected solar
rooftop with capacity
from 1 kW to 500 kWp
per project/system, off-
grid solar applications,
solar thermal systems
and solar cookers.
Grid-connected
decentralised solar
rooftop plants and small
solar power plants can
be implemented through
business models which
may be
developed/adopted,
depending upon market
conditions, user’s
interest, and initiatives
by the Energy Services
Company (ESCOs).

Policy Landscape
24
Table 2.7: Summary of Schemes in Phase II: JNNSM
Viability Gap
Funding
formerly through,
National Thermal
Power Corporation/
NTPC Vidyut Vyapar
Nigam Ltd
Defence
Schemes
Development of
Solar Parks
Canal
Top/Canal
Bank
Decentralised solar
rooftop, off-grid &
decentralised solar
applications
content
requirement and
open category.
Tariff For 750 MW
scheme: Fixed
tariff of
`5.45/kWh for
25 years.
For 2,000 MW
scheme: Fixed
tariff of
`5.43/kWh for
25 years.
For 5,000 MW
scheme: `4.00/
kWh in states
where tariff has
fallen below
`4.50/kWh in
one or major
tenders; and
`4.50/kWh
where tariff has
remained over
`4.50/kWh in all
major tenders.
At tariff quoted during
the bidding process
with a tenure of 25
years.
Developer
mode: Fixed
levelised
tariff of
`4.50/kWh
for 25 years.
EPC mode:
No tariff
setting
required.
The tariff could be
either the CERC/SERC
regulated price or that
determined through
the bidding process.
At tariffs
mutually agreed
or as fixed by the
State Electricity
Regulatory
Commission.
The projects can be
installed on Net Metering
or Feed-in Tariff (FIT)
basis. This will be
decided by Regulators
/DISCOMs/Distribution
Licensee, in consultation
with the implementing
agencies.
Source: MNRE, 2016

Policy Landscape
25
Achievements of Phase II (against targets) are provided in Table 2.8.
Table: 2.8: Achievements of JNNSM Phase II Targets [9] Category Target for Phase II Achievement
(As on 31 December 2016)
Viability Gap Funding
Phase II, Batch I – 750 MW (2013-
17)
680 MW projects commissioned
Phase II, Batch III – 2,000 MW
(2013-17)
2,395 MW PPA signed in 5 states
Phase II, Batch IV – 5,000 MW
(2013-17)
1,020 MW PPA signed in 3 states
Through NTPC/NVVN Tranche I – 3,000 MW (2013-17) 2,700 MW PPA signed
Defense Scheme 300 MW (2014-19) 356 MW sanctioned in 7
establishments
Development of Solar Parks
25 Solar Parks (2014-19) 34 solar parks of aggregate capacity
of 20,000 MW has been approved in
24 states
Canal Top/Canal Bank
Canal Top – 50 MW (2013-17) 1 MW canal top commissioned in
Andhra Pradesh
Another 49 MW allotted in 6 other
states
Canal Bank – 50 MW (2013-17) 5 MW and 10 MW commissioned in
Andhra Pradesh and West Bengal
respectively
35 MW projects allotted in 3 states
Grid-Connected Decentralised
Rooftop, Off-grid and Decentralised
Solar Applications
40,000 MW (2022) Under grid-connected rooftop solar
and small power plants program
3,044 MW has been sanctioned and
506 MW has been installed
Source: MNRE, 2016
GRID-CONNECTED ROOFTOP SOLAR
India has unveiled the ‘Grid-Connected Rooftop and Small Solar Power Plant Programme’ with the aim
of installing 40 GW of grid-interactive rooftop solar by 2022.[10] These rooftop plants would be set up
in residential, commercial, industrial and institutional sectors, and government and state-owned
sector enterprises. Till 31 March 2017, a total of 656 MW rooftop solar was installed in India.
The government offers 30% subsidy for rooftop projects in residential, social and institutional
buildings and a 15% to 25% incentive for projects in government and state-owned enterprises (public
sector undertaking or PSU). However, no subsidies or incentives are offered for rooftop solar projects
in the industrial and commercial sectors.
Figure 2.7 shows the state-wise and year-wise capacity addition targets indicated by MNRE, to achieve
the cumulative capacity of 40 GW by 2022. Maharashtra, Uttar Pradesh and Tamil Nadu are seen to
have the highest targets with 4,700, 4,300, and 3,500 MW respectively.

Policy Landscape
26
Figure 2.7: State-wise and Year-wise Proposed Capacity Addition Targets for Achieving 40 GW
Rooftop Solar by 2022
Source: MNRE, 2016
OTHER POLICIES
Policy on Repowering [11]
MNRE announced the policy for repowering wind power projects, in 2016, for projects with capacity
of 1 MW or below, that are located at sites having high wind power potential. IREDA is providing loans
at 0.25% which is lower than the applicable rates for new wind projects. Besides this, all fiscal and
financial benefits extended to new wind power projects (such as accelerated depreciation, generation
based incentives) are also provided.
Draft National Wind Solar Hybrid Policy [12]
MNRE published the Draft National Wind Solar Hybrid Policy in 2016 with the objective of promoting
large grid-connected wind-solar PV systems. The goal of the policy was to reach wind-solar hybrid
capacity of 10 GW by 2022. The draft policy proposed to extend all fiscal and financial incentives,
available to wind and solar, to hybrid projects as well, along with low-cost financing by IREDA and
other financial institutions, including multilateral banks.
FINANCIAL AND FISCAL INCENTIVES: A REVIEW
General Incentives and Exemptions
Incentives and exemptions enhance the strength of policies aimed at promoting RE. Different states
offer different incentives/exemptions. Table 2.9 summarizes the general incentives/exemptions
provided to different RE technologies across states and union territories in 2016-17.[13] While Dadra
and Nagar Haveli, Daman and Diu, Lakshadweep, Nagaland, and Sikkim have not announced any
0500
100015002000250030003500400045005000
An
dh
ra P
rad
esh
Aru
nac
hal
Pra
des
hA
ssam
Bih
arC
hh
atti
sgar
hD
elh
iG
uja
rat
Har
yan
aH
imac
hal
Pra
de
shJa
mm
u a
nd
Kas
hm
irJh
arkh
and
Kar
nat
aka
Ker
ala
Mad
hya
Pra
des
hM
ahar
ash
tra
Man
ipu
rM
izo
ram
Meg
hal
aya
Nag
alan
dO
riss
aP
un
jab
Raj
asth
anSi
kkim
Tam
il N
adu
Tele
nga
na
Trip
ura
Utt
arak
han
dU
ttar
Pra
des
hW
est
Be
nga
lC
han
dig
arh
Go
aD
adra
& N
agar
Hav
eli
Dam
an &
Diu
Pu
du
cher
ryA
nd
aman
& N
ico
bar
Lakh
adw
eepC
apac
ity
Targ
et in
MW
State-wise and Year-wise Solar Rooftop Targets

Policy Landscape
27
specific incentives for promotion of RE, all other states and union territories have declared at least
one incentive to encourage a particular RE technology.
As evident from Table 2.9, not all states have adopted the same instruments for development of RE.
Even within a state, different policy instruments have been adopted for different technologies. For
example, in Gujarat, electricity duty exemption has been allowed for wind, solar, small hydro and
MSW. But wheeling charge waiver and banking facility have been allowed only for solar technologies.
Table 2.9: State-wise Incentives/Exemptions in Renewable Energy*
State
Ele
ctri
city
Du
ty E
xe
mp
tio
n
Sta
mp
Du
ty E
xe
mp
tio
n
VA
T E
xe
mp
tio
n
En
try
Ta
x W
aiv
er
CS
S E
xe
mp
tio
n
Wh
ee
lin
g C
ha
rge
s W
aiv
er
Tra
nsm
issi
on
Ch
arg
es
Ex
em
pti
on
Dis
trib
uti
on
Ch
arg
es
Wa
ive
r
All
ow
an
ce o
f C
on
tra
ct
De
ma
nd
Cu
t
Ba
nk
ing
Fa
cili
ty
Ro
ya
lty
on
Wa
ter
Usa
ge
Mo
rato
riu
m o
n F
ree
Po
we
r
Ind
ust
ry P
oli
cy I
nce
nti
ve
s
Andaman and
Nicobar ⨂ ⨂
Andhra
Pradesh †• • † † † ɸ
Arunachal
Pradesh ɸ
Assam ɸ ɸ
Bihar ⨂ ⨂ ⨂ ⨂ ⨂ ⨂
Chandigarh
Chhattisgarh • • †
Dadra and
Nagar Haveli
Daman and
Diu
Delhi • • • • •
Gujarat †•
ɸ⟟ • †• ɸ⟟ •
Haryana • • • • • •
Himachal
Pradesh ɸ
Jammu and
Kashmir ɸ • • ɸ
Jharkhand • • • • • • •
Karnataka • ⨂ ⨂
Kerala • • •
Lakshadweep
Madhya
Pradesh • ɸ⧫ †•
ɸ⧫ †⧫ ⧫
†•
ɸ
⧫
ɸ ɸ † ɸ
Maharashtra ⨂ ⨂
Manipur ⨂ ɸ • • ɸ • ɸ
Meghalaya ⨂ ⨂
Mizoram •⨂ • • • •⨂
•
⨂ ɸ⨂
Nagaland
Orissa ⨂
Puducherry • • •

Policy Landscape
28
Punjab ⨂ ⨂ ⨂ ⨂ ⨂
Rajasthan ⧫ †⧫
Sikkim
Tamil Nadu • •
Telangana • †• †• •
Tripura ⨂ ⨂ ⨂ ⨂
Uttar
Pradesh • †
Uttarakhand •
West Bengal ⨂
Source: WISE, 2016
* Timeframe of the incentives is as per the policy period in existence in the respective states.
† Incentives for wind energy
• Incentives for solar energy
ɸ Incentives for small hydro
⧫ Incentives for biomass power
⟟ Incentives for MSW
⨂ All renewables
Accelerated Depreciation
In order to provide tax benefits during the early years of generation, accelerated depreciation benefit
is provided, which is 80% of asset value in the first year. In the second year, the remaining asset value
is derived using written down value method after deducting the depreciated asset value in the first
year and 80% depreciation is charged on the remaining asset value. Thus depreciation continues to
be charged on the remaining asset value in a tapered manner. This reduces the earning before taxes
and hence total tax payable by the generator.
For 2017-18, the Government of India has capped accelerated depreciation at 40% in the first year on
a written-down value (WDV) basis for equipment under Section 32(1)(i) of the Income Tax Act, 1961.
Generation Based Incentives (GBI)
Under GBI, wind power producers not availing Accelerated Depreciation are provided an incentive @
`0.50 per unit of electricity fed into grid with a cap of `100 lakh per MW, for a minimum period of 4
years and maximum period of 10 years.[14]
Under GBI I, II and demo schemes, a sum of `2,044.55 crore has been released upto 15 April 2017.
Details are provided in Table 2.10.
Table 2.10: GBI (Wind) Registration Status and Disbursement as on 15 April 2017
Scheme Period of scheme Capacity Registered (MW) Amount Released (`Crore)
GBI- II 01.04.2012 – 15.04.2017 8,424.95 855.16
GBI- I 17.12.2009 - 31.03.2012 2,031.38 1,159.34
Demo Limited to first 49 MW
registered
48.9 30.05
Total 10,505.23 2,044.55
Source: IREDA, 2017
A similar GBI scheme was offered to Rooftop PV and Small Solar Power Generation (RPSSPG). Grid-
connected solar projects in the capacity range of 100 kW to 2 MW each, connected to HT grid below

Policy Landscape
29
33 kV, were eligible. The first 100 MW capacity projects registered with IREDA were eligible for GBI.
A capacity of 91.8 MW has been registered under GBI up to April 2017 and a total disbursement of
`805.56 crore has been made.[15] From 2017-18, GBI has been discontinued.
Income Tax Holiday
Income tax holiday (elimination of tax for a given period on income) was offered for 10 years on
income earned from sale of electricity of RE projects, under Section 80 IA of the Income Tax Act, 1961,
within the first fifteen years of the life-cycle of all infrastructure projects, including renewable power
generation. However, the scheme has been discontinued from 2017.
Goods and Services Tax
Table 2.11: Goods and Services Tax for Renewable Energy
GST Rate
5%
Sr. No: 234, Tariff No. 84 or 85
Renewable energy devices & parts manufacture
(a) Bio-gas plant
(b) Solar power based devices
(c) Solar power generating system
(d) Wind mills, Wind Operated Electricity Generator (WOEG)
(e) Waste to energy plants/devices
(f) Solar lantern/solar lamp
(g) Ocean waves/tidal waves energy devices/plants
5% Sr. No: 232, Tariff No. 8419 19
Solar Water Heaters and Systems
Source: CBEC, 2017
In 2017-18, all existing fiscal and financial incentives (except accelerated depreciation) along with
other tax related incentives such as concessional customs and excise duty exemption, etc., will be
discontinued, and only one tax, the Goods and Services Tax (GST), will prevail. In GST, renewable
energy equipment and manufacturing of parts are taxed at 5% (Table 2.11).
NATIONAL CLEAN ENERGY AND ENVIRONMENT FUND (NCEEF)[16]
In 2010-11, the Government of India, introduced a corpus called National Clean Energy Fund (NCEF),
which was created out of a cess on coal produced/imported, (“polluter pays” principle) for the
purpose of financing and promoting clean energy initiatives, funding research in the area of clean
energy or for any other purpose relating thereto. Subsequently, the scope of the fund was expanded
to include clean environment initiatives and renamed National Clean Energy and Environment Fund
(NCEFF). An Inter-Ministerial Group (IMG) chaired by Finance Secretary approves the
projects/schemes eligible for financing under the NCEEF. Till date, IMG has recommended 55 projects
amounting to `34811.19 crore, spread over the past years.
In 2016-17, the proceeds of the NCEEF were used to finance projects under the Green Energy Corridor
for boosting the transmission sector, Namami Gange, Green India Mission, Jawaharlal Nehru National
Solar Mission, installation of SPV lights and small capacity lights, installation of SPV water pumping
systems, SPV power plants, grid-connected rooftop plants, etc. The proceeds from the cess are
distributed between a few ministries. Table 2.12 provides details of allocation of the NCEF in 2016-
17.

Policy Landscape
30
However, the Goods and Services Tax (Compensation to States) 2017, which has been notified on 12
April 2017, provides that 2017-18 onwards, coal cess would be used towards the GST Compensation
Fund for compensating states for potential losses on account of GST implementation, for five years.
Any amount left over would be shared on 50% basis between centre and states.
Table 2.12: Allocation of Clean Energy Cess Among Various Ministries (2016-17)
Ministry Amount
(in `Crore)
Ministry of Environment, Forest and Climate Change 1,000.00
Ministry of New and Renewable Energy 4,947.00
Ministry of Water Resources, River Development and Ganga Rejuvenation 2,500.00
Total 8,447.00
Source: Department of Expenditure, Government of India, 2016
PRIORITY SECTOR LENDING
Renewable energy projects have been included in Priority Sector Lending norms of commercial banks
by RBI in April 2015.[17] This means banks can lend up to a limit of `15 crore to borrowers for solar-
based power generators, biomass-based power generators, wind turbines, micro-hydel plants, and for
public utilities viz. street lighting systems, and remote village electrification. For individual
households, the loan limit is set at ̀ 10 lakh per borrower. As a policy of the Central Government, banks
have been instructed to encourage loan seeking households to install rooftop solar projects and
consider the amount required for the purpose as part of home loan or home improvement loan.
DECENTRALISED OFF-GRID POLICY
Access to affordable and reliable electricity is crucial for spurring social and economic progress in
rural India and for meeting the country’s developmental aspirations. A major portion of the Indian
population still does not have access to electricity. As per Census 2011 data, around 1.1 million
households do not have any source of lighting-77% of which are from rural areas. Decentralised
electricity generation through mini/microgrids is playing an important role in providing lighting to
these remote rural areas.
Many Energy Services Companies (ESCOs) have already installed microgrids through various business
models, but there are several challenges being faced by them. In order to overcome these challenges,
MNRE has come up with the “Draft National Policy on RE based Mini/Micro grids” in June 2016, with
the following objectives:
Simplify the project development procedures for ESCOs.
Provide operational framework to operate where the grid does not exist, or already exists (the
Distribution Company grid).
Access to central financial assistance and other incentives.
Encourage innovative minigrid business models to cater to rural needs.
Draft National Mini/Microgrid Policy
In 2016, the Government of India introduced the draft National Mini/Microgrid policy for India. The
main provisions of the policy are summarized in Table 2.13. [18]

Policy Landscape
31
Table 2.13: Main Provisions under Draft National Micro/Minigrid Policy
Eligibility Powered by RE sources such as solar, biomass, wind, small hydro or other notified sources
and having diesel-based generator as backup.
Hybrid systems using a combination of resources such as solar-wind, solar-biomass, solar-
hydro, etc.
Tariff Tariff may be set as follows:
(i) Where no subsidy or grid-connectivity is provided - As per market.
(ii) Where subsidy is provided - With concurrence of defined state government authority.
(iii) Where grid is connected - SERC.
Tariff should adhere to the following principals:
Should be transparently set.
Should be fixed for at least one year to avoid frequent changes.
Should not give more than 16% return on equity if it is a business venture.
Should cover cost of battery replacement.
Money collected should be displayed prominently in the village for everyone’s
information.
Implementation To fast-track the process, ESCOs are empanelled as Rural Energy Service Providers
(RESPs) - installer, owner, operator and service supplier - to implement mini grid
projects, and envisages RESPs to be one of the predominant vehicles for implementation.
RESPs can directly identify and implement projects by themselves.
The involvement of the State Government and/or DISCOMs in the SNA route for
implementation makes the process straightforward thus making project identification
more certain and the development and execution easier.
Private implementing agencies have to arrange for land, right-of-way permissions, seek
local government and community consent, and deal with other aspects, themselves. A
single window support channel, such as a special RE mini grid promotion cell, may be
instituted for this purpose.
Coexistence of Mini
Grids and
Distribution
Company
Policy framework to facilitate the coexistence of mini grids with the DISCOM grid is as
follows:
For both the entry situations – areas where the DISCOM grid pre-exists or areas where the
DISCOM grid is yet to arrive - the ESCO will be allowed to “Open Market” i.e., continue
supplying to its consumers and exist in parallel with DISCOM grid
or
continue to supply to its consumers and sell excess or unsold electricity to the DISCOM grid
at the interconnection point and draw power from mini grid if required
or
supply all electricity generated to the DISCOM grid at the interconnection point.
The ESCO:
Will be allowed to work in and migrate to an operating option of its choice.
Will abide by the tariff norms as prescribed under the existing policy or programme of
the state.
Will be allowed to charge a tariff mutually determined with consumers if operating in
“open market” option.
May be offered to undertake the role of a Distribution Franchisee, wherever feasible.
Exit Options Where the DISCOM grid arrives later, the DISCOM may choose to use the Public
Distribution Network (PDN) of the ESCO, if it conforms to the standards laid down, by
paying appropriate charges, or the ESCO is offered to sell the PDN to the DISCOM.
Where the mini grid opts to sell power to the DISCOM grid, the project should be
compensated in accordance with the National Tariff Policy. Such instances of asset sale,
exchange of power (through condition of Power Purchase Agreement (PPA) and
Franchisee Agreement (FA)), and aspects such as wheeling, interconnectivity etc., fall
under the technical purview of the SERC. The SERC will be required to develop a
regulatory framework for enabling implementation.

Policy Landscape
32
Where mini grids connect with the DISCOM grid to sell surplus power, the ESCO will
have to enter into a Power Purchase Agreement (PPA) with the Distribution Company.
In the instance of a Franchisee Arrangement, the Distribution Company will have to
enter into a Franchisee Agreement with the ESCO.
Source: WISE, 2016
The draft policy also provides specifications of quality and technical performance standards of the
mini/microgrids. The policy is meant as a guideline for states, which can adapt or modify the policy
based on their local needs. The Ministry will provide upfront capital subsidy for deploying minigrid
projects under it various programmes. However, a state may consider providing additional incentives,
over and above the existing central financial assistance, for projects under their policy.
UP Mini/Microgrid Policy
Based on the draft National Mini/Microgrid Policy, Uttar Pradesh is the first and only state to publish
a state-specific policy for development of mini/microgrids in 2016 (as on 31 March 2017).
Salient Features of UP Minigrid Policy [19]
The policy has limited the size of the minigrid to 500 kW and laid down conditions for qualifying for
state government subsidy, with developers requiring to procure land for their projects. The policy
mandates a minimum eight hours of electricity supply–three hours in the morning and five hours in
the evening–to all households willing to pay, in the chosen area. For production and commercial needs,
developers need to supply for six hours.
The policy also specifies that the developer will charge `60 per month for load up to 50 Watt for eight
hours, `120 per month for load up to 100 Watt for eight hours of electricity supply daily, and for load
over 100 Watt the tariff will be determined by mutual consent between consumers and developer.
One of the most important concerns of minigrid developers has been the uncertainty of the plant when
the grid arrives. Hence, the state has laid out two exit policies for developers:
The energy generated from the plant will be received into the grid by the DISCOM at the tariff
decided by Uttar Pradesh Electricity Regulatory Commission/tariff decided by mutual
consent.
Based on the cost benefit analysis, the project will be transferred to the DISCOM at a cost
determined by mutual consent between DISCOM and developer, by estimating cost,
profit/loss of the project installed by the developer.
Table 2.14: Summary of Minigrid Regulations of UP, J&K and MP

Policy Landscape
33
Parameters
considered by SERCs
UP [20]
(06.04.2016)
J&K [21]
(19.12.2016)
MP [22]
(02.09.2016)
1. Defined mini grid
area
Rural areas having inadequate supply of
electricity during peak hours and/or
compulsory supply hours.
Rural areas where grid is not in
existence.
2. Applicability New and existing mini grid projects. New and existing minigrid
projects.
3. Permissible capacity Up to 500 kW 10 kW and above
4. Business Model(s)
No Grid
Minigrid Operators (MGO) can supply
entire electricity to consumer at mutually
agreed tariff or as determined by the
Government in case MGO avails govt.
subsidy/grant.
On arrival of grid, the MGO can continue
with (i) sale of electricity to consumer at
mutually agreed/govt. approved tariff OR
(ii)MGO can sale part electricity to
consumer and balance to DISCOM at
Feed-In Tariff approved by SERC, OR (iii)
MGO can opt for sale of entire electricity
to DISCOM at FIT.
The MGO has the option to transfer the
PDN to DISCOM at depreciated cost
provided the standards of PDN match the
DISCOM’s system
DISCOM may allow MGO to work as DF.
The MGO may migrate to any of the
options upon intimating the SERC,
DISCOM and SNA.
Grid Pre-Exists
MGO can supply entire electricity to
consumer at mutually agreed tariff or as
determined by the government in case
MGO avails govt. subsidy/grant for a
minimum period of 6 months, or may opt
for any of the following three options: (i)
continue supplying electricity at mutually
agreed tariff (ii) sale part electricity to
consumer and balance to DISCOM at FIT
approved by SERC (iii) after supplying
electricity in either of the above options
for at least 3 years, MGO can opt for sale
of entire electricity to DISCOM at FIT .
The MGO has option to transfer the PDN
to DISCOM at depreciated cost provided
the standards of PDN match the DISCOM’s
system.
The MGO may migrate to any of the
options above upon intimating SERC,
DISCOM and State Nodal Agency.
MGO is allowed to set mini grid
in areas where DISCOM system
doesn’t exist.
Allowed to charge mutually
agreed tariff.
On arrival of grid, supply of the
entire electricity to DISCOM at
FIT determined by the
Commission.
Transfer ownership of Public
Distribution Network (PDN)
conforming to the standards of
DISCOM, with mutual consent,
at depreciated cost. The MGO
shall rectify shortcomings in
PDN as pointed out by DISCOM
before transfer.
5. Standard of
Performance
Compulsory Supply Hours - 1700 to 2300
Hrs.
NA

Policy Landscape
34
Source: WISE, 2016
The draft National Mini/Microgrid Policy also encourages states to develop state-specific regulations
to enable the active participation of mini/microgrid developers. These regulations are expected to
bring more clarity, stability and predictability to the developers/investors. In 2016-17, Uttar Pradesh,
Madhya Pradesh and Jammu & Kashmir published their final regulations, and Bihar came up with a
draft regulation for mini/microgrids. It should be noted that UP and J&K have adopted the same
measures for their respective regulations. A summary of state regulations of UP, MP and J&K is made
in Table 2.14.
***
Parameters
considered by SERCs
UP [20]
(06.04.2016)
J&K [21]
(19.12.2016)
MP [22]
(02.09.2016)
6. FIT Guidelines As per Uttar Pradesh
Electricity Regulatory
Commission RE
Regulations 2014.
FIT determined
by SERC, as per
JKSERC RE
Regulations 2013
Act as ceiling
tariff.
As determined by SERC for
procurement of electricity from
mini grid projects by DISCOMs
pursuant to Sec 61(h) of EA 2003.
7. RPO The quantum of electricity generated from a
minigrid plant interconnected with DISCOM
system shall qualify for compliance of RPO
for DISCOM.
The quantum of electricity
generated from minigrid plant
shall qualify for compliance of
RPO for DISCOM.
8. Contractual
Framework
Quantity declared by MGO shall qualify for
PPA.
PPA is allowed for sale of entire/partial
electricity.
Quantity declared by MGO shall
qualify for PPA.
PPA is allowed for sale of
entire/partial electricity.
9. Exit/Migration
Options
MGO shall be allowed to exit the mini grid
area after providing 90 days prior notice
to the Commission, SNA and DISCOM.
Exit options will be governed by the
agreement signed by MGO.
MGO intending to migrate shall inform
the Commission, SNA and DISCOM.
SNA to facilitate the migration process.
MGO shall be allowed to exit
the mini grid area upon
obtaining clearance from SNA.
MGO to mutually decide with
DISCOM for transfer of PDN on
advent of grid.
Migration within applicable
supply model possible.

35
3.
REGULATORY FRAMEWORK
REGULATORY FRAMEWORK FOR PROMOTION OF RENEWABLES IN
INDIA
The Electricity Act, 2003, provides the legislative framework for development of the power sector,
(including renewable energy), in India. As per the Act, the Central Electricity Regulatory Commission
(CERC) and State Electricity Regulatory Commissions (SERCs) are responsible for regulating the
generation, distribution and transmission of electricity, based on the jurisdiction and powers vested
in them, under the Act.[1] The Tariff Policy formulated by the central government as per provisions of
the Act, further elaborates the tariff setting methodologies and principles including ways to promote
renewables, by enacting/enabling regulations by the SERCs and CERC. The process of regulation is
therefore continuously evolving to facilitate increased electricity generation from RE sources.[2]
The regulatory framework for grid-connected renewable energy in India is mainly guided by tariff
regulations, Renewable Energy Obligation (RPO) and Renewable Energy Certificate (REC)
mechanism, Open Access (OA) Regulations, and forecasting and scheduling regulations, while the
development of decentralised rooftop solar PV projects is mainly guided by ‘net metering’
regulations enacted by the SERCs at the state level.
3.1 FEED-IN TARIFF
The provisions in the Electricity Act, 2003, empowers the Electricity Regulatory Commissions
(ERCs) to determine the feed-in tariff (FIT) for RE, under Section 62 of the Act, by following the ‘cost-
plus’ approach. Additionally, the tariff can also be discovered by following the transparent
competitive bidding process as per provisions under Section 63 of the Act. The CERC in 2009 has, for
the first time, notified RE Tariff Regulations (amended in 2012 and 2017), specifying the RE
technology-wise normative technical and financial parameters for determination of RE tariff on cost-
plus basis.[3,4,5] Subsequently, the State Electricity Regulatory Commissions has also developed
similar regulations at the state level for determining feed-in tariff. The announcement of the
Jawaharlal Nehru National Solar Mission, in 2008 (as part of the NAPCC) resulted in the discovery of
solar tariff through the bidding process. The first ever price discovery of wind power through
competitive bidding was done in February 2017.
Table 3.1: Comparison of CERC and SERC declared Solar Tariff (INR/kWh)
CERC (2016-17)
Gujarat (2015)
Tamil Nadu (2016)
Rajasthan (2014)
Madhya Pradesh (2016)
Karnataka (2013)
5.08 MW-scale plants: 5.74 kW-scale plants: 7.11
4.56 4.85 5.45 MW scale plants: 6.51 kW scale plants: 4.4 to 6.03
Source: CERC and SERC orders [4, 6, 7]

Regulatory Framework
36
Table 3.2: Comparison of CERC and SERC declared Wind Tariff (INR/kWh)
CERC
(2016-17)
Gujarat
(2016)
Tamil
Nadu
(2016)
Rajasthan
(2014)
Maharashtra
(2016)
Karnataka
(2013)
Andhra
Pradesh
(2015)
Wind zone-wise -
3.68 to 5.89
4.19 3.70 5.16/5.42 Wind zone-wise -
3.39 to 4.94
4.5 4.25
Source: CERC and SERC orders
Tables 3.1 and 3.2 show the net feed-in tariff applicable to solar and wind power respectively, across
states with high wind and solar potential.[4, 6, 7]
3.1.1 Tariff Discovery through Competitive Bidding
Central Government agencies [mainly National Thermal Power Corporation (NTPC) and Solar
Energy Corporation of India (SECI)] and various state governments are responsible for conducting
the process of competitive bidding. A substantial reduction in solar tariff has been witnessed in
successive biddings over the past five years.
The initial tariff discovered under JNNSM Phase I, Batch 1, in 2012, was around `10.95/kWh. The
result of the solar bidding conducted in 2017 by NTPC, SECI and some states witnessed a drastic fall
in the tariff rates, with the 750 MW REWA, Madhya Pradesh bidding, hitting a historic low of
`3.30/kWh levelised tariff (as on February 2017). The tariff discovered for the REWA project is
almost one-third the tariff discovered under JNNSM Phase I, Batch 1. Figure 3.1 captures the trend of
dropping tariffs in solar bidding from 2012 to 2017.[8]
In February 2017, SECI conducted the first-ever bidding for procurement of wind power at inter-
state transmission system.[9] The tariff discovered through this bidding process touched a record
low of `3.46 per kWh.[10] These projects are expected to be set up in Gujarat and Tamil Nadu.
At these tariff rates, the cost of solar and wind are almost on par with those of thermal power
generation. Besides, solar power tariff has also been declining on account of sharply falling prices of
solar panels; better structuring of projects, thus reducing risks for project developers; and better
deals, making financing available at competitive costs.
Based on market dynamics, CERC also revised the benchmark capital cost of Solar PV on an annual
basis. Figure 3.2 shows the decreasing trend of benchmark capital cost as determined by CERC
during 2010-11 to 2016-17.

Regulatory Framework
37
Figure 3.1: Solar Bid Tariff Trends (2012-2017)
Note
Type of Tariff Project Name Type of
Tariff
Project
Name
Type
of
Tariff
Project
Name
Type
of
Tariff
Project
Name
Fixed
Tariff/Bundling
NTPC,
Rajasthan;
Bhadla
NTPC, Uttar
Pradesh;
NTPC,
Karnataka;
NTPC,
Telangana;
NTPC,
Rajasthan.
Levelized
Tariff
KREDL,
Karnataka;
Jharkhand
Govt.;
REWA,
Madhya
Pradesh
Zero
VGF
SECI,
Maharashtra
With
VGF
SECI, Uttar
Pradesh;
SECI,
Andhra
Pradesh;
SECI,
Chattisgarh;
SECI,
Gujarat;
SECI,
Karnataka;
SECI,
Odisha.
Source: WISE Analysis
10.95
7.49
5.454.34 4.41 4.78 4.69 5.08
4.434.78
4.664.78
4.824.94
4.94 4.35 4.81 4.423.3
0
2
4
6
8
10
12
JNN
SM P
has
e I,
Bat
ch 1
JNN
SM P
has
e I,
Bat
ch 2
JNN
SM P
has
e II
, Bat
ch 1
NTP
C, R
ajas
than
(B
adla
)
SEC
I, M
ahar
ash
tra
NTP
C, U
ttar
Pra
des
h
KR
EDL,
Kar
nat
aka
Jhar
khan
d G
ovt
SEC
I, U
ttar
Pra
des
h
NTP
C, K
arn
atak
a
NTP
C, T
ele
nga
na
SEC
I, A
nd
hra
Pra
des
h
SEC
I, C
hat
tisg
arh
SEC
I, G
uja
rat
SEC
I, K
arn
atak
a
NTP
C, R
ajas
than
SEC
I, O
dis
ha
SEC
I, M
ahar
ash
tra
Mad
hya
Pra
des
h, R
EWA
2012-162016 2017

Regulatory Framework
38
Figure 3.2: Decreasing Trend of Solar Benchmark Capital Cost (2010-11 to 2016-17)
Source: Based on CERC orders framed [3, 4, 5]
It can be seen from Figure 3.2 that solar capital costs have drastically dropped from `1700
lakhs/MW in 2010-11 to `530.02 lakhs/MW in 2016-17 (almost 68% reduction). Developers can
source solar panels at even lower rates, resulting in reduced tariffs rates.
However, sustainability of these low bidding strategies may pose a challenge for the sector,
especially for power purchase agreements (PPAs) signed earlier at higher rates. There are concerns
whether distribution licensees will honour the PPA terms of higher tariffs or force generators to
reconsider. State regulators have also begun the process of feed-in tariff revision based on
experience gained from competitive bidding. Solar PV tariffs and capital costs may stabilize at
sustainable levels achieved in competitive bidding, since the technology is not material-intensive
and thereby not affected by low recurring annual O&M costs. However, the low tariffs seen for wind
power are largely the result of inventory build-up in the sector and the manufacturers’ willingness to
hive off inventory (to avoid holding costs) even at a loss. Since wind is a material-intensive
technology, its capacity for capital cost reduction and reduction in O&M cost may not match that of
the solar sector. Hence, wind power tariffs need to be viewed differently vis-à-vis solar. Tariff rates
need to be sustainable if the RE industry is to survive. While the industry has to be transparent in
declaring real costs, the government and regulators need to address technology-specific issues. It is
not reasonable to pit one technology against another since all renewable power generation
technologies need to prosper.
3.2 RENEWABLE PURCHASE OBLIGATION (RPO) & RENEWABLE
ENERGY CERTIFICATE (REC) MECHANISM
3.2.1 Analysis of State-Level RPO Compliance
Section 86 (1) (e) of the Electricity Act, 2003, empowers SERCs to mandate purchase of a percentage
of the total consumption of electricity, in the area of a distribution licensee, from renewable energy
sources. While the introduction of the RPO mechanism illustrated the national shift towards
renewable energy, the response from states has not been encouraging due to reluctance of obligated
entities to procure RE at FIT determined by the SERCs. Figures 3.3 and 3.4 represent the RPO target
and RPO compliance achieved by different states in 2015-16 (latest data available) respectively.[1]
0
200
400
600
800
1000
1200
1400
1600
1800
2010-11 2011-12 2012-13 2013-14 2014-15 2015-16 2016-17
Lakh
s/M
WBenchmark Capital Cost of Solar PV
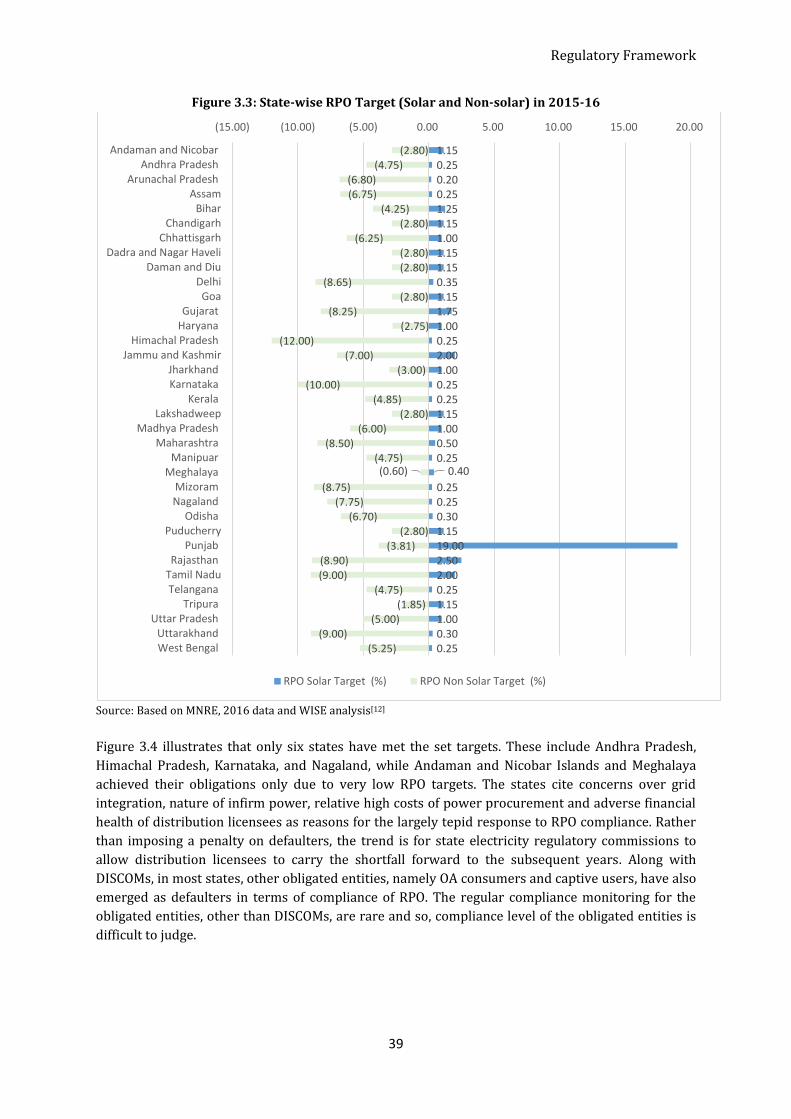
Regulatory Framework
39
Figure 3.3: State-wise RPO Target (Solar and Non-solar) in 2015-16
Source: Based on MNRE, 2016 data and WISE analysis[12]
Figure 3.4 illustrates that only six states have met the set targets. These include Andhra Pradesh,
Himachal Pradesh, Karnataka, and Nagaland, while Andaman and Nicobar Islands and Meghalaya
achieved their obligations only due to very low RPO targets. The states cite concerns over grid
integration, nature of infirm power, relative high costs of power procurement and adverse financial
health of distribution licensees as reasons for the largely tepid response to RPO compliance. Rather
than imposing a penalty on defaulters, the trend is for state electricity regulatory commissions to
allow distribution licensees to carry the shortfall forward to the subsequent years. Along with
DISCOMs, in most states, other obligated entities, namely OA consumers and captive users, have also
emerged as defaulters in terms of compliance of RPO. The regular compliance monitoring for the
obligated entities, other than DISCOMs, are rare and so, compliance level of the obligated entities is
difficult to judge.
1.15 0.25 0.20 0.25 1.25 1.15 1.00 1.15 1.15 0.35 1.15 1.75 1.00 0.25 2.00 1.00 0.25 0.25 1.15 1.00 0.50 0.25
0.40
0.25 0.25 0.30 1.15 19.00 2.50 2.00 0.25 1.15 1.00 0.30 0.25
(2.80)(4.75)
(6.80)(6.75)
(4.25)(2.80)
(6.25)(2.80)(2.80)
(8.65)(2.80)
(8.25)(2.75)
(12.00)(7.00)
(3.00)(10.00)
(4.85)(2.80)
(6.00)(8.50)
(4.75)(0.60)
(8.75)(7.75)
(6.70)(2.80)
(3.81)(8.90)(9.00)
(4.75)(1.85)
(5.00)(9.00)
(5.25)
(15.00) (10.00) (5.00) 0.00 5.00 10.00 15.00 20.00
Andaman and NicobarAndhra Pradesh
Arunachal PradeshAssam
BiharChandigarh
ChhattisgarhDadra and Nagar Haveli
Daman and DiuDelhi
GoaGujarat
HaryanaHimachal Pradesh
Jammu and KashmirJharkhandKarnataka
KeralaLakshadweep
Madhya PradeshMaharashtra
ManipuarMeghalaya
MizoramNagaland
OdishaPuducherry
PunjabRajasthan
Tamil NaduTelangana
TripuraUttar Pradesh
UttarakhandWest Bengal
RPO Solar Target (%) RPO Non Solar Target (%)

Regulatory Framework
40
Figure 3.4: State-wise RPO Compliance in 2015-16
Source: MNRE, 2017 [12]
RPO targets set by SERCs have been typically lower than the nationally recommended standard set
by the National Action Plan on Climate Change. Most recently, in line with the current amendments
to the National Tariff Policy, 2016, MNRE has emphasized the need for SERCs to notify their revised
RPO trajectory in accordance with national targets, which includes 17% of renewable electricity in
the total electricity mix by 2022, with at least 8% derived from solar energy.
Figure 3.5: State-wise RPO Targets vis-à-vis National Targets for 2016-17
Note: For Karnataka, only BESCOM, MESCOM and CESC RPO data has been considered
Source: WISE analysis
Figure 3.5 shows the comparison between state-wise RPO targets and national targets for 2016-17.
375%
103%
35%13% 13%6%
70%
0% 5% 6% 0%
76%74%
112%
14%2%
127%
49%50%71%79%
0%
204%
44%
113%
21%16%
67%79%82%
40%41%43%58%56%
0%
50%
100%
150%
200%
250%
300%
350%
400%
0%
2%
4%
6%
8%
10%
12%
14%A
nd
aman
an
d N
ico
bar
An
dh
ra P
rad
esh
Aru
nac
hal
Pra
des
h
Ass
am
Bih
ar
Ch
and
igar
h
Ch
hat
tisg
arh
Dad
ra a
nd
Nag
ar…
Dam
an a
nd
Diu
Del
hi
Go
a
Gu
jara
t
Har
yan
a
Him
ach
al P
rad
esh
Jam
mu
an
d K
ash
mir
Jhar
khan
d
Kar
nat
aka
Ker
ala
Laks
had
wee
p
Mad
hya
Pra
des
h
Mah
aras
htr
a
Man
ipu
ar
Meg
hal
aya
Miz
ora
m
Nag
alan
d
Od
ish
a
Pu
du
che
rry
Pu
nja
b
Raj
asth
an
Tam
il N
adu
Tela
nga
na
Trip
ura
Utt
ar P
rad
esh
Utt
arak
han
d
Wes
t B
enga
l
RP
O c
om
plia
nce
(%
of
RP
O t
arge
t ac
hie
ved
)
RP
O T
ota
l Tar
get
0
2
4
6
8
10
12
RP
O T
arge
t in
per
cen
tage
Solar Non-solar Solar (National Target) Non-solar (National Target)

Regulatory Framework
41
2.754.75
6.75
8.75
9.5
10.25
0
2
4
6
8
10
12
14
16
18
2016-17 2017-18 2018-19
RP
O P
erc
en
tage
tar
get
Non Solar
Solar
Pursuant to the revised tariff policy, the Ministry of Power, on 22 July 2016, notified the long-term
growth trajectory of RPO for solar and non-solar energy for the next three years, i.e. 2016-17, 2017-
18 and 2018-19.[13] Figure 3.6 shows the RPO trajectory for 2016-17 to 2018-19.
Figure 3.6: RPO Trajectory (2016-17 to 2018-19)
So far, only three states, namely
Andhra Pradesh, Madhya Pradesh
and Rajasthan have issued
regulations for aligning RPO
trajectory as per the notifications
from the Ministry of Power.
Source: Ministry of Power, 2016 [13]
3.2.2 REC Mechanism
CERC introduced the Renewable Energy Certificate (REC) mechanism in 2010 basically to address
the mismatch between availability of RE potential across the states and requirement for meeting
Renewable Purchase Obligation.[14]
REC pricing: Under the provisions of the Electricity Act, 2003, CERC determines the floor price and
forbearance price, separately, for solar and non-solar RECs, from time to time. The Commission in its
suo moto order of 2011, determined the floor price and forbearance price for the control period April
2012 to March 2017, but later in 2014, revised the solar REC price for the remaining control
period[14, 15,16] Table 3.3 shows the REC prices upto 31 March 2017, as determined by CERC.
Table 3.3: REC Price for 2016-17
Non Solar REC (`/MWh) Solar REC (`/MWh)
Forbearance Price 3300 5800
Floor Price 1500 3500
Source: CERC, 2016
Since the REC mechanism is driven mainly by the needs of obligated entities to meet their RPO, the
success of the REC mechanism depends crucially on whether SERCs enforce the compliance
mechanism for RPO or not. Many SERCs have not initiated any action on obligated entities for non-
compliance, and this has lowered the demand for RECs. Over 20 million RECs are up for sale,
whereas the demand is only a fraction of that.[17] Thus, RECs are being traded at the floor price,
which is the minimum stipulated for trading.
Due to poor interest shown by the obligated entities, particularly open access consumers and captive
users towards compliance of RPO, REC inventory is increasing. The total REC inventory, till 31 March
2017, was 17.83 million (12.92 million non-solar and 4.91 million solar RECs) (Figure 3.7).

Regulatory Framework
42
Figure 3.7: Increasing REC Inventory (upto March 2017)
Source: Renewable Energy Certificate registry, 2017
Figure 3.8 gives the technology-wise accredited and registered projects under REC mechanism and
Figure 3.9 gives the technology-wise REC liquidity figures, for 2016-17 upto March 2017
Figure 3.8: Technology-wise Accredited and Registered Projects under RECs (upto March 2017)
Source: Renewable Energy Certificate registry, 2017
10000000
11000000
12000000
13000000
14000000
15000000
16000000
17000000
18000000
19000000
20000000
0
200000
400000
600000
800000
1000000
1200000
1400000
1600000
1800000R
EC Is
sue
d/T
rad
ed
REC issued REC traded Closing balance
2187
8 3
743
254
2
693
1052
1811
0 0
711
224
2
544 480
0
500
1000
1500
2000
2500
MW
Accreditated Registered

Regulatory Framework
43
Figure 3.9: Technology-wise REC Liquidity (upto March 2017)
Source: Renewable Energy Certificate registry, 2017
3.3 OPEN ACCESS REGULATIONS
Open Access (OA) regulations are primarily encouraged by industrial and commercial consumers
due to the rate differential, viz. procurement from RE under OA and procurement from DISCOMs. In
case of captive users, it is also guided by cost economics as well as requirement for meeting the RPO.
Some states have notified their own open access regulations. The charges applicable under each
parameter are set by the respective SERCs who decide the attractiveness of third party sale and open
access model.[18]
Table 3.4 gives a summary of the OA regulations applicable to select states with high RE potential.
4908376
12926303
0 5000000 10000000 15000000 20000000 25000000 30000000 35000000
Solar
Non-solar
Closing Balance RECs retained by RE Generators
RECs Redeemed through Power Exchanges RECs Issued

Regulatory Framework
44
Table 3.4: Regulations Prevailing in States with high RE Potential under Open Access
State Transmission
Charges
Wheeling Charges Losses Cross Subsidy
Surcharge (CSS)
Andhra
Pradesh
Exempted for solar
and wind power
projects for captive
use/third party sale
within the state.
Exempted for solar and
wind power projects for
captive use/third party
sale within the state.
Applicable Exempted for third
party sale from solar
projects set up within
the state for a period of
5 years from the date of
commissioning.
Gujarat Applicable as
determined by the
Commission.
Applicable as determined
by the Commission.
Applicable No CSS for captive
generation plants and
MSW-to-energy plants.
Applicable for other
technologies.
Karnataka No charges for
developers who
generate and supply
RE within the state.
Applicable to open
access consumers.
Exempted for energy
transmitted or wheeled
from renewable energy
consumers in the state.
Applicable Not applicable to
renewable energy
generators who have
been exempted by
specific orders of the
Commission.
Madhya
Pradesh
Applicable Not applicable for
consumers availing open
access from renewable
energy sources.
Applicable Not applicable for
consumers availing
open access from
renewable energy
sources.
Maharashtra Applicable Not applicable to
consumers or generating
stations connected to the
Transmission System
directly or using
dedicated lines owned by
the consumer or
generating station.
Applicable to all other
cases.
Applicable Applicable
Rajasthan Applicable Applicable Applicable Applicable
Tamil Nadu Applicable Applicable Applicable;
distribution
losses borne by
the customer.
Applicable
Source: SERC orders
3.4 FORECASTING AND SCHEDULING
With the scaling up of RE targets by the Government of India, large-scale deployment of RE creates a
big challenge in terms of grid integration and grid management. These can be addressed through
proper scheduling and forecasting of RE generation.
CERC has notified Framework for Forecasting, Scheduling and Imbalance Handling for Variable
Renewable Energy Sources (wind and solar). The forecasting and scheduling framework provides
methodology for day-ahead scheduling of wind and solar energy generation forecast, with an
interval of 15 minutes for the next 24 hours, for the aggregate generation capacity of 50 MW and
above.[19]

Regulatory Framework
45
As per CERC Regulations, the schedule for energy injection given by wind and solar generators—
who are regional entities supplying inter-state power under long-term, medium-term or short-term
open access—may be revised by giving advance notice to the Regional Load Dispatch Centre (RLDC).
The charges payable for deviation from schedule by the wind and solar generators shall be delinked
from frequency, and shall be accounted for and settled in accordance with the provisions of the
Central Electricity Regulatory. Commission (Deviation Settlement Mechanism and related matters)
Regulations, 2014, as amended from time to time.[20]
Table 3.5: Comparison of Deviation Charges, Centre vs Karnataka
CERC
Absolute
error in 15-
min Block
Underinjection Overinjection
< = 15% Fixed rate for error up to 15% Fixed rate for absolute error up to 15%
> 15% but
<=25%
Fixed rate for error up to 15% + 110% of the
fixed rate for balance energy beyond 15% and
up to 25%.
Fixed rate for absolute error up to 15% + 90%
of the fixed rate for excess energy beyond 15%
and up to 25%.
>25% but
<=35%
Fixed rate for error up to 15% + 110% of the
fixed rate for balance energy beyond 15% and
up to 25% + 120% of the fixed rate for balance
energy beyond 25% and up to 35%.
Fixed rate for absolute error up to 15% + 90%
of the fixed rate for excess energy beyond 15%
and up to 25% + 80% of the fixed rate for
excess energy beyond 25%.
> 35%
Fixed rate for error up to 15% + 110% of the
fixed rate for balance energy beyond 15% and
up to 25% + 120% of the fixed rate for balance
energy beyond 25% and up to 35% + 130% of
the fixed rate for balance energy beyond 35%.
Fixed rate for absolute error up to 15% + 90%
of the fixed rate for excess energy beyond 15%
and up to 25% + 80% of the fixed rate for
excess energy beyond 25% and up to 35% +
70% of the fixed rate for excess energy beyond
35%.
Karnataka (within state)
Absolute
error in 15-
min Block
>15% Nil
> ± 15% and <
± 25% `0.50/kWh for the quantum of shortfall or excess energy deviation from schedule.
> ± 25% and <
± 35%
`0.50/kWh up to ± 25% + `1.0/kWh for remaining quantum of shortfall or excess energy for
deviation of > ± 25% and < ± 35% from schedule.
> ± 35%
`0.50/kWh up to ± 25% + `1.0/kWh for remaining quantum of shortfall or excess energy for
deviation of > ± 25% and < ± 35% from schedule + `1.5/kWh for remaining quantum of shortfall
or excess energy for deviation beyond ± 35% from schedule.
Source: CERC, 2014
The absolute error for the deviation settlement is calculated as:
Absolute error (%) = 100 x [Actual generation – Scheduled Generation]/Available Capacity
States including Andhra Pradesh, Jharkhand, Madhya Pradesh, Rajasthan and Tamil Nadu, have
already issued state-specific Draft Forecasting and Scheduling, Deviation and Settlement
Regulations, and the State of Karnataka has issued its final regulations. Table 3.5 provides the
comparison between deviation charges of the CERC Regulations and Karnataka Regulations.

Regulatory Framework
46
3.5 NET METERING REGULATIONS FOR ROOFTOP SOLAR
The Government of India aims to achieve 100 GW solar capacity by 2022. Of this, 40 GW is planned
to be deployed through rooftop PV. Typically, rooftop solar has two distinct ownership
arrangements:
Self-owned arrangement, wherein the rooftop owner also owns the PV system.
Third party ownership, in which a developer owns the PV system and enters into a
lease/commercial arrangement with the rooftop owner.
Irrespective of the ownership arrangement, the major advantages of solar rooftop are savings in
transmission and distribution losses, low gestation time, absence of land requirement issues and
reduction in system congestion with higher self-consumption and savings in electricity cost for the
rooftop owner.
The guiding regulations for net metering were prepared by the Forum of Regulators (FoR). Based on
these regulations, most SERCs issued their own net metering regulations. However, states like
Andhra Pradesh, Chhattisgarh, Karnataka, Nagaland, Tamil Nadu, Uttarakhand, and the union
territories, have not notified any separate net metering regulations till date. Table 3.6 shows the
comparison of state-wise net metering regulations of states having the highest planned capacity
addition target until 2022.[21]
Despite these supporting policies and regulations, the 40 GW target by 2022 appears challenging.
Although the net metering regulations are notified by the SERCs (at state level), real challenges are
being faced at the implementation level. In some states, grant for connection is provided by the
DISCOMs after several days of application. The net metering regulations of some states are too
restrictive on system size, type of connections, eligibility of consumer categories and business
models. Another big challenge lies in educating people, especially small domestic consumers, on the
benefits of solar rooftop and facilitation of easy financing for installation. Therefore, lessons from
industry experience and best practices adopted by other countries should be used to help improve
the policy and regulatory framework of rooftop solar.

Regulatory Framework
47
Table 3.6: Net Metering Regulations of States with Highest Rooftop Capacity Addition Targets
(Until 2022)
PARAMETERS MAHARASHTRA UTTAR PRADESH GUJARAT
ELIGIBILITY
CONDITIONS
Capacity less than 1
MW.
Maximum limit:
Limited to sanctioned
load.
Shall not exceed sanctioned
connected load or contract
load of the consumer.
Maximum capacity
installed–maximum of
50% of consumer’s
sanctioned load.
Installed capacity is
between 1 kW and 1 MW.
CAPACITY
TARGET FOR
DISTRIBUTION
LICENSEE
Cumulative capacity
shall not exceed 40% of
distribution
transformer’s rated
capacity.
Shall not exceed 15%, or any
other percentage as may be
fixed by the Commission, of
the rated capacity of such
transformer.
Cumulative capacity should
not exceed 65% of the peak
capacity of the distribution
transformer.
METERING
ARRANGEMENT
Solar generation meter
may be installed by
consumer/licensee at an
appropriate location if
the consumer/licensee
desires that such energy
be counted towards
meeting its RPO.
Installing check meters
shall be mandatory for
capacity over 50 kWp and
will be owned by the
licensee. Charges for
testing, installation and
maintenance of meters
shall be borne by the
consumer.
For systems with capacity
up to 50 kWp, licensee or
consumer shall install
check meter at their own
cost.
Check meters should be
mandatory for rooftop solar
PV systems having capacity
more than 20 kW. For
installation size of less than
or equal to 20 kW, the solar
check meter would be
optional.
ENERGY
ACCOUNTING
AND
SETTLEMENT
Excess export of
electricity over import
shall be carried
forward to the next
billing period as
credited units of
electricity.
For electricity import
over export
distribution licensee
shall raise an invoice
for the net electricity
consumed after
adjusting for credited
units.
In case of time of day
tariff, electricity
consumption in any
time block shall be
first compensated with
the quantum of
electricity injected in
the same time block,
and any excess
injection over
consumption during
any other time block
Excess electricity injected
by the consumer shall be
carried forward to the
next billing period as
electricity credit.
In case the consumer is
under the ambit of time of
day tariff, electricity
consumption in any time
block shall be first
compensated with the
generation in the same
time block, and excess
generation shall be
carried forward to the
corresponding time block
in the next month.
After each settlement
period, any unadjusted
excess electricity shall be
paid @ `2/kWh by the
distribution licensee.
Electricity injected
exceeding consumption
during any billing period
shall be paid by the
licensee:
At APPC of the year in
which the plant was
commissioned to
residential and
government consumers
and industrial,
commercial and other
consumers not registered
under REC mechanism.
At APPC of the year in
which plant was
commissioned after
adjustment of
consumption in 15
minute time blocks to
industrial, commercial
and other consumers
utilizing the renewable
attribute for RPO
compliance.
At 85% of APPC of the
year in which plant was

Regulatory Framework
48
PARAMETERS MAHARASHTRA UTTAR PRADESH GUJARAT
shall be accounted as if
the excess injection
has occurred during
off-peak hours.
commissioned after
adjustment of
consumption in 15
minute time blocks to
industrial, commercial
and other consumers
utilizing the renewable
attribute for REC.
OTHER CHARGES -- Eligible consumers or third
party owners shall be
exempted from wheeling
charge and cross subsidy
surcharge.
Exempted from transmission
and wheeling charges and
losses, cross subsidy
surcharge and additional
surcharge.
PENALTY -- The provisions of penalty or
compensation shall be as per
the provisions of the UPERC
(Electricity Supply Code)
Regulations, 2005, and
subsequent amendments
Penalty or compensation
shall be payable as per the
provisions of the GERC
(Standard of Performance of
Distribution Licensee)
Regulations, 2005, as
amended from time to time.
Source: SERC Regulations
TOWARDS GRID PARITY
Renewable energy based power projects have been developed under various business models in India. RE
power generators can sell the electricity generated from their projects to the distribution licensees, third
party customers or can set up for captive (own) use. For selling power to third party, the tariff rate can be
mutually decided, without any regulatory intervention. However, in the Indian context, the tariff rate for
selling electricity to distribution licensees is governed by the regulatory framework through the feed-in
tariff mechanism. In 2012, competitive bidding was introduced for the first time in India for RE
technologies, particularly for solar, under JNNSM. Under state policies also, solar power tariff was
discovered through competitive bidding, with very few exceptions.
The revised Tariff Policy announced by the Ministry of Power on 28 February 2016 prescribed power
procurement by states from all RE sources (except waste-to-energy projects) through competitive
bidding. Consequently, in February 2017, competitive bidding for wind power procurement by SECI was
introduced at the central level, kick-starting the process of competitive bidding at the state level.
In 2016-17, under competitive bidding, the lowest discovered solar tariff was `3.30/kWh (levellised) for
Rewa Ultra Mega Solar Project. For other solar projects, the discovered tariff was in the range of `4–
5/kWh. However, in case of competitive bidding for wind energy projects at the central level, the quoted
tariff was `3.46/kWh. Five projects were selected under the said bidding to be developed in Gujarat and
Tamil Nadu. The off-takers for competitive bidding in solar are SECI or NTPC who have a good credit
rating. This factor has also influenced in lowering tariff rates.
Besides competitive bidding, certain other factors that have been influential in lowering tariff rates
include reduced rate of solar module prices internationally, along with lower O&M costs due to economics
of scale. Similarly, for solar parks, the required infrastructure is readily available, thus reducing overall
costs. All these factors have resulted in reduced tariffs leading to renewables moving towards grid parity.
***

49
4.
MANUFACTURING INDUSTRY
In 2011, the Government of India announced the National Manufacturing Policy and laid down the
objective of increasing the share of manufacturing in GDP to 25% by 2020. In 2014, the newly elected
government announced the ‘Make in India’ initiative to promote domestic manufacturing in all
sectors; it also aimed at job creation and skill enhancement in renewable energy. With the government
of India announcing ambitious targets of 175 GW by 2022, of which 100 GW is from solar power and
60 GW from wind power, these targets offer a major opportunity for growth of RE manufacturing in
India. As of now, annual installed manufacturing capacity in wind turbine manufacturing in the
country is about 12,000 MW (which is way above the annual capacity addition), whereas
manufacturing capacity in solar PV is way below annual capacity additions. Many key upstream inputs
in the value chain are completely absent which results in great dependence on imports. Both in wind
and solar, there are issues relating to the supply chain viz. in terms of component manufacturing
within the country. Strengthening domestic manufacturing by creation of vertically integrated value
chains would be critical to the future sustainability of RE development in India. The emphasis in this
chapter is on wind and solar manufacturing since they contribute maximum to annual additions.
4.1 SOLAR MANUFACTURING
Subsequent to the announcement of the National Action Plan on Climate Change in 2008, Government
of India announced the Jawaharlal Nehru National Solar Mission (JNNSM). A key goal of the JNNSM
was “to take a global leadership role in solar manufacturing (across the value chain) of leading edge
solar technologies and target 4-5 GW equivalent of installed capacity by 2020.[1] By supporting a 6-fold
increase in manufacturing capabilities, the mission was expected to catalyse innovation, expansion
and dissemination of solar technologies, from silicon material to BoS components; all with a view to
generating jobs, becoming a dominant player with export capabilities, achieving grid parity with fossil
fuel-based technologies and creating greater flexibility for energy security.[1, 2] Table 4.1. gives solar
cell manufacturing capacity in India (as on June 2016), and Table 4.2 provides data for solar module
manufacturing. It can be seen that upto June 2016, the total installed manufacturing capacity of solar
cells was 1.4 GW and that of modules was 4.3 GW.

Manufacturing Industry
50
Table 4.1: Solar Cell Manufacturing Capacity in India[3]
Name of the Company
Installed in MW
(As on 30-06-2016)
1. BEL 10
2. Bharat Heavy Electricals Limited 10
3 Central Electronics Limited 10
4 Dev Solar 3
5 Euro Multivision Limited 50
6 Indosolar Ltd 250
7 Jupiter Solar Pvt. Ltd 280
8 Maharishi Solar Technology 10
9 Moser Baer Solar Limited 250
10 Premier Solar Systems Ltd 75
11
Solar Semiconductor (Renewsys
India) 30
12 Surana Solar Limited 120
13 Tata Power Solar Systems Limited 180
14 Udhaya Energy Photovoltaics Pvt Ltd 10
15 Websol Energy System Limited 120
16 XL Energy Ltd. 60
Total 1,468
Source: MNRE, 2016
Table: 4.2: Solar Module Manufacturing Capacity in India[3]
Sr No. Name of the Company Present Status Module Capacity
Installed in MW
(As on 30-06-2016)
Operational in MW (As on
30-06-2016)
1 Access Solar Ltd. 18 NA
2 Agrawal Solar 40 NA
3 Ajit Solar Pvt. Ltd. 35 20
4 Alpex Exports 200 150
5 AMV Energy Systems Pvt. Ltd. 10 NA
6 Andromeda Energy Technologies (P)Ltd. 30 15
7 Andslite 20 0.75
8 Arion Solar Pvt. Ltd. 5 5
9 AVI 15 15
10 BEL 10 10
11 Bharat Heavy Electricals Ltd 26 26
12 Blue brid Solar 20 20
13 Brawn Battery 25 NA
14 Central Electronics Limited 42 3.8
15 Deity Fuel Energy Pvt. Ltd. 20 20
16 Dev Solar 3 3
17 Electrona/Zynergy 36 35
18 Emmvee Photovoltaic Power Pvt. Ltd. 175 175
19 Empire Photovoltaic Systems 36 36
20 Enfield Solar Energy Limited 20 15

Manufacturing Industry
51
21
Enkay Solar Power & Infrastructure Pvt.
Ltd. 20 20
22 Evergreen Solar Systems India Pvt. Ltd. 20 20
23 Gautam Solar 65 65
24 Genus Solar 20 10
25 Goldi Green Technologies Pvt. Ltd. 125 125
26 Green Brilliance Energy Pvt. Ltd. 50 50
27 Greentek India Pvt. Ltd. 25 10
28 H. R. Solar Solution Pvt. Ltd. 15 10
29 HBL Power Systems Limited 20 NA
30 HHV Solar Technologies 100 90
31
ICON Solar-en Power Technologies Pvt.
Ltd. 50 24
32 Integrated solar 25 20
33 Jain Irrigation Systems Ltd. 55 55
34 Jakson Solar 60 50
35 JP Solar 20 NA
36 Jyoti Solar 25 NA
37 Jyotitech Solar LLP 35 28
38 Karishma Solar Pvt. Ltd. 20 NA
39 Kohima Solar 55 20
40 Kotak Urja Pvt. Ltd. 75 36
41 Lanco Solar 175 175
42 Maharishi Solar Technology 15 4
43 Mas Solar 20 5
44 Microsol Power P Ltd. 60 15
45 MicroSun Solar Tech Pvt. Ltd. 60 60
46 Modern Solar Pvt. Ltd. 40 32
47 Moser Baer Solar Ltd. 230 50
48 MX Power Solar Ltd. 10 10
49 Navitas Green Solutions Pvt. Ltd. 75 50
50 Neety Euro Asia Solar Energy 15 12
51 Novergy Energy Solutions Pvt. Ltd. 45 45
52 Nucifera 15 15
53 Photon Energy Systems Ltd 50 50
54 Photonix Solar Pvt. Ltd. 40 40
55 Plaza Solar 20 NA
56 Premier Solar Systems Ltd 100 100
57 Prosun Energy Pvt. Ltd. 5 3
58 PV Power Technologies 50 50
59 Raajratna Ventures Ltd. 30 30
60 Radiant Solar Pvt. Ltd. 80 30
61 Rhine Solar Ltd. 40 20
62
Rajasthan Electronics & Instruments
Ltd. 20 19
63 Reliance Industries Ltd - SOLAR 30 NA
64 Renewsys India 180 80
65 Ritika Systems 40 40
Manufacturing Industry
52
66 Rolta Power Pvt. Ltd. 60 50
67 Saatvik Green Energy Pvt. Ltd. 175 175
68 Savitri Solar 80 NA
69 Seemac Pvt. Ltd. 40 40
70 Shan Solar Pvt. Ltd. 30 30
71 Shukra Solar Energy Pvt. Ltd. 5 NA
72 SLG Solar System 8 NA
73 SolarMaxx 15 12
74 Solex Energy Ltd. 30 25
75 Sonali Energees Pvt. Ltd. 100 100
76 Sova Power Limited 100 100
77 Stellar Solar Works 20 NA
78 Sun Solar Techno Ltd. 30 18
79 SunFuel 15 1
80 Sunshine Power 10 10
81 Surana Solar 120 120
82 Synergy Solar 50 50
83 Tata Power Solar Systems 300 300
84 TITAN Energy Systems 100 100
85 Topsun Energy Limited 75 60
86 Udhaya Energy Photovoltaics Pvt. Ltd. 7 7
87 USL Photovoltaics Pvt. Ltd. 7 NA
88 Vikram Solar 500 400
89 Vinova Energy Systems Pvt. Ltd. 10 2
90 Vipul Solar 25 NA
91 VRV Energy India Pvt. Ltd. 25 NA
92 Waaree Energies 500 500
93 Websol Energies Ltd. 90 90
94 XL Energy Ltd. 210 NA
*NA- Information Not Available Total 4,307.55 –
Source: MNRE, 2016
4.2 WIND TURBINE MANUFACTURING
4.2.1. Background
Wind power development in India started around 1985. But it was only during the 8th Five Year Plan
(1992-97), the then Ministry of Non-Conventional Energy Sources (MNES) started concentrated
efforts towards creating a favourable policy environment for wind power in India. Thereafter, various
policy measures were introduced to encourage investments in wind power development. Investors
were initially offered capital subsidies to compensate for potential risks, thus ensuring project
viability. Policy instruments like accelerated depreciation, interest subsidies, sales tax exemption,
assured feed-in tariff, incentives for captive use, were introduced to encourage deployment of wind
turbines in India. These measures spurred the already existing manufacturing and led to shift of wind
turbine capacity from 225/600 kW to 600/1000 kW. As development progressed, the Indian wind
turbine manufacturers began to introduce higher capacity (MW class) wind turbines to reduce project
costs and increase electricity generation. With increasing penetration of wind turbines in the grid,

Manufacturing Industry
53
manufacturers had to adapt technologies and practices compatible with electricity load dispatch
centres.
4.2.2. Current Status
Today, wind is a mature technology and commercially driven, which had led to phase out of some of
the incentives provided in the past. From financial year 2017-18, some of these incentives will cease
to be available, while competitive bidding mechanism (operational from February 2017) will be in
play. Even though it may restrict the original equipment manufacturers (OEMs) and developers’
margins, it will ultimately promote efficient technologies, reduction in project costs, and development
of best wind sites.
Currently, there are around twenty-one wind turbine manufacturers in India (registered with NIWE),
offering more than fifty wind turbine models.[4] The list of wind turbine manufacturers and models
(along with hub height and rotor diameter) is provided in Table 4.3.
Table 4.3: WTG Manufacturers and Models Registered with NIWE (as on October 2016)
Sr.
No
Make Turbine
Capacity (kW)
Hub Height (m) Rotor Diameter
(m)
1 Acciona Wind power India Pvt. Ltd
3000 120 125
2 Gamesa Renewable Pvt. Ltd 850 49/55/65 58
2000 78/90 97
2000 78/90 97
2000 78/90 97
2000 104/108 97
2000 80/93/125 114
2000 110/114 114
3 Garuda Vaayu Shakthi Ltd 700 73 54
4 GE India Industrial Pvt. Ltd 1600 80 82.5
1600 80 87
1700 79.7/91 103
2330 94 116.7
5 Global Wind Power Ltd 1500 75 77.36
1500 80 89.3
6 Inox Wind Ltd 2000 80 93.3
2000 80/92 100
2000 92/120 113
7 Kenersys India Pvt. Ltd 2000 80/98 82
2400 85/95 109
2625 85 109
8 Lietwind Shriram Manufacturing Ltd 1500 80 83.3
1800 80 83.3
1500 80/90 86.4
3000 93.5 100.9
9 NuPower Technologies Pvt. Ltd 2050 85/98.2 93.2
2050 98.2/117/141 100.13
10 Para Enterprise Pvt. Ltd 750 61.1/75.3 49
11 PASL Wind Solutions Pvt. Ltd 1500 80 83.64
1050 74 68
12 Power Wind Ltd 900 71 56

Manufacturing Industry
54
13 ReGen Powertech Pvt. Ltd 1500 70/75/85/100 82.34
1500 85/100 86.6
1500 85 88.34
2800 90 108.82
14 RRB Energy Ltd 500 50 47
600 50/65 47
1800 80/100 82.5
15 Suzlon Energy Ltd 2100 80/90/100 95
2100 80/90/100/120 97
2100 90/120 111.8
16 Vestas Wind Technology India Pvt.
Ltd
1800 95 100
2000 80/95 100
2000 80/95/120 100
2000 110 110
2000 80/95 100
17 Wind World India Ltd. 800 75 52.9
18 Winwind Power Energy Pvt. Ltd 1000 70 60
19 Para Enterprise Pvt. Ltd 250 50 29.6
20 Shriram EPC Pvt. Ltd 250 41.5 28.5
250 51.5 28.5
21 Shiva Windturbine India Pvt. Ltd 250 50 30
22 Southern Wind Farms Ltd 225 45 29.8
Source: NIWE-Revised List for Manufacturers and Models as on 26-10-2016
Table 4.4: Wind Turbine Manufacturer-wise Manufacturing Capacity and Product Portfolio
Sr.
No
Manufacturer Wind turbine product
portfolio (rating in kW)
Manufacturing Capacity
per annum (in MW)
1 Acciona Wind power India Pvt. Ltd 3000 NA
2 Gamesa Renewable Pvt. Ltd 850/2000 1500
3 Garuda Vaayu Shakthi Ltd 700 NA
4 GE India Industrial Pvt. Ltd 1600/1700/2330 450
5 Global Wind Power Ltd 1500 600
6 Inox Wind Ltd 2000 800
7 Kenersys India Pvt. Ltd 2000/2400/2625 400
8 Lietwind Shriram Manufacturing Ltd 1500/1800/1500/3000 250
9 NuPower Technologies Pvt. Ltd 2050 NA
10 Para Enterprise Pvt. Ltd 750 NA
11 PASL Wind Solution Pvt. Ltd 1500/150 200
12 Power Wind Ltd 900 NA
13 ReGen Powertech Pvt. Ltd 1500/2800 750
14 RRB Energy Ltd 500/600/1800 300
15 Suzlon Energy Ltd 2100 3700
16 Vestas Wind Technology India Pvt. Ltd 1800/2000 1000
17 Wind World India Ltd. 800 960
18 Winwind Power Energy Pvt. Ltd 1000 1000
19 Shriram EPC Pvt. Ltd 250 NA
20 Shiva Wind turbine India Pvt. Ltd 250 15
21 Southern Wind Farms Ltd 225 NA
Total ~12,000MW
Source: Compiled from market reports/company websites.
Apart from the above, some wind turbine manufacturers have been delisted and some are in the
process of registering their companies and products with NIWE. The manufacturing capacities of these

Manufacturing Industry
55
manufacturers are not publicly available. Based on the research conducted by WISE, the list of wind
turbine manufacturers and their manufacturing capacities are shown in Table. 4.4. The total installed
wind turbine manufacturing capacity in India is in the range of 12,000 MW. Current annual demand
(even in peak years) is not even 50% of this capacity.
In 2016-17, the wind capacity addition of 5,525 MW was contributed by five major wind turbine
manufacturers, given in Table 4.5.
Table 4.5: Top Five Wind Turbine Manufacturers with Annual Installed Capacity (2016-17)
Sr. No OEM Installed capacity (in MW) Percentage share
1 Gamesa Renewable Pvt. Ltd 1900 34.39
2 Suzlon Energy Ltd 1750 31.67
3 Inox Wind Ltd 800 14.48
4 GE India Industrial Pvt. Ltd 300 5.43
5 Regen Powertech Pvt. Ltd 200 3.62
Others 575 10.41
Total 5,525 100
Source: Compiled from market reports/company websites
4.3 PROMOTION OF RE MANUFACTURING IN INDIA
While wind historically dominated annual capacity additions, currently it is solar PV that is in the
forefront. In addition, while the wind industry has almost a three-decade history of project
development and an established manufacturing base, solar manufacturing is a comparatively nascent
sector in India (except for some early players like Tata Solar).
The wind and solar industry supply chains are mainly composed of developers or IPPs, OEMs, Tier I
and Tier II suppliers. The overall supply chain of manufacturers is shown in Fig.4.1.

Manufacturing Industry
56
Figure 4.1: Wind and Solar Industry Supply Chain
Source: Addressing the Challenges of RE Manufacturing in India, WISE, 2015
4.3.1 Solar Photovoltaics
A typical value chain for solar PV manufacturing is given in Fig.4.2.
Figure 4.2: The PV Value Chain (multi-crystalline)
Tier-II
Suppliers
•Activity: Raw material/subcomponents, small component manufacturers
•Wind: Tata Steel, Winn Tek Power Systems Pvt.Ltd., Nu-Tech Industrial Spares & Services (P) Ltd., etc.
•Solar: Blistech International Pvt.Ltd., Dupont, Cape Electric Ltd., etc.
Tier -I
Suppliers
•Activity: Make large components such as towers, blades, generators, etc. for wind turbines; manufacturers of cell, glass, encapsulant, backsheet, etc., for PV modules.
•Wind: Larsen & Toubro Ltd., Crompton Greaves, ZF Friedrichshafen, LM Wind Power, etc.
•Solar: Gujarat Borosil, Renewsys Pvt. Ltd., Polycom., Sukriti Vidyut Udyog Pvt. Ltd., etc.
OEM
•Activity: Purchase or make components, and assembly, sell completed wind turbine and solar panels to developers.
•Wind: Suzlon, Wind World, Gamesa, etc.•Solar: EMVEE Solar, Tata Power Solar, Indosolar, Websol, etc.
Developers
•Activity: Secure land and buy wind turbines and solar modules, land levelling, installation etc. In India, most OEMs also work as developers, e.g. Lanco Solar, Tata Power Solar.
•Wind: Panama Wind Energy Pvt. Ltd., Mytrah Energy, etc.•Solar: L&T Ltd., Juwi International, Mahindra Solar, First Solar, Vikram Solar, etc.

Manufacturing Industry
57
In India, at present, solar PV manufacturing consists of crystalline silicon cell (c-Si) and PV module
manufacturing. As shown in Table 4.1 and 4.2, the cell manufacturing capacity in India (1.4 GW) is way
behind the module manufacturing capacity (4.3 GW). While the c-Si technology is likely to dominate
the Indian PV sector, production of metallurgical grade, polysilicon ingot and wafers is absent in India,
as of now. For solar PV development to become sustainable, it will be important to invest in this
manufacturing sector.
After the government launched the National Solar Mission in 2008, a committee was established and
given the task of “identifying the critical elements/components which lend themselves to indigenous
manufacturing and recommend the minimum indigenous content for solar power projects”. The
resultant policy option chosen to promote local manufacturing was local content requirements (LCRs)
and feed-in tariff for solar PV and CSP plants.[2] In 2016, the Government of India decided to install
100 GW of solar capacity by 2022, augmenting the original 20 GW target of 2009 by almost five times.
It was proposed that a small amount of this capacity be developed through Domestic Content
Requirement (DCR) in order to protect and promote the budding solar cell manufacturing industry in
the country.
The United States had earlier objected to this requirement and filed a complaint in 2013 with the
World Trade Organisation (WTO). The WTO ruled in favour of the US and recently made its judgment
public, observing that India’s policy does not conform to international trade agreements. To arrive at
a compromise, the Government of India proposed that it would buy DCR solar panels only for public
sector consumption (e.g. railways and defence) and not for commercial purposes, but the US did not
agree.[5] Bringing local manufacturers on par with foreign companies is therefore expected to take
time. Currently, most of the solar developers in India have been sourcing solar modules and
equipment from countries such as China as they are cheaper. India is working on a plan for making
domestic manufacturing of solar power generation equipment competitive vis-à-vis countries such as
China. As part of this strategy, the Central Government plans to come out with a policy to promote
manufacturing of the entire range of solar power generation equipment in the country. Prescription
of DCR may be interpreted as erecting a trade barrier; however it cannot stop India from strengthening
its domestic industrial base and making it more viable than imports.
As part of meeting the goal of ‘net zero imports’ in the electronics sector by 2020, the government
amended the Modified Special Incentive Package Scheme (MSIPS) in 2012 to promote large-scale
manufacturing in the electronic system design and manufacturing sector by providing subsidies for
capital expenditure. The MSIPS was expanded to include silicon wafer manufacturers. The
government also plans to expand MSIPS’ scope to make solar equipment manufacturing competitive
in India.
Solar power tariffs have become more attractive due to the lower cost of financing and decreasing
module prices. Solar tariffs declined from `10.95-12.76 per kWh during 2010-11 to `4.34 per kWh in
2016-17. The trend is such that the tariff is likely to continue to decline in the next financial year,
enabling achievement of grid parity.
India recognizes the solar PV manufacturing sector as a strategic segment of development. However,
in the recent past, many solar cell manufacturers have shut down, primarily due to global over supply
from optimized manufacturing lines at cheaper prices. Historically, the nascent supply chain, lack of
government initiatives and insufficient economics of scale are considered to be the three major factors

Manufacturing Industry
58
for higher manufacturing costs in India. But this is expected to change soon when the new policy for
RE manufacturing is announced.
Globally, countries providing strategic support to solar energy development also support solar
manufacturing within the country. China has taken a giant leap in solar manufacturing by
systematically providing incentive packages or investment support to manufacturing. Easy access to
land and electricity were other initiatives taken by that country to become a major global supplier of
RE equipment. Manufacturing in China has taken a more systematic form with efficient clusters
strategically located near resources, (both physical and human), and logistics or infrastructure like
ports.
Probable strategies India can adopt to support domestic solar manufacturing are:
Establish a cost-effective manufacturing base for metallurgical grade silicon, ingots and
wafers by providing government support (equity, etc).
Promote cluster manufacturing, especially since the raw materials are still imported.
Increase skilled manpower training at all levels of the downstream and upstream supply
chain.
Promote large domestic markets as they can increase the potential of cheaper sourcing and
technology transfer.
Enhance capabilities of manufacturing lines to cater to growing industry needs and widen
the network for dissemination of finished products in a competitive market.
Collaborate with research institutes, within and outside the country, for joint research
development and production.
4.3.2 Wind Turbine Manufacturing
There are two basic types of wind turbines being deployed in India viz. gear and gearless. In 2016-17,
more than 90.2% of wind turbines were geared with about 98.12% of WTGs in the range of 1500 kW
to 3000 kW. The components and manufacturing processes vary for both these categories of turbines.
Wind is a highly material intensive technology and has a long supply chain. The material intensity and
large number of components also put constraints and limits on cost-cutting. So, even though the wind
industry has a large established manufacturing base, there are many problems which need attention.
Some recent market events, policy changes, etc., which may directly or indirectly impact (positively or
otherwise) wind turbine manufacturing in India are:
Discontinuation of Incentives: The central government has discontinued the generation
based incentive and 10-year tax holiday, from April 2017. The accelerated depreciation
incentive has also been reduced from 80% to 40% from April 2017. This will certainly affect
project profitability and impact short to medium-term market demand.[5]
Competitive Bidding: The new Tariff Policy dated 28 January 2016[6] issued by the Central
Government envisages procurement of renewable energy (except from waste-to-energy
plants), in future, only through competitive bidding, as per its notified bidding framework. In
an environment of low tariffs and zero incentives, the only way to give assured returns to
investors is to increase efficiency by providing high plant load factor, reduce upfront capital

Manufacturing Industry
59
investment by cutting costs of turbines, and rationalize recurring O&M costs. This is going to
be a big challenge for manufacturers.
Modifications in CEA Grid Connection Guidelines: With increasing wind power penetration
into the grid, the load dispatch centers are facing fresh challenges. In order to regulate grid
interconnectivity and quality of power, CEA had introduced applicability of low voltage ride-
through (LVRT) for wind turbines. On similar lines, CEA has proposed modifications in grid
connectivity regulations to introduce high voltage ride-through (HVRT) facility, specifically
ramp-up and ramp-down rates, voltage regulation, short circuit ratio, limits on harmonics,
reactive power control capability, etc. The new regulatory stipulations will require
modifications in wind turbine technology and manufacturers will have to meet these
requirements, which may have additional cost implications on wind turbine costing.[7]
Repowering Policy: More than 3 GW of wind power capacity in India comes from wind
turbines of capacity 500 kW and below, which are installed at the best windy sites and have
completed more than twelve years of project life. New wind turbines with higher hub heights
and power can yield more energy due to their high efficiency, and on repowering, resource
utilisation can be optimized. On 5 August 2016, MNRE issued policy for repowering old wind
power projects. This policy has enabling provisions on transmission augmentation, treatment
of additional power generated, etc. If this policy is implemented effectively, it can positively
impact manufacturing.[8]
O&M Costs and Independent O&M Service Providers: The total installed wind power
project capacity has reached 32.2 GW as of 31 March 2017. The number of wind turbines are
greater than the total MW capacity. Mobilizing resources, maintaining manpower at widely
spread out rural locations is a big challenge for the OEMs. Annual escalations in O&M costs have
drastically increased the percentage of O&M cost vis-à-vis total revenue receipts from sale of
electricity, thereby reducing returns to project owners. Some independent O&M service
providers like Kintech Global Services Private Ltd., RENOM, Omkar Clean Energy Services
Private Limited (OCE), POWERCON Ventures India Pvt. Ltd, etc., have now entered the wind
turbine O&M market. It is hoped that rationalization of O&M costs and bringing competition
and quality in wind turbine O&M services will reduce recurring O&M costs in the near future.[9,
10, 11, 12]
4.4. EXPORT-IMPORT IN THE RE SECTOR
Solar manufacturing in India is adversely affected by large scale import of PV panels. It can be seen
from Figure 4.3 that the percentage of imported panels vis-à-vis total installed capacity for the three
years viz. 2012, 2013 and 2016 is 92%, 52% and 70% respectively. The reasons for this high import
content are manifold: insufficient manufacturing capacity in the country, sourcing from cheaper
locations like China, developers opting for different PV technologies which are not domestically
manufactured, etc.
Imported polysilicon cells are cheaper than domestically manufactured ones. At present, domestically
manufactured cells cost around `19/Wp; this is about 15% more than imported cells. The travails of
the domestic cell manufacturing industry stems from this mismatch. As already mentioned, the
absence of vertically integrated domestic supply chain (beginning with metallurgical silicon) also
economically hampers manufacturing of cells in India.

Manufacturing Industry
60
Figure 4.3: Solar PV Installed Capacity vis-à-vis Import of Panels
The values of PV imports
and exports are shown in
Figures 4.4 and 4.5
respectively. Solar PV
imports to India have
been increasing and
peaked at 3157 million
USD in 2016 due to
strong domestic demand.
In 2016, China supplied
around 84% of solar PV
imports to India. Apart
from this, India also
supplies PV panels to
many countries and the
exports are mainly to UK,
Belgium, Nepal, USA,
Italy, etc. While the volume of imports have increased by 650.9% the volume of exports have seen a
steep decline of 76.03% percent during the period 2008 to 2016.
Figure 4.4: Solar PV Imports (in Million USD)
Source: Derived from UN comtrade database.[13]
420.04 405.44 298.86
1332.84
871.941069.46
774.78
2056.74
3157.24
0
500
1000
1500
2000
2500
3000
3500
2008 2009 2010 2011 2012 2013 2014 2015 2016
Mill
ion
USD
Solar PV import in Million USD

Manufacturing Industry
61
Figure 4.5: Solar PV Exports (in Million USD)
Source: Derived from UN comtrade database [13]
As can be seen in Fig .4.6, even in the wind manufacturing industry, that has a strong established base
in India, exports have declined from a high of 651 million USD in 2008 to 8 million USD in 2016. This
is a decline of 98.7%. In 2015 and 2016, export of wind electric generators reduced drastically and
imports increased. (Fig.4.7). This may be partly due to increased domestic demand of wind electric
generators in India. Also, the volume of imports in 2016 was comparatively small at 7 million USD.
The wind electric generators are mainly imported from China and Austria.
Figure 4.6: Wind Electric Generator Exports (in Million USD)
Source: Derived from UN comtrade database [13]
528.79
437.33
585.72
327.50
111.84
200.78174.72
146.35 126.74
0
100
200
300
400
500
600
700
2008 2009 2010 2011 2012 2013 2014 2015 2016
Mill
ion
USD
Solar PV Export in Million USD
651.15
335.62
122.90
41.06 43.7876.29 83.03
4.65 8.100.00
100.00
200.00
300.00
400.00
500.00
600.00
700.00
2008 2009 2010 2011 2012 2013 2014 2015 2016
Mill
ion
USD
Wind Electric Generator Exports in Million USD

Manufacturing Industry
62
Figure 4.7: Wind Electric Generator Imports (in Million USD)
Source: Derived from UN comtrade database [13]
With the introduction of competitive bidding, both solar and wind tariffs would decline and soon
achieve grid parity. That would be a major step forward for India. However, for these rates to be
sustainable, we will have to strengthen our manufacturing base. In solar, priority should be given to
create facilitating mechanisms for establishing a vertically integrated c-Si PV module manufacturing
capacity, beginning with domestic production of metallurgical grade silicon. Right now we are
exporting large quantities of quartzite (the raw material for silicon production) from states like
Rajasthan. Instead, if we create value addition by utilizing it for silicon production, it would help
support our long-term objective of transitioning to a clean energy economy. It would also help
conserve foreign exchange, both by cutting import of silicon or silicon wafers and fossil fuels. Both in
solar and wind, we should focus on strengthening our manufacturing base, with a strong export
orientation. The next policy package should focus on this aspect of strengthening RE manufacturing
in India.
***
2.31
1.44
3.93
9.47
4.94 5.15
0.20
2.33
7.01
0.00
1.00
2.00
3.00
4.00
5.00
6.00
7.00
8.00
9.00
10.00
2008 2009 2010 2011 2012 2013 2014 2015 2016
Mill
ion
USD
Wind Electric Generator Imports in Million USD

63
5.
INVESTMENT FLOWS
Policy, regulation and an industrial base are critical to the growth of any sector. However, growth is
driven by investment flows which are also significantly impacted by the fiscal and financial framework
for the sector, besides profitability. The year under review has been a boom year for investments in
the sector. Besides Indian corporates and the public sector, international investors and multilateral
funding institutions participated in this investment growth. This section surveys the investment flows
to the RE sector.
5.1 INTRODUCTION
The central government has set an ambitious target of achieving 175 GW renewable energy by 2022.
From this target, 57 GW has been achieved till 31st March, 2017.[1] The remaining 118 GW capacity
needs to be installed within the next five years, which requires a capital amount of `9,414 billion,
including `6,590 billion in the form of debt.[2]. In addition, huge investment is required for
transmission and upgradation of infrastructure in order to utilize the power generated through RE
sources. India’s RE sector investment has grown steadily in the past 10 years (2006 to 2015). This
period can be divided into two in terms of average annual investment – one from 2006 to 2010 and
the other from 2011 to 2015. The average annual investment for the initial 5 years was `271 billion
(US$6 billion) whereas for the next 5 years it was `512 billion (US$9 billion).[3] Figure 5.1 shows the
growth trend in RE investments from 2006 to 2015.
Figure 5.1 Growth Trend in RE Investments (2006 to 2015)
Source: UNEP/WISE, 2017
5.2 STATUS OF RENEWABLE ENERGY FINANCING IN INDIA
RE financing in India is basically through debt and equity. Major sources of debt are banks and non-
banking financial corporations (NBFCs). According to MNRE, a total of 40 banks and NBFCs have
sanctioned `71,202 crore debt funding for financing various RE projects between February 2015 and
March 2016.[4] Apart from domestic banks and NBFCs, debt is also raised from multilateral
development banks (MDBs) and through external commercial borrowings (ECBs) and green bonds.
4.96.7
5.64.3
8.8
12.8
7.86.6
8.3
10.2
0
2
4
6
8
10
12
14
2006 2007 2008 2009 2010 2011 2012 2013 2014 2015
Inve
stm
ent
($ b
n)

Investment Flows
64
Equity investment comes from domestic investors, foreign direct investors, and multilateral
development banks. An estimation reveals that India’s total debt financing in 2016-17 was `7,11,533
million and equity financing was ̀ 3,04,943 million.+ For this estimation, capital cost as per CERC tariff
order, 2016, has been considered. When capital costs for different types of same technology are given,
the average over different types has been considered. Table 5.1 summarizes technology-wise capital
costs as per CERC regulations.
Table 5.1: Capital Cost for Different Technologies for 2016-17
Technology Capital Cost (`lakh/MW)
Wind 620
Small hydro(average) 706
Biomass 578
Solar 865
Waste-to-Energy (WtE) 1,200
Source: CERC, 2016
Figure 5.2: Debt and Equity Investments in Renewable Energy in India (2016-17)* [5,6]
Source: WISE, 2016 *The share of WtE and small hydro is very small due to which they are hardly visible. However, for readers’ convenience, their values
have been shown in the figure.
Figure 5.2 provides the estimated sector-wise, debt and equity investments in RE in 2016-17. The
largest investment is seen in the solar sector with ̀ 3,34,602 million debt and ̀ 1,43,401 million equity.
Lowest investment is seen in the waste-to-energy sector with `1,260 million debt and `540 million
equity.
__________________________________
+The estimation is based on the fact that India’s annual installed capacity in 2016-17 was 14,410.85 MW. Taking the benchmark capital cost for different
technologies (as pegged by CERC), the total capital cost for installing these capacities works out to `10,16,475.88 million (US $15,157.71 million), of
which 70% is considered as debt and 30% as equity. Primary data is collected from sources such as Reserve Bank of India, Indian Bank Association, and
MNRE.
234853,33%
5258, 1%
135560, 19%
334602, 47%
1260,0%
Technology wise Share of Debt (`. million)
Wind
Small hydro
Biomass
Solar
WtE
100651, 33%
2253,1%
58097, 19%
143401, 47%
540,0%
Technology wise Share of Equity (`.million)
Wind
Small hydro
Biomass
Solar
WtE

Investment Flows
65
5.2.1 Debt Funding in Renewable Energy
India’s total debt investments in 2016-17 came mainly from commercial banks. Others included non-
banking financial corporations, external commercial borrowings, and multilateral development
banks. Commercial debt contributed roughly 70% of RE investments. Major banks and NBFCs
financing RE through debt are listed in Figure 5.3.
Figure 5.3: Banks and NBFCs providing Debt in 2016-17
Source: WISE
*While major attempts were made to source data for loan disbursements made by Commercial Banks, these could not be procured.
Hence data not provided.
The three major NBFCs in India are the Indian Renewable Energy Development Agency (IREDA),
Power Finance Corporation (PFC) and Rural Electrification Corporation (REC). The amount
sanctioned and disbursed for five years from FY 2011-12 to FY 2015-16 to the RE sector by these three
public sector NBFCs is depicted in Figure 5.4. It can be seen that all NBFCs have carried out disbursal
lower than the sanctioned amounts. PFC’s sanctioned amount is highest in 2012-13 (`23,130 million)
and lowest in 2011-12 (`2,680 million). There is no clear trend in disbursement of loans by PFC with
highest disbursement (`6,094 million) in 2014-15 and lowest disbursement (`254 million) in 2013-
14. REC has increased its sanctioned amount 440% in 2015-16 (`29,657 million) from that in 2014-
15 (`5,479 million). Unlike these two NBFCs, sanction and disbursement by IREDA has increased
steadily between 2011-12 and 2015-16. Its lowest sanctioned amount (`34,059 million) was recorded
in 2011-12 and increased almost 130% over five years to record sanction of loan to the amount of
`78,064 million in 2015-16. Disbursal by IREDA also increased by almost 130% from `18,550 million
in 2011-12 to `42,573 million in 2015-16. [7,8,9]
For 2016-17, the one-year Marginal Cost of Funds based Lending (MCLR) rate in Indian banks varied
from 8.15% to 9.5%.[10] Generally, the interest rate on loan for renewable energy is considered to be
300 basis points above the MCLR. Consequently, the interest rate on term loans for renewable energy
works out between 11.15% and 12.50%. Comparatively, the interest rate on term loans for renewable
energy provided by NBFCs varies from 9.75% to 11.50%.[11,12,13] Thus loans given by NBFCs are
marginally beneficial to investors than those given by banks.
*Banks
• State Bank of India
• Punjab National Bank• Central Bank of India• Yes Bank• Axis Bank Ltd.• Exim Bank
NBFCs
• Indian Renewable Energy Development Agency
• Power Finance Corporation• Rural Electrification Corporation• L&T Infrastructure Finance• Tata Capital

Investment Flows
66
Figure 5.4 Sanction and Disbursement of Loans by Major NBFCs
(2011-12 to 2015-16)
Source: Annual Reports of respective institutions and WISE, 2011-12 to 2015-16
Apart from debt financing from banks and NBFCs, External Commercial Borrowing also played a
crucial role in RE financing. Total ECB from April 2016 to March 2017 was US$429 million. However,
a statistical analysis of ECB data shows that investment through ECB is still not popular in India,
mainly due to regulated interests (all-in-cost ceiling), which fails to attract foreign lenders. A summary
of statistics for ECBs is provided in Table 5.2. [14]
0.00
5000.00
10000.00
15000.00
20000.00
25000.00
20
11
-12
20
12
-13
20
13
-14
20
14
-15
20
15
-16
Loan
Am
ou
nt
(`m
illio
n)
PFC
Sanction (` million) Disbursement (` million)
0.005000.00
10000.0015000.0020000.0025000.0030000.0035000.00
20
11
-12
20
12
-13
20
13
-14
20
14
-15
20
15
-16
Loan
Am
ou
nt
(`m
illio
n)
REC
Sanction (` million) Disbursement (` million)
0.00
20000.00
40000.00
60000.00
80000.00
100000.00
20
11
-12
20
12
-13
20
13
-14
20
14
-15
20
15
-16
Loan
Am
ou
nt
(`m
illio
n)
IREDA
Sanction (` million) Disbursement (` million)

Investment Flows
67
Table 5.2: Summary of Statistics of External Commercial Borrowings in 2016-17
ECB (US$ Million) ECB (`Million)
Total 429 28,481
Average 20 1,356
Median 7 500
Standard Error 6 421
Source: RBI, 2016
As can be seen from Table 5.2, the average ECB for 2016-17 was US$20 million and median investment
was US$7 million. Clearly, the large difference between mean and median reflects the concentration
of ECBs towards smaller values, thereby indicating that large amounts from ECBs are still hard to come
by in India.
While financing from banks and NBFCs are of paramount importance, often these loans are
unaffordable. This happens due to the relatively high cost of investments and short loan tenures. The
advent of Green Banks, worldwide, has addressed these two issues by providing loans to borrowers
for a period equal to the payback period, at relatively lower interest rates. The features and benefits
of establishing Green Banks are provided in Box 1.
Box 1 Green Banks [15] & [16]
Green banks tailor their offerings to match domestic needs and can help mainstream green investment
locally. The characteristics of financing by green banks are threefold; first, they offer affordable lending for
a period which matches the payback period of projects; second, they use financial products and techniques
to mitigate specific risks; third, they engage in market development and demand generation.
Green banks use private sector experience and discipline in the service of the public good. They play a
unique role since neither traditional government programs with their limited engagement with the market,
nor competitive private sector can achieve this. These banks also provide low cost and longer tenure credit
to the renewable energy sector that matches the payback period of the projects, thereby leading to more
projects, being developed. Besides, green banks also help in mitigating perceived risks of renewable energy
by local lenders. These risk mitigation products help private banks execute the initial transactions for clean
energy projects.
Additionally, green banks play an important role in familiarizing other commercial banks with clean energy
technologies through co-investment. Moreover, green banks identify and analyze technologies that are new
to the local market, but which have a proven track record elsewhere. This can expand financing for
commercially mature, but unfamiliar technologies in India. Green banks may also facilitate financing to the
decentralized renewable energy sector in rural areas. These banks may establish standard norms as a
requirement for receiving finances. This in turn reduces costs.
There have been discussions for converting IREDA into a green bank. This may be a timely
intervention to fuel lending to renewable energy technologies in the country. The conversion of IREDA
into a green bank will facilitate low-cost and higher tenure loans in the market. The option of providing
low-cost financing to the renewable energy sector can be further leveraged by allowing IREDA to raise
funds from foreign markets.
A healthy tranche of low-cost debt in 2016-17 came from multilateral development banks (MDBs).
The main difference between lending by commercial banks and MDBs is in the interest rates and the
tenure of loans. While the interest on loans by commercial banks mostly remains over 10%, the
interest rate from MDBs ranges between 4% and 6%. However, these interest rates do not reflect
hidden charges and do not accommodate losses due to exchange rate fluctuations. Albeit, the cost of

Investment Flows
68
financing loans from MDBs is lower than that from commercial banks and NBFCs. Also, the tenure of
loans from MDBs is between 10 and 15 years with limited or no recourse, whereas tenure of most of
the bank loans are 10 years or less. Besides, lending from MDBs brings ‘financial additionality’. This
can be achieved in many ways. For example, MDBs help in bringing financing partners into specific
deals through syndication or co-financing arrangements. This also helps in increasing the confidence
of other financial institutes. Thus, it is strategically important to attract more funding from MDBs to
uplift the investment in the sector. Major debt investments from MDBs for RE, in 2016-17 are
enumerated in Table 5.3.
Table 5.3: Lending by Multilateral Development Banks in 2016-17*
Organization Amount ($ million) Description
World Bank 625 Loan to SBI for lending to grid connected solar PV projects
Asian Development Bank 500 Loan to renewable energy projects
Asian Development Bank 390 Project funding to Renew Power
European Investment Bank 213 Loan to SBI for mega solar projects
Asian Development Bank 175 Loan to Improve India's solar power transmission system
Asian Development Bank 50 Co finance from clean technology fund
Source: Press releases of respective organisations, 2016
*Annual average exchange rate for FY 2016-17 has been considered for rupee to dollar conversion
Table 5.3 shows that the major bulk of investments came from Asian Development Bank (57%),
followed by the World Bank (32%) and European Investment Bank (11%) respectively. Figure 5.5
depicts relative share of financing by different MDBs during 2016-17.
Figure 5.5 Funding Share of Different MDBs in the RE Sector (2016-17)
Source: WISE, 2017
5.2.2 Equity Investments in Renewable Energy
Equity investments in 2016-17 came from domestic investors, foreign direct investors and
multilateral development banks. The share of equity in total investments was roughly 30%.
Foreign direct investment (FDI) is through the automatic route and up to 100%, which has enhanced
the ease of equity investment in the RE sector. Between April 2014 and September 2016, a total of
US$904 million was invested in India in the form of FDI with highest and lowest values being US$200
million and US$32 million respectively.
Domestic equity investment from major investors in the RE sector in 2016-17 was `49,240.55 million
with lowest investment at `1,800 million and highest at `30,865 million. However, the range has a
downward bias with only one investment above `30,000 million and three investments below
`12,000 million, thereby leaving huge variation in the level of investment by domestic investors.
Company-wise domestic investments in 2016-17 are shown in Figure 5.6.
57%11%
32%
Asian DevelopmentBank
EuropeanInvestment Bank
World Bank

Investment Flows
69
Figure 5.6: Investments by Major Domestic Investors in Renewable Energy in 2016-17
Source: Press releases of respective organisations; WISE analysis
Apart from FDI and investments by domestic organisations, International Finance Corporation has
also pledged equity investment to the RE sector by committing US$140 million for 2016-17.
There are new investment vehicles that are gaining popularity in the Indian markets. These vehicles
mobilize financial resources from domestic as well as foreign markets to finance renewable energy in
the country. Looking at their future potential, the report features two such vehicles: Infrastructure
Investment Trusts and Green Bonds (Box 2).
Box 2 POTENTIAL PUBLIC MARKET INVESTMENTS [17, 18]
According to Bloomberg New Energy Finance (BNEF), India’s aggregate power sector spending will be
more than $1 trillion by 2040, out of which the allocation to renewable energy will be 60%. A study by
BNEF shows that most wind projects are financed by private lenders, whereas, most solar projects are
financed by government banks and NBFCs. In order to meet the target of 175 GW RE by 2022, both public
and private sector financial institutions need to enhance financing of renewables.
In addition, financing through public markets needs to be tapped, since currently it is not a much
sought-after option in India. But huge capital requirement, in combination with high cost of debt and equity,
means that fundraising from the capital market will be an important instrument of financing renewable
energy projects in the country. Two key instruments for raising finance through the capital market are
Infrastructure Investment Trusts and Green Bonds, and thus find critical mention here.
Infrastructure Investment Trusts
The concept of Infrastructure Investment Trusts (InvITs) has been under discussion in India for more than
five years. InvITs are publicly traded vehicles that offer investors regular yields. Investors will be able to
own, indirectly, part of the portfolio of the project that is part of an InvIT. Given that an InvIT consists
largely of completed assets, the returns required by the investors are expected to be lower than the
financing costs of the developer. These trusts release equity to finance/refinance infrastructure projects.
They also assist in unlocking tied-up capital of developers, lowering domestic financial institutions’ loan
exposure and attracting foreign capital.
0.0
0
50
00
.00
10
00
0.0
0
15
00
0.0
0
20
00
0.0
0
25
00
0.0
0
30
00
0.0
0
35
00
0.0
0
Hatsun Agro Product Ltd.
Welspun Renewable Energy PrivateLimited
Azure Power
Piramal SFG
Amount of Investment (`million)O
rgan
izat
ion

Investment Flows
70
Green Bonds
Indian renewable energy companies have been issuing bonds for quite a long time. However, most of them
were not labelled ‘GREEN’. In February 2015, YES Bank floated the first green bond in India worth `10,000
million with a tenure of 10 years and 8.85% coupon. Since then, many Indian companies have floated green
bonds. In 2016-17, green bonds were issued by 7 Indian companies as mentioned below.
Green Bonds Issued by Indian Companies in 2016-17
Issuer Amount (US$ Million) Amount (`Million )
Axis Bank 500 33,650
ReNew Power 75 5,000
NTPC 299 20,000
Greenko 500 33,465
Yes Bank 49 3,300
ReNew Power 475 31,872
IREDA 106 7,000
(Source: Climate Bonds Initiative)
Green bonds need not necessarily be raised in the domestic market. Offshore bond markets may be tapped
as well. In May 2016, Axis Bank listed a $500 million green bond on the London Stock Exchange. Further,
Masala bonds are a lucrative instrument for raising funds. These bonds are raised overseas, but the bonds
are issued in Indian currency. Thus, it transfers the risk of exchange rate fluctuation to the investor.
However, this type of bond requires higher ratings or offers higher returns to investors. The National
Thermal Power Corporation (NTPC) issued green masala bonds of `20,000 million (US$299 million) in
August, 2016 on the London Stock Exchange and Singapore Exchange.[19]
***

71
6.
EMISSIONS SCENARIO
According to the International Energy Agency (IEA), energy production and use account for two-thirds
of the world’s greenhouse gas (GHG) emissions. The Intergovernmental Panel on Climate Change
(IPCC) estimates that to preserve a 50% chance of limiting global warming to 20C, the world can
support a maximum carbon dioxide emissions “budget” of 3000 gigatonnes (Gt), of which an estimated
1970 Gt has already been emitted before 2014.[1] Taking into consideration CO2 emissions from
industrial processes and land use, land-use change and forestry for the remaining period of the 21st
century, the carbon budget for the energy sector works out to only 980 Gt (2014 onwards).
As on December 2015, the Government of India stated that the energy sector accounted for the
maximum number of emissions (58%). Within the energy sector, electricity generation is the biggest
contributor of GHG emissions, totalling 65.4%, followed by transport (12.9%) and buildings
(12.6%).[2] IEA predicts that an additional 315 million people – almost the population of the United
States today – are expected to live in India’s cities by 2040. This transition is expected to have huge
impact on energy consumption patterns. Currently, India is the world’s third largest market in terms
of gross electricity generation, of which coal-fired power provided 58.79% of India’s electricity in
2016-17.[3]
Given the above critical scenario (both global and India), the use and further development of fossil
fuels in the energy sector needs to be urgently curbed by transitioning to a low-carbon pathway.
6.1. INDIA AND ITS ‘CHANGING’ CLIMATE ROLE
6.1.1. International Negotiations and India (Figure 6.1)
In the initial years of climate negotiations (early 1990s), India made key formulations that went on to
defining the United Nations Framework Convention on Climate Change (UNFCCC) and the Kyoto
Protocol. This included formulation of the principle of “Common but Differentiated Responsibility”
(CBDR), that held the developed countries historically responsible for increased carbon emissions. In
essence, it translated into the fact that developed countries bear the responsibility of reducing
emissions, and transfer funds and technologies to developing countries to enable them to cope with
the impacts of climate change. The official Indian stance after its initial activism gradually turned out
to be defensive to the developed countries’ position. India mainly focused on warding-off mounting
pressure to take on mandatory emission cuts. It was only around 2008-09 that the country began to
synergize itself with international goals and decided to voluntarily reduce its emissions intensity by
20-25 percent by 2020 (from 2005 levels). India formally placed this pledge on record at COP 15 in
Copenhagen in 2009.[4]

Emissions Scenario
72
Figure 6.1: India’s Position in International Climate Negotiations
Source: WISE, 2017
6.1.2. Climate as part of India’s Energy Discourse
National Action Plan on Climate Change
Climate became part of the nation’s energy discourse with the
advent of the National Action Plan on Climate Change (NAPCC)
in 2008, which aimed to address India’s developmental concerns
along with mitigation and adaptation challenges posed by
climate change through eight national missions (Box 1). As per
the NAPCC, India’s climate strategy would promote the country’s
developmental objectives and at the same time, yield co-benefits
that address climate change.[5]
As part of the NAPCC, the government in 2009, directed all
state governments and union territories to prepare State
Action Plans on Climate Change (SAPCC), consistent with the
strategy outlined in the NAPCC. Twenty-two states have
since initiated the process of drafting SAPCCs.
Intended Nationally Determined Contribution (INDC)
The next big step taken by India to include climate as part of its energy discourse was with the
submission of its Intended Nationally Determined Contributions (INDCs) on 1 October 2015, prior to
the UN climate conference in December 2015 (COP 21) in Paris. India’s pledge through its INDCs offers
a comprehensive approach to curb the worst impacts of climate change while fostering economic
growth, increasing energy access, creating jobs, protecting forests and providing cleaner air and water
for its citizens.
Of the eight INDCs, the following three are specific targets and critical to India’s climate and energy
policy: [6]
1. Reduce emissions intensity of its GDP by 33 to 35 percent by 2030 from 2005 levels.
Early Stage
•Part of key formulations influencing UNFCCC and Kyoto Protocol, especially
intorduction of the principle of "Common but differentiated
responsibility".
•Stressed that developed countries were historically responsible for emissions
and hence should bear the sole responsibility of reduction as well.
Middle Stage
•Defensive rather than proactive approach to climate mitigation.
•Emphasis on seeking funds and technology transfer from developed
countries.
Later Stage
•Shift in policy to align with international goals and sustainability targets
•Notional non binding cap on emissions (Copenhagen Accord).
•Announcement of NDCs at the Paris Climate Convention.
Box 1: NAPCC - The Eight Missions
1. National Solar Mission
2. National Mission on Enhanced
Energy Efficiency
3. National Mission on Sustainable
Habitat
4. National Water Mission
5. National Mission for Sustaining
the Himalayan Eco-system
6. National Mission for a Green
India
7. National Mission for Sustainable
Agriculture
8. National Mission on Strategic
Knowledge for Climate Change.

Emissions Scenario
73
2. Achieve about 40 percent cumulative electric power installed capacity from non-fossil-fuel-
based energy resources by 2030 with the help of transfer of technology and low-cost
international finance including from the Green Climate Fund (GCF).
3. Create an additional carbon sink of 2.5 to 3 billion tonnes of CO2 equivalent through additional
forest and tree cover by 2030.
Apart from mitigation goals, there is also a strong focus on climate change adaptation in India’s INDCs
which highlights current initiatives in sensitive sectors, including agriculture, water, health and more.
6.2. EMISSIONS SCENARIO
6.2.1. Historical Emissions
In order to determine responsibility of nations towards climate change, taking into account historical
emissions by different countries in the past is crucial. Figure 6.2 illustrates the share of different
countries (regions) in cumulative GHG emissions during the past decade, i.e. 1990 to 2011.7 During
this period, the United States occupied the first rank in cumulative GHG emissions (16%), followed by
China (15%) and the European Union (12%). India ranked well below these countries (6th rank) with
a share of 4%. In terms of per capita emissions, the country showed much lower emissions (1.6
tonnes) than those in industrialised countries (Figure 6.3).
Figure 6.2: Global Cumulative GHG Emissions between 1990 and 2011
Source: World Resources Institute, 2014

Emissions Scenario
74
Figure 6.3: Global Per Capita GHG Emissions between 1990 and 2014[8]
Source: World Resources Institute, 2014
Table 6.1 GHG Emissions by Sector in India
(1994 and 2007)
According to the ‘India: Greenhouse Gas
Emissions 2007’ report, the total GHG
emissions without land use, land-use
change and forestry (LULUCF) has
grown from 1251.95 million tonnes in
1994 to 1904.73 million tonnes in 2007
at 3.3% compound annual growth rate
(CAGR) and with LULUCF at 2.9%
CAGR.[9] Between 1994 and 2007, some
of the sectors that show significant
growth in GHG emissions include cement
production (6%), electricity generation
(5.6%), and transport (4.5%). A
summary of GHG emissions by sector for
1994 and 2007 is shown in Table 6.1.
Source: INCCA, 2010
6.2.2. Current Emissions
According to the Emissions Gap Report, 2017, total global greenhouse gas emissions (including
LULUCF), are estimated at about 51.9 GtCO2e/year in 2016. The estimate for global total greenhouse
gas emissions in 2014 was 51.7 GtCO2e, and that of 2015 was 35.6 GtCO2. Emissions show a slowdown
in growth in the past two years, with calculated increases of 0.9 percent, 0.2 percent and 0.5 percent
in 2014, 2015 and 2016 respectively.[10]

Emissions Scenario
75
Data from World Resources Institute shows that around 70% of global GHG emissions emanates from
top 10 emitters of GHGs in the world. Figure 6.4 shows the absolute emissions of GHGs in 2011
(excluding and including LULUCF). While India ranks fourth in the list of absolute emissions, it ranks
last in per capita emissions (including LULUCF) (Figure 6.5).[7]
Figure 6.4: Global Top 10 Emitters of GHGs (2011)
Source: World Resources Institute, 2014
Figure 6.5: Global Per Capita Emissions of GHGs by top 10 Emitters (2011)
Source: World Resources Institute, 2014
6.3. EMISSIONS IN THE ENERGY SECTOR
6.3.1. Global Emissions
Total volume of global energy sector CO2 emissions over the past 27 years matched the total level of
all previous years. Fossil fuels continued to meet more than 80% of total primary energy demand and
over 90% of energy-related emissions were from CO2 emanating from fossil fuel combustion.[1] At the
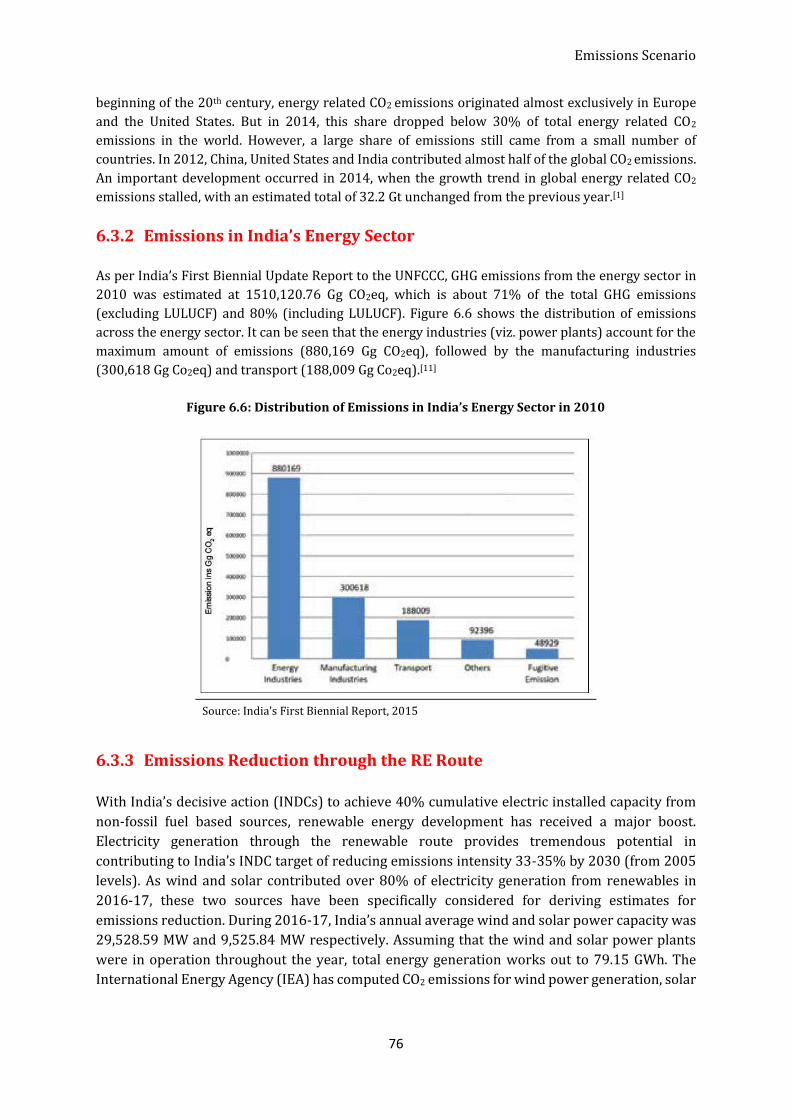
Emissions Scenario
76
beginning of the 20th century, energy related CO2 emissions originated almost exclusively in Europe
and the United States. But in 2014, this share dropped below 30% of total energy related CO2
emissions in the world. However, a large share of emissions still came from a small number of
countries. In 2012, China, United States and India contributed almost half of the global CO2 emissions.
An important development occurred in 2014, when the growth trend in global energy related CO2
emissions stalled, with an estimated total of 32.2 Gt unchanged from the previous year.[1]
6.3.2 Emissions in India’s Energy Sector
As per India’s First Biennial Update Report to the UNFCCC, GHG emissions from the energy sector in
2010 was estimated at 1510,120.76 Gg CO2eq, which is about 71% of the total GHG emissions
(excluding LULUCF) and 80% (including LULUCF). Figure 6.6 shows the distribution of emissions
across the energy sector. It can be seen that the energy industries (viz. power plants) account for the
maximum amount of emissions (880,169 Gg CO2eq), followed by the manufacturing industries
(300,618 Gg Co2eq) and transport (188,009 Gg Co2eq).[11]
Figure 6.6: Distribution of Emissions in India’s Energy Sector in 2010
Source: India’s First Biennial Report, 2015
6.3.3 Emissions Reduction through the RE Route
With India’s decisive action (INDCs) to achieve 40% cumulative electric installed capacity from
non-fossil fuel based sources, renewable energy development has received a major boost.
Electricity generation through the renewable route provides tremendous potential in
contributing to India’s INDC target of reducing emissions intensity 33-35% by 2030 (from 2005
levels). As wind and solar contributed over 80% of electricity generation from renewables in
2016-17, these two sources have been specifically considered for deriving estimates for
emissions reduction. During 2016-17, India’s annual average wind and solar power capacity was
29,528.59 MW and 9,525.84 MW respectively. Assuming that the wind and solar power plants
were in operation throughout the year, total energy generation works out to 79.15 GWh. The
International Energy Agency (IEA) has computed CO2 emissions for wind power generation, solar

Emissions Scenario
77
power generation and coal-based power generation. The results of the IEA study are summarised
in Table 6.2.
Table 6.2: CO2 Emissions in Metric Tonnes per MWh Generated
Technology† CO2 Emissions (t/MWh)
Wind 0.008
Solar 0.1
Coal 0.87
Source: Climate Report, Cecile Bordier, 2008
† Emissions from wind and solar technologies are indirect emissions
The average savings of CO2 emissions from one MWh of electricity production is 0.79 t/MWh. The
assumption here is that the entire electricity generated by wind and solar has replaced generation
from coal-based power plants. Thus, the resulting avoided emissions of CO2 from wind and solar
generation is approximately 62.72 million metric tonnes in 2016-17.
6.4. FUTURE TRENDS
According to the Emissions Gap Report 2017, India is expected to overachieve its INDC targets of a)
33-35% reduction in emissions intensity levels by 2030 (from 2005 levels), b) increase the share of
non-fossil energy in total power generation capacity to 40 percent, and c) create an additional
cumulative carbon sink of 2.5–3 GtCO2e through additional forest and tree cover, if it continues with
its achievement of current targets. In addition, India can also avoid emissions if it achieves its target
of producing 160 GW of power from wind and solar technologies by 2022. This will enable displacing
around 256.95 million metric tonnes of CO2 emissions and replacing coal-based power generation
with clean energy.
***

78
REFERENCES
CHAPTER 1: ELECTRICITY GENERATION 1. REN21 (2017): Renewables 2017 Global Status Report, Renewable Energy Policy Network for 21st Century,
Paris.
2. MNRE (2017): Annual Report 2016-17, Ministry of New and Renewable Energy, New Delhi.
3. CEA (2016): Draft National Electricity Plan, Central Electricity Authority, New Delhi, Chap. 5, pp 19.
4. CEA (2017): Installed Capacity March 2017, Central Electricity Authority, New Delhi.
5. IWTMA (2017): India Wind Power – volume 3, issue 2 (June – July 2017), Indian Wind Turbine
Manufacturers Association, pp 36-38.
6. Bridge to India (2017): India Solar Handbook 2017, Bridge to India, New Delhi.
7. MOP (2017): http://powermin.nic.in/en/content/power-sector-glance-all-india, 2017.
8. MOP (2017): Ujwal Bharat 3 Years, Achievements and Initiatives of Ministry of Power, Coal, New &
Renewable Energy, and Mines, Government of India, pp 24.
9. MNRE (2017): Annual Report 2016-17, Ministry of New and Renewable Energy, New Delhi, pp 86.
CHAPTER 2: POLICY LANDSCAPE 1. Government of India (2003): The Electricity Act, Government of India, 2003.
2. MoP (2006): Tariff Policy, Ministry of Power, Government of India.
3. MoEF (2008): National Action Plan on Climate Change, Ministry of Environment and Forests, 2008.
4. CEA (2016) & CEA (2017): Installed Capacity, Central Electricity Authority, 2016 & 2017.
5. Various State Governments: State Policies of the Government of India.
6. MNRE (2010): Jawaharlal Nehru National Solar Mission, Phase I Policy Document, Ministry of New and
Renewable Energy, Government of India.
7. Bridge to India (2017): http://www.bridgetoindia.com/india-add-9-4-gw-solar-capacity-2017/
8. MNRE (2017): Agenda Note for National Review Meeting of State Principal Secretaries and State Nodal
Agencies of Renewable Energy, Ministry of New and Renewable Energy, Government of India.
9. MNRE (2017): Agenda Note for National Review Meeting of State Principal Secretaries and State Nodal
Agencies of Renewable Energy, Ministry of New and Renewable Energy, Government of India.
10. MNRE (2016): State-wise and Year-wise Targets for Installation of 40,000 MW Grid-Connected Solar
Rooftop Systems, Ministry of New and Renewable Energy, Government of India.
11. MNRE (2016): Policy for Repowering of Wind Power Projects, Ministry of New and Renewable Energy,
Government of India.
12. MNRE (2016): Draft National Wind-Solar Hybrid Policy, Ministry of New and Renewable Energy,
Government of India.
13. Various State Governments: State Policies of the Government of India.
14. IREDAa (2017): http://www.ireda.gov.in/forms/contentpage.aspx?lid=744.
15. IREDAb (2017): http://www.ireda.gov.in/forms/contentpage.aspx?lid=743.
16. DoE (2016-17): National Clean Energy and Environment Fund, Department of Expenditure, India.
17. RBI (2015): https://rbi.org.in/Scripts/NotificationUser.aspx?Id=9688&Mode=0.
18. MNRE (2016): Draft National Policy on Renewable Energy Based Mini/MicroGrid, Ministry of New and
Renewable Energy, Government of India.
19. UPNEDA (2016): Minigrid Policy, Uttar Pradesh, 2016, Uttar Pradesh New and Renewable Energy
Development Agency, Uttar Pradesh.
20. UPERC (2016): Uttar Pradesh Electricity Regulatory Commission (Minigrid Renewable Energy Generation
and Supply) Regulations, Uttar Pradesh Electricity Regulatory Commission, Uttar Pradesh.
21. JKSERC (2016): JKSERC (Mini Grid Renewable Energy Generation and Supply) Regulations, Jammu and
Kashmir State Electricity Regulatory Commission, Jammu and Kashmir.
22. MPERC (2016): MPERC (Microgrid Renewable Energy Generation and Supply) Regulations, Madhya
Pradesh Electricity Regulatory Commission.

79
CHAPTER 3: REGULATORY FRAMEWORK
1. Government of India (2003): Electricity Act, 2003.
2. MoP (2016): Tariff Policy, 2016, dated 30 January 2016.
3. CERC (2009): Terms and Conditions for Tariff determination from Renewable Energy Sources Regulations,
2009.
4. CERC (2012): Terms and Conditions for Tariff determination from Renewable Energy Sources Regulations,
2012.
5. CERC (2017): Terms and Conditions for Tariff determination from Renewable Energy Sources Regulations,
2017.
6. State Electricity Regulatory Commissions (SERCs): Various Orders/Regulations related to Solar power
Feed-in tariff.
7. State Electricity Regulatory Commissions (SERCs): Various Orders/Regulations related to Wind power
Feed-in tariff.
8. Solar Energy Corporation of India (SECI): Various Guidelines and Results of Competitive Bidding
conducted for Solar Power Projects in India.
9. Solar Energy Corporation of India (SECI): Results of Competitive Bidding conducted for Wind Power
Projects in India
10. PIB (2017): http://pib.nic.in/newsite/printrelease.aspx?relid=163317, 2017.
11. State Electricity Regulatory Commissions (SERCs): Various Orders/Regulations related to Renewable
Purchase Obligation (RPO).
12. MNRE (2017): Agenda Note for National Review Meeting of State Principal Secretaries and State Nodal
Agencies of Renewable Energy on 23rd and 24th January 2017-New Delhi, Ministry of New and Renewable
Energy, Government of India.
13. MoP (2016): Notification dated 22 July 2016.
14. CERC (2010): Terms and Conditions for Recognition and Issuance of Renewable Energy Certificate for
Renewable Generation Regulations, 2010 and subsequent amendments.
15. CERC (2015): http://www.cercind.gov.in/2015/regulation/GZT101.pdf, 2015.
16. CERC (2014): http://www.cercind.gov.in/2014/regulation/ord16.pdf.
17. REC Registry of India (2017): https://recregistryindia.nic.in, 2017.
18. State Electricity Regulatory Commissions (SERCs): Various Orders/Regulations related to Open Access.
19. CERC (2016): Framework for Forecasting, Scheduling and Imbalance Handling for Variable Renewable
Energy Sources (Wind and Solar).
20. CERC (2014): (Deviation Settlement Mechanism and Related Matters) Regulations, 2014.
21. State Electricity Regulatory Commissions (SERCs): Various Regulations related to Net Metering.
CHAPTER 4: MANUFACTURING INDUSTRY 1. PIB (2009): http://pib.nic.in/archieve/others/2009/Nov/mission-JNNSM.pdf (accessed on 16/11/2017).
2. CEEW (Council on Energy, Environment and Water)/NRDC (Natural Resources Defense Council) (2012):
Laying the foundation for a bright future: assessing progress under Phase 1 of India’s National Solar
Mission: Interim Report, New Delhi.
3. MNRE: http://mnre.gov.in/file-manager/UserFiles/information-sought-from-all-Solar-Cell-&-Module-
manufacturers.pdf (accessed on 16/11/2017).
4. NIWE (2016): Revised List of Models and Manufacturers of Wind Turbines.
5. IT (2016): http://www.incometaxindia.gov.in/Budgets%20and%20Bills/2016/Finance_Bill_2016.pdf;
2017.
6. MoP (2017): http://powermin.nic.in/; 2017.
7. CEA (2017): http://www.cea.nic.in; 2017.
8. MNRE (2017) http://mnre.gov.in/information/policies-2/; 2017.
9. http://www.renom.in/; 2017.
10. http://www.kintechsynergy.com; 2017.
11. http://www.ocespl.com/; 2017.
12. http://www.powercon.in; 2017.
13. UN (2017) https://comtrade.un.org/; 2017.

80
CHAPTER 5: INVESTMENT FLOWS 1. CEA (2017): http://www.cea.nic.in/reports/monthly/installedcapacity/2017/installed_capacity-03.pdf.
2. CERC (2016): http://www.cercind.gov.in/2016/orders/SORE.pdf.
3. UNEP/BNEF, Frankfurt School (2017): Global Trends in Renewable Energy Investment, United Nations
Environment Program, Bloomberg New Energy Finance, Frankfurt School.
4. MNRE (2015): Achievements of RE-INVEST, Ministry of New and Renewable Energy, India.
5. MNRE (2016): Annual Report for FY 2015-16, Ministry of New and Renewable Energy, India.
6. MNRE (2017): http://mnre.gov.in/mission-and-vision-2/achievements/
7. IREDA (2015-16): Annual Reports, Indian Renewable Energy Agency, India.
8. PFC (2011-12 to 2015-16): Annual Reports, Power Finance Corporation, India.
9. REC (2011-12 to 2015-16): Annual Reports, Rural Electrification Corporation, India.
10. MCLR (2016): Marginal Cost of Funds based Lending Rate, Major Indian Banks, India.
11. PFC (2016): http://www.pfcgel.com/Content/lendingrates.aspx
12. REC (2017): http://recindia.nic.in/download/Interloan.pdf.
13. IREDA (2017): http://www.ireda.gov.in/forms/contentpage.aspx?lid=740.
14. RBI (2016): https://rbi.org.in/Scripts/ECBView.aspx
15. Energetica (2016): Greening India's Financial Market: Investigating Opportunities for a Green Bank in
India, Energitica India.
16. NRDC (2016): Green Banks: Easing India’s Clean Energy Finance Barriers, Natural Resources Defense
Council, India.
17. BNEF (2016): Financing India’s Clean Energy Transition, Bloomberg New Energy Finance, India.
18. Energetica (2016): Green Bonds: An Overview, Energetica India.
19. NTPC (2016): http://www.ntpc.co.in/en/media/press-releases/details/ntpc-first-indian-corporate-offer-
green-masala-bonds-raises-inr-2000crore-through-rupee-denominated
CHAPTER 6: EMISSIONS SCENARIO 1. IEA (2015): Energy and Climate Change, World Energy Outlook Special Report, International Energy
Agency, Paris.
2. TOI (2015): https://timesofindia.indiatimes.com/home/environment/global-warming/Energy-sector-
accounts-for-58-of-greenhouse-gas-emissions-Govt/articleshow/50275517.cms
3. CEA (2017): Installed Capacity by Source, Central Electricity Authority, 2017.
4. OXFAM, India (2013): Rethinking India’s Climate Policy and the Global Negotiations, OXFAM, India.
5. MoEF (2008): National Action Plan on Climate Change, Ministry of Energy and Forest, India.
6. GoI (2015): India’s Intended Nationally Determined Contribution: Working Towards Climate Justice,
Government of India.
7. WRI (2014): https://wri.org/blog/2014/11/6-graphs-explain-world%E2%80%99s-top-10-emitters.
8. IEA (2015): Energy and Climate Change, World Energy Outlook Special Report, International Energy
Agency, Paris.
9. INCCA (2010): India Greenhouse Gas Emissions 2007, Indian Network for Climate Change Assessment,
Ministry of Environment and Forests, Government of India.
10. UN (2017): The Emissions Gap Report 2017, A UN Environment Synthesis Report, United Nations
Environment Programme.
11. MoEFCC, GoI (2015): India’s First Biennial Update Report, Ministry of Environment, Forest and Climate
Change, Government of India, India.

WORLD INSTITUTE OF SUSTAINABLE ENERGY
44 Hindustan EstatesRoad No. 2, Kalyani Nagar, Pune 411 006
Tel: +91-20-26613832/55 Fax: +91-20-26611438Email: [email protected] Website: www.wisein.org