renewable integration in the nem - … · • short term supply / demand balancing and frequency...
TRANSCRIPT

SLIDE 1
RENEWABLE INTEGRATION IN THE NEM
May 2014
ANDREW GROOMSYSTEMS CAPABILITY

SLIDE 2
AEMO – ELECTRICITY ROLES
Market Operator• ~$10B spot market
National Planner• Demand forecasts (NEFR)• Network planning (NTNDP)• Generation capacity requirements
Power System Operator• Real-time dispatch of generation• Power system security • Connection of new generation
Market development, Emergency management
Significant roles in Gas.

SLIDE 3
THE NEXT FEW YEARS…

SLIDE 4
DEMAND SUPPLIED BY GRID IS FALLING
Falling demand from grid• Rooftop PV• Efficiency standards• Price responses• Reduced industrials
Possible future growth ?• Electric vehicles• Fuel substitution
Source: AER State of the energy market 2013
SLIDE 5
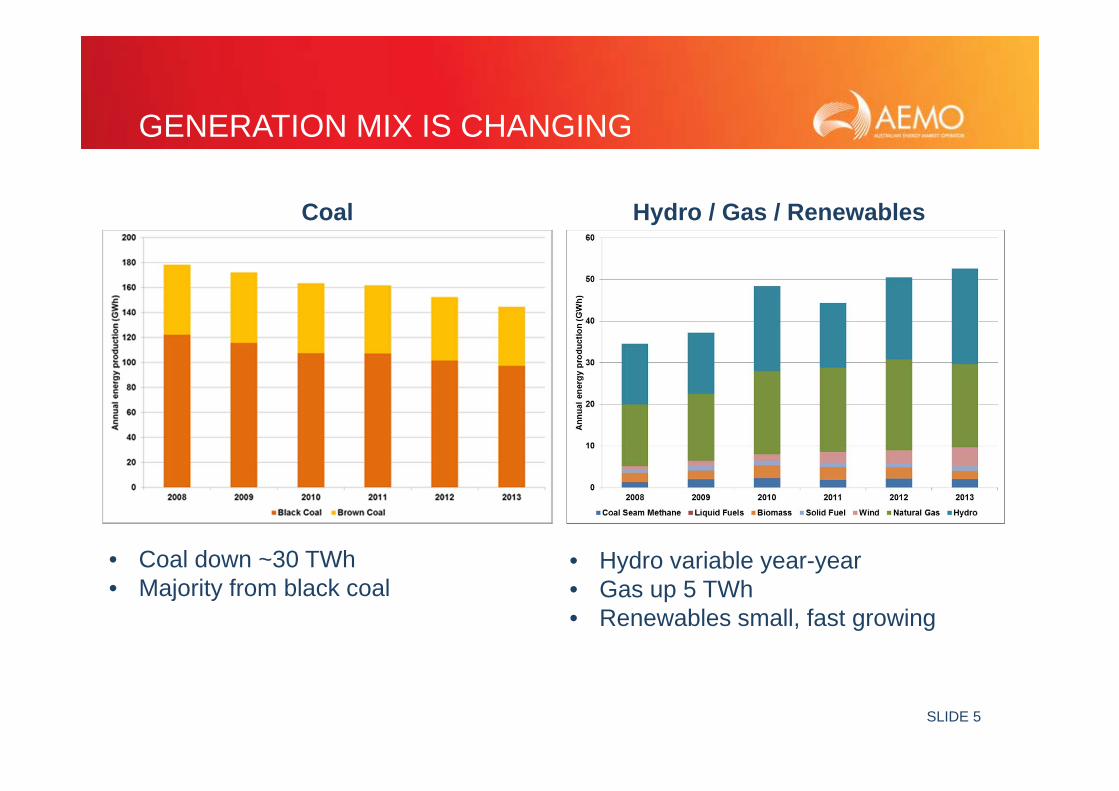
GENERATION MIX IS CHANGING
• Hydro variable year-year• Gas up 5 TWh• Renewables small, fast growing
• Coal down ~30 TWh• Majority from black coal
Hydro / Gas / RenewablesCoal
SLIDE 6
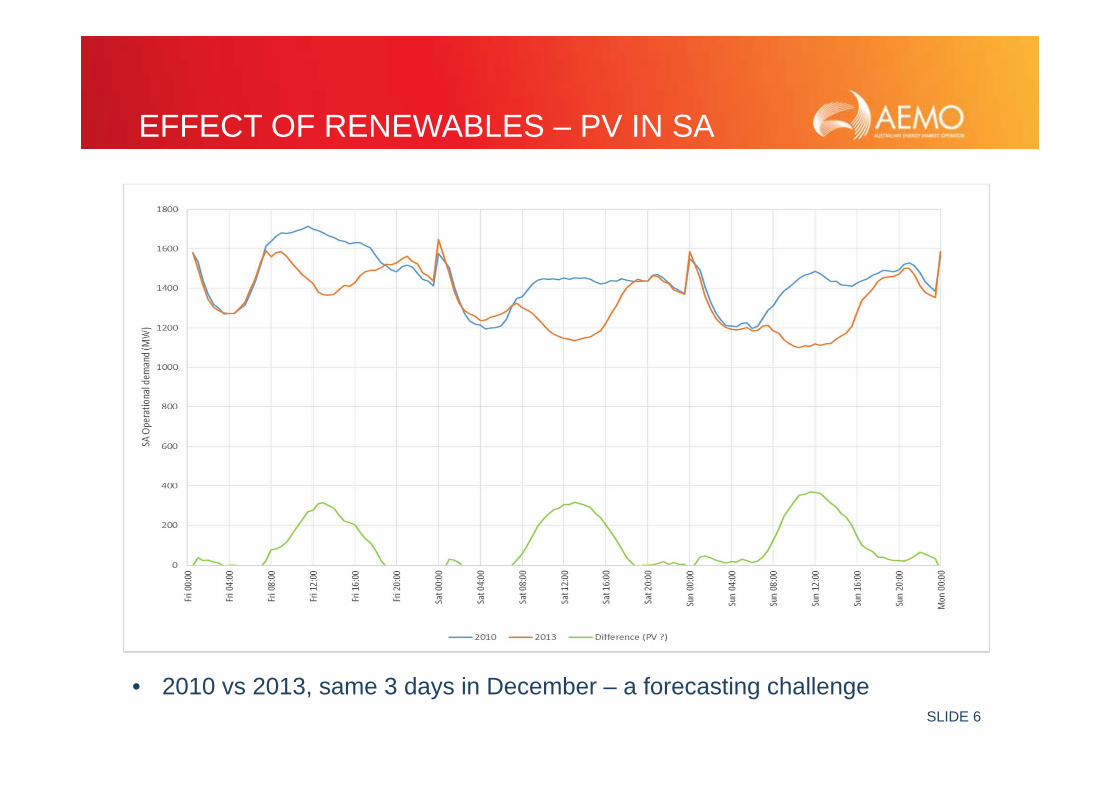
EFFECT OF RENEWABLES – PV IN SA
• 2010 vs 2013, same 3 days in December – a forecasting challenge
SLIDE 7
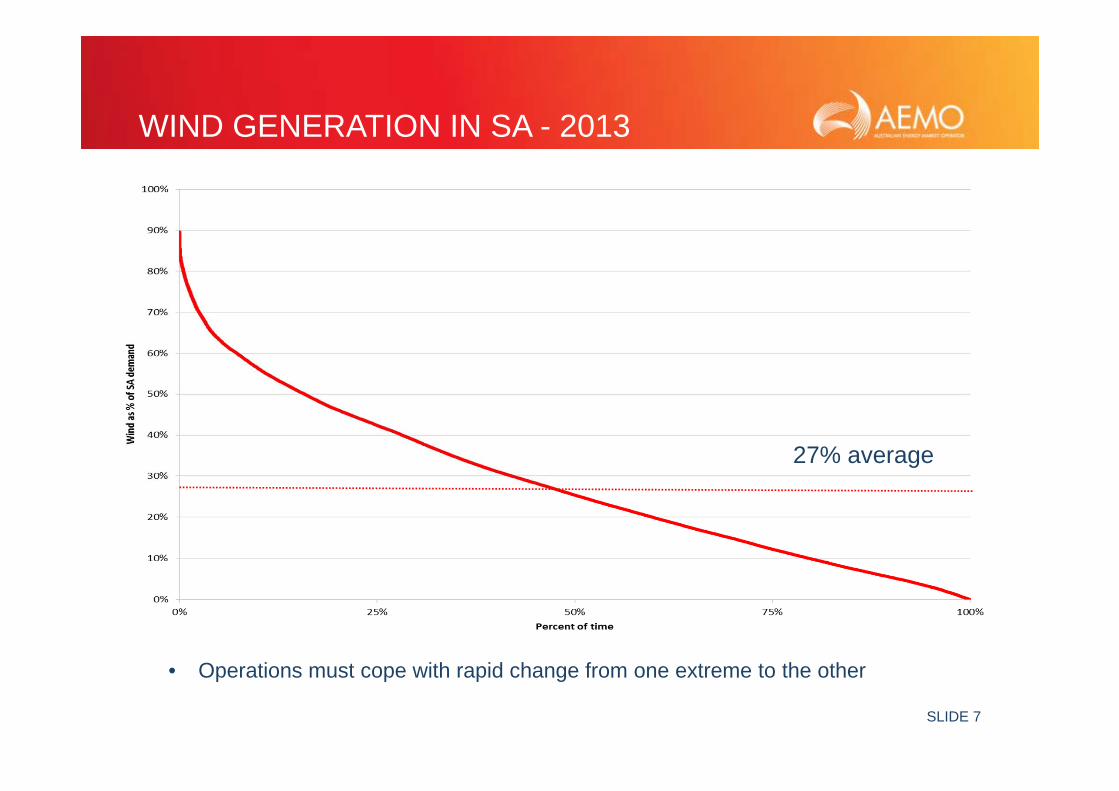
WIND GENERATION IN SA - 2013
27% average
• Operations must cope with rapid change from one extreme to the other

SLIDE 8
2013 RENEWABLE INTEGRATION STUDY
• 2020 system with 11.5 GW of total wind generation
• What impact on NEM operation ?o Interconnector limitso Frequency controlo Fault Levels

SLIDE 9
• Majority of new wind planted in SA and VIC
• Power system and market modelling to assess effects
8.9 GW NEW WIND GENERATION ADDED
SLIDE 10
WHAT DID WE FIND ?
• Good operational forecasting vital to renewable integrationo Grid scale and small scale PV forecasting under development
• Operational challenges come from displacement of conventional generation from the system.o Loss of ‘services’ like inertia, frequency control, fault levelo Impact on grid stability and frequency controlo Behaviour of incumbents is important, but hard to predict
• Biggest challenges when renewables form the largest portion of the supply mix.o Change from historical focus on maximum demand
• Impacts minimised when installation is geographically spread around the NEM.o Best wind resource may not in future be best location.
SLIDE 11
FREQUENCY CONTROL
• Short term supply / demand balancing and frequency control.o Low cost, voluntary market (FCAS), $25M in 2012o No incentive or obligation for renewables to participate.
• Renewables can complicate frequency control:o Don’t participate themselves, displace the generators who do
• Issues in TAS, and in SA when separated from NEM.o Not seen as a problem for mainland NEM.
• Some changes required to frequency control arrangements
SLIDE 12
STABILITY AND INTERCONNECTOR LIMITS
• Displacement of conventional generation can reduce grid stability.o Affects power transfer between regions.o Managed through significant wind curtailment in SA and VICo Up to 35% curtailment in VIC, mainly due to this issue
• Very dependent on response of incumbent generationo Do they stay online at reduced load, or come off ?o Not all drivers are clear, or easily modelled.o Are the right incentives in place ?

SLIDE 13
OPTIONS
• B.A.U. is viable.o Significant impact on wind, if expansion occurred as assumed
• Range of other options identifiedo Network investmento New markets or incentiveso Changes to technical standards for new connectiono Complex questions of cost, market efficiency, market power,
technical questions.o No preferred new options identified at this time

SLIDE 14
WHAT NEXT ?
NSW
QLD
VIC
TAS
SA
Demand 3,780 - 10,490 MWWind 1,015 MW
PV 532 MW Hydro 2187 MW
Demand 810 - 1,790 MWWind 240 MW
PV 55 MW Hydro 2370 MW
Demand 1,040 - 3,400 MWWind 1,475 MW
PV 500 MW ?Hydro 0 MW
Demand 5,120 - 14,740 MWWind 430 MW
PV 671 MWHydro 2342 MW
Demand 4,100 - 8,900 MWWind 0 MW
PV ~1,000 MWHydro 648 MW

SLIDE 15
FOCUS ON OPERATION OF SA
• Challenges unique to SAo Highest installed renewables vs demand Typical demand 1.1 - 1.7 GW ~1.5 GW wind by end 2013) ~0.5 GW rooftop PV
o Relatively inflexible thermal generation fleeto At risk of separation from NEM
• Any case for changes likely to emerge in SA
• Is only Wind + PV operationally viable in SA ?
• Operations and renewables one part of larger AEMO work stream

SLIDE 16
INDUSTRY CHALLENGES
• Changing customer behaviours and response to policy. o Diminishing load from the main power system (“at the meter”)
o Technological change – wind, embedded generation, rooftop PV, smart meters, appliance efficiency, storage ?.
• Changing market paradigm.o Reduced network energy but see short duration peak network demand
o Increasing supply vs flat demand = downwards pressure on wholesale prices, retirements, exit pathways for generators.
o Shift from centrally scheduled power system/major generation to increasing embedded generation (unscheduled)
• AEMO’s challenges.o Power system operation, forecasting, planning in a decentralised world;
o Retail and wholesale markets suited to the changing environment
Watch this space…
SLIDE 17
THANK YOU
17
www.aemo.com.au