renault atlas - daciaclub.tehnoplus.netdaciaclub.tehnoplus.net/daciaclub/logan/diverse/renault...
TRANSCRIPT

RENAULT ATLAS March 2006

Production and sales26 Worldwide production
35 Logistics
36 Worldwide sales
39 Sales in Europe
52 Sales in France
56 Sales outside Europe
60 Distribution network
61 Parts and accessories
Other activities62 RCI Banque
63 Industrial activities
64 Motor sport
This document is also published onwww.renault.com and www.media.renault.com
Key figures
Renault Commitment 2009
The Renault-Nissan Alliance6 Structure
7 World ranking of automotive groups
8 Worldwide sales and production sites
10 Cooperation
The Renault group12 Organization chart
14 Financial information
18 Workforce
19 Purchasing
20 Dacia
21 Renault Samsung Motors
22 Vehicle ranges
24 Engine and gearbox ranges
RENAULT ATLAS March 2006
Contents
Note: figures may vary slightly between the September andMarch issues of the Atlas to reflect the most recent data.
2 3
Key figures Renault Commitment 2009
4 5
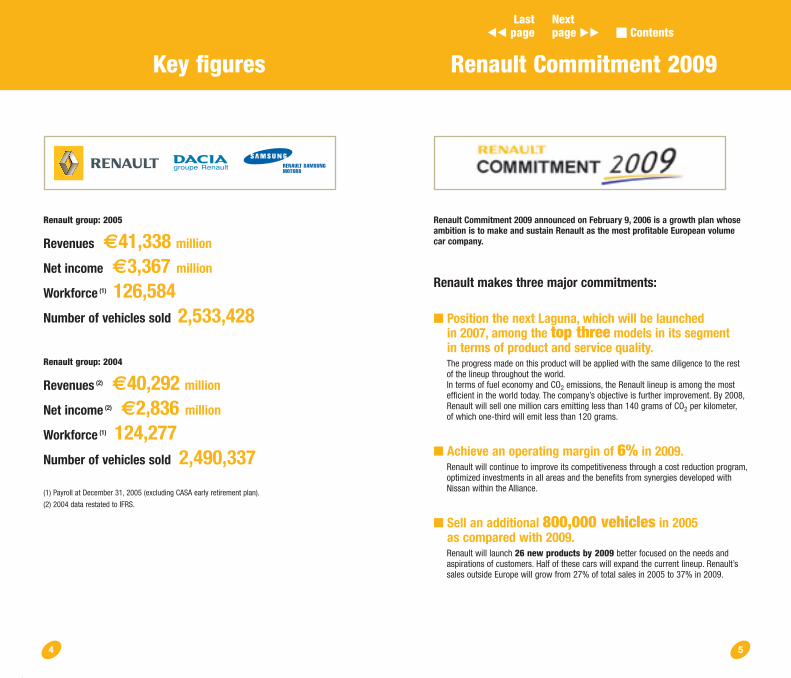
Renault group: 2005
Revenues €41,338 million
Net income €3,367 million
Workforce (1) 126,584Number of vehicles sold 2,533,428
Renault group: 2004
Revenues (2) €40,292 million
Net income (2) €2,836 million
Workforce (1) 124,277Number of vehicles sold 2,490,337
(1) Payroll at December 31, 2005 (excluding CASA early retirement plan).
(2) 2004 data restated to IFRS.
Renault Commitment 2009 announced on February 9, 2006 is a growth plan whoseambition is to make and sustain Renault as the most profitable European volumecar company.
Renault makes three major commitments:
■ Position the next Laguna, which will be launched in 2007, among the top three models in its segment in terms of product and service quality.The progress made on this product will be applied with the same diligence to the rest of the lineup throughout the world.In terms of fuel economy and CO2 emissions, the Renault lineup is among the most efficient in the world today. The company’s objective is further improvement. By 2008,Renault will sell one million cars emitting less than 140 grams of CO2 per kilometer,of which one-third will emit less than 120 grams.
■ Achieve an operating margin of 6% in 2009.Renault will continue to improve its competitiveness through a cost reduction program,optimized investments in all areas and the benefits from synergies developed withNissan within the Alliance.
■ Sell an additional 800,000 vehicles in 2005 as compared with 2009.Renault will launch 26 new products by 2009 better focused on the needs and aspirations of customers. Half of these cars will expand the current lineup. Renault’ssales outside Europe will grow from 27% of total sales in 2005 to 37% in 2009.
Last�� page
Next page �� Contents
7
The Renault-Nissan Alliance
6
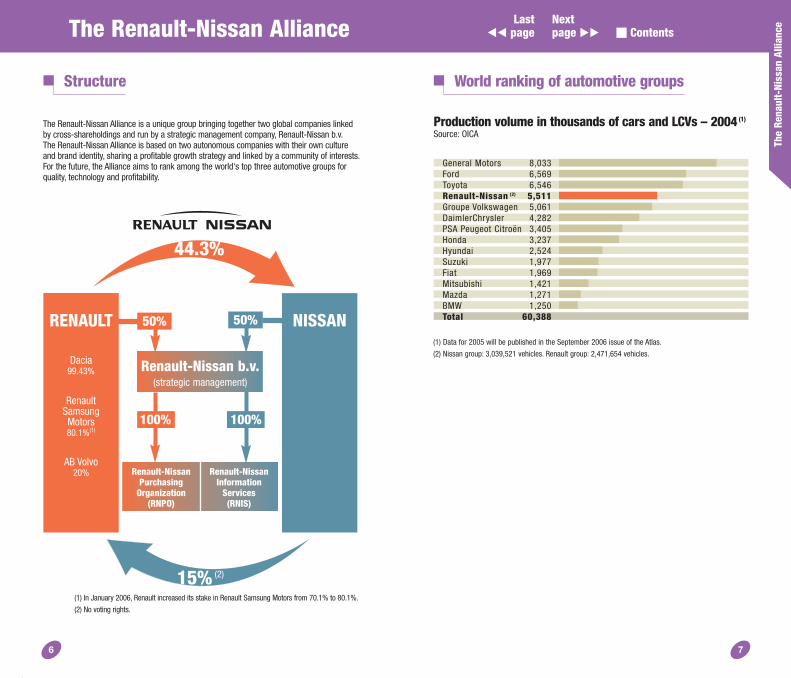
Structure
RENAULT NISSAN
Dacia99.43%
Renault Samsung Motors80.1%(1)
AB Volvo 20% Renault-Nissan
Information Services(RNIS)
Renault-Nissan Purchasing
Organization(RNPO)
50%
100%100%
44.3%
15% (2)
Renault-Nissan b.v.(strategic management)
50%
The Renault-Nissan Alliance is a unique group bringing together two global companies linkedby cross-shareholdings and run by a strategic management company, Renault-Nissan b.v.The Renault-Nissan Alliance is based on two autonomous companies with their own cultureand brand identity, sharing a profitable growth strategy and linked by a community of interests.For the future, the Alliance aims to rank among the world's top three automotive groups forquality, technology and profitability.
Production volume in thousands of cars and LCVs – 2004(1)
Source: OICA
General Motors 8,033Ford 6,569Toyota 6,546Renault-Nissan (2) 5,511Groupe Volkswagen 5,061DaimlerChrysler 4,282PSA Peugeot Citroën 3,405Honda 3,237Hyundai 2,524Suzuki 1,977Fiat 1,969Mitsubishi 1,421Mazda 1,271BMW 1,250Total 60,388
World ranking of automotive groups
(1) Data for 2005 will be published in the September 2006 issue of the Atlas.
(2) Nissan group: 3,039,521 vehicles. Renault group: 2,471,654 vehicles.
(1) In January 2006, Renault increased its stake in Renault Samsung Motors from 70.1% to 80.1%.
(2) No voting rights.
The
Rena
ult-
Niss
an A
llian
ce
Last�� page
Next page �� Contents
Mexico
United States
Kenya
Egypt
Turkey
Pakistan
Thailand
Indonesia
Romania (Dacia)
Russia
China (4)
South Korea (RSM)
Japan
Taiwan
South Africa
Zimbabwe
Colombia
Chile
Argentina
United Kingdom
France
Spain
Portugal
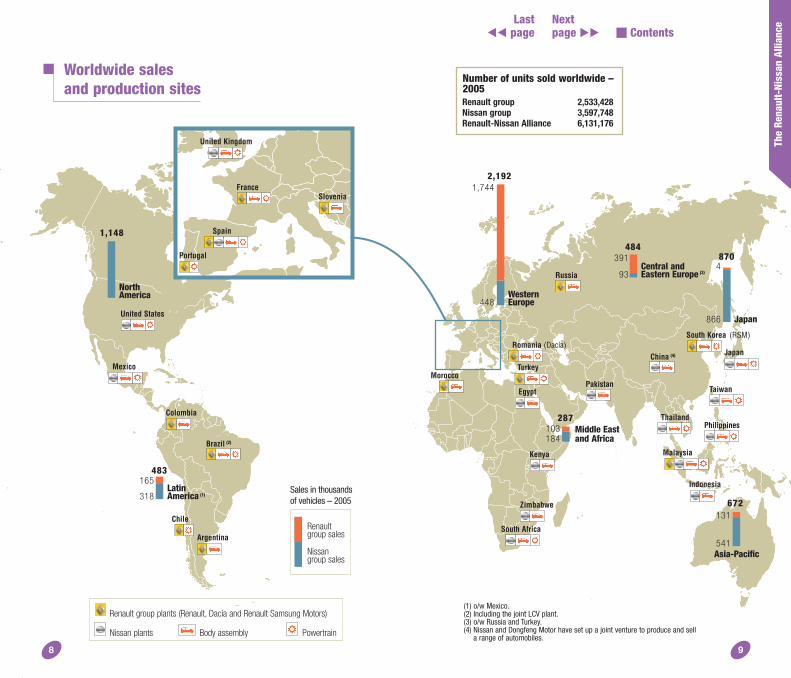
Number of units sold worldwide –2005Renault group 2,533,428Nissan group 3,597,748Renault-Nissan Alliance 6,131,176
The
Rena
ult-
Niss
an A
llian
ce
8 9
Worldwide sales and production sites
Philippines
1,148
NorthAmerica
(1) o/w Mexico.(2) Including the joint LCV plant.(3) o/w Russia and Turkey.(4) Nissan and Dongfeng Motor have set up a joint venture to produce and sell
a range of automobiles.
MalaysiaBrazil (2)
Slovenia
318
165LatinAmerica (1)
WesternEurope448
1,744
484
Central and Eastern Europe (3)93
391 870
Japan866
4
287Middle East and Africa184
103
672
Asia-Pacific541
131
Sales in thousands of vehicles – 2005
Morocco
Renaultgroup sales
Nissangroup sales
Renault group plants (Renault, Dacia and Renault Samsung Motors)
PowertrainNissan plants Body assembly
483
2,192
Last�� page
Next page �� Contents
The
Rena
ult-
Niss
an A
llian
ce
10 11
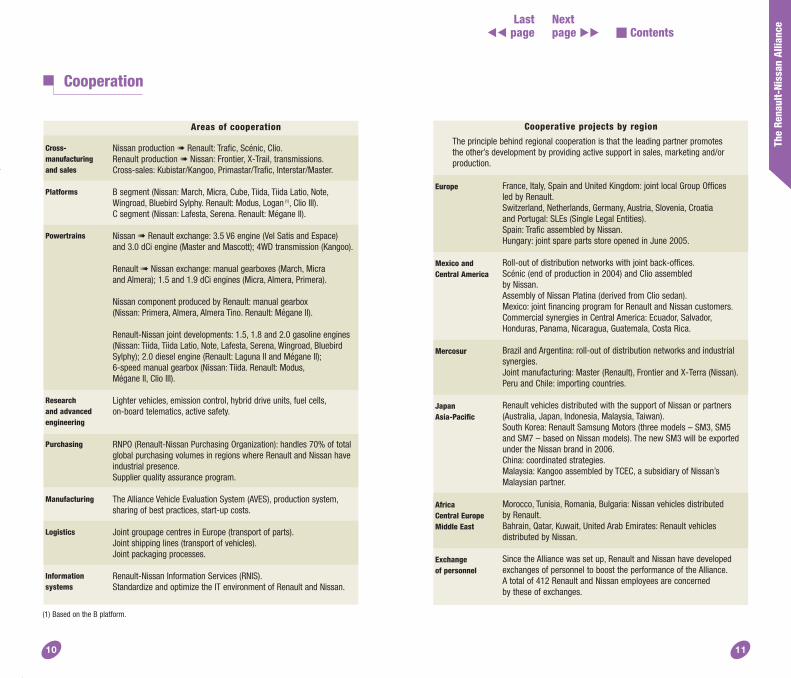
Cooperation
Europe
Mexico and Central America
Mercosur
JapanAsia-Pacific
Africa Central EuropeMiddle East
Exchange of personnel
France, Italy, Spain and United Kingdom: joint local Group Offices led by Renault.Switzerland, Netherlands, Germany, Austria, Slovenia, Croatia and Portugal: SLEs (Single Legal Entities).Spain: Trafic assembled by Nissan.Hungary: joint spare parts store opened in June 2005.
Roll-out of distribution networks with joint back-offices.Scénic (end of production in 2004) and Clio assembled by Nissan.Assembly of Nissan Platina (derived from Clio sedan).Mexico: joint financing program for Renault and Nissan customers.Commercial synergies in Central America: Ecuador, Salvador,Honduras, Panama, Nicaragua, Guatemala, Costa Rica.
Brazil and Argentina: roll-out of distribution networks and industrialsynergies.Joint manufacturing: Master (Renault), Frontier and X-Terra (Nissan).Peru and Chile: importing countries.
Renault vehicles distributed with the support of Nissan or partners(Australia, Japan, Indonesia, Malaysia, Taiwan).South Korea: Renault Samsung Motors (three models – SM3, SM5 and SM7 – based on Nissan models). The new SM3 will be exportedunder the Nissan brand in 2006.China: coordinated strategies.Malaysia: Kangoo assembled by TCEC, a subsidiary of Nissan’sMalaysian partner.
Morocco, Tunisia, Romania, Bulgaria: Nissan vehicles distributed by Renault.Bahrain, Qatar, Kuwait, United Arab Emirates: Renault vehicles distributed by Nissan.
Since the Alliance was set up, Renault and Nissan have developedexchanges of personnel to boost the performance of the Alliance.A total of 412 Renault and Nissan employees are concerned by these of exchanges.
Cross-manufacturingand sales
Platforms
Powertrains
Research and advancedengineering
Purchasing
Manufacturing
Logistics
Information systems
Areas of cooperation
Nissan production ➠ Renault: Trafic, Scénic, Clio.Renault production ➠ Nissan: Frontier, X-Trail, transmissions.Cross-sales: Kubistar/Kangoo, Primastar/Trafic, Interstar/Master.
B segment (Nissan: March, Micra, Cube, Tiida, Tiida Latio, Note,Wingroad, Bluebird Sylphy. Renault: Modus, Logan (1), Clio III).C segment (Nissan: Lafesta, Serena. Renault: Mégane II).
Nissan ➠ Renault exchange: 3.5 V6 engine (Vel Satis and Espace) and 3.0 dCi engine (Master and Mascott); 4WD transmission (Kangoo).
Renault ➠ Nissan exchange: manual gearboxes (March, Micra and Almera); 1.5 and 1.9 dCi engines (Micra, Almera, Primera).
Nissan component produced by Renault: manual gearbox (Nissan: Primera, Almera, Almera Tino. Renault: Mégane II).
Renault-Nissan joint developments: 1.5, 1.8 and 2.0 gasoline engines(Nissan: Tiida, Tiida Latio, Note, Lafesta, Serena, Wingroad, BluebirdSylphy); 2.0 diesel engine (Renault: Laguna II and Mégane II); 6-speed manual gearbox (Nissan: Tiida. Renault: Modus,Mégane II, Clio III).
Lighter vehicles, emission control, hybrid drive units, fuel cells,on-board telematics, active safety.
RNPO (Renault-Nissan Purchasing Organization): handles 70% of totalglobal purchasing volumes in regions where Renault and Nissan haveindustrial presence.Supplier quality assurance program.
The Alliance Vehicle Evaluation System (AVES), production system,sharing of best practices, start-up costs.
Joint groupage centres in Europe (transport of parts).Joint shipping lines (transport of vehicles).Joint packaging processes.
Renault-Nissan Information Services (RNIS).Standardize and optimize the IT environment of Renault and Nissan.
(1) Based on the B platform.
Cooperative projects by region
The principle behind regional cooperation is that the leading partner promotes the other’s development by providing active support in sales, marketing and/or production.
Last�� page
Next page �� Contents
The
Rena
ult g
roup
13
The Renault group
1212 13
Yann VincentSenior VP, Quality
Michel Faivre-DubozSenior VP, VehicleEngineering Development
Jean-Pierre CorniouSenior VP,Chief Information Officer
Kazumasa KatohSenior VP, PowertrainEngineering
Michel BalthazardVP, Pre-Engineering Projects and Requirements
Michel VimontVP, Research,Advanced Studies and Materials,
Patrick PélataExecutive Vice President,Product & Strategic Planningand Vehicle ProgramsRMC Leader, Asia-Africa
Rémi DeconinckSenior VP, Product Planning
Jean-Marie HurtigerCEO, Renault Samsung Motors
Bernard OllivierVP, Renault SportTechnologies
Jacques Verdonck VP, Strategic Planning
Gérard Detourbet (X90)Jacques Prost (I)Patrice Ratti (M2S)Jean-François Simon(3) (M1)VP, Vehicle Programs
Michel Gornet Executive Vice President,ManufacturingRMC Leader, France
Denis BarbierVP, Industrial SystemPerformance
Pascal DevernayVP, Logistics
Gérard Leclercq VP, PowertrainManufacturing
General Managersof body assembly plantsin Western Europe
Philippe JombartVP, Services
Didier LucienVP, Corporate Sales Division
Christian PouillaudeDirector, Commerce Americas
Christian PouillaudeDirector, Commerce Americas
Thierry KoskasDirector, Commerce Asia-Africa
Gilles Moncond’huyDirector, Commerce Euromed
Gilles Moncond’huyDirector, Commerce Euromed
Patrick BlainExecutive Vice President,Sales & Marketing RMC Leader, Europe
Thierry MoulonguetExecutive Vice President,Chief Financial OfficerRMC Leader, Americas
Jean-Jacques VaudoyerVP, Corporate Audit
Michel de VirvilleCorporate Secretary General,Executive Vice PresidentGroup Human Resources
Jean-Baptiste Duzan Senior VP,Corporate Controller
Marie-ChristineCaubetSenior VP, Market Area Europe
Philippe KleinSenior VP,CEO Office
Patrick Le QuémentSenior VP,Corporate Design
Marie-FrançoiseDamesin Senior VP,Communications
Odile Desforges Senior VP, PurchasingChairman and ManagingDirector of Renault-NissanPurchasing Organization
Manuel GomezSpecial Advisor to thePresident & CEO of Renault
Luc-Alexandre MénardChairman of the Dacia Board of Directors RMC Leader, Euromed
Luc-Alexandre MénardSenior VP, Public Affairs
Patrick Faure President,Renault F1 Team
Bernard LongVP, Executive Staff
Jacques Chauvet Senior VP, Market Area France
Jacques Chauvet Senior VP, Market Area France
Alain DassasSenior VP, Finance
Christian HussonVP, General Counsel
Christian EstèveVP, Corporate Resources
Bruno MorangeSenior VP, Light Commercial Vehicles
Philippe GambaChairman and CEO,RCI Banque
Jean-Michel KerebelVP, Central HumanResources
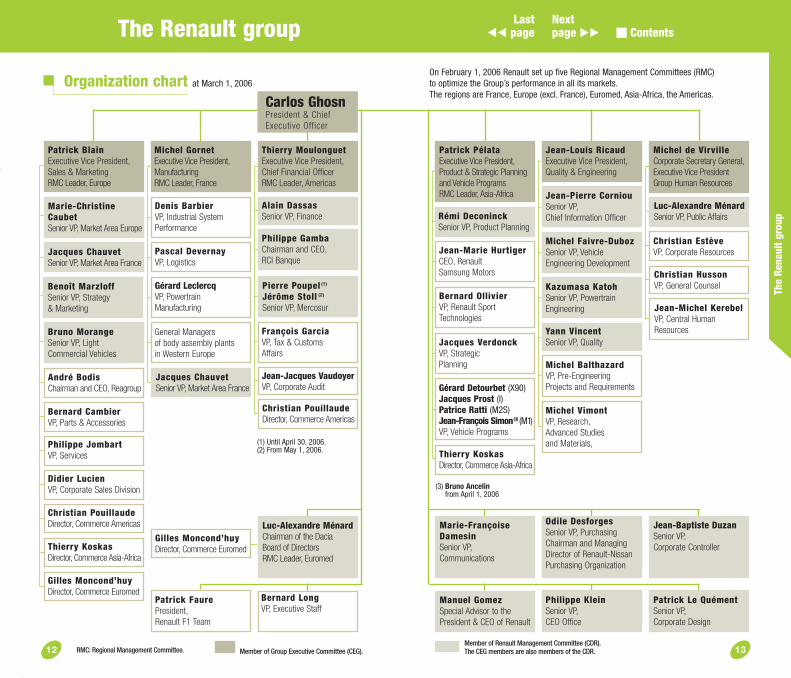
Member of Renault Management Committee (CDR).The CEG members are also members of the CDR.
Bernard CambierVP, Parts & Accessories
Benoît MarzloffSenior VP, Strategy & Marketing
Organization chart at March 1, 2006
Pierre Poupel (1)
Jérôme Stoll (2)
Senior VP, Mercosur
François GarciaVP, Tax & CustomsAffairs
Carlos GhosnPresident & ChiefExecutive Officer
André BodisChairman and CEO, Reagroup
Jean-Louis Ricaud Executive Vice President,Quality & Engineering
(1) Until April 30, 2006.(2) From May 1, 2006.
(3) Bruno Ancelin from April 1, 2006
Thierry KoskasDirector, Commerce Asia-Africa
Member of Group Executive Committee (CEG).RMC: Regional Management Committee.
On February 1, 2006 Renault set up five Regional Management Committees (RMC) to optimize the Group’s performance in all its markets.The regions are France, Europe (excl. France), Euromed, Asia-Africa, the Americas.
Last�� page
Next page �� Contents
The
Rena
ult g
roup
14 15
Financial information
■■■■■■■■■■■■■■■■■■■■■■■■■■■■■■■■■■■■■■■■■■■■■■■■■■■■■■■■■■■■■■■■■■■■■■■■■■■■■■■■■■■■■■■■■■■■■■■■■■■■■■■■■■■
■■■■■■■■■■■■■■■■■■■■■■■■■■■■■■■■■■■■■■■■■■■■■■■■■■■■■■
■■■■■■■■■■■■■■■■■■■■■■■■■■■■■■■■■■■■■■■■■■■■■■■■■■■■■■■■■■■■■■■■■■■■■■■■■■■■■■■■■■■■■■■■■■■■■■■■■■■■■■■■■■■
■■■■■■■■■■■■■■■■■■■■■■■■■■■■■■■■■■■■■■■■■■■■■■■■■■■■■■
■■■■■■■■■■■■■■■■■■■■■■■■■■■■■■■■■■■■■■■■■■■■■■■■■■■■■■■■■■■■■■■■■■■■■■■■■■■■■■■■■■■■■■■■■■■■■■■■■■■■■■■■■■■
■■■■■■■■■■■■■■■■■■■■■■■■■■■■■■■■■■■■■■■■■■■■■■■■■■■■■■
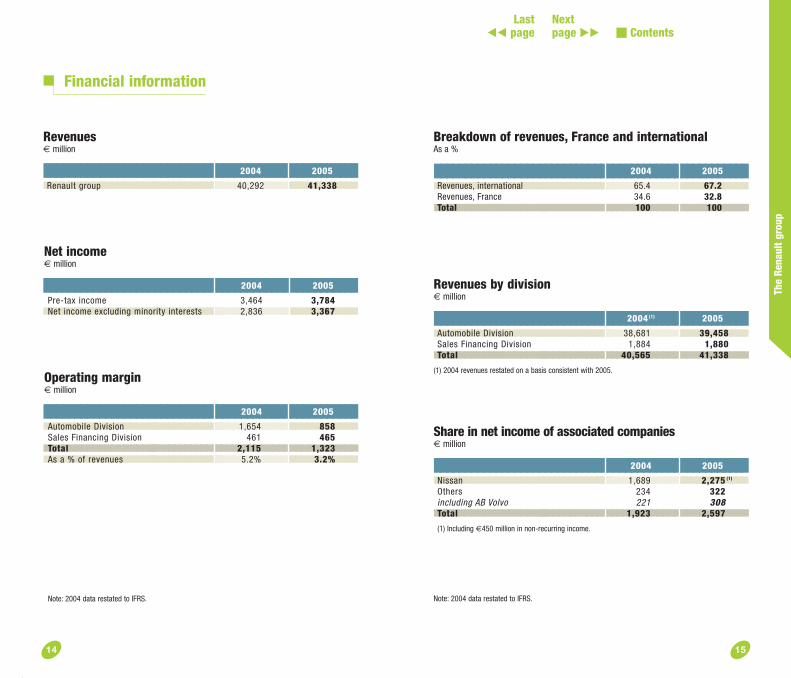
Revenues by division€ million
2004 (1) 2005
Automobile Division 38,681 39,458Sales Financing Division 1,884 1,880Total 40,565 41,338
(1) 2004 revenues restated on a basis consistent with 2005.
Breakdown of revenues, France and internationalAs a %
2004 2005
Revenues, international 65.4 67.2Revenues, France 34.6 32.8Total 100 100
■■■■■■■■■■■■■■■■■■■■■■■■■■■■■■■■■■■■■■■■■■■■■■■■■■■■■■■■■■■■■■■■■■■■■■■■■■■■■■■■■■■■■■■■■■■■■■■■■■■■■■■■■■■
Revenues€ million
2004 2005
Renault group 40,292 41,338
■■■■■■■■■■■■■■■■■■■■■■■■■■■■■■■■■■■■■■■■■■■■■■■■■■■■■■■■■■■■■■■■■■■■■■■■■■■■■■■■■■■■■■■■■■■■■■■■■■■■■■■■■■■
Net income€ million
2004 2005
Pre-tax income 3,464 3,784Net income excluding minority interests 2,836 3,367
■■■■■■■■■■■■■■■■■■■■■■■■■■■■■■■■■■■■■■■■■■■■■■■■■■■■■■■■■■■■■■■■■■■■■■■■■■■■■■■■■■■■■■■■■■■■■■■■■■■■■■■■■■■
■■■■■■■■■■■■■■■■■■■■■■■■■■■■■■■■■■■■■■■■■■■■■■■■■■■■■■■■■■■■■■■■■■■■■■■■■■■■■■■■■■■■■■■■■■■■■■■■■■■■■■■■■■■■■■
Operating margin€ million
2004 2005
Automobile Division 1,654 858Sales Financing Division 461 465Total 2,115 1,323As a % of revenues 5.2% 3.2%
Note: 2004 data restated to IFRS.
Share in net income of associated companies€ million
2004 2005
Nissan 1,689 2,275Others 234 322including AB Volvo 221 308Total 1,923 2,597
(1) Including €450 million in non-recurring income.
Note: 2004 data restated to IFRS.
(1)
Last�� page
Next page �� Contents

The
Rena
ult g
roup
16 17
Financial information (cont’d)
■■■■■■■■■■■■■■■■■■■■■■■■■■■■■■■■■■■■■■■■■■■■■■■■■■■
■■■■■■■■■■■■■■■■■■■■■■■■■■■■■■■■■■■■■■■■■■■■■■■■■■■■■■■■
■■■■■■■■■■■■■■■■■■■■■■■■■■■■■■■■■■■■■■■■■■■■■■■■■■■■■■■■■■■■■■■■■■■■■■■■■■■■■■■■■■■■■■■■■■■■■■■■■■■■■■■■■■■
■■■■■■■■■■■■■■■■■■■■■■■■■■■■■■■■■■■■■■■■■■■■■■■■■■■■■■
■■■■■■■■■■■■■■■■■■■■■■■■■■■■■■■■■■■■■■■■■■■■■■■■■■■■■■■■■■■■■■■■■■■■■■■■■■■■■■■■■■■■■■■■■■■■■■■■■■■■■■■■■■■■■■■■■■■■■■■■■■■■■■■■■■■■■■■■■■■■■■■■■■■■■■■■■■■■■■■■■■■■■■■■■■■■■■■■■■■■■■■■■■■■■■■■■■■■■■■■■■■■■■■■■■■■■■■■
■■■■■■■■■■■■■■■■■■■■■■■■■■■■■■■■■■■■■■■■■■■■■■■■■■■■■■■■■■■■■■■■■■■■■■■■■■■■■■■■■■■■■■■■■■■■■■■■■■■■■■■■■■■■■■■■■■■■■■■■■■■■■■■■■■■■■■■■■■■■■■■■■■■■■■■■■■■■■■■■■■■■■■■■■■■■■■■■■■■■■■■■■■■■■■■■■■■■■■■■■■■■■■■■■■■■■■■■■■■■■■■■■■■■■■■■■■■■■■■■■■■■■■■■■■■■■■■■■■■■■■■■■■■■■■■■■■■
Ownership of share capital – 2005At December 31, 2005
(1) Nissan cannot exercise the voting rights attached to these shares.(2) Shares acquired for the purposes of stock option programs.
These shares have no voting rights attached.
Total share capital: €1,085,610,419.58Total number of shares: 284,937,118
Research & development expenditure Automobile Division (1)
2004 2005
As a % of Automobile Division revenues 4.9 5.5€ million 1,961 2,264
(1) Including capitalized development costs.
Shareholders’ equity and net financial debt€ million
2004 2005
Net financial debt of the Automobile Division 1,567 2,252Shareholders’ equity 15,864 19,661Net financial debt of the Automobile Division/shareholders’ equity (as a %) 9.9% 11.5%
Capital expenditure in property, plant and equipment and intangible assets (net of disposals)€ million
2004 2005
Automobile Division 3,199 2,879Sales Financing Division 117 66Total 3,316 2,945
Treasury stock (2) 3.4%Employees 3.6%
French State 15.3%
Nissan (1) 15%Public 62.7%
Share price – from December 31, 2001to December 31, 2005 (in euros)CAC 40 and DJ Euro Stoxx Auto indexed on Renault share price at December 31, 2001 (€39.61)
80
70
60
50
40
30
20
10
Jan. Apr. Jul. Oct. Jan. Apr. Jul. Oct. Jan. Apr. Jul. Oct. Jan. Apr. Jul. Oct. Jan.
+13.1% +22.2% +12.5% +11.9%
DJ Euro Stoxx Auto: +23.4%
CAC 40: +19.9%
Renault: +11.9%
2002 2003 2004 2005
Note: 2004 data restated to IFRS.
Last�� page
Next page �� Contents
�������������������������������������������������������������������������������������������������������
��������������������������������������������������������������������������������������������������������
������������������������������������������������������
������������������������������������������������������������������������������������������������������������������������������������������������������������
����������������������������������������������������������������������������������������������������������������������������������������������������������������������������������������������������������������������������������������������������������������������������������������������������������������������
The
Rena
ult g
roup
18 19
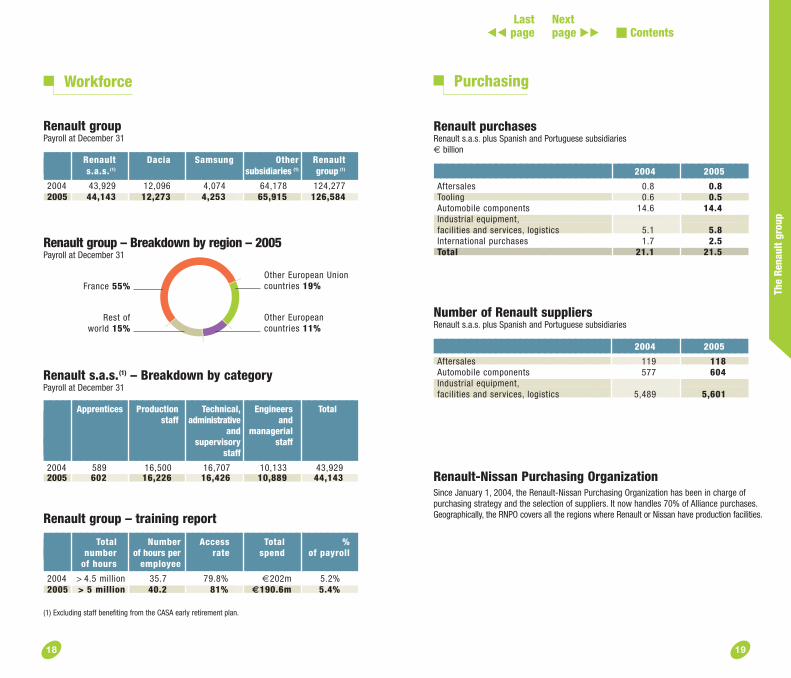
Renault purchases Renault s.a.s. plus Spanish and Portuguese subsidiaries€ billion
2004 2005
Aftersales 0.8 0.8Tooling 0.6 0.5Automobile components 14.6 14.4Industrial equipment,facilities and services, logistics 5.1 5.8International purchases 1.7 2.5Total 21.1 21.5
�������������������������������������������������������������������������������������������������������
��������������������������������������������������������������������������������������������������������
Number of Renault suppliers Renault s.a.s. plus Spanish and Portuguese subsidiaries
2004 2005
Aftersales 119 118Automobile components 577 604Industrial equipment,facilities and services, logistics 5,489 5,601
Renault-Nissan Purchasing OrganizationSince January 1, 2004, the Renault-Nissan Purchasing Organization has been in charge of purchasing strategy and the selection of suppliers. It now handles 70% of Alliance purchases.Geographically, the RNPO covers all the regions where Renault or Nissan have production facilities.
Renault group Payroll at December 31
Renault Dacia Samsung Other Renaults.a.s.(1) subsidiaries (1) group (1)
2004 43,929 12,096 4,074 64,178 124,2772005 44,143 12,273 4,253 65,915 126,584
Renault s.a.s.(1) – Breakdown by category Payroll at December 31
Apprentices Production Technical, Engineers Totalstaff administrative and
and managerialsupervisory staff
staff
2004 589 16,500 16,707 10,133 43,9292005 602 16,226 16,426 10,889 44,143
���������������������������������������������������������������������������������������������������������������������������������������������������������������������������������������������������������������
Renault group – training report
Total Number Access Total % number of hours per rate spend of payroll
of hours employee
2004 > 4.5 million 35.7 79.8% €202m 5.2%2005 > 5 million 40.2 81% €190.6m 5.4%
(1) Excluding staff benefiting from the CASA early retirement plan.
PurchasingWorkforce
France 55%Other European Unioncountries 19%
Rest of world 15%
Other European countries 11%
Renault group – Breakdown by region – 2005Payroll at December 31
Last�� page
Next page �� Contents
■■■■■■■■■■■■■■■■■■■■■■■■■■■■■■■■■■■■■■■■■■■■■■■■■■■■■■■■■■■■■■■■■■■■■■■■■■■■■■■■■■■■■■■■■■■■■■■■■■■■■■■■■■
■■■■■■■■■■■■■■■■■■■■■■■■■■■■■■■■■■■■■■■■■■■■■■■■■■■■■■■■■■■■■■■■■■■■■■■■■■■■■■■■■■■■■■■■■■■■■■■■■■■■■■■■■■
■■■■■■■■■■■■■■■■■■■■■■■■■■■■■■■■■■■■■■■■■■■■■■■■■■■■■■■■■■■■■■■■■■■■■■■■■■■■■■■■■■■■■■■■■■■■■■■■■■■■■■■■■■
■■■■■■■■■■■■■■■■■■■■■■■■■■■■■■■■■■■■■■■■■■■■■■■■■■■■■■■■■■■■■■■■■■■■■■■■■■■■■■■■■■■■■■■■■■■■■■■■■■■■■■■■■■■■■■■■■■■■■■■■■■■■■■■■■■■■■■■■■■■■■■■■■■■■■■■■■■■■
The
Rena
ult g
roup
20 21
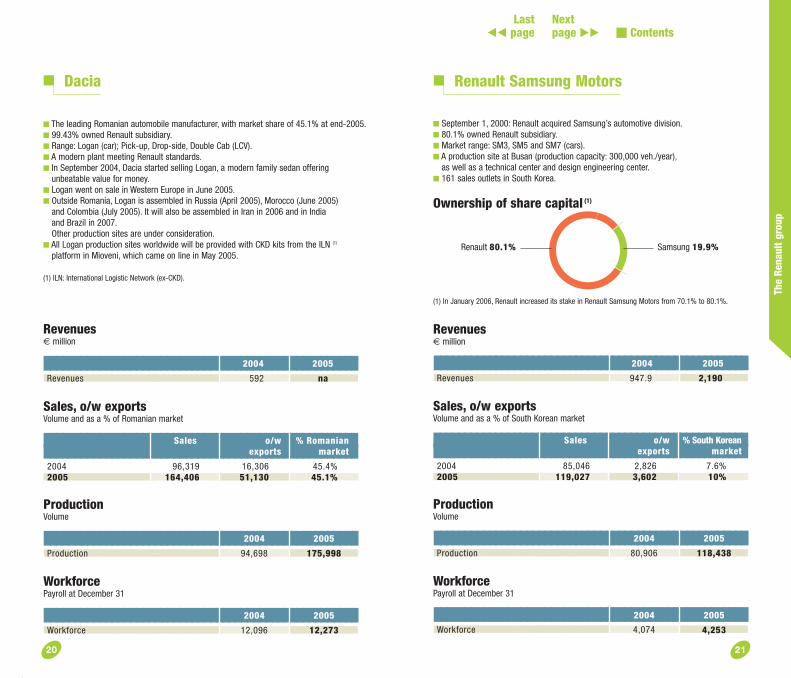
■ The leading Romanian automobile manufacturer, with market share of 45.1% at end-2005.■ 99.43% owned Renault subsidiary.■ Range: Logan (car); Pick-up, Drop-side, Double Cab (LCV).■ A modern plant meeting Renault standards.■ In September 2004, Dacia started selling Logan, a modern family sedan offering
unbeatable value for money.■ Logan went on sale in Western Europe in June 2005.■ Outside Romania, Logan is assembled in Russia (April 2005), Morocco (June 2005)
and Colombia (July 2005). It will also be assembled in Iran in 2006 and in India and Brazil in 2007.Other production sites are under consideration.
■ All Logan production sites worldwide will be provided with CKD kits from the ILN (1)
platform in Mioveni, which came on line in May 2005.
(1) ILN: International Logistic Network (ex-CKD).
Dacia
Revenues€ million
2004 2005
Revenues 592 na
Sales, o/w exportsVolume and as a % of Romanian market
Sales o/w % Romanian exports market
2004 96,319 16,306 45.4%2005 164,406 51,130 45.1%
ProductionVolume
2004 2005
Production 94,698 175,998
WorkforcePayroll at December 31
2004 2005
Workforce 12,096 12,273
■■■■■■■■■■■■■■■■■■■■■■■■■■■■■■■■■■■■■■■■■■■■■■■■■■■■■■■■■■■■■■■■■■■■■■■■■■■■■■■■■■■■■■■■■■■■■■■■■■■■■■■■■■■■■■■■■■■■■■■■■■■■■■■■■■■■■■■■■■■■■■■■■■■■■■■■■■■■
■■■■■■■■■■■■■■■■■■■■■■■■■■■■■■■■■■■■■■■■■■■■■■■■■■■■■■■■■■■■■■■■■■■■■■■■■■■■■■■■■■■■■■■■■■■■■■■■■■■■■■■■■■
■■■■■■■■■■■■■■■■■■■■■■■■■■■■■■■■■■■■■■■■■■■■■■■■■■■■■■■■■■■■■■■■■■■■■■■■■■■■■■■■■■■■■■■■■■■■■■■■■■■■■■■■■■
■■■■■■■■■■■■■■■■■■■■■■■■■■■■■■■■■■■■■■■■■■■■■■■■■■■■■■■■■■■■■■■■■■■■■■■■■■■■■■■■■■■■■■■■■■■■■■■■■■■■■■■■■■
Renault Samsung Motors
Samsung 19.9%
Revenues€ million
2004 2005
Revenues 947.9 2,190
Sales, o/w exportsVolume and as a % of South Korean market
Sales o/w % South Koreanexports market
2004 85,046 2,826 7.6%2005 119,027 3,602 10%
Production Volume
2004 2005
Production 80,906 118,438
WorkforcePayroll at December 31
2004 2005
Workforce 4,074 4,253
Renault 80.1%
■ September 1, 2000: Renault acquired Samsung’s automotive division.■ 80.1% owned Renault subsidiary.■ Market range: SM3, SM5 and SM7 (cars).■ A production site at Busan (production capacity: 300,000 veh./year),
as well as a technical center and design engineering center.■ 161 sales outlets in South Korea.
Ownership of share capital (1)
(1) In January 2006, Renault increased its stake in Renault Samsung Motors from 70.1% to 80.1%.
Last�� page
Next page �� Contents
The
Rena
ult g
roup
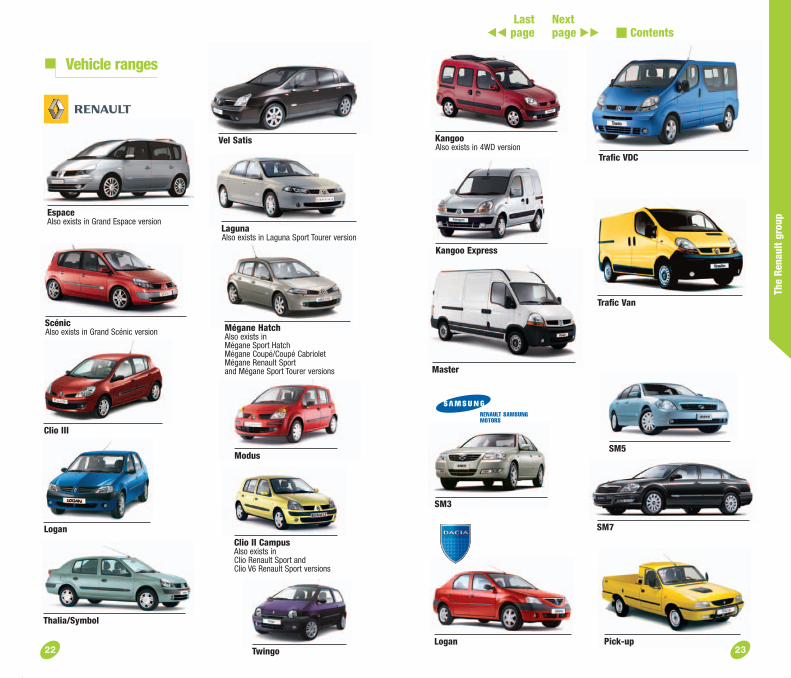
Vel Satis
22
Master
Trafic Van
LagunaAlso exists in Laguna Sport Tourer version
Trafic VDC
SM5
Thalia/Symbol
Clio III
Twingo
Logan
ScénicAlso exists in Grand Scénic version
EspaceAlso exists in Grand Espace version
Kangoo Express
Kangoo Also exists in 4WD version
Pick-upLogan
SM7
Modus
Clio II CampusAlso exists inClio Renault Sport andClio V6 Renault Sport versions
Mégane HatchAlso exists inMégane Sport HatchMégane Coupé/Coupé CabrioletMégane Renault Sportand Mégane Sport Tourer versions
Vehicle ranges
SM3
Last�� page
Next page �� Contents
23

The
Rena
ult g
roup
2524 25
Engine and gearbox ranges
Renault Samsung Motors engines
■■■■■■■■■■■■■■ ■■■■■■■■■■■■■■■■■■■■■■■■■■■■■■■■■■■■■■■■■■■■■■■■■
■■■■■■■■
■■■■■■■■■■■■■■
■■■■■■■■■■■■■■■■■■■■■■■■■■■■■■■■■■■■ ■■■■■■■■■■■■■■■■■■■■■■■■■■■■■■■■■■■■■■■■■■■■■■■
■■■■■■■■■■■■■■
■■■■■■■■■■■■■■■■■■■■■■■■■■■■■■■■■■■■■■■■■
■■■■■■■■■■■■■■■
■■■■■■■
■■■■■■■■
■■■■■■■■■■■■■■
■■■■■■■■■■■■■■
■■■■■■■■■■■■■■
■■■■■■■■■■■■■■■■■■■■■■■■■■■■■■■■■■■■■■■■■■■
■■■■■■■■■■■■■■■
■■■■■■■■■■■■■■■■
■■■■■■■
■■■■■■■■■■■■■■■■■■■■■■■■■■■■■■■■■■■
Renault gearboxes
Renault enginesType GASOLINE Laguna Vel Satis Espace Trafic Master
K1598cc 1.6 16v (K4M)F 2.0 16v (F4R)1998cc 2.0 T (F4Rt)
205hp 2.0 T (F4Rt)L2946cc6 cylinders in-vee 3.0 V6 (L7X)V3498cc6 cylinders in-vee 3.5 V6 (V4Y)
Type DIESEL Laguna Vel Satis Espace Trafic Master
F 80hp 1.9 dCi (F9Q)1870cc 90hp 1.9 dCi (F9Q)
115hp 1.9 dCi (F9Q)125hp 1.9 dCi (F9Q)130hp 1.9 dCi (F9Q)
M 150hp 2.0 dCi (M9R)1998cc 175hp 2.0 dCi (M9R)G 90hp 2.2 dCi (G9T)2188-2464cc 115hp 2.2 dCi (G9T)
140hp 2.2 dCi (G9T)150hp 2.2 dCi (G9T)100hp 2.5 dCi (G9U)120hp 2.5 dCi (G9U)140hp 2.5 dCi (G9U)
Z2953cc 140hp 3.0 dCi (ZD3)P2958cc6 cylinders in-vee 185hp 3.0 dCi V6 (P9X)
Type Laguna Vel Satis Espace Trafic Master
5-speed manual gearbox5-spd manual (JHQ)5-spd manual (JRQ)5-spd manual (PK5)6-speed manual gearbox6-spd manual (ND0)6-spd manual (PK6)6-spd manual (PF6)6-spd manual (PK4)6-speed AMT (1)
6-spd AMT (1) (PA6)4-speed automatic transmissionProactive (DPO)5-speed automatic transmissionProactive (SU1)Proactive (SU4)
■■■■■■■■■■■■■■■■■■
■■■■■■■■■■■■■■■■■■
■■■■■■■■■■■■■■■■■■■■■■■■■■■
■■■■■■■■■■■■ ■■■■■■■■■■■■ ■■■■■■■■■■■■■■■■■■■■■■■■ ■■■■■■
■■■■■■■■■■■■■■■■■■■■■■■■■■■■■■
■■■■■■■■■■■■■■■■■■■■■■■■■■■■■■
■■■■■■■■■■■■■■■■■■■■■■■■■■■■■■
■■■■■■ ■■■■■■■■■■■■■■■■■■■■■■■■■■■■■■■■■■■■
■■■■■■■■■■■■■■■■■■■■■■■■■■■■■■
Dacia engines
■■■■■■■■■■■■■■ ■■■■■■■■■■■■■■■■■ ■■■■■■■■■■■■■■■■■■■■■■■■■■■■■
■■■■■■■■■■■■■■■■■■ ■■■■■■■■■■■■■■■■■■■■■■■■■■■■■■■■■■■■■■■■■■■■■■■ ■■■■■■
■■■■■■■■■■■■■■
■■■■■■■■■■ ■■■■■■■■■■ ■■■■■
■■■■■■■■■■■
■■■■■ ■■■■■■■■■■■■■■■■■■■■■■■■■■■■■■■■■■■■■■■■■■■■■■■■■■■■■■■■■■■■■■■■■ ■■■■■■■■■■■■
■■■■■■■■■■■■■■
■■■■■■■■■■■■■■■■■■■■■■■■■■■■■■■■■■■■■■■■■■
■■■■■■■■■■■■
Renault enginesType GASOLINE Twingo Clio Modus Kangoo Mégane Scénic
D 1.0 (D7D) (1)
999-1149cc 1.2 (D7F)1.2 LPG (D7F) (2)
1.2 16v (D4F)K 1.4 (K7J)1390-1461cc 1.4 16v (K4J)1598cc 1.6 16v (K4M)
1.6 16v CNG (K4M) (2)
1.6 16v LPG (K4M)M1997cc 2.0 16v (M4R)F 2.0 16v (F4R)1998cc 2.0 T (F4Rt)
200hp 2.0 16v RS (F4R)225hp 2.0 T RS (F4Rt)
Type DIESEL Twingo Clio Modus Kangoo Mégane Scénic
K 60hp 1.5 dCi (K9K)1461cc 70hp 1.5 dCi (K9K)
85hp 1.5 dCi (K9K)105hp 1.5 dCi (K9K)
F 65hp 1.9D (F8Q) (1)
1870cc 90hp 1.9 dCi (F9Q)115hp 1.9 dCi (F9Q)125hp 1.9 dCi (F9Q)130hp 1.9 dCi (F9Q)
M1998cc 150hp 2.0 dCi (M9R)
Type Twingo Clio Modus Kangoo Mégane Scénic
5-speed manual gearbox5-spd manual (JB1)5-spd manual (JB3)5-spd manual (JC5)5-spd manual (JC7) (3)
5-spd manual (JHQ)5-spd manual (JRQ)5-speed AMT (4)
Quickshift 5 (JH1)Quickshift 5 (JA3)Quickshift 5 (JA5)6-speed manual gearbox6-spd manual (TL4)6-spd manual (NDO)6-spd manual (PK4)4-speed automatic transmissionProactive (DPO)
Type GASOLINE Pickup Drop-side Double Cab Logan
K 1.4 (K7J)1390-1598cc 1.6 (K7M)
DIESEL
K 65hp 1.9 D (F8Q) (1)
1461cc 70hp 1.5 dCi (K9K)F1870cc 65hp 1.9 D (F8Q) (1)
(1) Specific to certain markets. Ranges on sale.(2) On Clio II only.(3) On the 4WD version.(4) Automated Manual Transmission.
Renault gearboxes
GASOLINE SM3 SM5 SM7
QG 4-cylinder in-line (DOHC) 1497ccQG 4-cylinder in-line (CVTC) 1596ccSR LPG 4-cylinder in-line (2) 1998ccSR II 4-cylinder in-line (DOHC) 1998ccNeo VQ 6-cylinders in-vee 2349-3498cc
(1) Automated Manual Transmission.(2) On the Taxi version.
Last�� page
Next page �� Contents
Production and sales
Prod
uctio
n an
d sa
les
26 27
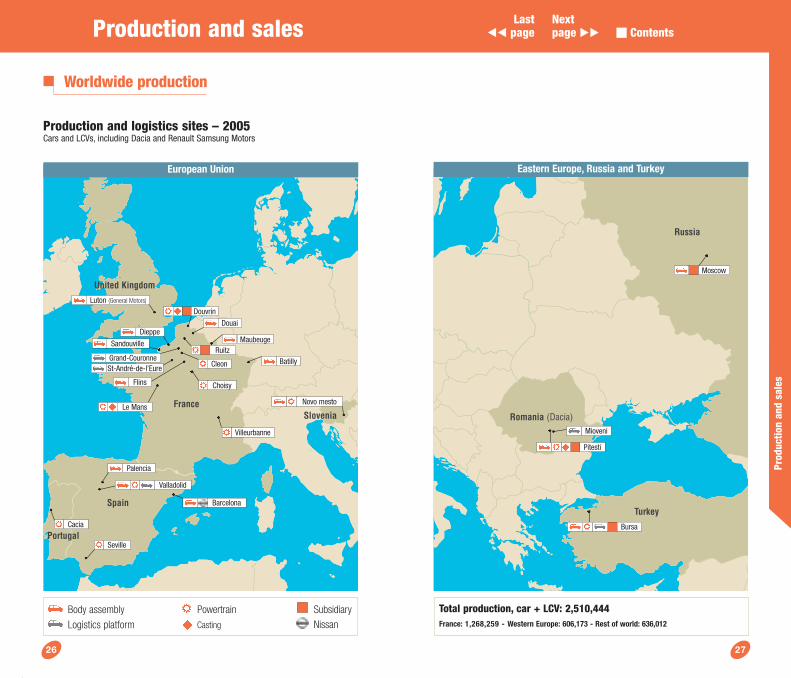
Production and logistics sites – 2005Cars and LCVs, including Dacia and Renault Samsung Motors
Worldwide production
Total production, car + LCV: 2,510,444France: 1,268,259 - Western Europe: 606,173 - Rest of world: 636,012
European Union Eastern Europe, Russia and Turkey
Turkey
Romania (Dacia)
Russia
Moscow
Pitesti
Powertrain SubsidiaryNissan
Body assembly
Logistics platform
Douai
Palencia
Seville
Cacia
Batilly
Spain
Slovenia
Portugal
France
United Kingdom
Valladolid
Choisy
Cleon
Sandouville
Grand-Couronne
Dieppe
Villeurbanne
Luton (General Motors)
Barcelona
Ruitz
Novo mesto
Maubeuge
Le Mans
Flins
St-André-de-l’Eure
Douvrin
Bursa
Mioveni
Casting
Last�� page
Next page �� Contents
Prod
uctio
n an
d sa
les
2928
Colombia
Mexico
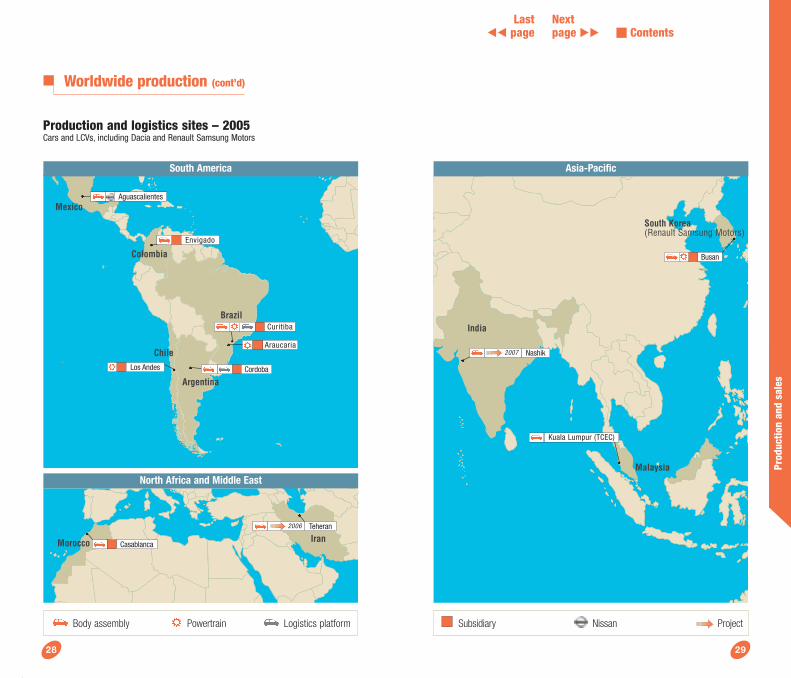
Production and logistics sites – 2005Cars and LCVs, including Dacia and Renault Samsung Motors
Worldwide production (cont’d)
Envigado
Brazil
Chile
Iran Morocco
Argentina
Aguascalientes
Curitiba
South America
North Africa and Middle East
Asia-Pacific
Casablanca
Teheran
South Korea (Renault Samsung Motors)
Malaysia
India
Kuala Lumpur (TCEC)
2006
Nashik2007
Los Andes
Busan
Subsidiary Nissan ProjectPowertrainBody assembly Logistics platform
Araucaria
Cordoba
Last�� page
Next page �� Contents
■■■■■■■■■■■■■■■■■■■■■■■■■■■■■■■■■■■■■■■■■■■■■■■■■■■■■■■■■■■■■■■■■■■■■■■■■■■■■■■■■■■■■■■■■■■■■■■■■■■■■■■■■■
■■■■■■■■■■■■■■■■■■■■■■■■■■■■■■■■■■■■■■■■■■■■■■■■■■■■■■■
■■■■■■■■■■■■■■■■■■■■■■■■■■■■■■■■■■■■■■■■■■■■■■■■■■■■■■■■■■■■■■■■■■■■■■■■■■■■■■■■■■■■■■■■■■■■■■■■■■■■■■■■■■
■■■■■■■■■■■■■■■■■■■■■■■■■■■■■■■■■■■■■■■■■■■■■■■■■■■■■■■■■■■■■■■■■■■■■■■■■■■■■■■■■■■■■■■■■■■■■■■■■■■■■■■■■■■■■■
Prod
uctio
n an
d sa
les
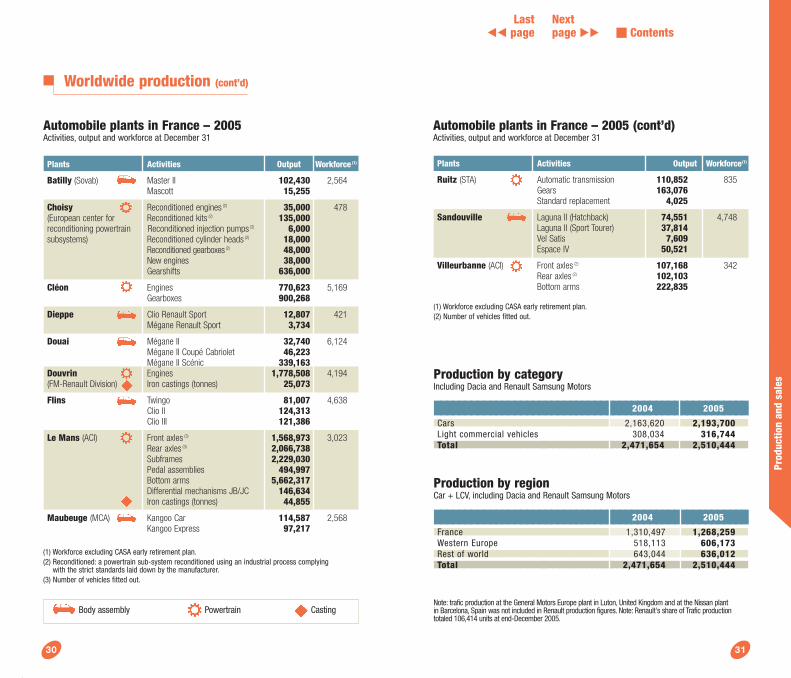
30 31
Plants Activities Output Workforce(1)
Ruitz (STA) Automatic transmission 110,852 835Gears 163,076Standard replacement 4,025
Sandouville Laguna II (Hatchback) 74,551 4,748Laguna II (Sport Tourer) 37,814Vel Satis 7,609Espace IV 50,521
Villeurbanne (ACI) Front axles (2) 107,168 342Rear axles (2) 102,103Bottom arms 222,835
Worldwide production (cont’d)
Body assembly Powertrain Casting
Automobile plants in France – 2005Activities, output and workforce at December 31
Plants Activities Output Workforce (1)
Batilly (Sovab) Master II 102,430 2,564 Mascott 15,255
Choisy Reconditioned engines (2) 35,000 478(European center for Reconditioned kits (2) 135,000reconditioning powertrain Reconditioned injection pumps (2) 6,000subsystems) Reconditioned cylinder heads (2) 18,000
Reconditioned gearboxes (2) 48,000New engines 38,000Gearshifts 636,000
Cléon Engines 770,623 5,169Gearboxes 900,268
Dieppe Clio Renault Sport 12,807 421Mégane Renault Sport 3,734
Douai Mégane II 32,740 6,124Mégane II Coupé Cabriolet 46,223Mégane II Scénic 339,163
Douvrin Engines 1,778,508 4,194(FM-Renault Division) Iron castings (tonnes) 25,073
Flins Twingo 81,007 4,638Clio II 124,313Clio III 121,386
Le Mans (ACI) Front axles (3) 1,568,973 3,023Rear axles (3) 2,066,738Subframes 2,229,030Pedal assemblies 494,997Bottom arms 5,662,317Differential mechanisms JB/JC 146,634Iron castings (tonnes) 44,855
Maubeuge (MCA) Kangoo Car 114,587 2,568Kangoo Express 97,217
Production by categoryIncluding Dacia and Renault Samsung Motors
2004 2005
Cars 2,163,620 2,193,700Light commercial vehicles 308,034 316,744Total 2,471,654 2,510,444
Production by regionCar + LCV, including Dacia and Renault Samsung Motors
2004 2005
France 1,310,497 1,268,259Western Europe 518,113 606,173Rest of world 643,044 636,012Total 2,471,654 2,510,444
Automobile plants in France – 2005 (cont’d)Activities, output and workforce at December 31
(1) Workforce excluding CASA early retirement plan.(2) Number of vehicles fitted out.
(1) Workforce excluding CASA early retirement plan.(2) Reconditioned: a powertrain sub-system reconditioned using an industrial process complying
with the strict standards laid down by the manufacturer.(3) Number of vehicles fitted out.
Note: trafic production at the General Motors Europe plant in Luton, United Kingdom and at the Nissan plant in Barcelona, Spain was not included in Renault production figures. Note: Renault's share of Trafic production totaled 106,414 units at end-December 2005.
Last�� page
Next page �� Contents
Prod
uctio
n an
d sa
les
32 33
Automobile plants in the European Union – 2005Activities, output and workforce at December 31
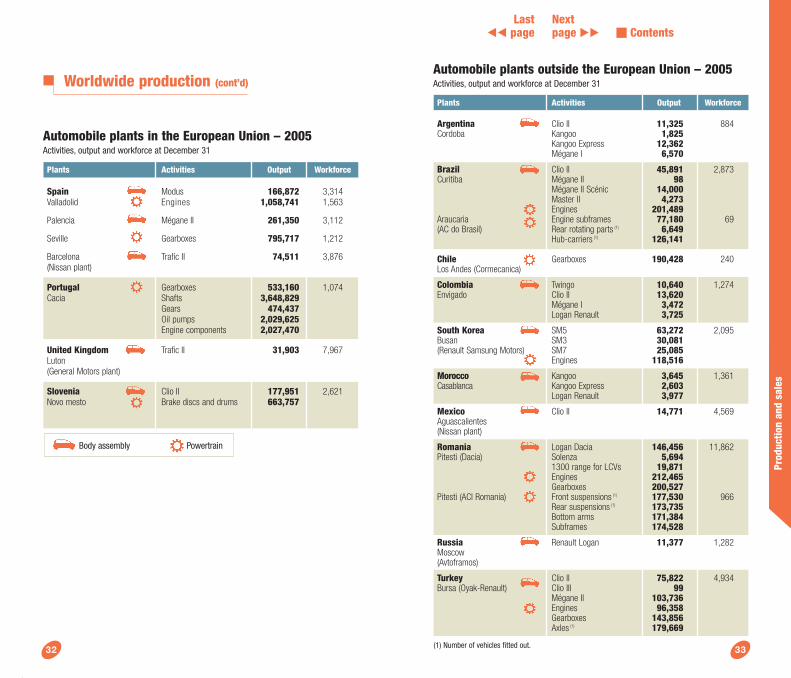
Worldwide production (cont’d)Automobile plants outside the European Union – 2005Activities, output and workforce at December 31
Plants Activities Output Workforce
Argentina Clio II 11,325 884Cordoba Kangoo 1,825
Kangoo Express 12,362Mégane I 6,570
Brazil Clio II 45,891 2,873Curitiba Mégane II 98
Mégane II Scénic 14,000Master II 4,273Engines 201,489
Araucaria Engine subframes 77,180 69(AC do Brasil) Rear rotating parts (1) 6,649
Hub-carriers (1) 126,141
Chile Gearboxes 190,428 240Los Andes (Cormecanica)
Colombia Twingo 10,640 1,274Envigado Clio II 13,620
Mégane I 3,472Logan Renault 3,725
South Korea SM5 63,272 2,095Busan SM3 30,081(Renault Samsung Motors) SM7 25,085
Engines 118,516
Morocco Kangoo 3,645 1,361Casablanca Kangoo Express 2,603
Logan Renault 3,977
Mexico Clio II 14,771 4,569Aguascalientes (Nissan plant)
Romania Logan Dacia 146,456 11,862Pitesti (Dacia) Solenza 5,694
1300 range for LCVs 19,871Engines 212,465Gearboxes 200,527
Pitesti (ACI Romania) Front suspensions (1) 177,530 966Rear suspensions (1) 173,735Bottom arms 171,384Subframes 174,528
Russia Renault Logan 11,377 1,282Moscow(Avtoframos)
Turkey Clio II 75,822 4,934Bursa (Oyak-Renault) Clio III 99
Mégane II 103,736Engines 96,358Gearboxes 143,856Axles (1) 179,669
(1) Number of vehicles fitted out.
Plants Activities Output Workforce
Spain Modus 166,872 3,314Valladolid Engines 1,058,741 1,563
Palencia Mégane II 261,350 3,112
Seville Gearboxes 795,717 1,212
Barcelona Trafic II 74,511 3,876(Nissan plant)
Portugal Gearboxes 533,160 1,074Cacia Shafts 3,648,829
Gears 474,437Oil pumps 2,029,625Engine components 2,027,470
United Kingdom Trafic II 31,903 7,967Luton(General Motors plant)
Slovenia Clio II 177,951 2,621Novo mesto Brake discs and drums 663,757
Body assembly Powertrain
Last�� page
Next page �� Contents
Prod
uctio
n an
d sa
les
34 35
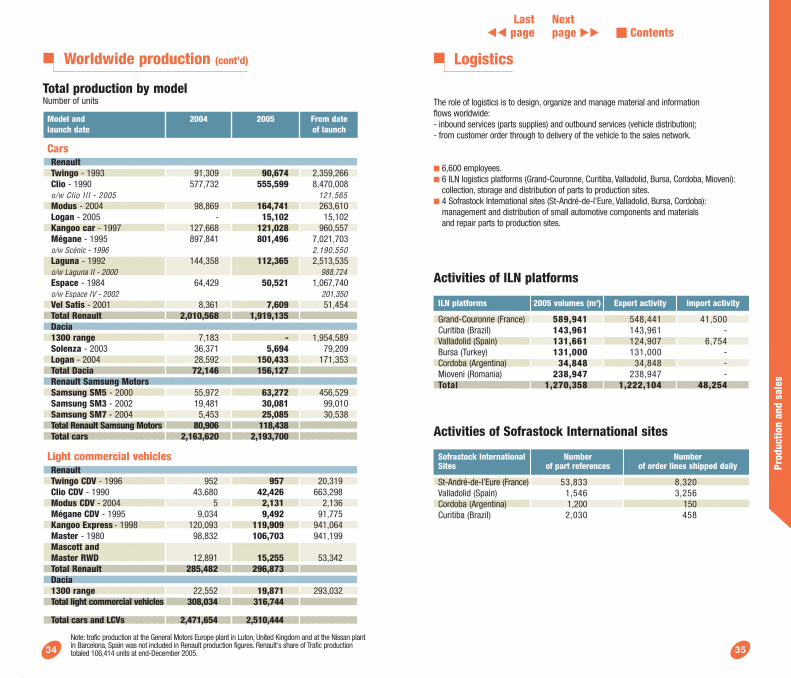
Logistics
The role of logistics is to design, organize and manage material and information flows worldwide:- inbound services (parts supplies) and outbound services (vehicle distribution);- from customer order through to delivery of the vehicle to the sales network.
■ 6,600 employees.■ 6 ILN logistics platforms (Grand-Couronne, Curitiba, Valladolid, Bursa, Cordoba, Mioveni):
collection, storage and distribution of parts to production sites.■ 4 Sofrastock International sites (St-André-de-l’Eure, Valladolid, Bursa, Cordoba):
management and distribution of small automotive components and materials and repair parts to production sites.
Activities of ILN platforms
■■■■■■■■■■■■■■■■■■■■■■■■■■■■■■■■■■■■■■■■■■■■■■■■■■■■■■
■■■■■■■■■■■■■■■■■■■■■■■■■■■■■■■■■■■■■■■■■■■■■■■■■■■■■■
■■■■■■■■■■■■■■■■■■■■■■■■■■■■■■■■■■■■■■■■■■■■■■■■■■■■■■
■■■■■■■■■■■■■■■■■■■■■■■■■■■■■■■■■■■■■■■■■■■■■■■■■■■■■■
ILN platforms 2005 volumes (m3) Export activity Import activity
Grand-Couronne (France) 589,941 548,441 41,500Curitiba (Brazil) 143,961 143,961 -Valladolid (Spain) 131,661 124,907 6,754 Bursa (Turkey) 131,000 131,000 - Cordoba (Argentina) 34,848 34,848 -Mioveni (Romania) 238,947 238,947 - Total 1,270,358 1,222,104 48,254
Activities of Sofrastock International sites
■■■■■■■■■■■■■■■■■■■■■■■■■■■■■■■■■■■■■■■■■■■■■■■■■■■■■■■■■
■■■■■■■■■■■■■■■■■■■■■■■■■■■■■■■■■■■■■■■■■■■■■■■■■■■■■■■■■
Sofrastock International Number Number Sites of part references of order lines shipped daily
St-André-de-l’Eure (France) 53,833 8,320Valladolid (Spain) 1,546 3,256Cordoba (Argentina) 1,200 150Curitiba (Brazil) 2,030 458
■■■■■■■■■■■■■■■■■■■■■■■■■■■■■■■■■■■■■■■■■■■■■■■■■■■■■■■■■■■■■■■■■■■■■■■■■■■■■■■■■■■■■■■■■■■■■■■■■■■■■■■■■■
■■■■■■■■■■■■■■■■■■■■■■■■■■■■■■■■■■■■■■■■■■■■■■■■■■■■■■■
■■■■■■■■■■■■■■■■■■■■■■■■■■■■■■■■■■■■■■■■■■■■■■■■■■■■■■■
■■■■■■■■■■■■■■■■■■■■■■■■■■■■■■■■■■■■■■■■■■■■■■■■■■■■■■■■■■■■■■■■■■■■■■■■■■■■■■■■■■■■■■■■■■■■■■■■■■■■■■■■■■■■■■
■■■■■■■■■■■■■■■■■■■■■■■■■■■■■■■■■■■■■■■■■■■■■■■■■■■■■■■■■■■■■■■■■■■■■■■■■■■■■■■■■■■■■■■■■■■■■■■■■■■■■■■■■■■■■■■■■■■■■■■■■■■■■■■■■■■■■■■■■■■■■■■■■■■■■■■■■■■■■ ■■■■■■■■■■■■■■■■■■■■■■■■■■■■■■■■■■■■■■■■■■■■■■■■■■■■■■■
■■■■■■■■■■■■■■■■■■■■■■■■■■■■■■■■■■■■■■■■■■■■■■■■■■■■■■■■■■■■■■■■■■■■■■■■■■■■■■■■■■■■■■■■■■■■■■■■■■■■■■■■■■■■■■■■■■■■■■■■■■■■■■■■■■■■■■■■■■■■■■■■■■■■■■■■■■■■■ ■■■■■■■■■■■■■■■■■■■■■■■■■■■■■■■■■■■■■■■■■■■■■■■■■■■■■■■
■■■■■■■■■■■■■■■■■■■■■■■■■■■■■■■■■■■■■■■■■■■■■■■■■■■■■■■■■■■■■■■■■■■■■■■■■■■■■■■■■■■■■■■■■■■■■■■■■■■■■■■■■■■■■■■■■■■■■■■■■■■■■■■■■■■■■■■■■■■■■■■■■■■■■■■■■■■■■
Total production by modelNumber of units
Worldwide production (cont’d)
Note: trafic production at the General Motors Europe plant in Luton, United Kingdom and at the Nissan plant in Barcelona, Spain was not included in Renault production figures. Renault's share of Trafic production totaled 106,414 units at end-December 2005.
■■■■■■■■■■■■■■■■■■■■■■■■■■■■■■■■■■■■■■■■■■■■■■■■■■■ ■■■■■■■■■■■■■■■■■■■■■■■■■■■■■■■■■■■■■■■■■■■■■■■■■■■■■■■■
■■■■■■■■■■■■■■■■■■■■■■■■■■■■■■■■■■■■■■■■■■■■■■■■■■■■■■■■
■■■■■■■■■■■■■■■■■■■■■■■■■■■■■■■■■■■■■■■■■■■■■■■■■■■■■■■■
■■■■■■■■■■■■■■■■■■■■■■■■■■■■■■■■■■■■■■■■■■■■■■■■■■■■■■■■■■■■■■■■■■■■■■■■■■■■■■■■■■■■■■■■■■■■■■■■■■■■■■■■■■■■■■■■■■■■■■■■■■■■■■■■■■■■■■■■■■■■■■■■■■■■■■■■■■■■■■■■■ ■■■■■■■■■■■■■■■■■■■■■■■■■■■■■■■■■■■■■■■■■■■■■■■■■■■ ■■■■■■■■■■■■■■■■■■■■■■■■■■■■■■■■■■■■■■■■■■■■■■■■■■■■■■■■■■■■■■■■■■■■■■■■■■■■■■■■■■■■■■■■■■■■■■■■■■■■■■■■■■■
■■■■■■■■■■■■■■■■■■■■■■■■■■■■■■■■■■■■■■■■■■■■■■■■■■■
Model and 2004 2005 From date launch date of launch
CarsRenaultTwingo - 1993 91,309 90,674 2,359,266Clio - 1990 577,732 555,599 8,470,008o/w Clio III - 2005 121,565Modus - 2004 98,869 164,741 263,610Logan - 2005 - 15,102 15,102Kangoo car - 1997 127,668 121,028 960,557Mégane - 1995 897,841 801,496 7,021,703o/w Scénic - 1996 2,190,550Laguna - 1992 144,358 112,365 2,513,535o/w Laguna II - 2000 988,724Espace - 1984 64,429 50,521 1,067,740o/w Espace IV - 2002 201,350Vel Satis - 2001 8,361 7,609 51,454Total Renault 2,010,568 1,919,135Dacia1300 range 7,183 - 1,954,589Solenza - 2003 36,371 5,694 79,209Logan - 2004 28,592 150,433 171,353Total Dacia 72,146 156,127Renault Samsung MotorsSamsung SM5 - 2000 55,972 63,272 456,529Samsung SM3 - 2002 19,481 30,081 99,010Samsung SM7 - 2004 5,453 25,085 30,538Total Renault Samsung Motors 80,906 118,438Total cars 2,163,620 2,193,700
Light commercial vehiclesRenaultTwingo CDV - 1996 952 957 20,319Clio CDV - 1990 43,680 42,426 663,298Modus CDV - 2004 5 2,131 2,136Mégane CDV - 1995 9,034 9,492 91,775Kangoo Express - 1998 120,093 119,909 941,064Master - 1980 98,832 106,703 941,199Mascott andMaster RWD 12,891 15,255 53,342Total Renault 285,482 296,873Dacia1300 range 22,552 19,871 293,032Total light commercial vehicles 308,034 316,744
Total cars and LCVs 2,471,654 2,510,444
Last�� page
Next page �� Contents
Prod
uctio
n an
d sa
les
3736
Worldwide sales
■■■■■■■■■■■■■■■■■■■■■■■■■■■■■■■■■■■■■■■■■■■■■■■■■■■■■■■■■■■■■■■■■■■■■■■■■■■■■■■■■■■■■■■■■■■■■■■■■■■■■■■■■■■■■■■■■■■■■■■■■■■■■■■■■■■■■■■■■■■■■■■■■■■■■■■■■■■■■
■■■■■■■■■■■■■■■■■■■■■■■■■■■■■■■■■■■■■■■■■■■■■■■■■■■■■■■
■■■■■■■■■■■■■■■■■■■■■■■■■■■■■■■■■■■■■■■■■■■■■■■■■■■■■■■
■■■■■■■■■■■■■■■■■■■■■■■■■■■■■■■■■■■■■■■■■■■■■■■■■■■■■■■■■■■■■■■■■■■■■■■■■■■■■■■■■■■■■■■■■■■■■■■■■■■■■■■■■■■■■
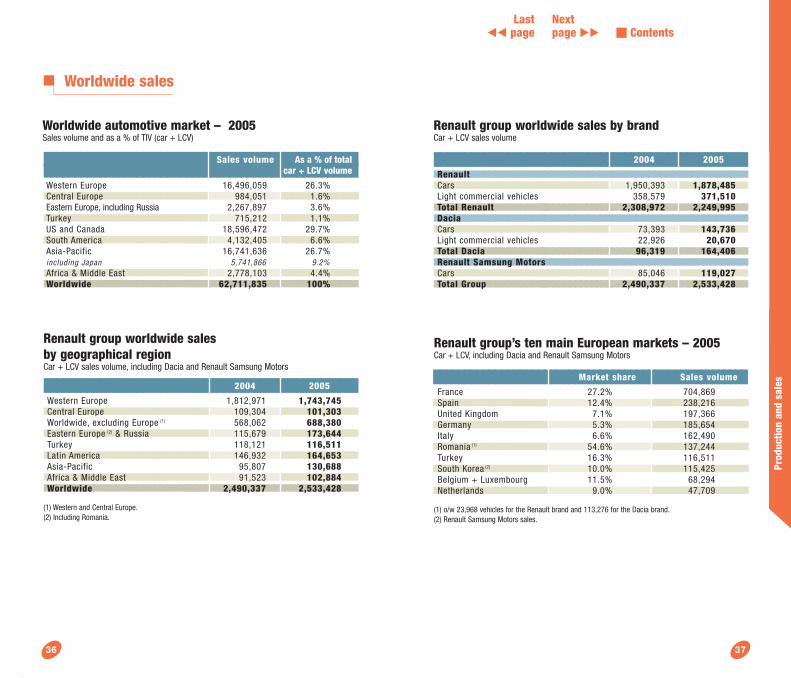
Worldwide automotive market – 2005Sales volume and as a % of TIV (car + LCV)
Sales volume As a % of totalcar + LCV volume
Western Europe 16,496,059 26.3%Central Europe 984,051 1.6%Eastern Europe, including Russia 2,267,897 3.6%Turkey 715,212 1.1%US and Canada 18,596,472 29.7%South America 4,132,405 6.6%Asia-Pacific 16,741,636 26.7%including Japan 5,741,866 9.2%Africa & Middle East 2,778,103 4.4%Worldwide 62,711,835 100%
■■■■■■■■■■■■■■■■■■■■■■■■■■■■■■■■■■■■■■■■■■■■■■■■■■■■■■■■■■■■■■■■■■■■■■■■■■■■■■■■■■■■■■■■■■■■■■■■■■■■■■■■■■■■■
■■■■■■■■■■■■■■■■■■■■■■■■■■■■■■■■■■■■■■■■■■■■■■■■■■■■■■■■■■
■■■■■■■■■■■■■■■■■■■■■■■■■■■■■■■■■■■■■■■■■■■■■■■■■■■■■■■■■■
■■■■■■■■■■■■■■■■■■■■■■■■■■■■■■■■■■■■■■■■■■■■■■■■■■■■■■■■■■■■■■■■■■■■■■■■■■■■■■■■■■■■■■■■■■■■■■■■■■■■■■■■■■■■■■■■
Renault group worldwide sales by geographical regionCar + LCV sales volume, including Dacia and Renault Samsung Motors
2004 2005
Western Europe 1,812,971 1,743,745Central Europe 109,304 101,303Worldwide, excluding Europe (1) 568,062 688,380Eastern Europe (2) & Russia 115,679 173,644Turkey 118,121 116,511Latin America 146,932 164,653Asia-Pacific 95,807 130,688Africa & Middle East 91,523 102,884Worldwide 2,490,337 2,533,428
(1) Western and Central Europe.(2) Including Romania.
■■■■■■■■■■■■■■■■■■■■■■■■■■■■■■■■■■■■■■■■■■■■■■■■■■■■■■■■■■■■■■■■■■■■■■■■■■■■■■■■■■■■■■■■■■■■■■■■■■■■■■■■■■■■■■■■■■■■■■■■■■■■■■■■■■■■■■■■■■■■■■■■■■■■■■■■■■■■■
■■■■■■■■■■■■■■■■■■■■■■■■■■■■■■■■■■■■■■■■■■■■■■■■■■■■■■■■■■■■■■■■■■■■■■■■■■■■■■■■■■■■■■■■■■■■■■■■■■■■■■■■■■■■■■■■■■■■■■■■■■■■■■■■■■■■■■■■■■■■■■■■■■■■■■■■■■■■■■■■
■■■■■■■■■■■■■■■■■■■■■■■■■■■■■■■■■■■■■■■■■■■■■■■■■■■■■■■■■■■■■■■■■■■■■■■■■■■■■■■■■■■■■■■■■■■■■■■■■■■■■■■■■■■■■■■■■■■■■■■■■■■■■■■■■■■■■■■■■■■■■■■■■■■■■■■■■■■■■■■■■■■■■■■■■■■■■■■■■■■■■■■■■■■■■■■■■■■■■■■■■■■■■■■■■■■■■■
Renault group worldwide sales by brand Car + LCV sales volume
2004 2005
RenaultCars 1,950,393 1,878,485Light commercial vehicles 358,579 371,510Total Renault 2,308,972 2,249,995DaciaCars 73,393 143,736Light commercial vehicles 22,926 20,670Total Dacia 96,319 164,406Renault Samsung Motors Cars 85,046 119,027Total Group 2,490,337 2,533,428
■■■■■■■■■■■■■■■■■■■■■■■■■■■■■■■■■■■■■■■■■■■■■■■■■■■■■■■■■■■■■■■■■■■■■■■■■■■■■■■■■■■■■■■■■■■■■■■■■■■■■■■■■
■■■■■■■■■■■■■■■■■■■■■■■■■■■■■■■■■■■■■■■■■■■■■■■■■■■■■■
■■■■■■■■■■■■■■■■■■■■■■■■■■■■■■■■■■■■■■■■■■■■■■■■■■■■■■
■■■■■■■■■■■■■■■■■■■■■■■■■■■■■■■■■■■■■■■■■■■■■■■■■■■■■■
■■■■■■■■■■■■■■■■■■■■■■■■■■■■■■■■■■■■■■■■■■■■■■■■■■■■■■
Renault group’s ten main European markets – 2005Car + LCV, including Dacia and Renault Samsung Motors
Market share Sales volume
France 27.2% 704,869Spain 12.4% 238,216United Kingdom 7.1% 197,366Germany 5.3% 185,654Italy 6.6% 162,490Romania (1) 54.6% 137,244Turkey 16.3% 116,511South Korea (2) 10.0% 115,425Belgium + Luxembourg 11.5% 68,294Netherlands 9.0% 47,709
(1) o/w 23,968 vehicles for the Renault brand and 113,276 for the Dacia brand.(2) Renault Samsung Motors sales.
Last�� page
Next page �� Contents
■■■■■■■■■■■■■■■■■■■■■■■■■■■■■■■■■■■■■■■■■■■■■■■■■■■■■■■■■■■■■■■■■■■■■■■■■■■■■■■■■■■■■■■■■■■■■■■■■■■■■■■■■■■■■■■■■■■■■■■■■■■■■■■■■■■■■■■■■■■■■■■■■■■■■■■■■■■■
■■■■■■■■■■■■■■■■■■■■■■■■■■■■■■■■■■■■■■■■■■■■■■■■■■■■■■
■■■■■■■■■■■■■■■■■■■■■■■■■■■■■■■■■■■■■■■■■■■■■■■■■■■■■■
■■■■■■■■■■■■■■■■■■■■■■■■■■■■■■■■■■■■■■■■■■■■■■■■■■■■■■
■■■■■■■■■■■■■■■■■■■■■■■■■■■■■■■■■■■■■■■■■■■■■■■■■■■■■■ ■■■■■■■■■■■■■■■■■■■■■■■■■■■■■■■■■■■■■■■■■■■■■■■■■■■■■■■■■■■■■■■■■■■■■■■■■■■■■■■■■■■■■■■■■■■■■■■■■■■■■■■■■■■■ ■■■■■■■■■■■■■■■■■■■■■■■■■■■■■■■■■■■■■■■■■■■■■■■■■■■■■■■■■■■■■■■■■■■■■■■■■■■■■■■■■■■■■■■■■■■■■■■■■■■■■■■■■■■■■■■■■■■■■■■■■■■■■■■■■■■■■■■■■■■■■■■■■■■■■■■■■■■■■■■
■■■■■■■■■■■■■■■■■■■■■■■■■■■■■■■■■■■■■■■■■■■■■■■■■■■■■■■■■■■■■■■■■■■■■■■■■■■■■■■■■■■■■■■■■■■■■■■■■■■■■■■■■■■■■■■■■■■■■■■■■■■■■■■■■■■■■■■■■■■■■■■■■■■■■■■■■■■■■■■■■■■■■■■■■■■■■■■■■■■■■■■■■■■■■■■■■■■■■■■■■■■■■■■■■■■■■
■■■■■■■■■■■■■■■■■■■■■■■■■■■■■■■■■■■■■■■■■■■■■■■■■■■■■■ ■■■■■■■■■■■■■■■■■■■■■■■■■■■■■■■■■■■■■■■■■■■■■■■■■■■■■■
■■■■■■■■■■■■■■■■■■■■■■■■■■■■■■■■■■■■■■■■■■■■■■■■■■■■■■
Prod
uctio
n an
d sa
les
38 39
■■■■■■■■■■■■■■■■■■■■■■■■■■■■■■■■■■■■■■■■■■■■■■■■■■■■■■■■■■■■■■■■■■■■■■■■■■■■■■■■■■■■■■■■■■■■■■■■■■■■■■■■■■■■■■■■■■■■■■■■■■■■■■■■■■■■■■■■■■■■■■■■■■■■■■■■■■■■
■■■■■■■■■■■■■■■■■■■■■■■■■■■■■■■■■■■■■■■■■■■■■■■■■■■■■■
■■■■■■■■■■■■■■■■■■■■■■■■■■■■■■■■■■■■■■■■■■■■■■■■■■■■■■
■■■■■■■■■■■■■■■■■■■■■■■■■■■■■■■■■■■■■■■■■■■■■■■■■■■■■■
■■■■■■■■■■■■■■■■■■■■■■■■■■■■■■■■■■■■■■■■■■■■■■■■■■■■■■■■■■■■■■■■■■■■■■■■■■■■■■■■■■■■■■■■■■■■■■■■■■■■■■■■■■■■■■■■■■■■■■■■■■■■■■■■■■■■■■■■■■■■■■■■■■■■■■■■■■■■■■■■■■■■■■■■■■■■■■■■■■■■■■■■■■■■■■■■■■■■■■■■■■■■■■■■■■■■■■■■■■■■■■■■■■■■■■■■■■■■■■■■■■■■■■■■■■■■■■■■■■■■■■■■■■■
■■■■■■■■■■■■■■■■■■■■■■■■■■■■■■■■■■■■■■■■■■■■■■■■■■■■■■
■■■■■■■■■■■■■■■■■■■■■■■■■■■■■■■■■■■■■■■■■■■■■■■■■■■■■■
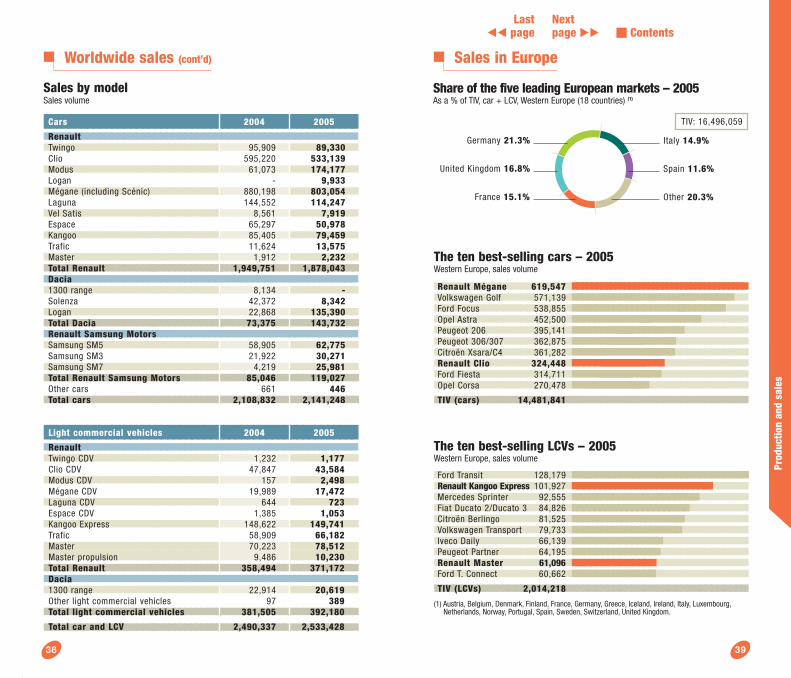
Light commercial vehicles 2004 2005
RenaultTwingo CDV 1,232 1,177Clio CDV 47,847 43,584Modus CDV 157 2,498Mégane CDV 19,989 17,472Laguna CDV 644 723Espace CDV 1,385 1,053Kangoo Express 148,622 149,741Trafic 58,909 66,182Master 70,223 78,512Master propulsion 9,486 10,230Total Renault 358,494 371,172Dacia1300 range 22,914 20,619Other light commercial vehicles 97 389Total light commercial vehicles 381,505 392,180
Total car and LCV 2,490,337 2,533,428
Cars 2004 2005
RenaultTwingo 95,909 89,330Clio 595,220 533,139Modus 61,073 174,177Logan - 9,933Mégane (including Scénic) 880,198 803,054Laguna 144,552 114,247Vel Satis 8,561 7,919Espace 65,297 50,978Kangoo 85,405 79,459Trafic 11,624 13,575Master 1,912 2,232Total Renault 1,949,751 1,878,043Dacia1300 range 8,134 -Solenza 42,372 8,342Logan 22,868 135,390Total Dacia 73,375 143,732Renault Samsung MotorsSamsung SM5 58,905 62,775Samsung SM3 21,922 30,271Samsung SM7 4,219 25,981Total Renault Samsung Motors 85,046 119,027Other cars 661 446Total cars 2,108,832 2,141,248
Sales by modelSales volume
■■■■■■■■■■■■■■■■■■■■■■■■■■■■■■■■■■■■■■■■■■■■■■■■■■■■■■■■■■■■■■■■■■■■■■■■■■■■■■■■■■■■■■■■■■■■■■■■■■■■■■■■■■■■■■■■■■■■■■■■■■■■■■■■■■■■■■■■■■■■■■■■■■■■■■■■■■■■■■■■■■■■■■■■■■■■■■■■■■■■■■■■■■■■■■■■■■■■■■■■■■■■■■■■■■■■■■■■■■■■■■■■■■■■■■■■■■■■■■■■■■■■■■■■■■■■■■■■■■■■■■■■■■■■■■■■■■■■■■■■■■■■■■■■■■■■■■■■■■■■■■■■■■■■■■■■■■■■■■■■■■■■■■■■■■■■■■■■■■■■■■■■■■■■■■■■■■■■■■■■■■■■■■■■■■■■■■■■■■■■■■■■■■■■■■■■■■■■■■■■■■■■■■■■■■■■■■■■■■■■■■■■■■■■■■■■■■■■■■■■■■■■■■■■■■■■■■■■■■■■■■■■■■■■■■■■■■■■■■■■■■■■■■■■■■■■■■■■■■■■■■■■■■■■■■
■■■■■■■■■■■■■■■■■■■■■■■■■■■■■■■■■■■■■■■■■■■■■■■■■■■
Sales in Europe
■■■■■■■■■■■■■■■■■■■■■■■■■■■■■■■■■■■■■■■■■■■■■■■■■■■■■■■■■■■■■■■■■■■■■■■■■■■■■■■■■■■■■■■■■■■■■■■■■■■■■■■■■■■■■■■■■■■■■■■■■■■■■■■■■■■■■■■■■■■■■■■■■■■■■■■■■■■■■■■■■■■■■■■■■■■■■■■■■■■■■■■■■■■■■■■■■■■■■■■■■■■■■■■■■■■■■■■■■■■■■■■■■■■■■■■■■■■■■■■■■■■■■■■■■■■■■■■■■■■■■■■■■■■■■■■■■■■■■■■■■■■■■■■■■■■■■■■■■■■■■■■■■■■■■■■■■■■■■■■■■■■■■■■■■■■■■■■■■■■■■■■■■■■■■■■■■■■■■■■■■■■■■■■■■■■■■■■■■■■■■■■■■■■■■■■■■■■■■■■■■■■■■■■■■■■■■■■■■■■■■■■■■■■■■■■■■■■■■■■■■■■■■■■■■■■■■■■■■■■■■■■■■■■■■■■■■■■■■■■■■■■■■■■■■■■■■■■■■■■■■■■■■■■■■■
■■■■■■■■■■■■■■■■■■■■■■■■■■■■■■■■■■■■■■■■■■■■■■■■■■■
The ten best-selling cars – 2005Western Europe, sales volume
Renault Mégane 619,547Volkswagen Golf 571,139Ford Focus 538,855Opel Astra 452,500Peugeot 206 395,141Peugeot 306/307 362,875Citroën Xsara/C4 361,282Renault Clio 324,448Ford Fiesta 314,711Opel Corsa 270,478
TIV (cars) 14,481,841
The ten best-selling LCVs – 2005Western Europe, sales volume
Ford Transit 128,179Renault Kangoo Express 101,927Mercedes Sprinter 92,555Fiat Ducato 2/Ducato 3 84,826Citroën Berlingo 81,525Volkswagen Transport 79,733Iveco Daily 66,139Peugeot Partner 64,195Renault Master 61,096Ford T. Connect 60,662
TIV (LCVs) 2,014,218
(1) Austria, Belgium, Denmark, Finland, France, Germany, Greece, Iceland, Ireland, Italy, Luxembourg,Netherlands, Norway, Portugal, Spain, Sweden, Switzerland, United Kingdom.
■■■■■■■■■■■■■■■■■■■■■■■■■■■■■■■■■■■■■■■■■■■■■■■■■■■■■■■■■■■■■■■ ■■■■■■■■■■■■■■■■■■■■■■■■■■■■■■■■■■■■■■■■■■■■■■■■■■■■■■■■■■■■■■■■■■■■■■■■■■■■■■■■■■■■■■■■■■■■■■■■■■■■■■■■■■■■■■■■■■■■■■■■■■■■■■■■■■■■■■■■■■■■■■■■■■■■■■■■■■■■■■■■■■■■■■■■■■■■■■■■■■■■■■■■■■■■■■■■■■■■■■■■■■■■■■■
■■■■■■■■■■■■■■■■■■■■■■■■■■■■■■■■■■■■■■■■■■■■■■■■■■■■■■■■■■■■■■■■■■■■■■■■■■■■■■■■■■■■■■■■■■■■■■■■■■■■■■■■■■■■■■■■■■■■■■■■■■■■■■■■■■■■■■■■■■■■■■■■■■■■■■■■■■■■■■■■■■■■■■■■■■■■■■■■■■■■■■■■■■■■■■■■■■■■■■■■■■■■■■■■■■
Share of the five leading European markets – 2005As a % of TIV, car + LCV, Western Europe (18 countries) (1)
TIV: 16,496,059
Italy 14.9%
Other 20.3%
Spain 11.6%
France 15.1%
Germany 21.3%
United Kingdom 16.8%
Worldwide sales (cont’d)
Last�� page
Next page �� Contents
Prod
uctio
n an
d sa
les
4140
■■■■■■■■■■■■■■■■■■■■■■■■■■■■■■■■■■■■■■■■■■■■■■■■■■■■■■■■■■■■■■■■■■■■■■■■■■■■■■■■■■■■■■■■■■■■■■■■■■■■■■■■■■■■■■■■■■■■■■■■■■■■■■■■■■■■■■■■■■■■■■■■■■■■■■■■■■■■■
■■■■■■■■■■■■■■■■■■■■■■■■■■■■■■■■■■■■■■■■■■■■■■■■■■■■■■■
Sales in Europe (cont’d)
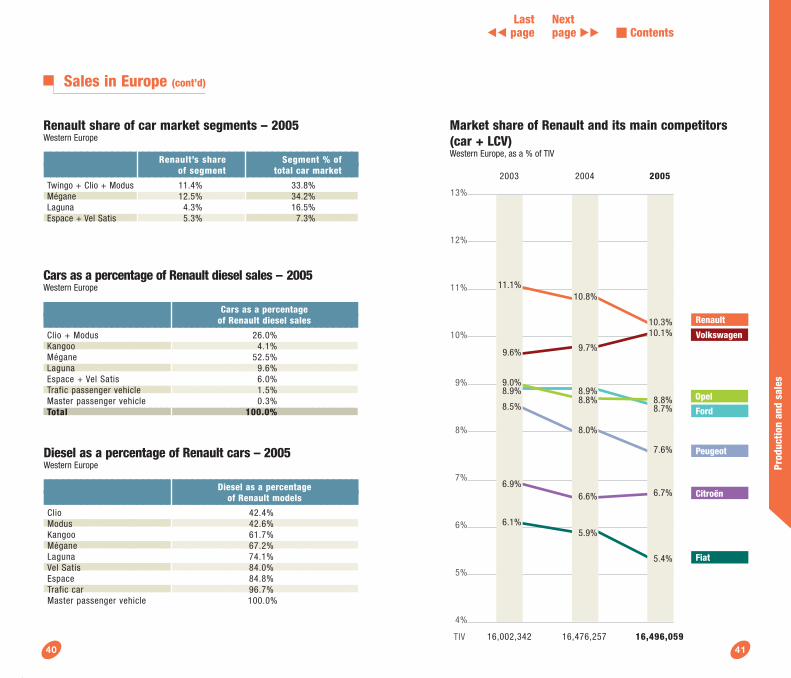
Renault share of car market segments – 2005Western Europe
Renault’s share Segment % of of segment total car market
Twingo + Clio + Modus 11.4% 33.8%Mégane 12.5% 34.2%Laguna 4.3% 16.5%Espace + Vel Satis 5.3% 7.3%
■■■■■■■■■■■■■■■■■■■■■■■■■■■■■■■■■■■■■■■■■■■■■■■■■■■■■■■■■■■■■■■■■■■■■■■■■■■■■■■■■■■■■■■■■■■■■■■■■■■■■■■■■■■■■■■■■■■■■■■■■■■■■■■■■■■■■■■■■■■■■■■■■■■■■■■■■■■■■
■■■■■■■■■■■■■■■■■■■■■■■■■■■■■■■■■■■■■■■■■■■■■■■■■■■■■■■
■■■■■■■■■■■■■■■■■■■■■■■■■■■■■■■■■■■■■■■■■■■■■■■■■■■■■■■
■■■■■■■■■■■■■■■■■■■■■■■■■■■■■■■■■■■■■■■■■■■■■■■■■■■■■■■
13%
12%
11%
10%
9%
8%
7%
6%
5%
4%
Market share of Renault and its main competitors (car + LCV)Western Europe, as a % of TIV
Citroën
Peugeot
11.1%
9.6%
9.0%8.9%
8.5%
6.9%
6.1%
10.8%
9.7%
8.9%8.8%
8.0%
6.6%
5.9%
10.3%10.1%
8.8%8.7%
7.6%
6.7%
5.4%
Renault
Ford
Volkswagen
Opel
2003 2004 2005
TIV 16,002,342 16,476,257 16,496,059
Fiat
■■■■■■■■■■■■■■■■■■■■■■■■■■■■■■■■■■■■■■■■■■■■■■■■■■■■■■■■■■■■■■■■■■■■■■■■■■■■■■■■■■■■■■■■■■■■■■■■■■■■■■■■■■■■■■■■■■■■■■■■■■■■■■■■■■■■■■■■■■■■■■■■■■■■■■■■■■■■■
■■■■■■■■■■■■■■■■■■■■■■■■■■■■■■■■■■■■■■■■■■■■■■■■■■■■■■■
■■■■■■■■■■■■■■■■■■■■■■■■■■■■■■■■■■■■■■■■■■■■■■■■■■■■■■■
■■■■■■■■■■■■■■■■■■■■■■■■■■■■■■■■■■■■■■■■■■■■■■■■■■■■■■■
Cars as a percentage of Renault diesel sales – 2005Western Europe
Cars as a percentage of Renault diesel sales
Clio + Modus 26.0%Kangoo 4.1%Mégane 52.5%Laguna 9.6%Espace + Vel Satis 6.0%Trafic passenger vehicle 1.5%Master passenger vehicle 0.3%Total 100.0%
Diesel as a percentage of Renault cars – 2005Western Europe
Diesel as a percentage of Renault models
Clio 42.4%Modus 42.6%Kangoo 61.7%Mégane 67.2%Laguna 74.1%Vel Satis 84.0%Espace 84.8%Trafic car 96.7%Master passenger vehicle 100.0%
Last�� page
Next page �� Contents
Prod
uctio
n an
d sa
les
4342
Sales in Europe (cont’d)
13%
12%
11%
10%
9%
8%
7%
6%
5%
4%
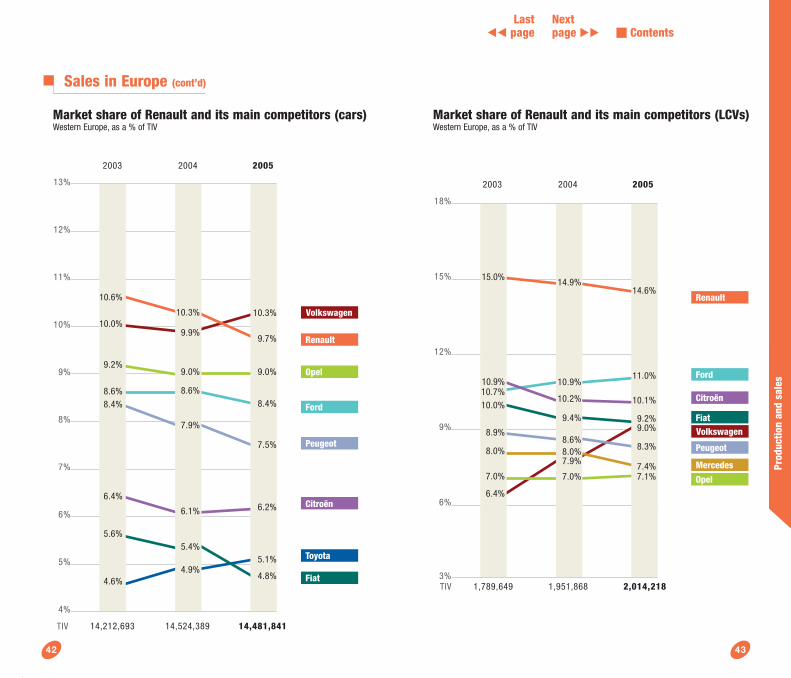
Market share of Renault and its main competitors (cars)Western Europe, as a % of TIV
Citroën
Peugeot
10.6%
10.0%
9.2%
8.6%8.4%
6.4%
5.6%
4.6%
10.3%
9.9%
9.0%
8.6%
7.9%
6.1%
5.4%
4.9%
10.3%
9.7%
9.0%
8.4%
7.5%
6.2%
5.1%
4.8%
Renault
Toyota
Ford
Volkswagen
Opel
2003 2004 2005
TIV 14,212,693 14,524,389 14,481,841
Fiat
Market share of Renault and its main competitors (LCVs)Western Europe, as a % of TIV
Fiat
Peugeot
Mercedes
Renault
Citroën
Ford
Volkswagen
Opel
2003 2004 2005
15.0%
10.9%10.7%10.0%
8.9%
8.0%
7.0%
6.4%
14.9%
10.9%
10.2%
9.4%
8.6%8.0%7.9%
7.0%
14.6%
11.0%
10.1%
9.2%9.0%
8.3%
7.4%7.1%
1,789,649 1,951,868 2,014,218
18%
15%
12%
9%
6%
3%TIV
Last�� page
Next page �� Contents
■■■■■■■■■■■■■■■■■■■■■■■■■■■■■■■■■■■■■■■■■■■■■■■■■■■
■■■■■■■■■■■■■■■■■■■■■■■■■■■■■■■■■■■■■■■■■■■■■■■■■■■■■■
■■■■■■■■■■■■■■■■■■■■■■■■■■■■■■■■■■■■■■■■■■■■■■■■■■■■■■
Prod
uctio
n an
d sa
les
45
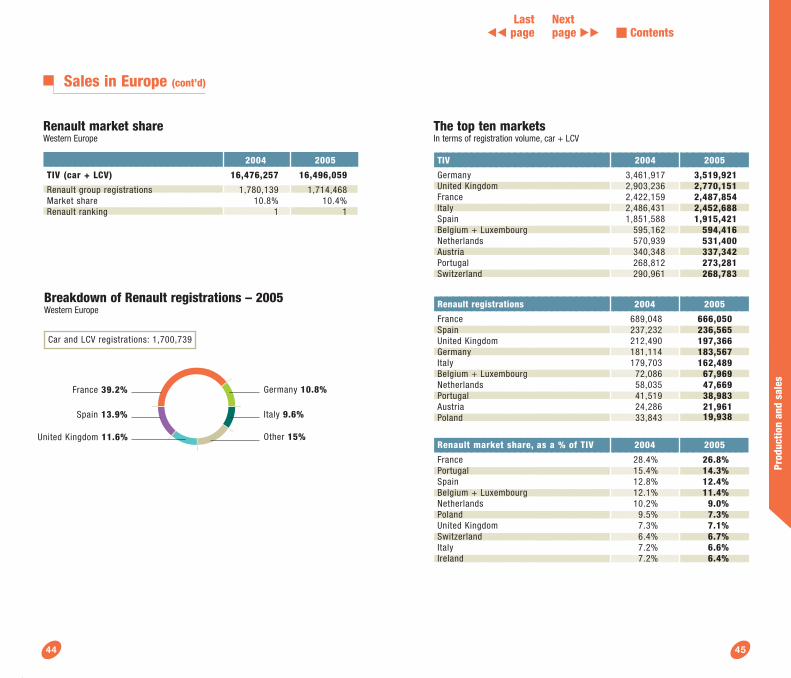
Renault market shareWestern Europe
2004 2005
TIV (car + LCV) 16,476,257 16,496,059
Renault group registrations 1,780,139 1,714,468Market share 10.8% 10.4%Renault ranking 1 1
44
Breakdown of Renault registrations – 2005Western Europe
Other 15%
Germany 10.8%
Italy 9.6%
France 39.2%
Spain 13.9%
United Kingdom 11.6%
Car and LCV registrations: 1,700,739
Sales in Europe (cont’d)
■■■■■■■■■■■■■■■■■■■■■■■■■■■■■■■■■■■■■■■■■■■■■■■■■■■■■■■■■■■■■■■■■■■■■■■■■■■■■■■■■■■■■■■■■■■■■■■■■■■■■■■■■
■■■■■■■■■■■■■■■■■■■■■■■■■■■■■■■■■■■■■■■■■■■■■■■■■■■■■■
■■■■■■■■■■■■■■■■■■■■■■■■■■■■■■■■■■■■■■■■■■■■■■■■■■■■■■
■■■■■■■■■■■■■■■■■■■■■■■■■■■■■■■■■■■■■■■■■■■■■■■■■■■■■■
■■■■■■■■■■■■■■■■■■■■■■■■■■■■■■■■■■■■■■■■■■■■■■■■■■■■■■
The top ten marketsIn terms of registration volume, car + LCV
TIV 2004 2005
Germany 3,461,917 3,519,921United Kingdom 2,903,236 2,770,151France 2,422,159 2,487,854Italy 2,486,431 2,452,688Spain 1,851,588 1,915,421Belgium + Luxembourg 595,162 594,416Netherlands 570,939 531,400Austria 340,348 337,342Portugal 268,812 273,281Switzerland 290,961 268,783
Renault registrations 2004 2005
France 689,048 666,050Spain 237,232 236,565United Kingdom 212,490 197,366Germany 181,114 183,567Italy 179,703 162,489Belgium + Luxembourg 72,086 67,969Netherlands 58,035 47,669Portugal 41,519 38,983Austria 24,286 21,961Poland 33,843 19,938
Renault market share, as a % of TIV 2004 2005
France 28.4% 26.8%Portugal 15.4% 14.3%Spain 12.8% 12.4%Belgium + Luxembourg 12.1% 11.4%Netherlands 10.2% 9.0%Poland 9.5% 7.3%United Kingdom 7.3% 7.1%Switzerland 6.4% 6.7%Italy 7.2% 6.6%Ireland 7.2% 6.4%
Last�� page
Next page �� Contents
■■■■■■■■■■■■■■■■■■■■■■■■■■■■■■■■■■■■■■■■■■■■■■■■■■■■■■■■■■■■■■■■■■■■■■■■■■■■■■■■■■■■■■■■■■■■■■■■■■■■■■■■■
■■■■■■■■■■■■■■■■■■■■■■■■■■■■■■■■■■■■■■■■■■■■■■■■■■■■■■
Prod
uctio
n an
d sa
les
47
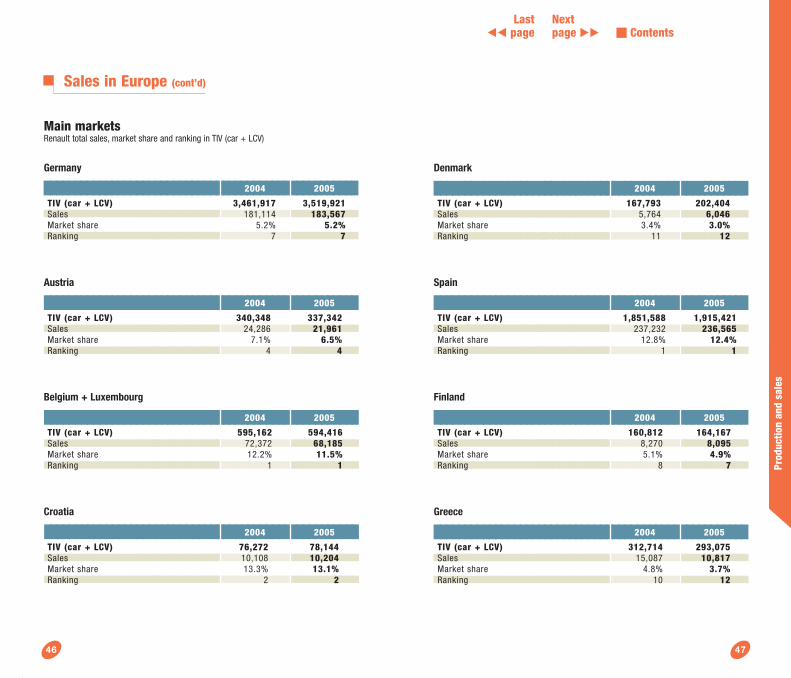
Main marketsRenault total sales, market share and ranking in TIV (car + LCV)
Germany
2004 2005
TIV (car + LCV) 3,461,917 3,519,921Sales 181,114 183,567Market share 5.2% 5.2%Ranking 7 7
■■■■■■■■■■■■■■■■■■■■■■■■■■■■■■■■■■■■■■■■■■■■■■■■■■■■■■■■■■■■■■■■■■■■■■■■■■■■■■■■■■■■■■■■■■■■■■■■■■■■■■■■■
■■■■■■■■■■■■■■■■■■■■■■■■■■■■■■■■■■■■■■■■■■■■■■■■■■■■■■
■■■■■■■■■■■■■■■■■■■■■■■■■■■■■■■■■■■■■■■■■■■■■■■■■■■■■■■■■■■■■■■■■■■■■■■■■■■■■■■■■■■■■■■■■■■■■■■■■■■■■■■■■
■■■■■■■■■■■■■■■■■■■■■■■■■■■■■■■■■■■■■■■■■■■■■■■■■■■■■■
■■■■■■■■■■■■■■■■■■■■■■■■■■■■■■■■■■■■■■■■■■■■■■■■■■■■■■■■■■■■■■■■■■■■■■■■■■■■■■■■■■■■■■■■■■■■■■■■■■■■■■■■■
■■■■■■■■■■■■■■■■■■■■■■■■■■■■■■■■■■■■■■■■■■■■■■■■■■■■■■
Austria
2004 2005
TIV (car + LCV) 340,348 337,342Sales 24,286 21,961Market share 7.1% 6.5%Ranking 4 4
Belgium + Luxembourg
2004 2005
TIV (car + LCV) 595,162 594,416Sales 72,372 68,185Market share 12.2% 11.5%Ranking 1 1
Croatia
2004 2005
TIV (car + LCV) 76,272 78,144Sales 10,108 10,204Market share 13.3% 13.1%Ranking 2 2
46
Sales in Europe (cont’d)
■■■■■■■■■■■■■■■■■■■■■■■■■■■■■■■■■■■■■■■■■■■■■■■■■■■■■■■■■■■■■■■■■■■■■■■■■■■■■■■■■■■■■■■■■■■■■■■■■■■■■■■■■
■■■■■■■■■■■■■■■■■■■■■■■■■■■■■■■■■■■■■■■■■■■■■■■■■■■■■■
■■■■■■■■■■■■■■■■■■■■■■■■■■■■■■■■■■■■■■■■■■■■■■■■■■■■■■■■■■■■■■■■■■■■■■■■■■■■■■■■■■■■■■■■■■■■■■■■■■■■■■■■■
■■■■■■■■■■■■■■■■■■■■■■■■■■■■■■■■■■■■■■■■■■■■■■■■■■■■■■
■■■■■■■■■■■■■■■■■■■■■■■■■■■■■■■■■■■■■■■■■■■■■■■■■■■■■■■■■■■■■■■■■■■■■■■■■■■■■■■■■■■■■■■■■■■■■■■■■■■■■■■■■
■■■■■■■■■■■■■■■■■■■■■■■■■■■■■■■■■■■■■■■■■■■■■■■■■■■■■■
■■■■■■■■■■■■■■■■■■■■■■■■■■■■■■■■■■■■■■■■■■■■■■■■■■■■■■■■■■■■■■■■■■■■■■■■■■■■■■■■■■■■■■■■■■■■■■■■■■■■■■■■■
■■■■■■■■■■■■■■■■■■■■■■■■■■■■■■■■■■■■■■■■■■■■■■■■■■■■■■
Denmark
2004 2005
TIV (car + LCV) 167,793 202,404Sales 5,764 6,046Market share 3.4% 3.0%Ranking 11 12
Spain
2004 2005
TIV (car + LCV) 1,851,588 1,915,421Sales 237,232 236,565Market share 12.8% 12.4%Ranking 1 1
Finland
2004 2005
TIV (car + LCV) 160,812 164,167Sales 8,270 8,095Market share 5.1% 4.9%Ranking 8 7
Greece
2004 2005
TIV (car + LCV) 312,714 293,075Sales 15,087 10,817Market share 4.8% 3.7%Ranking 10 12
Last�� page
Next page �� Contents
■■■■■■■■■■■■■■■■■■■■■■■■■■■■■■■■■■■■■■■■■■■■■■■■■■■■■■■■■■■■■■■■■■■■■■■■■■■■■■■■■■■■■■■■■■■■■■■■■■■■■■■■■
■■■■■■■■■■■■■■■■■■■■■■■■■■■■■■■■■■■■■■■■■■■■■■■■■■■■■■
■■■■■■■■■■■■■■■■■■■■■■■■■■■■■■■■■■■■■■■■■■■■■■■■■■■■■■■■■■■■■■■■■■■■■■■■■■■■■■■■■■■■■■■■■■■■■■■■■■■■■■■■■
■■■■■■■■■■■■■■■■■■■■■■■■■■■■■■■■■■■■■■■■■■■■■■■■■■■■■■
■■■■■■■■■■■■■■■■■■■■■■■■■■■■■■■■■■■■■■■■■■■■■■■■■■■■■■■■■■■■■■■■■■■■■■■■■■■■■■■■■■■■■■■■■■■■■■■■■■■■■■■■■
■■■■■■■■■■■■■■■■■■■■■■■■■■■■■■■■■■■■■■■■■■■■■■■■■■■■■■
■■■■■■■■■■■■■■■■■■■■■■■■■■■■■■■■■■■■■■■■■■■■■■■■■■■■■■■■■■■■■■■■■■■■■■■■■■■■■■■■■■■■■■■■■■■■■■■■■■■■■■■■■
■■■■■■■■■■■■■■■■■■■■■■■■■■■■■■■■■■■■■■■■■■■■■■■■■■■■■■
Prod
uctio
n an
d sa
les
49
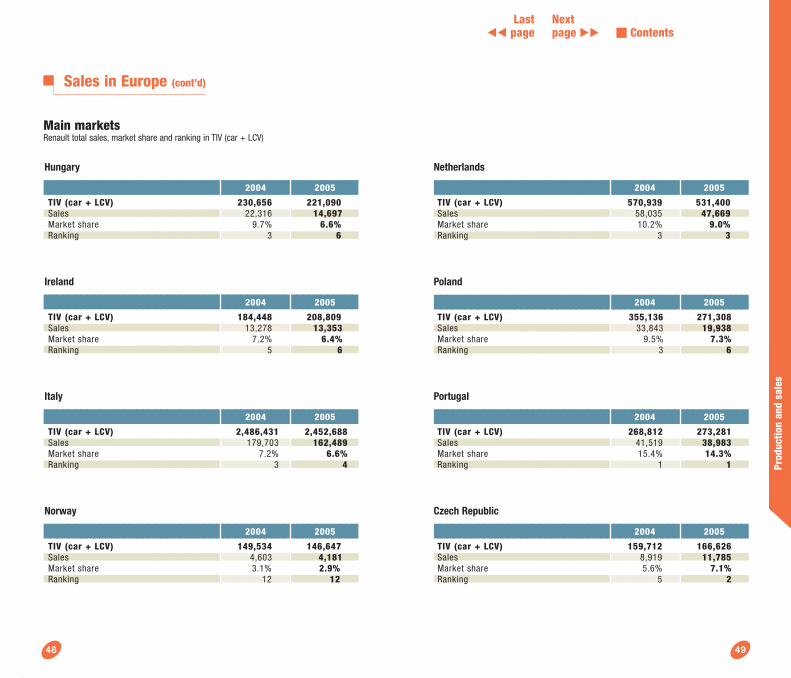
Hungary
2004 2005
TIV (car + LCV) 230,656 221,090Sales 22,316 14,697Market share 9.7% 6.6%Ranking 3 6
Ireland
2004 2005
TIV (car + LCV) 184,448 208,809Sales 13,278 13,353Market share 7.2% 6.4%Ranking 5 6
Italy
2004 2005
TIV (car + LCV) 2,486,431 2,452,688Sales 179,703 162,489Market share 7.2% 6.6%Ranking 3 4
Norway
2004 2005
TIV (car + LCV) 149,534 146,647Sales 4,603 4,181Market share 3.1% 2.9%Ranking 12 12
48
Sales in Europe (cont’d)
Main marketsRenault total sales, market share and ranking in TIV (car + LCV)
■■■■■■■■■■■■■■■■■■■■■■■■■■■■■■■■■■■■■■■■■■■■■■■■■■■■■■■■■■■■■■■■■■■■■■■■■■■■■■■■■■■■■■■■■■■■■■■■■■■■■■■■■
■■■■■■■■■■■■■■■■■■■■■■■■■■■■■■■■■■■■■■■■■■■■■■■■■■■■■■
■■■■■■■■■■■■■■■■■■■■■■■■■■■■■■■■■■■■■■■■■■■■■■■■■■■■■■■■■■■■■■■■■■■■■■■■■■■■■■■■■■■■■■■■■■■■■■■■■■■■■■■■■
■■■■■■■■■■■■■■■■■■■■■■■■■■■■■■■■■■■■■■■■■■■■■■■■■■■■■■
■■■■■■■■■■■■■■■■■■■■■■■■■■■■■■■■■■■■■■■■■■■■■■■■■■■■■■■■■■■■■■■■■■■■■■■■■■■■■■■■■■■■■■■■■■■■■■■■■■■■■■■■■
■■■■■■■■■■■■■■■■■■■■■■■■■■■■■■■■■■■■■■■■■■■■■■■■■■■■■■
■■■■■■■■■■■■■■■■■■■■■■■■■■■■■■■■■■■■■■■■■■■■■■■■■■■■■■■■■■■■■■■■■■■■■■■■■■■■■■■■■■■■■■■■■■■■■■■■■■■■■■■■■
■■■■■■■■■■■■■■■■■■■■■■■■■■■■■■■■■■■■■■■■■■■■■■■■■■■■■■
Poland
2004 2005
TIV (car + LCV) 355,136 271,308Sales 33,843 19,938Market share 9.5% 7.3%Ranking 3 6
Portugal
2004 2005
TIV (car + LCV) 268,812 273,281Sales 41,519 38,983Market share 15.4% 14.3%Ranking 1 1
Czech Republic
2004 2005
TIV (car + LCV) 159,712 166,626Sales 8,919 11,785Market share 5.6% 7.1%Ranking 5 2
Netherlands
2004 2005
TIV (car + LCV) 570,939 531,400Sales 58,035 47,669Market share 10.2% 9.0%Ranking 3 3
Last�� page
Next page �� Contents
■■■■■■■■■■■■■■■■■■■■■■■■■■■■■■■■■■■■■■■■■■■■■■■■■■■■■■■■■■■■■■■■■■■■■■■■■■■■■■■■■■■■■■■■■■■■■■■■■■■■■■■■■
■■■■■■■■■■■■■■■■■■■■■■■■■■■■■■■■■■■■■■■■■■■■■■■■■■■■■■
■■■■■■■■■■■■■■■■■■■■■■■■■■■■■■■■■■■■■■■■■■■■■■■■■■■■■■■■■■■■■■■■■■■■■■■■■■■■■■■■■■■■■■■■■■■■■■■■■■■■■■■■■
■■■■■■■■■■■■■■■■■■■■■■■■■■■■■■■■■■■■■■■■■■■■■■■■■■■■■■
■■■■■■■■■■■■■■■■■■■■■■■■■■■■■■■■■■■■■■■■■■■■■■■■■■■■■■■■■■■■■■■■■■■■■■■■■■■■■■■■■■■■■■■■■■■■■■■■■■■■■■■■■
■■■■■■■■■■■■■■■■■■■■■■■■■■■■■■■■■■■■■■■■■■■■■■■■■■■■■■
■■■■■■■■■■■■■■■■■■■■■■■■■■■■■■■■■■■■■■■■■■■■■■■■■■■■■■
■■■■■■■■■■■■■■■■■■■■■■■■■■■■■■■■■■■■■■■■■■■■■■■■■■■■■■
Prod
uctio
n an
d sa
les
51
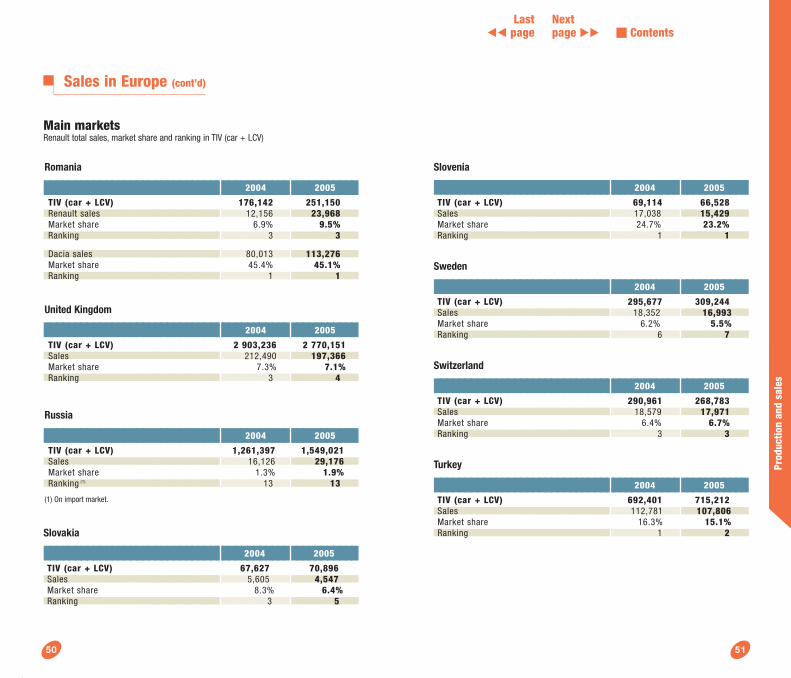
Russia
2004 2005
TIV (car + LCV) 1,261,397 1,549,021Sales 16,126 29,176Market share 1.3% 1.9%Ranking (1) 13 13
(1) On import market.
Romania
2004 2005
TIV (car + LCV) 176,142 251,150Renault sales 12,156 23,968Market share 6.9% 9.5%Ranking 3 3
Dacia sales 80,013 113,276Market share 45.4% 45.1%Ranking 1 1
United Kingdom
2004 2005
TIV (car + LCV) 2 903,236 2 770,151Sales 212,490 197,366Market share 7.3% 7.1%Ranking 3 4
50
Sales in Europe (cont’d)
Main marketsRenault total sales, market share and ranking in TIV (car + LCV)
■■■■■■■■■■■■■■■■■■■■■■■■■■■■■■■■■■■■■■■■■■■■■■■■■■■■■■■■■■■■■■■■■■■■■■■■■■■■■■■■■■■■■■■■■■■■■■■■■■■■■■■■■
■■■■■■■■■■■■■■■■■■■■■■■■■■■■■■■■■■■■■■■■■■■■■■■■■■■■■■
Slovakia
2004 2005
TIV (car + LCV) 67,627 70,896Sales 5,605 4,547Market share 8.3% 6.4%Ranking 3 5
■■■■■■■■■■■■■■■■■■■■■■■■■■■■■■■■■■■■■■■■■■■■■■■■■■■■■■■■■■■■■■■■■■■■■■■■■■■■■■■■■■■■■■■■■■■■■■■■■■■■■■■■■
■■■■■■■■■■■■■■■■■■■■■■■■■■■■■■■■■■■■■■■■■■■■■■■■■■■■■■
■■■■■■■■■■■■■■■■■■■■■■■■■■■■■■■■■■■■■■■■■■■■■■■■■■■■■■■■■■■■■■■■■■■■■■■■■■■■■■■■■■■■■■■■■■■■■■■■■■■■■■■■■
■■■■■■■■■■■■■■■■■■■■■■■■■■■■■■■■■■■■■■■■■■■■■■■■■■■■■■
■■■■■■■■■■■■■■■■■■■■■■■■■■■■■■■■■■■■■■■■■■■■■■■■■■■■■■■■■■■■■■■■■■■■■■■■■■■■■■■■■■■■■■■■■■■■■■■■■■■■■■■■■
■■■■■■■■■■■■■■■■■■■■■■■■■■■■■■■■■■■■■■■■■■■■■■■■■■■■■■
■■■■■■■■■■■■■■■■■■■■■■■■■■■■■■■■■■■■■■■■■■■■■■■■■■■■■■■■■■■■■■■■■■■■■■■■■■■■■■■■■■■■■■■■■■■■■■■■■■■■■■■■■
■■■■■■■■■■■■■■■■■■■■■■■■■■■■■■■■■■■■■■■■■■■■■■■■■■■■■■
Slovenia
2004 2005
TIV (car + LCV) 69,114 66,528Sales 17,038 15,429Market share 24.7% 23.2%Ranking 1 1
Sweden
2004 2005
TIV (car + LCV) 295,677 309,244Sales 18,352 16,993Market share 6.2% 5.5%Ranking 6 7
Switzerland
2004 2005
TIV (car + LCV) 290,961 268,783Sales 18,579 17,971Market share 6.4% 6.7%Ranking 3 3
Turkey
2004 2005
TIV (car + LCV) 692,401 715,212Sales 112,781 107,806Market share 16.3% 15.1%Ranking 1 2
Last�� page
Next page �� Contents
Prod
uctio
n an
d sa
les
53
Sales in France
40%
30%
20%
10%
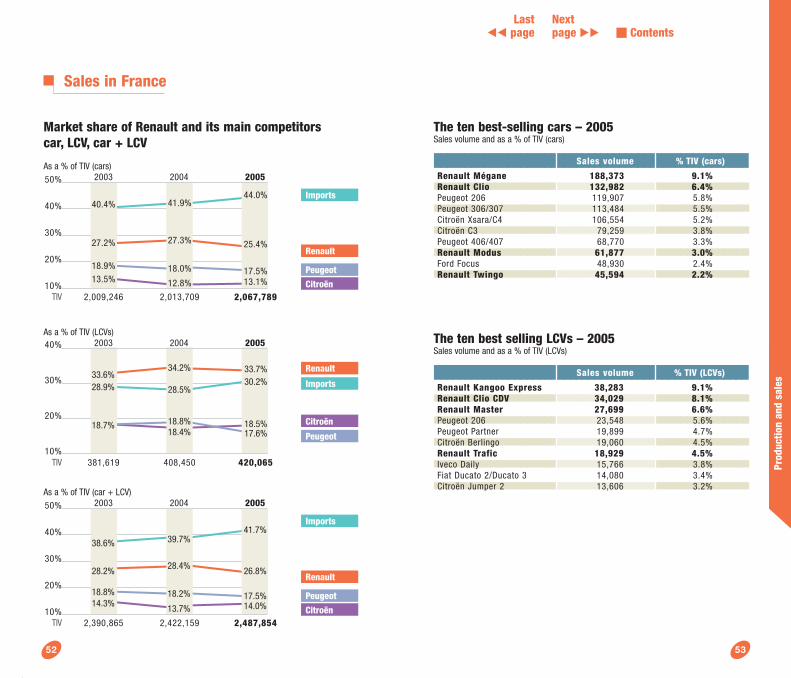
Market share of Renault and its main competitors car, LCV, car + LCV
As a % of TIV (cars)
As a % of TIV (LCVs)
As a % of TIV (car + LCV)
34.2% 33.7%33.6%28.9% 28.5%
30.2%
18.7% 18.8% 18.5%18.4% 17.6%
Citroën
Renault
Peugeot
Imports
Citroën
Imports
Peugeot
Renault
52
381,619 408,450 420,065
2003 2004 2005
TIV
50%
40%
30%
20%
10%
40.4% 41.9%44.0%
27.2% 27.3% 25.4%
18.9% 18.0% 17.5%13.5% 12.8% 13.1%
2,009,246 2,013,709 2,067,789
2003 2004 2005
TIV
■■■■■■■■■■■■■■■■■■■■■■■■■■■■■■■■■■■■■■■■■■■■■■■■■■■■■■■■■■■■■■■■■■■■■■■■■■■■■■■■■■■■■■■■■■■■■■■■■■■■■■
■■■■■■■■■■■■■■■■■■■■■■■■■■■■■■■■■■■■■■■■■■■■■■■■■■■
■■■■■■■■■■■■■■■■■■■■■■■■■■■■■■■■■■■■■■■■■■■■■■■■■■■
■■■■■■■■■■■■■■■■■■■■■■■■■■■■■■■■■■■■■■■■■■■■■■■■■■■
■■■■■■■■■■■■■■■■■■■■■■■■■■■■■■■■■■■■■■■■■■■■■■■■■■■
The ten best-selling cars – 2005Sales volume and as a % of TIV (cars)
Sales volume % TIV (cars)
Renault Mégane 188,373 9.1%Renault Clio 132,982 6.4%Peugeot 206 119,907 5.8%Peugeot 306/307 113,484 5.5%Citroën Xsara/C4 106,554 5.2%Citroën C3 79,259 3.8%Peugeot 406/407 68,770 3.3%Renault Modus 61,877 3.0%Ford Focus 48,930 2.4%Renault Twingo 45,594 2.2%
The ten best selling LCVs – 2005Sales volume and as a % of TIV (LCVs)
Sales volume % TIV (LCVs)
Renault Kangoo Express 38,283 9.1%Renault Clio CDV 34,029 8.1%Renault Master 27,699 6.6%Peugeot 206 23,548 5.6%Peugeot Partner 19,899 4.7%Citroën Berlingo 19,060 4.5%Renault Trafic 18,929 4.5%Iveco Daily 15,766 3.8%Fiat Ducato 2/Ducato 3 14,080 3.4%Citroën Jumper 2 13,606 3.2%
Citroën
Imports
Peugeot
Renault
50%
40%
30%
20%
10%2,390,865 2,422,159 2,487,854
2003 2004 2005
TIV
38.6% 39.7%41.7%
28.2% 28.4% 26.8%
18.8% 17.5%18.2%14.3% 13.7% 14.0%
Last�� page
Next page �� Contents
■■■■■■■■■■■■■■■■■■■■■■■■■■■■■■■■■■■■■■■■■■■■■■■■■■■■■■■■■■■■■■■■■■■■■■■■■■■■■■■■■■■■■■■■■■■■■■■■■■■■■■■■■■■■■■■■■■■■■■■■■■■■■■■■■■■■■■■■■■■■■■■■■■■■■■■■■
■■■■■■■■■■■■■■■■■■■■■■■■■■■■■■■■■■■■■■■■■■■■■■■■■■■
Prod
uctio
n an
d sa
les
55
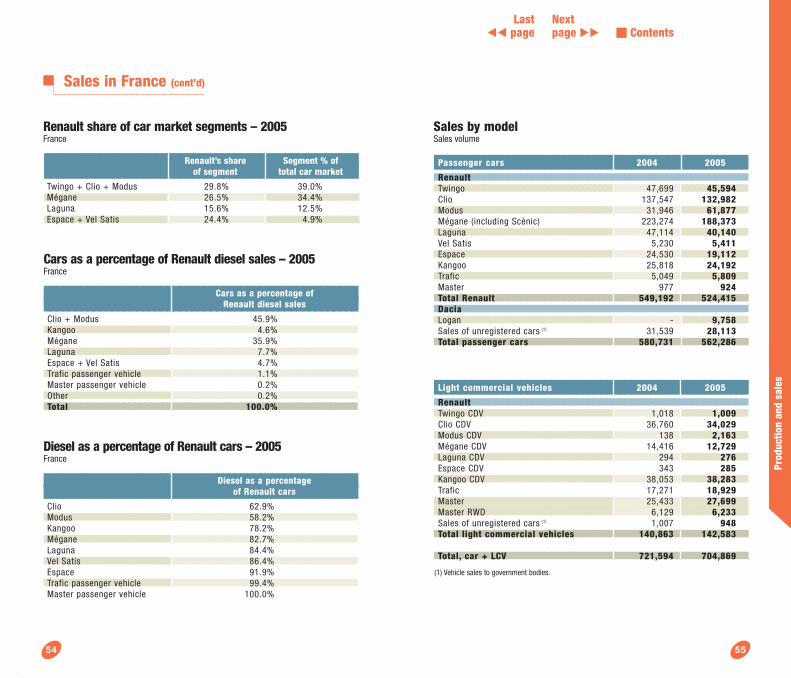
Renault share of car market segments – 2005France
Renault’s share Segment % of of segment total car market
Twingo + Clio + Modus 29.8% 39.0%Mégane 26.5% 34.4%Laguna 15.6% 12.5%Espace + Vel Satis 24.4% 4.9%
54
Sales in France (cont’d)
■■■■■■■■■■■■■■■■■■■■■■■■■■■■■■■■■■■■■■■■■■■■■■■■■■■■■■■■■■■■■■■■■■■■■■■■■■■■■■■■■■■■■■■■■■■■■■■■■■■■■■■■■■■■■■■■■■■■■■■■■■■■■■■■■■■■■■■■■■■■■■■■■■■■■■■■■■■■■
■■■■■■■■■■■■■■■■■■■■■■■■■■■■■■■■■■■■■■■■■■■■■■■■■■■■■■■
■■■■■■■■■■■■■■■■■■■■■■■■■■■■■■■■■■■■■■■■■■■■■■■■■■■■■■■
■■■■■■■■■■■■■■■■■■■■■■■■■■■■■■■■■■■■■■■■■■■■■■■■■■■■■■■
■■■■■■■■■■■■■■■■■■■■■■■■■■■■■■■■■■■■■■■■■■■■■■■■■■■■■■■■■■■■■■■■■■■■■■■■■■■■■■■■■■■■■■■■■■■■■■■■■■■■■■■■■■■■■■■■■■■■■■■■■■■■■■■■■■■■■■■■■■■■■■■■■■■■■■■■■■■■■■■■
■■■■■■■■■■■■■■■■■■■■■■■■■■■■■■■■■■■■■■■■■■■■■■■■■■■■■■■■■■
■■■■■■■■■■■■■■■■■■■■■■■■■■■■■■■■■■■■■■■■■■■■■■■■■■■■■■■■■■
■■■■■■■■■■■■■■■■■■■■■■■■■■■■■■■■■■■■■■■■■■■■■■■■■■■■■■■■■■
■■■■■■■■■■■■■■■■■■■■■■■■■■■■■■■■■■■■■■■■■■■■■■■■■■■■■■■■■■
■■■■■■■■■■■■■■■■■■■■■■■■■■■■■■■■■■■■■■■■■■■■■■■■■■■■■■■■■■■■■■■■■■■■■■■■■■■■■■■■■■■■■■■■■■■■■■■■■■■■■■■■■■■■■■■■■■■■■■■■■■■■■■■■■■■■■■■■■■■■■■■■■■■■■■■■■■■■■■■■■■
■■■■■■■■■■■■■■■■■■■■■■■■■■■■■■■■■■■■■■■■■■■■■■■■■■■■■
Passenger cars 2004 2005
RenaultTwingo 47,699 45,594Clio 137,547 132,982Modus 31,946 61,877Mégane (including Scénic) 223,274 188,373Laguna 47,114 40,140Vel Satis 5,230 5,411Espace 24,530 19,112Kangoo 25,818 24,192Trafic 5,049 5,809Master 977 924Total Renault 549,192 524,415DaciaLogan - 9,758Sales of unregistered cars (1) 31,539 28,113Total passenger cars 580,731 562,286
■■■■■■■■■■■■■■■■■■■■■■■■■■■■■■■■■■■■■■■■■■■■■■■■■■■■■■■■■■■■■■■■■■■■■■■■■■■■■■■■■■■■■■■■■■■■■■■■■■■■■■■■■■■■■■■■■■■■■■■■■■■■■■■■■■■■■■■■■■■■■■■■■■■■■■■■■■■■■■■■
■■■■■■■■■■■■■■■■■■■■■■■■■■■■■■■■■■■■■■■■■■■■■■■■■■■■■■■■■■
■■■■■■■■■■■■■■■■■■■■■■■■■■■■■■■■■■■■■■■■■■■■■■■■■■■■■■■■■■
■■■■■■■■■■■■■■■■■■■■■■■■■■■■■■■■■■■■■■■■■■■■■■■■■■■■■■■■■■
■■■■■■■■■■■■■■■■■■■■■■■■■■■■■■■■■■■■■■■■■■■■■■■■■■■■■■■■■■■■■■■■■■■■■■■■■■■■■■■■■■■■■■■■■■■■■■■■■■■■■■■■■■■■■■■■■■■■
■■■■■■■■■■■■■■■■■■■■■■■■■■■■■■■■■■■■■■■■■■■■■■■■■■■■■
■■■■■■■■■■■■■■■■■■■■■■■■■■■■■■■■■■■■■■■■■■■■■■■■■■■■■
Light commercial vehicles 2004 2005
RenaultTwingo CDV 1,018 1,009Clio CDV 36,760 34,029Modus CDV 138 2,163Mégane CDV 14,416 12,729Laguna CDV 294 276Espace CDV 343 285Kangoo CDV 38,053 38,283Trafic 17,271 18,929Master 25,433 27,699Master RWD 6,129 6,233Sales of unregistered cars (1) 1,007 948Total light commercial vehicles 140,863 142,583
Total, car + LCV 721,594 704,869
(1) Vehicle sales to government bodies.
Sales by modelSales volume
■■■■■■■■■■■■■■■■■■■■■■■■■■■■■■■■■■■■■■■■■■■■■■■■■■■■■■■■■■■■■■■■■■■■■■■■■■■■■■■■■■■■■■■■■■■■■■■■■■■■■■■■■■■■■■■■■■■■■■■■■■■■■■■■■■■■■■■■■■■■■■■■■■■■■■■■■■■■■
■■■■■■■■■■■■■■■■■■■■■■■■■■■■■■■■■■■■■■■■■■■■■■■■■■■■■■■
■■■■■■■■■■■■■■■■■■■■■■■■■■■■■■■■■■■■■■■■■■■■■■■■■■■■■■■
■■■■■■■■■■■■■■■■■■■■■■■■■■■■■■■■■■■■■■■■■■■■■■■■■■■■■■■■■■■■■■■■■■■■■■■■■■■■■■■■■■■■■■■■■■■■■■■■■■■■■■■■■■■■■■
Cars as a percentage of Renault diesel sales – 2005France
Cars as a percentage of Renault diesel sales
Clio + Modus 45.9%Kangoo 4.6%Mégane 35.9%Laguna 7.7%Espace + Vel Satis 4.7%Trafic passenger vehicle 1.1%Master passenger vehicle 0.2%Other 0.2%Total 100.0%
Diesel as a percentage of Renault cars – 2005France
Diesel as a percentage of Renault cars
Clio 62.9%Modus 58.2%Kangoo 78.2%Mégane 82.7%Laguna 84.4%Vel Satis 86.4%Espace 91.9%Trafic passenger vehicle 99.4%Master passenger vehicle 100.0%
Last�� page
Next page �� Contents
■■■■■■■■■■■■■■■■■■■■■■■■■■■■■■■■■■■■■■■■■■■■■■■■■■■■■■■■■■■■■■■■■■■■■■■■■■■■■■■■■■■■■■■■■■■■■■■■■■■■■■■■■
■■■■■■■■■■■■■■■■■■■■■■■■■■■■■■■■■■■■■■■■■■■■■■■■■■■■■■■■■■■■■■■■■■■■■■■■■■■■■■■■■■■■■■■■■■■■■■■■■■■■■■■■■
■■■■■■■■■■■■■■■■■■■■■■■■■■■■■■■■■■■■■■■■■■■■■■■■■■■■■■■■■■■■■■■■■■■■■■■■■■■■■■■■■■■■■■■■■■■■■■■■■■■■■■■■■
Prod
uctio
n an
d sa
les
57
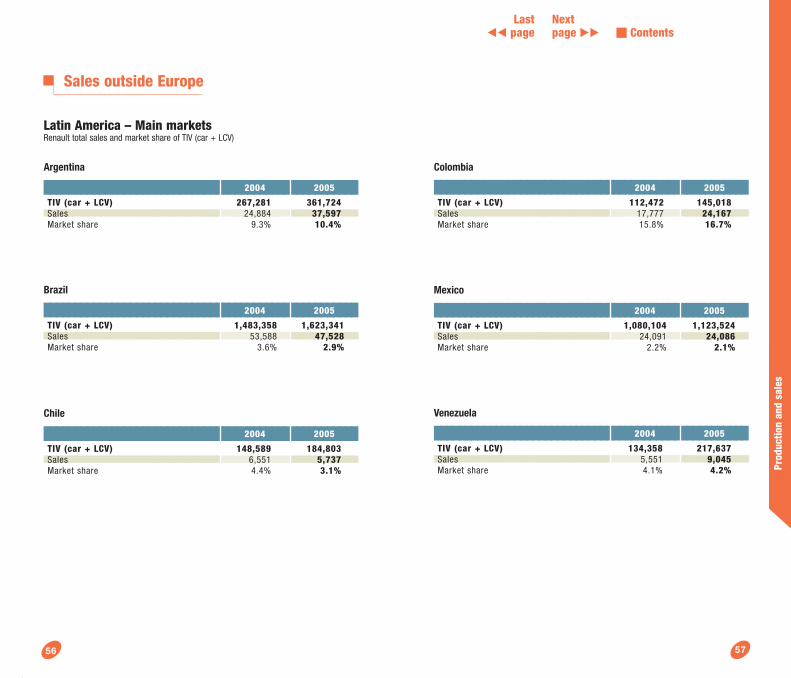
Sales outside Europe
Latin America – Main marketsRenault total sales and market share of TIV (car + LCV)
Argentina
2004 2005
TIV (car + LCV) 267,281 361,724Sales 24,884 37,597Market share 9.3% 10.4%
Brazil
2004 2005
TIV (car + LCV) 1,483,358 1,623,341Sales 53,588 47,528Market share 3.6% 2.9%
Chile
2004 2005
TIV (car + LCV) 148,589 184,803Sales 6,551 5,737Market share 4.4% 3.1%
56
■■■■■■■■■■■■■■■■■■■■■■■■■■■■■■■■■■■■■■■■■■■■■■■■■■■■■■■■■■■■■■■■■■■■■■■■■■■■■■■■■■■■■■■■■■■■■■■■■■■■■■■■■
■■■■■■■■■■■■■■■■■■■■■■■■■■■■■■■■■■■■■■■■■■■■■■■■■■■■■■■■■■■■■■■■■■■■■■■■■■■■■■■■■■■■■■■■■■■■■■■■■■■■■■■■■
Mexico
2004 2005
TIV (car + LCV) 1,080,104 1,123,524Sales 24,091 24,086Market share 2.2% 2.1%
Venezuela
2004 2005
TIV (car + LCV) 134,358 217,637Sales 5,551 9,045Market share 4.1% 4.2%
■■■■■■■■■■■■■■■■■■■■■■■■■■■■■■■■■■■■■■■■■■■■■■■■■■■■■■■■■■■■■■■■■■■■■■■■■■■■■■■■■■■■■■■■■■■■■■■■■■■■■■■■■
Colombia
2004 2005
TIV (car + LCV) 112,472 145,018Sales 17,777 24,167Market share 15.8% 16.7%
Last�� page
Next page �� Contents
■■■■■■■■■■■■■■■■■■■■■■■■■■■■■■■■■■■■■■■■■■■■■■■■■■■■■■■■■■■■■■■■■■■■■■■■■■■■■■■■■■■■■■■■■■■■■■■■■■■■■■■■■
■■■■■■■■■■■■■■■■■■■■■■■■■■■■■■■■■■■■■■■■■■■■■■■■■■■■■■■■■■■■■■■■■■■■■■■■■■■■■■■■■■■■■■■■■■■■■■■■■■■■■■■■■
Prod
uctio
n an
d sa
les
59
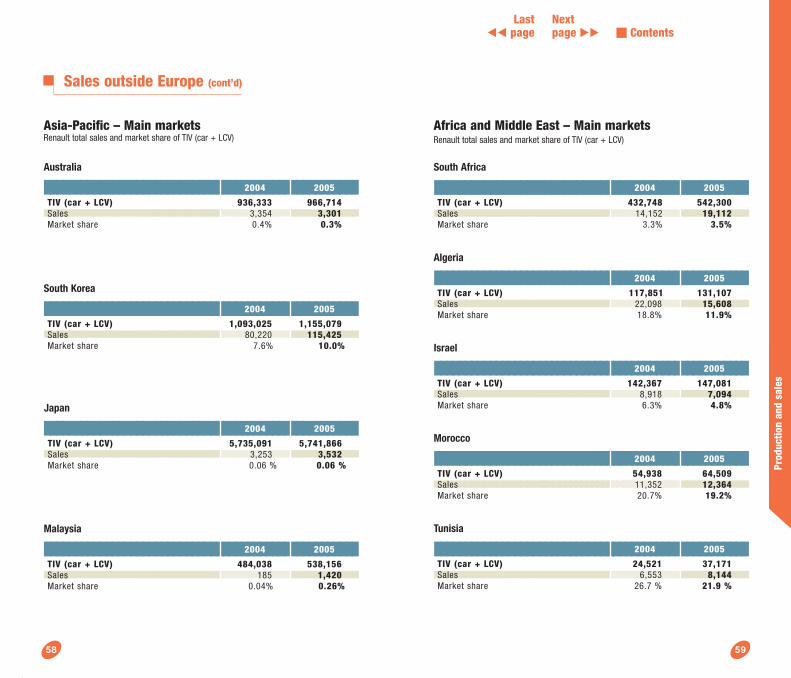
Asia-Pacific – Main marketsRenault total sales and market share of TIV (car + LCV)
Australia
2004 2005
TIV (car + LCV) 936,333 966,714Sales 3,354 3,301Market share 0.4% 0.3%
South Korea
2004 2005
TIV (car + LCV) 1,093,025 1,155,079Sales 80,220 115,425Market share 7.6% 10.0%
■■■■■■■■■■■■■■■■■■■■■■■■■■■■■■■■■■■■■■■■■■■■■■■■■■■■■■■■■■■■■■■■■■■■■■■■■■■■■■■■■■■■■■■■■■■■■■■■■■■■■■■■■
Malaysia
2004 2005
TIV (car + LCV) 484,038 538,156Sales 185 1,420Market share 0.04% 0.26%
58
Sales outside Europe (cont’d)
■■■■■■■■■■■■■■■■■■■■■■■■■■■■■■■■■■■■■■■■■■■■■■■■■■■■■■■■■■■■■■■■■■■■■■■■■■■■■■■■■■■■■■■■■■■■■■■■■■■■■■■■■
Japan
2004 2005
TIV (car + LCV) 5,735,091 5,741,866Sales 3,253 3,532Market share 0.06 % 0.06 %
■■■■■■■■■■■■■■■■■■■■■■■■■■■■■■■■■■■■■■■■■■■■■■■■■■■■■■■■■■■■■■■■■■■■■■■■■■■■■■■■■■■■■■■■■■■■■■■■■■■■■■■■■
■■■■■■■■■■■■■■■■■■■■■■■■■■■■■■■■■■■■■■■■■■■■■■■■■■■■■■■■■■■■■■■■■■■■■■■■■■■■■■■■■■■■■■■■■■■■■■■■■■■■■■■■■
■■■■■■■■■■■■■■■■■■■■■■■■■■■■■■■■■■■■■■■■■■■■■■■■■■■■■■■■■■■■■■■■■■■■■■■■■■■■■■■■■■■■■■■■■■■■■■■■■■■■■■■■■
■■■■■■■■■■■■■■■■■■■■■■■■■■■■■■■■■■■■■■■■■■■■■■■■■■■■■■■■■■■■■■■■■■■■■■■■■■■■■■■■■■■■■■■■■■■■■■■■■■■■■■■■■
■■■■■■■■■■■■■■■■■■■■■■■■■■■■■■■■■■■■■■■■■■■■■■■■■■■■■■■■■■■■■■■■■■■■■■■■■■■■■■■■■■■■■■■■■■■■■■■■■■■■■■■■■
Africa and Middle East – Main marketsRenault total sales and market share of TIV (car + LCV)
South Africa
2004 2005
TIV (car + LCV) 432,748 542,300Sales 14,152 19,112Market share 3.3% 3.5%
Algeria
2004 2005
TIV (car + LCV) 117,851 131,107Sales 22,098 15,608Market share 18.8% 11.9%
Israel
2004 2005
TIV (car + LCV) 142,367 147,081Sales 8,918 7,094Market share 6.3% 4.8%
Morocco
2004 2005
TIV (car + LCV) 54,938 64,509Sales 11,352 12,364Market share 20.7% 19.2%
Tunisia
2004 2005
TIV (car + LCV) 24,521 37,171Sales 6,553 8,144Market share 26.7 % 21.9 %
Last�� page
Next page �� Contents
Prod
uctio
n an
d sa
les
6160
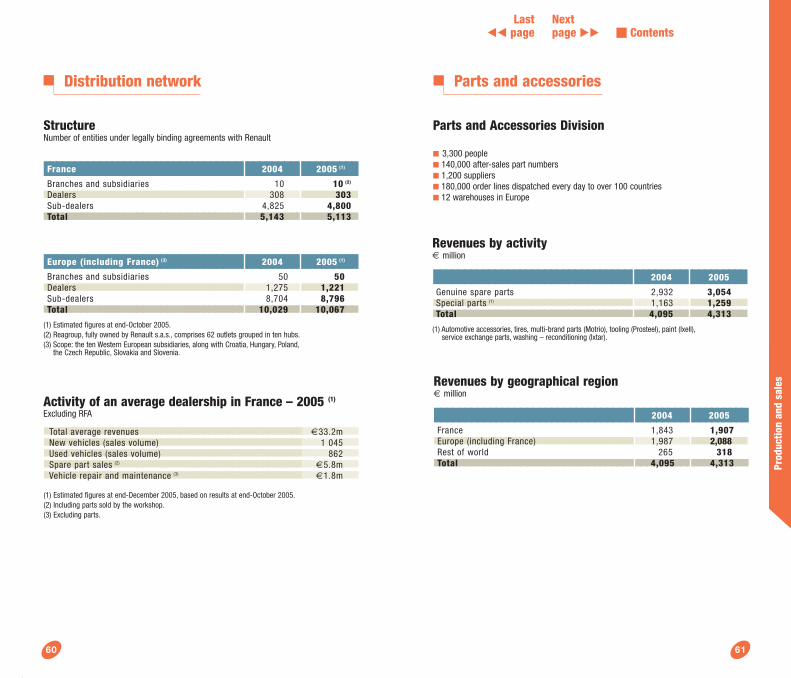
Distribution network
Activity of an average dealership in France – 2005 (1)
Excluding RFA
■■■■■■■■■■■■■■■■■■■■■■■■■■■■■■■■■■■■■■■■■■■■■■■■■■■■■■■■■■■■■■■■■■■■■■■■■■■■■■■■■■■■■■■■■■■■■■■■■■■■■■■■■■■■■■■■■■■■■■■■■■■■■■■■■■■■■■■■■■■■■■■■■■■■■■■■■■■■■■■■■■■■■■■■■■■■■■■■■■■■■■■■■■■■■■■■■■■■■■■■■■■■■■■■■■■■■■■■■■■■■■■■■■■■■■■■■■■■■■■■■■■■■■■■■■■■■■■■■■■■
Total average revenues €33.2mNew vehicles (sales volume) 1 045 Used vehicles (sales volume) 862 Spare part sales (2)
€5.8mVehicle repair and maintenance (3)
€1.8m
(1) Estimated figures at end-December 2005, based on results at end-October 2005.(2) Including parts sold by the workshop.(3) Excluding parts.
■■■■■■■■■■■■■■■■■■■■■■■■■■■■■■■■■■■■■■■■■■■■■■■■■■■■■■■■■■■■■■■■■■■■■■■■■■■■■■■■■■■■■■■■■■■■■■■■■■■■■■■
■■■■■■■■■■■■■■■■■■■■■■■■■■■■■■■■■■■■■■■■■■■■■■■■■■■■
■■■■■■■■■■■■■■■■■■■■■■■■■■■■■■■■■■■■■■■■■■■■■■■■■■■■■■■■■■■■■■■■■■■■■■■■■■■■■■■■■■■■■■■■■■■■■■■■■■■■■■■
■■■■■■■■■■■■■■■■■■■■■■■■■■■■■■■■■■■■■■■■■■■■■■■■■■■■
France 2004 2005 (1)
Branches and subsidiaries 10 10 (2)
Dealers 308 303Sub-dealers 4,825 4,800Total 5,143 5,113
StructureNumber of entities under legally binding agreements with Renault
Europe (including France) (3) 2004 2005 (1)
Branches and subsidiaries 50 50Dealers 1,275 1,221Sub-dealers 8,704 8,796Total 10,029 10,067
(1) Estimated figures at end-October 2005.(2) Reagroup, fully owned by Renault s.a.s., comprises 62 outlets grouped in ten hubs.(3) Scope: the ten Western European subsidiaries, along with Croatia, Hungary, Poland,
the Czech Republic, Slovakia and Slovenia.
■■■■■■■■■■■■■■■■■■■■■■■■■■■■■■■■■■■■■■■■■■■■■■■■■■■■■■■■■■■■■■■■■■■■■■■■■■■■■■■■■■■■■■■■■■■■■■■■■■■■■■■■■■■■■■■■■■■■■■■■■■■■■■■■■■■■■■■■■■■■■■■■■■■■■■■■■■■
Parts and accessories
Parts and Accessories Division
■ 3,300 people■ 140,000 after-sales part numbers ■ 1,200 suppliers■ 180,000 order lines dispatched every day to over 100 countries■ 12 warehouses in Europe
Revenues by activity€ million
2004 2005
Genuine spare parts 2,932 3,054Special parts (1) 1,163 1,259Total 4,095 4,313
(1) Automotive accessories, tires, multi-brand parts (Motrio), tooling (Prosteel), paint (Ixell),service exchange parts, washing – reconditioning (Ixtar).
■■■■■■■■■■■■■■■■■■■■■■■■■■■■■■■■■■■■■■■■■■■■■■■■■■■■■■■■■■■■■■■■■■■■■■■■■■■■■■■■■■■■■■■■■■■■■■■■■■■■■■■
■■■■■■■■■■■■■■■■■■■■■■■■■■■■■■■■■■■■■■■■■■■■■■■■■■■■
Revenues by geographical region€ million
2004 2005
France 1,843 1,907Europe (including France) 1,987 2,088Rest of world 265 318Total 4,095 4,313
Last�� page
Next page �� Contents

6362
Othe
r ac
tiviti
es
Other activities
■■■■■■■■■■■■■■■■■■■■■■■■■■■■■■■■■■■■■■■■■■■■■■■■■■■■■■■■■■■■■■■■■■■■■■■■■■■■■■■■■■■■■■■■■■■■■■■■■■■■■■■■■■
■■■■■■■■■■■■■■■■■■■■■■■■■■■■■■■■■■■■■■■■■■■■■■■■■■■■■■■■■■■■■■■■■■■■■■■■■■■■■■■■■■■■■■■■■■■■■■■■■■■■■■■■■■■■■■
■■■■■■■■■■■■■■■■■■■■■■■■■■■■■■■■■■■■■■■■■■■■■■■■■■■■
■■■■■■■■■■■■■■■■■■■■■■■■■■■■■■■■■■■■■■■■■■■■■■■■■■■■
■■■■■■■■■■■■■■■■■■■■■■■■■■■■■■■■■■■■■■■■■■■■■■■■■■■■
■■■■■■■■■■■■■■■■■■■■■■■■■■■■■■■■■■■■■■■■■■■■■■■■■■■■■■■■■■■■■■■■■■■■■■■■■■■■■■■■■■■■■■■■■■■■■■■■■■■■■■■■
RCI Banque
RCI Banque, the financing arm of the Renault group, provides a full range of financial products and services for its three main customer segments: the general public, fleet customers and the Renault, Nissan and Dacia brand dealer networks.RCI Banque:■ offers the general public solutions for purchasing new or used Renault,
Nissan and Dacia vehicles and for facilitating their use and renewal;■ brings fleet customers a full range of services from contract hire with
service options through to fleet management without financing;■ finances network stocks of new and used vehicles and spare parts.
New financing and loans outstandingNew and used Renault, Nissan (and Dacia for 2005) vehicles
Net loans Net loans 2004 2005 outstanding outstanding
at end 2004 at end 2005
Germany 48.3% 47.0% 5,406 5,266Spain 37.8% 43.7% 3,250 3,849 France 32.6% 32.5% 7,209 7,687 Italy 40.6% 35.8% 2,508 2,264United Kingdom 32.5% 26.4% 1,683 1,795Total Western Europe 35.4% 34.9% 21,900 22,824 Central and Eastern Europe 35.3% 33.4% 91 356Mercosur 44.8% 36.0% 146 230Total RCI Banque 35.8% 34.8% 22,142 23,411
Financing rate and net loans outstanding by country RCI Banque rate for new Renault and Nissan vehicle sales in EuropeAs a % / € million
2004 2005
Financing rate (1) 35.4% 34.9%New financing schemes €10,685m €10,490mNumber of new loans 1,058,000 1,036,000Net loans outstanding at end of period €22,142m €23,411m
(1) Austria, Belgium-Luxembourg, France, Germany, Italy, Netherlands, Portugal, Spain, Switzerland.
Industrial activities
Main subsidiaries and industrial shareholdings of the Renault group (excluding vehicle assembly) (1)
Country Activity Share Remarks
AB Volvo Sweden Trucks, 20% Stake acquired construction in 2001, when materials and Renault Véhicules miscellaneous Industriels was
sold to AB Volvo
ACI Europe, Chassis systems 100% Company founded Mercosur, in 1999United States, Asia
Française France Engines 50% Company foundedde Mécanique with Peugeot in 1969
Renault France Tractors and 49%(2) Stake resulting from Agriculture agricultural the sale of 51%
machinery of the capital to Claas in 2003
STA France Automatic 80% Company founded transmissions with Peugeot in 1970
SNR France Industrial 100% Company foundedRoulements bearings in 1946
(1) At December 31, 2005.
(2) In January 2006, Renault reduced its stake in Renault Agriculture to 20% (80% held by the Claas group).
Last�� page
Next page �� Contents
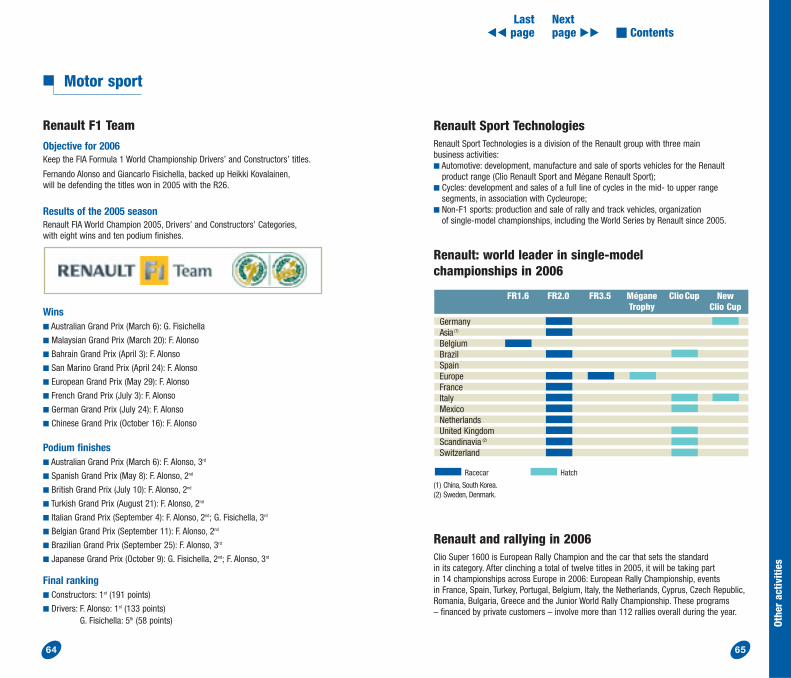
Othe
r ac
tiviti
es
6564
Motor sport
Renault F1 TeamObjective for 2006 Keep the FIA Formula 1 World Championship Drivers’ and Constructors’ titles.
Fernando Alonso and Giancarlo Fisichella, backed up Heikki Kovalainen,will be defending the titles won in 2005 with the R26.
Results of the 2005 season Renault FIA World Champion 2005, Drivers’ and Constructors’ Categories,with eight wins and ten podium finishes.
Wins■ Australian Grand Prix (March 6): G. Fisichella
■ Malaysian Grand Prix (March 20): F. Alonso
■ Bahrain Grand Prix (April 3): F. Alonso
■ San Marino Grand Prix (April 24): F. Alonso
■ European Grand Prix (May 29): F. Alonso
■ French Grand Prix (July 3): F. Alonso
■ German Grand Prix (July 24): F. Alonso
■ Chinese Grand Prix (October 16): F. Alonso
Podium finishes■ Australian Grand Prix (March 6): F. Alonso, 3rd
■ Spanish Grand Prix (May 8): F. Alonso, 2nd
■ British Grand Prix (July 10): F. Alonso, 2nd
■ Turkish Grand Prix (August 21): F. Alonso, 2nd
■ Italian Grand Prix (September 4): F. Alonso, 2nd; G. Fisichella, 3rd
■ Belgian Grand Prix (September 11): F. Alonso, 2nd
■ Brazilian Grand Prix (September 25): F. Alonso, 3rd
■ Japanese Grand Prix (October 9): G. Fisichella, 2nd; F. Alonso, 3rd
Final ranking■ Constructors: 1st (191 points)
■ Drivers: F. Alonso: 1st (133 points)G. Fisichella: 5th (58 points)
Renault: world leader in single-model championships in 2006
Renault and rallying in 2006Clio Super 1600 is European Rally Champion and the car that sets the standard in its category. After clinching a total of twelve titles in 2005, it will be taking part in 14 championships across Europe in 2006: European Rally Championship, events in France, Spain, Turkey, Portugal, Belgium, Italy, the Netherlands, Cyprus, Czech Republic,Romania, Bulgaria, Greece and the Junior World Rally Championship. These programs – financed by private customers – involve more than 112 rallies overall during the year.
Renault Sport TechnologiesRenault Sport Technologies is a division of the Renault group with three main business activities:■ Automotive: development, manufacture and sale of sports vehicles for the Renault
product range (Clio Renault Sport and Mégane Renault Sport);■ Cycles: development and sales of a full line of cycles in the mid- to upper range
segments, in association with Cycleurope;■ Non-F1 sports: production and sale of rally and track vehicles, organization
of single-model championships, including the World Series by Renault since 2005.
GermanyAsia (1)
BelgiumBrazilSpainEuropeFranceItalyMexicoNetherlandsUnited KingdomScandinavia (2)
Switzerland
FR1.6 FR2.0 FR3.5 Mégane Clio Cup New Trophy Clio Cup
Racecar Hatch
(1) China, South Korea.(2) Sweden, Denmark.
Last�� page
Next page �� Contents
www.renault.comwww.media.renault.com
RENAULT13-15, quai Le Gallo
92513 BOULOGNE-BILLANCOURT CedexFrance
Tel.: 33 (0)1 76 84 04 04
CORPORATE COMMUNICATIONS DEPARTMENT
The Renault Atlas is published twice a year, in March for the Geneva Motor Show,and in September for the Paris Motor Show (even-numbered years)
or the Frankfurt Motor Show (odd-numbered years).
An updated edition will be published in September 2006.
Photo credits:B. Barbet, H. Gruyaert, P. Zachmann: front cover,
O. Banet: front cover, pp. 22-23,A. Bernier: p. 22,C. Cugny: p. 23,
P. Curtet: pp. 22-23,D. Dumas: p. 22,G. Esmieu: p. 22,A. Lesieur: p. 22,
P. Sautelet: front cover, p. 22,Renault Sales & Marketing Department: p. 22, Dacia photo library (all rights reserved): p. 23,
Renault Samsung Motors photo library (all rights reserved): p. 23.
ATL
ASG
B030
6
C
over
: allia
nce
desi
gn -
Des
ign/
Prod
uctio
n:-
Com
elli
prin
ting