renal program annual report
TRANSCRIPT

2012/13
Renal Program Annual Report
Capital District Health Authority
Queen Elizabeth II Health Sciences
Centre
Room 606 Dickson Building
5820 University Avenue
Halifax, Nova Scotia
Canada
B3H 1V8
Phone: (902) 473-7545
Fax: (902) 473-4168
www.cdha.nshealth.ca/renal-program

P a g e | 2
Table of Contents
Executive Summary …………………………………………………………..………………………………….………. 3
Acknowledgments …………………………………………………………….……………………………….……….… 4
Program Statistics ……………………………………………………………………………………………..…….……. 5
Renal Clinic Statistics …....…………………………………………….…………………………………..………….. 14
Home and Satellite Dialysis Unit Statistics ……………………………..………………………..….……….. 18
In-Centre Hemodialysis Unit Statistics………………………………………………………………………..…. 25
Balanced Scorecard ………………………………………………….…………...…………………………………….. 30
Accreditation 2013 ……………………………………………………..…………………………………...………….. 32
Research ………………………………………………...…………...……………………………………………….…….. 33
Initiatives ………………………………………………………………..……………………………………………….….. 37
Quality Care Teams …………………………………………………….………………………………..………………. 39
Directions/Priorities for future planning ……………………………….……………………………….…….. 46

P a g e | 3
Executive Summary The Capital District Health Authority (CDHA) Renal Program’s vision of ‘Innovative Quality Renal Care’ is
achieved through its mission statement of ‘working with the health care system, its partners, patients
and families to achieve optimal integrated care through advocacy, education, research, and leadership.
The Renal Program offers many services at many different service locations. Included are the Renal
Clinic, Home and Satellite Dialysis Units, and the in-centre hemodialysis units in Halifax at the Dickson
centre, and at the Dartmouth General Hospital (DGH). The program operates in a multidisciplinary
fashion with nephrologists, nurse practitioners, a pharmacist, clinical nurse educators, registered nurses,
licensed practical nurses, dieticians, social workers, Information Technology (IT) support, clerical
support, renal assistants, biomedical technicians, a vascular access nurse, and Peritoneal Dialysis (PD)
access nurse. The Renal program maintains strong relationships with Inpatient Nephrology, Multi Organ
Transplant Program (MOTP), Victorian Order of Nurses (VON) and Continuing Care, Interventional
Radiology, Vascular Surgery, General Surgery, The Nova Scotia Renal Program (NSRP), and the Cape
Breton, Yarmouth, and Prince Edward Island (PEI) Renal Programs. The program also supports the
Guysborough Antigonish Strait Health Authority (GASHA) hemodialysis unit.
The multidisciplinary Renal Clinic receives outpatient nephrology consultations, provides appointments
with nephrologists and nurse practitioners, and offers pre-dialysis education sessions and small group
education sessions. Key foci in the renal clinic are health promotion, slowing the progression of renal
disease, and supporting patients who need to start a renal replacement therapy.
The Home Dialysis Unit supports patients and their families to dialyze in the comfort and convenience of
their own home after completing education and training in the home dialysis unit. For patients
performing PD or home hemodialysis (HHD) in their own homes, there is 24 hour on-call support from
an RN. Also, the unit operates small community dialysis units in Berwick, Liverpool, Pictou, Port
Hawkesbury, Springhill, and Truro. Key foci in the home unit are to maximize self-management through
home therapies, and keep people in their communities.
The in-centre hemodialysis units in the Dickson and DGH provide a large proportion of dialysis
treatments in the CDHA region. The Dickson in-centre hemodialysis unit provides acute dialysis
treatments off-unit in ICU, IMCU, or ERs, as well as fallback support for the rest of the renal program and
other renal programs in the Maritimes including Yarmouth, Cape Breton, PEI, New Brunswick, and
Newfoundland.
The Renal Program strives for quality, and as such has many different quality teams that each focus on
improving the safety and quality that is delivered. The Renal Program is also committed to improving the
quality of renal care and is actively involved in the research community.
Finally, the renal program is looking towards the future with the creation of the Renal Palliation and
Therapeutic Harmonization (PATH) clinic, the promotion of home therapies, and the transitioning of
satellite dialysis units to the local health authorities in which they are located.
Matt Phillips RN BScN, Nephrology Quality Leader

P a g e | 4
Acknowledgements
This report would not have been possible without the support and contributions of many
dedicated and talented individuals in the renal program and beyond. It would not be possible to
individually acknowledge all those who assisted or contributed to the development of this
report, but the following deserve special mention. Special thanks go to the Renal Program
Quality and Patient Safety Team for developing the framework for this Annual Report, and also
to Dr. Steven Soroka and Cynthia Stockman for on-going guidance and support. Thanks goes to
the committee chairs of each quality team for submitting on behalf of their respective teams
their annual reports. Statistics were provided by Niall Sheehy and Avtar Seehra, the renal
program systems analysts, as well as Nancy MacDonald from STAR Reporting, Kathy Hart from
Infection Control, Denise Harrie, Paula Mossop, and Cindy Everett. Bernadette Chevalier
provided all medication usage information. Treena Campbell provided CRRT data. Research
information was provided by Susan Fleet, David Landry NP, Dr. Jo-Anne Wilson and Dr. Michael
West. Finally, we would like to acknowledge all staff and physicians who on a daily basis focus
their energy on the care and safety of all patients and families. Each treatment, appointment,
teaching or training session, surgical or radiological intervention, or change of modality requires
a coordinated approach that involves many factors, variables, and team members. Thank you to
all, for all that you do.

P a g e | 5
Program Statistics
Dialysis Modality Trends
Distribution of Modalities
0
50
100
150
200
250
300
2008 2009 2010 2011 2012
In-Centre
Satellite
PD
HHD
243 116
57
18
Distribution of Modalities on March 31, 2013
In-Centre Hemodialysis (56%) Satellite Hemodialysis (27%)
PD (13%)
Dialysis Modality Trends In-Centre Satellite PD HHD Total
2012 243 (56%) 116 (27%) 57 (13%) 18 (4%) 434
2011 246 (56.6%) 112 (25.8%) 59 (13.5%) 17 (3.9%) 434
2010 242 (58.7%) 90 (21.8%) 66 (16%) 14 (3.3%) 412
2009 229 (54.9%) 90 (21.6%) 87 (20.9%) 11 (2.6) 417
2008 242 (58.6%) 89 (21.5%) 77 (18.6%) 5 (1.2%) 413

P a g e | 6
Modality of Incident Patients
Incident dialysis modality is defined as the initial renal replacement therapy. This table does not capture
changes of modality (Hemodialysis PD, or TransplantHemodialysis).
Incident Modality
2011/12 2012/13
Q1 Q2 Q3 Q4 Total Q1 Q2 Q3 Q4 Total
In-Centre 25 24 17 14 80 19 16 18 20 73
PD 5 7 3 9 24 2 7 3 5 17
Home Hemodialysis
0 0 0 2 2 1 0 3 2 6
Total 30 31 20 25 106 22 23 24 27 96
Program Separations
Reason for Separation 2011/12 2012/13
Death 83 81
Transplant* 36* 40*
Stopped Treatment 22 23
Recovered Function 8 3
Transferred to Another Program 2 3
Other N/A 7
Total Program Separations 151 157 * This is the number of CDHA chronic dialysis patients who received a kidney transplant, and not the
total number of kidney transplants performed at CDHA.
Hemodialysis Treatments Performed
Total number of hemodialysis treatments performed by the renal program. This does not
include home hemodialysis treatments independently performed by patients in their own
homes.
* Data from STAR/performance Indicators and Reports, CDHA intranet
Treatment Location HD treatments 2011/12 HD treatments 2012/13
Dickson In-centre unit 34 056 31 022
DGH In-Centre Unit 7 094 7 957
Satellite Dialysis units 15 816 17 429
Home Dialysis Unit 215* 436*
Acute Hemodialysis ICU/IMCU/ER 910 904
Total Hemodialysis Treatments 58 091 57 748
P a g e | 7
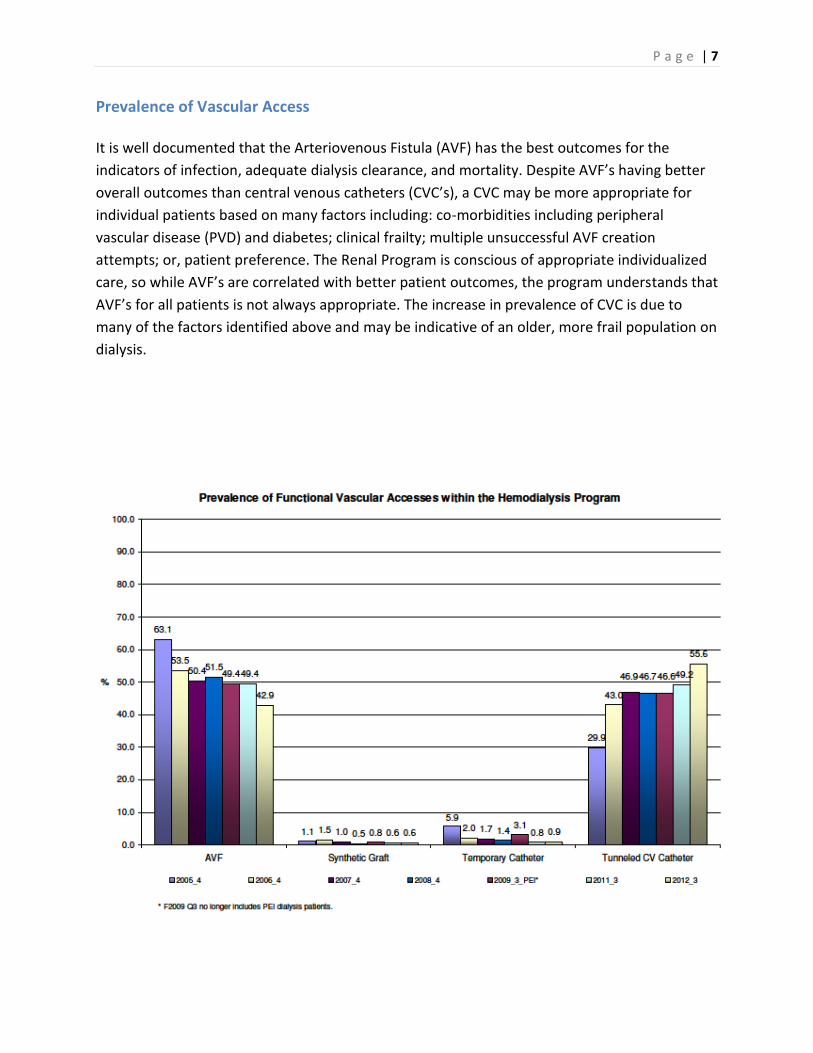
Prevalence of Vascular Access
It is well documented that the Arteriovenous Fistula (AVF) has the best outcomes for the
indicators of infection, adequate dialysis clearance, and mortality. Despite AVF’s having better
overall outcomes than central venous catheters (CVC’s), a CVC may be more appropriate for
individual patients based on many factors including: co-morbidities including peripheral
vascular disease (PVD) and diabetes; clinical frailty; multiple unsuccessful AVF creation
attempts; or, patient preference. The Renal Program is conscious of appropriate individualized
care, so while AVF’s are correlated with better patient outcomes, the program understands that
AVF’s for all patients is not always appropriate. The increase in prevalence of CVC is due to
many of the factors identified above and may be indicative of an older, more frail population on
dialysis.

P a g e | 8
Access Prevalence by Program Area
Vascular Access Related Interventions
The renal program through the vascular access nurse has developed a strong working relationship with
both vascular surgery and interventional radiology. These strong relationships have been essential in
providing safe, seamless, appropriate vascular access-related care and interventions.
Vascular Access Referrals and Surgeries
150
107 135 140
0
50
100
150
200
Referrals Surgeries
2011/12
2012/13
P a g e | 9
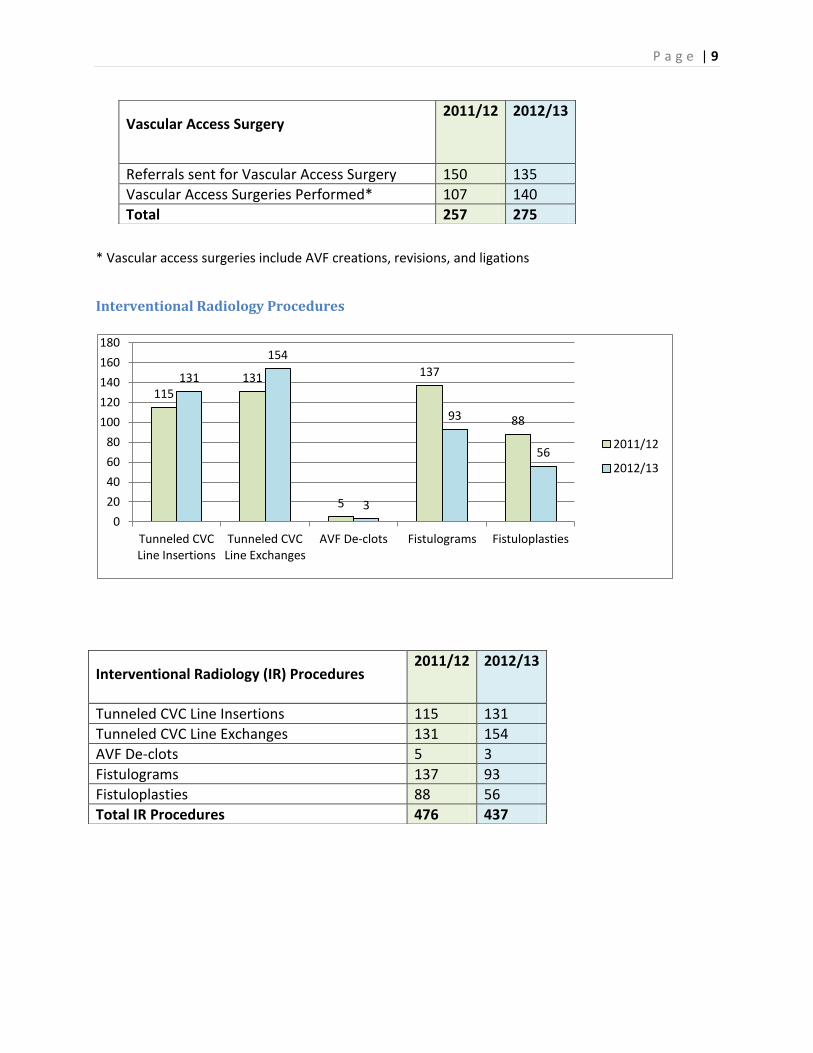
* Vascular access surgeries include AVF creations, revisions, and ligations
Interventional Radiology Procedures
115 131
5
137
88
131
154
3
93
56
0
20
40
60
80
100
120
140
160
180
Tunneled CVC Line Insertions
Tunneled CVC Line Exchanges
AVF De-clots Fistulograms Fistuloplasties
2011/12
2012/13
Vascular Access Surgery
2011/12 2012/13
Referrals sent for Vascular Access Surgery 150 135
Vascular Access Surgeries Performed* 107 140
Total 257 275
Interventional Radiology (IR) Procedures
2011/12 2012/13
Tunneled CVC Line Insertions 115 131
Tunneled CVC Line Exchanges 131 154
AVF De-clots 5 3
Fistulograms 137 93
Fistuloplasties 88 56
Total IR Procedures 476 437

P a g e | 10
Medication Usage Medication costs do not include Aranesp® or Eprex®, as these medications are covered by the
Department of Health and Wellness high cost drug program. These costs are displayed separately for the
Dickson and DGH In-Centre units.
Drug Costs in Hemodialysis Units 2006-2013
Unit Location 2006-2007 2007-
2008
2008-
2009 2009-2010
2010-
2011
2011-
2012
2012-
2013
QEII $651,463 $774,431 $719,033 $1,205,459 $832,377 $742,174 $766,662
DGH $56,620 $124,446 $179,603 $138,843 $118,570 $106,998 $139,340
$0
$200,000
$400,000
$600,000
$800,000
$1,000,000
$1,200,000
$1,400,000
2006-2007 2007-2008 2008-2009 2009-2010 2010-2011 2011-2012 2012-2013
Drug Costs in Hemodialysis Units QEII
DGH

P a g e | 11
DGH Medication Trends
$0
$10,000
$20,000
$30,000
$40,000
$50,000
$60,000
$70,000
$80,000
Alteplase Iron Sucrose Heparin Iron Dextran Sodium Citrate
Calcitriol Sodium Thiosulfate
Top $ Drugs in DGH Hemodialysis Unit 2006-2007 2007-2008 2008-2009 2009-2010 2010-2011 2011-2012 2012-2013
Drug $ Trending in DGH Hemodialysis Unit 2006-2013
DRUG 2006-
2007
2007-
2008
2008-
2009
2009-
2010
2010-
2011
2011-
2012 2012-2013
Alteplase $8,001 $20,032 $60,736 $70,592 $65,024 $57,152 $62,464
Iron Sucrose $13,125 $21,375 $31,088 $29,812 $23,775 $18,075 $28,200
Heparin $6,479 $8,294 $15,033 $6,322 $4,525 $2,894 $11,874
Iron Dextran $8,704 $8,850 $7,460 $8,921 $9,740 $14,411 $10,604
Sodium Citrate $0 $0 $0 $3,831 $6,591 $6,449 $7,384
Calcitriol $774 $2,322 $5,169 $5,255 $4,031 $2,108 $1,061
Sodium Thiosulfate $8,602 $43,471 $49,097 $5,839 $0 $0 $0

P a g e | 12
Dickson Medication Trends
$0
$50,000
$100,000
$150,000
$200,000
$250,000
$300,000
$350,000
$400,000
$450,000
$500,000
Alteplase Iron Sucrose Heparin Sodium Citrate Iron Dextran
Top 5 Drugs in QEII Hemodialysis 2006-2007
2007-2008
2008-2009
2009-2010
2010-2011
2011-2012
2012-2013
Drug $ Trending in Dickson Hemodialysis Unit 2002-2013
DRUG 2006-2007
2007-2008
2008-2009
2009-2010
2010-2011
2011-2012
2012-2013
Alteplase $264,331 $333,312 $326,278 $397,254 $374,720 $378,240 $442,368
Iron Sucrose $44,025 $54,188 $79,238 $75,150 $69,525 $56,888 $119,850
Heparin $73,228 $76,868 $75,929 $34,345 $32,325 $37,606 $58,632
Sodium Citrate $0 $0 $0 $31,158 $46,402 $53,799 $48,840
Iron Dextran $55,042 $60,000 $64,144 $54,844 $65,520 $73,965 $39,778
Sodium Thiosulfate $157,539 $173,344 $97,328 $358,446 $140,306 $88,664 $13,115
Danaparoid $17,233 $24,783 $30,777 $2,359 $13,365 $11,990 $9,518
Calcitriol $8,041 $8,806 $15,682 $12,258 $9,274 $4,637 $5,187
Bacitracin-Gramicidin-Polymyxin Oint
$11 $6,275 $7,574 $7,256 $8,925 $6,709 $4,368
Vancomycin $3,231 $3,236 $3,153 $3,759 $3,562 $2,783 $3,615
Water for Injection $2,167 $2,469 $2,664 $3,475 $3,134 $2,977 $3,338
Cefazolin $2,044 $1,629 $2,258 $2,141 $2,122 $2,261 $1,469
Pentamidine $753 $893 $0 $893 $893 $1,208 $1,387
Desmopressin $1,196 $382 $704 $820 $9,387 $4,468 $855
Tuberculin $272 $650 $739 $1,899 $1,046 $1,281 $273

P a g e | 13
ESA Therapy
Darbepoetin and Epoetin Usage in QEII Hemodialysis
2011/12 2012/13
Darbepoetin Quantity Cost Quantity Cost
Darbepoetin 10mcg 118 $3,162.40 67 $1,795.60
Darbepoetin 20mcg 648 $34,732.80 560 $30,016.00
Darbepoetin 30mcg 341 $27,416.40 456 $36,662.40
Darbepoetin 40mcg 548 $58,745.60 420 $45,024.00
Darbepoetin 50mcg 492 $65,928.00 352 $47,168.00
Darbepoetin 60mcg 896 $144,076.80 776 $124,780.80
Darbepoetin 80mcg 876 $187,814.40 740 $158,656.00
Darbepoetin 100mcg 1424 $381,632.00 1332 $356,976.00
Darbepoetin 150mcg 1010 $406,020.00 924 $371,448.00
Darbepoetin Total 6353 $1,309,528.40 5627 $1,172,526.80
Epoetin Epoetin 10,000U 30 $4,275.00 31 $4,417.50
Epoetin 2000U 1 $28.50
Epoetin 3000U 6 $256.50
Epoetin 4000U 39 $2,223.00 90 $5,130.00
Epoetin 6000U 12 $1,026.00
Epoetin Total 69 $6,498.00 140 $10,858.50
Grand Total $1,316,026.40 $1,183,385.30
Darbepoetin and Epoetin Usage in DGH Hemodialysis
Darbepoetin 2011/12 2012/13
Quantity Cost Quantity Cost
Darbepoetin 10mcg 48 $1,286.40 114 $3,055.20
Darbepoetin 20mcg 146 $7,825.60 168 $9,004.80
Darbepoetin 30mcg 96 $7,718.40 114 $9,165.60
Darbepoetin 40mcg 152 $16,294.40 136 $14,579.20
Darbepoetin 50mcg 156 $20,904.00 144 $19,296.00
Darbepoetin 60mcg 178 $28,622.40 236 $37,948.80
Darbepoetin 80mcg 169 $36,233.60 219 $46,953.60
Darbepoetin 100mcg 308 $82,544.00 324 $86,832.00
Darbepoetin 150mcg 160 $64,320.00 161 $64,722.00
Darbepoetin Total 1413 $265,748.80 1616 $291,557.20
Epoetin
Epoetin 4000U 4 1607.40 24 $1,345.20
Epoetin 40 000U 66 $3,784.80
Epoetin Total 70 $5,392.20 24 $1,345.20
Grand Total $271,141.00 $292,902.40

P a g e | 14
Renal Clinic Statistics The Renal Clinic follows patients with Chronic Kidney Disease (CKD) stage 3, 4, or 5. The Multidisciplinary
clinic provides care for new referrals with CKD, maintenance care for patients with CKD, group teaching
sessions and one on one teaching sessions, when appropriate.
Referrals to the Renal Clinic
All Referrals received by the renal clinic are triaged by a nephrologist, and assigned a level of urgency,
based on the information provided with the assessment. Levels of urgency, or priority targets, are as
follows:
P1: Seen by a Nephrologist within 7 days P2: Seen by a Nephrologist within 1 month P3: Seen by a Nephrologist within 3 months P4: Seen by a Nephrologist within 1 year
Referrals to Renal Clinic by level of Priority
65
293
507
161
74
281
507
158
0
100
200
300
400
500
600
P1 P2 P3 P4
2011/12
2012/13
Referrals to Renal Clinic
Priority/ Quarter
2011/12 2012/13
P1 P2 P3 P4 Total P1 P2 P3 P4 Total
Q1 14 79 114 21 228 21 63 151 45 280
Q2 20 73 135 46 274 20 76 124 31 251
Q3 13 75 112 50 250 15 67 112 46 240
Q4 18 66 146 44 274 18 75 120 36 249
Total 65 293 507 161 1026 74 281 507 158 1020

P a g e | 15
New Visits to the Renal Clinic
New Visits to Renal Clinic
2011/12 2012/13
P1 P2 P3 P4 Total P1 P2 P3 P4 Total
Q1 14 83 55 0 152 20 56 128 6 210
Q2 19 82 79 0 180 17 61 96 4 178
Q3 12 63 167 2 244 15 61 99 1 176
Q4 16 71 101 27 215 18 66 1 3 164
Total 61 299 402 29 791 70 244 400 14 728
Appointments in the Renal Clinic
61
299
402
29
70
244
400
14
0
50
100
150
200
250
300
350
400
450
P1 P2 P3 P4
2011/12
2012/13
36
04
38
7
41
7
21
9
29
1
20
14
9
33
79
36
5
27
3
13
6
26
4
29
0
0
500
1000
1500
2000
2500
3000
3500
4000
2011/12
2012/13

P a g e | 16
Appointments in Renal Clinic 2011/12 2012/13
Total Number of Visits to Nephrologists (new and returning) 3604 3379
Total Number of Visits to Nurse Practitioners 387 365
Total Number of Visits to Renal Dietician 417 273
Total Number of Visits for Education Classes 219 136
Total Number of Visits for 1:1 Nursing Assessments or teaching 291 264
Total Number of Visits to Research Nurse 20 29
Total Number of Visits (attending not specified) 149 N/A
Total Number of Visits to Renal Clinic 5087 4446
PD Catheter Surgeries
PD Catheter Surgeries 2011/12 2012/13
New PD Catheter Insertions 39 40
PD Catheter Removals 23 7
PD Catheter Exchanges 3 0
PD Catheter Repositionings 2 2
Total PD Catheter Surgeries 67 49
39
23
3 2
40
7
0 2
0
5
10
15
20
25
30
35
40
45
New PD catheter insertions
PD catheter removals PD catheter exchanges
PD catheter repositionings
2011/12
2012/13

P a g e | 17
PD Average Wait Times
The PD access nurse tracks and reports all consults for PD catheters and PD catheter insertions. Below is
the mean wait time in days for ‘consult to clinic’, ‘clinic to OR’, and ‘OR to training’.
PD: Mean Wait Time in Days Q1 Q2 Q3 Q4
Consult to Clinic (Target 30 days) 19.7 32.6 17.9 20.1
Clinic to OR (Target 30 days) 31.6 32.1 31.4 32
OR to Training (target 35 days) 26.8 26.1 26.8 26.8
0
5
10
15
20
25
30
35
Q1 Q2 Q3 Q4
Consult to Clinic
Clinic to OR
OR to Training

P a g e | 18
Home and Satellite Dialysis Unit Statistics The Home and satellite dialysis unit provides education, training and support for patients who manage
their own dialysis treatments, either peritoneal dialysis or hemodialysis, in their home. After training,
the unit provides 24 hour on-call support for all dialysis-related issues with all home dialysis patients.
The home dialysis unit also oversees six satellite dialysis units, including staff education and training, as
well as assessment of patient suitability for home or satellite dialysis. The Home dialysis unit also
provides peritoneal dialysis training for patients in the Yarmouth and PEI Renal Programs, and also
supports PD patients in both programs through clinic visits.
Distribution of Home and Satellite Dialysis Patients
Distribution of Home and Satellite Dialysis Patients 2011/12 2012/13
Pts on Satellite HD at year end 112 117
Pts on Home hemodialysis at year end 17 19
Pts on PD at year end 59 56
Total number of patients followed by Home Dialysis unit (HHD, PD, and Satellite) at year end
188 192
Number of Home Visits
Home Visits 2012/13
Home Visits (HHD patients) 14
Home Visits (PD patients) 0
Total number of home visits (PD and HHD) 14
112
17
59
117
19
56
0
20
40
60
80
100
120
140
Satellite HD Home HD Home PD
2011/12
2012/13

P a g e | 19
Number of Teaching Days
Teaching Days 2011/12 2012/13
Total Number of Teaching Days (HHD) 199 306
Total Number of Teaching Days (PD) 285 199
Total number of Teaching Days (PD and HHD) 484 505
Number of Patients Who Initiated Training for Home Dialysis
Number of Patients Who Initiated Training HHD PD
Q1 7 8
Q2 2 14
Q3 4 12
Q4 5 13
Total 18 47 HHD: Patients may or may not have completed training successfully
PD: Training may be for CAPD or CCPD. Patients may or may not have completed training successfully.
199
285 306
199
0
50
100
150
200
250
300
350
Home HD PD
2011/12
2012/13
7
2
4 5
8
14
12 13
0
2
4
6
8
10
12
14
16
Q1 Q2 Q3 Q4
HHD
PD

P a g e | 20
Clinic Visits
Clinic Visits 2011/12 2012/13
Scheduled Clinic Visits (HHD and satellite HD) 275 291
Unscheduled Clinic Visits (HHD and satellite HD) 23 29
Scheduled Clinic Visits (PD) 229 167
Unscheduled Clinic Visits (PD) 99 50
Total Number of Clinic Visits (scheduled and unscheduled; PD and HD)
626 537
Phone Consults to Home Unit
Phone Consults Volume
HHD 315
PD 2004
Satellite Units 2670
Total 4989
*Not collected or registered prior to 2012/13
Peritonitis Rates for the Home Dialysis Unit
PD Infection Rate per patient months Program Target 2011/12 2012/13
Peritonitis 1:36 1:29.4 1:41.4
Exit Site Infection 1:48 1: 188.2 1:82.9
275
23
229
99
291
29
167
50
0
50
100
150
200
250
300
350
Scheduled HHD or satellite HD clinic
visits
Unscheduled HHD or satelltie HD Clinic
visits
Scheduled PD clinic visits
Unscheduled PD Clinic visits
2011/12
2012/13

P a g e | 21
Capacity Trends for Satellite Units Berwick 2012/13 Monthly Capacity Trends
* Maximum physical capacity 24 (6 stations, 6 days per week, 2 shifts per day)
Liverpool 2012/13 Monthly Capacity Trends
* Maximum physical capacity 24 (6 stations, 6 days per week, 2 shifts per day)
0
5
10
15
20
25
30
Ap
r-1
2
May
Jun
e
July
Au
gust
Sep
tem
ber
Oct
ob
er
No
vem
ber
Dec
emb
er
Jan
-13
Feb
ruar
y
Mar
ch
Target Capacity
Operating Capacity
Actual Capacity
0
5
10
15
20
25
30
Ap
r-1
2
May
Jun
e
July
Au
gust
Sep
tem
ber
Oct
ob
er
No
vem
ber
Dec
emb
er
Jan
-13
Feb
ruar
y
Mar
ch
Target Capacity
Operating Capacity
Actual Capacity
P a g e | 22
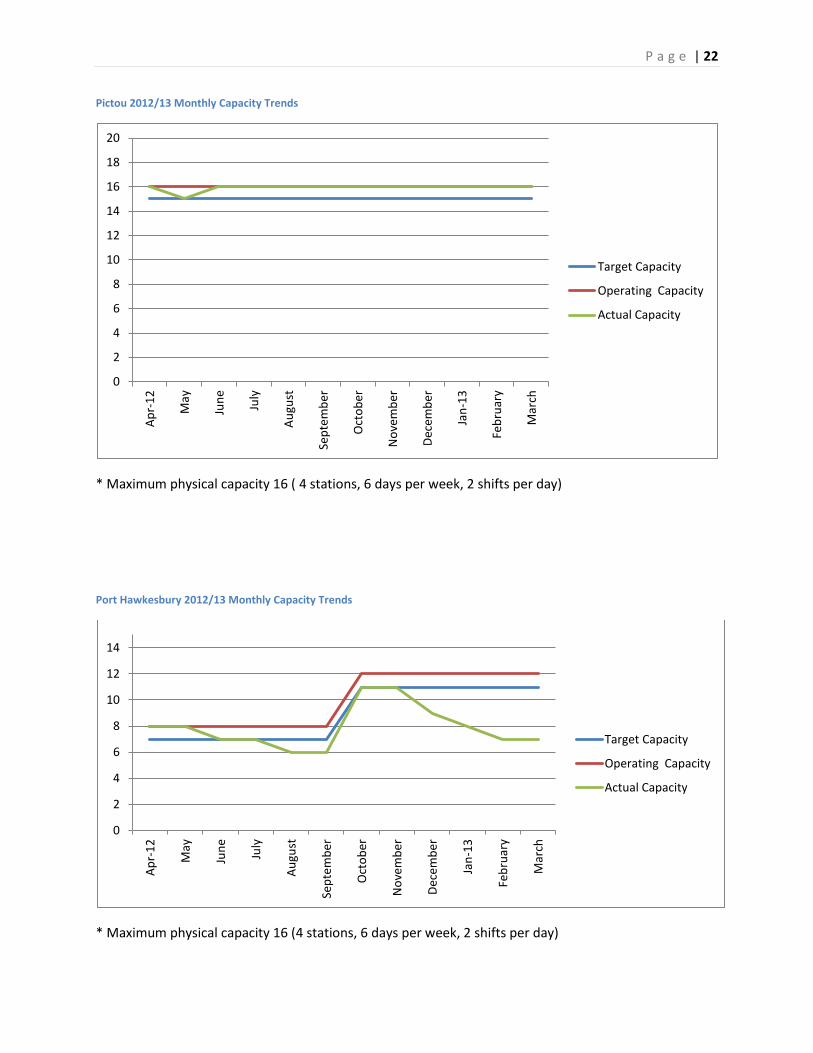
Pictou 2012/13 Monthly Capacity Trends
* Maximum physical capacity 16 ( 4 stations, 6 days per week, 2 shifts per day)
Port Hawkesbury 2012/13 Monthly Capacity Trends
* Maximum physical capacity 16 (4 stations, 6 days per week, 2 shifts per day)
0
2
4
6
8
10
12
14
16
18
20 A
pr-
12
May
Jun
e
July
Au
gust
Sep
tem
ber
Oct
ob
er
No
vem
ber
Dec
emb
er
Jan
-13
Feb
ruar
y
Mar
ch
Target Capacity
Operating Capacity
Actual Capacity
0
2
4
6
8
10
12
14
Ap
r-1
2
May
Jun
e
July
Au
gust
Sep
tem
ber
Oct
ob
er
No
vem
ber
Dec
emb
er
Jan
-13
Feb
ruar
y
Mar
ch
Target Capacity
Operating Capacity
Actual Capacity

P a g e | 23
Springhill 2012/13 Monthly Capacity Trends
* Maximum physical capacity 16 (4 stations, 6 days per week, 2 shifts per day)
Truro 2012/13 Monthly Capacity Trends
* Maximum physical capacity 40 starting December 2012 (6 stations, 6 days per week, 2 shifts per day)
0
2
4
6
8
10
12
14
16
18
20 A
pr-
12
May
Jun
e
July
Au
gust
Sep
tem
ber
Oct
ob
er
No
vem
ber
Dec
emb
er
Jan
-13
Feb
ruar
y
Mar
ch
Target Capacity
Operating Capacity
Actual Capacity
0
5
10
15
20
25
30
Ap
r-1
2
May
Jun
e
July
Au
gust
Sep
tem
ber
Oct
ob
er
No
vem
ber
Dec
emb
er
Jan
-13
Feb
ruar
y
Mar
ch
Target Capacity
Operating Capacity
Actual Capacity

P a g e | 24
Antigonish 2012/13 Monthly Capacity Trends
Antigonish is operated by Guysborough-Antigonish-Strait-Health-Authority (GASHA)
* Maximum Physical capacity 36 stations (9 stations, 3 days per week, 2 shifts per day)
0
2
4
6
8
10
12
14
16
18
20
Ap
r-1
2
May
Jun
e
July
Au
gust
Sep
tem
ber
Oct
ob
er
No
vem
ber
Dec
emb
er
Jan
-13
Feb
ruar
y
Mar
ch
Target Capacity
Operating Capacity
Actual Capacity

P a g e | 25
In-Centre Hemodialysis Unit
Unit Capacity
The in-Centre renal hemodialysis unit (RDU) is the largest hemodialysis unit in Nova Scotia. The unit
provides treatment for chronic hemodialysis patients, and also provides support for the satellite, home
dialysis, and PD patients requiring re-assessment or short-term in-centre treatments. As CDHA is a
quaternary institution and transplant centre for Atlantic Canada, the in-centre unit also provides
hemodialysis treatments to chronic hemodialysis patients from other programs in NS or other Atlantic
Canada programs who require the specialized services offered at CDHA. The scope of responsibility of
the in-centre hemodialysis unit requires flexibility to accommodate these needs, and as such strives to
operate at 85% capacity.
The unit operated at over 100% capacity of approved hemodialysis stations for each month of the 2011
fiscal year. In 2011, the provincial government announced funding for the planning of an expansion of
six hemodialysis stations. This expansion will increase the number of approved stations from 34 to 40,
and subsequently increase the daily capacity from 102 treatments to 120 treatments.
Capacity limits are calculated by multiplying the number of approved of stations (34) by 3 shifts per day
to determine the daily capacity. As the unit operates two different schedules (Monday, Wednesday,
Friday, OR Tuesday, Thursday, Saturday), the maximum unit capacity is achieved by multiplying the daily
capacity by 2. Actual capacity= (34 X 3) X2. Actual capacity is 204 spaces.
Quarterly Capacity RDU Dickson Trends 2011/12-2012/13
0
50
100
150
200
250
Q1
20
11
Q2
20
11
Q3
20
11
Q4
20
11
Q1
20
12
Q2
20
12
Q3
20
12
Q4
20
12
Target (173.4)
100% Capacity (204)
Actual Capacity
P a g e | 26
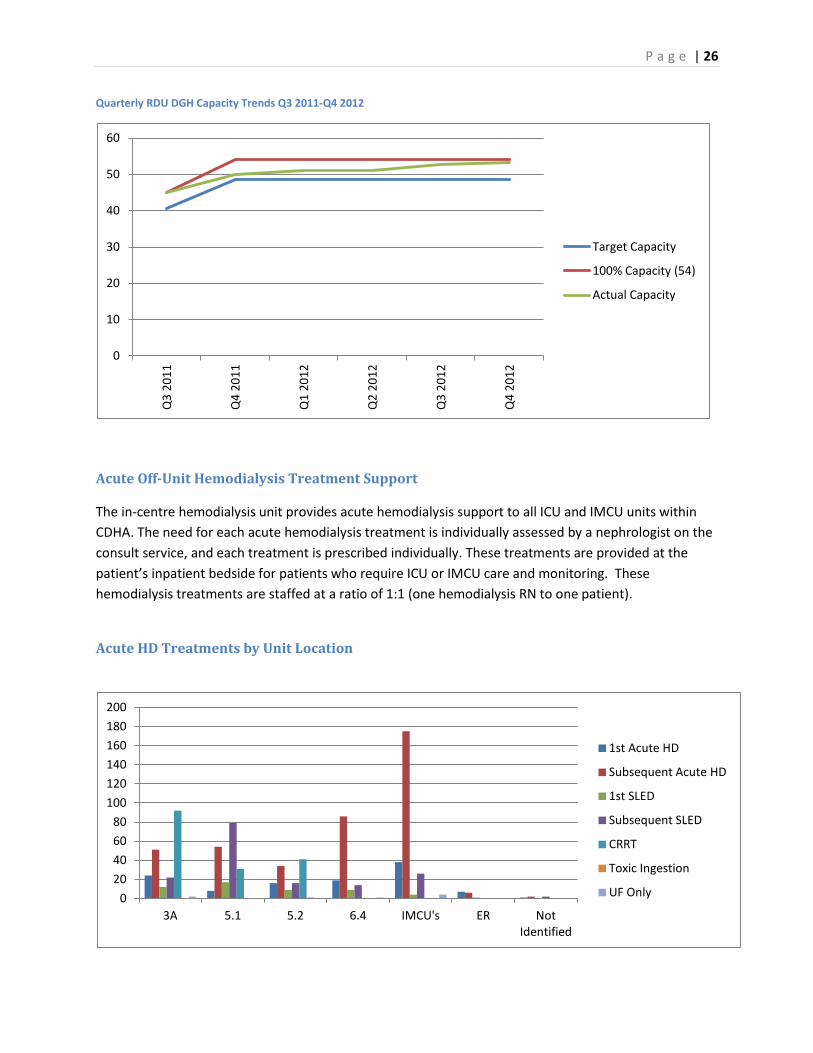
Quarterly RDU DGH Capacity Trends Q3 2011-Q4 2012
Acute Off-Unit Hemodialysis Treatment Support
The in-centre hemodialysis unit provides acute hemodialysis support to all ICU and IMCU units within
CDHA. The need for each acute hemodialysis treatment is individually assessed by a nephrologist on the
consult service, and each treatment is prescribed individually. These treatments are provided at the
patient’s inpatient bedside for patients who require ICU or IMCU care and monitoring. These
hemodialysis treatments are staffed at a ratio of 1:1 (one hemodialysis RN to one patient).
Acute HD Treatments by Unit Location
0
10
20
30
40
50
60
Q3
20
11
Q4
20
11
Q1
20
12
Q2
20
12
Q3
20
12
Q4
20
12
Target Capacity
100% Capacity (54)
Actual Capacity
0
20
40
60
80
100
120
140
160
180
200
3A 5.1 5.2 6.4 IMCU's ER Not Identified
1st Acute HD
Subsequent Acute HD
1st SLED
Subsequent SLED
CRRT
Toxic Ingestion
UF Only

P a g e | 27
Acute HD Treatments by Unit Location
Treatment
Type/
Location
1st
Acute
HD
Subsequent
Acute HD
1st
SLED
Subsequent
SLED
CRRT* Toxic
Ingestion
UF
Only
Total
3A 24 51 12 22 92 0 2 203
5.1 8 54 17 79 31 0 0 189
5.2 16 34 9 16 41 1 0 117
6.4 19 86 9 14 0 0 1 129
IMCU’s 38 175 4 26 0 0 4 247
ER 7 6 1 0 0 0 0 14
Not
Identified
1 2 0 2 0 0 0 5
Total 113 408 52 159 164 1 7 904
* CRRT treatments are performed by the ICU bedside RN, not by a hemodialysis unit RN
**CRRT data from ICU database
Bacteremia Rates for RDU Dickson (2012 Calendar year)
Bacteremia in hemodialysis patients is a serious event that impacts the health status of persons on
dialysis and requires many interventions including lab specimens, administration of antibiotics, potential
hospital admission, and possibly interventions to exchange catheters. For many years the Dickson
dialysis unit has worked closely with Infection Control at CDHA to monitor bacteremia, as well as
investigate possible causes. CDHA Renal Program targets for Bacteremia are:
1.2 infections per 1000 line days for tunneled CVCs
0 infections for AVFs
2.2 infections per 1000 line days for non-tunneled CVCs
0.0
0.2
0.4
0.6
0.8
1.0
1.2
Jan Feb Mar Apr May Jun Jul Aug Sept Oct Nov Dec
Rat
e /
10
00
Lin
e d
ays
2012 RDU Tunneled Line Infection Rates
Tunneled Line Infection Rates

P a g e | 28
Tunnel Line Infections
(Target: 1.2 infections per 1000 line days)
2012 Jan Feb Mar Apr May Jun Jul Aug Sept Oct Nov Dec
# of Infections 0 2 2 3 4 2 3 4 2 1 0 1
# of Line Days 4240 4033 4289 4285 3777 4114 4127 4250 4066 4170 3933 3797
Infection Rate
per 1000 days 0.0 0.5 0.5 0.7 1.1 0.5 0.7 0.9 0.5 0.2 0.0 0.3
AVF Infections
(Target: 0 infections)
2012 Jan Feb Mar Apr May Jun Jul Aug Sept Oct Nov Dec
# of Infections 0 0 0 0 0 0 0 0 0 1 0 0
# of Fistula
Days 1705 1584 1571 1760 1636 1674 1612 1781 1612 1676 1738 1716
Infection Rate
per 1000 days
0.0 0.0 0.0 0.0 0.0 0.0 0.0 0.0 0.0 0.6 0.0 0.0
0.0
0.2
0.4
0.6
0.8
Jan Feb Mar Apr May Jun Jul Aug Sept Oct Nov Dec
Rat
e /
10
00
fis
tula
day
s
RDU 2012 Fistula Infection Rates
Fistula Infection Rates

P a g e | 29
Non tunneled line Infections (Target: 2.2 infections per 1000 line days)
2012 Jan Feb Mar Apr May Jun Jul Aug Sept Oct Nov Dec
# of Infections 0 0 0 0 0 0 0 0 0 0 1 0
# of Non tunnel line days Days
186 232 224 216 235 171 202 227 288 310 284 228
Infection Rate per 1000 days
0.0 0.0 0.0 0.0 0.0 0.0 0.0 0.0 0.0 0.0 3.5 0.0
0.0
1.0
2.0
3.0
4.0
Jan Feb Mar Apr May Jun Jul Aug Sept Oct Nov Dec
Rat
e /
10
00
no
n t
un
ne
l lin
e
day
s RDU 2012 Non tunneled Line Infection Rates
Non-Tunneled Infection Ratees

P a g e | 30
Balanced Scorecard
The balanced scorecard is a quality communication tool that was developed by Capital District Health
Authority to be a template for quality work and reporting. The framework for the scorecard is grounded
in the five milestones: Person-Centered Health Care; Citizen Engagement; Transformational Leadership;
Innovative Health and Learning; and, Sustainability. The balanced scorecard meets milestone and
accreditation requirements, and also allows for a showcase of unique quality initiatives. The balanced
scorecard also serves as a reporting template for bi-annual reports to the Renal Enabling Team and the
department of medicine quality and patient safety council. The scorecard is a living document and
evolves to meet the reporting and quality improvement needs of the program.
Indicator Q1 ‘12 Q2 ‘12 Q3 ‘12 Q4 ‘12
Person-Centered Care
Tunneled hemodialysis catheter <1.2 per 1000 catheter days
Non-Tunneled hemodialysis catheter <2.2 per 1000 catheter days
AVF 0%
Peritonitis 1:36 per PD month
PD exit site 1:48 per PD month
AVF: consult to clinic 80% <28 days
AVF: clinic to OR 80% <28 days
PD catheter consult to clinic 80% <30 days
PD catheter clinic to OR 80% <30 days
PD OR to teaching: 100% within 35 days
Very Urgent: 100% within 24 hours N/A N/A
Urgent: 100% within 7 days N/A N/A
Non-Urgent: 100% within 3 weeks N/A N/A
P1: within 7 days
P2: within 30 days
P3: within 90 days
P4: within 365 days
5. Wait times for home hemodialysis training will meet targets N/A N/A N/A N/A
In-Centre Dickson RDU N/A N/A In-Centre DGH N/A N/A 6B N/A N/A Satellites N/A N/A N/A C-Diff transmissions N/A N/A N/A MRSA transmissions on 6B N/A N/A N/A VRE transmissions on 6B N/A N/A N/A
Med Reconciliation RDU, satellites, DGH N/A N/A N/A N/A Med Rec 6B N/A N/A N/A N/A Falls Risk Assessments updated regularly N/A N/A N/A

P a g e | 31
Interventions for high falls risk patients implemented N/A N/A N/A TOA: Episodic Care N/A N/A N/A Patient and family role in safety verbally discussed and written
information provided
N/A N/A N/A
No Dangerous Abbreviations on chart N/A N/A N/A Consent for HD on Chart N/A N/A N/A Telephone Orders Co-Signed N/A N/A N/A 1. Patient Experience surveys will guide PDSA cycles of
improvement
2. Annual CDHA patient satisfaction surveys will be >90%
3. Patient and Family involvement in quality review will be evident
1. 100% of staff will receive performance evaluations by 2013. N/A N/A
2. Frontline staff will meet ‘my leadership’ targets by 2013. N/A N/A N/A N/A
3. 90% of formal leaders consistently demonstrate the
competencies of ‘my leadership’.
4. Staff experience surveys will guide PDSA cycles of improvement.
1. Content of staff ed days will be guided by yearly competencies
and staff surveys.
2. Modality Questionnaires guide renal education in clinic. N/A N/A
3. Self-care in-centre will expand to 9 patients by the end of 2012.
4. PATH Clinic offers decision support to frail elderly adults who
may not benefit from conventional Renal Replacement Therapy.
N/A N/A
1. HD in-centre Dickson will run at 85% capacity.
2. HD in-centre DGH will run at 90% capacity.
3. Satellite units will operate with 1-2 empty stations with no
patients on the wait list
Berwick
Liverpool
Pictou
Port Hawkesbury
Springhill
Truro
Antigonish
Sherbrooke N/A N/A N/A
4. 6B inpatient nephrology will operate at 85% capacity
20% of all dialysis patients on a home therapy by the end
of 2012
25% of all dialysis patients on a home therapy by the end
of 2015
N/A N/A N/A N/A

P a g e | 32
Accreditation 2013 The Renal Program Accreditation team evolved into the renal program quality and patient safety team
(Q&PS) in September of 2011. While accreditation remains a component of the group, the group also
focuses on ongoing quality and patient initiatives. This transition shifts accreditation requirements from
a cyclical nature to an ongoing philosophy and practice.
The Quality and Patient Safety Team, in preparation for the upcoming Accreditation has developed
action plans based on feedback from staff in the form of the worklife pulse survey and the patient safety
culture survey. These action plans are aimed at improving communication within the program as well as
to increase awareness of patient safety.
A change for the 2013 Accreditation process is a change from Medicine Services to Ambulatory Care
Services. The rationale for this change is that the program felt the ambulatory care standards were more
appropriate for the program.
Ambulatory Medication Reconciliation is a requirement for the 2013 Accreditation. Ambulatory
Nephrology has volunteered and will be the CDHA pilot for Ambulatory Medication Reconciliation at
Admission. The program is fortunate to have Dr. Jo-Anne Wilson and Marsha Wood NP lead this
important work.
P a g e | 33
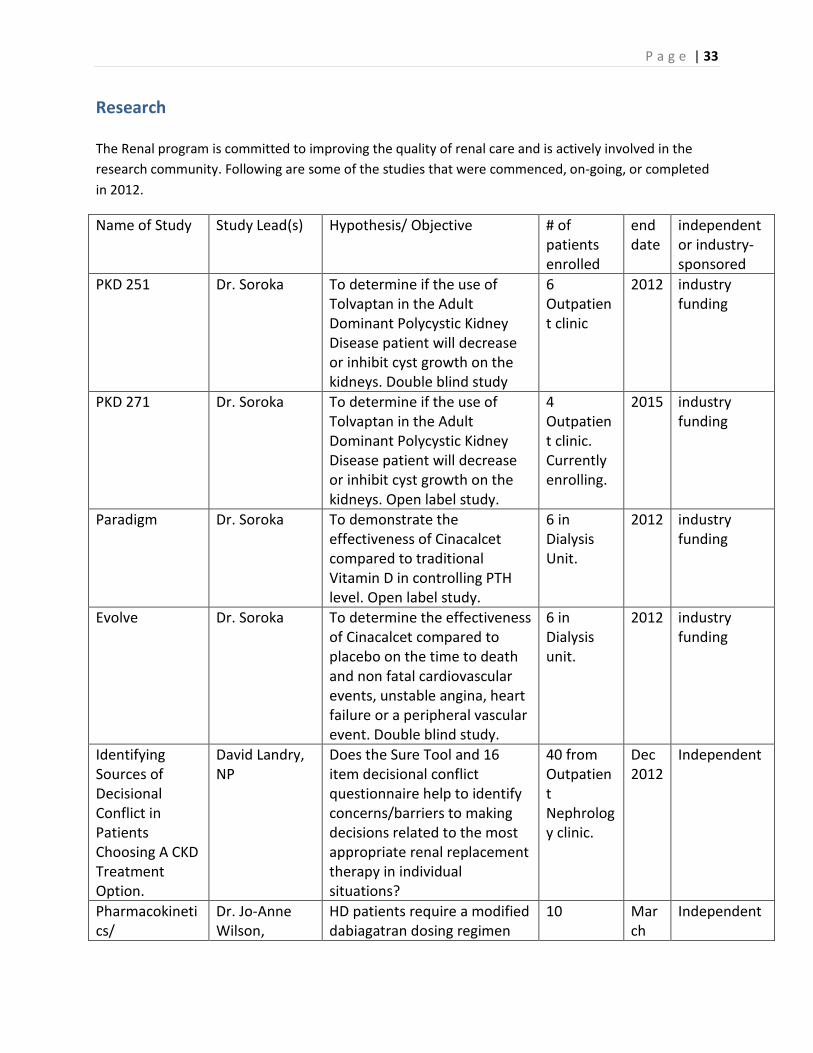
Research The Renal program is committed to improving the quality of renal care and is actively involved in the
research community. Following are some of the studies that were commenced, on-going, or completed
in 2012.
Name of Study Study Lead(s) Hypothesis/ Objective # of patients enrolled
end date
independent or industry-sponsored
PKD 251 Dr. Soroka To determine if the use of Tolvaptan in the Adult Dominant Polycystic Kidney Disease patient will decrease or inhibit cyst growth on the kidneys. Double blind study
6 Outpatient clinic
2012 industry funding
PKD 271 Dr. Soroka To determine if the use of Tolvaptan in the Adult Dominant Polycystic Kidney Disease patient will decrease or inhibit cyst growth on the kidneys. Open label study.
4 Outpatient clinic. Currently enrolling.
2015 industry funding
Paradigm Dr. Soroka To demonstrate the effectiveness of Cinacalcet compared to traditional Vitamin D in controlling PTH level. Open label study.
6 in Dialysis Unit.
2012 industry funding
Evolve Dr. Soroka To determine the effectiveness of Cinacalcet compared to placebo on the time to death and non fatal cardiovascular events, unstable angina, heart failure or a peripheral vascular event. Double blind study.
6 in Dialysis unit.
2012 industry funding
Identifying Sources of Decisional Conflict in Patients Choosing A CKD Treatment Option.
David Landry, NP
Does the Sure Tool and 16 item decisional conflict questionnaire help to identify concerns/barriers to making decisions related to the most appropriate renal replacement therapy in individual situations?
40 from Outpatient Nephrology clinic.
Dec 2012
Independent
Pharmacokinetics/
Dr. Jo-Anne Wilson,
HD patients require a modified dabiagatran dosing regimen
10 March
Independent

P a g e | 34
Pharmacodynamics with Oral Dabigatran Etexilate in Hemodialysis
Dr.Steven Soroka, Dr. Kerry Goralski, Paula Mossop, Dr. David Anderson, Dr. Lekha Sleno, Matthew Morrison.
compared to individuals with normal renal function due to altered pharmacokinetic and pharmacodyanmic parameter.
2013
Determination of rates and factors affecting seroconverson from Hepatitis B vacine in predialysis and peritoneal dialysis patients compared to Hemodialysis.
Dr. Jo-Anne Wilson, Dr. Steven Soroka, Susan Fleet, Cindy Everette, Dr. Hirsh and Dr. Finkle
Immunizing patients with chronic kidney disease before they require dialysis may result in higher rates of seroconversion.
60 to date Ongoing
Independent
Evaluation and validation of a hemodialysis central venous catheter (CVC) dsfunction protocol for administering Alteplase (Cathflo)
Dr. Jo-Anne Wilson, Paula Mossop, Dr. Steven Soroka
To determine if a new CVC dysfunction protocol may result in improved short-term and long-term success as it relates to catheter patency and timing of alteplase intervention.
22 patients at DGH dialysis site
May 2013
Independent
Validation of a model for outpatient management of warfarin sodium pre/post interventional radiology procedures in
Paula Mossop, Dr. Jo-Anne Wilson, Dr. Soroka, Dr. Dipchand, Dr. Brown.
To evaluate the effectiveness and safety of a HD perioperative anticoagulation protocol for patients at low risk for Thromboemoblic complications who require temporary interruption of warfarin sodium for IR proecedures.
7 patients/9 interventions to date
Ongoing
Independent

P a g e | 35
low risk hemodialysis patients.
BH4 Dr. M. West Study of tetrahydrobiopterin (BH4) blood levels to confirm earlier observation that levels are low in Fabry disease.
40+ open
Investigator sponsored
CFSSI: Canadian Fabry Stroke Screening Initiative
Dr. M. West Study of idiopathic stroke pts 18-55 yrs in Canada with DNA analysis to screen for Fabry disease as a cause.
7+ 2014 Investigator sponsored with a grant from Shire HGT
Fabry Alopecia Study
Dr. M. West Study of male pattern baldness in Fabry men to determine if hair loss pattern is less severe compared with age matched controls.
20 open
Investigator sponsored
FOS: Fabry Outcome Survey
Dr. M. West Registry study collecting clinical data on Fabry patients.
72+ open
Shire HGT
Fabry Registry Dr. M. West Registry study collecting clinical data on Fabry pts.
76+ open
Genzyme
Gene Transfer Therapy in Fabry Disease
Dr. M. West A pilot gene therapy clinical study directed towards amelioration of Fabry disease in men using Lentivirus-transduced, autologous CD34+ stem cells will demonstrate safety and feasibility.
0 2017 CIHR sponsored
REP-081 Dr. M. West A phase III clinical trial to determine the safety of a new form of agalsidase-alfa enzyme replacement therapy in Fabry disease.
20 open
Shire HGT
REP-082 Dr. M. West A phase III pharmaco-dynamic pharmacokinetic study of agalsidase-alfa enzyme replacement therapy in Fabry disease.
8 2013 Shire HGT
IGNITE (Orphan Diseases: Identifying
Dr. M. West A sub-study in the Ethical, Economic, Environmental, Legal and Social Aspects of Genomics (GE3LS) component,
0 2015 Genome-Canada

P a g e | 36
Genes and Novel Therapeutics to Enhance Treatment)
which examines the attitudes to genetic testing of adults with hypertrophic cardiomyopathy being screened for Fabry disease.
ARISE (Acid Lipase Replacement Investigating Safety and Efficacy)
Dr. M. West LAL-CL02 A phase II multi-center, randomized, placebo controlled study of SBC-102 lipase replacement in adults with cholesterol ester storage disease
0 2016
Synageva BioPharma

P a g e | 37
Initiatives
Program newsletter
Under the leadership of Sohani Welcher, NP, a program newsletter was developed and
distributed to the program with positive feedback. A contest is currently underway to name the
newsletter. The newsletter will continue to be distributed quarterly, and will meet one of the
requirements for the Quality and Patient Safety Team action plans to address the ‘worklife
pulse’ and ‘patient safety culture’ surveys.
Capital Health Quality Summit
The Renal program was well-represented at this year’s quality summit. Out of approximately
fifty posters accepted at the summit, six were presented by members of the nephrology team
including:
Evaluation of Oral Dabigatran Etexilate Pharmacokinetics and Pharmacodynamics in
Hemodialysis- Jo-Anne Wilson, Kerry Goralski, Steven Soroka, David Anderson, Paula Mossop,
Matthew Morrison, Lekha Sleno
A Model for Outpatient Management of Anticoagulation Pre - Post Interventional Radiology
Procedures in Hemodialysis Patients- Paula Mossop, Jo-Anne Wilson, Steven Soroka, Christine
Dipchand, Peter Brown
Peritonitis Culturing - Implementing a change in Protocol Using a Quality Improvement
Framework- Matt Phillips, Colleen Wile, Joan Tompkins, Neil Finkle
A model for outpatient Hepatitis B Vaccination for patients with chronic kidney disease in Nova Scotia- Susan Betts, Jo-Anne Wilson, Cindy Everett, Cindy Douglas, Lori Paruch, Barb Hirtle, Matt Phillips, Adam Fahie, Neil Finkle, David Hirsch, Steven Soroka Improving the Quality of Care Delivered and the Patient Experience of the First Hemodialysis Treatment- Risa LeBlanc, Rachel Wells, Carolyn Bartol, Norma Jean Martel, Matt Phillips Evaluation of Hemodialysis Central Venous Catheter (CVC) Protocol- Paula Mossop, Jo-Anne Wilson, Niall Sheehy, Jeanette Squires, David Hirsch, Steven Soroka Congratulations to all presenters for their great work!

P a g e | 38
PATH Clinic Wins Award
David Landry, NP, initiated the Renal PATH clinic about a year ago based on the model
developed by Drs. Laurie Mallery and Paige Moorhouse. PATH, which stands for Palliative and
Therapeutic Harmonization, is a program that helps identify frailty in elderly patients and helps
the patient’s families and caregivers make health-care decisions that are in the best interests of
the patient and lead to the best quality of life.
David joined Drs. Mallery and Moorehouse earlier this year in accepting two prestigious
national health care awards. June 9 they received a 3M Health Care Quality Team Award, in the
category of Programs and Processes in a Non-acute Care Environment. Earlier this year
they received a Public Sector Leadership Award - gold in the health category - from the Institute
of Public Administration of Canada for their work with the PATH program.
Self-Care In-Center Hemodialysis
Self-care in-centre continues to be established, and offers patients an option to participate partially or
fully in their own care in a controlled, supervised setting. This treatment option is a collaborative effort
between the home dialysis unit that provides education and training for the dialysis patient, the in-
centre unit that reinforces education and monitors treatments, and the patients who are actively
participating as members of their own care team.
Exercise on Hemodialysis
In collaboration with the Dalhousie school of Physiotherapy, the in-centre hemodialysis unit facilitated
an exercise program with one hemodialysis patient. The program consisted of pre and post assessments,
individualized exercise plan using a stationary bike while on dialysis, and pre and post quality of life
surveys. This project was initiated because of the dedication and advocacy of two dialysis patients, as
well as collaborative team work between the dialysis patients, Professional Practice, Dalhousie School of
Physiotherapy, and members of the nephrology team led by Marsha Wood, Carolyn Bartol, and Norma
Jean Martel. The Renal program is attempting to continue this great work and has applied for a grant for
another stationary bike. The program will continue to build relationships with collaborative partners to
develop and maintain initiatives that benefit the lives of patients with Chronic Kidney Disease.
Dialyzer Change for Hemodialysis
Mid way through the 2012/13 year the contract for dialyzers expired. The new dialyzer contract
will result in savings of approximately 50%.

P a g e | 39
Quality Care Teams
Renal Program Quality and Patient Safety
Description of Team:
The team is multidisciplinary and has membership from all program areas, all health care
professionals as well as patient experience advisors. The team evolved from the Accreditation
team in 2011, and has a focus on quality of care delivered and patient safety. The team has
developed a scorecard, and uses it to report to the Renal Enabling Team as well as the Medicine
Quality and Patient Safety Team.
Highlights:
The scorecard continues to evolve to showcase program initiatives as well as to organize quality
reports.
The Renal Program will be developing and piloting Ambulatory Medication Reconciliation at
Admission for Capital Health.
Accreditation will be occurring in October 2013, and the team has developed and is conducting
multiple Required Organizational Practices (ROP) audits, as well as regular communication to
the program.
The team has also developed action plans based on the information provided by two surveys
completed by staff (‘Work Life Pulse’ and ‘Patient Safety Culture’). The action plans include
quarterly dissemination of incidents reported through the Patient Safety Reporting System
(PSRS), PSRS tutorial at the fall education days, the development of a quarterly newsletter to
improve communication in the program, and bi-annual leadership safety rounds (bi-annual
safety rounds has yet to be approved by the Renal Enabling Team).
Future Initiatives:
Accreditation 2013 will occur at the end of October and beginning of November. Preparations
are underway, and will continue and include regular communication with the program, ROP
audits, a mock Accreditation survey, and education sessions at the fall education days.
The Scorecard will continue to evolve to meet the reporting and quality improvement needs of
the program.
Submitted by Matt Phillips

P a g e | 40
Anemia Management Quality Team (AMQT)
Description of Team:
This team is comprised of membership from medicine, nursing and pharmacy with representatives from Nephrology Clinic, Home Unit, In-Centre VG and DGH Hemodialysis and the Community Dialysis Units. The purpose of this team is to make evidence and practice based recommendations regarding anemia management and to evaluate anemia targets in all areas of the CDHA renal program.
Highlights:
• Implementation of changes to the timing and frequency of measuring iron studies were made based on current clinical practice guidelines as well as data collected from a program survey and other Canadian renal programs.
• Quarterly anemia reports have been tailored to provide clinicians with the following information:
o Site specific (e.g., Nephrololgy Clinic, Home Unit, In-Centre VG and DGH
Hemodialysis and Community Dialysis Units) attainment of anemia targets.
o Number of hyporesponsive patients (Defined as: Aranesp dosage ≥ 300 mcg/month
and Tsat > 20% , Ferritin > 200 (HD) or > 100 (PD) and Hbg < 100 g/L).
o Number of patients on Aranesp medication with irons studies less than desired
anemia targets.
Future Initiatives:
• To update anemia management protocols in all areas the CDHA renal program with the upcoming 2013 Canadian Society of Nephrology commentary on the 2012 KDIGO anemia clinical practice guidelines in patients with chronic kidney disease.
• To develop single a pre-printed order for oral and intravenous iron to be used program
wide.
• To develop single a pre-printed order for erythropoietin therapy to be used program wide.
• To investigate the feasibility of a renal clinic anemia management protocol administered by
nursing staff.
• As a result of new labeling changes regarding intravenous (IV) iron which requires patients
to be monitored for 30 minutes post IV iron infusion, another future initiative is to
investigate the feasibility of administering IV iron in the renal clinic or home unit for
patients living locally who would otherwise be required to attend the hospital medical day
unit.
• In light of new concerns regarding erythropoietin stimulating agents (ESA), a review of
hyporesponsive patients will be conducted on a quarterly basis and a maximum dose will be
implemented as per 2013 CSN commentary recommendations.

P a g e | 41
• Patient education pamphlets will be developed for IV irons and ESA therapy.
Submitted by Dr. Jo-Anne Wilson
Kidney Patient Advocacy Committee (KPAC 3)
Description of Team:
KPAC3 is a group of kidney patients and family members which was formed in 2010. Initially,
the group came together as an ad hoc committee formed with the intention of petitioning the
government for funding for much needed improvements to our dialysis unit. As a result of that
task, we became a permanent group representing dialysis patients and their families. We meet
monthly with dialysis administration and staff with the goal of presenting ongoing patient
issues, in an effort to find the best possible solutions.
Highlights:
In the past year we have brought forward many patient & caregiver concerns, ranging from
problems with the televisions to privacy issues. As well, some of our members continue to
participate in other hospital committees including Accreditation and Quality and Patient Safety.
Future Initiatives:
Our primary focus continues to be patient advocacy by acting as liaison between patients and
staff. Our biggest concern is our ability to sustain this group, as we lose members due to moves,
deaths & inability to continue dialysis effectively.
Areas for Improvement:
Going forward we need to obtain representation from all of the dialysis shifts so that the
committee is able to continue in the most effective way possible.
Submitted by Don Codling
Mineral Metabolism
Description of Team:
The bone and mineral metabolism group was started 2010 and is made up of interested members of the
interdisciplinary team. The focus of the mineral bone disorder group continues to be on staff and patient
education.
Highlights:
Patient Education
Patient education display June 18-22, 2012, similar to health fair

P a g e | 42
Plans are underway for a “roving cart display”, an education opportunity that can be taken to the
patents and families in the dialysis unit. An evaluation by patients/families of this opportunity will be
completed to help inform future patient/family learning opportunities.
Food models have been purchased to assist with education.
Group is exploring ways to help motivate patients to achieve their BMM targets. The group is exploring a
voluntary participation “Rewards Program” program as a possible initiative. Discussion around the
following.
Opportunity 1: Patients fill in nephrology related crosswords/word finds and submit (with name
attached) for a chance to win a prize
Opportunity 2: Names of those with ”in target ” mineral metabolism labs names entered for a chance to
win a prize.
Opportunity 3: Names of those with the most improved labs names entered for a chance to win a prize.
Perhaps do draw 3-4 times per year with 2-3 10$ gift certificates (ie. Sobeys).
Staff education:
Resource/Tool Kits were compiled and distributed all units to assist staff with patient/family teaching
Education session “Secondary Hyperparathyroidism” presented by Dr. Poyah and Dr Wilson, March
21/13
Renal webpage is being used to post presentations and useful links to mineral metabolism resources.
Education Grant Sanofi-aventis: Monies from this fund have been used to purchase the food models,
Patient Education Resource Kits and will be used for other patient education initiative (Rewards
Program).
We welcome anyone with an interest in doing some work around this important area of practice. Our
meeting dates for the up-coming year are: Sept 23 and Nov 24 2013: 1400-1500, room 5132 Dickson
Respectfully submitted Marsha Wood
PD Quality
Description of Team:
The team is chaired by the Medical Director of Peritoneal Dialysis, and includes the peritoneal dialysis
access nurse, clinical nurse educator, health services manager, pharmacist, clinical leader home and
satellite dialysis unit, quality leader, and the PD desk nurse (home dialysis unit). The team meets
quarterly and reviews rates of peritonitis and exit site infections, as well as wait times for access clinic,
OR, and training.

P a g e | 43
Highlights of the Team:
The team presented a poster at CDHA Quality Summit that was also accepted at the National Canadian
Association of Nephrology Nurses and Technologists (CANNT) conference titled: Peritonitis Culturing:
Implementing a Change in Protocol Using a Quality Improvement Framework.
The team also changed its Peritoneal Dialysis Catheter function report from quarterly to annual to better
analyze catheter function trends.
Future Initiatives:
The team has been requested to extend the length of time between PD catheter insertion to training
from two weeks to six weeks. The team is currently collating baseline data.
Practice and Safety
Description of Team:
The practice and safety team is comprised of in-centre staff and focuses on workplace safety and
identifies challenges and opportunities for improvement. Meetings are monthly, and all staff are
welcome. Agenda items include standing items: Role of the Patient Care Coordinator (PCC); teamwork;
and, problems and possible solutions.
Highlights of the team:
In 2011, the team developed an improvement strategy to improve the compliance with the role of the
PCC. Staff surveys were completed, baseline trending was completed, and a review of literature was
conducted. The team subsequently adapted a charting documentation tool to guide the PCC review, as
well as provide the team a way to audit the process. Results at six months post implementation
demonstrated minor improvements in both outcome and process measures.
Future initiatives:
The team is continuing with small monthly audits of the role of the PCC and sharing results with staff.
The team has also begun to experiment with meeting times as well as locations to facilitate and
encourage staff involvement.
Professional Practice
Description of Team:
The team is chaired by the clinical leaders in the renal program, and has membership including frontline staff from many program areas, educators, nurse practitioner, and quality leader.
Highlights:
The Professional Practice Quality Team has improved the yearly competency assessment forms. These forms are mandatory for every front-line staff to complete on a yearly basis. During 2011, the team transferred the forms to an electronic survey format which facilitated tracking of who had completed the forms, as well as significantly reduced the time and effort required to collate the over two hundred forms yearly. Also, the team has been attempting to improve documentation practices within the

P a g e | 44
program. In an attempt to increase awareness in front-line staff of what is audited in documentation audits, each front-line staff member was asked to complete two chart audits. The completion rate for this was almost 100%. The conversion of both of these processes to electronic format has reduced approximately forty hours of manual data entry.
Future Initiatives:
The team will be continuing to evaluate and improve the use of electronic forms, as well as continue to target improved documentation.
Areas for Improvement:
A challenge for the Professional Practice Quality Team is that the renal program is spread out over
different geographical locations, including satellite units in rural NS, as well as the Dartmouth in-centre
dialysis unit. Also, despite having steady membership from the program areas, the team struggles with
attracting new members.
Vascular Access
Description of Team:
The Vascular Access Quality care Team has: established vascular access quality performance measurement indicators; established what information needs to be collected, on what frequency, and how reporting of identified quality indicators should be managed; identified, implemented, and monitored quality improvement initiatives through quarterly and annual reporting; and engaged renal program members in the collection and utilization of accurate, evidence- based practice. A close relationship remains ongoing between the Division of Nephrology and our Interventional Radiology colleagues as well as the dedicated surgeons involved with creating / revising AVF’s.
Highlights:
A patient education pamphlet was developed Hemodialysis Patients on Warfarin Who Need Interventional Radiology Procedures to correlate with the pre printed Order (PPO) developed for managing anticoagulation of low-risk patients going for an IR procedure. This has been developed to increase patient safety and also to establish consistency in practice. A poster presentation presented at Canadian Society of Nephrology (CSN) Annual meeting, CDHA Quality summit fair and the abstract was accepted at CANNT National October 2013. The prevalence of AVFs in the Renal program is at 43% which is at all time low within the program. One response to this low prevalence is the creation of a cannualtion focus group to discuss and identify ways we can support less experienced staff to continue to develop their cannulation skills and ways we can improve the process of cannulating challenging AV accesses.

P a g e | 45
The revised Hemodialysis Central Venous Catheter (CVC) Dysfunction protocol was rolled out in October 2012. Data was collected from the DGH site for a three month time period December 1, 2012 –March 1 2013 which will be evaluated. This quality assurance project will help evaluate the effectiveness of the revised protocol.
Future Initiatives:
Ongoing discussion looking at our AVF prevalence, vascular access at treatment initiation including if there was an AVF in place or if there was an ‘AVF-ever’ attempt. Respectfully submitted by Paula Mossop

P a g e | 46
Directions/Priorities for Future Planning
New Satellite Unit opens in Colchester East Hants Health Center In December 2012, a new 10-station satellite hemodialysis unit opened, replacing the existing 3-station
unit.
Expansion of Dickson Dialysis Unit
The design of a 12-station unit was completed. Currently the program is waiting for funding approval
from the Department of Health and Wellness (DOHW) for the detailed design, construction, and
operations of the new unit.
New Community Dialysis Unit in the Valley Regional Hospital
In the fall of 2012, the DOHW announced funding for the design phase of a new 12-station satellite
dialysis unit in the Valley Regional Hospital that will replace the existing 6-station unit in the Western
King’s Memorial Health Centre.
Expanding Home Therapies The renal program has developed a multi-pronged approach to expanding home therapies including the
production of a home dialysis educational video in the renal clinic, and a study measuring pre and post
scores of an educational intervention on the perceptions of home dialysis of in-centre hemodialysis unit
nurses.