renal program annual report 2013/2014 · renal program annual report 2013/2014 ... cindy everett,...
TRANSCRIPT
Renal Program Annual Report 2013/2014
Capital District Health Authority
Room 606 Dickson Building
5820 University Avenue
Halifax, Nova Scotia
Canada
B3H 1V8
Phone: (902) 473-7545
Fax: (902) 473-4168
www.cdha.nshealth.ca/renal-program
2013/14
P a g e | 2
Table of Contents
Executive Summary …………………………………………………………..………………………………….………. 3
Acknowledgments …………………………………………………………….……………………………….……….… 4
Program Statistics ……………………………………………………………………………………………..…….……. 5
Renal Clinic Statistics …....…………………………………………….…………………………………..………….. 15
Home and Satellite Dialysis Unit Statistics ……………………………..………………………..….……….. 19
In-Centre Hemodialysis Unit Statistics………………………………………………………………………..…. 26
Balanced Scorecard ………………………………………………….…………...…………………………………….. 32
Accreditation 2013 ……………………………………………………..…………………………………...………….. 35
Research ………………………………………………...…………...……………………………………………….…….. 36
Initiatives ………………………………………………………………..……………………………………………….….. 40
Quality Care Teams …………………………………………………….………………………………..……………….43
Directions/Priorities for future planning ……………………………….……………………………….…….. 51

P a g e | 3
Executive Summary
The Capital District Health Authority (CDHA) Renal Program’s vision of ‘Innovative Quality Renal Care’ is
achieved through its mission statement of ‘working with the health care system, its partners, patients
and families to achieve optimal integrated care through advocacy, education, research, and leadership’.
The Renal Program offers many services at many locations. Included are the Renal Clinic, Home and
Satellite Units, and the In-Centre hemodialysis (HD) units in Halifax at the Dickson centre and at the
Dartmouth General Hospital (DGH). The program is multidisciplinary and includes nephrologists, nurse
practitioners, a pharmacist, clinical nurse educators, registered nurses, licensed practical nurses,
dietitians, social workers, Information Technology (IT) systems analysts, clerical support, renal assistants,
biomedical technicians, a vascular access nurse, and Peritoneal Dialysis (PD) access nurse. The Renal
program maintains strong relationships with Inpatient Nephrology, Multi Organ Transplant Program,
Victorian Order of Nurses and Continuing Care, Interventional Radiology, Vascular Surgery, General
Surgery, the Nova Scotia Renal Program (NSRP), and the Cape Breton, Yarmouth, IWK, and Prince
Edward Island (PEI) Renal Programs. The program also supports the Guysborough Antigonish Strait
Health Authority (GASHA) and the Colchester East Hants Health Centre Satellite HD units.
The multidisciplinary Renal Clinic receives outpatient nephrology consultations, offers appointments
with nephrologists and nurse practitioners, and offers pre-dialysis education sessions and small group
education sessions. Key foci in the renal clinic are health promotion, slowing the progression of renal
disease, and supporting patients with decision-making as they near the need for dialysis or transplant.
The Home Dialysis Unit supports patients and their families to dialyze in the comfort and convenience of
their own home after completing education and training. For patients performing PD or home
hemodialysis (HHD) in their own homes, there is 24 hour on-call support. Also, the unit supports the
operation of small community dialysis units in Berwick, Liverpool, Pictou, Port Hawkesbury, and
Springhill. Key foci in the home unit are to maximize self-management through home therapies and
keep people in their communities.
The In-Centre HD units in the Dickson and DGH provide a large portion of HD treatments in the CDHA
region. The Dickson unit provides acute HD treatments off-unit in ICU, IMCU, or ERs, as well as fallback
support for the rest of the renal program and other renal programs in the Maritimes including
Yarmouth, Cape Breton, PEI, New Brunswick, and Newfoundland and Labrador.
The Renal Program strives for quality, and as such has many quality teams that each focus on improving
the safety and quality of care that is delivered. The Renal Program is also committed to advancing renal
care and is actively involved in the research community.
Finally, the renal program is continuously working with internal and external partners to provide high
quality, sustainable patient-focused appropriate care. This is facilitated by modality suitability
assessments, conservative management support, the promotion of home therapies, and continued
advocacy for access to required medications.
Matt Phillips RN BScN, Nephrology Quality Leader

P a g e | 4
Acknowledgements
This report would not have been possible without the support and contributions of many
dedicated and talented individuals in the renal program and beyond. It would not be possible to
individually acknowledge all those who assisted or contributed to the development of this
report, but the following deserve special mention. Special thanks go to the Renal Program
Quality and Patient Safety Team for developing the framework for this Annual Report, and also
to Cynthia Stockman and Drs. Steven Soroka, Ken West, and David Hirsch for on-going guidance
and support. Thanks goes to the committee chairs of each quality team for submitting on behalf
of their respective teams their annual reports. Data were provided by Niall Sheehy and Avtar
Seehra, the renal program systems analysts, as well as Nancy MacDonald from STAR Reporting,
Kathy Hart from Infection Control, Denise Harrie, program secretary, Paula Mossop, Vascular
Access Coordinator, Cindy Everett, PD Access Nurse, Rachael Blair, Clinical Leader Home and
Satellite Dialysis, and Lyndsay Collier, BioMed. Bernadette Chevalier from the pharmacy
department provided all medication usage information. Karen Webb-Anderson, quality and
patient safety leader for critical care provided CRRT data. Research information was provided
by Susan Fleet, Dr. Steven Soroka, Dr. Karthik Tennankore, Dr. Jo-Anne Wilson and Dr. Michael
West. Finally, we would like to acknowledge all staff and physicians who on a daily basis focus
their energy and attention on the care and safety of all patients and families. Each treatment,
appointment, teaching or training session, surgical or radiological intervention, or change of
modality requires a coordinated approach that involves many factors, variables, and team
members. Thank you to all, for all that you do.

P a g e | 5
Program Statistics The Renal Program collects and uses many types of data for quality assurance, quality
improvement, and reporting purposes.
Table 1 Dialysis Modality Trends fiscal Years 2008/092013/14
Figure 1 Dialysis Modality Trends Fiscal Years 2008/092013/14
Figure 2 Distribution of Modalities end of Fiscal Year 2013/14
0
50
100
150
200
250
300
2008 2009 2010 2011 2012 2013
In-Centre
Satellite
PD
HHD
54.4 27.3
14
4.2
Distribution of Modalities on March 31, 2014
In-Centre Hemodialysis (%)
Satellite Hemodialysis (%)
PD (%)
HHD (%)
Dialysis Modality Trends In-Centre Satellite PD HHD Total
2013/14 241 (54.4%) 121 (27.3%) 62 (14%) 19 (4.2%) 443
2012/13 243 (56%) 116 (27%) 57 (13%) 18 (4%) 434
2011/12 246 (56.6%) 112 (25.8%) 59 (13.5%) 17 (3.9%) 434
2010/11 242 (58.7%) 90 (21.8%) 66 (16%) 14 (3.3%) 412
2009/10 229 (54.9%) 90 (21.6%) 87 (20.9%) 11 (2.6%) 417
2008/09 242 (58.6%) 89 (21.5%) 77 (18.6%) 5 (1.2%) 413

P a g e | 6
Modality of Incident Patients
Incident dialysis modality is defined as the initial renal replacement therapy. This table does not
capture changes of modality (Hemodialysis PD, or TransplantHemodialysis).
Table 2 Incident Modality Trends
Incident Modality 2011/12 2012/13 2013//14
In-Centre 80 73 83
PD 24 17 23
Home HD 2 6 3
Total 106 96 109 Table 3 Program Separation Trends
Reason for Separation 2011/12 2012/13 2013/14
Death 83 81 76
Transplant* 36* 40* 16*
Stopped Treatment 22 23 13
Recovered Function 8 3 6
Transferred to Another Program 2 3 2
Other N/A 7 2
Total Program Separations 151 157 115
* This is the number of CDHA chronic dialysis patients who received a kidney transplant, and
not the total number of kidney transplants performed at CDHA.
Hemodialysis Treatments Performed
Total number of hemodialysis treatments performed by the renal program. This does not
include home hemodialysis treatments independently performed by patients in their own
homes.
Table 4 Yearly Treatment Trends
Treatment Location HD treatments 2011/12
HD treatments 2012/13
HD treatments 2013/14
Dickson In-centre unit 34 056 31 022 30 953
DGH In-Centre Unit 7 094 7 957 8 042
Satellite Dialysis units 15 816 17 429 18 310
Home Dialysis Unit 215 436 113
Acute HD off-unit ( ICU/IMCU/ER) 910 904 726
Total HD Treatments 58 091 57 748 58144

P a g e | 7
Prevalence of Vascular Access
It is well documented that the Arteriovenous Fistula (AVF) has the best outcomes for the
indicators of infection, adequate dialysis clearance, and mortality. Despite AVF’s having better
overall outcomes than central venous catheters (CVC’s), a CVC may be more appropriate for
individual patients based on many factors including: co-morbidities including peripheral
vascular disease (PVD) and diabetes; clinical frailty; multiple unsuccessful AVF creation
attempts; or, patient preference.
Figure 3 Vascular Access Prevalence Trends

P a g e | 8
Figure 4 Access Prevalence by Program Area
Vascular Access Related Interventions
The renal program through the vascular access nurse has developed a strong working
relationship with both vascular surgery and interventional radiology. These strong relationships
have been essential in providing safe, seamless, appropriate vascular access-related care and
interventions.
Table 5 Vascular Access Surgery Trends
* Vascular access surgeries include AVF creations, revisions, and ligations
Vascular Access Surgery
2011/12 2012/13 2013/14
Number of patients seen for vascular access consultation
150 135 89
Vascular Access Surgeries Performed* 107 140 57
Total 257 275 146

P a g e | 9
Figure 5 Vascular Access Referrals and Surgeries
Figure 6 Vascular Access Wait Times for: Consult to Clinic; Clinic to OR
* Vascular access surgeries include AVF creations, revisions, and ligations
Table 6 IR Procedure Trends
150
107 135 140
89
57
0
50
100
150
200
Referrals Surgeries
2011/12
2012/13
2013/14
0
20
40
60
80
100
120
140
160
Q1 Q2 Q3 Q4
Consult to Clinic
Clinic to OR
Interventional Radiology (IR) Procedures
2011/12 2012/13 2013/14
Tunneled CVC Line Insertions 115 131 109
Tunneled CVC Line Exchanges 131 154 162
AVF De-clots 5 3 2
Fistulograms 137 93 76
Fistuloplasties 88 56 52
Total IR Procedures 476 437 401

P a g e | 10
Figure 7 IR Procedure Trends
Medication Usage Medication costs do not include Aranesp® or Eprex®, as these medications are covered by the Department of Health and Wellness high cost drug program. These costs are displayed separately for the Dickson and DGH In-Centre units.
Table 7 Drug Cost Trends of Dickson and DGH Units
Drug Costs in Hemodialysis Units at CH 2006-2014
Unit Location 2006-2007 2007-2008 2008-2009 2009-2010 2010-2011 2011-2012
2012-2013 2013-2014
QEII $651,463 $774,431 $719,033 $1,205,459 $832,377 $742,174 $766,662 $867,095
DGH $56,620 $124,446 $179,603 $138,843 $118,570 $106,998 $139,340 $137,676
Figure 8 Drug Cost Trends of Dickson and DGH Units
115 131
5
137
88
131
154
3
93
56
109
162
2
76
52
0
20
40
60
80
100
120
140
160
180
Tunneled CVC Line Insertions
Tunneled CVC Line Exchanges
AVF De-clots Fistulograms Fistuloplasties
2011/12
2012/13
2013/14
$0
$200,000
$400,000
$600,000
$800,000
$1,000,000
$1,200,000
$1,400,000
2006-2007 2007-2008 2008-2009 2009-2010 2010-2011 2011-2012 2012-2013 2013-2014
Drug Costs in Hemodialysis Units at CH QEII
DGH
P a g e | 11
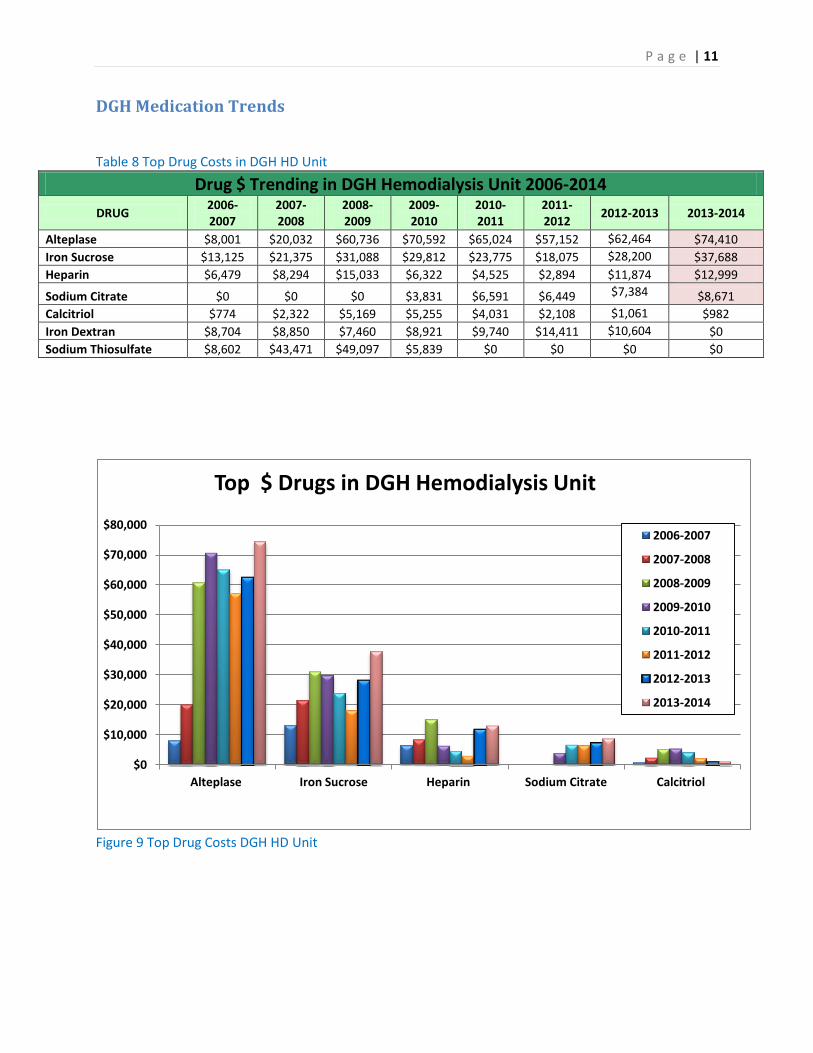
DGH Medication Trends
Table 8 Top Drug Costs in DGH HD Unit
Drug $ Trending in DGH Hemodialysis Unit 2006-2014
DRUG 2006-2007
2007-2008
2008-2009
2009-2010
2010-2011
2011-2012
2012-2013 2013-2014
Alteplase $8,001 $20,032 $60,736 $70,592 $65,024 $57,152 $62,464 $74,410
Iron Sucrose $13,125 $21,375 $31,088 $29,812 $23,775 $18,075 $28,200 $37,688
Heparin $6,479 $8,294 $15,033 $6,322 $4,525 $2,894 $11,874 $12,999
Sodium Citrate $0 $0 $0 $3,831 $6,591 $6,449 $7,384 $8,671
Calcitriol $774 $2,322 $5,169 $5,255 $4,031 $2,108 $1,061 $982
Iron Dextran $8,704 $8,850 $7,460 $8,921 $9,740 $14,411 $10,604 $0
Sodium Thiosulfate $8,602 $43,471 $49,097 $5,839 $0 $0 $0 $0
Figure 9 Top Drug Costs DGH HD Unit
$0
$10,000
$20,000
$30,000
$40,000
$50,000
$60,000
$70,000
$80,000
Alteplase Iron Sucrose Heparin Sodium Citrate Calcitriol
Top $ Drugs in DGH Hemodialysis Unit
2006-2007
2007-2008
2008-2009
2009-2010
2010-2011
2011-2012
2012-2013
2013-2014

P a g e | 12
Dickson Medication Trends Table 9 Top Drug Costs in Dickson HD Unit
Drug $ Trending in Hemodialysis Unit 2002-2014
DRUG 2006-2007 2007-2008
2008-2009
2009-2010
2010-2011
2011-2012
2012-2013 2013-2014
Alteplase $264,331 $333,312 $326,278 $397,254 $374,720 $378,240 $442,368 $457,326
Iron Sucrose $44,025 $54,188 $79,238 $75,150 $69,525 $56,888 $119,850 $195,675
Heparin $73,228 $76,868 $75,929 $34,345 $32,325 $37,606 $58,632 $59,795
Sodium Thiosulfate $157,539 $173,344 $97,328 $358,446 $140,306 $88,664 $13,115 $58,197
Sodium Citrate $0 $0 $0 $31,158 $46,402 $53,799 $48,840 $47,889
Danaparoid $17,233 $24,783 $30,777 $2,359 $13,365 $11,990 $9,518 $14,032
Sodium Ferric Gluconate Complex in Sucrose
$0 $234 $47 $609 $2,508 $914 $2,357.56 $11,119
Bacitracin-Gramicidin-Polymyxin Oint
$11 $6,275 $7,574 $7,256 $8,925 $6,709 $4,368 $3,904
Vancomycin $3,231 $3,236 $3,153 $3,759 $3,562 $2,783 $3,615 $3,824
Calcitriol $8,041 $8,806 $15,682 $12,258 $9,274 $4,637 $5,187 $2,849
Water for Injection $2,167 $2,469 $2,664 $3,475 $3,134 $2,977 $3,338 $2,671
Iron Dextran $55,042 $60,000 $64,144 $54,844 $65,520 $73,965 $39,778 $0
Figure 10 Top Drug Costs Dickson HD Unit
$0
$50,000
$100,000
$150,000
$200,000
$250,000
$300,000
$350,000
$400,000
$450,000
$500,000
Alteplase Iron Sucrose Heparin Sodium Thiosulfate Sodium Citrate
Top 5 Drugs in QEII Hemodialysis
2006-2007
2007-2008
2008-2009
2009-2010
2010-2011
2011-2012
2012-2013
2013-2014

P a g e | 13
ESA Therapy Table 10 ESA Usage Dickson Unit
Darbepoetin and Epoetin Usage in QEII Hemodialysis
2011/12 2012/13 2013/14
Darbepoetin Quantity Cost Quantity Cost Quantity Cost
10mcg 118 $3,162.40 67 $1,795.60 264 $7,075.20
20mcg 648 $34,732.80 560 $30,016.00 644 $34,518.40
30mcg 341 $27,416.40 456 $36,662.40 748 $60,139.20
40mcg 548 $58,745.60 420 $45,024.00 500 $53,600.00
50mcg 492 $65,928.00 352 $47,168.00 420 $56,280.00
60mcg 896 $144,076.80 776 $124,780.80 588 $94,550.40
80mcg 876 $187,814.40 740 $158,656.00 620 $132,928.00
100mcg 1424 $381,632.00 1332 $356,976.00 1072 $287,296.00
150mcg 1010 $406,020.00 924 $371,448.00 660 $265,320.00
Darbepoetin Total 6353 $1,309,528.40 5627 $1,172,526.80 5516 $991,707.20
Epoetin 10,000U 30 $4,275.00 31 $4,417.50 4 $570.00
2000U N/A N/A 1 $28.50 N/A N/A
3000U N/A N/A 6 $256.50 N/A N/A
4000U 39 $2,223.00 90 $5,130.00 20 $1,140.00
6000U N/A N/A 12 $1,026.00 10 $855.00
Epoetin Total 69 $6,498.00 140 $10,858.50 34 $2,565.00
Grand Total $1,316,026.40
$1,183,385.30 $994,272.20

P a g e | 14
Table 11 ESA Usage DGH
Darbepoetin and Epoetin Usage in DGH Hemodialysis
Darbepoetin 2011/12 2012/13 2013/14
Quantity Cost Quantity Cost Quantity Cost
10mcg 48 $1,286.40 114 $3,055.20 84 $2,251.20
20mcg 146 $7,825.60 168 $9,004.80 232 $12, 435.20
30mcg 96 $7,718.40 114 $9,165.60 100 $8,040.00
40mcg 152 $16,294.40 136 $14,579.20 148 $15,865.60
50mcg 156 $20,904.00 144 $19,296.00 112 $15,008.00
60mcg 178 $28,622.40 236 $37,948.80 180 $28,944.00
80mcg 169 $36,233.60 219 $46,953.60 140 $30,016.00
100mcg 308 $82,544.00 324 $86,832.00 234 $62,712.00
150mcg 160 $64,320.00 161 $64,722.00 100 $40,200.00
Darbepoetin Total 1413 $265,748.80 1616 $291,557.20 1330 $215,472.00
Epoetin
4000U 4 1607.40 24 $1,345.20 7 $399.00
40 000U 66 $3,784.80 N/A N/A N/A N/A
Epoetin Total 70 $5,392.20 24 $1,345.20 7 $399.00
Grand Total $271,141.00 $292,902.40 $215, 871.00

P a g e | 15
Renal Clinic Statistics The Renal Clinic follows patients with Chronic Kidney Disease (CKD) stage 3, 4, or 5. The
Multidisciplinary clinic provides care for new referrals with CKD, maintenance care for patients
with CKD, group teaching sessions and one on one teaching sessions, when appropriate.
Referrals to the Renal Clinic
All Referrals received by the renal clinic are triaged by a nephrologist, and assigned a level of
urgency, based on the information provided with the assessment. In January 2014 (Q4), a new
category of triage was developed. This category narrows the gap between those categorized as
needing be seen within three months and needing to be seen within one year. The new triage
category is for a time frame of six months, and replaces the current ‘P4’ level. As such, the
previous ‘P4’ (365 days target) has been changed to ‘P5’, and remains at 365 days.
Table 12 Referrals to Renal Clinic by Triage Category
Figure 11 Referrals to Renal Clinic by Triage Category
65
293
507
0
161
74
281
507
0
158
74
193
435
56
128
0
100
200
300
400
500
600
P1 P2 P3 P4 P5
2011/12
2012/13
2013/14
Referrals to Renal Clinic
Priority 2011/12 2012/13 2013/14
P1 (Target 7 days) 65 74 74
P2 (Target 30 days) 293 281 193
P3 (Target 90 days) 507 507 435
P4 (Target 180 days) N/A N/A 56
P5 (Target 365 days) 161 158 128
Total 1026 1020 886

P a g e | 16
Table 13 New Visits to Renal Clinic by Triage Category
New Visits to Renal Clinic
2011/12 2012/13 2013/14
Total Total Total
P1 61 70 71
P2 299 244 181
P3 402 400 432
P4 N/A N/A N/A
P5 29 14 126
Total 791 728 810
Figure 12 New Visits to Renal Clinic by Triage Category
Table 14 Appointment Trends in the Renal Clinic
Appointments in Renal Clinic 2011/12 2012/13 2013/14
Number of Visits to Nephrologists (new and returning) 3604 3379 3405
Number of Visits to Nurse Practitioners 387 365 306
Number of Visits to Renal Dietitian 417 273 368
Number of Visits for Education Classes 219 136 130
Number of Visits for 1:1 Nursing Assessments or teaching 291 264 298
Number of Visits to Research Nurse 20 29 9
Number of Visits (attending not specified) 149 N/A N/A
Total Number of Visits to Renal Clinic 5087 4446 4516
61
299
402
0 29
70
244
400
0 14
71
181
432
0
126
0
100
200
300
400
500
P1 P2 P3 P4 P5
2011/12
2012/13
2013/14

P a g e | 17
Figure 13 Appointment Trends in the Renal Clinic
PD Catheter Surgeries Table 15 PD Catheter Surgery Trends
PD Catheter Surgeries 2011/12 2012/13 2013/14
New PD Catheter Insertions 39 40 35
PD Catheter Removals 23 7 12
PD Catheter Exchanges 3 0 4
PD Catheter Repositionings 2 2 2*
Total PD Catheter Surgeries 67 49 53
*Done in Interventional Radiology
Figure 14 PD Catheter Surgery Trends
36
04
38
7
41
7
21
9
29
1
20
14
9
33
79
36
5
27
3
13
6
26
4
29
0
34
05
30
6
36
8
13
0
29
8
9
0
0
500
1000
1500
2000
2500
3000
3500
4000
2011/12
2012/13
2013/14
39
23
3 2
40
7
0 2
35
12
4 2
0
5
10
15
20
25
30
35
40
45
New PD catheter insertions
PD catheter removals PD catheter exchanges
PD catheter repositionings
2011/12
2012/13
2013/14

P a g e | 18
PD Average Wait Times
The PD access nurse tracks and reports all consults for PD catheters and PD catheter insertions.
Below are the mean wait times in days for ‘consult to clinic’, and ‘clinic to OR’. The indicator ‘OR
to training’ has stopped being reported in 2013/14 because it is consistently in target.
Table 16 PD Catheter Wait Times
PD: Mean Wait Time in Days Q1 Q2 Q3 Q4
Consult to Clinic (Target 30 days) 12.5 17.5 23.5 21.1
Clinic to OR (Target 30 days) 35.4 29.6 22.5 24
Figure 15 PD Catheter Wait Times
0
5
10
15
20
25
30
35
40
Q1 Q2 Q3 Q4
Consult to Clinic
Clinic to OR
P a g e | 19
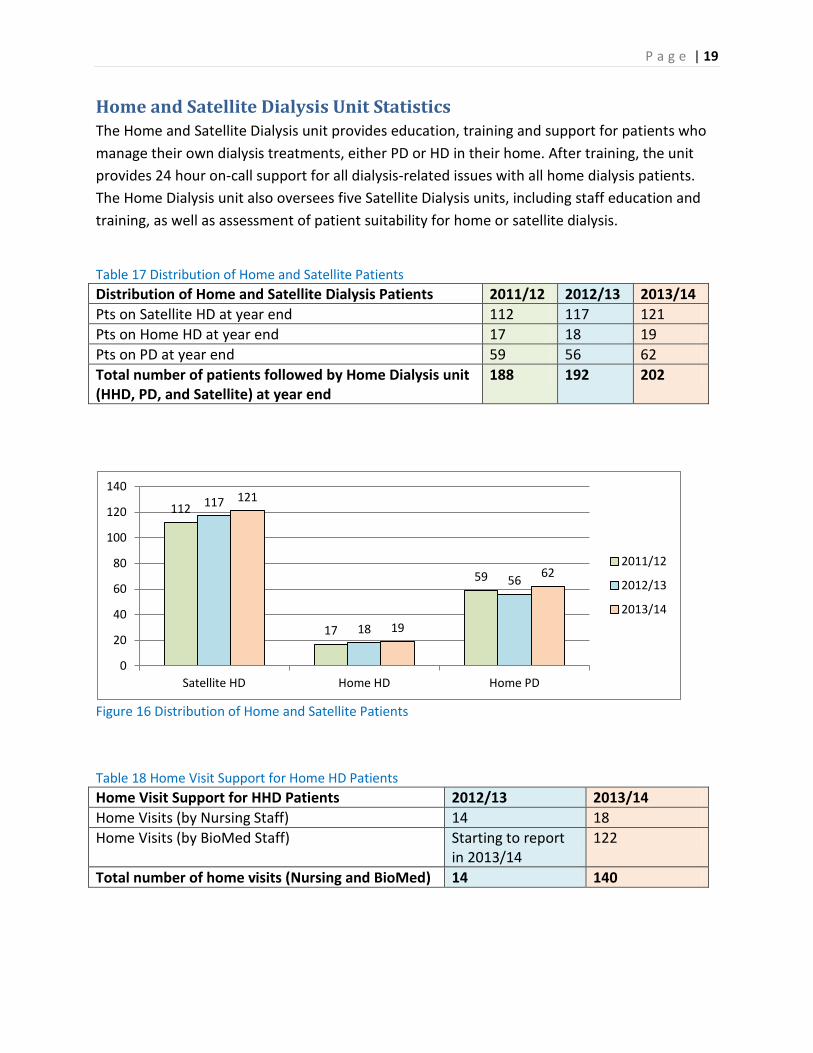
Home and Satellite Dialysis Unit Statistics The Home and Satellite Dialysis unit provides education, training and support for patients who
manage their own dialysis treatments, either PD or HD in their home. After training, the unit
provides 24 hour on-call support for all dialysis-related issues with all home dialysis patients.
The Home Dialysis unit also oversees five Satellite Dialysis units, including staff education and
training, as well as assessment of patient suitability for home or satellite dialysis.
Table 17 Distribution of Home and Satellite Patients
Distribution of Home and Satellite Dialysis Patients 2011/12 2012/13 2013/14
Pts on Satellite HD at year end 112 117 121
Pts on Home HD at year end 17 18 19
Pts on PD at year end 59 56 62
Total number of patients followed by Home Dialysis unit (HHD, PD, and Satellite) at year end
188 192 202
Figure 16 Distribution of Home and Satellite Patients
Table 18 Home Visit Support for Home HD Patients
Home Visit Support for HHD Patients 2012/13 2013/14
Home Visits (by Nursing Staff) 14 18
Home Visits (by BioMed Staff) Starting to report in 2013/14
122
Total number of home visits (Nursing and BioMed) 14 140
112
17
59
117
18
56
121
19
62
0
20
40
60
80
100
120
140
Satellite HD Home HD Home PD
2011/12
2012/13
2013/14

P a g e | 20
Table 19 Teaching Day trends for home dialysis
Teaching Days 2011/12 2012/13 2013/14
Total Number of Teaching Days (HHD) 199 306 230
Total Number of Teaching Days (PD) 285 199 221
Total number of Teaching Days (PD and HHD) 484 505 451
Figure 17 Teaching day trends for home dialysis
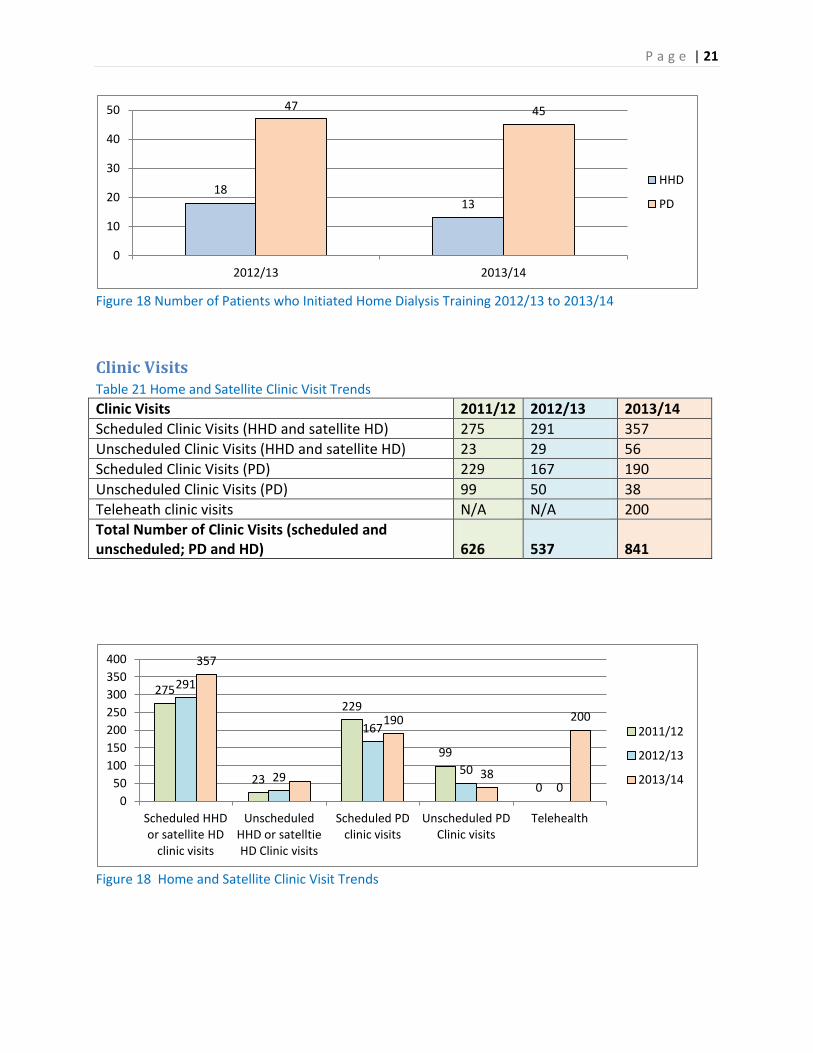
Table 20 Number of Patients who Initiated Home Dialysis Training
2012/13 2013/14
Number of Patients Who Initiated Training HHD PD HHD PD
Q1 7 8 4 9
Q2 2 14 5 23
Q3 4 12 3 10
Q4 5 13 1 13
Total 18 47 13 45
HHD: Patients may or may not have completed training successfully
PD: Training may be for CAPD or CCPD. Patients may or may not have completed training
successfully.
199
285 306
199 230 221
0
50
100
150
200
250
300
350
Home HD PD
2011/12
2012/13
2013/14
P a g e | 21
Figure 18 Number of Patients who Initiated Home Dialysis Training 2012/13 to 2013/14
Clinic Visits Table 21 Home and Satellite Clinic Visit Trends
Clinic Visits 2011/12 2012/13 2013/14
Scheduled Clinic Visits (HHD and satellite HD) 275 291 357
Unscheduled Clinic Visits (HHD and satellite HD) 23 29 56
Scheduled Clinic Visits (PD) 229 167 190
Unscheduled Clinic Visits (PD) 99 50 38
Teleheath clinic visits N/A N/A 200
Total Number of Clinic Visits (scheduled and unscheduled; PD and HD)
626 537 841
Figure 18 Home and Satellite Clinic Visit Trends
18 13
47 45
0
10
20
30
40
50
2012/13 2013/14
HHD
PD
275
23
229
99
0
291
29
167
50
0
357
190
38
200
0
50
100
150
200
250
300
350
400
Scheduled HHD or satellite HD
clinic visits
Unscheduled HHD or satelltie HD Clinic visits
Scheduled PD clinic visits
Unscheduled PD Clinic visits
Telehealth
2011/12
2012/13
2013/14

P a g e | 22
Table 22 Phone Consults to Home Dialysis Unit
Phone Consults 2012/13 2013/14**
HHD and PD 2319 1754
Satellite Units 2670 737
Total 4989 2491
**No data collected for 3 months during clerical turnover
Peritonitis Rates for the Home Dialysis Unit Table 23 Peritonitis Rate Trends
PD Infection Rate per patient months Program Target 2011/12 2012/13 2013/14
Peritonitis 1:36 1:29.4 1:41.4 1:41.9
Exit Site Infection 1:48 1: 188.2 1:82.9 1:167.8
Capacity Trends for Satellite Units
Figure 19 Berwick Monthly Capacity Trends
* Maximum physical capacity 24 (6 stations, 6 days per week, 2 shifts per day)
0
5
10
15
20
25
30
Ap
r-1
2
May
Jun
e
July
Au
gust
Sep
tem
ber
Oct
ob
er
No
vem
ber
Dec
emb
er
Jan
-13
Feb
ruar
y
Mar
ch
Ap
ril
May
Jun
e
July
Au
gust
Sep
tem
ber
Oct
ob
er
No
vem
ber
Dec
emb
er
Jan
-14
Feb
ruar
y
Mar
ch
Target Capacity
Operating Capacity
Actual Capacity

P a g e | 23
Figure 20 Liverpool Monthly Capacity Trends
* Maximum physical capacity 24 (6 stations, 6 days per week, 2 shifts per day)
Figure 21 Pictou Monthly Capacity Trends
* Maximum physical capacity 16 (4 stations, 6 days per week, 2 shifts per day)
0
5
10
15
20
25
30
Ap
r-1
2
May
Jun
e
July
Au
gust
Sep
tem
ber
Oct
ob
er
No
vem
ber
Dec
emb
er
Jan
-13
Feb
ruar
y
Mar
ch
Ap
ril
May
Jun
e
July
Au
gust
Sep
tem
ber
Oct
ob
er
No
vem
ber
Dec
emb
er
14
-Jan
Feb
ruar
y
Mar
ch
Target Capacity
Operating Capacity
Actual Capacity
0
2
4
6
8
10
12
14
16
18
20
Ap
r-1
2
May
Jun
e
July
Au
gust
Sep
tem
ber
Oct
ob
er
No
vem
ber
Dec
emb
er
Jan
-13
Feb
ruar
y
Mar
ch
Ap
ril
May
Jun
e
July
Au
gust
Sep
tem
ber
Oct
ob
er
No
vem
ber
Dec
emb
er
Jan
-14
Feb
ruar
y
Mar
ch
Target Capacity
Operating Capacity
Actual Capacity
P a g e | 24
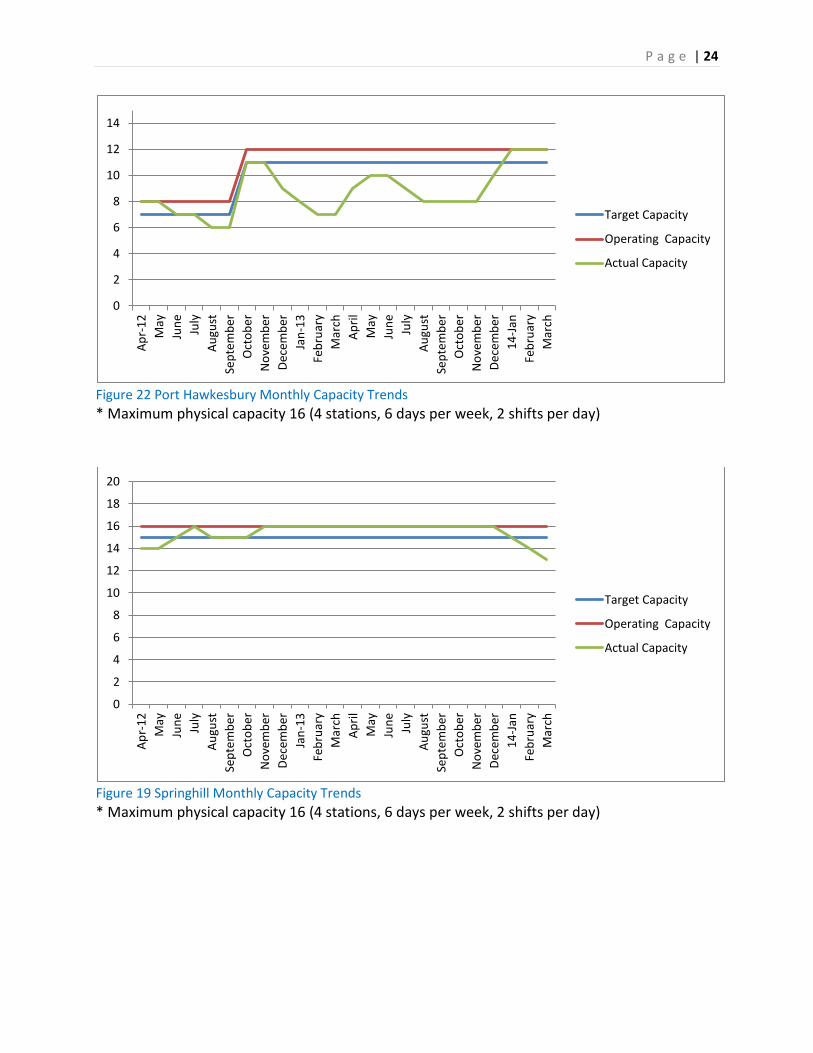
Figure 22 Port Hawkesbury Monthly Capacity Trends
* Maximum physical capacity 16 (4 stations, 6 days per week, 2 shifts per day)
Figure 19 Springhill Monthly Capacity Trends
* Maximum physical capacity 16 (4 stations, 6 days per week, 2 shifts per day)
0
2
4
6
8
10
12
14
Ap
r-1
2
May
Jun
e
July
Au
gust
Sep
tem
ber
Oct
ob
er
No
vem
ber
Dec
emb
er
Jan
-13
Feb
ruar
y
Mar
ch
Ap
ril
May
Jun
e
July
Au
gust
Sep
tem
ber
Oct
ob
er
No
vem
ber
Dec
emb
er
14
-Jan
Feb
ruar
y
Mar
ch
Target Capacity
Operating Capacity
Actual Capacity
0
2
4
6
8
10
12
14
16
18
20
Ap
r-1
2
May
Jun
e
July
Au
gust
Sep
tem
ber
Oct
ob
er
No
vem
ber
Dec
emb
er
Jan
-13
Feb
ruar
y
Mar
ch
Ap
ril
May
Jun
e
July
Au
gust
Sep
tem
ber
Oct
ob
er
No
vem
ber
Dec
emb
er
14
-Jan
Feb
ruar
y
Mar
ch
Target Capacity
Operating Capacity
Actual Capacity
P a g e | 25
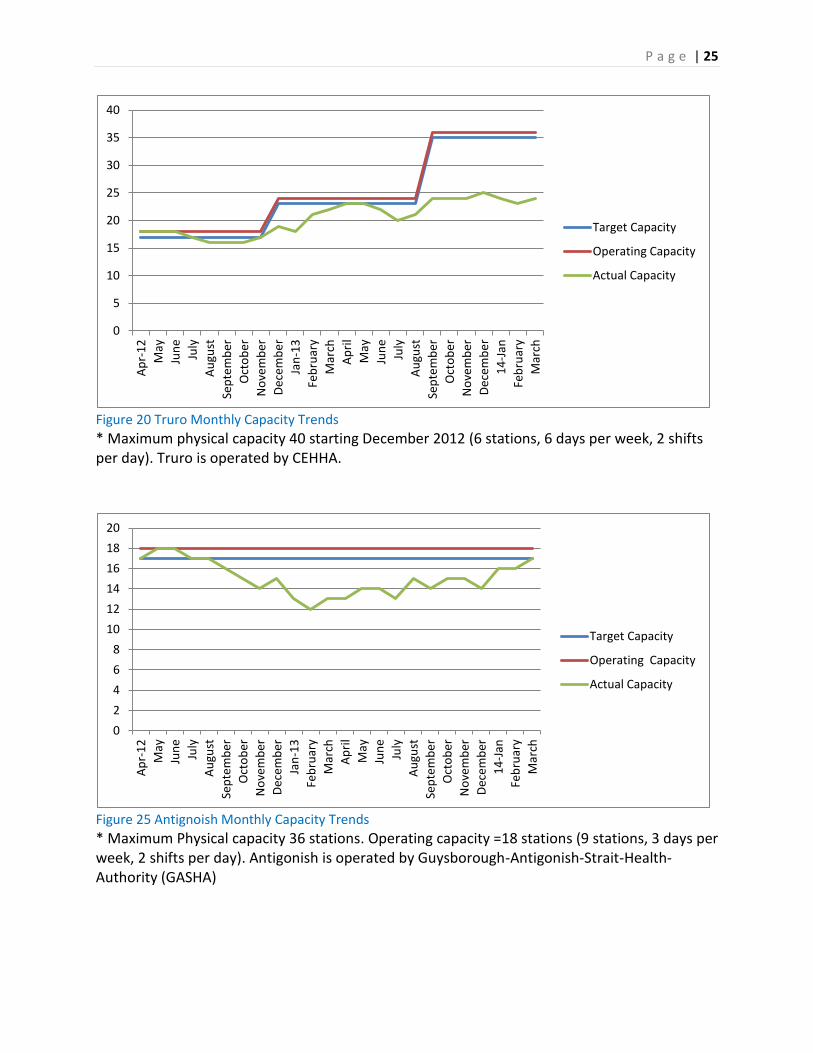
Figure 20 Truro Monthly Capacity Trends
* Maximum physical capacity 40 starting December 2012 (6 stations, 6 days per week, 2 shifts per day). Truro is operated by CEHHA.
Figure 25 Antignoish Monthly Capacity Trends
* Maximum Physical capacity 36 stations. Operating capacity =18 stations (9 stations, 3 days per week, 2 shifts per day). Antigonish is operated by Guysborough-Antigonish-Strait-Health-Authority (GASHA)
0
5
10
15
20
25
30
35
40
Ap
r-1
2
May
Jun
e
July
Au
gust
Sep
tem
ber
Oct
ob
er
No
vem
ber
Dec
emb
er
Jan
-13
Feb
ruar
y
Mar
ch
Ap
ril
May
Jun
e
July
Au
gust
Sep
tem
ber
Oct
ob
er
No
vem
ber
Dec
emb
er
14
-Jan
Feb
ruar
y
Mar
ch
Target Capacity
Operating Capacity
Actual Capacity
0
2
4
6
8
10
12
14
16
18
20
Ap
r-1
2
May
Jun
e
July
Au
gust
Sep
tem
ber
Oct
ob
er
No
vem
ber
Dec
emb
er
Jan
-13
Feb
ruar
y
Mar
ch
Ap
ril
May
Jun
e
July
Au
gust
Sep
tem
ber
Oct
ob
er
No
vem
ber
Dec
emb
er
14
-Jan
Feb
ruar
y
Mar
ch
Target Capacity
Operating Capacity
Actual Capacity

P a g e | 26
In-Centre Hemodialysis Unit
Unit Capacity
The in-Centre renal HD unit (RDU) is the largest HD unit in Nova Scotia. The unit provides
treatment for chronic HD patients, and also provides support for the satellite, home dialysis,
and PD patients requiring re-assessment or short-term in-centre treatments. As CDHA is a
quaternary institution and transplant centre for Atlantic Canada, the in-centre unit also
provides HD treatments to chronic HD patients from other programs in NS or other Atlantic
Canada programs who require the specialized services offered at CDHA. The scope of
responsibility of the in-centre HD unit requires flexibility to accommodate these needs, and as
such strives to operate at 85% capacity.
The unit operated at over 100% capacity of approved HD stations for each month of the
previous three fiscal years. In 2011, the provincial government announced funding for the
planning of an expansion of four HD stations and funding for eight of the stations that are being
operated over current capacity.
Capacity limits are calculated by multiplying the number of approved of stations (34) by 3 shifts
per day to determine the daily capacity. As the unit operates two different schedules (Monday,
Wednesday, Friday, OR Tuesday, Thursday, Saturday), the maximum unit capacity is achieved
by multiplying the daily capacity by 2. Actual capacity= (34 X 3) X2. Actual capacity is 204
spaces.
Figure 26 Quarterly Dickson Capacity Trends
0
50
100
150
200
250
Q1
20
11
Q2
20
11
Q3
20
11
Q4
20
11
Q1
20
12
Q2
20
12
Q3
20
12
Q4
20
12
Q1
20
13
Q2
20
13
Q3
20
13
Q4
20
13
Target (173.4)
100% Capacity (204)
Actual Capacity
P a g e | 27
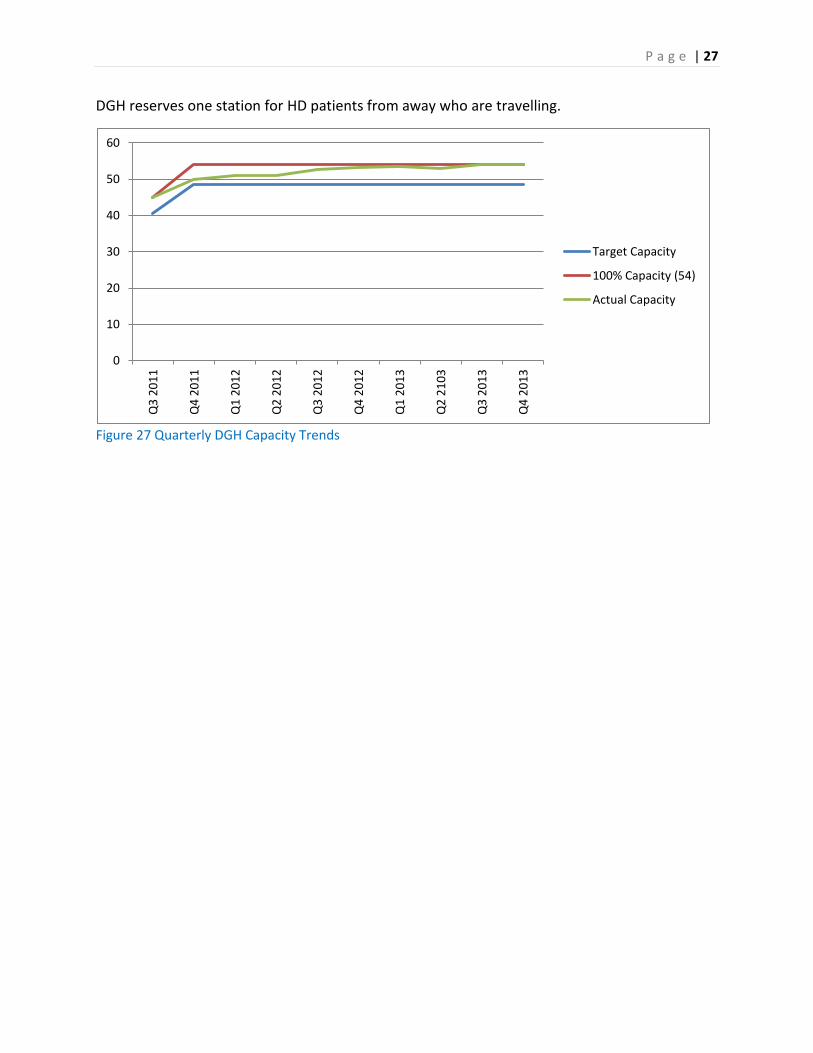
DGH reserves one station for HD patients from away who are travelling.
Figure 27 Quarterly DGH Capacity Trends
0
10
20
30
40
50
60 Q
3 2
01
1
Q4
20
11
Q1
20
12
Q2
20
12
Q3
20
12
Q4
20
12
Q1
20
13
Q2
21
03
Q3
20
13
Q4
20
13
Target Capacity
100% Capacity (54)
Actual Capacity

P a g e | 28
Acute Off-Unit Hemodialysis Treatment Support
The in-centre HD unit provides acute HD support to all ICU and IMCU units within CDHA. The
need for each acute HD treatment is individually assessed by a nephrologist on the consult
service, and each treatment is prescribed individually. These treatments are provided at the
patient’s inpatient bedside for patients who require ICU or IMCU care and monitoring. These
HD treatments are staffed at a ratio of 1:1 (one HD RN to one patient).
Table 24 Acute HD Trends by Treatment Location
Acute HD Treatments by Unit Location
1st Acute
HD
Subsequent
Acute HD
1st SLED Subsequent
SLED
CRRT* UF Only Total
3A 21 88 17 33 14 4 177
5.1 4 55 13 29 59 2 162
5.2 10 20 10 14 17 0 71
6.4 17 49 9 10 0 3 88
IMCU’s 26 160 8 18 0 2 216
ER 12 0 0 0 0 0 12
Total 90 372 57 104 90 11 726
* CRRT treatments are performed by the ICU bedside RN, not by a HD unit RN **CRRT data from ICU database
Figure 28 Acute HD Trends by Treatment Location
0
20
40
60
80
100
120
140
160
180
3A 5.1 5.2 6.4 IMCU's ER
1st Acute HD
Subsequent Acute HD
1st SLED
Subsequent SLED
CRRT
UF Only

P a g e | 29
Bacteremia Rates for RDU Dickson (2013 Calendar year)
Bacteremia in HD patients is a serious event that impacts the health status of persons on
dialysis and requires many interventions including lab specimens, administration of antibiotics,
potential hospital admission, and possibly interventions to exchange catheters. For many years
the Dickson dialysis unit has worked closely with Infection Control at CDHA to monitor
bacteremia, as well as investigate possible causes. Work is under way to monitor bacteremia
rates in all HD areas. CDHA Renal Program targets for Bacteremia are:
Rate of 1.2 infections per 1000 line days for tunneled CVCs
0 infections for AVFs
Rate of 2.2 infections per 1000 line days for non-tunneled CVCs
Table 25 2013 Dickson Tunneled Line Infection Rates
2013 Jan Feb Mar Apr May Jun Jul Aug Sept Oct Nov Dec
# of Tunnel Line Infections 4 6 1 0 2 1 2 3 2 2 2 1
# of Line Days 3999 3831 4372 3883 3846 3716 4054 3948 3648 3797 3987 4158
Infection Rate/1000 Line days 1.0 1.6 0.2 0.0 0.5 0.3 0.5 0.8 0.5 0.5 0.5 0.2
Figure 29 2013 Dickson Tunneled Line Infection Rates
0.0
0.5
1.0
1.5
2.0
Jan Feb Mar Apr May Jun Jul Aug Sept Oct Nov Dec
Rat
e /
10
00
Lin
e d
ays
2013 RDU Tunneled Line Infection Rates

P a g e | 30
Table 26 Dickson Non-Tunneled Line Infection Rates
2013 Jan Feb Mar Apr May Jun Jul Aug Sept Oct Nov Dec
# of Non tunnel line Infections 0 0 0 0 0 0 0 0 0 0 0 0
# of Non tunnell line days Days 297 140 163 262 281 265 248 248 251 311 331 295
Infection Rate/1000 Non tunnel days 0.0 0.0 0.0 0.0 0.0 0.0 0.0 0.0 0.0 0.0 0.0 0.0
Figure 30 Dickson Non-Tunneled Line Infection Rates
Table 27 Dickson AVF Infection Rates
2013 Jan Feb Mar Apr May Jun Jul Aug Sept Oct Nov Dec
# of Fistula Infections 0 0 0 0 0 0 0 0 0 0 1 0
# of Fistula Days 1850 1586 1826 1689 1635 1592 1755 1709 1720 1779 1835 1786
Infection Rate/1000 Fistula days 0.0 0.0 0.0 0.0 0.0 0.0 0.0 0.0 0.0 0.0 0.5 0.0
0.0
0.2
0.4
0.6
0.8
1.0
Jan Feb Mar Apr May Jun Jul Aug Sept Oct Nov Dec
Rat
e /
10
00
no
n t
un
ne
l lin
e d
ays
RDU 2013 Non tunneled Line Infection Rates

P a g e | 31
Figure 31 Dickson AVF Infection Rates
0.0
0.5
1.0
Jan Feb Mar Apr May Jun Jul Aug Sept Oct Nov Dec
Rat
e /
10
00
fis
tula
d
ays
RDU 2013 Fistula Infection Rates
P a g e | 32
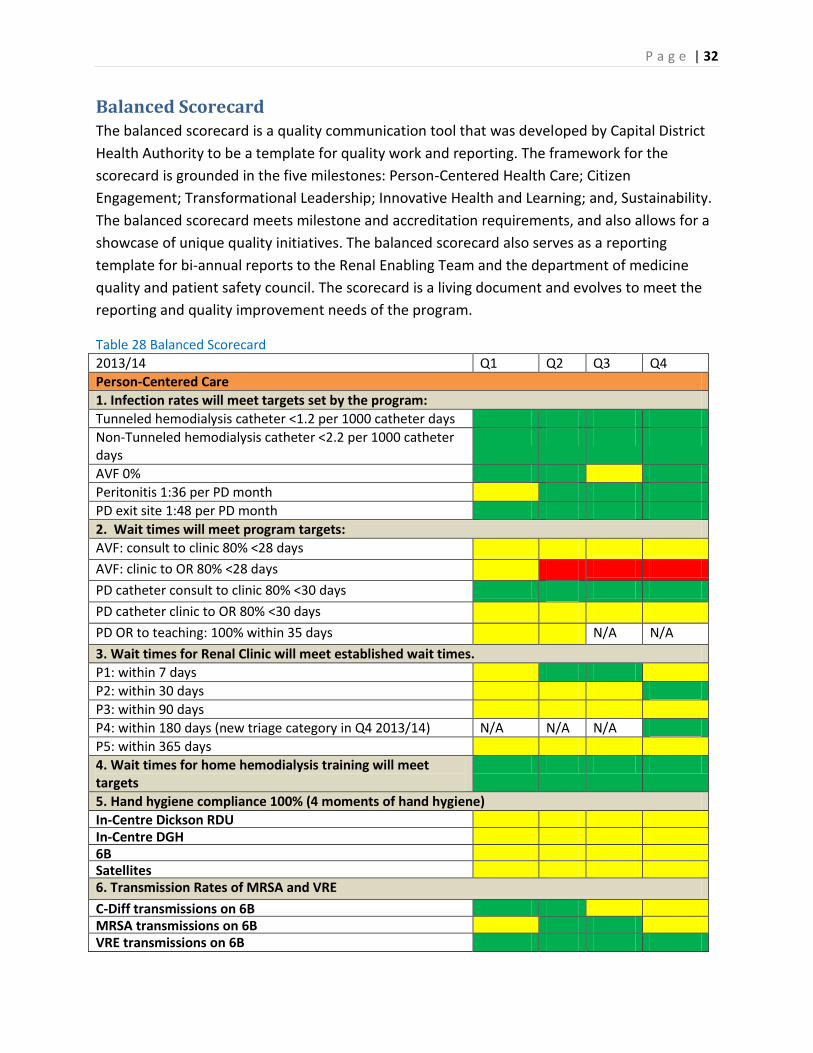
Balanced Scorecard The balanced scorecard is a quality communication tool that was developed by Capital District
Health Authority to be a template for quality work and reporting. The framework for the
scorecard is grounded in the five milestones: Person-Centered Health Care; Citizen
Engagement; Transformational Leadership; Innovative Health and Learning; and, Sustainability.
The balanced scorecard meets milestone and accreditation requirements, and also allows for a
showcase of unique quality initiatives. The balanced scorecard also serves as a reporting
template for bi-annual reports to the Renal Enabling Team and the department of medicine
quality and patient safety council. The scorecard is a living document and evolves to meet the
reporting and quality improvement needs of the program.
Table 28 Balanced Scorecard
2013/14 Q1 Q2 Q3 Q4
Person-Centered Care
1. Infection rates will meet targets set by the program:
Tunneled hemodialysis catheter <1.2 per 1000 catheter days
Non-Tunneled hemodialysis catheter <2.2 per 1000 catheter days
AVF 0%
Peritonitis 1:36 per PD month
PD exit site 1:48 per PD month
2. Wait times will meet program targets:
AVF: consult to clinic 80% <28 days
AVF: clinic to OR 80% <28 days
PD catheter consult to clinic 80% <30 days
PD catheter clinic to OR 80% <30 days
PD OR to teaching: 100% within 35 days N/A N/A
3. Wait times for Renal Clinic will meet established wait times.
P1: within 7 days
P2: within 30 days
P3: within 90 days
P4: within 180 days (new triage category in Q4 2013/14) N/A N/A N/A
P5: within 365 days
4. Wait times for home hemodialysis training will meet targets
5. Hand hygiene compliance 100% (4 moments of hand hygiene)
In-Centre Dickson RDU In-Centre DGH 6B Satellites 6. Transmission Rates of MRSA and VRE
C-Diff transmissions on 6B MRSA transmissions on 6B VRE transmissions on 6B

P a g e | 33
7. ROP and High Priority Audits
Med Reconciliation RDU, satellites, DGH N/A Falls Risk Assessments updated regularly Interventions for high falls risk patients implemented TOA: Episodic Care N/A N/A Patient and family role in safety verbally discussed and written information provided
No Dangerous Abbreviations on chart Consent for HD on Chart Telephone Orders Co-Signed 8. Anemia Indices are within target for patients receiving EPO therapy
a) Dickson Hemoglobin in Target b) Dickson %TSAT in Target c) Dickson Ferritin in Target d) DGH Hemoglobin in Target e) DGH %TSAT in Target f) DGH Ferritin in Target N/A N/A g) Satellites Hemoglobin in Target h) Satellites %TSAT in Target i) Satellites Ferritin in Target j) PD Hemoglobin in Target k) PD %TSAT in Target l) PD Ferritin in Target m) Renal Clinic Hemoglobin in Target n) Renal Clinic %TSAT in Target o) Renal Clinic Ferritin in Target
Citizen and Stakeholder Engagement and Accountability
1. Patient Experience surveys will guide PDSA cycles of improvement
2. Annual CDHA patient satisfaction surveys will be >90%
3. Patient and Family involvement in quality review will be evident
Transformational Leadership
1. 90% of formal leaders consistently demonstrate the competencies of ‘my leadership’.
N/A
2. Staff experience surveys will guide PDSA cycles of improvement.
Innovative Health and Learning
1. Content of staff ed days will be guided by yearly competencies and staff surveys.
2. Modality Questionnaires guide renal education in clinic.
3. Self-care in-centre will expand to 9 patients by the end of 2012.
4. PATH Clinic offers decision support to frail elderly adults who may not benefit from conventional Renal Replacement Therapy.
Sustainability
1. HD in-centre Dickson will run at 85% capacity.

P a g e | 34
2. HD in-centre DGH will run at 90% capacity.
3. Satellite units will operate with one empty station per unit.
a. Berwick
b. Liverpool
c. Pictou
d. Port Hawkesbury
e. Springhill
f. Truro
g. Antigonish
4. 6B inpatient nephrology will operate at 85% capacity
5. Renal program will meet provincial home dialysis targets:
a. 20% of all dialysis patients on a home therapy by the end of 2012
N/A N/A
b. Distribution of Incident patients: At least 20% of incident patients begin on a home therapy.
c. # of patients changing modality to a home therapy
d. 25% of all dialysis patients on a home therapy by the end of 2015
P a g e | 35
Accreditation 2013 The Renal Program Accreditation team evolved into the renal program quality and patient
safety team (Q&PS) in September of 2011. While accreditation remains a component of the
group, the group also focuses on ongoing quality and patient initiatives. This transition shifts
accreditation requirements from a cyclical nature to an ongoing philosophy and practice.
The Quality and Patient Safety Team led the program through the Accreditation survey.
Specifically, the team coordinated and encouraged staff to complete the ‘worklife pulse’ and
‘patient safety culture’ surveys, developed and completed audits related to Required
Organizational Practices (ROPs) and high priority standards, provided education and
information to the program, and reviewed all ROPs and high priority standards that were
applicable for the survey.
During the survey, the Renal Program was visited by surveyors to evaluate Ambulatory
Medication Reconciliation in the Renal Clinic, Telehealth in the Home Dialysis Unit, and Point of
Care Testing in the DGH HD unit. The lead surveyor also met with members of the program to
evaluate how work done at the program level aligns with the organizational strategic direction.
As part of this evaluation, the surveyor also met with two HD patients, who shared their
experience of being part of quality improvement in the renal program.
Feedback from all surveyors who evaluated care and quality in the Renal Program all offered
very positive feedback, and were vocal in their acknowledgement of the dedicated,
experienced, patient-centered renal team. As an organization, Capital Health received the
highest ranking possible from Accreditation Canada: Accredited with Exemplary Standing. More
information about the CDHA 2013 Accreditation survey can be found at:
http://www.cdha.nshealth.ca/performance-excellence-program/accreditation

P a g e | 36
Research The Renal program is committed to improving the quality of renal care and is actively involved
in the research community. Following are some of the studies that were commenced, on-going,
or completed in 2013/14.
Table 29 Summary of Research in Renal Program Name of Study Study Lead(s) Hypothesis/ Objective # of patients
enrolled end date
Independ-ent or industry-sponsored
Phase IIIb open label study to optimize the single bolus dose of dalteparin sodium for the prevention of clotting within the extracorporeal system during hemodialysis procedures for subjects with chornic renal insufficiency: The PARROT study.
Dr. Steven Soroka, Dr. Jo-Anne Wilson, Ms. Susan Fleet
To determine the safety and efficacy of Fragmin to prevent clotting in the extracorporeal system during hemodialysis, when Fragmin is administered according to the adjustable dose regimen.
15 1 year Industry
Effectiveness and cost of weekly rt-PA in hemodialysis patients at high risk of catheter complications: Quality Assurance Project of the implementation and evaluation of the PreCLOT.
Dr. Steven Soroka, Dr. Jo-Anne Wilson, Dr. Karthik Tennankore, Ms. Paula Mossop
To determine, in real world clinical practice among outpatient hemodialysis patients with a CVC who are at high risk of catheter malfunction, if use of rtPA once per week compared to citrate as a locking solution results in: 1) a reduction in the rate of rt-PA use for treatment of catheter malfunction ; 2) a reduction in the rate of catheter-related bacteremia; 3) a reduction in the rate of radiological interventions for catheter malfunciton ;and 4) a reduction in cost and hospitalizations
100 2 years Both industry and independent funded
A Randomized, double-blind , placebo-controlled phase 3 study to assess the efficacy and safety of AMG
Dr. Steven Soroka, Dr. Jo-Anne Wilson, Ms. Susan Fleet
The primary objective is to evaluate the efficacy of AMG 416 compared to placebo for reducing PTH by > 30%.
5 1 year Industry

P a g e | 37
416 in the treatment of secondary hyperparathyroidism in subjects with CKD on hemodialysis : KAI study (study site)
An Evaluation of hepatitis B Vaccine Seroconversion Rates in Predialysis Chronic Kidney Disease and Hemodialysis Patients: A Matched Cohort Study.
Dr. Jo-Anne Wilson, Dr. Steven Soroka,Dr. Karthik Tennankore, Dr. Bryce Kiberd, Dr. Shelly MacNeil, Dr. Kathy Slayter
The objectives are to determine: 1) whether patients (matched for characteristics that have been shown to influence response rates to Hepatitis B vaccine) with CKD stages 4-5 (predialysis) have better seroconversion rates compared to hemodialysis patients; and 2) possible parameters that could influence response rates to hepatitis B vaccine among dialysis patients.
800 HD, 50 pre-dialysis
1 year Independent
Evaluation of PTH Pathway for management of elevated parathyroid hormones in dialysis patients.
Dr. Jo-Anne Wilson, Dr. Steven Soroka, Marsha Wood NP, Matt Phillips
Evaluate process and outcome measures to determine uptake and effectiveness of PTH pathway.
All patients in CDHA Renal Program
2014 Independent and industry
Effectiveness of an online portal for delivery of care to home dialysis patients
Karthik Tennankore, Cynthia Stockman, Bryce Kiberd, Steven Soroka, Arun Radhakrishnan, MattPhillips, Neil Finkle
To determine if an online portal improves home dialysis patient quality of life and satisfaction with care
In REB 2016 CDHA Translating Research Into Care (TRIC) grant
Virtual Ward for Home dialysis-A novel Model to Address Transitions of Care
Karthik Tennankore, Neil Finkle (in collaboration with several centers from across the country). PI: Christopher Chan
To determine if a series of telephone communications for home dialysis patients after they are admitted, receive antibiotics, complete training or require interventions identifies care gaps
Recruiting June 1 2014
Investigator initiated Baxter High Dose dialysis grant (Christopher Chan)
Education Initiative modifies nurses’ opinions.
Dr. Karthik Tennankore, Matt Phillips, Colleen Wile
To determine if an education initiative modifies opinions of in-center and satellite nurses towards home dialysis.
88 nurses 2014 Independent

P a g e | 38
Towards a better understanding of frailty in dialysis
Karthik Tennankore, David Landry, Ashley Cox, Steven Soroka, Paige Moorhouse, Bryce Kiberd
To determine if a clinical frailty scale is associated with hospitalization in incident dialysis patients
20 to date Dec 2015
Capital Health Research Fund
Institutional Changes in Magnesium Administration
Dr. Bryce Kiberd, Dr. Karthik Tennankore, Dr. Chris Daley
Has there been a change in Magnesium administration at CDHA over the past 5 years, and if so, why?
Institutional nested select floors. Sample of approximately 500 admissions
April 2014
Independent
Modality Suitability Assessment in Renal Clinic
Dr. Steven Soroka, Dr. Karthik Tennankore, Matt Phillips
To determine pre-dialysis modality suitability of all patients on a trajectory for renal replacement.
Start date May 2014
2016 Industry grant and independent
PKD 271 Dr. Soroka To determine if the use of Tolvaptan in the Adult Dominant Polycystic Kidney Disease patient will decrease or inhibit cyst growth on the kidneys. Open label study.
4 Outpatient clinic. Currently enrolling.
2015 industry funding
Evaluation and validation of a hemodialysis central venous catheter (CVC) dysfunction protocol for administering Alteplase (Cathflo)
Dr. Jo-Anne Wilson, Paula Mossop, Dr. Steven Soroka
To determine if a new CVC dysfunction protocol may result in improved short-term and long-term success as it relates to catheter patency and timing of alteplase intervention.
22 patients at DGH dialysis site
May 2013
Independent
Validation of a model for outpatient management of warfarin sodium pre/post interventional radiology procedures in low risk hemodialysis patients.
Paula Mossop, Dr. Jo-Anne Wilson, Dr. Soroka, Dr. Dipchand, Dr. Brown.
To evaluate the effectiveness and safety of a HD perioperative anticoagulation protocol for patients at low risk for Thromboemoblic complications who require temporary interruption of warfarin sodium for IR proecedures.
7paients 9 interventions to date
Ongoing Independent
CFSSI: Canadian Fabry Stroke
Dr. M. West Study of idiopathic stroke pts 18-55 yrs in Canada
7+ 2014 Investigator sponsored

P a g e | 39
Screening Initiative with DNA analysis to screen for Fabry disease as a cause.
with a grant from Shire HGT
FOS: Fabry Outcome Survey
Dr. M. West Registry study collecting clinical data on Fabry patients.
72+ open Shire HGT
Fabry Registry Dr. M. West Registry study collecting clinical data on Fabry pts.
76+ open Genzyme
Gene Transfer Therapy in Fabry Disease
Dr. M. West A pilot gene therapy clinical study directed towards amelioration of Fabry disease in men using Lentivirus-transduced, autologous CD34+ stem cells will demonstrate safety and feasibility.
0 2017 CIHR sponsored
REP-081 Dr. M. West A phase III clinical trial to determine the safety of a new form of agalsidase-alfa enzyme replacement therapy in Fabry disease.
20 open Shire HGT
IGNITE (Orphan Diseases: Identifying Genes and Novel Therapeutics to Enhance Treatment)
Dr. M. West A sub-study in the Ethical, Economic, Environmental, Legal and Social Aspects of Genomics (GE3LS) component, which examines the attitudes to genetic testing of adults with hypertrophic cardiomyopathy being screened for Fabry disease.
0 2015 Genome-Canada
P a g e | 40
Initiatives
Priority Setting Partnership for People with Kidney Failure on Dialysis
A steering group (comprised of patients, caregivers, clinicians and a facilitator) worked closely
with the Kidney Foundation of Canada (KFOC), the Interdisciplinary Chronic Disease
Collaboration, and the Canadian Kidney Knowledge Translation and Generation Network
(CANN-NET) to develop a survey used to collect research uncertainties. The survey consisted of
broad questions about the overall management of kidney failure and dialysis, diagnosis,
prognosis and treatment. Current research recommendations from the major clinical practice
guidelines were examined and incorporated with the survey responses. A shortlist of 30
research uncertainties was generated from nearly 2000 responses to the Canada-wide survey.
Three members of our Renal program including Michelle Jensen (Social Worker), Annette Cyr
(Kidney Patient Advocacy Committee member), and Julianne Morrison (LPN) joined
approximately 30 others (including patients with kidney disease, caregivers and clinicians who
care for people on dialysis) for the ‘Priority Setting Partnership for People with Kidney Failure
on Dialysis Workshop’ which was held in Toronto in June 2013. The purpose of the workshop
was to reduce the shortlist of 30 research uncertainties to 10. The top 10 research uncertainties
were identified as follows:
1) What is the best way to enhance communication between health care professionals and patients and to maximize patient participation in decision-making with regards to the advantages and disadvantages of different forms of dialysis, and access to test results to facilitate self-management?
2) How do different dialysis modalities compare in terms of their impact on quality of life,
mortality and patient acceptability, and are there specific patient factors that make one modality better for some patients with kidney failure than others?
3) What are the causes and effective treatment(s) of, and ways to prevent, itching in dialysis
patients? 4) What is the best strategy to increase kidney transplantation; including access to
transplantation, increasing the efficiency of the recipient workup, and increasing the availability of donor kidneys?
5) What is the psychological and social impact of kidney failure on patients, their family, and
other caregivers, and can this be reduced? 6) What are the best ways to promote heart health in dialysis patients, including
management of blood pressure?

P a g e | 41
7) For people with kidney failure, what is the impact of each of the dietary restrictions (sodium, potassium, phosphate) separately, and when taken in combination, on important outcomes including quality of life?
8) What are the best ways to manage symptoms in people on or nearing dialysis including
poor energy, nausea, cramping, and restless legs? 9) What are the causes and effective treatment(s) of depression in dialysis patients? 10) What is the best vascular access (among both new and existing types of access) for people
on hemodialysis?
BMM Evaluation
An evaluation plan has been developed to evaluate the algorithm for the management of elevated parathyroid hormone. This algorithm was developed by a multidisciplinary team including nephrology, ENT, Surgery, Endocrinology, and the Department of Health and Wellness. The program has received an industry grant to evaluate process and outcome measures and to provide recommendations to improve the algorithm.
Modality Suitability Assessment
The program has initiated a formalized modality suitability assessment so that incident and prevalent dialysis trends can be better understood, barriers to home dialysis can be identified, and interventions can be implemented and evaluated. The program received an industry grant to assist in database development and data entry.
Provincial Anemia Strategy
Several members of the Renal Program including Anne Hiltz and Drs. Jo-Anne Wilson, Ken West, and David Hirsch have been working collaboratively with the NSRP and the other provincial Renal Programs to develop a standardized approach to anemia management and to improve access to anemia management medications in home dialysis patients.
PATH Clinic
David Landry, NP, initiated the Renal PATH clinic in 2011 based on the model developed by Drs.
Laurie Mallery and Paige Moorhouse. PATH, which stands for Palliative and Therapeutic
Harmonization, is a program that helps identify frailty in elderly patients and helps the patient’s
families and caregivers make health-care decisions that are in the best interests of the patient
and lead to the best quality of life. The program currently supports approximately 70 patients.
Self-Care In-Center Hemodialysis
Self-care in-centre continues to be established, and offers patients an option to participate
partially or fully in their own care in a controlled, supervised setting. This treatment option is a
collaborative effort between the home dialysis unit that provides education and training for the

P a g e | 42
dialysis patient, the in-centre unit that reinforces education and monitors treatments, and the
patients who are actively participating as members of their own care team.
Behaviour Change Institute Over the last couple of years, there have been additional challenges related to providing individualized
patient care in the context of kidney disease. In collaboration, nephrology interdisciplinary team
members, Nova Scotia Renal Program and Behavior Change Institute are moving towards building
additional capacity as it relates to helping health care professionals, patients and families work towards
a shared decision making process. Several interdisciplinary team members in Nephrology have
participated in specialized training sessions to identify helping behaviors and processes to manage
challenging patient situations. In the future, it is expected additional team members will have
opportunities to participate and learn techniques that can assist health care professionals involved with
challenging patient behaviors and situations.
Personal Directives The Nephrology Social Workers co-facilitated 4 education sessions on personal directives. The sessions
were provided to dialysis patients and family members on two consecutive days. Educational handouts,
including sample forms/templates, were distributed and information was also displayed on the bulletin
board in the waiting room. Information about personal directives is also included in the treatment
options education sessions for renal clinic patients. The information is being displayed throughout the
summer in order to increase the opportunities for it to be read by those who may have missed the
sessions or want further information.
Exercise on Hemodialysis
This project is a follow-up of a collaborative initiative between the dialysis patients,
Professional Practice, Dalhousie School of Physiotherapy, and members of the nephrology team
led by Marsha Wood, Carolyn Bartol, and Norma Jean Martel. The Renal program is attempting
to continue this great work and has applied for a grant for another stationary bike. The program
will continue to build relationships with collaborative partners to develop and maintain
initiatives that benefit the lives of patients with Chronic Kidney Disease.
Capital Health Quality Summit
Oral presentation: ‘Why report? Does it even make a difference?’ Team members shared the
experience of reporting medical device equipment malfunctions including the teamwork and
data required along with the visible outcomes. Outcomes included formal acknowledgement
from Health Canada, removal of medical devices from stock, and stimulation of manufacturing
improvements. Also presented were the program action plans that had been developed and
implemented by the Quality and Patient Safety Team. Thank you to Matt Phillips, Paula
Mossop, Carolyn Bartol, and Barb Hodgson (IR).
P a g e | 43
Out of fifty seven posters accepted at the summit, five were presented by members of the
nephrology team including:
Development and Implementation of Ambulatory Medication Reconciliation in the Renal Clinic. Matt Phillips, Jo-Anne Wilson, Marsha Wood, Steven Soroka, Ken West, Carolyn Bartol, Cindy Douglas, Cindy Everett, Lori Paruch, Barb Hirtle, Susan Betts, Anne Hiltz, Cynthia Stockman, Holly Carver, Catherine Doherty, Norma Jean Martel, Penelope Poyah, Tammy Keough-Ryan, Anna Johannesson, Niall Sheehy Evaluation Plan for the ‘Pathway for the Management of Elevated Parathyroid Hormone Levels in Dialysis Patients’. Jo-Anne Wilson, Steven Soroka, Marsha Wood, Matt Phillips, Pam Dill, Tracy Gower, Anastasia Kleronomos-MacAlpine, Niall Sheehy, Carolyn Bartol, Colleen Wile, Michael West, Lucy Helyer, Robert Hart, Margaret Lee Preserving the Dialysis Patient Lifeline. Paula Mossop, CeAnne Giovanni, Matt Phillips Modifying In-Centre Nurses’ Perceptions of Home Dialysis Using An Education Initiative. Matt
Phillips, Karthik Tennankore, Colleen Wile
Foot Care in the Acute Care Setting. Carolyn Bartol, Amy Carpenter
Congratulations to all presenters for their great work!
Quality Care Teams
Renal Program Quality and Patient Safety (Q+PS)
Description of Team:
The team is multidisciplinary and has membership from all program areas as well as patient
experience advisors. The team evolved from the Accreditation team in 2011, and has a focus
on quality of care delivered and patient safety. The team has developed a scorecard, and uses it
to report to the Renal Enabling Team as well as the Medicine Quality and Patient Safety Team.
Highlights:
The team led the program through the 2013 Accreditation process and was specifically involved
in Accreditation evaluation of: Telehealth; Ambulatory Medication Reconciliation in the Renal
Clinic; Point of Care Testing, and, alignment of Organizational Strategic Direction with quality
work at a program level.
The team has also developed action plans based on the information provided by two surveys
completed by staff (‘Work Life Pulse’ and ‘Patient Safety Culture’). The action plans include
quarterly dissemination of incidents reported through the Patient Safety Reporting System
(PSRS), PSRS tutorial at the fall education days, the development of a quarterly newsletter to
P a g e | 44
improve communication in the program, and bi-annual leadership safety rounds (bi-annual
safety rounds has yet to be approved by the Renal Enabling Team).
Future Initiatives:
In 2013/14, the Renal Program will be continuing to focus on delivering person-centered care,
specifically through a focused blitz on advanced care directives as well as developing a strategy
to fully engage patients and families in the development of plans of care. Additionally,
members of the team will be submitting completed work to Accreditation Canada for
consideration of ‘leading practice’ status including the ‘outpatient management of
anticoagulation’ work by the Vascular Access Team as well as the evaluation of the elevated
PTH pathway.
Respectfully submitted by: Matt Phillips co-chair Ambulatory Nephrology Q+PS
Anemia Management Quality Team (AMQT) Description of Team:
This team is comprised of membership from medicine, nursing and pharmacy with representatives from Nephrology Clinic, Home Unit, In-Centre VG and DGH HD and the Community Dialysis Units. The objectives of this team are as follows: 1) to make evidence and practice based recommendations regarding anemia management; 2) to evaluate anemia targets in all areas of the CDHA renal program and to provide clinicians with reports of patients not achieving targets.
Highlights:
Based on 2012 KDIGO Clinical Practice Guidelines for Anemia in Chronic Kidney Disease and 2013 CSN Commentary to the 2012 KDIGO, the following changes to the CDHA renal program are underway or have been implemented:
o New CDHA Anemia Management Protocols/Algorithms with revised targets and monitoring parameters is underway. Waiting final decision from DD&T regarding which IV iron(s) will be selected for hospital drug formulary.
o New single pre-printed orders for iron therapy developed and implemented. o New single pre-printed orders for erythropoeitin developed and implemented. o In light of new concerns in the literature regarding high-dose erythropoietin
stimulating agents (ESA), a review of hyporesponsive patients will be conducted on a quarterly basis and a report will be generated and sent to clinicians to review.
o Hyporesponsive management algorithm has been developed with criteria for maximum ESA Dosing. This tool will be used in conjunction with new anemia management protocols/algorithms.
Quarterly anemia reports have been tailored to provide clinicians and nursing with the following information so patients can be reviewed and necessary changes performed.
o Site specific (e.g., Nephrololgy Clinic, Home Unit, In-Centre VG and DGH

P a g e | 45
Hemodialysis and Community Dialysis Units) attainment of anemia targets.
o Number of hyporesponsive patients (Defined as: Aranesp dosage ≥ 300
mcg/month and Tsat > 20% , Ferritin > 200 (HD) or > 100 (PD) and Hbg < 100
g/L). o Number of patients on Aranesp medication with irons studies less than desired
anemia targets.
Drug formulary request for alternate IV iron in the renal program submitted and a decision is pending in mid-June 2014. Much of the work to the IV iron protocols/algorithms is dependent on the decision by the DT&T committee around which IV iron(s) will be on the hospital drug formulary. Depending on which IV iron(s) our program will be using, will impact the timing of monitoring and assessing of iron studies.
Two members of the anemia committee were invited to the fall DT&T committee to present the findings (such as Health Canada data, comprehensive literature search and survey information from other Canadian Renal programs) conducted by the Nephrology Quality and Patient Safety Team around the adverse reactions to iron dextran that were experienced by patients in our program.
Method of administering intravenous (IV) iron from infusion to IV direct implemented program wide.
Changes to the timing and frequency of measuring iron studies following an IV iron load were implemented.
Developed a process in conjunction with chemistry laboratory group to systematically respond to TSAT being reported as invalid.
Development of blood work anemia process map is underway to determine if scheduling weekly comprehensive anemia nursing reviews may reduce missing blood work as was done in the past. At present, anemia blood work is reviewed every shift which has not been consistently adopted.
The following anemia patient education pamplets were developed: o Injectable Iron Sucrose and Chronic Kidney Disease o Oral Iron and Chronic Kidney Diease o Erthropoiesis-Stimulating Agent Therapy and Chornic Kidney Disease
Interactive Anemia Education session for nursing staff was conducted and supported by an educational sponsorship grant.
Implementation of thermometer and education to staff in all dialysis and satellite units regarding ESA stability and storage of a costly refrigerated medication.
Continue to monitor process for new hemodialysis starts who have an outpatient supply of ESA therapy from renal clinic.
Future Initiatives:
The Nova Scotia Renal Program has formed a working group with representatives from all three provinicial renal programs with the aim to develop a standardized approach to anemia management provincially for Home Hemodialysis, Peritoneal Dialysis, Pre-

P a g e | 46
dialysis, In-center and Satellite dialysis. This work began shortly after the publication of the CSN 2013 commentary and will continue over the next year.
To investigate the feasibility of a renal clinic anemia management protocol administered by nursing staff.
To investigate the feasibility of a home unit anemia management protocol administered by nursing staff.
To develop a research study to evaluate whether reducing ESA therapy in patients with ESA hyporesponsiveness results in a change in hemoglobin . Submitted respectfully by: Dr. Jo-Anne Wilson, Chair AMQT
Kidney Patient Advocacy Committee (KPAC 3)
Description of Team:
KPAC is a group of kidney patients and family members which was formed in 2010. Initially, the group came together as an ad hoc committee formed with the intention of petitioning the government for funding for much needed improvements to our dialysis unit. As a result of that task, we became a permanent group representing dialysis patients and their families. We meet monthly with dialysis administration and staff with the goal of presenting ongoing patient issues, in an effort to find the best possible solutions.
Highlights:
In the past year we have brought forward many patient & caregiver concerns, and have addressed and provided viable solutions where we could as part of our vision to ‘make the dialysis experience the best it can be. We are now beginning to provide our information online via the CDHA website; meeting minutes and our new quarterly newsletter are available to home dialysis patients and to all satellite dialysis units. A new terms of reference design and statement have been initiated, with our Mission outlined as follows:
Advocating for all Clinic, Satellite and Home Dialysis Clients
Improving physical spaces and lobbying for funding for new units as well as interim improvements to all Capital Health Dialysis Centres
Communicating with Clinic and Home Dialysis patients and caregivers to collect ideas, questions and concerns; and provide news, information and feedback
Communicating concerns to dialysis administration, nursing staff, doctors and social workers
Promoting patient education and kidney awareness
Supporting each other in dealing with day to day issues
P a g e | 47
Efforts are being made to better include representation from both home dialysis patients and from patients attending treatment in the other CDHA dialysis units.
Future Initiatives:
Our primary focus continues to be patient advocacy by acting as liaison between patients and staff. Our biggest challenge remains the ability to sustain and grow this group throughout the CDHA dialysis network.
Areas for Improvement:
We always welcome new representation from all of the dialysis shifts and locations so that the committee is able to continue in the most effective way possible. We are working to connect to all patients via electronic methods, newsletter and our email [email protected], so that all ideas, concerns can be acknowledged, reviewed and action in a more timely manner. We will continue to focus on establishing better communication methods for all CDHA dialysis patients and caregivers.
Respectfully Submitted by Tim Harnish - Chairperson
Bone and Mineral Metabolism (BMM) Quality Team
The Pathway for the Management of Elevated Parathyroid Hormone Levels in Dialysis Patients was approved by the Department of Health and Wellness and we began using this process in March 2013. Work is currently underway to evaluate the following aspects of the pathway:
the response to non-calcium-based phosphate binders as defined by a reduction in serum phosphate of 0.7 mmol/L over two months after starting therapy;
the response to Cinacalcet as defined by a 30% reduction in iPTH after at least three months with an escalating dose;
to compare the number of patients in the program who meet criteria for non-calcium based phosphate binders and calcimimetic treatment to the number who were prescribed these therapies;
to determine the number of patients referred for parathyroidectomy compared to the number who were eligible; and
to determine wait times from consult to referral, and referral to surgery for the patients who are referred for parathyroidectomy.
Staff education:
An evening education session for staff on Secondary Hyperparathyroidism was given by Dr.
Poyah and Dr. Wilson.

P a g e | 48
Patient education:
A CKD Bone and Mineral Resource pamphlet portfolio to assist with patient education was developed and made accessible to all program areas. Three patient education pamphlets were developed for sensipar (cinacalcet), renagel (sevelamer), and fosrenol (lanthanum). An education grant from Sanofi, provided an opportunity to obtain food models to assist with diet teaching, as well as initiate a rewards program to help motivate patients to achieve BMD targets, and will run over the next year. Respectfully submitted, Marsha Wood
PD Quality
Description of Team:
The team is chaired by the Medical Director of Peritoneal Dialysis, and includes the Medical
Director of Community Home Dialysis, peritoneal dialysis access nurse, clinical nurse educator,
health services manager, pharmacist, clinical leader home and satellite dialysis unit, quality
leader, and the PD desk nurse (home dialysis unit). The team meets quarterly and reviews rates
of peritonitis and exit site infections, as well as wait times for access clinic, OR, and training.
Highlights of the Team:
The team has started a journal club funded by industry to stimulate discussion, learning, and
improved care for patients on Peritoneal Dialysis.
Future Initiatives:
The PD Catheter function report has been changed to a yearly report from quarterly, and
special attention will be paid to all patients who undergo surgery for a PD catheter, but who
initiate a form of dialysis other than PD.
Practice and Safety
Description of Team:
The practice and safety team is comprised of in-centre and Dartmouth staff and focuses on
workplace safety and identifies challenges and opportunities for improvement. Meetings are
monthly, and all staff are welcome. Agenda items include standing items: Role of the Patient
Care Coordinator (PCC); teamwork; expansion of the new HI site; and, problems and possible
solutions.

P a g e | 49
Highlights of the team:
In 2011, the team developed an improvement strategy to improve the compliance with the role
of the PCC. Staff surveys were completed, baseline trending was completed, and a review of
literature was conducted. The team subsequently adapted a charting documentation tool to
guide the PCC review, as well as provide the team a way to audit the process. Results at six
months post implementation demonstrated minor improvements in both outcome and process
measures.
Future initiatives:
The team is continuing with small monthly audits of the role of the PCC and sharing results with
staff. The team has also begun to experiment with meeting times as well as locations to
facilitate and encourage staff involvement.
Professional Practice
Description of Team:
The team is chaired by the clinical leaders in the renal program, and has membership including frontline staff from many program areas, educators, nurse practitioner, and quality leader.
Highlights:
The Professional Practice Quality Team has improved the yearly competency assessment forms. These forms are mandatory for every front-line staff to complete on a yearly basis. During 2011, the team transferred the forms to an electronic survey format which facilitated tracking of who had completed the forms, as well as significantly reduced the time and effort required to collate the over two hundred forms yearly. Also, the team has been attempting to improve documentation practices within the program. In an attempt to increase awareness in front-line staff of what is audited in documentation audits, each front-line staff member was asked to complete two chart audits. The completion rate for this was almost 100%. The conversion of both of these processes to electronic format has reduced approximately forty hours of manual data entry.
Future Initiatives:
The team will be continuing to evaluate and improve the use of electronic forms, as well as continue to target improved documentation.
Vascular Access
Description of Team:
The Vascular Access Quality care Team has: established vascular access quality performance measurement indicators; established what information needs to be collected, on what frequency, and how reporting of identified quality indicators should be managed; identified, implemented, and monitored quality improvement initiatives through quarterly and annual reporting; and engaged renal program members in the collection and utilization of accurate, evidence-based practice.

P a g e | 50
A close relationship remains ongoing between the Division of Nephrology and our Interventional Radiology colleagues as well as the dedicated surgeons involved with creating/ revising AVF’s.
Highlights:
Members of the team received recognition from Health Canada for the reporting of medical equipment device malfunctions related to cuff non adherence. This reporting led to the removal of several Central Venous Catheters (CVCs) from stock.
Future Initiatives:
In an effort to reduce the number of patients awaiting surgery for creation of AVF, members of the team are exploring other possible locations where AVFs can be created. Additionally, the team will be closely analyzing the patients in the program who dialyze with a CVC as the prevalent access to determine the reason(s) that AVFs are not used with more prevalence. Respectfully Submitted by Paula Mossop
Home Hemodialysis Quality Team Description of Team:
The team is chaired by the clinical leader of the home dialysis program, and has membership including Health Service Manager, Director of Community Home Dialysis, Physicians, Nurse Educator, Chief Dialysis Technologist, Quality Leader, and frontline staff. The purpose of the team is to monitor and improve quality of care for a home hemodialysis patient and to deliver home hemodialysis in a safe and effective manner to patients.
Highlights:
The Home Hemodialysis Quality Team has begun the initiation of home visits after patients have been trained and started performing their treatments at home. These visits take place at the first one and six months, and then yearly. This has allowed patients to have the nurse be available in their own environment and provide the follow up care that is needed. A risk assessment tool has been adapted from Continuing Care by the Clinical Nurse Educator. This is completed by nursing staff prior to patient beginning home hemodialysis. A home hemodialysis agreement has been developed and approved by risk management. It outlines what the expectations will be from both the Home dialysis staff and the patient during their time within the home dialysis program.
Future Initiatives:
It was recognized that there needs to be a clear communication tool for the biomedical technologists to document any concerns while visiting a patient’s home. The team is in the process of developing a documentation tool for them. This would ensure that these concerns would be relayed to our home dialysis team for immediate follow up if necessary.
Respectfully submitted by: Rachael Blair

P a g e | 51
Directions/Priorities for Future Planning
Expansion of Dickson Dialysis Unit
The design of a 12-station unit was completed. Construction of the new unit will begin in the
summer of 2014.
Future Expansions
A 9-station expansion for the DGH unit was announced in December 2013. There are no firm
dates yet but it will be tied to the other expansion work at Dartmouth. A new satellite unit for
Bridgewater was also announced in December 2013.
New Satellite Dialysis Unit in the Valley Regional Hospital
In the fall of 2012, the DOHW announced funding for the design phase of a new 12-station
satellite dialysis unit in the Valley Regional Hospital that will replace the existing 6-station unit
in the Western King’s Memorial Health Centre.
Expanding Home Therapies
The renal program has developed a multi-pronged approach to expanding home therapies
including the production of a home dialysis educational video in the renal clinic, a study
measuring pre and post scores of an educational intervention on the perceptions of home
dialysis of in-centre HD unit nurses, and the introduction of a formalized modality suitability
assessment. Additionally, Dr. Tennankore and Cynthia Stockman have received a Translating
Research into Practice (TRIC) grant to develop an electronic tool aimed at improving care and
communication with home dialysis patients.
Provincial District Health Authority Transition
The provincial government is transitioning from ten provincial district health authorities to one
district health authority and the IWK. The transition is still in the design and planning phase, so
impacts to organizational structure are not yet known.