renaissance canadian monthly income fund interim financial … › en › downloads › statutory...
TRANSCRIPT

The accompanying notes are an integral part of these financial statements.
Renaissance Canadian Monthly Income Fund
Interim Financial Statements (unaudited)for the period ended February 28, 2014
x
Statement of Investment Portfolio (unaudited) As at February 28, 2014
SecurityNumber
of Shares
Average Cost
($000s)
Current Value
($000s)
% of Net
Assets
CANADIAN EQUITIES x
Consumer Discretionary ..
Magna International Inc., Class 'A' 16,780 692 1,651 ..
.. ..
692 1,651 1.1% . . x
Energy ..
AltaGas Ltd. 34,129 755 1,449 ..
AltaGas Ltd., Preferred, Series 'A', Variable Rate, Convertible, Callable
3,666 96 90
..
Baytex Energy Corp. 31,876 1,567 1,285 ..
Bonavista Energy Corp. 70,092 977 1,115 ..
Canadian Natural Resources Ltd. 85,780 3,028 3,476 ..
Canadian Oil Sands Ltd. 55,890 1,116 1,179 ..
Cenovus Energy Inc. 66,960 2,120 1,961 ..
Crescent Point Energy Corp. 43,698 1,697 1,698 ..
Enbridge Inc., Preferred, Series 'F', Variable Rate, Perpetual, Callable
3,180 82 78
..
Husky Energy Inc. 32,080 932 1,080 ..
MEG Energy Corp. 34,560 1,246 1,178 ..
Penn West Petroleum Ltd. 139,315 1,250 1,265 ..
Suncor Energy Inc. 106,110 3,584 3,876 ..
Talisman Energy Inc. 84,080 1,101 959 ..
TransCanada Corp. 20,780 939 1,013 ..
TransCanada Corp., 4.00%, Preferred, Series '3', Variable Rate, Convertible, Callable
4,224 105 86
..
Vermilion Energy Inc. 7,017 345 439 ..
Westcoast Energy Inc., 5.50%, Preferred, Series '7', Perpetual 775 19 19 ..
.. ..
20,959 22,246 14.7% . . x
Financials ..
Bank of Montreal 64,871 3,494 4,731 ..
Bank of Montreal, 4.50%, Preferred, Class 'B', Series '13', Perpetual, Callable
3,772 97 96
..
Bank of Nova Scotia 51,518 2,702 3,262 ..
Bank of Nova Scotia, 4.50%, Preferred, Series '15', Callable 6,930 178 178 ..
Bank of Nova Scotia, Preferred, Series '28', Convertible, Callable
2,460 65 62
..
Canadian Imperial Bank of Commerce 49,220 3,691 4,561 ..
Cominar REIT 61,367 1,091 1,112 ..
Dundee REIT 53,676 1,647 1,582 ..
Granite Real Estate Investment Trust, Stapled Units 32,090 1,238 1,226 ..
Great-West Lifeco Inc., 4.85%, Preferred, Series 'H', Perpetual 5,300 134 120 ..
H&R REIT 76,988 1,427 1,709 ..
Labrador Iron Ore Royalty Corp. 35,890 403 1,149 ..
Manulife Financial Corp. 140,860 2,524 2,959 ..
Manulife Financial Corp., Preferred, Class '1', Series '7', Variable Rate, Perpetual
3,660 97 95
..
Manulife Financial Corp., Preferred, Series '4', Variable Rate, Perpetual
3,525 94 89
..
Power Corp. of Canada 48,800 1,326 1,478 ..
Power Financial Corp. 49,550 1,414 1,727 ..
Power Financial Corp., 5.50%, Preferred, Series 'R', Callable 3,660 98 91 ..
Royal Bank of Canada 102,730 4,692 7,390 ..
Royal Bank of Canada, 4.50%, Preferred, Series 'AD', Callable 4,240 110 108 ..
Sun Life Financial Inc. 76,746 2,024 2,942 ..
Sun Life Financial Inc., 4.50%, Preferred, Class 'A', Series '5', Perpetual, Callable
4,240 105 92
..
Sun Life Financial Inc., 4.75%, Preferred, Class 'A', Series '1', Callable
2,600 65 58
1
The accompanying notes are an integral part of these financial statements.
Renaissance Canadian Monthly Income Fund
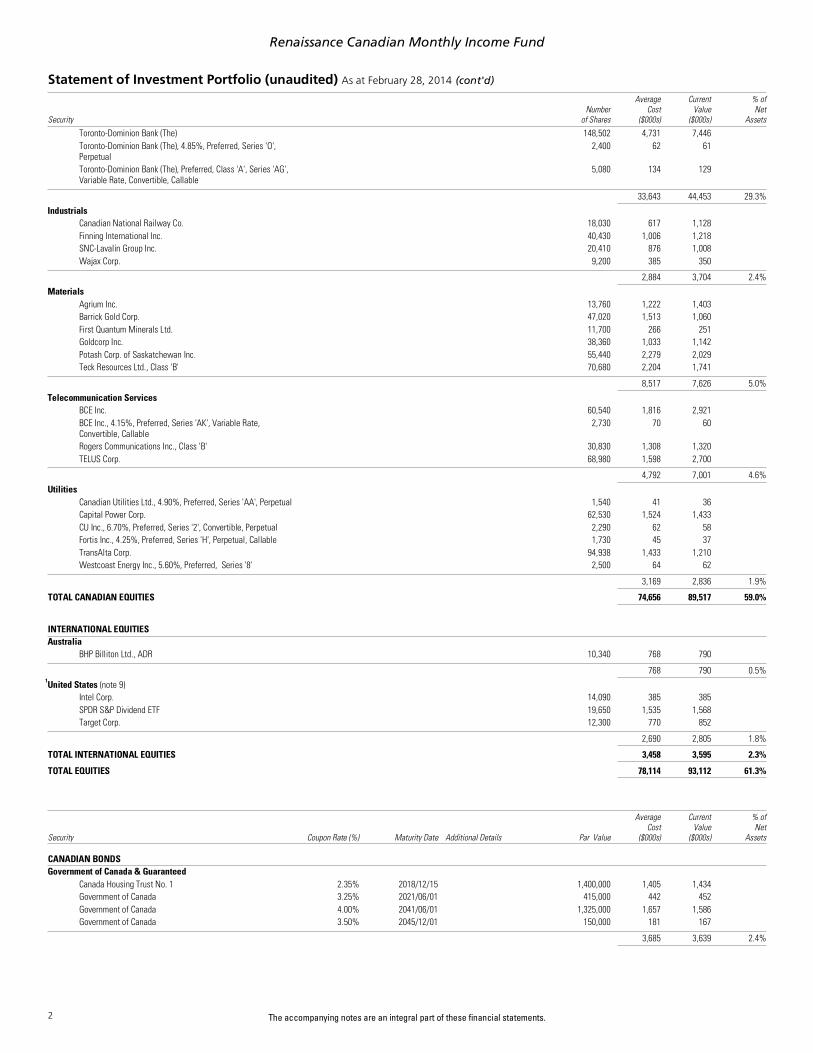
Statement of Investment Portfolio (unaudited) As at February 28, 2014 (cont'd)
SecurityNumber
of Shares
Average Cost
($000s)
Current Value
($000s)
% of Net
Assets ..
Toronto-Dominion Bank (The) 148,502 4,731 7,446 ..
Toronto-Dominion Bank (The), 4.85%, Preferred, Series 'O', Perpetual
2,400 62 61
..
Toronto-Dominion Bank (The), Preferred, Class 'A', Series 'AG', Variable Rate, Convertible, Callable
5,080 134 129
..
.. ..
33,643 44,453 29.3% . . x
Industrials ..
Canadian National Railway Co. 18,030 617 1,128 ..
Finning International Inc. 40,430 1,006 1,218 ..
SNC-Lavalin Group Inc. 20,410 876 1,008 ..
Wajax Corp. 9,200 385 350 ..
.. ..
2,884 3,704 2.4% . . x
Materials ..
Agrium Inc. 13,760 1,222 1,403 ..
Barrick Gold Corp. 47,020 1,513 1,060 ..
First Quantum Minerals Ltd. 11,700 266 251 ..
Goldcorp Inc. 38,360 1,033 1,142 ..
Potash Corp. of Saskatchewan Inc. 55,440 2,279 2,029 ..
Teck Resources Ltd., Class 'B' 70,680 2,204 1,741 ..
.. ..
8,517 7,626 5.0% . . x
Telecommunication Services ..
BCE Inc. 60,540 1,816 2,921 ..
BCE Inc., 4.15%, Preferred, Series 'AK', Variable Rate, Convertible, Callable
2,730 70 60
..
Rogers Communications Inc., Class 'B' 30,830 1,308 1,320 ..
TELUS Corp. 68,980 1,598 2,700 ..
.. ..
4,792 7,001 4.6% . . x
Utilities ..
Canadian Utilities Ltd., 4.90%, Preferred, Series 'AA', Perpetual 1,540 41 36 ..
Capital Power Corp. 62,530 1,524 1,433 ..
CU Inc., 6.70%, Preferred, Series '2', Convertible, Perpetual 2,290 62 58 ..
Fortis Inc., 4.25%, Preferred, Series 'H', Perpetual, Callable 1,730 45 37 ..
TransAlta Corp. 94,938 1,433 1,210 ..
Westcoast Energy Inc., 5.60%, Preferred, Series '8' 2,500 64 62 ..
.. ..
3,169 2,836 1.9% . .
..
TOTAL CANADIAN EQUITIES 74,656 89,517 59.0% . .
x
INTERNATIONAL EQUITIES x
Australia ..
BHP Billiton Ltd., ADR 10,340 768 790 ..
.. ..
768 790 0.5% . .
x1United States (note 9)
..
Intel Corp. 14,090 385 385 ..
SPDR S&P Dividend ETF 19,650 1,535 1,568 ..
Target Corp. 12,300 770 852 ..
.. ..
2,690 2,805 1.8% . .
..
TOTAL INTERNATIONAL EQUITIES 3,458 3,595 2.3% . .
..
TOTAL EQUITIES 78,114 93,112 61.3% . .
Security Coupon Rate (%) Maturity Date Additional Details Par Value
Average Cost
($000s)
Current Value
($000s)
% of Net
Assets
CANADIAN BONDS x
Government of Canada & Guaranteed ..
Canada Housing Trust No. 1 2.35% 2018/12/15 1,400,000 1,405 1,434 ..
Government of Canada 3.25% 2021/06/01 415,000 442 452 ..
Government of Canada 4.00% 2041/06/01 1,325,000 1,657 1,586 ..
Government of Canada 3.50% 2045/12/01 150,000 181 167 ..
.. ..
3,685 3,639 2.4% . .
2

The accompanying notes are an integral part of these financial statements.
Renaissance Canadian Monthly Income Fund
Statement of Investment Portfolio (unaudited) As at February 28, 2014 (cont'd)
Security Coupon Rate (%) Maturity Date Additional Details Par Value
Average Cost
($000s)
Current Value
($000s)
% of Net
Assets x
Provincial Government & Guaranteed ..
Hydro-Québec 11.00% 2020/08/15 Series 'HL' 300,000 472 451 ..
New Brunswick (F-M) Project Co. Inc. 6.47% 2027/11/30 Step Coupon, Callable 130,699 150 158 ..
Province of British Columbia 4.95% 2040/06/18 1,800,000 2,279 2,180 ..
Province of New Brunswick 4.40% 2019/06/03 2,200,000 2,471 2,446 ..
Province of New Brunswick 5.50% 2034/01/27 Series 'GJ' 1,050,000 1,356 1,293 ..
Province of Newfoundland and Labrador 4.65% 2040/10/17 1,225,000 1,206 1,387 ..
Province of Nova Scotia 4.15% 2019/11/25 500,000 505 551 ..
Province of Ontario 4.20% 2020/06/02 250,000 284 276 ..
Province of Ontario 3.15% 2022/06/02 2,000,000 2,039 2,041 ..
Province of Quebec 4.25% 2021/12/01 400,000 412 440 ..
Province of Saskatchewan 3.40% 2042/02/03 550,000 545 521 ..
.. ..
11,719 11,744 7.7% . . x
Municipal Government & Guaranteed ..
Greater Toronto Airports Authority 3.04% 2022/09/21 Callable 250,000 250 249 ..
Municipal Finance Authority of British Columbia 4.45% 2020/06/01 1,750,000 1842 1946 ..
Municipal Finance Authority of British Columbia 3.75% 2023/09/26 600,000 598 627 ..
Vancouver International Airport Authority 7.43% 2026/12/07 Series 'B', Step Coupon 535,000 737 723 ..
.. ..
3,427 3,545 2.3% . . x
Mortgage-Backed Securities ..
Real Estate Asset Liquidity Trust 4.34% 2015/06/12 Class 'A1', Series '2005-2' 32,765 33 34 ..
Real Estate Asset Liquidity Trust 5.20% 2017/03/12 Class 'A1', Series '2007-2', Variable Rate, Callable
15,912 17 17
..
Real Estate Asset Liquidity Trust 5.20% 2017/06/12 Class 'A2', Series '2007-2' 75,000 80 82 ..
.. ..
130 133 0.1% . . x
Corporate ..
407 International Inc. 3.87% 2017/11/24 Callable 625,000 621 663 ..
407 International Inc. 5.75% 2036/02/14 Series '06D1' 340,000 375 399 ..
Alimentation Couche-Tard Inc. 3.32% 2019/11/01 440,000 441 439 ..
Alimentation Couche-Tard Inc. 3.90% 2022/11/01 Series '3' 435,000 436 424 ..
Alliance Pipeline L.P. 6.77% 2025/12/31 291,207 325 345 ..
Bank of Montreal 2.39% 2017/07/12 Callable 775,000 775 787 ..
Bank of Montreal 2.84% 2020/06/04 Callable 375,000 375 378 ..
Bank of Montreal 3.98% 2021/07/08 Variable Rate, Callable 540,000 543 565 ..
Bank of Montreal Subordinated Notes Trust 5.75% 2022/09/26 Variable Rate, Callable 50,000 56 56 ..
Bank of Nova Scotia 1.80% 2016/05/09 400,000 400 402 ..
Bank of Nova Scotia 6.65% 2021/01/22 Variable Rate, Callable 625,000 718 680 ..
Bank of Nova Scotia 2.90% 2022/08/03 Variable Rate, Callable 675,000 675 690 ..
Bank of Nova Scotia 3.04% 2024/10/18 Variable Rate, Callable 200,000 200 203 ..
Bell Aliant Regional Communications L.P. 5.41% 2016/09/26 Callable 75,000 81 81 ..
Bell Canada 3.35% 2019/06/18 Series 'M-25', Callable 325,000 324 334 ..
Bell Canada 3.35% 2023/03/22 Series 'M-26', Callable 625,000 624 606 ..
Bell Canada 8.88% 2026/04/17 25,000 31 34 ..
Brascan Corp. 5.95% 2035/06/14 75,000 69 79 ..
British Columbia Ferry Services Inc. 4.70% 2043/10/23 Series '13-1', Restricted, Callable
225,000 225 238
..
BRP Finance ULC 5.25% 2018/11/05 Series '3', Callable 50,000 51 55 ..
BRP Finance ULC 5.14% 2020/10/13 Series '7', Callable 175,000 175 192 ..
BRP Finance ULC 4.79% 2022/02/07 Callable 350,000 350 372 ..
Caisse centrale Desjardins du Québec 2.28% 2016/10/17 675,000 675 684 ..
Calloway REIT 5.37% 2016/10/12 Series 'B', Convertible, Callable
50,000 52 54
..
Calloway REIT 3.75% 2021/02/11 Series 'L' 150,000 150 151 ..
Clarica Life Insurance Co. 6.30% 2028/05/15 Series '2' 50,000 53 61 ..
Daimler Canada Finance Inc. 2.28% 2017/02/17 525,000 526 529 ..
Dundee Real Estate Investment Trust 3.42% 2018/06/13 Callable 260,000 261 262 ..
Enbridge Inc. 4.77% 2019/09/02 Callable 1,975,000 2,230 2,183 ..
Enbridge Inc. 4.24% 2042/08/27 Callable 275,000 275 265 ..
Fortis Inc. 4.00% 2015/07/02 Instalment Receipts, Convertible
1,201,000 366 389
..
Fortis Inc. 6.51% 2039/07/04 Callable 100,000 120 131 ..
Gaz Métro inc. 10.45% 2016/10/31 Series 'D' 156,000 213 190 ..
GE Capital Canada Funding Co. 4.24% 2015/06/08 Series 'A' 375,000 375 388 ..
GE Capital Canada Funding Co. 4.60% 2022/01/26 300,000 300 330 ..
George Weston Ltd. 3.78% 2016/10/25 Callable 300,000 300 313 ..
Great-West Lifeco Inc. 4.65% 2020/08/13 Callable 500,000 501 552 ..
Great-West Lifeco Inc. 6.67% 2033/03/21 Callable 50,000 58 64 ..
Hospital Infrastructure Partners NOH Partnership 5.44% 2045/01/31 Series 'A', Sinkable, Callable 125,000 125 140
3

The accompanying notes are an integral part of these financial statements.
Renaissance Canadian Monthly Income Fund
Statement of Investment Portfolio (unaudited) As at February 28, 2014 (cont'd)
Security Coupon Rate (%) Maturity Date Additional Details Par Value
Average Cost
($000s)
Current Value
($000s)
% of Net
Assets ..
Husky Energy Inc. 5.00% 2020/03/12 Callable 425,000 442 473 ..
Hydro One Inc. 2.78% 2018/10/09 Callable 375,000 375 384 ..
Hydro One Inc. 4.59% 2043/10/09 Callable 415,000 415 439 ..
Loblaw Cos. Ltd. 4.86% 2023/09/12 Callable 625,000 625 669 ..
Manufacturers Life Insurance Co. (The) 2.81% 2024/02/21 Variable Rate, Callable 225,000 225 226 ..
Manulife Financial Capital Trust II 7.41% 2019/12/31 Series '1', Variable Rate, Callable
625,000 703 760
..
Master Credit Card Trust 3.50% 2016/05/21 Class 'A', Series '2011-1' 350,000 350 364 ..
National Bank of Canada 2.05% 2016/01/11 275,000 275 277 ..
NAV Canada 1.95% 2018/04/19 450,000 450 448 ..
NBC Asset Trust 7.24% 2018/06/30 Variable Rate, Perpetual, Callable
25,000 29 30
..
NBC Asset Trust 7.45% 2020/06/30 Series '2', Variable Rate, Perpetual, Callable
25,000 29 31
..
Penske Truck Leasing Canada Inc. 3.65% 2018/02/01 Callable 200,000 201 206 ..
Plenary Health Care Partnerships Humber L.P. 4.82% 2044/11/30 Callable 300,000 307 311 ..
Rogers Communications Inc. 5.80% 2016/05/26 Callable 900,000 989 976 ..
Rogers Communications Inc. 4.00% 2022/06/06 Callable 250,000 249 255 ..
Rogers Communications Inc. 6.11% 2040/08/25 765,000 789 873 ..
Royal Bank of Canada 2.58% 2017/04/13 275,000 275 281 ..
Royal Bank of Canada 2.26% 2018/03/12 525,000 525 527 ..
Royal Bank of Canada 3.18% 2020/11/02 Variable Rate, Callable 625,000 625 639 ..
Scotiabank Tier I Trust 7.80% 2019/06/30 Variable Rate, Callable 150,000 177 185 ..
SNC-Lavalin Group Inc. 6.19% 2019/07/03 Callable 680,000 781 775 ..
SNC-Lavalin Innisfree McGill Finance Inc. 6.63% 2044/06/30 Callable 525,000 543 636 ..
Sobeys Inc. 3.52% 2018/08/08 100,000 100 103 ..
Sobeys Inc. 4.70% 2023/08/08 Callable 275,000 275 288 ..
Sun Life Financial Inc. 7.90% 2019/03/31 Series '2009-1', Variable Rate, Callable
500,000 576 502
..
Sun Life Financial Inc. 4.38% 2022/03/02 Series '2012-1', Variable Rate, Callable
825,000 827 876
..
Suncor Energy Inc. 5.39% 2037/03/26 Callable 65,000 66 72 ..
TD Capital Trust III 7.24% 2018/12/31 Variable Rate, Perpetual 250,000 293 301 ..
TD Capital Trust IV 6.63% 2021/06/30 Variable Rate, Callable 150,000 166 180 ..
TELUS Corp. 3.65% 2016/05/25 Callable 250,000 249 260 ..
TELUS Corp. 5.05% 2019/12/04 Series 'CG', Callable 1,000,000 1,135 1,116 ..
TELUS Corp. 5.05% 2020/07/23 Series 'CH', Callable 525,000 526 586 ..
TELUS Corp. 3.35% 2023/03/15 Series 'CJ', Callable 275,000 275 268 ..
TELUS Corp. 4.40% 2043/04/01 Callable 850,000 848 795 ..
Teranet Holdings L.P. 4.81% 2020/12/16 Callable 350,000 344 383 ..
Thomson Reuters Corp. 6.00% 2016/03/31 Callable 75,000 85 81 ..
Toronto-Dominion Bank (The) 2.95% 2016/08/02 300,000 300 309 ..
Toronto-Dominion Bank (The) 4.78% 2016/12/14 Variable Rate, Callable 625,000 638 670 ..
Toronto-Dominion Bank (The) 5.76% 2017/12/18 Variable Rate, Callable 375,000 420 421 ..
Toronto-Dominion Bank (The) 2.17% 2018/04/02 425,000 425 427 ..
Toyota Credit Canada Inc. 2.20% 2017/10/19 275,000 275 276 ..
Union Gas Ltd. 5.20% 2040/07/23 Callable 200,000 201 227 ..
Wells Fargo Financial Canada Corp. 2.77% 2017/02/09 1,350,000 1,359 1,383 ..
Wells Fargo Financial Canada Corp. 2.78% 2018/11/15 250,000 250 254 ..
Wells Fargo Financial Canada Corp. 2.94% 2019/07/25 400,000 400 407 ..
Wells Fargo Financial Canada Corp. 3.04% 2021/01/29 450,000 450 452 ..
West Edmonton Mall Property Inc. 4.06% 2024/02/13 Series 'B2', Sinkable 150,000 150 151 ..
Westcoast Energy Inc. 4.57% 2020/07/02 Series '10', Callable 235,000 236 256 ..
Westcoast Energy Inc. 8.85% 2025/07/21 50,000 70 71 ..
.. ..
34,768 35,588 23.4% . .
..
TOTAL CANADIAN BONDS 53,729 54,649 35.9% . .
x
INTERNATIONAL BONDS x
Australia ..
Commonwealth Bank of Australia 5.15% 2020/04/09 235,000 235 263 ..
.. ..
235 263 0.2% . .
x1United States (note 9)
..
Anheuser-Busch InBev Finance Inc. 2.38% 2018/01/25 Series 'Maple', Callable 950,000 945 957 ..
Anheuser-Busch InBev Worldwide Inc. 3.65% 2016/01/15 375,000 375 389 ..
.. ..
1,320 1,346 0.9% . .
..
TOTAL INTERNATIONAL BONDS 1,555 1,609 1.1% . .
..
TOTAL BONDS 55,284 56,258 37.0% . .
4
The accompanying notes are an integral part of these financial statements.
Renaissance Canadian Monthly Income Fund
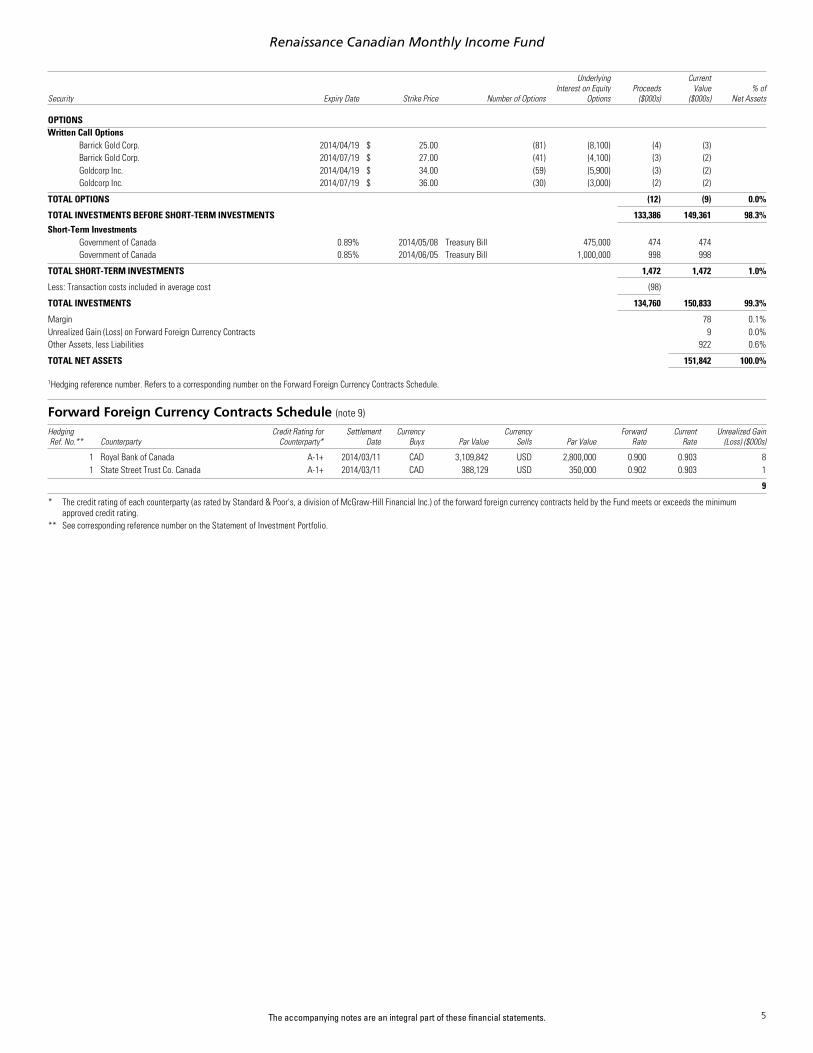
Security Expiry Date Strike Price Number of Options
Underlying Interest on Equity
OptionsProceeds ($000s)
Current Value
($000s)% of
Net Assets
OPTIONS x
Written Call Options ..
Barrick Gold Corp. 2014/04/19 $ 25.00 (81) (8,100) (4) (3) ..
Barrick Gold Corp. 2014/07/19 $ 27.00 (41) (4,100) (3) (2) ..
Goldcorp Inc. 2014/04/19 $ 34.00 (59) (5,900) (3) (2) ..
Goldcorp Inc. 2014/07/19 $ 36.00 (30) (3,000) (2) (2) ..
.. ..
TOTAL OPTIONS (12) (9) 0.0% . .
..
TOTAL INVESTMENTS BEFORE SHORT-TERM INVESTMENTS 133,386 149,361 98.3% . . x
Short-Term Investments ..
Government of Canada 0.89% 2014/05/08 Treasury Bill 475,000 474 474 ..
Government of Canada 0.85% 2014/06/05 Treasury Bill 1,000,000 998 998 ..
.. ..
TOTAL SHORT-TERM INVESTMENTS 1,472 1,472 1.0% . .
..
Less: Transaction costs included in average cost (98) .
.. ..
TOTAL INVESTMENTS 134,760 150,833 99.3% . .
..
Margin 78 0.1% ..
Unrealized Gain (Loss) on Forward Foreign Currency Contracts 9 0.0% ..
Other Assets, less Liabilities 922 0.6% ..
.. ..
TOTAL NET ASSETS 151,842 100.0% . .
x
1Hedging reference number. Refers to a corresponding number on the Forward Foreign Currency Contracts Schedule.x
Forward Foreign Currency Contracts Schedule (note 9)
Hedging Ref. No.** Counterparty
Credit Rating for Counterparty*
Settlement Date
Currency Buys Par Value
Currency Sells Par Value
Forward Rate
Current Rate
Unrealized Gain (Loss) ($000s)
x ..
1 Royal Bank of Canada A-1+ 2014/03/11 CAD 3,109,842 USD 2,800,000 0.900 0.903 8 ..
1 State Street Trust Co. Canada A-1+ 2014/03/11 CAD 388,129 USD 350,000 0.902 0.903 1 .. .. ..
9 . . ..
* The credit rating of each counterparty (as rated by Standard & Poor's, a division of McGraw-Hill Financial Inc.) of the forward foreign currency contracts held by the Fund meets or exceeds the minimum approved credit rating.
..
** See corresponding reference number on the Statement of Investment Portfolio.
5

The accompanying notes are an integral part of these financial statements.
Renaissance Canadian Monthly Income Fund
Supplemental Schedule to Statement of Investment Portfolio
Risk ManagementInvestment Objective: Renaissance Canadian Monthly Income Fund (the Fund) seeks to generate a high level of current cash flow by investing primarily in income-producing securities including income trusts, preferred shares, common shares, and fixed income securities.
Investment Strategies: The Fund invests to provide a consistent, long-term income stream and capital preservation and employs a strategic asset allocation strategy.
The Statement of Investment Portfolio presents the securities held by the Fund as at February 28, 2014 and groups the securities by asset type, industry sector, geographic region, or currency exposure. Significant risks that are relevant to the Fund are discussed here. General information on risk management and specific discussion on credit, currency, interest rate, liquidity, and other price/market risk can be found in note 2 of the financial statements.
Summary of Investment Portfolio as at August 31, 2013The following chart presents the investment sectors held by the Fund as at August 31, 2013 and groups the securities by asset type, industry sector, geographic region, or currency exposure:
.
Portfolio Breakdown% of
Net Assetsx
x
Canadian Equitiesx
Consumer Discretionary 1.5x
Consumer Staples 0.7x
Energy 14.1x
Financials 29.3x
Industrials 2.6x
Materials 4.0x
Telecommunication Services 4.6x
Utilities 1.9x
Canadian Bondsx
Government of Canada & Guaranteed 4.1x
Provincial Government & Guaranteed 7.7x
Municipal Government & Guaranteed 2.2x
Mortgage-Backed Securities 0.1x
Corporate 23.1x
International Bondsx
Australia 1.1x
United States 0.8x
Short-Term Investments 2.2xxx
Total 100.0xx
Credit RiskCredit ratings represent a consolidation of the ratings provided by various outside service providers and are subject to change, which could be material.
See the Statement of Investment Portfolio for counterparty from over-the-counter derivative contracts, where applicable.
As at February 28, 2014 and August 31, 2013, the Fund invested in debt securities with the following credit ratings:
.
% of Net AssetsDebt Securities by Credit Rating February 28, 2014x August 31, 2013
xx
'AAA' 7.2 10.9x
'AA' 3.6 6.2x
'A' 16.8 14.7x
'BBB' 10.4 9.6xxx
Total 38.0 41.4xx
Currency RiskThe table that follows indicates the currencies to which the Fund had material exposure as at February 28, 2014, based on the market value of the Fund's financial instruments (including cash and cash equivalents) and the underlying principal amounts of forward foreign currency contracts, as applicable. As at August 31, 2013, the Fund did not have a significant exposure to currency risk.
As at February 28, 2014
Currency (note 2l)Total Currency
Exposure* ($000s) % of Net Assetsx
x
USD 114 0.1xxx
* Amounts reflect the carrying value of monetary and non-monetary items (including the notional amount of forward foreign currency contracts, if any).
The table that follows indicates how net assets as at February 28, 2014 and August 31, 2013 would have decreased or increased had the Canadian dollar strengthened or weakened by 1% in relation to all foreign currencies. This analysis assumes that all other variables remain unchanged. In practice, the actual results may differ from this analysis and the difference could be material.
February 28, 2014x August 31, 2013x
x
Impact on Net Assets ($000s) 1 –xx
Interest Rate RiskThe Fund’s short-term assets and liabilities were not subject to significant amounts of risk due to fluctuations in the prevailing level of market interest rates.
The table that follows indicates the Fund’s exposure to fixed income securities by remaining term-to-maturity..
February 28, 2014x August 31, 2013Remaining Term-to-Maturity ($000s)x ($000s)
xx
Less than 1 year – 356x
1-3 years 7,775 5,288x
3-5 years 7,914 12,321x
> 5 years 40,569 44,249xxx
Total 56,258 62,214xx
The table that follows indicates how net assets as at February 28, 2014 and August 31, 2013 would have increased or decreased had the interest rate decreased or increased by 25 basis points and assuming a parallel shift in the yield curve. This change is estimated using the weighted average duration of the fixed income portfolio. This analysis assumes that all other variables remain unchanged. In practice, actual results may differ from this analysis and the difference could be material..
February 28, 2014x August 31, 2013x
x
Impact on Net Assets ($000s) 1,104 1,264xx
Liquidity RiskThe Fund is exposed to daily cash redemptions of redeemable units. As at February 28, 2014 and August 31, 2013, the Fund retained sufficient cash and cash equivalent positions to maintain adequate liquidity.
Other Price/Market RiskThe table that follows indicates how net assets as at February 28, 2014 and August 31, 2013 would have increased or decreased had the value of the Fund’s benchmark(s) increased or decreased by 1%. This change is estimated based on the historical correlation between the return of Class A units of the Fund as compared to the return of the Fund’s benchmark(s), using 36 monthly data points, as available, based on the monthly net returns of the Fund. This analysis assumes that all other variables remain unchanged. The historical correlation may not be representative of the future correlation and, accordingly, the impact on net assets could be materially different..
Impact on Net Assets ($000s)Benchmark(s) February 28, 2014x August 31, 2013
xx
S&P/TSX Composite Index 757 816xxx
50% S&P/TSX Composite Index50% DEX Universe Bond Index
1,575 1,769
x
Fair Value of Financial InstrumentsThe following is a summary of the inputs used as at February 28, 2014 and August 31, 2013 in valuing the Fund’s financial assets and financial liabilities, carried at fair value:
6

The accompanying notes are an integral part of these financial statements.
Renaissance Canadian Monthly Income Fund
As at February 28, 2014Level 1 (i) Level 2 (ii) Level 3 (iii) Total
Classification ($000s) ($000s) ($000s) ($000s)xx
Financial Assetsx
Fixed Income Securities – 56,258 – 56,258x
Short-Term Investments – 1,472 – 1,472x
Equities 93,112 – – 93,112x
Currency Forward Contracts – 3,498 – 3,498xxx
Total Financial Assets 93,112 61,228 – 154,340xx
x
Financial Liabilitiesx
Currency Forward Contracts – (3,489) – (3,489)x
Options (7) (2) – (9)xxx
Total Financial Liabilities (7) (3,491) – (3,498)xx
x
Total Financial Assets and Liabilities 93,105 57,737 – 150,842xx
x
(i) Quoted prices in active markets for identical assetsx
(ii) Significant other observable inputsx
(iii) Significant unobservable inputs
As at August 31, 2013Level 1 (i) Level 2 (ii) Level 3 (iii) Total
Classification ($000s) ($000s) ($000s) ($000s)xx
Financial Assetsx
Fixed Income Securities – 62,214 – 62,214x
Short-Term Investments – 3,518 – 3,518x
Equities 93,209 – – 93,209xxx
Total Financial Assets 93,209 65,732 – 158,941xx
x
(i) Quoted prices in active markets for identical assetsx
(ii) Significant other observable inputsx
(iii) Significant unobservable inputs
Transfer of assets between Level 1 and Level 2Financial assets and liabilities transferred from Level 1 to Level 2 are the result of securities no longer being traded in an active market.
For the periods ended February 28, 2014 and August 31, 2013, there were no transfers of financial assets and liabilities from Level 1 to Level 2.
Financial assets and liabilities transferred from Level 2 to Level 1 are the result of securities now being traded in an active market.
For the periods ended February 28, 2014 and August 31, 2013, there were no transfers of financial assets and liabilities from Level 2 to Level 1.
Reconciliation of financial asset and liability movement – Level 3The Fund did not hold any significant positions of Level 3 investments at the beginning of, during, or at the end of either reporting period.
7

The accompanying notes are an integral part of these financial statements.
Renaissance Canadian Monthly Income Fund
Statements of Net Assets (unaudited)(in 000s, except per unit amounts)As at February 28, 2014 and August 31, 2013 (note 1)
2014x 2013x
x
Assets x
Investments at current value † (notes 2 and 3) $ 150,842 $ 158,941 x
Cash including foreign currency holdings, at current value 306 - x
Margin 78 13 x
Accrued interest and dividends receivable 684 812 x
Receivable for portfolio securities sold 1,175 108 x
Receivable for units issued 114 37 x
Other receivables 24 3 x
Unrealized gain on forward foreign currency contracts 9 - x
xx
Total Assets 153,232 159,914 xxx
Liabilities x
Bank overdraft - 531 x
Liability on written options 9 - x
Payable for portfolio securities purchased - 124 x
Payable for units redeemed 1,164 314 x
Distributions payable to unitholders 217 - xxx
Total Liabilities 1,390 969 xxx
Total Net Assets $ 151,842 $ 158,945 xxx
Net Assets per Class (note 11) x
Class A $ 149,718 $ 157,395 x
Class F $ 2,124 $ 1,550 x
xx
Net Assets per Unit †† (notes 4 and 11) x
Class A $ 6.97 $ 6.65 x
Class F $ 7.52 $ 7.13 x
† Securities LendingThe Fund had assets involved in securities lending transactions outstanding as at February 28, 2014:
Aggregate Valueof Securities
on Loan($000s)
Aggregate Valueof Collateral
for Loan($000s)
xx
17,629 18,340xx
Collateral Type* ($000s)i ii iii iv v
xx
6,070 12,270 – – –xx
x
* See note 2i for Collateral Type definitions.
†† Reconciliation of Net Assets per Unit (note 11)As at February 28, 2014
Net Assets per
Unit
Adjustment for CICA 3855 Valuation
Difference per Unit
Net Asset Value
per Unit xx
Class A $ 6.97 $ 0.01 $ 6.98 x
Class F $ 7.52 $ 0.01 $ 7.53 xx
As at August 31, 2013
Net Assets per
Unit
Adjustment for CICA 3855 Valuation
Difference per Unit
Net Asset Value
per Unit xx
Class A $ 6.65 $ 0.01 $ 6.66 x
Class F $ 7.13 $ 0.01 $ 7.14 xx
Organization of the Fund (note 1)The Fund was established on October 30, 1997 (Date Established).
Inception Datexx
Class A October 30, 1997x
Class F June 13, 2007xx
8
The accompanying notes are an integral part of these financial statements.
Renaissance Canadian Monthly Income Fund
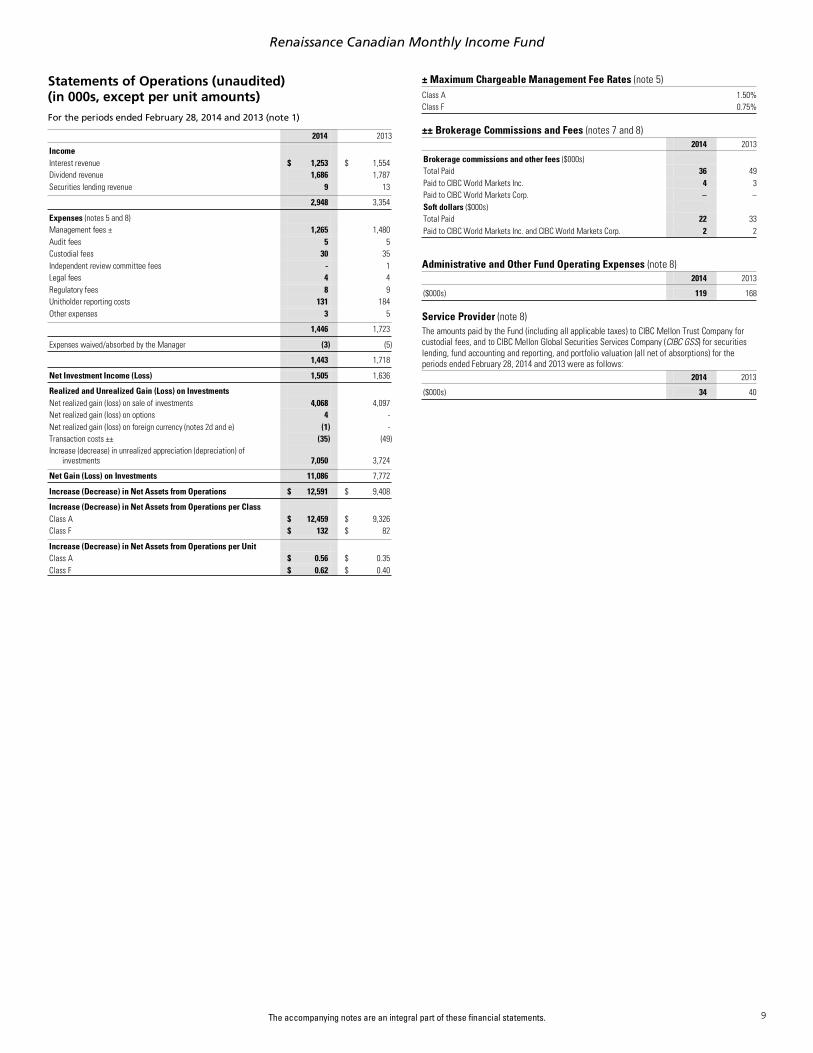
Statements of Operations (unaudited)(in 000s, except per unit amounts)For the periods ended February 28, 2014 and 2013 (note 1)
2014x 2013x
x
Income x
Interest revenue $ 1,253 $ 1,554 x
Dividend revenue 1,686 1,787 x
Securities lending revenue 9 13 xxx
2,948 3,354 xxx
Expenses (notes 5 and 8) x
Management fees ± 1,265 1,480 x
Audit fees 5 5 x
Custodial fees 30 35 x
Independent review committee fees - 1 x
Legal fees 4 4 x
Regulatory fees 8 9 x
Unitholder reporting costs 131 184 x
Other expenses 3 5 xxx
1,446 1,723 xxx
Expenses waived/absorbed by the Manager (3) (5)xxx
1,443 1,718 xxx
Net Investment Income (Loss) 1,505 1,636 xxx
Realized and Unrealized Gain (Loss) on Investments x
Net realized gain (loss) on sale of investments 4,068 4,097 x
Net realized gain (loss) on options 4 - x
Net realized gain (loss) on foreign currency (notes 2d and e) (1) - x
Transaction costs ±± (35) (49)x
Increase (decrease) in unrealized appreciation (depreciation) of investments 7,050 3,724
xxx
Net Gain (Loss) on Investments 11,086 7,772 xxx
Increase (Decrease) in Net Assets from Operations $ 12,591 $ 9,408 xxx
Increase (Decrease) in Net Assets from Operations per Class x
Class A $ 12,459 $ 9,326 x
Class F $ 132 $ 82 x
xx
Increase (Decrease) in Net Assets from Operations per Unit x
Class A $ 0.56 $ 0.35 x
Class F $ 0.62 $ 0.40 x
± Maximum Chargeable Management Fee Rates (note 5)xx
Class A 1.50%x
Class F 0.75%xx
±± Brokerage Commissions and Fees (notes 7 and 8)2014x 2013
xx
Brokerage commissions and other fees ($000s)x
Total Paid 36 49x
Paid to CIBC World Markets Inc. 4 3x
Paid to CIBC World Markets Corp. – –x
Soft dollars ($000s)x
Total Paid 22 33x
Paid to CIBC World Markets Inc. and CIBC World Markets Corp. 2 2xx
Administrative and Other Fund Operating Expenses (note 8)2014x 2013
xx
($000s) 119 168xx
Service Provider (note 8)The amounts paid by the Fund (including all applicable taxes) to CIBC Mellon Trust Company for custodial fees, and to CIBC Mellon Global Securities Services Company (CIBC GSS) for securities lending, fund accounting and reporting, and portfolio valuation (all net of absorptions) for the periods ended February 28, 2014 and 2013 were as follows:
2014x 2013x
x
($000s) 34 40xx
9

The accompanying notes are an integral part of these financial statements.
Renaissance Canadian Monthly Income Fundx
x
Statements of Changes in Net Assets (unaudited)(in 000s)For the periods ended February 28, 2014 and 2013 (note 1)
Class A Units Class F Units2014 2013 2014 2013
xx.
Increase (Decrease) in Net Assets from Operations $ 12,459 $ 9,326 $ 132 $ 82 xxx.
Distributions Paid or Payable to Unitholders x.
From net investment income (2,471) (3,005) (30) (30)x.
From net realized capital gains (1,204) - (9) - x.
Return of capital (1,516) (3,248) (11) (18)x.
xx
(5,191) (6,253) (50) (48)xxx.
Changes Due to Unitholder Transactions x.
Amount received from the issuance of units 5,105 5,006 944 354 x.
Amount received from reinvestment of distributions 3,475 4,194 32 31 x.
Amount paid on redemptions of units (23,525) (22,617) (484) (407)x.xx
(14,945) (13,417) 492 (22)xxx.
Increase (Decrease) in Net Assets for the Period (7,677) (10,344) 574 12 x.
Net Assets at Beginning of Period 157,395 186,544 1,550 1,518 x.
xx
Net Assets at End of Period $ 149,718 $ 176,200 $ 2,124 $ 1,530 xxx.
Units Issued and Outstanding (note 4) x.
As at February 28, 2014 and August 31, 2013 x.
Balance - beginning of period 23,667 27,167 217 209 x.
Units issued for cash 744 1,130 127 82 x.
Units issued on reinvestment of distributions 507 1,182 4 9 x.
xx
24,918 29,479 348 300 x.
Units redeemed (3,430) (5,812) (66) (83)x.
xx
Balance - end of period 21,488 23,667 282 217 x
x
10

Notes to Financial Statements (unaudited)
x
February 28, 2014, and 2013 and August 31, 2013
1. Organization of the Funds and Financial Reporting Periods
Each of the funds in the Renaissance Investments family of funds (individually, a Fund, and collectively, the Funds) is an open-end investment trust organized under the laws of Ontario and governed by a declaration of trust (Declaration of Trust).
The manager of the Funds is CIBC Asset Management Inc. (the Manager). The Manager is also the trustee, registrar, and transfer agent of the Funds.
Each Fund may issue an unlimited number of classes of units and an unlimited number of units of each class. In the future, the offering of any classes of a Fund may be terminated or additional classes may be offered. The following table indicates the classes of units offered for sale for each of the Funds:x
Funds Class A Class T6 Class T8 Class F Premium Class F-Premium Class O x ..
Renaissance Money Market Fund ü ü ü ..
Renaissance Canadian T-Bill Fund ü ü ..
Renaissance U.S. Money Market Fund ü ü ..
Renaissance Short-Term Income Fund ü ü ü ü ü ..
Renaissance Canadian Bond Fund ü ü ü ü ü ..
Renaissance Real Return Bond Fund ü ü ü ü ü ..
Renaissance Corporate Bond Fund ü ü ü ü ü ..
Renaissance Corporate Bond Capital Yield Fund ü ü ü ü ü ..
Renaissance U.S. Dollar Corporate Bond Fund ü ü ü ü ü ..
Renaissance High-Yield Bond Fund ü ü ü ü ü ..
Renaissance Floating Rate Income Fund ü ü ü ü ü ..
Renaissance Global Bond Fund ü ü ü ü ü ..
Renaissance Canadian Balanced Fund ü ü ü ..
Renaissance U.S. Dollar Diversified Income Fund ü ü ü ü ü ..
Renaissance Optimal Conservative Income Portfolio (also offers Class T4, Select Class, Select-T4 Class, Select-T6 Class, Elite Class, Elite-T4 Class, and Elite-T6 Class units) ü ü ü ü
..
Renaissance Optimal Income Portfolio(also offers Select Class, Select-T6 Class, Select-T8 Class, Elite Class, Elite-T6 Class, and Elite-T8 Class units) ü ü ü ü ü
..
Renaissance Optimal Growth & Income Portfolio (also offers Class T4, Select Class, Select-T4 Class, Select-T6 Class, Select-T8 Class, Elite Class, Elite-T4 Class, Elite-T6 Class and Elite-T8 Class units) ü ü ü ü ü
..
Renaissance Canadian Dividend Fund ü ü ü ..
Renaissance Canadian Monthly Income Fund ü ü ü ..
Renaissance Diversified Income Fund ü ü ü ..
Renaissance Millennium High Income Fund ü ü ü ..
Renaissance Covered Call Income Fund ü ü ü ..
Renaissance Canadian Core Value Fund ü ü ü ..
Renaissance Canadian Growth Fund ü ü ü ..
Renaissance Canadian All-Cap Equity Fund ü ü ü ..
Renaissance Canadian Small-Cap Fund ü ü ü ..
Renaissance U.S. Equity Income Fund ü ü ü ü ..
Renaissance U.S. Equity Value Fund ü ü ü ..
Renaissance U.S. Equity Growth Fund ü ü ü ..
Renaissance U.S. Equity Growth Currency Neutral Fund ü ü ü ..
Renaissance U.S. Equity Fund ü ü ü ..
Renaissance International Dividend Fund ü ü ü ..
Renaissance International Equity Fund ü ü ü ..
Renaissance International Equity Currency Neutral Fund ü ü ü ..
Renaissance Global Markets Fund ü ü ü ..
Renaissance Optimal Global Equity Portfolio(also offers Class T4, Select Class, Select-T4 Class, Select-T6 Class, Select-T8 Class, Elite Class, Elite-T4 Class, Elite-T6 Class, and Elite-T8 Class units) ü ü ü ü ü
..
Renaissance Optimal Global Equity Currency Neutral Portfolio(also offers Class T4, Select Class, Select-T4 Class, Select-T6 Class, Select-T8 Class, Elite Class, Elite-T4 Class, Elite-T6 Class, and Elite-T8 Class units) ü ü ü ü ü
..
Renaissance Global Value Fund ü ü ü ..
Renaissance Global Growth Fund ü ü ü ..
Renaissance Global Growth Currency Neutral Fund ü ü ü ..
Renaissance Global Focus Fund ü ü ü ..
Renaissance Global Focus Currency Neutral Fund ü ü ü ..
Renaissance Global Small-Cap Fund ü ü ü
11

p / 2 Notes to Financial Statements (unaudited)
..
Renaissance European Fund ü ü ü ..
Renaissance Asian Fund ü ü ü ..
Renaissance China Plus Fund ü ü ü ..
Renaissance Emerging Markets Fund ü ü ü ..
Renaissance Optimal Inflation Opportunities Portfolio(also offers Select Class and Elite Class units) ü ü ü
..
Renaissance Global Infrastructure Fund ü ü ü ..
Renaissance Global Infrastructure Currency Neutral Fund ü ü ü ..
Renaissance Global Real Estate Fund ü ü ü ..
Renaissance Global Real Estate Currency Neutral Fund ü ü ü ..
Renaissance Global Health Care Fund ü ü ü ..
Renaissance Global Resource Fund ü ü ü ..
Renaissance Global Science & Technology Fund ü ü üx
Each class of units may charge a different management fee and operating expenses can either be common or class-specific. Class-specific expenses are allocated on a class-by-class basis. As a result, a separate net asset value per unit is calculated for each class of units.
Class A, T4, T6, and T8 units are available to all investors on a load basis. Investors may pay a sales commission when purchasing Class A, T4, T6, and T8 units of the Funds and may pay a deferred sales charge if they redeem their Class A, T4, T6, and T8 units. They may have to pay a short-term trading fee, if applicable.
Select, Select-T4, Select-T6, and Select-T8 Class units are available to all investors on a load basis. Investors may pay a sales commission when purchasing Select, Select-T4, Select-T6, and Select-T8 Class units of the Funds and may pay a deferred sales charge if they redeem their Select, Select-T4, Select-T6, and Select-T8 Class units. They may have to pay a short-term trading fee, if applicable. Select, Select-T4, Select-T6, and Select-T8 Class units have a lower management expense ratio than Class A, T4, T6, and T8 units. Select, Select-T4, Select-T6, and Select-T8 Class units have a minimum investment requirement of $250,000. Elite, Elite-T4, Elite-T6, and Elite-T8 Class units are available to all investors on a load basis. Investors may pay a sales commission when purchasing Elite, Elite-T4, Elite-T6, and Elite-T8 Class units of the Funds and may pay a deferred sales charge if they redeem their Elite, Elite-T4, Elite-T6, and Elite-T8 Class units. They may have to pay a short-term trading fee, if applicable. Elite, Elite-T4, Elite-T6, and Elite-T8 Class units have a lower management expense ratio than Class A, T4, T6, T8, Select, Select-T4, Select-T6, and Select-T8 units. Elite, Elite-T4, Elite-T6, and Elite-T8 Class units have a minimum investment requirement of $500,000.
Class T4, T6, and T8 units have the same characteristics as Class A units, except that they each intend to pay a unique maximum fixed distribution amount per unit, which also results in a separate net asset value per unit. Select-T4, Select-T6, and Select-T8 Class units are the same as Select Class units except that they each intend to pay a unique maximum fixed distribution amount per unit. Elite-T4, Elite-T6, and Elite-T8 Class units are the same as Elite Class units, except that they each intend to pay a unique maximum fixed distribution amount per unit.
Class F and Class F-Premium units are available to investors participating in programs that do not require the payment of sales charges by investors and do not require the payment of service or trailing commissions to dealers. For these investors, the Manager “unbundles” the typical distribution costs and charges a lower management fee. Potential investors include clients of “fee-for-service” investment advisors, dealer-sponsored “wrap accounts”, and others who pay an annual fee to their dealer instead of transactional sales charges and where the dealer does not receive service fees or trailing commissions from the Manager.
Premium Class units of Renaissance Money Market Fund are available to investors with a minimum initial investment of $25,000 on a load basis. Premium Class units of Renaissance Short-Term Income Fund, Renaissance Canadian Bond Fund, Renaissance Real Return Bond Fund, Renaissance Corporate Bond Fund, Renaissance Corporate Bond Capital Yield Fund, Renaissance U.S. Dollar Corporate Bond Fund, Renaissance High-Yield Bond Fund, Renaissance Floating Rate Income Fund, Renaissance Global Bond Fund, and Renaissance U.S. Dollar Diversified Income Fund are available to investors with a minimum initial investment of $100,000 on a load basis. Investors pay a sales commission when purchasing Premium Class units of the Funds and may pay a deferred sales charge if they redeem their Premium Class units. They may have to pay a short-term trading fee, if applicable.
Class O units are only available to select investors who have been approved by and have entered into a Class O unit account agreement with the Manager or whose dealer or discretionary manager offers separately managed accounts or similar programs and has entered into a Class O unit account agreement with the Manager. These investors are typically financial services companies, including the Manager, that use Class O units of a Fund to facilitate offering other products to investors. No management fees or operating expenses are charged to a Fund in respect of Class O units; instead, a negotiated management fee is charged by the Manager directly to, or as directed by, Class O unitholders.
The date upon which each Fund was established by Declaration of Trust (Date Established) and the date upon which each class of units of each Fund was first sold to the public (Inception Date) are reported in footnote Organization of the Fund on the Statements of Net Assets.
The Statement of Investment Portfolio of each of the Funds is as at February 28, 2014. The Statements of Net Assets are as at February 28, 2014 and August 31, 2013 and the Statements of Operations and Statements of Changes in Net Assets are for the periods ended February 28, 2014 and 2013 except for Funds or classes established during either period, in which case the information presented is from the Date Established or the Inception Date to February 28, 2014 or 2013.
2. Summary of Significant Accounting Policies
These financial statements, prepared in accordance with Canadian generally accepted accounting principles (GAAP ), include estimates and assumptions made by management that affect the reported amounts of assets, liabilities, income, and expenses during the reporting periods. Actual results may differ from such estimates.
a) Risk management
The Funds’ overall risk management approach includes formal guidelines that govern the extent of exposure to various types of risk, including diversification within asset classes and limits on the exposure to individual investments and counterparties. In addition, derivative financial instruments may be used to manage certain risk exposures. The Manager also has various internal controls to oversee the Funds’ investment activities, including monitoring compliance with the investment objectives and strategies, internal guidelines, and securities regulations. Please refer to each Fund’s Supplemental Schedule to Statement of Investment Portfolio for specific risk disclosures.
Fair value of financial instruments by using valuation techniques
The process of valuing investments for which no quoted market exists is inevitably based on inherent uncertainties and the resulting values may differ from values that would have been used had an active market existed for these investments. The valuation of such securities can be based on various valuation techniques that could include mathematical models, comparable valuation models, fundamental valuation models, or other techniques that would reflect the specific business situation or market the security operates within. The models would use observable market data as inputs where possible. However, in some instances, certain investments are fair valued based on assumptions that may not be supported by observable inputs. Securities without observable market value inputs in their valuation require judgement in establishing their fair value. Changes in any of these assumptions could affect the reported fair value of financial assets or financial liabilities. For Funds that hold Level 3 investments, a reconciliation from the beginning balances to ending balances is included in the Supplemental Schedule to Statement of Investment Portfolio. In addition, the impact of using reasonable alternative assumptions for valuing Level 3 investments is disclosed.
Credit risk
Credit risk is the risk that a counterparty to a financial instrument, such as a fixed income security or a derivative contract, will fail to discharge an obligation or commitment that it has entered into with the Funds. The value of fixed income securities and derivatives as presented on the Statement of Investment Portfolio includes consideration of the creditworthiness of the issuer and, accordingly, represents the maximum credit risk exposure of the Funds. Certain Funds may invest in short-term fixed income securities issued or guaranteed primarily by the Government of Canada or any Canadian provincial government, obligations of Canadian chartered banks or trust companies, and commercial paper with approved credit ratings. The risk of default on these short-term fixed income securities is considered low and these securities primarily have credit ratings of ‘A-1 (Low)’ or higher (as rated by Standard & Poor’s, a division of McGraw-Hill Financial Inc. or equivalent rating from another rating service).
12
Notes to Financial Statements (unaudited) p / 3
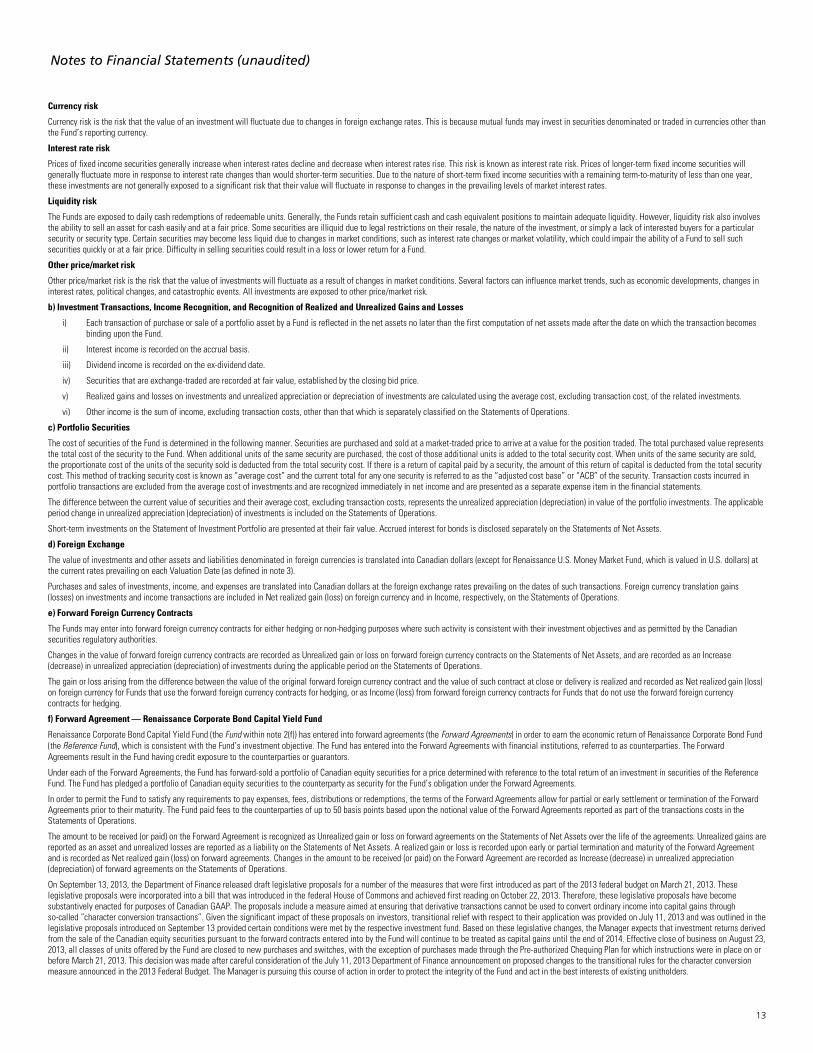
Currency risk
Currency risk is the risk that the value of an investment will fluctuate due to changes in foreign exchange rates. This is because mutual funds may invest in securities denominated or traded in currencies other than the Fund’s reporting currency.
Interest rate risk
Prices of fixed income securities generally increase when interest rates decline and decrease when interest rates rise. This risk is known as interest rate risk. Prices of longer-term fixed income securities will generally fluctuate more in response to interest rate changes than would shorter-term securities. Due to the nature of short-term fixed income securities with a remaining term-to-maturity of less than one year, these investments are not generally exposed to a significant risk that their value will fluctuate in response to changes in the prevailing levels of market interest rates.
Liquidity risk
The Funds are exposed to daily cash redemptions of redeemable units. Generally, the Funds retain sufficient cash and cash equivalent positions to maintain adequate liquidity. However, liquidity risk also involves the ability to sell an asset for cash easily and at a fair price. Some securities are illiquid due to legal restrictions on their resale, the nature of the investment, or simply a lack of interested buyers for a particular security or security type. Certain securities may become less liquid due to changes in market conditions, such as interest rate changes or market volatility, which could impair the ability of a Fund to sell such securities quickly or at a fair price. Difficulty in selling securities could result in a loss or lower return for a Fund.
Other price/market risk
Other price/market risk is the risk that the value of investments will fluctuate as a result of changes in market conditions. Several factors can influence market trends, such as economic developments, changes in interest rates, political changes, and catastrophic events. All investments are exposed to other price/market risk.
b) Investment Transactions, Income Recognition, and Recognition of Realized and Unrealized Gains and Losses
i) Each transaction of purchase or sale of a portfolio asset by a Fund is reflected in the net assets no later than the first computation of net assets made after the date on which the transaction becomes binding upon the Fund.
ii) Interest income is recorded on the accrual basis.
iii) Dividend income is recorded on the ex-dividend date.
iv) Securities that are exchange-traded are recorded at fair value, established by the closing bid price.
v) Realized gains and losses on investments and unrealized appreciation or depreciation of investments are calculated using the average cost, excluding transaction cost, of the related investments.
vi) Other income is the sum of income, excluding transaction costs, other than that which is separately classified on the Statements of Operations.
c) Portfolio Securities
The cost of securities of the Fund is determined in the following manner. Securities are purchased and sold at a market-traded price to arrive at a value for the position traded. The total purchased value represents the total cost of the security to the Fund. When additional units of the same security are purchased, the cost of those additional units is added to the total security cost. When units of the same security are sold, the proportionate cost of the units of the security sold is deducted from the total security cost. If there is a return of capital paid by a security, the amount of this return of capital is deducted from the total security cost. This method of tracking security cost is known as “average cost” and the current total for any one security is referred to as the “adjusted cost base” or “ACB” of the security. Transaction costs incurred in portfolio transactions are excluded from the average cost of investments and are recognized immediately in net income and are presented as a separate expense item in the financial statements.
The difference between the current value of securities and their average cost, excluding transaction costs, represents the unrealized appreciation (depreciation) in value of the portfolio investments. The applicable period change in unrealized appreciation (depreciation) of investments is included on the Statements of Operations.
Short-term investments on the Statement of Investment Portfolio are presented at their fair value. Accrued interest for bonds is disclosed separately on the Statements of Net Assets.
d) Foreign Exchange
The value of investments and other assets and liabilities denominated in foreign currencies is translated into Canadian dollars (except for Renaissance U.S. Money Market Fund, which is valued in U.S. dollars) at the current rates prevailing on each Valuation Date (as defined in note 3).
Purchases and sales of investments, income, and expenses are translated into Canadian dollars at the foreign exchange rates prevailing on the dates of such transactions. Foreign currency translation gains (losses) on investments and income transactions are included in Net realized gain (loss) on foreign currency and in Income, respectively, on the Statements of Operations.
e) Forward Foreign Currency Contracts
The Funds may enter into forward foreign currency contracts for either hedging or non-hedging purposes where such activity is consistent with their investment objectives and as permitted by the Canadian securities regulatory authorities.
Changes in the value of forward foreign currency contracts are recorded as Unrealized gain or loss on forward foreign currency contracts on the Statements of Net Assets, and are recorded as an Increase (decrease) in unrealized appreciation (depreciation) of investments during the applicable period on the Statements of Operations.
The gain or loss arising from the difference between the value of the original forward foreign currency contract and the value of such contract at close or delivery is realized and recorded as Net realized gain (loss) on foreign currency for Funds that use the forward foreign currency contracts for hedging, or as Income (loss) from forward foreign currency contracts for Funds that do not use the forward foreign currency contracts for hedging.
f) Forward Agreement — Renaissance Corporate Bond Capital Yield Fund
Renaissance Corporate Bond Capital Yield Fund (the Fund within note 2(f)) has entered into forward agreements (the Forward Agreements) in order to earn the economic return of Renaissance Corporate Bond Fund (the Reference Fund), which is consistent with the Fund’s investment objective. The Fund has entered into the Forward Agreements with financial institutions, referred to as counterparties. The Forward Agreements result in the Fund having credit exposure to the counterparties or guarantors.
Under each of the Forward Agreements, the Fund has forward-sold a portfolio of Canadian equity securities for a price determined with reference to the total return of an investment in securities of the Reference Fund. The Fund has pledged a portfolio of Canadian equity securities to the counterparty as security for the Fund’s obligation under the Forward Agreements.
In order to permit the Fund to satisfy any requirements to pay expenses, fees, distributions or redemptions, the terms of the Forward Agreements allow for partial or early settlement or termination of the Forward Agreements prior to their maturity. The Fund paid fees to the counterparties of up to 50 basis points based upon the notional value of the Forward Agreements reported as part of the transactions costs in the Statements of Operations.
The amount to be received (or paid) on the Forward Agreement is recognized as Unrealized gain or loss on forward agreements on the Statements of Net Assets over the life of the agreements. Unrealized gains are reported as an asset and unrealized losses are reported as a liability on the Statements of Net Assets. A realized gain or loss is recorded upon early or partial termination and maturity of the Forward Agreement and is recorded as Net realized gain (loss) on forward agreements. Changes in the amount to be received (or paid) on the Forward Agreement are recorded as Increase (decrease) in unrealized appreciation (depreciation) of forward agreements on the Statements of Operations.
On September 13, 2013, the Department of Finance released draft legislative proposals for a number of the measures that were first introduced as part of the 2013 federal budget on March 21, 2013. These legislative proposals were incorporated into a bill that was introduced in the federal House of Commons and achieved first reading on October 22, 2013. Therefore, these legislative proposals have become substantively enacted for purposes of Canadian GAAP. The proposals include a measure aimed at ensuring that derivative transactions cannot be used to convert ordinary income into capital gains through so-called “character conversion transactions”. Given the significant impact of these proposals on investors, transitional relief with respect to their application was provided on July 11, 2013 and was outlined in the legislative proposals introduced on September 13 provided certain conditions were met by the respective investment fund. Based on these legislative changes, the Manager expects that investment returns derived from the sale of the Canadian equity securities pursuant to the forward contracts entered into by the Fund will continue to be treated as capital gains until the end of 2014. Effective close of business on August 23, 2013, all classes of units offered by the Fund are closed to new purchases and switches, with the exception of purchases made through the Pre-authorized Chequing Plan for which instructions were in place on or before March 21, 2013. This decision was made after careful consideration of the July 11, 2013 Department of Finance announcement on proposed changes to the transitional rules for the character conversion measure announced in the 2013 Federal Budget. The Manager is pursuing this course of action in order to protect the integrity of the Fund and act in the best interests of existing unitholders.
13
p / 4 Notes to Financial Statements (unaudited)
g) Futures Contracts
The margin deposits with brokers relating to futures contracts are included in Margin on the Statements of Net Assets. Any change in the margin requirement is settled daily and included in Receivable for portfolio securities sold or Payable for portfolio securities purchased on the Statements of Net Assets.
Any difference between the settlement value at the close of business on each Valuation Date and the settlement value at the close of business on the previous Valuation Date is recorded as Income (loss) from futures contracts on the Statements of Operations.
h) Options
Premiums paid for purchased call and put options are included in Investments at current value on the Statements of Net Assets. When a purchased option expires, the Fund will realize a loss in the amount of the cost of the option. For a closing transaction, the Fund will realize a gain or loss depending on whether the proceeds are greater or less than the premium paid at the time of purchase. When a purchased call option is exercised, the cost of the security purchased is increased by the premium paid at the time of purchase.
Premiums received from writing options are included in Investments at current value on the Statements of Net Assets as initial reductions in the value of investments. Premiums received from writing options that expire unexercised are recorded as Income on the Statements of Operations. For a closing transaction, if the cost of closing the transaction exceeds the premium received, the Funds will record a realized loss, or if the premium received at the time the option was written is greater than the amount paid, the Funds will record a realized gain. If a written put option is exercised, the cost for the security delivered is reduced by the premiums received at the time the option was written.
i) Securities Lending
The Funds may lend portfolio securities in order to earn additional revenue, which is disclosed on the Statements of Operations. The loaned assets of any one Fund are not permitted to exceed 50% of the current value of the assets of that Fund (excluding collateral debt for the loaned securities). The minimum allowable collateral is 102% of the current value of the loaned securities as per the requirements of National Instrument 81-102 Mutual Funds. Collateral can consist of the following:
i) Cash.
ii) An evidence of indebtedness that is issued or fully and unconditionally guaranteed as to the principal and interest by: a) the government of Canada, or a province or territory of Canada; b) the government of the United States of America or the government of one of the states of the United States of America; c) the government of another sovereign state, or a permitted supranational agency, if, in each case, the evidence of indebtedness has an approved credit rating; or d) a Canadian financial institution or a financial institution that is not incorporated or organized under the laws of Canada or of a province or territory of Canada, if, in either case, evidences of indebtedness of that issuer or guarantor that are rated as short-term debt by an approved credit rating organization have an approved credit rating.
iii) Irrevocable letters of credit issued by a Canadian financial institution, if evidences of indebtedness of the Canadian financial institution that are rated as short-term debt by an approved credit rating organization have an approved credit rating.
iv) Securities that are immediately convertible into securities of the same issuer, class, or type, and the same term, as the securities loaned.
v) Commercial paper with a term to maturity of 365 days or less with an approved credit rating and that was issued by a company other than a government or permitted supranational agency.
The market value of the loaned securities is determined on the close of any Valuation Date and any additional required collateral is delivered to the Funds on the next business day. The securities on loan continue to be included on the Statement of Investment Portfolio and are included in the total value on the Statements of Net Assets in Investments at current value. Where applicable, a Fund’s securities lending transactions are reported in footnote Securities Lending on the Statements of Net Assets.
j) Multi-Class Structured Funds
Each Fund may issue an unlimited number of classes of units. The realized and unrealized capital gains or capital losses, income, and common expenses (other than class-specific operating expenses and management fees) of the Fund are allocated on each Valuation Date to the unitholders in proportion to the respective prior day’s net asset value, which includes unitholder trade(s) dated for that day, of each class at the date on which the allocation is made. Class-specific operating expenses and management fees do not require allocation. All class-specific operating expenses are paid by the Manager and are collected from the Funds on a recoverable basis.
k) Other Assets and Liabilities
Other assets and liabilities are recorded at cost, which approximates their fair value.
l) Legend for Abbreviations
The following is a list of abbreviations (foreign currency translation and others) that may be used in the Statements of Investment Portfolio:x
x .. .. .. .. ..x
x
Currency Abbreviations
x ..
AUD – Australian Dollar KRW – South Korean Won ..
BRL – Brazilian Real MXN – Mexican Peso ..
CAD – Canadian Dollar MYR – Malaysian Ringgit ..
CHF – Swiss Franc NOK – Norwegian Krone ..
CLP – Chilean Peso NZD – New Zealand Dollar ..
CNY – Chinese Renminbi PHP – Philippine Peso ..
CZK – Czech Koruna PLN – Polish Zloty ..
DKK – Danish Krone RUB – Russian Ruble ..
EUR – Euro SEK – Swedish Krona ..
GBP – British Pound SGD – Singapore Dollar ..
HKD – Hong Kong Dollar THB – Thai Baht ..
HUF – Hungarian Forint TRY – New Turkish Lira ..
IDR – Indonesian Rupiah TWD – Taiwan Dollar ..
INR – Indian Rupee USD – United States Dollar ..
JPY – Japanese Yen ..
Other Abbreviations
..
ADR – American Depositary Receipt iUnits – Index Units Securities ..
ADC – Austrian Depositary Certificates LEPOs – Low Exercise Price Options ..
CVO – Contingent Value Obligations International MSCI – Morgan Stanley Capital Index ..
ETF – Exchange-Traded Fund OPALS – Optimized Portfolios as Listed ..
GDR – Global Depositary Receipt Securities PERLES – Performance Linked to Equity ..
IPN – International Participation Note REIT – Real Estate Investment Trust ..
iShares – Index Shares SDR – Swedish Depositary Receiptx
14

Notes to Financial Statements (unaudited) p / 5
m) International Financial Reporting Standards (IFRS)
Investment companies that are publicly accountable enterprises or investment funds to which National Instrument 81- 106 Investment Fund Continuous Disclosure is applicable, are required to adopt IFRS for the first time for interim and annual financial statements relating to annual periods beginning on or after January 1, 2014. As a result, the Funds will adopt IFRS beginning September 1, 2014 and publish their first financial statements, prepared in accordance with IFRS, for the semi-annual period ending February 28, 2015. The 2015 semi-annual and annual financial statements will include 2014 comparative financial information and an opening Statement of Financial Position as at September 1, 2014, also prepared in accordance with IFRS.
The Manager continues to execute its transition plan to complete the changeover to IFRS for the Funds in 2014 and comply with the required timetable for continuous disclosure. As at February 28, 2014, the impact to the financial statements based on the Manager’s assessment of the differences between current Canadian GAAP and IFRS are as follows:
l IFRS 13 Fair Value Measurement permits the use of mid-market prices or other pricing conventions that are used by market participants as a practical expedient for fair value measurements within a bid-ask spread. The Funds will adopt accounting policies for the valuation of investments to utilize mid-market prices that align more closely with the calculation of net asset value (NAV) used to price unitholder transactions (Transaction NAV). As a result, net assets for current financial reporting purposes (GAAP NAV) will be impacted and is expected to align with Transaction NAV, eliminating the need for a NAV per unit reconciliation. The impact to the Statements of Financial Position as at September 1, 2013 and February 28, 2014 is disclosed in these financial statements in the reconciliation of net assets per unit as at February 28, 2014.
l IFRS 10 Consolidated Financial Statements provides an exception to the consolidation requirements and requires an investment entity to account for its subsidiaries at fair value through profit or loss. The Manager has concluded that each of the Funds meet the definition of an investment entity as at September 1, 2013 and throughout the period ended February 28, 2014.
l Units of the Funds are puttable instruments and are required to be presented as equity or liability depending on certain criteria. As at September 1, 2013 and throughout the period ended February 28, 2014, units of the Funds did not meet the criteria to be classified as equity. As a result, unitholders' equity will be presented as a liability in the Statements of Financial Position.
l IFRS requires the presentation of a Statement of Cash Flows, including comparatives for 2014. The Funds have not previously presented this statement as permitted by current Canadian GAAP. In addition, other statements presented will be renamed as follows:
x
x ..
Canadian GAAP IFRS ..
Statements of Net Assets Statements of Financial Position ..
Statements of Operations Statements of Comprehensive Income ..
Statements of Changes in Net Assets Statements of Changes in Financial Position ..
Statement of Investment Portfolio Schedule of Investment Portfolio
xxxxxxx
l Other reclassifications, presentation differences and additional disclosures will also be required in the financial statements to comply with the new requirements under IFRS.
3. Valuation of Investments
The valuation date for a Fund is any day when the Manager’s head office is open for business (Valuation Date). The Trustee may, at its discretion, establish other Valuation Dates. The value of the investments or assets of a Fund is determined as follows:
a) Cash and Other Assets
Cash, accounts receivable, dividends receivable, distributions receivable, and accrued interest are valued at fair value or at their recorded cost, plus or minus any foreign exchange between recognition of the asset by the Fund and the current Valuation Date, which approximates fair value.
Short-term investments (money market instruments) are valued at fair value.
b) Bonds, Debentures, and Other Debt Obligations
Bonds, debentures, and other debt obligations are valued at current value using the bid price provided by a recognized vendor upon the close of trading on a Valuation Date.
c) Listed Securities, Unlisted Securities, and Fair Value Pricing of Foreign Securities
Any security that is listed or traded on a securities exchange is valued at fair value using the closing bid price (with the exception of Renaissance Corporate Bond Capital Yield Fund, securities pledged under the Forward Agreement are valued at closing market prices) or, if there is no closing bid price on that exchange and in the case of securities traded on an “over-the-counter” market, at the fair value as determined by the Manager as an appropriate basis for valuation. In such situations, a fair value will be determined by the Manager to establish current value. If any securities are inter-listed, or traded on more than one exchange or market, the Manager will use the principal exchange or market for the fair value of such securities. For Renaissance Corporate Bond Capital Yield Fund, securities pledged under the Forward Agreement are valued at mid market prices as they are offsetting risk positions against the value of the Forward Agreement. Units of each mutual fund in which a Fund invests will be valued at fair value using the most recent net asset value quoted by the trustee or Manager of the mutual fund on the Valuation Date.
Unlisted securities are valued at fair value using the bid price quoted by a recognized dealer, or the Manager may determine a price that more accurately reflects the fair value of these securities if the Manager feels the bid price does not reflect fair value.
Fair value pricing is designed to avoid stale prices and provide a more accurate current value, and may assist in the deterrence of harmful short-term or excessive trading in the Funds. When securities listed or traded on markets or exchanges that close prior to North or South American markets or exchanges are valued by the Manager at their fair market value, instead of using quoted or published prices, the prices of such securities used to calculate the Fund’s net assets or net asset value may differ from quoted or published prices of such securities.
d) Derivatives
Long positions in options, debt-like securities, and listed warrants are valued at fair value using the closing bid price as established on either their principal trading exchange or by a recognized dealer in such securities. The credit rating of each counterparty (as rated by Standard & Poor’s) meets or exceeds the minimum approved credit rating.
When any option is written by any Fund, the premium received by the Fund will be reflected as a liability that will be valued at an amount equal to the fair value of the option that would have the effect of closing the position. Any difference resulting from revaluation shall be treated as an unrealized gain or loss on investment; the liability shall be deducted in arriving at the net assets of the Fund. The securities that are the subject of a written options, if any, will be valued in the manner described above for listed securities.
Futures contracts, forward contracts, or swaps will be valued at fair value of the gain or loss, if any, that would be realized on the Valuation Date if the position in the futures contracts, forward contracts, or swaps were to be closed out.
Margin paid or deposited in respect of futures contracts and forward contracts will be reflected as an account receivable and margin consisting of assets other than cash will be noted as held as collateral.
Other derivatives and margin are valued at fair value in a manner that the Manager determines to represent their current value.
e) Restricted Securities
Restricted securities purchased by any Fund will be valued at fair value in a manner that the Manager determines to represent their current value.
f) Other Securities
All other investments of the Funds will be valued at fair value in accordance with the laws of the Canadian securities regulatory authorities where applicable.
The value of any security or other property of a Fund for which a market quotation is not readily available or where the market quotations do not properly reflect the current value of such securities will be determined by the Manager by valuing the securities at their fair value. In such situations, current value will be determined using fair valuation techniques that most accurately reflect their fair value as established by the Manager.
15
p / 6 Notes to Financial Statements (unaudited)
4. Units Issued and Outstanding
A Fund has an unlimited number of classes of units and may issue an unlimited number of units of each class. The outstanding units represent the capital of a Fund. Each unit has no par value and the value of each unit is the net asset value next determined. Settlement of the cost for units issued is completed as per the laws of the Canadian securities regulatory authorities in place at the time of issue. Distributions made by a Fund and reinvested by unitholders in additional units also constitute issued capital of a Fund.
Units are redeemed at the net asset value per unit of each class of units of a Fund. A right to redeem units of a Fund may be suspended with the approval of the Canadian securities regulatory authorities or when normal trading is suspended on a stock, options, or futures exchange within Canada or outside of Canada on which securities or derivatives that make up more than 50% of the value or underlying exposure of the total assets of a Fund, not including any liabilities of a Fund, are traded and when those securities or derivatives are not traded on any other exchange that represents a reasonably practical alternative for a Fund. The Fund is not subject to any externally imposed capital requirements.
The capital received by the Fund is utilized within the respective investment mandate of the Fund. This includes the ability to make liquidity available to satisfy unitholder unit redemption requirements upon the unitholder’s request.
Changes in issued and outstanding units for the periods ended February 28, 2014 and August 31, 2013 can be found on the Statements of Changes in Net Assets.
5. Management Fees and Operating Expenses
Management fees are based on the net asset value of the Funds and are calculated daily and paid monthly. Management fees are paid to the Manager in consideration for providing, or arranging for the provision of, management, distribution, and portfolio advisory services. Advertising and promotional expenses, office overhead expenses related to the Manager’s activities, trailing commissions and the fees of the portfolio sub-advisors are paid by the Manager out of the management fees received from the Funds. The maximum annual management fee expressed as a percentage of the average net asset value for each class of units of the Fund is reported in footnote Maximum Chargeable Management Fee Rates on the Statements of Operations. For Class O units, management fees are negotiated with and paid by, or as directed by, unitholders, or dealers and discretionary managers on behalf of unitholders.
In addition to the management fees, the Funds are responsible for all expenses relating to the operation and conduct of the business of the Funds, including interest, operating, and administrative costs (other than advertising and promotional expenses, which are the responsibility of the Manager), brokerage fees, commissions, spreads, regulatory fees (including the portion of the regulatory fees paid by the Manager that are attributable to the Funds), Independent Review Committee fees, taxes, audit and legal fees and expenses, trustee fees, safekeeping fees, custodial fees, any agency fees, securities lending, repurchase, and reverse repurchase fees, investor servicing costs, and costs of unitholder reports, prospectuses, fund facts, and other reports. All class-specific operating expenses are paid by the Manager and recovered from the Funds. The Funds do not pay a fee to the Trustee.
The Manager may recover from a Fund less than the actual class-specific operating expenses paid by the Manager, resulting in the Manager absorbing class-specific expenses. The Manager may also charge to a Fund less than the maximum management fee noted in footnote Maximum Chargeable Management Fee Rates on the Statements of Operations, resulting in the Manager waiving management fees.
At its sole discretion, the Manager may stop absorbing class-specific operating expenses and/or waiving management fees at any time. Class-specific operating expenses absorbed and/or management fees waived by the Manager are disclosed on the Statements of Operations.
In some cases, the Manager may charge management fees to a Fund that are less than the management fees the Manager is entitled to charge in respect of certain investors in a Fund. The difference in the amount of the management fees will be paid out by the Fund to the applicable investors as a distribution of additional units of the Fund (Management Fee Distributions).
Management Fee Distributions are negotiable between the Manager and the investor and are dependent primarily on the size of the investor’s investment in the Fund. Management Fee Distributions paid to qualified investors do not adversely impact the Fund or any of the Fund’s other investors. The Manager may increase or decrease the amount of Management Fee Distributions to certain investors from time to time.
Certain Funds may invest in units of other funds (the Underlying Funds). Where a Fund invests in units of an Underlying Fund, the Fund does not pay duplicate management fees on the portion of its assets that it invests in units of the Underlying Fund. In addition, the Fund will not pay duplicate sales fees or redemption fees with respect to the purchase or redemption by it of units of the Underlying Fund. Some of the Underlying Funds held by the Funds may offer Management Fee Distributions. Such Management Fee Distributions of an Underlying Fund will be paid out as required for taxable distribution payments by a Fund. The manager of an Underlying Fund may, in some cases, waive a portion of an Underlying Fund’s management fee and/or absorb a portion of an Underlying Fund’s operating expenses.x
6. Income Taxes
All of the Funds (except Renaissance Corporate Bond Fund, Renaissance International Equity Currency Neutral Fund, Renaissance Optimal Global Equity Currency Neutral Portfolio, Renaissance Global Growth Currency Neutral Fund, Renaissance Canadian All-Cap Equity Fund, Renaissance Optimal Inflation Opportunities Portfolio, Renaissance Global Real Estate Fund, and Renaissance Global Real Estate Currency Neutral Fund) qualify as mutual fund trusts under the Income Tax Act (Canada). No income tax is payable by the Funds on net income and/or net realized capital gains that are distributed to unitholders. In addition, for all of the Funds (except those that do not qualify as mutual fund trusts under the Income Tax Act (Canada)), income taxes payable on undistributed net realized capital gains are refundable on a formula basis when units of the Funds are redeemed. Sufficient net income and realized capital gains of the Funds have been, or will be, distributed to the unitholders such that no tax is payable by the Funds and, accordingly, no provision for income taxes has been made in the financial statements. Occasionally, a Fund may pay distributions in excess of net income and net realized capital gains of the Fund. This excess distribution is called a return of capital and is non-taxable to the unitholder. However, a return of capital reduces the average cost of the unitholder’s units for tax purposes. Non-capital losses that arose in 2004 and 2005 are available to be carried forward for 10 years. Non-capital losses that arose in 2006 and after are available to be carried forward for 20 years.
Capital losses for income tax purposes may be carried forward indefinitely and applied against capital gains realized in future years. Where applicable, a Fund’s net capital and non-capital losses are reported in footnote Capital and Non-Capital Losses on the Statements of Changes in Net Assets.
Renaissance Money Market Fund, Renaissance Canadian T-Bill Fund, Renaissance U.S. Money Market Fund, Renaissance Canadian All-Cap Equity Fund, Renaissance Corporate Bond Fund, Renaissance Corporate Bond Capital Yield Fund, Renaissance Global Focus Currency Neutral Fund, Renaissance Global Growth Currency Neutral Fund, Renaissance Global Infrastructure Currency Neutral Fund, Renaissance Global Real Estate Fund, Renaissance Global Real Estate Currency Neutral Fund, Renaissance International Equity Currency Neutral Fund, Renaissance Optimal Global Equity Portfolio, Renaissance Optimal Global Equity Currency Neutral Portfolio, Renaissance Optimal Income Portfolio, Renaissance Optimal Inflation Opportunities Portfolio, and Renaissance U.S. Equity Growth Currency Neutral Fund have a taxation year-end of December 31. All other Funds have a taxation year-end of December 15.
7. Brokerage Commissions and Fees
The total commissions paid by the Funds to brokers in connection with portfolio transactions are reported in footnote Brokerage Commissions and Fees on the Statements of Operations of each Fund. In allocating brokerage business, consideration may be given by the portfolio advisor and the portfolio sub-advisors of the Funds to the provision of goods and services by the dealer or a third party, other than order execution to a dealer (referred to in the industry as “soft dollar” arrangements). These goods and services are paid for with a portion of brokerage commissions and assist the portfolio advisor and the portfolio sub-advisors with their investment decision-making services to the Funds or relate directly to the execution of portfolio transactions on behalf of the Funds. The total soft dollar payments paid by the Funds to brokers are reported in footnote Brokerage Commissions and Fees on the Statements of Operations of each Fund. In addition, the Manager may enter into commission recapture arrangements with certain dealers with respect to the Fund. Any commission recaptured will be paid to the applicable Fund.
Fixed income, certain other securities and certain derivative products (including forwards) are transacted in an over-the-counter market, where participants are dealing as principals. Such securities are generally traded on a net basis and do not normally involve brokerage commissions, but will typically include a “spread” (being the difference between the bid and the offer prices on the security of the applicable marketplace).
Spreads associated with fixed income securities trading and certain derivative products (including forwards) are not ascertainable and, for that reason, are not included in the dollar amounts. In addition, the soft dollar amounts only include the value of research and other services supplied by a third party to the portfolio sub-advisors, as the value of the services supplied to the portfolio sub-advisors by the dealer is not ascertainable. When these services benefit more than one Fund, the costs are allocated among the Funds based on transaction activity or some other fair basis as determined by the portfolio sub-advisors.
8. Related Party Transactions
Canadian Imperial Bank of Commerce (CIBC) and its affiliates have the following roles and responsibilities with respect to the Funds and receive the fees described below in connection with their roles and responsibilities. The Funds may hold securities of CIBC. CIBC and its affiliates may also be involved in underwriting or lending to issuers that may be held by the Funds, have purchased or sold securities from or to the Funds while acting as principal, have purchased or sold securities from or to the Funds on behalf of another investment fund managed by CIBC or an affiliate, or have been involved as a counterparty to derivative transactions. Management fees payable and other accrued expenses on the Statements of Net Assets are amounts generally payable to a related party of the Fund.
16

Notes to Financial Statements (unaudited) p / 7
Manager, Trustee, Portfolio Advisor, and Portfolio Sub-Advisor of the Funds
CIBC Asset Management Inc., a wholly-owned subsidiary of CIBC, is the Manager, trustee, and portfolio advisor of each of the Funds.
The Manager also arranges for fund administrative services (other than advertising and promotional services, which are the responsibility of the Manager), legal, investor servicing, and costs of unitholder reports, prospectuses, and other reports. The Manager is the registrar and transfer agent for the Funds and provides, or arranges for the provision of, all other administrative services required by the Funds. The dollar amount (including all applicable taxes) of all fund administrative expenses (net of absorptions) that the Manager recovers from the Fund is reported in footnote Administrative and Other Fund Operating Expenses on the Statements of Operations.
American Century Investment Management, Inc. (ACI) is a portfolio sub-advisor to certain of the Funds. Although not an affiliate, CIBC currently owns a 41% percent equity interest in ACI.
Prior to January 1, 2014, CIBC Global Asset Management (CGAM), a wholly-owned subsidiary of CIBC, was a portfolio sub-advisor to certain of the Funds.
Effective January 1, 2014, CIBC Asset Management Inc., CIBC Asset Management Holdings Inc., CIBC Private Investment Counsel Inc. and CIBC Global Asset Management Inc. were amalgamated to form one legal entity, CIBC Asset Management Inc. (CAMI). CAMI will continue to act as portfolio advisor of the Funds. CAMI will directly provide investment management services to the Funds for which CGAM previously acted as portfolio sub-advisor and retain portfolio sub-advisors for the other Funds.
Brokerage Arrangements and Soft Dollars
The portfolio advisor and portfolio sub-advisors make decisions, including the selection of markets and dealers and the negotiation of commissions, with respect to the purchase and sale of portfolio securities, certain derivative products (including futures), and the execution of portfolio transactions. Brokerage business may be allocated by the portfolio advisor and the portfolio sub-advisors, including ACI, to CIBC World Markets Inc. and CIBC World Markets Corp., each a subsidiary of CIBC. The total commissions paid to related brokers in connection with portfolio transactions are reported in footnote Brokerage Commissions and Fees on the Statements of Operations of each Fund. CIBC World Markets Inc. and CIBC World Markets Corp. may also earn spreads on the sale of fixed income and other securities, and certain derivative products (including forwards) to the Funds. Dealers, including CIBC World Markets Inc. and CIBC World Markets Corp., may furnish goods and services, other than order execution, to the portfolio advisor and portfolio sub-advisors including ACI, that process trades through them (referred to in the industry as “soft-dollar” arrangements). These goods and services are paid for with a portion of brokerage commissions and assist the portfolio sub-advisors with their investment decision-making services to the Funds or relate directly to executing portfolio transactions on behalf of the Funds. They are supplied by the dealer executing the trade or by a third party and paid for by that dealer. As per the terms of the sub-advisory agreements, such soft dollar arrangements are in compliance with applicable laws. Custodial fees directly related to portfolio transactions incurred by the Fund, otherwise payable by the Fund, shall be paid by CAMI, and/or dealer(s) directed by CAMI, up to the amount of the credits generated under soft dollar arrangements from trading on behalf of the Fund, or portion of the Fund, during the month. The total soft dollar payments paid by the Fund to related brokers are reported in footnote Brokerage Commissions and Fees on the Statements of Operations of each Fund. In addition, the Manager may enter into commission recapture arrangements with certain dealers with respect to the Funds. Any commission recaptured will be paid to the relevant Fund.
Spreads associated with fixed income securities trading and certain derivative products (including forwards) are not ascertainable and, for that reason, are not included in the dollar amounts. In addition, the soft dollar amounts only include the value of research and other services supplied by a third party to the portfolio sub-advisors, as the value of the services supplied to the portfolio sub-advisors by the dealer is not ascertainable. When these services benefit more than one Fund, the costs are allocated among the Funds based on transaction activity or some other fair basis as determined by the portfolio sub-advisors.
Custodian
The Custodian holds all cash and securities for the Funds and ensures that those assets are kept separate from any other cash or securities that the custodian might be holding. The Custodian also provides other services to the Fund including record keeping and processing of foreign exchange transactions. CIBC Mellon Trust Company is the custodian of the Funds (the Custodian). The fees and spreads for services of the Custodian directly related to the execution of portfolio transactions by a Fund, or a portion of a Fund, for which CAMI acts as portfolio advisor are paid by CAMI and/or dealer(s) directed by CAMI, up to the amount of the credits generated under soft dollar arrangements from trading on behalf of the Fund, or portion of the Fund, during that month. All other fees and spreads for the services of the Custodian are borne as an operating expense by the Funds. CIBC owns a 50% interest in the Custodian.
Service Provider
CIBC Mellon Global Securities Services Company (CIBC GSS) provides certain services to the Funds, including securities lending, fund accounting and reporting, and portfolio valuation. CIBC indirectly owns a 50 percent interest in CIBC GSS. The dollar amount paid by the Funds (including all applicable taxes) to CIBC Mellon Trust Company for custodial fees (all net of absorptions) and to CIBC GSS for securities lending, fund accounting, reporting, and fund valuation (all net of absorptions) for the periods ended February 28, 2014 and August 31, 2013 is reported in footnote Service Provider on the Statements of Operations.x
9. Hedging
Certain foreign currency denominated positions have been hedged, or partially hedged, by forward foreign currency contracts as part of the investment strategies of certain Funds. These hedges are indicated by a hedging reference number on the Statement of Investment Portfolio and a corresponding hedging reference number on the Forward Foreign Currency Contracts Schedule for those Funds.
10. Collateral on Specified Derivatives
Short-term investments may be used as collateral for futures contracts outstanding with brokers.
11. Reconciliation of Net Assets Per Unit and Net Asset Value Per Unit
The application of CICA Handbook Section 3855 — Financial Instruments — Recognition and Measurement may result in a different value of securities held by a Fund for financial reporting purposes (defined as Net Assets when referring to the Fund or Net Assets Per Unit when referring to a unit of a particular class) than the value used for pricing unitholder transactions (defined as Net Asset Value when referring to the Fund or Net Asset Value per Unit when referring to a unit of a particular class). See footnote Reconciliation of Net Assets per Unit reported on the Statements of Net Assets.
12. Comparative Figures
To conform to the presentation adopted in the current period, certain amounts from the prior period have been reclassified.
17

This page is intentionally left blank.

Renaissance Investments
1500 University Street, Suite 800Montreal, Quebec
H3A 3S61-888-888-FUND (3863)
Websitewww.renaissanceinvestments.ca
CIBC Asset Management Inc., the manager and trustee of the Renaissance Investments family of funds, is a wholly-owned subsidiary of Canadian Imperial Bank of Commerce (CIBC). Please read the Renaissance Investments family of funds simplified prospectus before investing. To obtain a copy of the simplified prospectus, call 1-888-888-FUND (3863), email us at [email protected], or ask your advisor.
®Renaissance Investments is offered by and is a registered trademark of CIBC Asset Management Inc.
02345E (201402)