removal of cresols from synthetic wastewater using crude soybean
TRANSCRIPT
REMOVAL OF CRESOLS FROM SYNTHETIC WASTEWATER USING CRUDE SOYBEAN
PERQXIDASE
by
Kaushik Biswas
A thesis submitted to the College of Graduate Studies and Research through
Civil and Environmental Engineering in partial fùlfillment of the requirements for the
Degree of Master of Applied Science at the University of Windsor
Windsor, Ontario, Canada 1999
O 1999 Kaushik Biswas
Nationai Library 1+1 of Canada Bibliothèque nati~nale du Canada
Acquisitions and Acquisitions et Bibliographie Services services bibliographiques
395 Wellington Street 395, rue Wellington Ottawa ON K I A O N 4 Ottawa ON KI A ON4 Canada Canada
The author has granted a non- exclusive licence allowing the National Library of Canada to reproduce, loan, distribute or sell copies of this thesis in microfom, paper or electronic formats.
The author retains ownership of the copyright in this thesis. Neither the thesis nor substantial extracts fiom it may be printed or othenvise reproduced without the author' s permission.
Your file Voire r é l e m e
Our Ele tare r é f d m u a
L'auteur a accordé une licence non exclusive permettant à la Bibliothèque nationale du Canada de reproduire, prêter, distribuer ou vendre des copies de cette thèse sous la forme de microfiche/fïh, de reproduction sur papier ou sur fonnat électronique.
L'auteur conserve la propriété du droit d'auteur qui protège cette thèse. Ni la thèse ni des extraits substantiels de celle-ci ne doivent être imprimés ou autrement reproduits sans son autorisation-
ABSTRACT
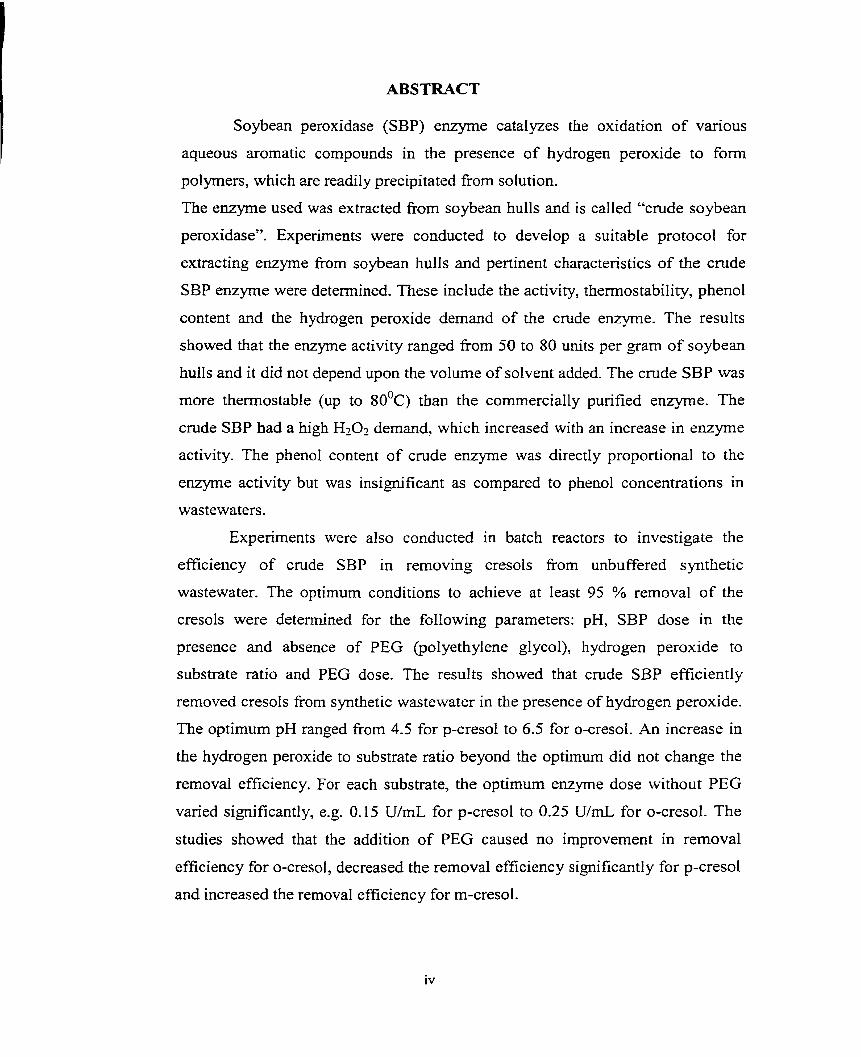
Soybean peroxidase (SBP) enzyme catalyzes the oxidation of various
aqueous aromatic compounds in the presence of hydrogen peroxide to form
polymers, which are readily precipitated from solution.
The enzyme used was extracted from soybean hulls and is called "crude soybean
peroxidase". Experiments were conducted to develop a suitable protocol for
extracting enzyme from soybean hulls and pertinent characteristics of the crude
SBP enzyme were detennined. These include the activity, thermostability, phenol
content and the hydrogen peroxide demand of the crude enzyme. The results
showed that the enzyme activity ranged from 50 to 80 units per gram of soybean
hulls and it did not depend upon the volume of solvent added. The crude SBP was
more thermostable (up to 8 0 ' ~ ) than the commercially purified enzyme. The
crude SBP had a high H202 demand, which increased with an increase in enzyme
activity. The phenol content of crude enzyme was directly proportional to the
enzyme activity but was insignificant as compared to phenol concentrations in
wastewaters.
Experiments were also conducted in batch reactors to investigate the
efficiency of crude SBP in rernoving cresols from unbuffered synthetic
wastewater. The optimum conditions to achieve at least 95 % removal of the
cresols were determined for the following parameters: pH, SBP dose in the
presence and absence of PEG (polyethylene glycol), hydrogen peroxide to
substrate ratio and PEG dose. The results showed that crude SBP efficiently
removed cresols from synthetic wastewater in the presence of hydrogen peroxide.
The optimum pH ranged fiom 4.5 for p-cresol to 6.5 for O-cresol. An increase in
the hydrogen peroxide to substrate ratio beyond the optimum did not change the
removal efficiency. For each substrate, the optimum enzyme dose without PEG
varied significantly, e.g. 0.15 U/mL for p-cresol to 0.25 U l d for O-cresol. The
studies showed that the addition of PEG caused no improvement in removal
efficiency for O-cresol, decreased the removal efficiency significantly for p-cresol
and increased the removal efficiency for m-cresol.

DEDICATION
This thesis is dedicated to my friends at the University of Windsor

ACKNOWLEDGEMENTS
The author would like to express his sincere gratefulness to bis advisors, Dr.J.K. Bewtra,
Professor of Civil and Environmental Engineering, University of Windsor and Dr. K.E.
Taylor, Professor of Chemistry and Biochemistry, University of Windsor for their
continuous support, encouragement, valuable suggestions and recommendations.
The author would like to thank the Commîttee members of his Master's thesis, Dr.
B.Mutus, Professor of Chemistry and Biochemistry, Dr. N.Biswas and Dr. P-Henshaw,
Professors of Civil and Environrnental Engineering, University of Windsor, for their
valuable suggestions during various stages of this work, which helped to improve the
quality of the work.
The author would like to express his gratefulness to Dr. Nihar Biswas, Professor and
Program Chair, Civil and Environmental Engineering, University of Windsor, once again,
for extending his dynamic efforts to provide al1 sorts of infra structural facilities and
giving valuable advises throughout the Master's degree program.
The author would like to thank Ms. JoAnn Grondin and Ms. Anne-marie Barlett, the
Secretaries of the Civil and Environmental Engineering Program, University of Windsor,
for their cooperation in various official rnatters.
The author wouId like to thank the Civil and Environrnental Engineering Program,
University of Windsor, for their financial help provided through Graduate Teaching and
Research Assistantships, during the course of Master's degree program.
The author would like to thank National Science and Engineering Research Council,
Canada for providing financial support for the research work.
Thanks are due to al1 colleagues of the author in graduate program, for their cooperation.
Last, but not the least, the family members of the author, deserve to get appreciation for
extending their moral support throughout the course of the Master's program.
LIST OF TABLES
............... Table 2.1 : Conventional Treatment Technologies for Phenolic Compounds 1 I
Table 4A . 2: Half life of commercial and crude SBP @) at different ....................................................................... temperature ranges -37
Table 4A.3. Effect of SBP dose on the H202 demand of the enzyme at pH 6.7 ............ 42
Table 4A.4. Phenol contributed by crude SBP ................................................ -44
Table 4A.5. Error Analysis ....................................................................... -45
Table 4B . 1 : Optimum pH for cresols ............................................................. 51
Table 413.2. Change in pH for o-cresol ....................................................... - 3 2
Table 4B.3. Optimum SBP dose in the presence and absence of PEG ...................... 60
Table 4B.4: Optimum HzOl to substrate ratios for the removal of cresols using crude SBP ................................................................................... 65
.... Table 4B.5. Minimum Effective PEG Dose for removal of cresols using crude SBP 69
Table 4B.6: Summary of Optimum Parameters for three selected phenolic compounds ................................................................................ -73
Table 4B.7: Error Analysis ...................................................................... 76
Table 5.1 : Summary of Optimum Reaction Parameters for Various Aromatic .............................................................................. Compounds -79
LIST OF FIGURES
Figure 3A.3.1: Flowchart for the extraction of SBP enzyme fiom soybean hulls using tapwater ............................................................................. 19
Figure 3B.3. I : Flowchart for Experimental Procedure ......................................... 25
Figure 4A . 1.1 : Effect of extraction time on the activity of crude SBP (A) extracted using tap water as solvent ............................................................... 31
Figure 4A . 1.2: Effect of extraction time on the activity of crude SBP (A) extracted using Phosphate buffer as solvent ...................................................... 32
Figure 4A . 1.3: Effect of the volume of solvent used on the total units of enzyme .......................................................................... extracted -33
....... Figure 4A.2.1. Variation of the activity of the commercial SBP with heating tirne 35
... Figure 4A.2.2. Variation of the activity of the crude SBP (A & B) with heating time 36
Figure 4A.3.1: Effect of pH on H20Z demand of crude SBP (B) at an enzyme dose of . O 1 U/mL ........................................................................... 39
Figure 4A.i.2: Effect of pH on H202 dernand of cmde SBP (B) at an enzyme dose of 0.4 U/mL ........................................................................... 40
Figure 4A.3.3: Effect of pH on H 2 0 1 demand of cmde SBP at an enzyme dose of 0.8 U/mL ........................................................................... 41
............ Figure 4B . 1.1 : Effect of pH on the removal of o-cresol using crude SBP (A) -47
Figure 4B . 1.2. Effect of pH on the removal of o-cresol using crude SBP (B) ............. 48
Figure 4B.1.3. Effect of pH on the removal of m-cresol using crude SBP (B) ............ 49
Figure 4B . 1.4. Effect of pH on the rernoval of p-cresol using crude SBP (B) ............. 50
............... Figure 4B . 2.1 : Effect of crude SBP (A) dose on the removal of o.creso1 - 3 3
Figure 4B.2.2. Effect of cmde SBP (B) dose on the rernoval of o.cresol ................... 54
................. Figure 4B.2.3. Effect of crude SBP (B) dose on the removal of m-cresol -55
Figure 4B.2.4. Effect of crude SBP (B) dose on the removal of p.creso1 .................. .56
Figure 4B.2.5. Effect of crude SBP (B) dose on the removal of p.creso1 ................... 57
Figure 4B.2.6. Effect of crude SBP (B) dose on the removal of p.creso1 ................. -58
Figure 4B.3.1. Effect of H202 dose on the removal of O-cresol using cmde SBP (A) ..... 61
.... Figure 4B.3.2. Effect of H202 dose on the removal of O-cresol using crude SBP (B) 62
Figure 4B.3.3. Effect of H202 dose on the rernoval of m-cresol using crude SBP (B) ... 63
Figure 4B.3.4. Effect of &Oz dose on the removal of p-cresol using crude SBP (B) .... 64
.... Figure 4B.4. i : Ef'fect of PEG dose on the removaI of O-cresol using cmde SBP (B) 66
Figure 4B.4.2. Effect of PEG dose on the removal of m-cresol using crude SBP @) .... 67
..... Figure 43.4.3. Effect of PEG dose on the removal of p-cresol using crude SBP (B) 68
Figure 4B.5.1. Effect of crude SBP (B) dose on the removal of phenol .. .. ............... 70
Figure 4B.5.2: Effect of crude SBP (E3) dose on the removal of two substrates: O-cresol 2nd m.creso1 ....................................................................... 71
Figure 4B.5.3: Effect of crude SBP (B) dose on the removal of two substrates: phenol and m-cresol ........................................................................... -72
1. INTRODUCTION
Cresols are isomeric substituted phenols with a methyl substituent at either
ortho, meb or para position relative to the hydroxyl group. These compounds are
contained in crude oi!, coal tar, and flyash from coal and wood combustion
(WHO, 1995). Cresols are considered to be toxic and have been classified as
hazardous pollutants. There is clear evidence that during dermal or oral exposure
in hurnans, high concentrations of cresok are corrosive, absorbed rapidly and
produce severe toxicity that may result in death. The present treatment methods
for removing aromatic compounds from wastewater, including biological
treatment, chemical oxidation, adsorption on activated carbon and solvent
extraction suffer from certain drawbacks. The introduction of an enzyme based
technology by Klibanov et al. (1980) is expected to be a feasible alternative to the
conventional treatment methods.
1.1 Enzyme Background
Traditionaliy, waste treatment processes have been evaluated in terrns of
reducing gross indicators of pollution such as biochemical oxygen demand
(BOD), chernical oxygen demand (COD) or total organic carbon (TOC). Today,
there is an increased emphasis on the removal of specific pollutants from waste
mixtures and on the multimedia (air, land and water) effects of treatrnent
processes. Existing waste treatment processes have limitations associated with the
removal of specific chemicals to regulated leveis. Enzymes represent one means
by which selective removal of pollutants rnight be accomplished in waste
removal. Enzymes cataIyze chemical reactions that would othenvise be too slow
at arnbient temperatures to be of interest and therefore, can achieve chemical
transformations that may be difficult to achieve efficiently with conventional
chernical and biological treatment processes.

The use of enzymes in waste treatment applications was first proposed in the
1930s. However, the concept of using enzymes to destroy individual pollutants in
waste mixtures was not developed until the 1970s. Al1 enzymes are proteins,
whch are Iarge molecules consisting of amino acid units joined in series. These
biological catalysts increase the rate of the chemical reaction which is taking
place (Palmer, 198 1). The substrate of an enzyme is defined as the reactant of an
enzyme-catalyzed reaction. The region, which contains the binding and catalytic
sites, is termed the active site of the enzyme.
The kinetic feature thaî most distinguishes enzyme-catalyzed reactions
fiom simple chemical reactions is that they show saturation. Enzymes, as catalysts
promote chernical reactions but are not irreversibl y rnodified themselves. Rate
enhancernents are attributed to a lowering of the activation energy of the reaction.
In simple terrns this is explained by the reactant physically binding to the enzyrne
at an "active site", forming a metastable complex (Palmer, 198 1). The activation
energy for the breakdown of this complex is then considerably lower than that for
the breakdown of the reactant alone. Starting from the simple concept the reaction
scheme proposed is as follows:
Enzyme + Reactant L
C o r n p l e x + Enzyme + Product
FI CRI [ER] FI PI The complex formation step is regarded as being reversible as the complex
has a similar energy state to the enzyme-reactant mixture. The subsequent
breakdown of the cornplex to give products will be exothermic and this stage may
be effectively irreversible in many cases (Gacesa and Hubble, 1 987).
The enzyme used in this study is a peroxidase which is extracted fiom
soybean hulls called "crude soybean peroxidase" (SBP). Peroxidases oxidize
reduced compounds in the presence of hydrogen peroxide. Several other
peroxidases have been studied, with horseradish peroxidase (HRP) being the most
extensively researched to date. Although the SBP enzyme has not been used in
research as rnuch as Hm, it is considered to be a suitable alternative to the other
peroxidases. Previous studies (Al-Kassim et al., 1995 and Caza et al., 1999) have
indicated that SBP is effective in removing several different phenolic compounds
fiom wastewater. This process produces a minimal amount of waste and is cost
cornpetitive with the other peroxidases that have been studied. In al1 of the
previous studies with SBP, the commercially purified enzyme was used and no
one had tried the "crude SBP".
1.2 Objectives
The objectives of this study were to:-
O extract enzyme from soybean hulls;
O determine pertinent characteristic properties of the enzyme and
O optimize the reaction parameters in unbuffered tap water, to achieve at
least 95 % removal of cresols by using soybean peroxidase (SBP).
1.3 Scope
The scope of this research included:
Establishment of a suitable experimental protocol for extracting enzymes
from soybean huIls by optimizing parameters such as time of extraction
and hulls to solvent ratio.
Determination of the characteristic properties of the crude SBP like the
activity of the enzyme extracted, stability of the enzymes at different
temperatures, amount of phenol present in the crude enzyme and hydrogen
peroxide demand of the enzyme at different pH and enzyme doses.
Optimization of the removal of O-,m- and p-cresoi with crude SBP with
respect to: pH, SBP dose in the presence and absence of polyethylene
glycol (PEG), moIar ratio of hydrogen peroxide dose to substrate dose,
and PEG dose.
Study of the effect of PEG on optimum enzyme dose.
Determination of the effect of CO-precipitation with two different
substrates on the optimum enzyme dose.
Comparison of the removal of cresol with cornrnercialIy purifïed SBP
enzyme and cmde SBP.
2. LITERATURE REVIEW
2.1 Cresols as poliutants
Cresols are contained in crude oil and coal tar. Therefore, the
dominant anthropogenic sources of cresols are accidental and process
discharge during the manufacture, use, transport and storage of cresols or
associated products of the coal tar and petroleum industries. Cresols are also
produced during coal gasification, coal liquefaction and shale oil production. Low
levels of cresols are present in the exhaust of vehicles powered with petroleum-
based fuels, stack emissions fiom municipal waste incinerators, and emissions
fiom the incineration of vegetable materials (WHO, 1995).
According to the Toxic Release Inventory (TRI) database, maintained by the
US EPA, the total production-related cresol waste in USA for 1996 was more than
10 thousand tons. The total release was more than 900 tons. The TRI data may
have under-estimated the actual release since o d y certain types of facilities were
required to report (WHO, 1995).
There is clear evidence in humans that, during dermal or oral exposure, high
concentrations of cresols are corrosive, absorbed rapidly and produce severe
toxicity that may result in death (WHO, 1995).
Several populations have been identified that may be at special risk from
cresol exposure. For instance, in persons with renal insufficiency, the renal
clearance of phenol and p-cresol is impairsd, Ieading to accumulation of cresol in
the blood. Individuals with glucose-6-phosphate dehydrogenase (G6DP)
deficiency may also have heightened sensitivity to the haernatological effects of
cresols (WHO, 1 995).
Governmental regulations will require that a broad range of organic
compounds in concentrations ranging fiom beiow &litre levels to 1000s of
mglitre must be detected and removed fiom aqueous streams even though they
arrive at the detection/removal stage in a solution/suspension which can Vary
widely in other parameters such as temperature, pH, level of other solutes and
particulates. For example, in 1986 the Ontario Ministry of the Environment
announced the Municipal lndustrial Strategy for Abatement (MISA) Program
whose objective is the virtual elimination of persistent toxic discharges into
Ontario watenvays. Future compliance with the discharge limits imposed by this
and other similar programs will require the development of economically and
technoIogically effective methods for reducing industrial and municipal
discharges of targeted pollutants (Nice11 et al., 1993).
2.2 Cresols: Uses, Sources and Levels of exposure
Cresols are used as solvents, disinfectants, and in the production of
fragrances, antioxidants, dyes, pesticides, resins, and as wood preservatives.
Cresols are contained in crude oil, coal tar, and fly ash from coal and wood
combustion (WHO, 1995). The isorner O-cresol is used as a chernical intermediate
for deodorizing and odour enhancing compounds and in pharmaceuticals. The
compound p-cresol is mainly used in the formulation of antioxidants for
lubricating oil and motor fuel, rubber, and polyrners. The isomer m-cresol is used
in the manufacture of explosives and in the production of herbicides and
insecticides.
~e water Exposure to cresol can occur through air, water or food. Surfa-
concentrations in the USA range from below the detection limit to 77pgfL
(STORET, 1993). Levels of 204 p g L have been reported in a river polluted by
industrial effluents in Japan. Concentrations as high as 2 100 pg/L for O-cresol and
1200pgL for mixed m- and p-cresols have been detected in wastewaters (WHO,
1995).
2.3 Enzyme: Extraction
A different purification procedure is usually necessary to isolate each
enzyme, and there are many techniques that are available for the separation of
proteins.
First and foremost, a suitable extract of the enzyme-containing tissue must
be made. For many simple hydrolytic enzymes of micïobial origin, the protein is
secreted into the growth medium and removal of the cells Sy centrifugation is the
only step that is required.
Extraction of enzymes fiom plant tissues presents a whole new set of
problems and the comparitively small number that have been isolated is in part a
reflection of the difficulties that are encountered. The ce11 wall of plants presents a
formidable challenge. The forces needed to destroy the ce11 wall are so great that
the desired enzymes are fiequently denatured in the process. Furthemore, rnany
plants contain phenolic compounds that are oxidized enzymically (polyphenol
oxidases) in the presence of molecular oxygen to give products that can rapidly
inactivate many enzymes. The pH, ionic strength and composition of the medium
that is used for the extraction of an enzyme is important to the success of this and
subsequent stages of purification (Gacesa and Hubble, 1987).
2.4 Enzyme: Stability
Most enzymes have been shown to be moderately stable in the ranse 0-
4 ' ~ . During storage, when catalytic activity is not important. this would represent
the ideal temperature range. In some cases the presence of stabilizers, eg. gIycols
and sulphydryl compounds, have been shown to be highly beneficial. The
presence of reactants or reactant analogues has also been shown to have a
stabilizing effect on many enzymes (Gacesa and Hubble, 1987).
Intrinsically stable enzymes are generally found in organisms adapted to
life in hostile environments. Although no clear principle has emerged, it appears
that a degree of flexibility, allowing rapid renaturation, may be important. The
greater stability of these enzymes must be balanced against the often higher cost
of production when they are assessed for commercial applications (Gacesa and
Hubble, 1987).
The stability of a given enzyme is a cornplex function of the
environmental conditions used. It varies with pH, reactant concentrations and the

presence of destabilizing agents. Generally, the decay of enzyme activity is
attributed to thermal effects, with the rate of decay being first order, reflecting the
properties of the enzyme and its local environment (Cornish-Bowden, 1 979).
For an enzyme to be suitable for commercial applications, it must be
sufficiently stable for the purpose. In case of a reactor system, the stability can be
quantified in terms of the profit made on the product formed during the lifetime of
the enzyme catalyst. Whereas, for a sensor, the criterion would usually be based
on the need for a linear response over an extended time period. This period would
be determined by the cost of replacement and the mn time of the process to be
monitored. In addition to operational stability, ease and cost of storage must be
considered. The rate of decay of enzyme activity, CE] with time, t, is given by:
wliere [El is enzyme activity and i~ is rate constant
(Cornish-Bowden, 1979)
This equation can be integrated to give the active enzyme concentration at time
t([EtI):
where [Et] = Active enzyme concentration at time t
[Eo] = Initial enzyme activity
So the decay constant, kd, for the enzyme can be determined by plotting
ln([Et]/[Eo]) versus t.
The decay constant i~ is related to temperature according to the Arrhenius
relationship, with the activation energy of the destabilization process being
critical (Gacesa and Hubble, 1 987). The presence of stabilizing compounds and
the storage pH may change the activation energy and hence the necessary storage
temperature.
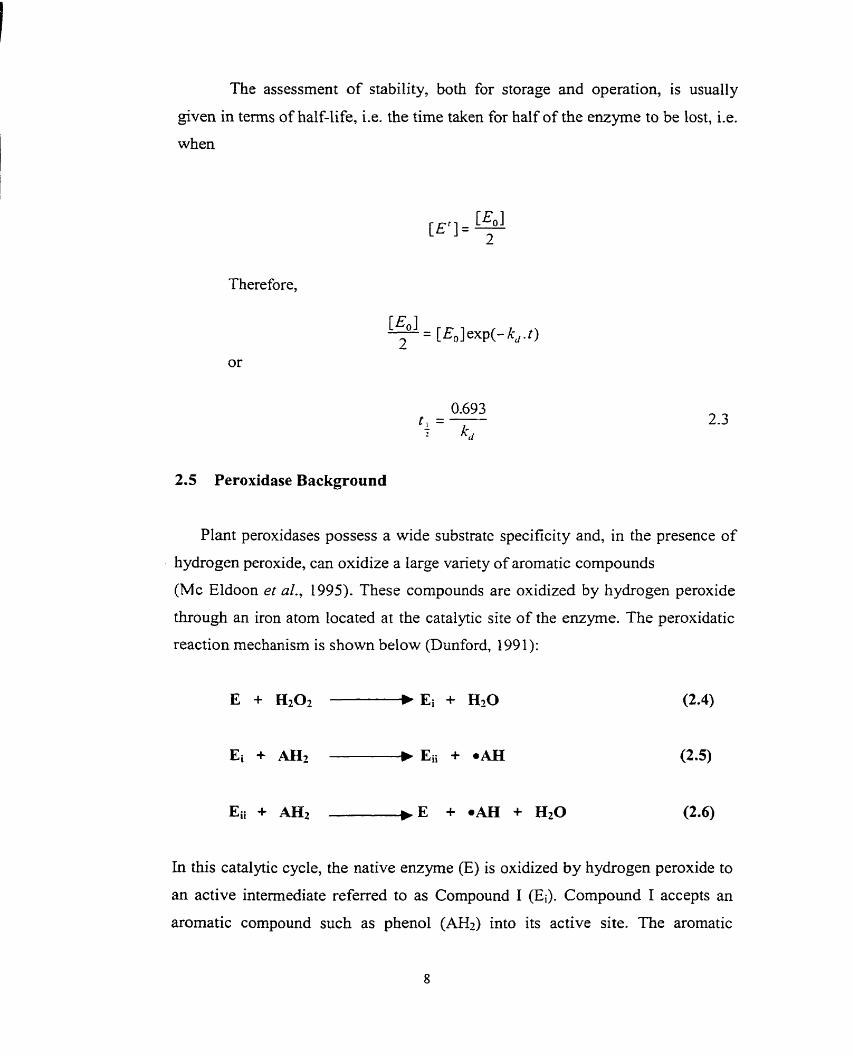
The assessrnent of stability, both for storage and operation, is usually
given in terms of half-life, Le. the tirne taken for half of the enzyme to be lost, Le.
when
Therefore,
2.5 Peroxidase Background
Plant peroxidases possess a wide substrate specificity and, in the presence of
hydrogen peroxide, can oxidize a large variety of aromatic compounds
(Mc Eldoon et al., 1995). These compounds are oxidized by hydrogen peroxide
through an iron atom located at the catalytic site of the enzyme. The peroxidatic
reaction mechanisrn is shown below (Dunford, 199 1 ):
In thk catalytic cycle, the native enzyme (E) is oxidized by hydrogen peroxide to
an active intermediate referred to as Compound 1 (Ei). Compound 1 accepts an
aromatic cornpound such as phenol (AH2) into its active site. The aromatic
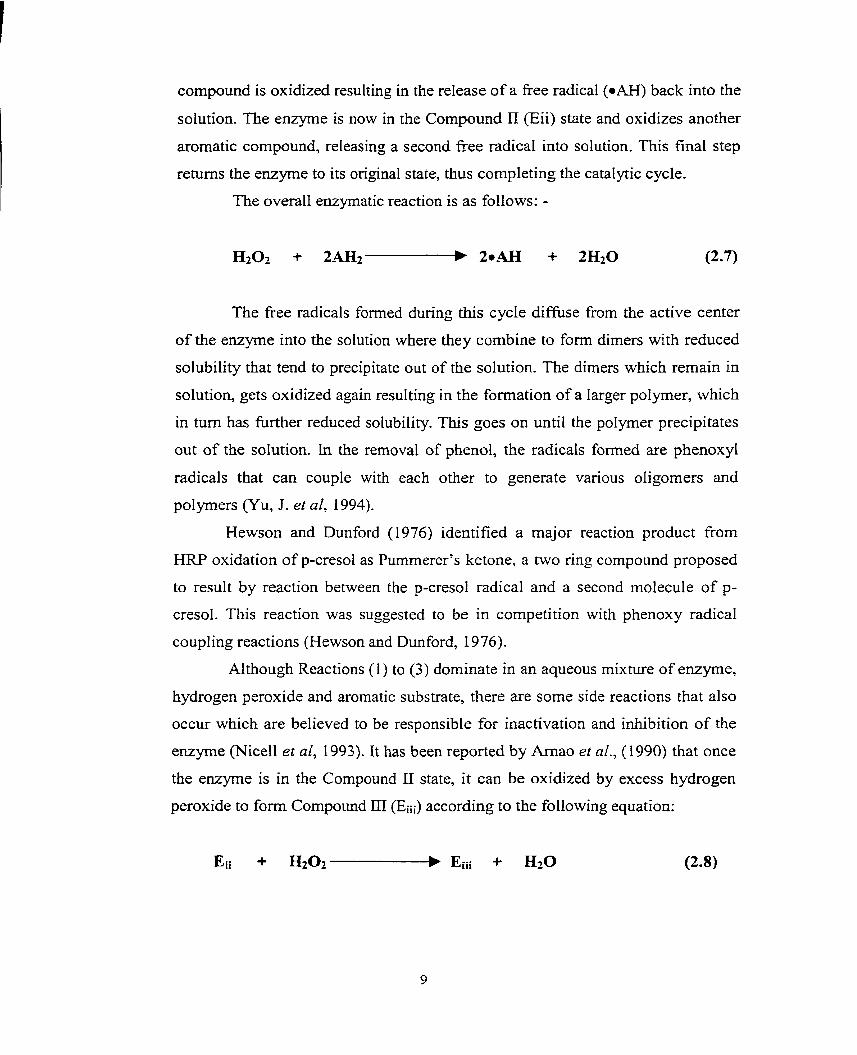
compound is oxidized resulting in the release of a fkee radical (.AH) back into the
solution. The enzyme is now in the Compound II (Eii) state and oxidizes another
aromatic compound, releasing a second fiee radical into solution. This final step
returns the enzyme to its original state, thus completing the catalytic cycle.
The overalI enzymatic reaction is as follows: -
The fiee radicals formed during this cycle diffuse from the active center
of the enzyme into the solution where they combine to form dimers wiih reduced
solubility that tend to precipitate out of the solution. The dimers which remain in
solution, gets oxidized again resulting in the formation of a Iarger polymer, which
in tum has further reduced solubility. This goes on until the polymer precipitates
out of the solution. In the removal of phenol, the radicals formed are phenoxyl
radicals that can couple with each other to generate various oligomers and
polymers (Yu, J. et al, 1994).
Hewson and Dunford (1976) identified a major reaction product from
HRP oxidation of p-cresol as Purnrnerer's ketone, a two ring compound proposed
to result by reaction between the p-cresol radical and a second molecule of p-
cresol. This reaction was suggested to be in cornpetition with phenoxy radical
coupling reactions (Hewson and Dunford, 1976).
Although Reactions (1) to (3) dominate in an aqueous mixture of enzyme,
hydrogen peroxide and aromatic substrate, there are sorne side reactions that also
occur which are believed to be responsible for inactivation and inhibition of the
enzyme (Nice11 et al, 1993). It has been reported by Arnao et al., (1990) that once
the enzyme is in the Compound II state, it can be oxidized by excess hydrogen
peroxide to form Compound III (Eiii) according to the following equation:

Compound III is equivalent to the oxy-ferro or superoxide-ferri-fonn of the
enzyme. The retum to the native enzyrne is extremely sIow, and therefore once in
the Compound III fom, the enzyme is suffkiently ineffective in carrying out the
oxidation of arornatic substrates.
2.6 Wastewater Treatment
The enzymatic method for treating phenolic compounds uses peroxidases in
the presence of hydrogen peroxide to f o m phenoxy1 radicals. These radicals
coupIe to eventualIy form larger oligomers, which are practically insoluble in
water and can be separated easily by filtration or sedimentation. Phenolic
compounds such as cresols corne fiom a variety of sources and this method has
many advantages over conventional treatment processes.
2.6.1 Conventional Methods
The selection of a waste treatment process involves the evaluation of many
factors, including the technical feasibility with respect to one or more treatment
objectives (permit requirements), economic feasibili ty, and the potential to
generate residuals that require subsequent treatrnent or disposal. For wastes
containing toxic components, treatment processes that destroy the toxic materials
are preferred over methods that simply transfer these materials from one phase to
another, for exarnple, stripping of volatile organic compounds from wastewater
into the atmosphere. Table 1.1 lists the current methods used for treating phenolic
wastes. These conventional methods suffer from such serious drawbacks as
incomplete removal, high cost, formation of hazardous by-products and
applicability to a small concentration range.
Physical and chemical treatment processes, including activated carbon
adsorption and the various oxidation processes developed in recent years are
typically able to remove organic pollutants to low levels. However, most
physiochemical treatment processes are not highly selective in terms of the range
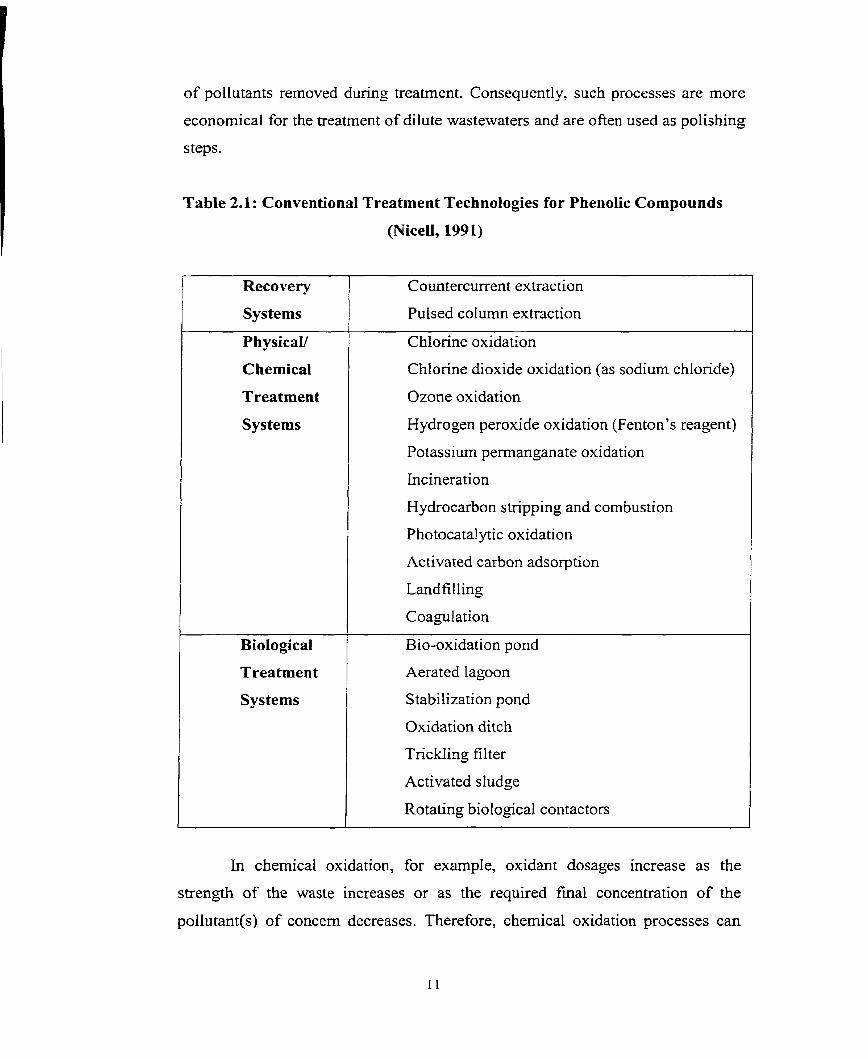
of pollutants removed during treatment. Consequently, such processes are more
economical for the treatment of dilute wastewaters and are ofien used as polishing
s teps.
Table 2.1: Conventional Treatment Technologies for Phenotic Compounds
Recovery
Systems
PhysicaY
Chernical
Treatment
Systems
Biological
Treatment
Systems
Countercurrent extraction
Pulsed column extractiort
Chlorine oxidation
Chlorine dioxide oxidation (as sodium chloride)
Ozone oxidation
Hydrogen peroxide oxidation (Fenton's reagent)
Potassium permanganate oxidation
lncineration
Hydrocarbon stripping and combustion
Photocatalytic oxidation
Activated carbon adsorption
Landfilling
Coagulation
Bio-oxidation pond
Aerated Iagoon
S tabilization pond
Oxidation ditch
Tnckling filter
Activated shdge
Rotating biological contactors
In chemical oxidation, for example, oxidant dosages increase as the
strength of the waste increases or as the required final concentration of the
pollutant(s) of concem decreases. Therefore, chemical oxidation processes can
become prohibitively expensive for high strength wastes, even though the target
pollutants might only be present in low concentrations.
Biological treatment, for example, is dependent on the health and activity
of the microbial population. These microorganisms require suscient food and
oxygen, and stable environmental conditions, including pH and temperature, if
they are to maintain optimum eficiency (Lanouette, 1977). Hence, with these
shortcomings, alternative methods are desirable.
2.6.2 Use of enzymes
Enzymes represent one means by which selective removal of pollutants
mi@ be accomplished in uraste treatment. Such specificity allows enzymes to
remove target pollutants selectively, while utilizing any required chernical
reactants with very high stoichiometric efficiency. Enzyme specificity also
precludes undesirable or unnecessary reactions, which would otherwise increase
reactant consumption and correspondingly increase the cost of treatment. This is a
great advantage over conventional chemical treatment processes. Therefore,
enzymes have the potential to combine the advantages of selectively with the
simplicity, reliability and predictability of conventiona1 chernical treatment
systerns.
The following potential advantages of an enzyme-based treatment over
conventional biological treatment were noted by Nice11 et al. (1 993):
application to a broad range of compounds;
action on, or in the presence of, many substances which are toxic to
microbes;
operation at both high and low concentrations of contaminants;
operation over wide temperature, pH and salinity ranges;
no shock loading effects;
no delays associated with acclimatization of biomass;
reduction in sludge vohrne (no biomass generation);
better defined system with simpler process control.

The same group also discussed the following potential advantages of an enzyme-
based treatment over chemical/pl~ysical processes:
* operation under milder, less corrosive, conditions;
0 operation in a catalytic marner;
operation on trace level organic compounds and on organics not removed by
existing chemical/physical processes;
reduced consumption of oxidants;
0 reduced amounts of adsorbent materials for disposal.
Klibanov et al. (1 980) developed an enzymatic method for removing over 30
different phenols and anilines from wastewater using horseradish peroxidase
(HRP). They noted certain reaction parameters, which were of significant
importance, such as pH, hydrogen peroxide concentration and peroxidase
concentration. Their results indicated that large amounts of HRP were required
and, therefore, this method of treatment did not seem promising due to the high
cost of the enzyme. Continued research showed that a great reduction in enzyme
requirements could be achieved by using additives such as gelatin and
polyethylene glycol (Nakamoto et al., 1992; Wu Y. et a[; 1997) compared
different additives in the removal of phenolic compounds and concluded that
polyethylene glycol (PEG) was the best additive and that the amount of
horseradish peroxidase required decreased significantly with an increase in PEG
dose. Although HRP efficiently removed phenolic compounds from wastewater, it
is unlikely ever to become a cornrnodity suitable for this process due to the
vagaries of root cultivation and processing (Taylor et al., 1996).
2.7 Peroxidase in Wastewater Treatment
The polymerization of aromatics in the presence of oxidoreductive
enzymes, has recently been the focus of much attention due to its potential use for
the decontamination of wastewaters. The enzymatic approach is particularly
suitable for the treatment of wastewaters because during polymerization the

products forrn insoluble precipitates that can be removed easily from water by
sedimentation or filtration.
Klibanov (1 982), Klibanov & Morris (1 98 l), Kiibanov et al. (1980, 1983),
Maloney et al. (1 985, 1986) and Fiessinger et al. (1 984) have demonstrated the
effectiveness of using horseradish peroxidase for the polyrnerization and
precipitation of substituted phenols and aromatic amines fiom wastewaters and
drinking waters. These authors recognized the potential for the enzymatic
treatrnent process and recornrnended the process for fùrther development.
Although the enzymatic method has many advantages over conventional
treatment technologies, it has a significant disadvantage: the relatively short
catalytic lifetime of the enzyme. The short catalytic lifetime has been attributed to
the inactivation of the peroxidase. Klibanov et al. (1983) has suggested that this
inactivation occurs dunng the enzyrnatic reaction due to interactions of the
phenoxyl radicals with the enzyme's active site. Therefore, this enzyrnatic method
has not been considered to be a feasible option for application due to the
extremely high cost of the enzyme.
Nakamato and Machida (1991), on the other hand, have reported that
enzyrne inactivation is a result of the end-product polymer which adsorbs the
enzyrne and hinders the access of substrate to the enzyme's active site. They
showed that the mount of enzyme could be greatly reduced by adding proteins or
hydrophilic synthetic polymers, such as gelatin and polyethylene glycol (PEG).
These additives inhibit the interactions between the enzyme and the phenolic
polymers.
Wu J. et al. (1993) studied the effect of PEG on the minimum
horseradish peroxidase (HRP) dose for 95% removal of phenol. They concluded
that PEG protected the enzyme activity, and that 1/40 and 1/75 of the original
amount of enzyme was required in the presence of PEG, for 1 and 10 rnM phenol
solutions, respectively. These results were confirmed by Wu Y. et al. (1997)
where they compared different additives on the removal of phenolic compounds
using HRP. The additives selected for the study were PEG, gelatin, and two
polyelectrolytes, PERCOL LT24 (cationic) and PERCOL LT20 (non-ionic). Wu
Y. and CO-workers concluded that polyethylene glycol was better than the other
additives for several reasons. They found that excess PEG had no negative effect
on the reaction whereas excess gelatin and the polyelectrolytes actually lowered
the removal eficiency and also resulted in not forming particles. The effluent
quality of the wastewater which was treated with PEG was better since at
minimum PEG dose, there was little PEG left in solution; however, a considerable
amount of gelatin remained in solution even at its minimum dose. Gelatin also
produced more precipitate than PEG because the minimum gelatin doses were
found to be higher than the minimum PEG doses. The results also indicated that
the minimum HRP dose required for 95% removal of the arornatic compounds in
the presence of PEG was much less than the original amount required without
PEG for certain compounds (Wu, Y et al., 1993).
The removal of phenols from a foundry wastewater using HRP was
investigated by Cooper et al. (1995). These studies were conducted not only to
optimize the operating conditions, but also to reduce costs. The economic
feasibility of this process rested on reducing the cost of the enzyrne. Two
approaches were taken to minimize overall treatment costs: (1) evaluate the use of
an additive to reduce enzyme requirements; (2) examine the potential of using a
low purity enzyme to achieve equivalent removal at a Iower cost. They found that
PEG greatly reduced the cost associated with the enzyme. The use of PEG, a
relatively inexpensive chernical, reduced the HRP requirements to 1/22 of the
original enzyrne requirements, which in tum greatly reduced the overall
enzyrnatic treatment cost. Their results also showed that this process was capable
of achieving 97-99% removal of total phenols from a foundry wastewater using
either purified HRP or a cmde HRP extract.
It has been suggested that easily removed aromatic compounds aid in the
removal of otber compounds with lower removal efficiencies (Kiibanov et al.,
1980). These studies have shown that the removal efficiency of phenol increased
in the presence of more easily removable compounds. Klibanov and CO-workers
have suggested two explanations, the first one being that phenol has a low
reactivity towards peroxidase and is therefore poorly rernoved. Consequently, the
addition of more easily removed compounds increases the yieid of free radicals
which results in a higher formation of the polymenc products. The second
explanation is that phenol is reactive towards peroxidase but the by-products have
a low rnolecular rnass and are soluble in water. The addition of compounds with
higher removal efficiency results in the formation of a polymer with a higher
molecular rnass and therefore precipitates out of the solution.
2.8 Soybean peroxidase as an enzyme
McEldoon et al., (1995) have examined the substrate specificity of a
peroxidase isoIated from soybean hulls (SBP). In their study, they found that plant
peroxidases, such as SBP and HRP, possess a wide substrate specificity that can
be dramatically broadened at low pH values to include nonphenolic compounds.
SBP follows a ping-pong, bi-bi catalytic reaction mechanism. It is found to be
highly stable at pH 2.4 and also thermostable under acidic conditions.
Caza et al., (1999), have shown that soybean peroxidase is a viable
alternative to other enzymes that have previously been studied. The results of the
study have demonstrated the applicability of using SBP for treating synthetic
phenolic wastewater. The reaction parameters, optimized to achieve a removal
efficiency of at least 95%, were pH, SBP dose with and without PEG,
[H20î]/[Substrate] and PEG dose. The study recornmended the necessity of
investigating the potential of using soybean hulls instead of purchasing the
enzyme from a chemical manufacturer. After the enzyme has been extracted from
the hulls, they could then be used as animal feed. This would greatly reduce the
amount of solid waste that is produced and in turn would also reduce costs.
Similarly, some researchers have also suggested using crude HRP (Cooper et al.,
1996; Dec et al., 1994; Klibanov, 1982) to reduce treatment costs. In contrast to
cmde SBP, the amount of solid waste produced with the use of crude HRP is
much greateï. Another advantage of using soybeans is that they are more readily
available than horseradishes.

3. MATERIALS AND METHODS
The entire work was divided into two sections A and B. Section A
involved the extraction and characterization of cmde soybean peroxidase enzyme
and Section B involved the polyrnerization and rernoval of substrates.
3A. Extraction and characterization of crude soybean peroxidase enzyme
3A.f Materials
Soybean hulls were obtained fi-orn ADM-Agri Industries Limted,
Windsor, fiorn two different batches (called A & B). A was 5 years older than B
and while the former was stored at 4 ' ~ in dark the latter was obtained fresh. The
activity of the enzyme extracted from the hulls, was determined by using the
enzyme activity assay descnbed in Appendix A (Wu, 1993). A unit of activity is
defined as the number of micromoles of hydrogen peroxide converted per minute
at pH 7.4 and temperature 2 5 ' ~ . The hulls were stored at room temperature, while
the enzyme extract was stored at 4 ' ~ .
Hydrogen peroxide (30% by rnass over volume) was purchased from
BDH inc., Toronto, Ontario and was stored in a refrigerator at 4 ' ~ . The diluted
hydrogen peroxide solutions used in the anal ysis were prepared daily.
Whatrnan's glass microfiber filters of 42.5 mm diameter (934-AH) was
purchased from Whatman Inc. Clifton, NJ 07014, USA. Also, millipore filters of
Type HA and size 0.45pM were purchased from Millipore Corporation, Bedford,
M-4 01730.
3A.2 Analytical Equipment
The rate of colour absorbance for enzyme activity was measured
using a Hewlett Packard Diode A m y Spectrophotometer Mode1 8452A (with a
wavelength range of 190 to 820 nm and 2nm resolution), which was controlled by
a Hewlett Packard Vectra ES/12 cornputer. Polystyrene disposable semi-micro
cuvettes were used. They were purchased from Bio-Rad Laboratories, Hercules,
CA. An IEC Centrifuge, supplied by International Equipment Company, USA;
was used to separate suspended particles. It was operated at 4000 r.p.m. for 5 min.
An Expandable Ion Analyzer EA 940, manufactured by Orion Research,
was used to measure the pH of the samples. Standard buffer solutions of pH 4.0,
7.0 and 10.0 were purchased from BDH Inc., Toronto, Ontario.
3A.3 Experimental Procedure
3A.3.1 Extraction of soybean peroxidase from soybean hulls
The experiments were conducted at room temperature of approximately
22'~. The study was designed to develop a suitable experimental protocol for
extraction of soybean peroxidase (SBP) from soybean hulIs. Soybean hulls was
obtained in two different batches (A & B) of hulls. Tap water and phosphate
buffer solution (O. 1 M, pH=7.4) [Gornori, 19551 were used as solvents in order to
extract the enzyme from the hulls. Buffer solution was used so that the pH
remained stable during extraction.
10 g of soybean hulls was added to tap water and buffer solution separately
and mixed thoroughly with magnetic stirrer. After mixing, the hulls were
separated from the solution, first by centrifugation and then by filtration.
hespective of the amount of solvent used about 50 mL of the solvent could not
be recovered in the extraction process. Then the activity of the extracted enzyme
solution was deterrnined. This enzyme solution extracted from soybean hulls is
tcmed as "crude soybean peroxidase". The parameters that were varied in order
to detemine the optimum conditions were time of extraction and hulls to solvent
ratio.
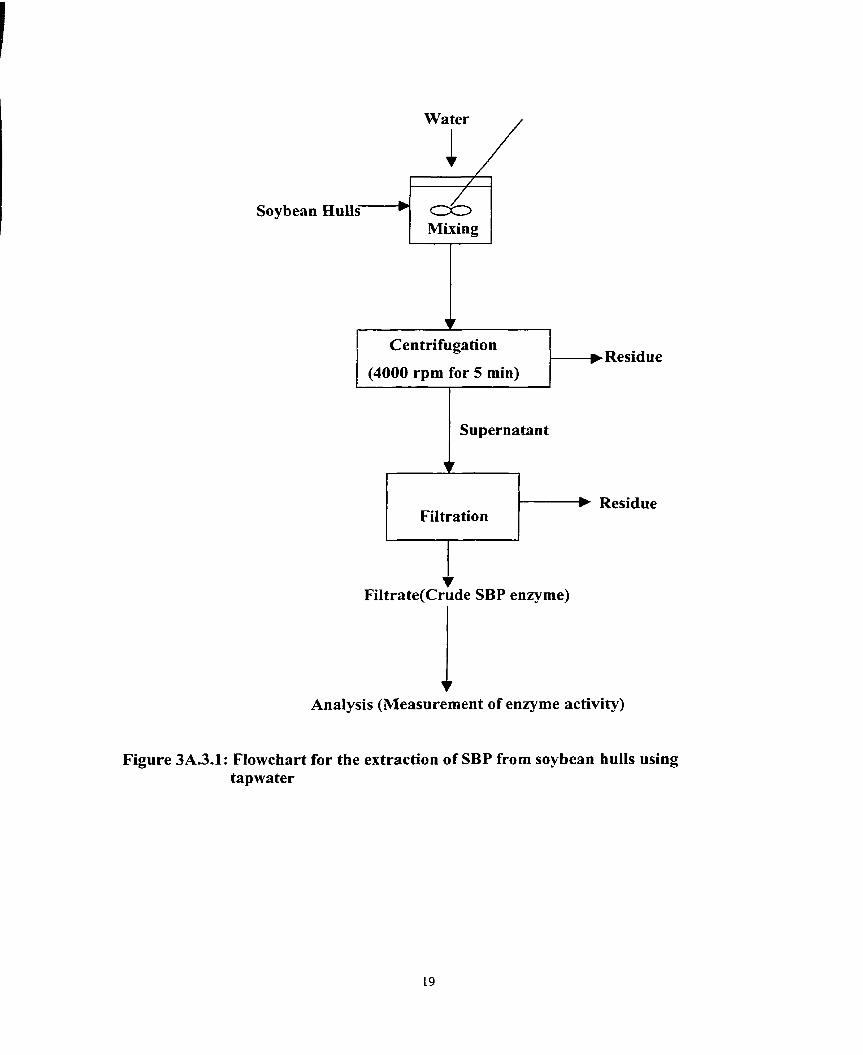
Initially, after the mixing of hulls and solvent, separation of the extracted
solution fiom the hulls was tried by filtration alone. But, it was found that the
hulls clogged the filter paper and prevented filtration to take place. Consequently,
centrifugation was applied before filtration and during this process a significant
Water 1
Soybean Huns A I Mixing 171
Centrifugation t- Residue (4000 rpm for 5 min)
Supernatant
1 Filtration t- Residue
~ i l t r a t e ( ~ r u d e SBP enzyme)
Analysis (Measurement of enzyme activity)
Figure 3A.3.1: Flowchart for the extraction of SBP from soybean hulls using tapwater
arnount of the hulls was separated fiom the extracted solution. Thus the
supernatant, obtained after centritùgation could easily be filtered and analyzed.
It was also observed that by using a millipore filter of Type HA and size
0.45pM instead of a glass microfiber filter, the total units of enzyme extracted
were reduced by several fold. Therefore, glass microfiber filter was used for
filtration purpose. Figure 3A.3.1 shows the procedure adopted for enzyme
extraction using tap water. The extraction time was varied between 0.5 io 5 h.
3A.3.2 Temperature stability of soybean peroxidase
The experiments were conducted in order to determine the changes in the
activities of commercially purified SBP and crude SBP (A & B) due to exposure
tu high temperatures for different durations of tirne. A srnaIl volume (approx.
5mL) of the enzyme solution with a known activity (measured previously) was
taken in different test tubes and dipped in water bath maintained within particular
temperature ranges. After heating the enzyme solutions for a certain time, they
were instantly taken out of the water bath and cooled to room temperature by
keeping in a refkigerator. The activities of the enzyme solution were then
determined and compared with the ones rneasured before heating. The parameters
that were varied in order to study the enzyme characteristics were the temperature
ranges and the time of heating. If the enzyme activity did not change appreciabIy
due to high ternperatures, the enzyme was considered to be "stable" within that
temperature range.
311.3.3 Hydrogen peroxide demand of crude SBP enzyme at different
enzyme doses and pH
Batch experiments were conducted at room temperature, approximately
2 2 ' ~ , to determine the hydrogen peroxide consurned by crude SBP at different pH
values when mixed for 3 h. The batch containers were glass vials, which
contained 30 rnL of a mixture of SBP, hydrogen peroxide and tap water. The tap
water was boiled to remove the chlorine and then cooled down. The components
of the sarnple mixture were added in the following order: SBP, tap water and
hydrogen peroxide. For each expenment, there was one control vial, which
contained components except SBP. At the end of stirring for 3 h, the remaining
hydrogen peroxide was found with the help of the &Oz assay procedure given in
Appendix C. For detemination of the pH effect, the pH was adjusted before the
addition of hydrogen peroxide to the desired value. The pH after the mixing
process was also determined in order to check whether or not there was a change
in pH due to the mixing process.
Since cmde enzyme solution may contain other constituents beside the
enzyme, another experiment was run by using the enzyme solution in which
enzyme had been denatured by boiling for 30 minutes. The activity was measured
both before and afier boiling the enzyme solution and it was found that the
enzyme solution retained less than 1% of the enzyme activity after boiling.
Therefore, it was assumed that the enzyme was denatured.
Thus, the hydrogen peroxide demand was determined both for crude SBP
enzyme and kiIled crude SBP enzyme at different enzyme doses and pH.
3A.3.4 Phenol content of crude SBP enzyme
Cnide enzyme may contain phenolic cornpounds and this might interfere
with the analysis during the use of crude enzyme for the removal of phenolic
compounds. So it was decided to determine if the phenolics preseni in the crude
enzyme were significantly large to influence the analysis of phenolic compounds
in synthetic wastewater.
The phenol present in the crude SBP was determined by using the enzyme
as the sample against the standard calibration curve of phenol given in
Appendix B.
3A.4 Analytical Methods
3A.4.1 Phenol Concentration Assay
The concentration of the phenol was determined by a colonmetric method.
The concentrations of the substrates are expressed as molar quantities, where one
millimolar is equal to 94 mgL of phenol. The colorimetrïc method used 4-
aminoantipyrine ( A M ) and femcyanide as colour generating substances when
cornbined with phenolic compounds. The colour generated at a peak wavelength
of 5 10 nm was directly proportional to the concentration of the aromatic
compound. The assay mixture in the plastic cuvette consisted of lOOpL of
ferricyanide solution, 100p.L of AAP solution, 200 to 800 pL of aromatic sample,
and deionized water to bnng the total volume to 1000 jL. A detailed procedure
for the colorimetric method can be found in Appendix B (Caza et al., 1999).
3A.4.2 Peroxidase Activity Assay
The enzyme activity w-as measured with peroxidase activity assay
procedure which used phenol, 4-AAP and Hz02. This method provided al1
reagents in excess except for enzyme in order to ensure that the initial rate of
reaction was directly proportional to the amount of SBP present. Enzyme activity
is defined as the number of micromoles of hydrogen peroxide converted per
minute at pH 7.4 and 2 5 ' ~ . The assay mixture consisted of 100 PL of 100 mM
phenol, 250 pL of 9.6 mM 4- AAP, 100pL of 2 mM HzO1, 500 pL of 100 mM
phosphate buffer (pH 7.4), and 50 pL of enzyme sample. hmediately after the
addition of the enzyme, the cuvette was shaken and the change in rate of
absorbance with time was monitored at a peak wavelength of 510 nm which was
converted to a rate of change in H202 concentration based on an extinction
coefficient of 6000 M" cm-'. A detailed description of this method can be found
in Appendix A (Wu et al., 1997).
3A.4.3 Hydrogen Peroxide Assay
A colorimetric assay has been developed for the measurement of hydrogen
Peroxide (H202) concentration using ARP as catalyst and AAP as colour
generating substances. This assay procedure was set up so that the only substance
present in lirniting quantities was hydrogen peroxide. Therefore, the intensity of
colour forrned at 510 rn was directly proportional to the amount of peroxide
originally present in the sample. The assay sample volume was kept at 1 mL. The
peroxide concentration in the cuvette did not exceed 50 FM. The maximum
colour formation at the peak wavelength was recorded. From the calibration curve
the amount of peroxide that was present in the cuvette was determined- If the
value exceeded 50 FM, then the process was repeated but using smaller sample
volume and the difference was made up with buffered water so that the assay
volume was always equal to IrnL. Once a satisfàctory cuvette concentration was
achieved, the amount of peroxide present in the original sample was found by
back-calculation.
3A.5 Sources of Error
Ln any experiment, several errors may affect the reliability of the results.
Systematic errors are due to analytical techniques and instruments, whereas
random (or human) errors are due to persona1 factors. Calibration curves were
done several times and cornpared to veri@ the accuracy. A set of experiments, the
hydrogen peroxide demand of crude SBP at doses of O. 1, 0.4 and 0.8 U/mL, was
repeated 3 times and the results were compared to determine the reliability of the
experirnental resuIts.
SB. Polymerization and removal of substrates
3B.1 Materials
Additional materials required are described below:
Catalase (EC 1.1 1.1 -6, 15000 units/mg solid) and polyethylene glycol
(with an average rnolecular mass of 3350 g/grnole) were purchased fkom Sigma
Chemical Co., St. Louis. MO. One unit of catalase decomposes one micromole of
hydrogen peroxide per minute at pH 7.0 and temperature 2 5 ' ~ . An aqueous stock
solution of catalase was stored at 4 ' ~ .
O-cresol, m-cresol, p-cresol and phenol with a purity of 99% or greater,
were supplied by Aldrich Chemical Co., Milwaukee, WI. Stock solutions were
stored at 4 ' ~ .
3B.2 Analytical Equipment
In addition to the analytical equipment described previously, quartz cells
with a 10 mm path length were purchased from Hellma (Canada) Limited,
Concord, Ontario.
3B.3 Experimental Procedure
Batch experiments were conducted at room temperature, approximately
2 2 ' ~ . This study was designed to achieve at least 95% removal of the aromatic
substrate by optimizing the following parameters: pH, PEG dose, SBP dose both
with and without PEG, and H203 dose-
The batch reactors were g l a s vials, which contained 30 mL of a mixture of
aromatic substrate, Hz02, PEG, crude SBP enzyme and tap water. The tap water
was boiled and cooled down to room temperature in order to remove the chlorine.
The components of the sample mixture were added in the following order:
aromatic substrate, PEG, cmde SBP enzyme and tap water. Reactions were

In 30 rnL batch reactors, add the following in the desired amount:
soybean peroxidase (SBP) polyethylene glycol (PEG) aromatic compound (substrate) boiled tap water
Add hydrogen peroxide (HzOz) to initiate the reaction
catalase (125 U/mL) and stir for 5 minutes to stop the reaction alum (50 mg/L) to coagulate precipitate
Adjust the pH of the reaction mixture between 6.3 and 8
1 Stir a t low speed for 10 minutes
1 Centrifuge approximately 5 mL of the sample @ 3000 rprn for 30 minutes I
Analyse the supernatant for remaining aromatic compound
Figure 3B.3.1: Flow Chart for Experimental Procedure
initiated by adding a known arnount of HzOz to each reactor. For each experiment,
tfiere was one control reactor, which contained aH other components except &Oz.
The control reactor was used to measure the initial amount of the aromatic
substrate present in the sample mixture. AU of the reactors, including the cuntrol
reactor, were stirred vigorously for three hours using a rnagnetic stirrer and teflon
coated stir bars. At the end of the reaction period, catalase was added a to final
concentration of 125 U/mL to stop the reaction and alun was added to final Ievel
of 50 m g L to the mixture and stirred. The pH of each sample was adjusted to
between 6.3 to 7.5 and then stirred again at low speed to aIlow for the formation
of the floc. Approximately 5 mL of each sample was centnfuged, after which the
supernatant was analyzed in duplicates for remaining substrate by the colorimetric
method. The foIlowing four sections and Figure 3B.3.1 describe the procedure
used to optimize al1 of the reaction parameters.
The first parameter that was optirnized was pH. The reaction mixture
consisted of tap water, aromatic substrate, PEG and SBP erizyrne. The substrate
concentration was ImM for al1 of the different cresols that were tested. The SBP
dose used in these experiments was determined from previous studies and the
PEG dose in each reactor was 400 mg/L. The pH was then adjusted within the
range of 3-00 to 10.00 using concentrated HCl or NaOH.
3B.3.2 f erosidase Dose
The optimum SBP dose was determined both in the presence and in the
absence of PEG. In one set of experiments, an excess of PEG, 400 mg/L, was
added to the reaction mixture, whereas in the other set of experiments, no PEG
was added. These tests were conducted at the optimum pH values determined in
the previous set of experiments. Peroxidase was added in pre-detemined amounts
in order to determine the minimum SBP dose required to remove 95% of the
initial substrate concentration.
3B.3.3 Hydrogen Peroxide Dose
The next parameter to be optimized was the HzOz concentration. The
amount of hydrogen peroxide, which was added to the reactor, is expressed as a
ratio of millimoIar Hz02 to miIlirnolar aromatic compound ([Hz02]/[Substrate]).
During this set of experiments, the optimum pH and a limiting amount of SBP, as
determined previously, were used. Each reactor contained 400 mg/L of PEG as in
the previous set of experiments.
3B.3.4 PEG Dose
The last parameter to be optimized was PEG dose. A 20 g/L stock solution
of PEG was prepared and stored at room temperature. During this final set of
experirnents, the optimum pH and [HzOz]/[Substrate] were used, and the SBP
dose in the reactors was kept at less than the optimum dose determined
previously.
3B.4 Anaiytical Methods
3B.4.1 Aromatic Compound Concentration Assay
The concentrations of the aromatic compounds were determined by either
the Direct spectrophotometric method or the coIorimetric method. The
concentrations of the substrates are expressed as molar quantities, where one
millimolar is equal to 94 mg/L of phenol and 108 mg/L of cresols. The
colorimetric method has been described earlier in Section 3A.4.1. It was observed
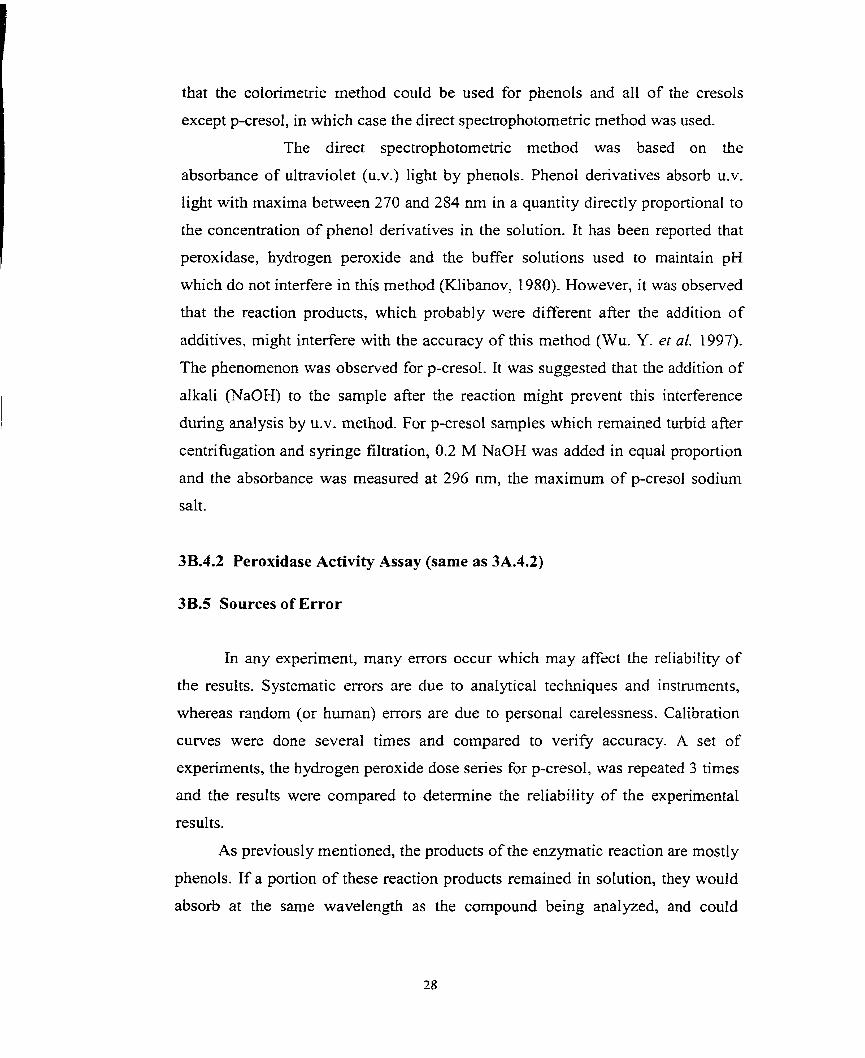
that the colorimetric rnethod could be used for phenols and al1 of the cresols
except p-cresol, in which case the direct spectrophotornetric method was used.
The direct spectrophotometric method was based on the
absorbance of ultraviolet (U.V.) light by phenols. Phenol derivatives absorb U.V.
light with maxima between 270 and 284 nm in a quaritity directly proportional to
the concentration of phenol derivatives in the solution. It has been reported that
peroxidase, hydrogen peroxide and the buffer solutions used to maintain pH
which do not interfere in this method (Klibanov, 1980). However, it was observed
that the reaction products, which probably were different after the addition of
additives, might interfere with the accuracy of this method (Wu. Y. et al. 1 997).
The phenornenon was observed for p-cresoI. It was suggested that the addition of
alkali (NaOH) to the sample after the reaction might prevent this interference
during analysis by U.V. method. For p-cresol samples which remained turbid afier
centnfûgation and syinge filtration, 0.2 M NaOH was added in equal proportion
and the absorbance was measured at 296 nrn, the maximum of p-cresol sodium
salt.
3B.4.2 Peroxidase Activity Assay (same as 3A.4.2)
3B.5 Sources of Error
In any experiment, many errors occur which may affect the reliability of
the results. Systematic errors are due to analytical techniques and instruments,
whereas random (or huinan) errors are due to personal carelessness. Calibration
curves were done several times and compared to veriQ accuracy. A set of
experiments, the hydrogen peroxide dose series for p-cresol, was repeated 3 times
and the results were compared to determine the reliability of the experimental
results.
As previously mentioned, the products of the enzyrnatic reaction are mostly
phenols. If a portion of these reaction products remained in solution, they would
absorb at the same wavelength as the compound being analyzed, and could

therefore lead to errors in the estimation of the amount of initial substrate that
acîually remained in solution.
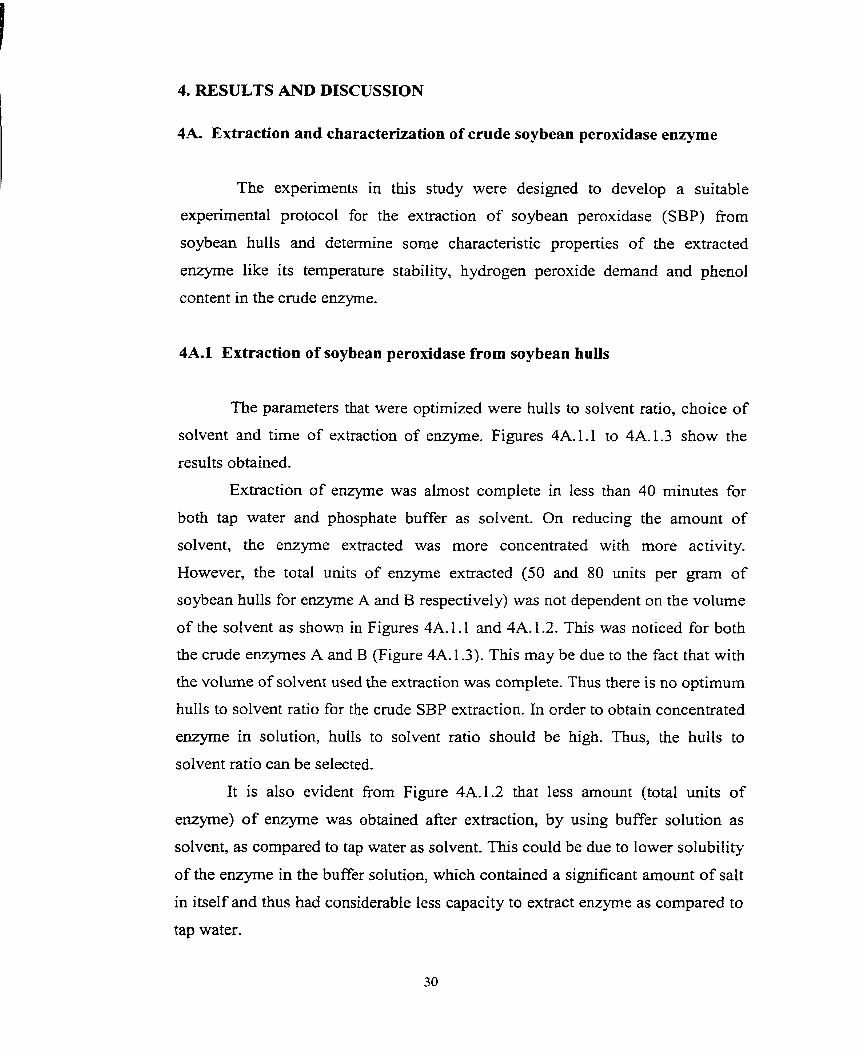
4. RESULTS AND DISCUSSION
4A. Extraction and characterization of crude soybean peroxidase enzyme
The experiments in this study were designed to develop a suitable
experimental protocol for the extraction of soybean peroxidase (SBP) fiom
soybean hulls and determine some charactenstic properties of the extracted
enzyme like its temperature stability, hydrogen peroxide demand and phenol
content in the crude enzyme.
4A.l Extraction of soybean peroxidase from soybean hulls
The parameters that were optimized were hulls to solvent ratio, choice of
solvent and time of extraction of enzyme. Figures 4A. 1 .l to 4A.1.3 show the
results obtained.
Extraction of enzyme was almost complete in less than 40 minutes for
both tap water and phosphate buffer as solvent. On reducing the amount of
solvent, the enzyme extracted was more concentrated with more activity.
However, the total units of enzyme extracted (50 and 80 units per gram of
soybean hulls for enzyme A and B respectively) was not dependent on the volume
of the solvent as shown in Figures 4A. 1.1 and 4A. 1.2. This was noticed for both
the crude enzymes A and B (Figure 4A. 1.3). This may be due to the fact that with
the volume of solvent used the extraction was complete. Thus there is no optimum
hulls to solvent ratio for the crude SBP extraction. In order to obtain concentrated
enzyme in solution, hulls to solvent ratio should be high. Thus, the hulls to
solvent ratio c m be selected.
It is also evident fiom Figure 4A.1.2 that less amount (total units of
enzyme) of enzyme was obtained after extraction, by using buffer solution as
solvent, as compared to tap water as solvent. This could be due to lower solubility
of the enzyme in the buffer solution, which contained a significant amount of salt
in itself and thus had considerable less capacity to extract enzyme as compared to
tap water.

0.5 1 1.5 2 2.5 3 3.5 4 4.5 5
Tirne of extraction (h) - . - . . - - -
+Volume of solvent =200 mL +Volume of solvent =300 mL +Volume of solvent = 400 mL * Volume of solvent = 500 mL
CONDITIONS Soybean hulis used = 10 g
Solvent = Tap water Room temperature = 22 O C
Figure 4A.l.l Effect of extraction time on the activity of crude SBP
(A) extracted using tap water as solvent

Tirne of extraction (h)
/ +Volume of solvent = 200 rnL +Volume of soivent = 300 rnL +Volume of sofvent = 400 mL *Volume of solvent = 500 mL
- - - - - - - - . . - - - - - - - - - -
CONDITIONS Soybean hull used =10 g
Solvent = Phosphate buffer (0.1 M) (pH = 7.4)
Room temperature = 22 O C
Figure 4A.1.2: Effect of extraction tirne on the activity of crude SBP
(A) extracted using Phosphate buffer as solvent
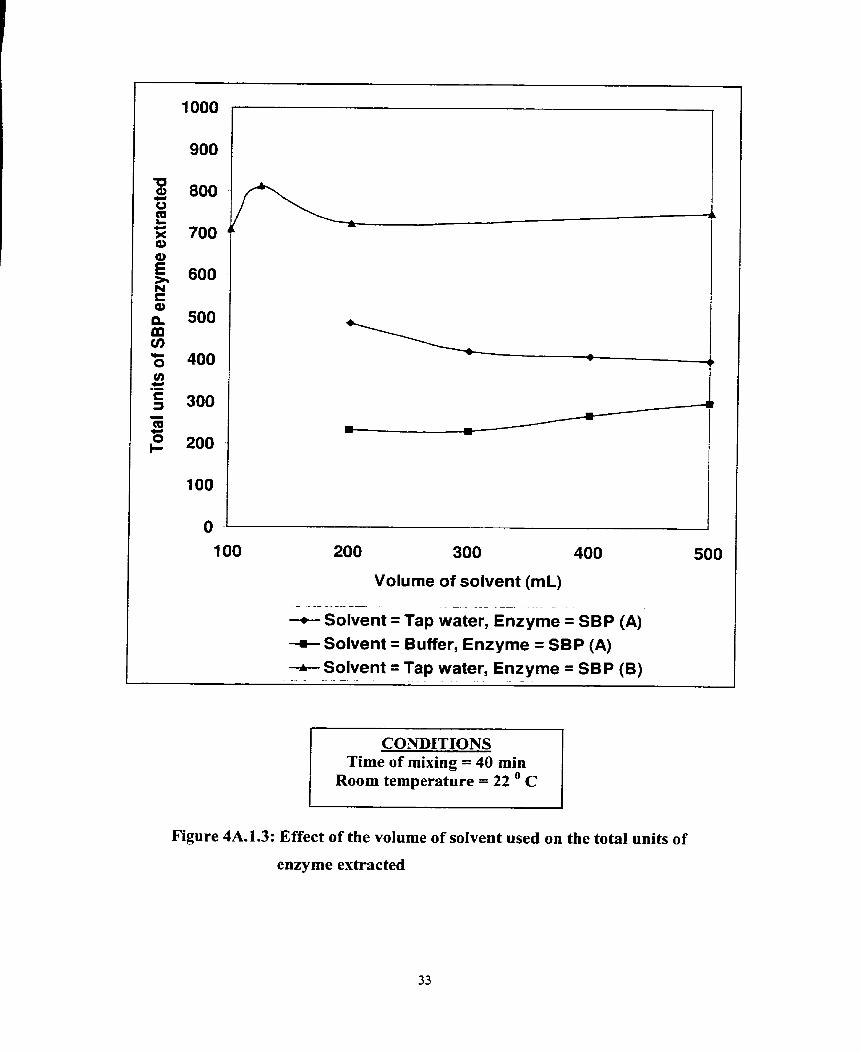
Volume of solvent (mL) -- -- - - - - - - -- - .
-+- Solvent = Tap water, Enzyme = SBP (A) + Solvent = Buffer, Enzyme = SBP (A) +- Solvent = Tap water, Enzyme = SBP (B)
Time of mixing = 40 min Room temperature = 22 O C
Figure 4A.1.3: Effect of the volume of solvent used on the total units of
enzyme extracted

Figure 4A.1.3 aIso shows that the source of enzyme hulls plays a critical
role in the yield of the crude enzyme. SBP (B) whose hulls came fiom a different
batch than the hulls of SBP (A) yields almost twice as much total enzyme activity
units than that fiom the hulls of SBP (A). Thus the yield of the enzyme depends
upon the source of the soybean hulls.
4.A.2 Temperature stability of SBP
Figure 4A.2.1 shows that the activity of commercial SBP enzyme did not
change at temperature range of 45-50'~. However above this temperature range it
became unstable and the enzyme activity decreased considerably both with an
increase in heating and an increase in heating temperature. The activity of the
crude SBP (A) remained unchanged on heating up to a ternperature range of 75-
8 0 ' ~ for almost an hour. Thus it was highly stable as compared to the commercial
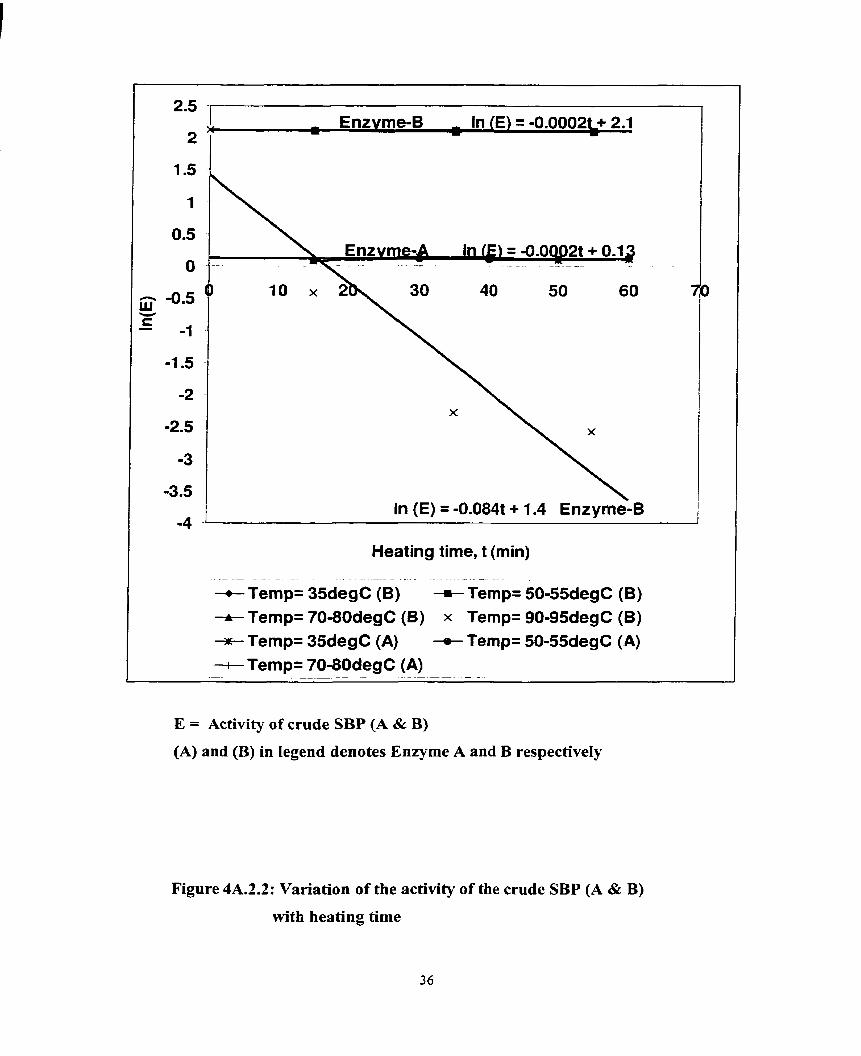
SBP which started losing stability above 5 0 ' ~ .
The activity of crude SBP (B) also remained unchanged up to the ternperature
range 75-80'~. However at 90-95'~ ternperature range, it lost its activity rapidly
with time. Therefore, the crude SBP (B) was found to be stable until a
temperature of about 8 0 ' ~ . The half life of the enzyme at various ternperahlre
ranges was determined from Figures 4A.2.1 and 4A.2.2, where In(enzyme
activity) is plotted against the time of heating (min). The basic equations used for
determining the half Iife are given in Section 1.1.3.
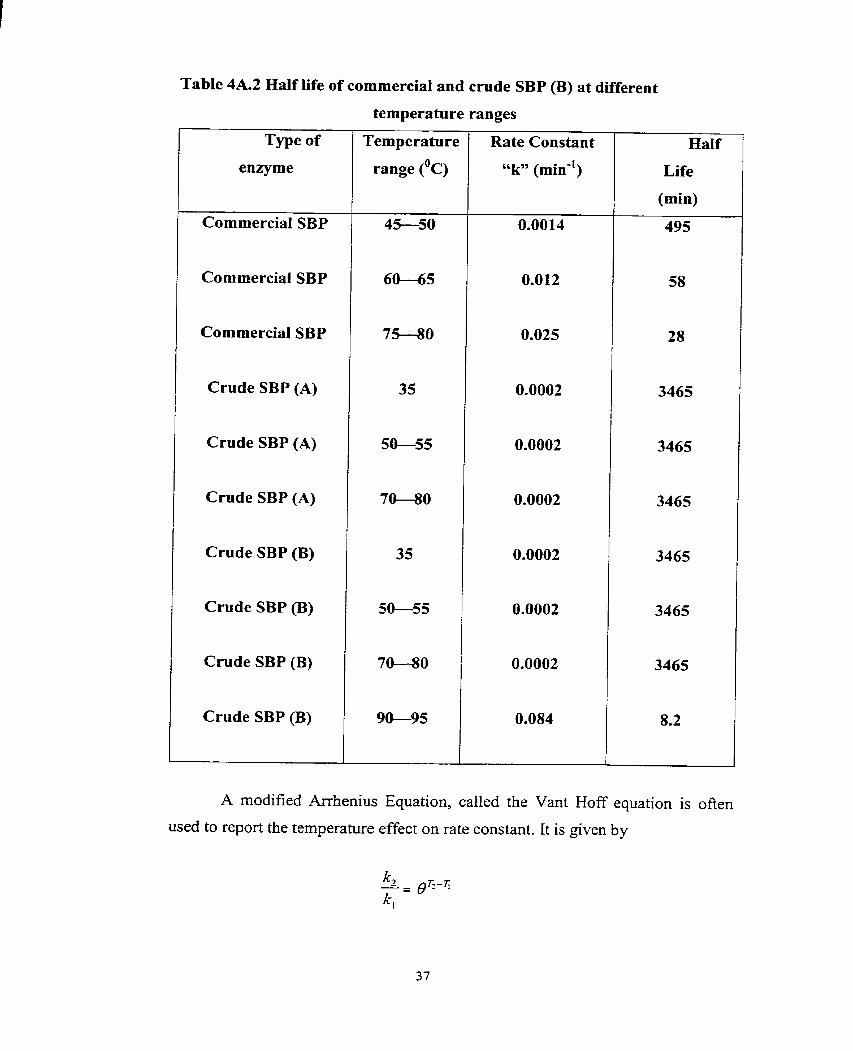
The siope of the curve gives rate constant "-kW and the Half Life is given by
[ïn2]/[k] (Section 1.1.3). The half life and rate constant values are aven in Table
4A.2.
The rate constants of crude SBP enzyme A and B are almost zero below
8 0 ' ~ and hence its half lifes are very high. At 9 0 ' ~ the activity of the crude SBP
enzyme B decreased rapidly and its half life was calculated to be as low as 8.2
minutes. On cornpanng the half life, it is evident that the cmde SBP enzyme A
and B are more stable than commercial SBP enzyme at temperatures below 80 '~ .
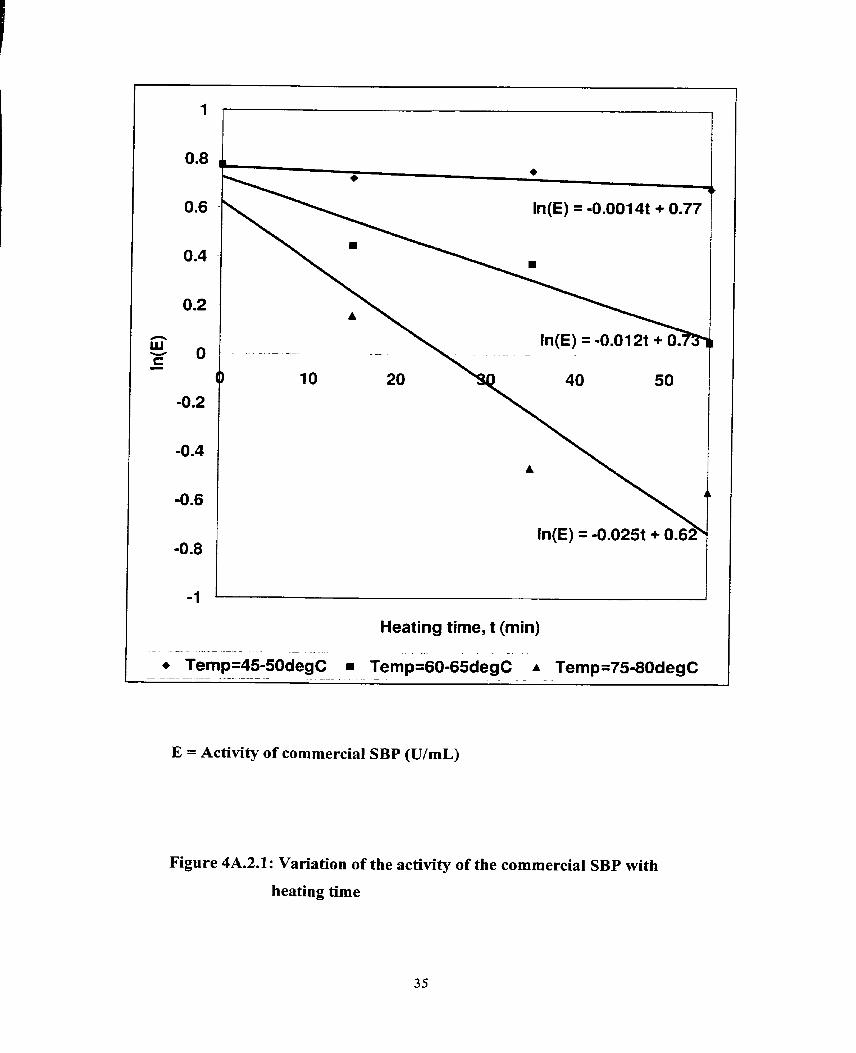
Heating time, t (min)
E = Activity of commercial SBP (U/mL)
Figure 4A.2.1: Variation of the activity of the commercial SBP with
heating time
In (E) = -0.0841 + 1.4 ~nzyrne-B
Heating time, t (min) - . - - - . .
-t Temp= 35degC (B) --+ Temp= 50-55degC (B) -+ Temp= 70-80degC (B) x Temp= 9085degC (6) +-- Temp= 35degC (A) - Temp= 50-55degC (A) + Temp= 70-80degC (A) -. - - - . - - - - - - - - - - - - - - -- - - - - - -- - - -
E = Activity of crude SBP (A & B)
(A) and (B) in Iegend denotes Enzyme A and B respectively
Figure 4A.2.2: Variation of the activity of the crude SBP (A & B)
with heating time
1 ame ~ A . L nalx me O' commercia1 and crude SBP (£3) at different
temperature ranges
Type of
enzyme
Commercial SEP
Commercial SBP
Commercial SBP
Crude SBP (A)
Crude SBP (A)
Crude SBP (A)
Crude SBP (B)
Crude SBP (B)
Crude SBP (B)
Crude SBP (B)
Temperatun
range (OC)
Rate Constant
Life
(min)
A modified Arrhenius Equation, called the Vant Hoff equation is often
used to report the temperature effect on rate constant. It is given by
where 8 = Constant
T?, TI = Temperatures
k2 = Rate constant at temperature T7
k i = Rate constant at temperature T i
For commercial SBP enzyme,
ki = 0.012 min" at Ti = 6 2 . 5 ' ~ and
kz = 0.025 min" at T2 = 77.5 '~
For cmde SBP (B),
kl = 0.0002 min-' at T l = 8 5 ' ~ and
k2 = 0.084 min-' at T2 = 92.5 '~
By substituting the values in the above equation, one gets
8 = 1.0493 for commercial SBP and
8=2.238 forcrudeSBP
9 is an important parameter in wastewater treatment often used for
determining rate constants at different temperatures. In this context higher the
value of 8, higher is the rate of change in enzyme activity. The usefuIness of 8 as
an indicator for temperature influence is limited within a given range
temperature. For commercial SBP the reported value of 8 is valid between
temperatures of 6 2 . 5 ' ~ and 77 .5 '~ and for cmde SBP it is valid between 8 5 ' ~
and 92.5'~.
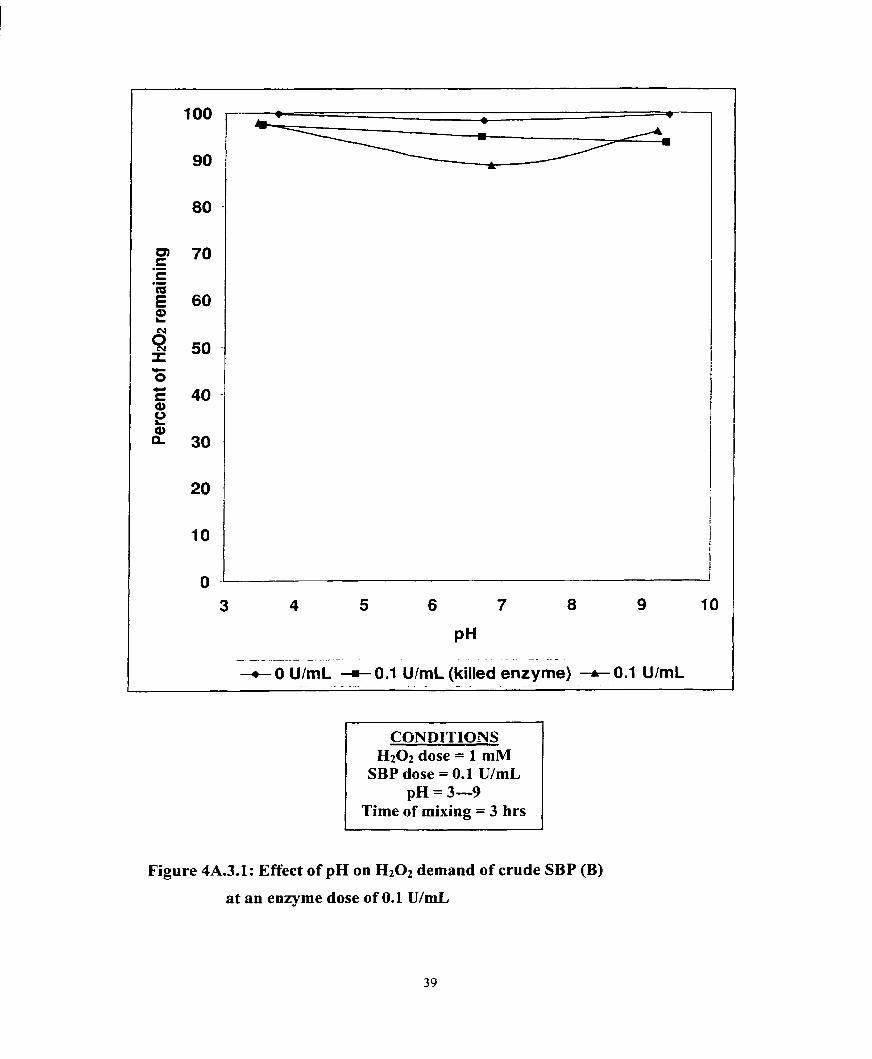
4A.3 Hydrogen Peroxide demand of crude SBP
The results obtained are sumrnarized in Table 4A.3. At O U/mL of
crude SBP (B), the hydrogen peroxide remaining afier 3 h was almost 100 %.
Similar results were obtained with thermally denatured crude SBP (B) at enzyme
dosages of 0.1, 0.4 and 0.8 U/mL. However, for unheated crude SBP (B), the
residual hydrogen peroxide decreased with an increase in enzyme dosage. Only
12 % of hydrogen peroxide remained when enzyme dose was 0.8 U/mL. Thus, the
crude SBP (B) had s ipifkant hydrogen peroxide demand and it increased with an
increase in the activity of the enzyme.
3 4 5 6 7 8 9 10
PH -- - - - - -- - - - - - - - - - - -
-t O U/mL + 0.1 U/mL (killed enzyme) -+ 0.1 UlmL
CONDITIONS H202 dose = 1 mM
SBP dose = 0.1 U/mL pH = 3-9
Time of rnixing = 3 hrs
Figure 4A.3.1: Effect of pH on H202 demand of crude SBP (B)
at an enzyme dose of 0.1 U/mL
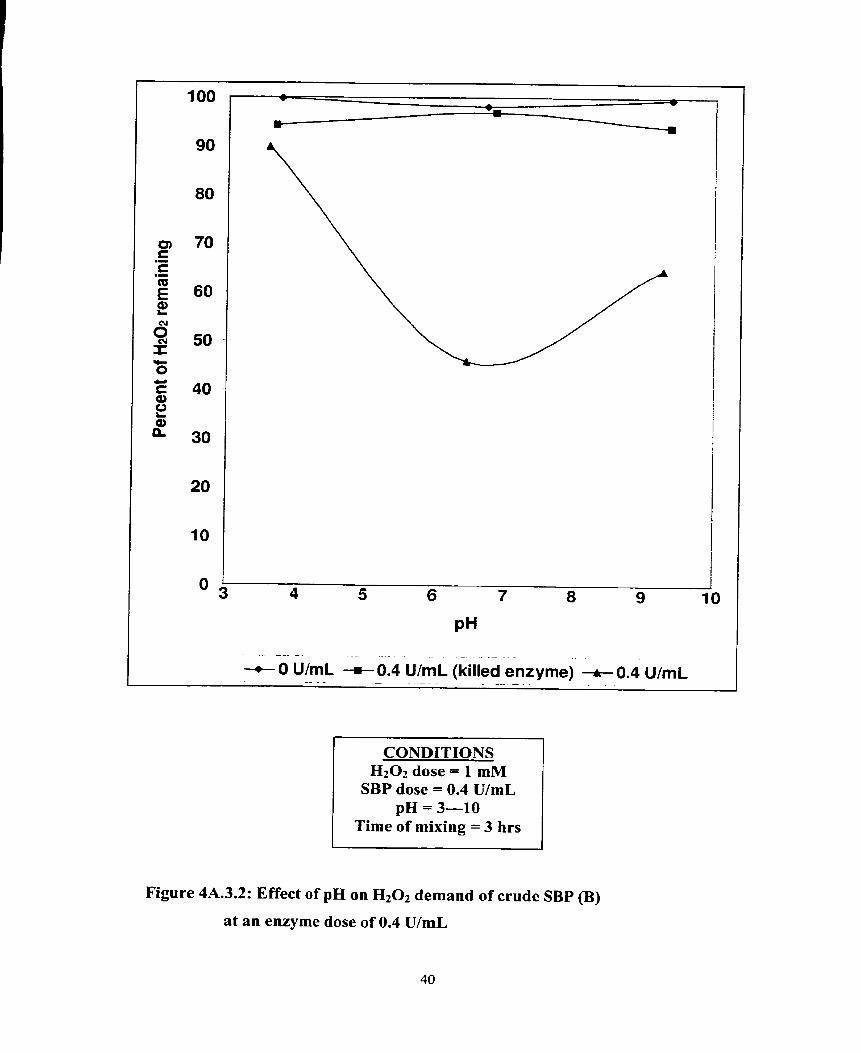
- 0 U/mL -+- 0.4 U/mL (killed enzyme) -A- 0.4 U/mL -- - - - - . . - - - - -
CONDITIONS HzOz dose = 1 rnM
SBP dose = 0.4 U/mL pH = 3-10
Time of rnixing = 3 hrs
Figure 4A.3.2: Effect of pH on Hz02 demand of crude SBP (B)
at an enzyme dose of 0.4 U/mL
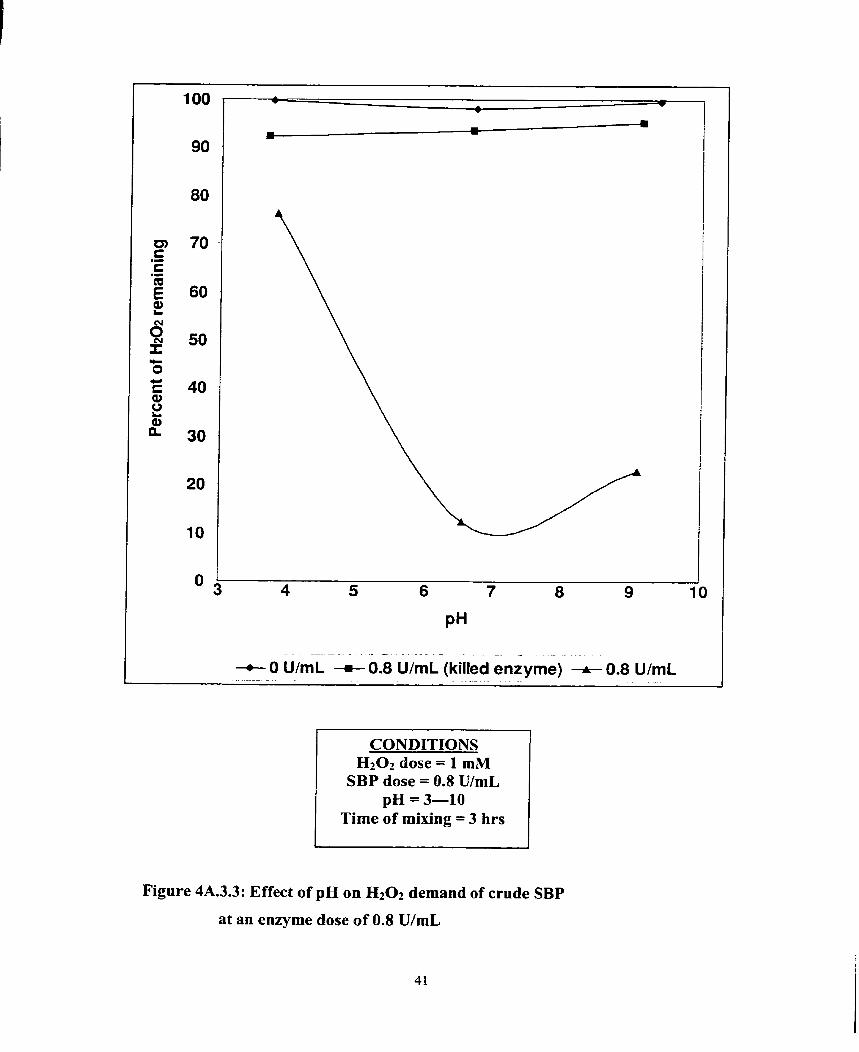
-c O UImL + 0.8 U/mL (killed enzyme) -A- 0.8 UImL
CONDlTIONS Hz02 dose = 1 m M
SBP dose = 0.8 UImL pH = 3-10
Time of mixing = 3 hrs
Figure 4A.3.3: Effect of pH on H202 demand of crude SBP
at an enzyme dose of 0.8 U h L

Table 4A.3: Effect of SBP dose on the H202 demand of the enzyme at pH 6-7
Si No. Crude SBP (B)
Control
Active
Active
Active
Denatured
Denatured
Denatured
~nzy&e activity (U/mL)
O
O. 1
0.4
0.8
O (originally 0.1)
O (originally 0.4)
O (originally 0.8)
Percent of HzOz
remaining
Figures 4A.3.1 to 4A.3.3 show the effect of pH on HzOz demand. It is
observed that the hydrogen peroxide demand is maximum in the pH range of 6-
7. Thus, pH plays a critical role in exerting a hydrogen peroxide demand by the
enzyme.
The H202 demand of the 30 rnL mixture in the batch containers can be due
to three possible reasons. Firstly, it rnay be due to the organic matter present in
the mixture that is susceptib1e to oxidation by the hydrogen peroxide added to it.
Due to the oxidation of the organic matter the Hz02 decomposes and thus the
latter is lost fiom the mixture accounting for the sipifkant HIOl demand.
Secondly, it may be due to the phenol content in the crude SBP. The crude
enzyme may contain a certain arnount of phenolics which may react with the
&O2 in presence of the enzyme to form other reaction products. So the H202 may
be consumed because of this reaction. Finally, the HzOl demand may be due to

the catalase present in the crude SBP. Catalases are found in al1 plants. They are,
both structurally and functionally, close relations of the peroxidases. They are
easily crystallizable haem enzymes with four iron atoms per molecule attached to
protein. Catalases decompose hydrogen peroxide to oxygen and water.
From, the results obtained we find that the thermally denatured enzyme
had hardly any H201 demand after 3 hrs. So, the organic rnatter present in the
mixture was not the reason for the significant Hz02 demand- Also, we found
(Section 4A.4 below) that the phenol present in the crude SBP was so srnall, that
it was impossible for the H301 demand of the mixture to be due to it. Therefore,
we are lefi with the only possibility, catalase present in the crude SBP. Thus, the
crude SBP (B) had significant HzOz demand and it was due to the consumption of
H202 by the catalase present in the enzyme.
4A.4 Phenol content in crude SBP
Phenol content in crude SBP (A) is found to be 62.4 pM and that in crude
SBP enzyme B was found to be 164 FM. Consequently, when the cnide SBP
enzymes were used for the removal of phenolic compounds fiom wastewater
using hydrogen peroxide it introduced a certain amount of phenol in the reaction.
If the additional phenol due to the enzyme is significantly high, adjustments must
be made in enzyme and hydrogen peroxide doses.
Table 4A.4 shows that with enzyme dosages as high as 0.4 U/rnL, the
phenolic compounds introduced in a 30 mL reactor was only 18 PM. This is a
small nurnber when compared to the substrate concentration in the range of 1000
PM. Therefore, the error introduced by the enzyme is less than 1.8 % for an
enzyme dose of 0.4 U/mL and no correction for the phenolic content in the crude
enzyme is necessary unless a high dose of enzyme is used for wastewater
treatment .

No.
1
2
3
4
5
6
Phenol contnbuted by
SBP (A)
(PM)
Phenol contributed by
SBP (B)
(PM)
4A.5 Error Analysis
A set of experiments was conducted in order to determine the reliability of
the results in this study. The H20z demand for the crude SBP doses of O. 1, 0.4 and
0.8 U/mL was deterrnined in triplicate and the percent deviation was calculated.
Each solution was prepared separateIy to determine the accuracy of analytical
techniques. The test parameters were as follows: pH = 6-7, HzOz = 1 mM and
crude SBP dose = 0.1, 0.4 and 0.8 U/mL The results of these experiments are
Iisted in Table 4A.5. These resuIts indicate that the deviation was always less than
+ 4 %, which is considered to be within an acceptable range. Therefore, the
resülts obtained in this study are considered to be accurate and reliable.
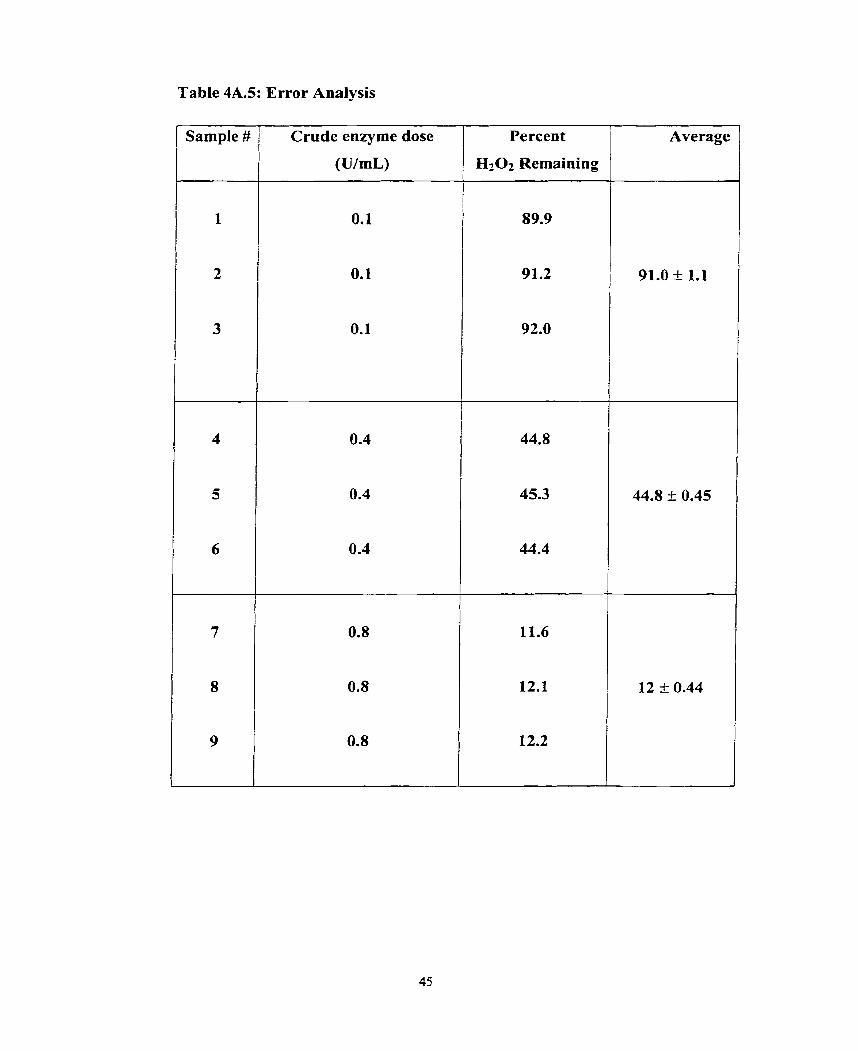
Table 4A.5: Error Analysis
- --
Crude enzyme dose Percent
H t O z Remaining
4B. Polymerization and rernoval of substrates
The experiments in this part were designed to achieve a removal of at
least 95 % of the initial aromatic substrate concentration. The reaction parameters
which were optimized were pH, soybean peroxidase (SBP) enzyrne dose both in
the presence and absence of polyethylene glycol (PEG), hydrogen peroxide to
substrate ratio, ([Hz02]/[Substrate]) and PEG dose. The effect of co-precipitation
on crude SBP requirements was also investigated. Reactions were carried out
once and mostly under stringent conditions so that the effect of the parameter
being optimized is more pronounced. Earlier similar experiments were conducted
by Wu. Y. et al. (1997) using horseradish peroxidase and Caza et al. (1993) by
using comrnercially purified SBP enzyme. Both conducted their experiments at
room temperature. However Wu Y et al. (1997) conducted their studies in
buffered sohtions and Caza et al. (1999) conducted their studies in unbuffered tap
water.
It was observed that the reaction products which probably were different
after the addition of additives, did not interfere with the accuracy of the method
except for p-cresol. For p-cresol, the interference may be due to the formation of
the Pummerer's ketone, a two ring compound proposed to result by reaction
between p-cresol radical and a second molecule of p-cresol (Section 2.5). So, for
p-cresol a rnodified method was suggested (Section 3B.4.1) which worked out
well and did not interfere with the accuracy of the method.
The optimum pH was detennined for each substrate in the range of 3 to 10.
The initial substrate concentration was 1 .O mM for al1 the compounds. The HzOz
to substrate ratio was between 1.0 and 1.6 for each experirnent and PEG was
present in excess at 400 mg/L so that the removal efficiency was only dependent
on pH and the enzyme dose. The reactions were stopped afier 3 h which was
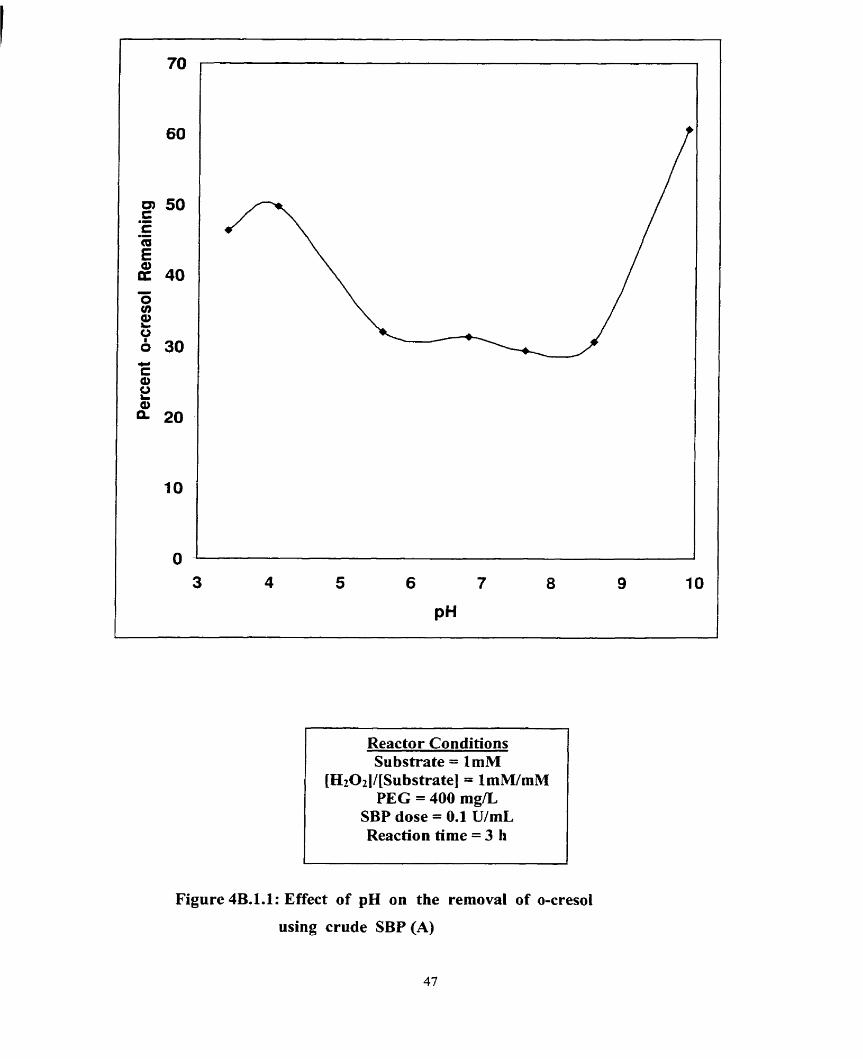
Reactor Conditions Substrate = 1mM
[HzOz]/ [Substrate] = I mM/mM PEG = 400 mgPL
SBP dose = 0.1 U/mL Reaction tirne = 3 h
Figure 4B.l.l: Effect of pH on the removal of o-cresol
using crude SBP (A)

Reactor Conditions Substrate = 1 mM
[HzOz]/[Substrate] = 1 mM/mM PEG = 400 mg/L
SBP dose = 0.15 U/mL Reaction Time = 3 h
Figure 4B.1.2: Effect of pH on the rernoval of O-cresol using
crude SBP (B)

Reactor Conditions Substrate = 1 mM
[H202]/[Substrate] = 1.2 mM/mM PEG = 400 mg/L
SBP dose = 0.05 U/mL Reaction Time = 3 h
Figure 4B.1.3: Effect of pH on the removal of m-Cresol
using crude SBP (B)

Reactor Conditions Substrate = 1 mM
[Hz02 J/[Substrate] = 1.6 mM/mM PEG = 400 mg/L
SBP dose = 0.4 U/mL Reaction Time = 3 h
Figure 4B.1.4: Effect of pH on the removal of p-cresol using
crude SBP (B)

considered to be sufficient tirne based on previous studies (Caza et al., 1999).
Removal efficiencies as a function of pH are presented in Figures 4B. 1.1 through
Fig 4B.1.4. These Figures show that O-cresol has a broad optimum pH range
whereas both p-cresol and m-cresol have a relatively narrow optimum pH range.
The pH is similar with both SBP enzymes A and B for reaction with O-cresol. P-
cresol had an optimum pH range at 4-5 which is inconsistent fiom those found
by Wu. Y. et al (1997) by using horseradish peroxidase and Caza et al (1999) by
using commercially purified SEP enzyme. The optimum pH for each aromatic
compound is listed in Table 4B. 1.
Table 4B.L: Optimum pH for cresols
Substrate / Type of enzyme Optimum pH range
O-cresol
O-cresol
m-cresol
p-cresol
Optimum pH
Crude SBP (A)
Crude SBP (ï3)
Crude SBP (B)
Crude SBP (B)
Since reactions were camed out in unbuffered solutions, the pH afier
mixing was checked in order to verify that the reactions were camed out at the
appropriate pH values. Typical results for O-cresol when using crude SBP enzyme
B are shown in Table 4B.2. As expected, these results indicate that there was IittIe
change in pH values afier the reaction was completed. The largest change in pH
was 1.2 and the smallest was 0.1. The resuIts obtained with other compounds
were consistent with those obtained for this compound.
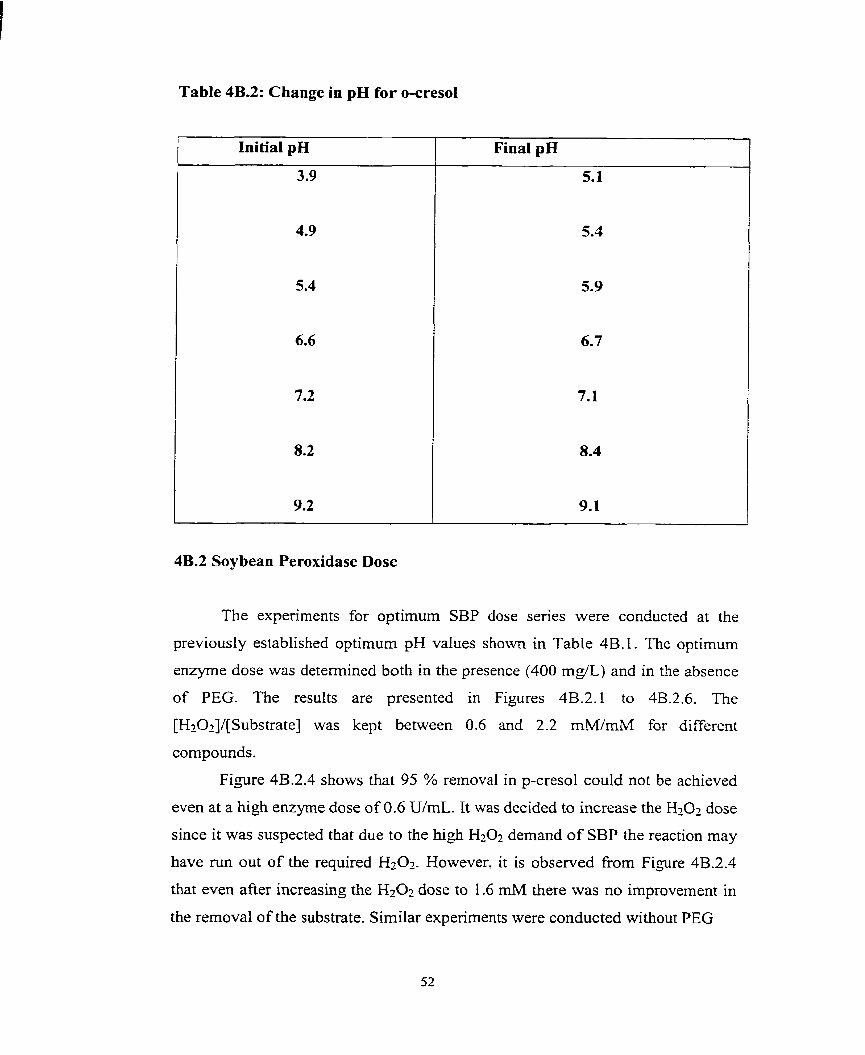
Table 4B.2: Change in pH for O-cresol
Initial pH Final pH
4B.2 Soybean Peroxidase Dose
The experiments for optimum SBP dose series were conducted at the
previously established optimum pH values s h o w in Table 4B.l. The optimum
enzyme dose was detennined both in the presence (400 m g L ) and in the absence
of PEG. The results are presented in Figures 4B.2.l to 4B.2.6. The
[HzOz]/[Substrate] was kept between 0.6 and 2.2 mM/mM for different
compounds.
Figure 4B.2.4 shows that 95 % removal in p-cresol could not be achieved
even at a high enzyme dose of 0.6 WmL. It was decided to increase the HzOz dose
since it was suspected that due to the high Hz02 demand of SBP the reaction may
have run out of the required H t 0 2 . However, it is observed fiom Figure 4B.2.4
that even after increasing the HrOz dose to 1.6 mM there was no improvement in
the removal of the substrate. Similar experiments were conducted without PEG
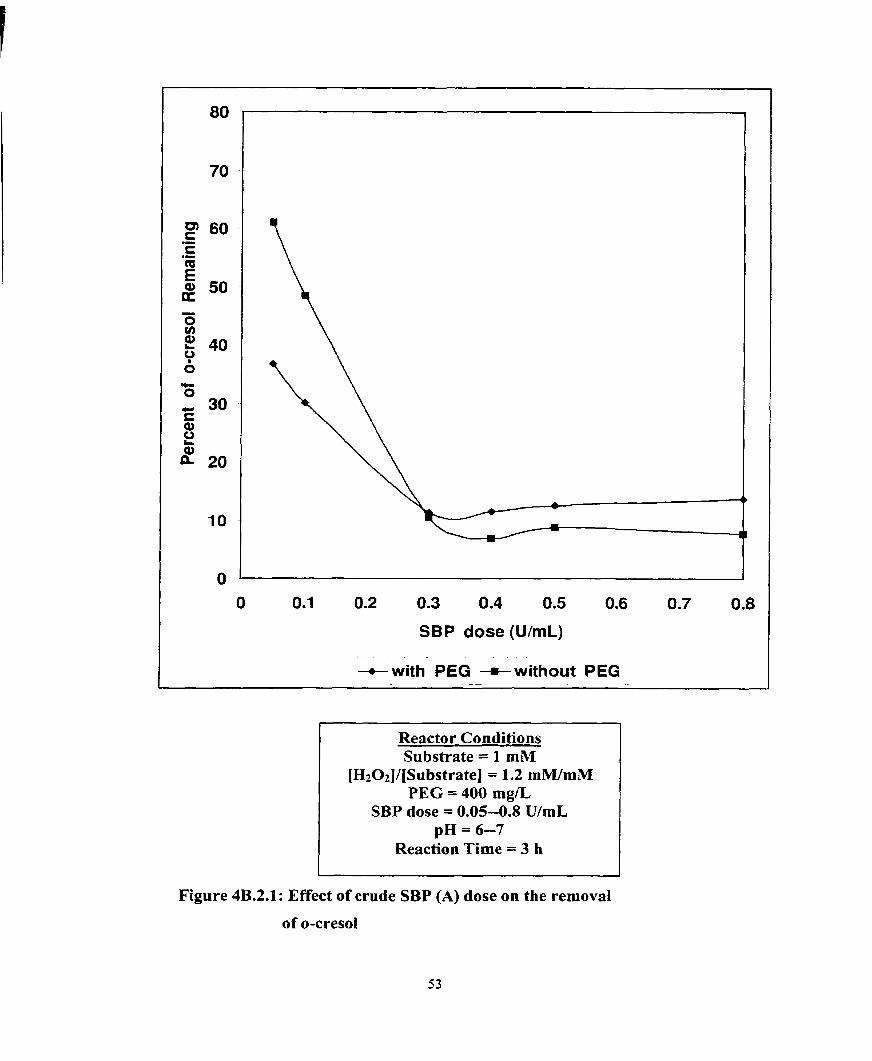
0.3 0.4 0.5
SBP dose (U/mL) . --
+with PEG +without PEG
Reactor Conditions Substrate = 1 mM
[H20z]/[Substrate] = 1.2 mWmM PEG = 400 mg/L
SBP dose = 0.05-0.8 U/mL p H = 6-7
Reaction Time = 3 h
Figure 4B.2.P: Effect of crude SBP (A) dose on the removal
of O-cresol
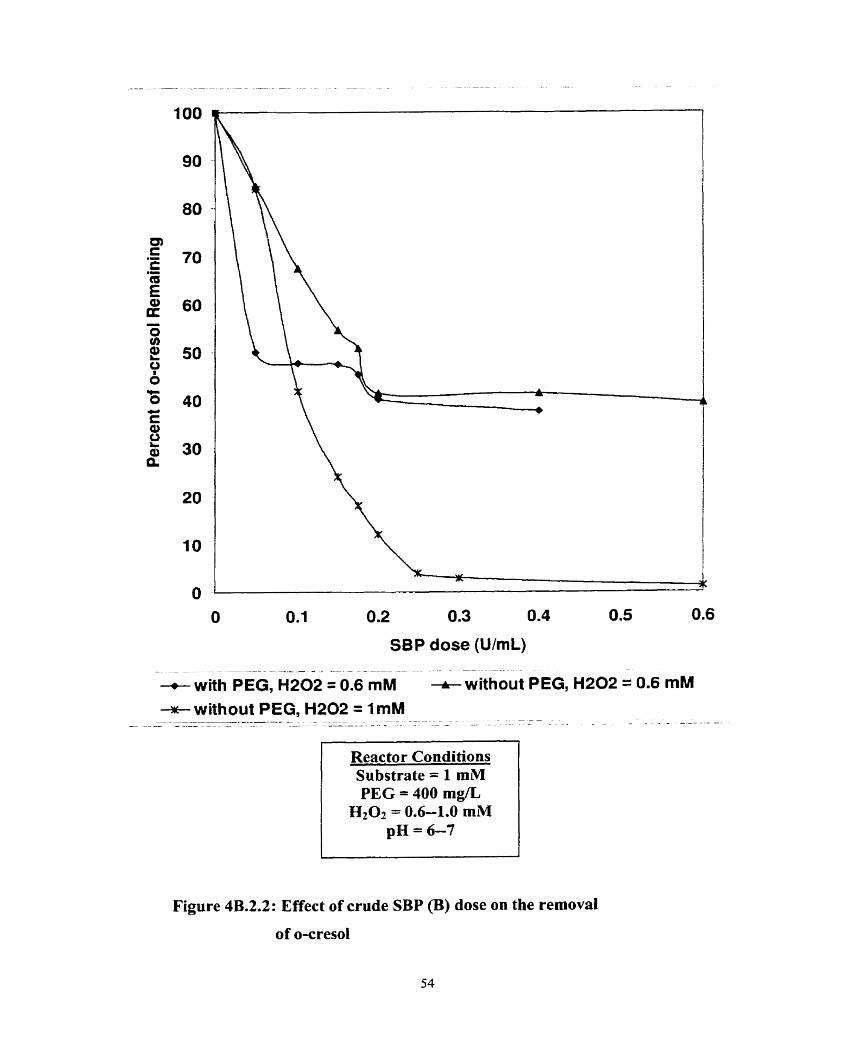
O 0.1 0.2 0.3 0.4 0.5 0.6
SBP dose (UImL) - with PEG, H202 = 0.6 mM -+ without PEG, H202 = 0.6 mM
-wt without PEG, H202 = ImM
Reactor Conditions Substrate = 1 mM PEG = 400 mg&
&O2 = 0.6-1.0 rnlM pH = 6-7
Figure 4B.2.2: Effect of crude SBP (B) dose on the removal
of O-cresol

O 0.05 0.1 0.1 5 0.2 0.25 0.3
SBP Enzyme dose (U/mL) - - - - .- - - - - -- - - A
+-with PEG +without PEG
Reactor Conditions Substrate = 1 mM
pH = 5-5.5 PEG = 400 mg&
[HtOz]/[SubstrateJ = 1.2 mM/mM
Figure 4B.2.3: Effect of crude SBP (B) dose on the removal
m-cresol

SBP dose (U/mL)
Reactor Conditions Substrate = 1 rnM
pH = 4.5-5 PEG = 400 mg/L
Figure 4B.2.4: Effect of crude SBP (B) dose on the removal of
p-cresol
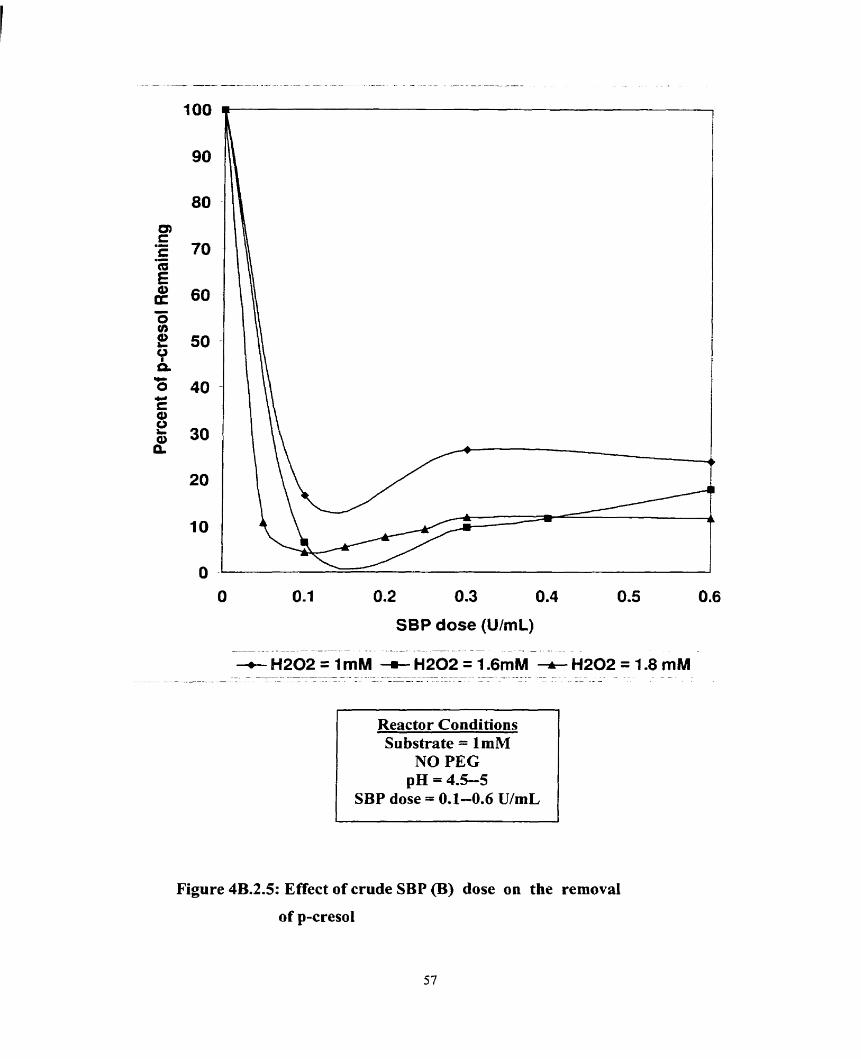
0.2 0.3 0.4
SBP dose (WmL)
Reactor Conditions Substrate = ImM
NO PEG pH = 4.5-5
SBP dose = 0.1-0.6 U/mL
Figure 4B.2.5: Effect of crude SBP @) dose on the removal
of p-cresol

0.2 0.3 0.4 0.5
SBP dose (UlmL) - . - -.
+ with salt +no salt
Reactor Conditions Substrate = 1 mM
pH = 4.5-5.0 NO PEG
[H202]/[Substrate] = 1.6 mM/mM
Figure 4B.2.6: Effect of crude SBP (B) dose on the removal
of p-cresol
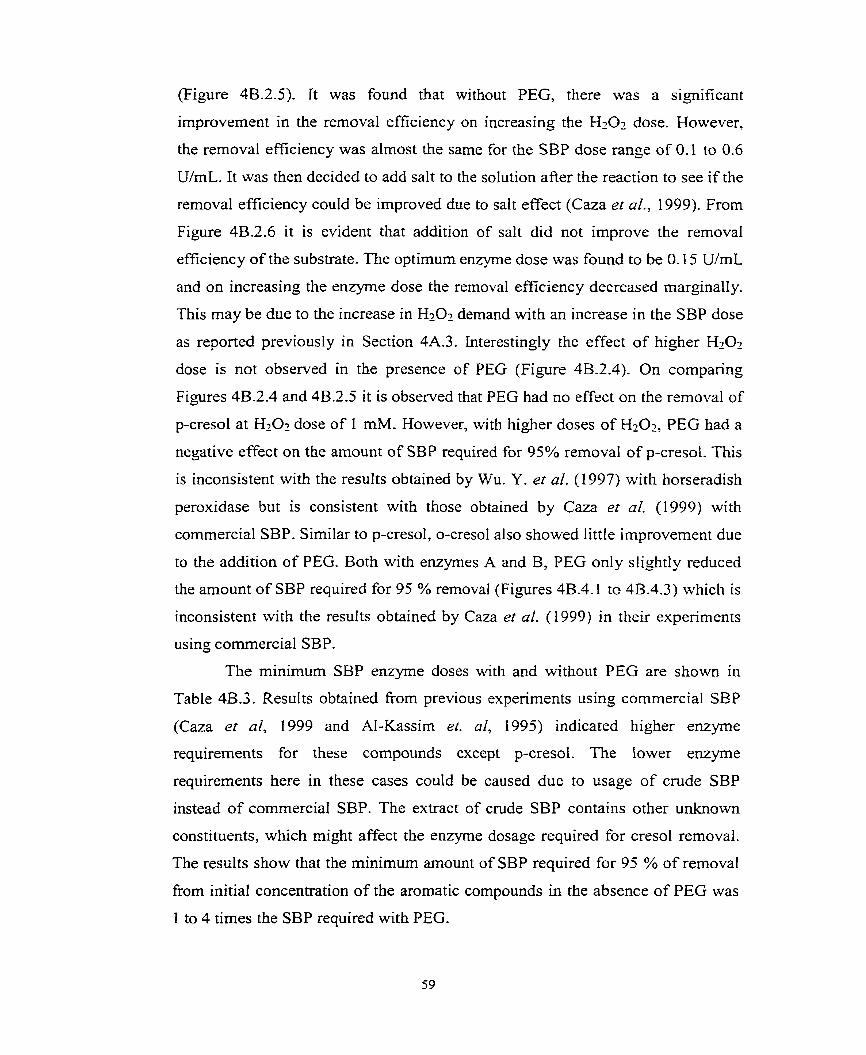
(Figure 4B.2.5). Tt was found that without PEG, there was a significant
improvement in the removal eficiency on increasing the H,02 dose. However,
the rernoval efficiency was almost the same for the SBP dose range of 0.1 to 0.6
U/rnL. It was then decided to add salt to the solution afier the reaction to see if the
removal efficiency could be irnproved due to salt effect (Caza et al., 1999). From
Figure 4B.2.6 it is evident that addition of salt did not improve the removal
efficiency of the substrate. The optimum enzyme dose was found to be 0.15 UimL
and on increasing the enzyme dose the removal efficiency decreased marginally.
This may be due to the increase in H707 demand with an increase in the SBP dose
as reported previously in Section 4A.3. lnterestingly the effect of higher H202
dose is not observed in the presence of PEG (Figure 4B.2.4). On comparing
Figures 4B.2.4 and 4B.2.5 it is observed that PEG had no effect on the removal of
p-cresol at HzOl dose of 1 mM. However, with higher doses of H202, PEG had a
negative effect on the arnount of SBP required for 95% removal of p-cresol. This
is inconsistent with the results obtained by Wu. Y. et al. (1997) with horseradish
peroxidase but is consistent with those obtained by Caza er al. (1999) with
commercial SBP. Similar to p-cresoI, o-cresol also showed Iitîle improvement due
to the addition of PEG. Both with enzymes A and B, PEG oniy slightly reduced
the amount of SBP required for 95 % removal (Figures 4B.4.1 tu 4B.4.3) which is
inconsistent with the results obtained by Caza et al. (1999) in their expenments
using commercial SBP.
The minimum SBP enzyme doses with and without PEG are shown in
Table 4B.3. Results obtained fiom previous expenments using commercial SEP
(Caza et al, 1999 and Al-Kassim et. al, 1995) indicated higher enzyme
requirements for these compounds except p-cresol. The Iower enzyme
requirements here in these cases could be caused due to usage of crude SBP
instead of commercial SBP. The extract of crude SBP contains other unknown
constituents, which might affect the enzyme dosage required for cresol removal.
The results show that the minimum amount of SBP required for 95 % of removal
fi-orn initial concentration of the aromatic compounds in the absence of PEG was
1 to 4 times the SBP required with PEG.

Table 4B.3 Optimum SBP dose in the presence and absence of PEG.
Aromatic
compound
O-cresol
O-cresol
m-cresol
p-cresol
Min. SBP dose
Without PEG (UIrnL)
0.3 (SBP-A)
0.25(SBP-B)
0.3(SBP-B)
O. 15(SBP-B)
Min. SBP dose with
PEG (U/mL)
SBP
dose ratio
4B.3 Hydrogen Peroxide to Substrate Ratio ([H202]/[Substrate])
The tfiird parameter that was optimized in this stuciy was the molar ratio of
hydrogen peroxide to substrate. These experiments were conducted at the
previously detemined optimum pH, whereas the initial SBP concentration was
kept at kss than the optimum dose listed in Table 4B.3 in order to observe a
greater change in removal under stressed condition. The PEG dose was kept at an
excess dose of 400 mg/L. The concentration for al1 of the phenolic compounds
was kept at 1 rnM. Results are plotted in Figures 4B.3.l to 4B.3.4 and the
optimum moIar ratios are listed in Table 4B.4.
These figures show that as [Hz02]/[Substrate] was increased the removal
efficiency also increased until the optimum value was reached. These results
indicate a broad optimum range as was found by Wu. Y. et al. (1997) with
horseradish peroxidase; however they are inconsistent with those obtained by
Caza et al., (1999) when al1 the compounds showed definite optimum points.

Reactor Conditions: Substrate = 1mM PEG = 400 mg/L
SBP dose = 0.1-0.3U/mL
Figure 4B.3.1: Effect of H202 dose on the rernoval of O-cresol
using crude SBP (A)

Reactor Conditions Substrate = 1mM
SBP dose = O.lU/mL PEG = 400 mg/L
pH = 6-7
Figure 4B.3.2: Effect of H202 dose on the removal of O-cresol
using crude SBP (B)
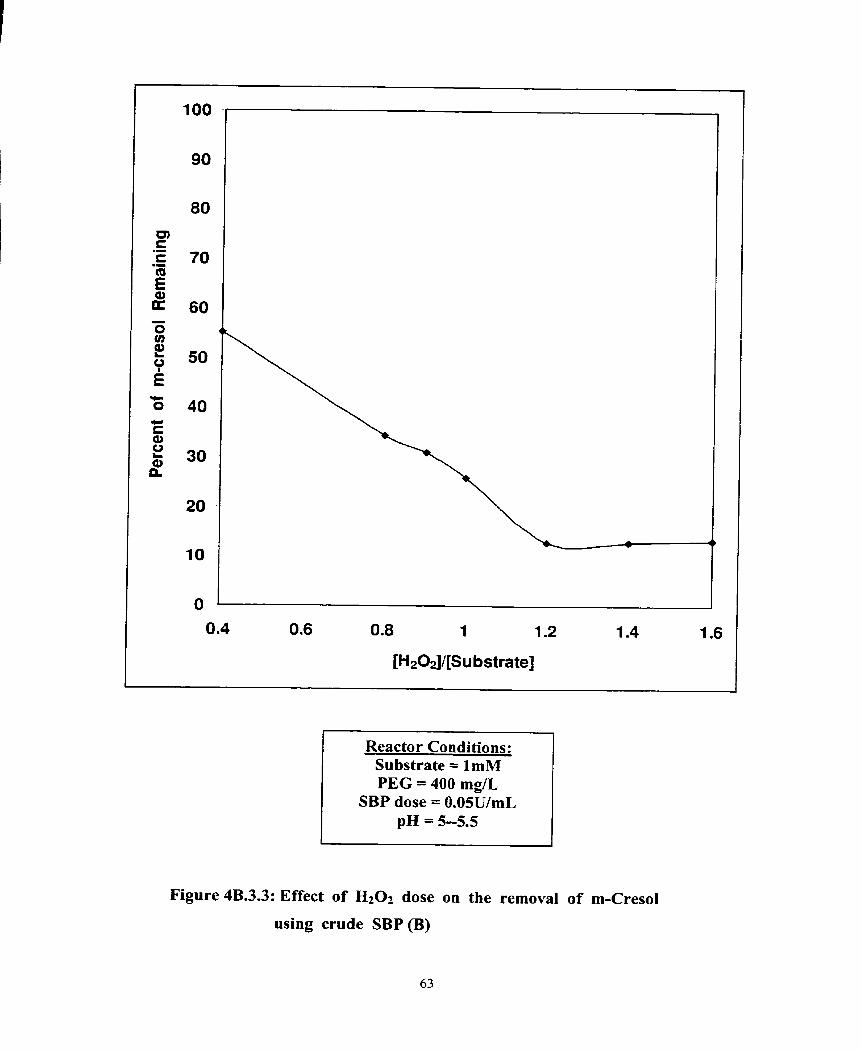
0.8 1 1.2
[HaO$[Su bstrate]
I Reactor Conditions:
Substrate = lmiM PEG = 400 mg&
SBP dose = O.OSU/mL pH = 5-5.5
Figure 4B.3.3: Effect of H202 dose on the removal of m-Cresol
using crude SBP (B)

Reactor Conditions: Substrate = 1mM PEG = 400 mg/L
SBP dose = 0.05-0.4UImL p H = 4.5-5
Figure 4B.3.4: Effect of H202 dose on the removal of p-Cresol
using crude SBP (B)

Table 4B.4: Optimum H z 0 2 to Substrate ratios for the removal of cresols
using crude SBP
m-cresol
p-cresot
Aromatic Compound
O-cresoI
Crude SBP (B)
1 CrudeSBP(B)
As seen in Table 4B.4, the optimum ratios range from 1 .O to as high as 1.8
mM/mM. For the substrate p-cresol, it was observed that without PEG, an
increase in [H2O7]/[Substrate] significantly increased the removal efficiency
(Section 4B.2). This was due to high H202 demand of the crude SBP as was
discussed previously (Section 4A.3). It is possible that when H202 is added to the
reactor, it may react with the substrate in preference over the crude enzyme.
However, the products of reaction will be different for different substrates and
their behavior with HzOz is not known. In the case of p-cresol, the products of
reaction rnight have contributed to the huge arnount of Hl02 demand.
Type of enzyme
Crude SBP (A)
4B.4 Polyethylene Glycol dose
Optimum Hz02 to Substrate
Ratio (mM/mM)
1.4
Polyethylene glycol dose experiments were conducted at the previously
established pH and [Hz02]/[Substrate]. As explained in the previous section, the
SBP concentration was kept at less than the optimum. Results for the removal
efficiency as a function of PEG dose are plotted in Figures 4B.4.1 through 4B.4.4.
The initial concentration of the phenolic compounds was 1 mM for al1 substrates
and the PEG dose ranged from O to 600 mgL.
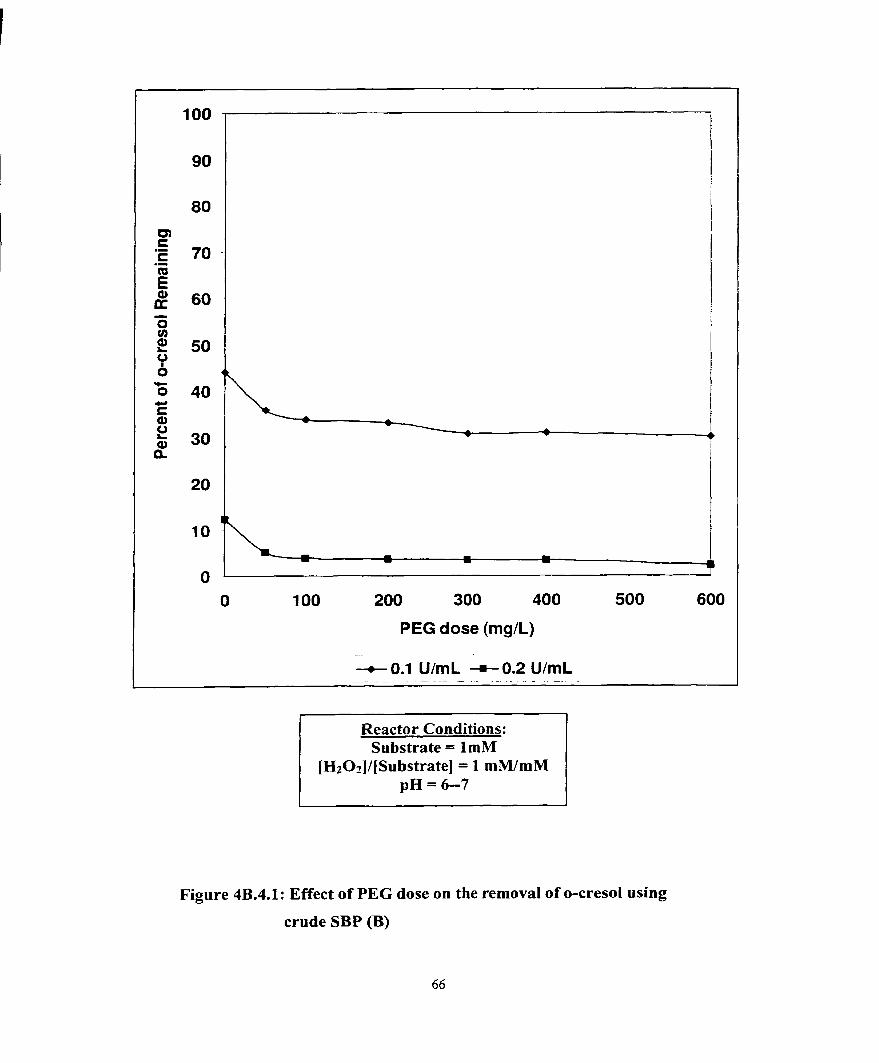
PEG dose (mg/L)
Reactor Conditions: Substrate = 1mM
[H202]/[Substrate] = 1 mWmM pH = 6-7
Figure 4B.4.1: Effect of PEG dose on the removal of O-cresol using
crude SBP (B)

200 300 400
PEG dose (mglL)
Reactor Conditions: Substrate = 1 mM
pH = 5-5.5 [H202]/[Substrate] = 1.2 mlWmM
SBP dose = 0.1 UImL
Figure 4B.4.2: Effect of PEG dose on the removal of m-cresol using
crude SBP (B)

O 100 200 300 400 500 600 700 800 900
PEG dose (mg/L) -
-+SBP dose = O.OSU/mL + SBP dose = 0.2 U/mL
Reactor Conditions: p-cresol = 1 mM
pH = 4-5 [H&]/[Su bstrate] = 1 mM/mM
PEG dose = 0-900 mg/L
Figure 4B.4.3: Effect of PEG dose on the removal of p-cresol
using crude SBP (B)
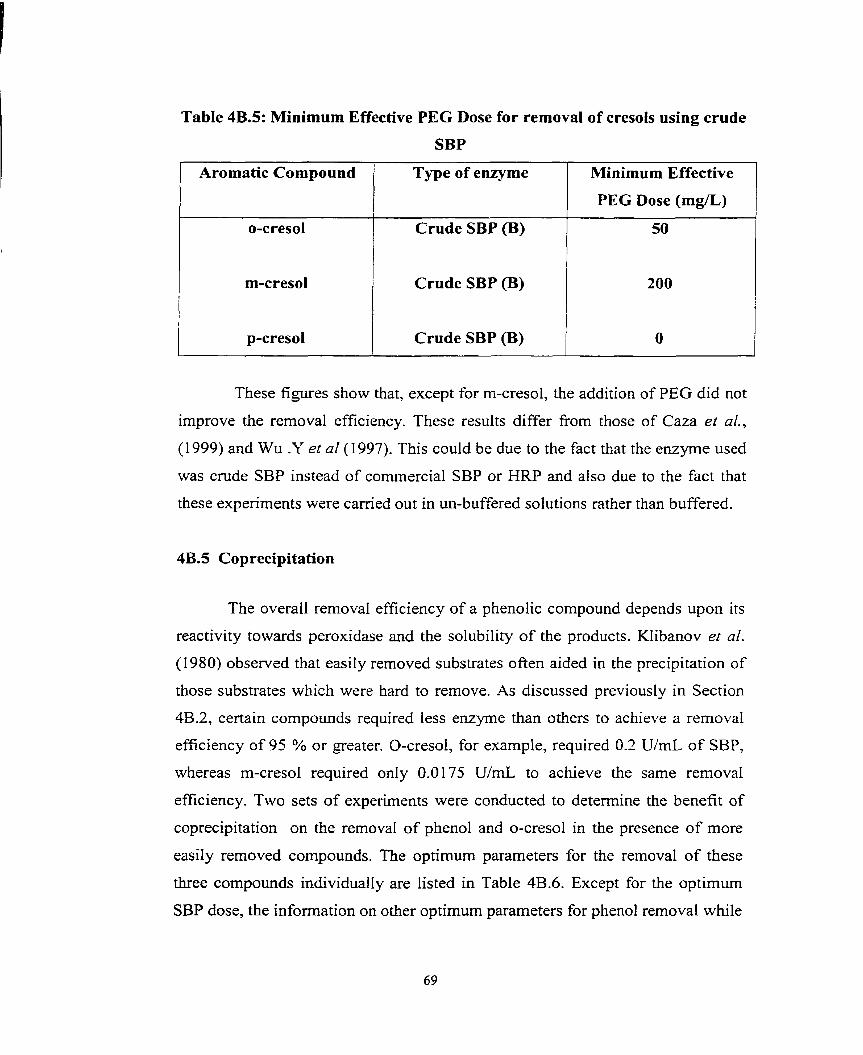
Table 4B.5: Minimum Effective PEC Dose for removal of cresols using crude
SBP
These figures show that, except for m-cresol, the addition of PEG did not
improve the removal efficiency. These results differ fiom those of Caza et al.,
(1999) and Wu .Y et a1 (1997). This could be due to the fact that the enzyme used
was crude SBP instead of commercial SBP or HEU' and also due to the fact that
these experiments were carried out in un-buffered solutions rather than buffered.
Aromatic Compound
O-cresol
m-cresol
p-cresol
4B.5 Coprecipitation
The overall removal efficiency of a phenolic compound depends upon its
reactivity towards peroxidase and the solubility of the products. IUibanov et al.
(1980) observed that easily removed substrates often aided in the precipitation of
those substrates which were hard to rernove. As discussed previously in Section
4B.2, certain compounds required less enzyme than others to achieve a removal
efficiency of 95 % or p a t e r . O-cresol, for example, required 0.2 U/mL of SBP,
whereas m-cresol required only 0.01 75 U/mL to achieve the same removal
efficiency. Two sets of experiments were conducted to determine the benefit of
coprecipitation on the removaI of phenol and O-cresol in the presence of more
easily removed compounds. The optimum parameters for the removal of these
three compounds individually are listed in Table 4B.6. Except for the optimum
SBP dose, the information on other optimum parameters for phenol removal while
Type of enzyme
Crude SBP (B)
Crude SBP (B)
Crude SBP (B)
Minimum Effective
PEG Dose ( m m )
50
200
O

0.1 0.2 0.3 0.4 0.5 0.6 0.7 0.8 0.9
SBP dose (UlmL)
Reactor Conditions Substrate = 1 mM
[H202]/[Su bstrate] = 2.2 mM/mM p H = 6
PEG = 200 mg/L
Figure 4B.5.1: Effect of crude SBP (B) dose on the removal
of phenol

0.2 0.3 0.4
SBP dose (UImL)
1 Reactor Conditions O-cresol = 0.5 mM m-cresol = 0.5 mM
H202 dose = 1.1 mM PEG dose = 200 mg/L
pH = 5.5-6.0
Figure 4B.5.2: Effect of crude SBP (B) dose on the removal of
two substrates: O-cresol and m-cresol
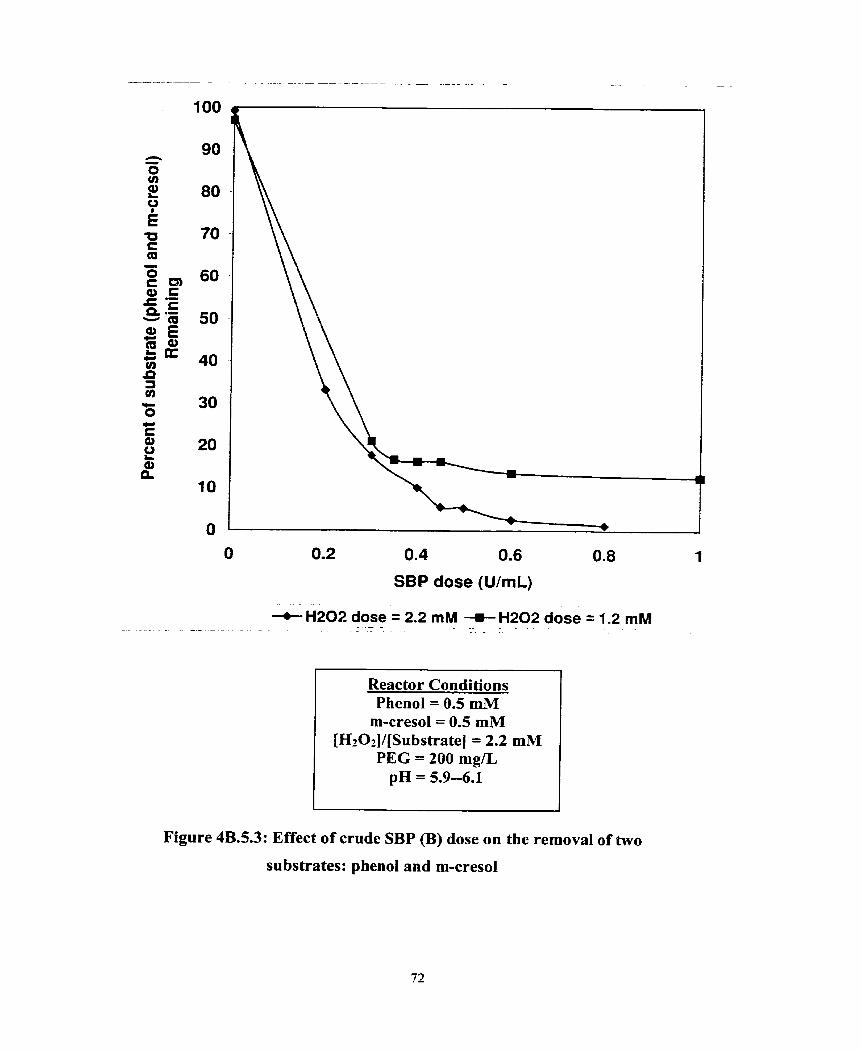
0.2 0.4 0.6 0.8
SBP dose (UImL)
~203. dose = 2.2 mM + H202 dose = 1.2 mM
Reactor Conditions Phenol = 0.5 mM
m-cresol = 0.5 mM [HzO#[Substrate] = 2.2 mM
PEG = 200 mg/L pH = 5.9-6.1
Figure 4B.5.3: Effect of crude SBP (B) dose on the removal of two
substrates: phenol and m-cresol

using crude SBP were obtained by Caza et al, 1999. A separate study was
conducted to obtain the optimum crude SBP dose for the removal of phenol from
synthetic wastewater and the results are shown in Figure 4B.5.1.
Table 4B.6: Summary of Optimum Parameters for three selected phenolic
Cornpounds
In the coprecipitation experiments, the analysis for substrate concentration
was done by using the colonmet~c method. The amount of individual compound
was not determined, but instead, only the total percent of the total substrate
remaining was determined. The substrates used for the coprecipitation
experiments had almost similar calibration curves and extinction coefficients but
not exactly the same. It was assumed to be same and analysis were camed out
based on the assumption that both have the same extinction coefficients.
The rota1 initial substrate concentration in coprecipitation experiments was
1 mM with the concentration of each cornpound being equal to 0.5 mM. Figure
4B.5.2 shows the coprecipitation results for O-cresol and m-cresol. The reaction
pararneters were as follows: pH = 5.5; PEG dose = 200 m a ; and
[H20z]/[Substrate] = 1.1 mMlmM. Table 4B.6 shows that the total enzyme dose
required for an individual removal efficiency of 95 % at a concentration of 0.5
mM is 0.14 UImL (0.1 UImL for O-cresol plus 0.04 UImL for m-cresol). From
Figure 4B.5.2, the optimum SBP dose is 0.5 U/mL. Therefore the presence of an
easier to remove compound (m-cresol) did not aid in the removal of O-cresol.
Aromatic
Compound
Phenol
O-cresol
m-cresol
SBP dose with
PEG (U/mL)
0.8
0.2
0.075
PEG dose
(mg&)
50
50
200
[H201]/[Substrate]
(mM/mM)
1.2
1.2
pH
6
5.5
1 .O 1 5.5
The results for the removal of phenol in the presence of m-cresol are
shown in Figure 4B.5.3. The total initial substrate concentration was 1 mM, with
the individual initial concentrations being equal to 0.5 mM. The experiments were
conducted at pH = 6 , [Hz02]/[Substrate] = 2.2 rnM/rnM and a PEG dose = 200
mg/L. The [Hr02]/[Substrate] ratio used was 2.2 mM/mM instead of 1.2 rnM/miM
because it was anticipated that by using a hydrogen peroxide dose of 1.2 mM, the
peroxidase reaction might run out of hydrogen peroxide due to the high hydrogen
peroxide demand of the enzyme (Section 4A.3). This is confirmed by Figure
4B.5.3 where it is found that 95 % removal of substrate could not be obtained
even at a high SBP dose of 1 .O UlmL when a hydrogen peroxide dose of 1.2 mM
was used. Under similar conditions, the removal of substrate had significantly
increased on increasing the hydrogen peroxide dose to 2.2 mM.
The total SBP dose required for 95 Oio removaI in the coprecipitation
experiment, calculated from the results in Table 4B.6, is 0.44 U/mL (0.4 U/mL for
phenol plus 0.04 U/mL for rn-cresol). The optimum SBP dose, from Figure
4B.5.3, was found to be the same. Since there was no improvement in the removal
efficiency, it is concluded that the enzymatic removal of phenolic compounds
with SBP did not help in coprecipitation. Caza et uZ., (1999) had amved at a
similar conclusion.
4.6 Source of enzyme
Experiments for the optimization of the above reaction parameters were
conducted with crude SBP enzymes extracted from two different batches/hulls
(designated A and BI. It was found that the optimum reaction parameters for the
removal of cresols fiom unbuffered tap water were almost same for both SBP
extracts A and B. Thus it is evident that irrespective of the cmde enzyme source
the removal efficiency remains almost same for the removal of cresols fiom
synthetic wastewater.

4.7 Error Analysis
A set of experiments was conducted in order to determine the reliability of
the results in this study. The Hz02 to substrate ratio senes for p-cresol was
repeated three times at three different ratios and the percent deviations in results
were calculated. Separate solutions were prepared in order to detemine the
accuracy of analytical techniques. The design parameters were as follows: pH =
4.5; initial p-cresol concentration = 1.0 mM; PEG dose = O mg/L; and SBP
enzyme dose = 0.4 U/mL. The results of these experiments are listed in
Table 4B.7.
These results indicate that the deviation was aIways less than + 5%, which is
within an acceptable range. Therefore, the results obtained in this study are
considered to be accurate and reliable.

Table 4B.7: Error Analysis
Percent
Rernaining
Average

5. CONCLUSIONS AND RECOMMENDATIONS
5.1 Conclusions
A suitable experimental protocol has been developed for extracting cnide
SBP enzyme from soybean hulls and to optirnize hulls to solvent ratio and time of
extraction. Also, pertinent characteristic properties of the crude enzyme have been
determined. These included temperature stability, hydrogen peroxide demand and
phen01 content in the enzyme.
5.1.1 Extraction of crude enzyme from hulls
The optimum time of extraction was found to be less than 40 minutes.
The hulls to solvent ratio had no optimum value. The total units of enzyme
extracted remained constant and did not depend on the volume of the solvent
added to soybean hulls. Thus, about 50 and 80 activity units of enzyme were
obtained fiom 1 g of soybean hulls (A) and soybean hulls (B) respectively.
Depending upon the strength of enzyme required, the hulls to solvent ratio c m
be selected.
Tap water as a solvent was found to be more suitable than buffer solution.
Irrespective of the amount of solvent added to 10 g of soybean hulIs, about 50
mL of the extracted solution was not recovered.
The crude SBP was found to be extremely stable up to 8 0 ' ~ . On the other
hand, commercial SBP was unstable above 5 0 ' ~ . Thus, the crude SBP
enzyme has better potential for applications at high temperatures.
The crude SBP showed a significant hydrogen peroxide demand. This demand
depends on the pH of the enzyme solution and also on the activity of the
enzyme. The hydrogen peroxide demand was found to be maximum at pH 6-
7. It increased with an increase in the enzyme activity. The information on the
hydrogen peroxide demand of crude SBP under given conditions helps in
determining the hydrogen peroxide dose required for peroxidase reactions
during removal of substrates.
The phenol content in the crude SBP was found to be very srna11 as compared
to substrate concentration and it did not interfere with the analysis of the
phenolic compounds dunng the enzymatic treatment of synthetic wastewater.
It was also found that the phenolic content in the cmde SBP was directly
proportional to the activity of the enzyme.
5.1.2 Application of crude SBP for cresol removal
The results have demonstrated the feasibility of using crude soybean
peroxidase (SBP) enzyme for treating cresols. The reaction parameters that
were optimized to achieve a removal efficiency of at least 95 % were pH, SBP
enzyme dose with and without PEG, [H207]l[Substrate] and PEG dose. Table
5.1 surnmarizes the optimum doses for al1 of these reaction parameters.
The optimum pH varied between 4.5 and 6.5 for different substrates. Both
m-cresol and p-cresol had a narrow optimum pH range.
Excess peroxidase had no significant effect on the removal of cresols;
however, limiting the amount of SBP resulted in Iower substrate removal
efficiencies. The addition of PEG did not reduce the amount of enzyrne
required for 95 % removal, except for m-cresol in which case it reduced by 4
times.
The hydrogen peroxide requirement depended on the enzyme dose because of
the high demand of hydrogen peroxide by the cmde SBP. The optimum H202
to substrate molar ratios ranged fiom 1.0 for O-cresol to 1.8 for p-cresol. As
the molar ratio increased, the removal efficiency also increased until the
optimum ratio was achieved. Beyond the optimum ratio, therc was no change
in the removal efficiency.
The addition of PEG had little effect on improving the substrate removal
efficiency, except for m-cresol in which case the removal effrciency increased
due to PEG. An excess of PEG had no measurable effect on the removal
efficiency, except for p-cresol, in which case excess PEG drastically
decreased the removal efficiency.

Coprecipitation of phenol and O-cresol with an easier to remove compound
did not reduce the SBP requirements for 95 % removal. In the presence of m-
cresol, the enzyrne requirements for the removal of phenol and O-cresol did
not improve. Similarly, the minimum SBP dose for phenol in the presence of
m-cresol was no t reduced significantl y.
5.2 Recommendations
The results of these experiments have shown that cmde soybean
peroxidase is a viable alternative to other enzymes that have previously been
studied. In order to implement the enzyrnatic method of treatment to full-scale
industriai applications, several other aspects must be considered.
The potential toxicity of the final products must be studied. Once the
nature of the by-products is determined, a suitable disposa1 method can be chosen.
Afier extraction, the enzyme hulls could then be used as animal feed. This would
greatly reduce the amount of solid waste that is produced and in tum would also
reduce costs. Sirnilarly some researchers have also suggested using crude HRP
(Cooper et al., 1996; Dec et al., 1994; Klibanov, 1982) to reduce treatment costs.
In contrast to cmde SBP, crude HRP produces a greater amount of solid waste.
Another advantage of using soybeans is that they are more readily available than
horseradishes. A detailed cost analysis should be camed out in order to determine
the applicability of this process over current treatment methods.
The effect of CO-precipitation should continue to be investigated. Co-
precipitation may yield better results in a mixture of compounds other than the
ones used in this sh~dy. Other components that are present in an actual wastewater
Stream may interfere with or improve the removal of substrates.
5. REFERENCES
Aitken, M.D. (1993) Waste treatment applications of enzymes: opportunities and obstacles. Chem. Eng. Joiirnal. 52, B49-B 5 8.
Al-Kassim, L., Taylor, K. E., Bewtra, J. K. and Biswas, N. (1993) Evaluation of there removal of aromatic and halogenated unsaturated hydrocarbons From synthetic wastewater by enzyme catalyzed polymerization. 48fh Purdue Industrial Waste Con ference Proceedings. 4 1 3 -420.
Al-Kassim, L., Taylor, K. E., Bewtra, J.K. and Biswas, N. (1994) Optimization of phenol rernoval by a fbngal peroxidase from Copnlzus macro hizrrs using batch, continuous, and discontinuous semibatch reactors. Enqrne Micr-ob. Technol. fi, 120- 124.
Al-Kassim, L., Taylor, K. E., Bewtra, J. K. and Biswas, N. (1 995) Optimization and preliminary cost analysis of soybean peroxidase-catalyzed removal of phenols fiorn synthetic and industrial wastewater. Presentation at the 481h Canadian Chernical Engineering Conference.
Arnao, M. B., Acosta, M., del Rio, J. A., Varon, R. and Garcia-Canovas, F. (1990) A kinetic study on the suicide inactivation of peroxidase by hydrogen peroxide. Biochem. Biophys. Acta. lO41,43-47.
Baynton, K.J., Bewtra, J.K., Biswas, N. and Taylor, K.E. (1994) Inactivation of horseradish peroxidase by phenol and hydrogen peroxide: a kinetic investigation Biochem. Biophys. Acta., 1206,272-278
Caza, N., Bewtra, J. K., Biswas, N. and Taylor, K. E. (1999) RernovaI of phenolic compounds fiorn synthetic wastewater using soybean peroxidase. Wat. Res. (in press)
Cooper, V. A. and Nicell, J. A. (1996) Removal of phenols from a foundry wastewater using horseradish peroxidase. Wat. Res. 30,954-964.
Comish-Bowden, A. (1 979). "Fundamentals of Enzyme Kinetics", London, Butterworth.
Dec., J and Bollag, L M . (1994) Use of plant material for the decontamination of water polluted with phenols. Biotech. Bioeng. 44, 1 132- 1 139.
Dunford, H. B. (1 99 1 ) Horseradish peroxidase: structure and kinetic properties. In "Peroxidases in Chemistry and Biology", Vol. Ii, (Edited by Everse J., Everse K. E., and Grisham M.B.), pp. 1-25. CRC Press, Boca Raton, FIL.
Gacesa, P and Hubble, J. (1 987) "Enzyme Technology", Taylor and Francis, pp 77-80 New York, Philadelphia.
Gomori, G. (1 955) Preparation of buffers for use in enzyme studies. In "Methods in

Enzymology", Vol 1, (Edited by Colowrick, S.P. and Kalpan, N.O.), pp. 138-146. Academic Press Inc.
Hewson, W. D. and Dunford, H. B. (1 976) Stoichiometry of the reaction between horseradish peroxidase and p-cresol. J. Biol. Chem. 251, 6043-6052.
Klibanov, A. M. (1982) Enzyrnatic removal of hazardous pollutants fiom ifidustrial aqueous effluents. Enzyme Eng. fi, 3 19-324.
KIibanov, A. M., Alberti, B. N., Mon-is, E. D. and Felshin, L. M. (1980) Enzymatic removal of toxic phenols and anilines fiom wastewaters. J. AppZ. Biochem. 2 , 4 14-42 1.
Klibanov, A. M. and Morris, E. D. (1 98 1) Horseradish peroxidase for the removal of carcinogenic aromatic amines from water. Enqrne Microb. Technol- 3, No. 2., 1 19- 122.
Klibanov, A. M., Tu, T.-M. and Scott, K. P. (1983) Peroxidase-catalyzed removal of phenols from coal-conversion waste waters. Science 221, 259-260.
Lanouette, K. H. (1 977) Treatment of phenolic wastes. Chenrical Eng./Deskbook Issue 99- 106.
McEldoon, J. P., Pokora, A. R. and Dordick, J.S. (1 995) Lignin peroxidase-type activity of soybean peroxidase. En,yrne Microbial Tech. i7, 359-365.
Nakamoto, S. and Machida, N. (1992) Phenol removal fiom aqueous solutions by peroxidase-catalyzed reaction using additives. Wat. Res. 26, 49-54.
Nannipieri, P. and Bollag, J.-M. (1 99 1) Use of enzymes to detoxify pesticide- contaminated soils and water. J. Environ. @al. 20, 5 10-5 17.
Nicell, J. A. (1 99 1) Enzyme catalyzed polymerization and precipitation of arornatic compounds fiom wastewater. Ph.D. dissertation, University of Windsor.
Nicell, J. A. (1 994) Kinetics of horseradish peroxidase-catalyzed polymerization and precipitation of aqueous 4-chlorophenol. J. Chem. Tech. Biotech 60,203 -2 1 5.
NiceII, J. A., Saadi, K.W. and Buchanan, 1. D. (1995) Phenol polymerization and precipitation by horseradish peroxidase enzyme and an additive. Biores. Tech. 54, 5- 16.
Nicell, J. A., Al-Kassim, L., Bewtra, J. K. and Taylor, K. E. (1993) Treatment of waste waters by enzyme catalyzed polyrnerization and precipitation. Biodeterioration Absîracts, 7(1), 1-8.
Palmer, T. (1 98 1) "Understanding Enzymes", Ellis Honvood Limited, Chichester,
England.
STORET (1993) Online retrieval fiom database. Washington, DC, US Environrnental Protection Agency.
Taylor, K. E., Al-Kassim, L., Bewtra, J. K., Biswas, N. and Taylor, J. (1996) Enzyme based wastewater treatment: removal of phenols by oxidative enzymes. "Environmental Biotechnology: Pronciples and Applications", M. Moo-Young, W. A. Anderson, A. M. Chakrabarty (editors), Kluwer Academic Publishers, Dordrecht,pp. 524-532
World Health Organization (1 995) Cresols, Environmental Health Criteria, 168.
World Health Organization (1994) Phenol, Environrnental Health Criteria, 161.
Wu, J., Bewtra, J. K., Biswas, N. and Taylor, K. E. (1994) Effect of Hz02 addition mode on enzymatic removal of phenol from wastewater in the presence of polyethylene glycol. Can. J. C'hem. Eng. 72, 88 1-886.
Wu, J., Taylor, K. E., Bewtra, J. K. and Biswas, hr. (1 993) Optimization of the reaction conditions for enzymatic removal of phenol from wastewater in the presence of polyethylene glycol. Wat. Res. 27, 170 1 - 1706.
Wu, Y., Taylor, K. E., Biswas, N. and Bewtra, J. K. (1997) Cornparison of additives in the removal of phenolic compounds by peroxidase-catalyzed polyrnerization. Wat. Res. 3 l , 2699-2704.
Wu, Y., Bewtra, J. K., Biswas, N. and Taylor, K. E. (1 993) Removal of Phenol Derivatives from Aqueous Solution by Enzyrnatic Reaction with Additives. 48lh Purdue Industrial Waste Con ference Proceedings. 42 1 -43 1 .
Yu, J., Taylor, K. E., Zou, H., Biswas, N. and Bewtra, J. K. (1994) Phenol Conversion and Dimeric Intermediates in Horseradish Peroxidase-Catalyzed Phenol Removal from Water. Environ. Sei. Tecnol. 28,2 154-2 160.
APPENDIX A
Enzyme Activity Assay
1. Generai
The purpose of the enzyme activity assay is to determine the amount of active
enzyme that is present in a solution. The reaction between phenol and HzOz is
catalyzeci by the enzyme (SBP) such that the products of the reaction react with
AAP to form red coloured solution which absorbs light at a peak wavelength of
5 10 nm. Under saturated conditions of phenol, AAP and H202, the initial rate is
measured by observing the change in colour formation in a solution.
2. Reagents
i>
ii)
iii)
iv)
Phosphate buffer (O. 1 M NaPP, pH 7.4)
160 mL of 0.2 M monobasic sodium phophate +
840 mL of 0.2 M dibasic sodium phosphate +
distilled water to make 2 L
Phenol (O. 1 M phenol)
1882.2 mg phenol + Phosphate buffer to make 200 mL +
Store in refngerator
4-Arninoantipyrine (9.6 mM A M )
390 mg AAP rnake + Phosphate buffer to 200 mL.
Store in refigerator
Hydrogen peroxide (2.0 rnM H?O2)
a) 226.7pL of 30 % H202 +
distilled water to make 1 O O m L
b) 1 O rnL of H202 solution fiom (a) +
distilled water to make 100 mL
3. Procedure
In a semi-micro cuvette, combine in the following order:
50 pL SBP soIution
500 pL NaPP buffer
100 pL 0.1 M phenol
250 pL 9.6 mM AAP
100 PL 2.0 mM H202
The total volume in the cuvette should be 1 mL, and the rate of colour
formation must be measured before substrate depletion becomes significant.
Imrnediately after the addition of the sample, shake the cuvette and then monitor
the absorbance change with time at 5 10 nm.
4. Cakulation
i) Find the average slope over the linear range of the data in tems of
absorbance units per unit time (admin).
ii)Calculate the activity in the cuvette
sZope(ati / min) Actl'vity(U / mL) = 1 0 6
X l( 0
6000au. L / mol mol 1000(mL)
The activity is given in ternis of micromoles of hydrogen peroxide converted
per minute at 2 0 ' ~ and pH 7.4.
iii) Calculate the activity of the sample
Activiv in sample(U / mL) = Activiîy in cuvette(U / mL) x looo(@)
sample voltirne(@)

APPENDK B
Aromatic Substrate Assay
1. General
This is a colorimetric assay used to measure the concentration of an
aromatic substrate in an aqueous sample. It uses ferricyanide and 4-
arninoantipyrine as colour generating substances when combined with the
aromatic compound in the sarnple. The Iimiting reagent is the amount of the
aromatic compound and therefore, the degree of colour generated at a peak
wavelength of 5 1 O nm is proportional to the amount of aromatic present.
2. Reagents
0 Ferricyanide reagent (83.4 mM of K3Fe(CN)6 in 0.25 M NaHC03)
2 -75 g K3 Fe(CN)6 +
2.1 g NaHC03 +
distilled water to make IO0 rnL.
ii) 4-Aminoantipyrine reagent (20.8 rnM of AAP in 0.25 M NaHC03)
0.423 g AAP +
2.1 gNaHCOj +
Distilled water to make 100 mL
3. Procedure
In a semi-micro cuvette, combine in the following order:
500 pL of aromatic sarnpie (diluted if necessary)
100 pL of AAP reagent
100 pL of ferricyanide reagent
The final assay sarnple volume should be 1 mL. Afier a couple of
minutes, measure the absorbance at 5 10 nrn against a reagent blank.
4. Calculation
Using the appropriate calibration curve (Appendix D), conven absorbance
readings into desired concentration units.

Appendix-C
Hydrogen peroxide assay
1. General
This end-point colorimetric assay was used to measure the concentration
of hydrogen peroxide in a sample. The assay uses A,?hromyces ramosus
peroxidase as a catalyst and Caminoantipyrine as a color generating cosubstrate
in combination with an aromatic substrate, phenol, in the assay mixture. In this
assay, the amount of hydrogen peroxide introduced into the assay sampie is the
only limiting reactant; therefore, the degree of the colour developed in the
reaction is proportional to the amount of peroxide in the sample. Once the
maximum amount of colour has developed, the absorbance (at 310 nm) is
converted to the hydrogen peroxide concentration in the cuvette by means of a
calibration curve. The hydrogen peroxide concentration in the sample is then
calculated according to the dilution the sample had undergone in the cuvette.
2. Preparation of reagents
a) Phosphate buffer (0.5M NaPP, pH 7.4)
In a IO00 rnL flask, add the following
13.796 g of monobasic sodium phosphate (NaHlP04.H10),
56.78 g of dibasic sodium phosphate (Na2HP04),
add distilled water up to 1 L.
b > Phenol (O. 1 M Phenol) in 0SM phosphate buffer pH 7.4
Dissolve 9.41 1 g of phenol on 1000 rnL of 0.5M phosphate buffer solution.
c > Assay mixture
In a beaker, add the following:
41 mg of 4-aminoantipyrine (AAP),
10 mL of O. 1 M phenol in 0.5M Phosphate buffer pH 7.4,
200 pL of ARP stock solution,
9.8 mL distilled water,
The final total volume of the assay reagent is 20 rnL.
3. Calibration Procedure
Make up a stock solution of hydrogen peroxide with a
concentration of 1 .O mM. From this stock solution prepare standards ranging fiom
O to 1 .O mM. In a test tube place the following solutions
200 pL of the assay reagent
750 pL distilled water
50 pL of standard sample
The total volume of the assay mixture must be 1 rnL and hydrogen peroxide
concentration in the assay mixture should be below 50 pM. Lmmediately afier the
addition of hydrogen peroxide standard, shake the tube and then wait until the
colour is hl ly developed (mostly afier 10 minutes). Put the assay mixture in a
semi-micro cuvette and read the maximum amount of absorbance at 510 nm.
Repeat the procedure for ai1 standards, using triplicate measurements. Make a plot
of absorbance versus hydrogen peroxide concentration in the cuvette, and
deterrnine the dope of the trace using linear regression. A typical calibration
curve for the hydrogen peroxide is presented in Figure A-5.
4. Measurement of hydrogen peroxide
In a semi-micro cuvette, place these reactants in the following order:
200 pL of the assay reagent,
O to 750 pL distilled water,
50 to 800 pL of sample.
The total volume in the cuvette must be 1 rnL. h e d i a t e l y after addition of the
sarnple, shake the cuvette and then wait for the fuII development of the colour.
Read the maximum arnount of absorbance at the peak wavelength of 5 10 nrn.
Detemine the cuvette &O-, concentration from the calibration curve.
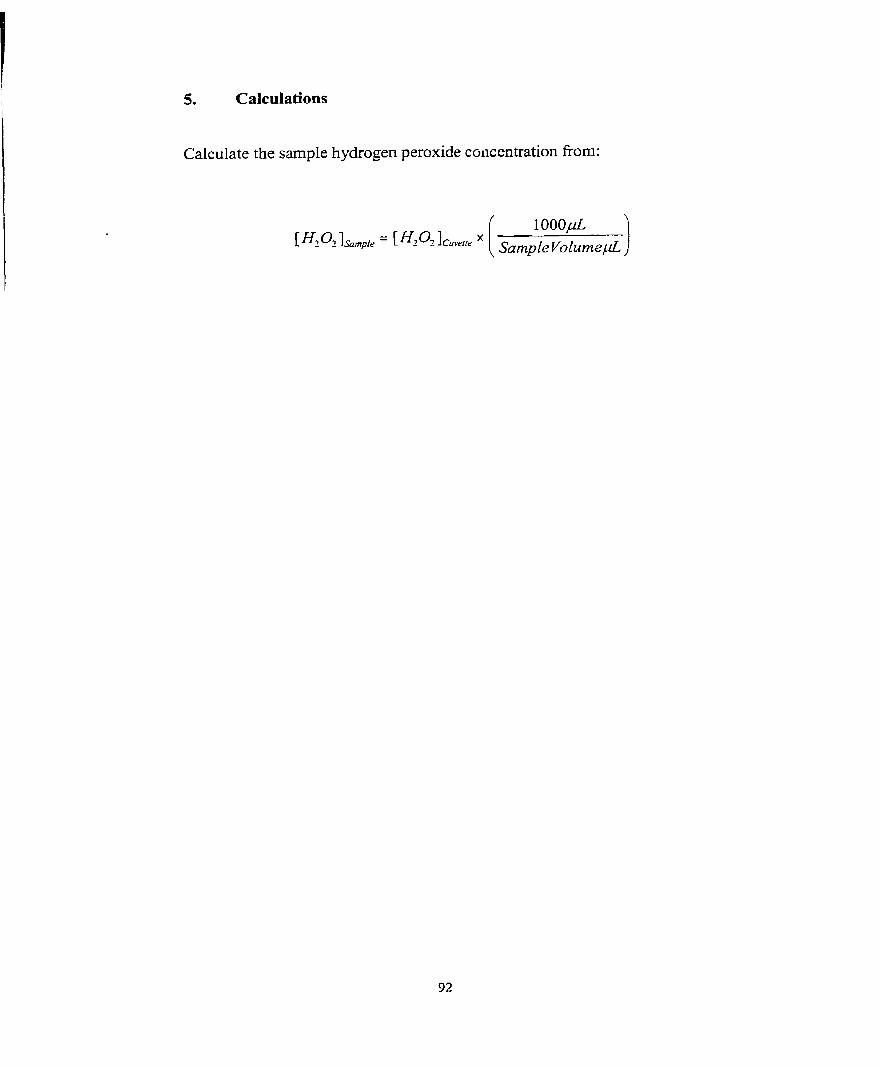
5. Calculations
Calculate the sarnple hydrogen peroxide coiicentration frorn:

Appendix-D
Standard Curves for the Aromatic Compounds
The following section consists of the standard curves (Beer's fit) for the aromatic
compounds and H202.
According to Beer's law,
A = E C L
where A = Absorbance
E = Molar extinction coefficient (M-' .cmm1)
C = Concentration (M)
L = Length of the path of light traveled in cm (1 cm in these cases)

D a t e : ~34-3@- i 999 - - -> Standard Calibration R e p o r t <--- T l m e : i;:48:8S
O p e r a t o r : N c t E n t r r e d
Anclytiszl Wav=iength : 506 rm R e f e r ~ n , c e hsvelength : None 5 e l e c t e d C ~ n f r r - a t i c n Waveiengths : None Seiected
T Intsgrsîion I r m e : 1 s e c a n d s
,508 35.808 C o n c e n t r a t ion (un 1
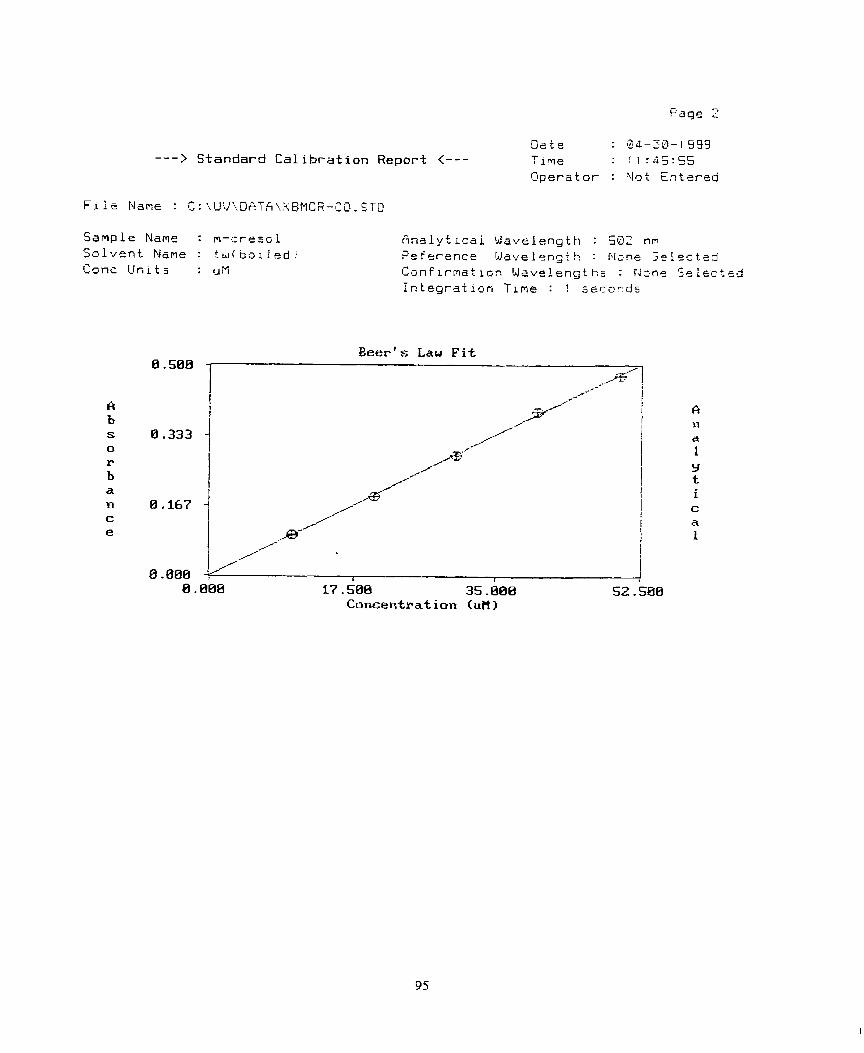
Date : -3-39- 1 999 ---> Standard C a l ibrat ion Repor t <--- T i m e : r i : 5 5 : 5 5
Q p e r a t o r : blot E n t e r e d
Sample Name : m-cresci Solvent Name : t u ( 8 o r l e d Conc Unit3 : u M
Analyt ~ c a i Gzveiength : 5 9 2 n m
P e f r r e n c e Wavelength : r.icne 5 o ! e c t z d C s n f rrnat l c n Wavelengt hc : r Jcne 3 e L ~ c t e d Inteÿration Trme : ! s e c û n d s
Beer's Law F i t
Concentrat ion CuH 1

O a t e : 04-38-1999 -- -> Standard C a l i b r a t ion R e p o r t <--- -? 1 me : i i : S 3 : 3 4
Gperator : Not E n t e r ~ d
5 s m p l e Name : p-cresoi 50 1 v e n t Name : N a D H ! 0. i M ! Conc Units : uM
f i n à l : ~ t i c a i Wsueiength : 296 nm Rsterence Wa,Jelengtn : None S e l e c t e d ;:.:nt r rma t i o n b iave ieng t hs : None Seiected integratlûn Ï r m e : 1 S ~ C G ~ ~ S
Beer's Law F i t
Y-- / /
,/- ,@
/----
2- /--- =--- y-'-
../. /--
**y'
/-' /=-'
+1 . 7 5 E + 0 2 +3 .50~+02 +5.25~+02 Cancentrat i o n (un 1

Date : 94-38-1 992 - - -> Standa rd Calibration Report <--- T f FIE : 11:43:54
Operatcr : Not Entered
Sample Name : FHENOL Ç ~ l v e n t Nanc : TAF WATER Conc Unlts : u M
Analytlcal Wavelength : 510 nm Reference Wavflengih : rdsne 5 ~ 1 e c T e d Conf rrmatlon W s v ~ i ~ n g t n s : Nane seierted fntegration T L ~ P : i 5econdz
Beer's L a w Fit 0.644 ,--'*
1-
/--&
l /-
a'/ /--
6.429 -/ Y 1
I vg*/- i
@/-' i
0.215 // l 1 , /.// I i
I I /-
I /-
s0
/ . d
/
0 . B B B k I fi I 8.608 17.500 35.806 52.508
Concentration CuH)
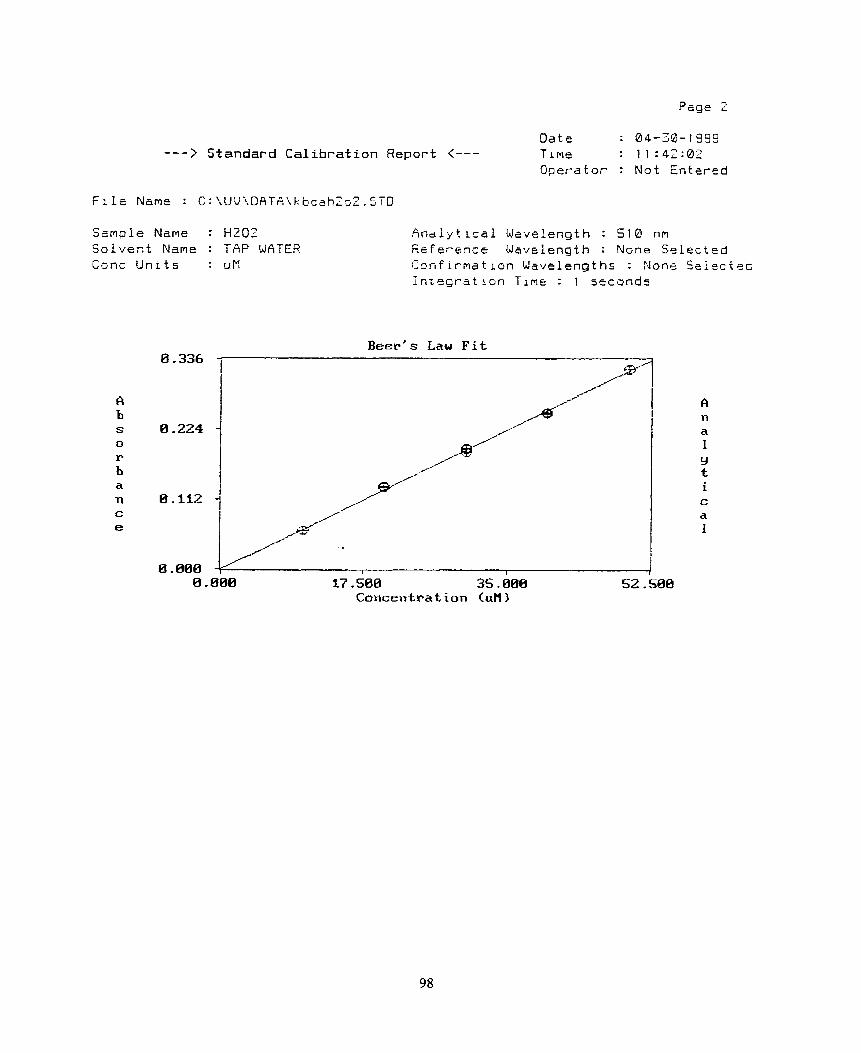
Page Z
D a t e : 04-Za-1995 - ---> Standard Calihratian Report <--- I l m e : t i :42:@2 O p e r a t o r : N o t Entèred
Sample Name : HZû2 Solvent Name : TnF WATER Conc Y n i t s : u M
Analytical Wavelength : S I @ n m Eeference Wavelength : N ~ n e S e l e c t e d Cnnfirmatron Wavelengths : None Ssiectea I n t ~ g r a t ~ ~ n T i m e : t seconds
Beer's Law Fit
17.500 35.880 Concentration <uH)
VITA AUCTORIS
Name: Kaushik Biswas
Place of birth: Calcutta, hdia
Date of birth: September 25'h, 1973
Education: Master of Applied Science Environmental Engineering University of Windsor Windsor, Ontario, Canada i 998- 1999
Bachelor of Technology Chemical Engineering Indian Institute of TechnoIogy Kharagpur, India 1993- 1997
Work Experience: Graduate Assistant, Research Assistant Civil and Environmental Engineering University of Windsor Windsor, Ontario, Canada January 1998- June 1999
Scientist Engineer National Council for Cements and Building Materials Ballabgarh, Haryana, hdia May-December, 1997
Vocational Trainee Lndian Oil Corporation Barauni, hdia May- July, 1996
Awards: Sumrner Research Scholarship, 1999 Visa Differential fee waiver, 1998- 1999