remote sensing of glacier- and permafrost-related...
TRANSCRIPT

Natural Hazards and Earth System Sciences, 5, 527–554, 2005SRef-ID: 1684-9981/nhess/2005-5-527European Geosciences Union© 2005 Author(s). This work is licensedunder a Creative Commons License.
Natural Hazardsand Earth
System Sciences
Remote sensing of glacier- and permafrost-related hazards in highmountains: an overview
A. Kaab1, C. Huggel1, L. Fischer1, S. Guex1, F. Paul1, I. Roer2, N. Salzmann1, S. Schlaefli1, K. Schmutz1,D. Schneider1, T. Strozzi3, and Y. Weidmann4
1Department of Geography, University of Zurich, Switzerland2Department of Geography, University of Bonn, Germany3Gamma Remote Sensing, Berne, Switzerland4University of Applied Sciences, Muttenz, Basel, Switzerland
Received: 9 May 2005 – Revised: 1 July 2005 – Accepted: 1 July 2005 – Published: 29 July 2005
Abstract. Process interactions and chain reactions, thepresent shift of cryospheric hazard zones due to atmosphericwarming, and the potential far reach of glacier disasters makeit necessary to apply modern remote sensing techniques forthe assessment of glacier and permafrost hazards in high-mountains. Typically, related hazard source areas are situ-ated in remote regions, often difficult to access for physi-cal and/or political reasons. In this contribution we providean overview of air- and spaceborne remote sensing methodssuitable for glacier and permafrost hazard assessment anddisaster management. A number of image classification andchange detection techniques support high-mountain hazardstudies. Digital terrain models (DTMs), derived from opticalstereo data, synthetic aperture radar or laserscanning, rep-resent one of the most important data sets for investigatinghigh-mountain processes. Fusion of satellite stereo-derivedDTMs with the DTM from the Shuttle Radar TopographyMission (SRTM) is a promising way to combine the advan-tages of both technologies. Large changes in terrain volumesuch as from avalanche deposits can indeed be measuredeven by repeat satellite DTMs. Multitemporal data can beused to derive surface displacements on glaciers, permafrostand landslides. Combining DTMs, results from spectralimage classification, and multitemporal data from changedetection and displacement measurements significantly im-proves the detection of hazard potentials. Modelling of haz-ardous processes based on geographic information systems(GIS) complements the remote sensing analyses towards anintegrated assessment of glacier and permafrost hazards inmountains. Major present limitations in the application ofremote sensing to glacier and permafrost hazards in moun-tains are, on the one hand, of technical nature (e.g. combina-tion and fusion of different methods and data; improved un-
Correspondence to: A. Kaab([email protected])
derstanding of microwave backscatter). On the other hand,better dissemination of remote sensing expertise towards in-stitutions involved in high-mountain hazard assessment andmanagement is needed in order to exploit the large potentialof remote sensing in this field.
1 Introduction
The glacial, paraglacial and periglacial environment is de-fined, respectively, as the zone of glaciers or their action,the non-glacial zone directly conditioned by glaciation ordeglaciation, and the non-glacial zone in cold regions withfrost action being the predominant geomorphic process. Dis-asters associated to that environment can cause thousands ofcasualties in one event. Related damages or mitigation costsare on the order of several 100 million EUR as a long-termannual average global sum (Kaab et al., 2005). Glacier andpermafrost hazards (here used as a synonym for glacial, peri-,and paraglacial hazards) in high mountains include glacier-and permafrost related floods, stable and unstable glacierlength changes as well as glacier fluctuations, glacier- andpermafrost-related mass movements, permafrost thaw settle-ment and frost heave, and hazards from glacier-clad volca-noes (Table 1). Often, combinations of these (and other) pro-cesses lead to the most severe glacier and permafrost catas-trophes. Whilst above direct glacier and permafrost haz-ards are very palpable, so too are indirect hazards, such aschanges in dry-season river flows, adverse effects on moun-tain tourism, and related socio-economic consequences.
Assessment and management of glacial, peri- andparaglacial hazards require the application of modern inte-grative earth-observation techniques for a number of reasons:
– Typically, related hazard source areas are situated in re-mote high-mountain regions, often difficult to access

528 A. Kaab et al.: Remote sensing of glacier and permafrost hazards
Table 1. Overview of glacier- and permafrost-related hazards in high mountains, processes involved, important remote sensing aspects, andselected remote sensing applications (see also GAPHAZ, 2004; Huggel, 2004; Kaab et al., 2005; Quincey et al., 2005).
Hazardtype
Processes Remote sensing Selected remote sensingapplications
(1) Glacier-and perma-frost-relatedfloods
(1.1) Breaching of moraine damsOutburst of moraine-dammed lakes. Par-ticularly far reaching glacier disasters (upto hundreds of km). Causes: enhancedrunoff; impact waves (1.5); temporarydamming/jamming at outlet.
Moraine-dammed lakes usually detectableby remote sensing, in particular optical tech-niques. Time series particularly useful forassessing lake dynamics and estimating fu-ture development. Assessment of morainedam characteristics requires high-resolutionand -precision techniques (dam geometry,deformation, settlement, surface material,etc.). Monitoring of associated glacier char-acteristics (geometry, surface type), changesand kinematics (thickness changes, veloc-ity) may help assessing the evolution ofproglacial lakes.
(Buchroithner et al.,1982; Kaab, 1996; Agetaet al., 2000; Haeberli etal., 2001; Mool et al.,2001a, b; Huggel et al.,2002, 2004b)
(1.2) Failure or overtopping of ice-damsOutburst of ice-dammed lakes. Particularlyfar reaching glacier disasters. Often repeat-ing for permanent ice dams. Sources: ice-marginal or supraglacial lakes; temporary icedams from ice avalanches (3.1) or glaciersurges (2.1).
Detection of ice-dammed lakes dependingon temporal resolution and timing of remotesensing system; detection of ice dams de-pending on spatial resolution and spectralcharacteristics. Time series particularly use-ful. Monitoring of thickness changes andkinematics of long-lasting ice dams supportsassessment, e.g. of floatation level.
(Espizua and Ben-gochea, 1990; Haeberliet al., 2001; Huggel etal., 2002; Kaab et al.,2003c), (Fig. 4)
(1.3) Glacier outburstsCatastrophic water discharge from the en-or subglacial drainage system. Causes:geothermal or volcanic activity; temporaryen- or subglacial water storage; catastrophicwater release connected to surge termination(2.1).
Particularly difficult or impossible to assessdue to sub-surface character.
(Bjornsson et al., 2001),(cf. Haeberli, 1983;Walder and Driedger,1995)
(1.4) Breaching of thermokarst and supra-glacial lakesOn ice-rich permafrost or stagnant glacierice. Progressive lake growth through ther-mal convection. Outburst causes: similar to(1.1), and progressive melt of ice/permafrostdam.
Detection of related lakes usually requireshigh image resolution due to the small lakesize. Time series particularly useful. Dis-position of lake development partially de-tectable through remote sensing of surfacecharacteristics and kinematics.
(Reynolds, 2000; Kaaband Haeberli, 2001;Wessels et al., 2002)
(1.5) Displacement wavesDisplacement-wave impacts on people, nat-ural and artificial lake dams, and other instal-lations. Trigger for a number of lake outburstevents of types (1.1) and (1.2). Causes: lakeimpact from snow-, ice-, rock-avalanches,landslides, debris flows, etc.; floatation oficebergs.
Assessment requires integrative remote sens-ing and modelling approaches of source pro-cesses.
No direct air- and space-borne remote sensing ap-plication. (cf. Haeberliand Rothlisberger, 1975;Muller, 1995; Tinti etal., 1999; Walder et al.,2003; Zweifel, 2004)
(1.6) Enhanced runoff from permafrostPermafrost is for the most part impermeablefor surface water, a fact that leads to runoffconcentration at the permafrost table, in par-ticular with enhanced surface runoff fromsnow-melt and intense rainfall; ice melt atpermafrost table. Temporary water storagein or underneath permafrost is particularlydifficult to investigate but suggested for rarecases (causes: taliks; ice-melt in permafrost;(temporary) water blockage in or under thepermafrost?). Both phenomena, runoff con-centration and water storage, may lead to un-usually enhanced runoff. Potential triggermechanisms of debris flows (4.3).
Can hardly be directly investigated by re-mote sensing.
No published remotesensing applications.(cf. Haeberli et al.,1990; Zimmermann andHaeberli, 1992)

A. Kaab et al.: Remote sensing of glacier and permafrost hazards 529
Table 1. Continued.
Hazardtype
Processes Remote sensing Selected remote sensingapplications
(2) Glacierlength andvolumechanges
(2.1) Glacier surge (unstable length change)Temporary instability of large glacier partswith ice velocity increased by an order ofmagnitude (or more). Usually accompaniedby drastic glacier advance. Besides the di-rect impact from glacier advance (overridingof structures, blockage of rivers, etc), glaciersurges often trigger further hazards such asice-dammed lakes (1.2). Enhanced englacialwater storage, possibly released at surge end(1.3).
Surges can be tracked by high-frequency re-mote sensing. Former glacier surges, andthus surge-type glaciers, can often be recog-nised from deformed, so-called ”looped”moraines. Geometry changes, if involved inthe surge disposition and build-up, can be de-tected as glacier thickness changes.
(Espizua and Ben-gochea, 1990; Zhang,1992; Rolstad et al.,1997; Jiskoot et al.,2001; Luckman et al.,2002; Strozzi et al.,2002; Copland et al.,2003; Dowdeswell andBenham, 2003), (Figs. 1,13 and 17)
(2.2) Stable glacier advanceAdvancing glaciers may inundate land, over-ride installations, dam rivers and form lakes(1.2), cause ice break-offs (3.1), etc. Causes:positive mass balance, ice dynamics.
Can usually be monitored by remote sensing.Glacier area changes from repeat imagery,glacier mass changes from repeat DTMs.Forecast best done by a combination of re-mote sensing, glaciological field work andmodelling.
(Kaab, 1996; Paul, 2002)and many others (seetext)
(2.3) Glacier retreatGlacier retreat forms usually no direct haz-ard but is able to trigger a number of sec-ondary hazards such as various slope insta-bilities (3). Causes and remote sensing see(2.2).
(Silverio and Jaquet,2005), see (2.2) and (3),(Fig. 2)
(2.4) Changes in glacier runoff and season-alityGlacier mass loss leads to reduction of wa-ter resources as stored in glaciers and tochanges in dry-season river flows. Short-term perspective: increasing discharge dueto enhanced melt; long-term perspective: de-creasing discharge when glaciers becomesubstantially smaller or disappear. Conse-quences for drinking water supply, irrigation,hydropower production, industrial water use,fishery, water quality, etc.
Best investigated through a combination ofremote sensing, meteorology, and combinedglaciological and hydrological modelling.Causes and remote sensing see (2.2).
(Huggel et al., 2003a),see (2.2) and (Wagnon etal., 1999)
physically for topographic, political and/or security rea-sons (Fig. 1).
– The remote location of most glacial hazard sources, thepotential process interactions and chain reactions, andthe far reach of some of the high-mountain hazards re-quire remote sensing sensors capable to cover large ar-eas at once (Fig. 1).
– Climate change induces disturbance in glacier and per-mafrost equilibrium and can shift hazard zones beyondhistorical knowledge. In addition, human settlementsand activities increasingly extend towards endangeredzones in many regions. As a result, historical dataalone are not sufficient any more for hazard assess-ments and have to be combined with new observationand modelling approaches (Grove, 1987; Evans andClague, 1994; Haeberli and Beniston, 1998; Richard-
son and Reynolds, 2000; Huggel et al., 2004a; Kaab etal., 2005).
– Due to the rapid change of high-mountain environ-ments, hazard assessments shall be undertaken routinelyand regularly, combined with continuous monitoring.Remote sensing is particularly suited for both regularand rapid observation.
Recent developments in air- and spaceborne remote sensingopen up new possibilities for the assessment of natural haz-ards in general (Mantovani et al., 1996; Sabins, 1997; Ostiret al., 2003) and glacier and permafrost related hazards inparticular (Huggel, 2004; Kaab, 2004; Quincey et al., 2005).Remote sensing will therefore substantially gain importancefor such works in the near future. Obstacles to the full ex-ploitation of the remote sensing potential for high-mountainhazard assessments are of technical nature, on the one hand,but also due to the lack of expertise dissemination, on theother hand. The present contribution provides for the first

530 A. Kaab et al.: Remote sensing of glacier and permafrost hazards
Table 1. Continued.
Hazardtype
Processes Remote sensing Selected remote sensingapplications
(3) Glacialand para-glacial massmovements
(3.1) Ice fall and ice avalanchesIce break-offs and subsequent ice avalanchesfrom steep glaciers. In rare cases detach-ment of complete glaciers. Particularly dan-gerous in winter with reduced basal friction,extended runout, and mass gain from snow.Glacier parts can fail due to a failure of theunderlaying rock (3.2). Ice avalanches canbe triggered by earthquakes. Ice avalanchescan trigger lake outbursts (1.5), dam rivers(1.2), transform into mud/debris flows (3.5)(3.6).
Detection of steep glaciers through combi-nation of spectral data with DTM. High-resolution, -precision, and -frequency re-mote sensing (e.g. terrestrial close rangetechniques) enables sometimes monitoringof mass changes and kinematics related toentire steep glaciers or unstable sections.
(Kaab, 1996; Clagueand Evans, 2000; Kaab,2000; Kaab et al., 2003c;Salzmann et al., 2004)(Fig. 20)
(3.2) Rock fall, rock avalancheGlacier retreat uncovers and debuttressesrock flanks. The related change in ther-mal, hydrologic, hydraulic and mechanicconditions can lead to rock fall and rockavalanches (fast mass movement). Rockavalanches can carry parts of overlayingglaciers. Rock avalanches can be of in-creased magnitude in glacial environments(extended runout on glaciers or when com-bined with ice, mass gain from ice, entrain-ment of glacier parts through impact, detach-ment of glaciers overlaying the rock massbreaking off). Rock avalanches can be trig-gered by earthquakes.
Mapping of rock faces and some bound-ary conditions (e.g. glacier retreat) possiblethrough remote sensing.
(Kaab et al., 2003c;Huggel et al., 2005)(Figs. 1 and 2)
(3.3) Landslide/rock slideAmong other causes, glacier retreat (2.3) orslope undercutting by floods uncovers anddebuttresses rock and debris flanks. The re-lated change in hydrologic, hydraulic andmechanic conditions can lead to mass move-ments (slow mass movement). These cancreate secondary hazards such as river dams.
Landslide surface characteristics, geometryand kinematics can be monitored by repeathigh-resolution and -precision remote sens-ing.
(Mantovani et al., 1996;Kaab, 2002; Kaab, 2004;Singhroy and Molch,2004)(Figs. 15 and 19)
(3.4) Destabilisation of unconsolidatedglacial depositsGlacier retreat (2.3) leaves unprotected andunconsolidated moraine material that isprone to enhanced erosion and debris flows.
Related zones can be detected trough remotesensing combined with DTMs.
(Huggel et al., 2004b)
(3.5) Debris flows from glacier floodsGlacier and permafrost floods (1) are oftenaccompanied by debris flows when erodi-ble material is available in steep parts of theflood path. Such debris flows can show asequence of erosion and deposition. Debrisflow deposits may dam tributaries or mainrivers.
Remote sensing with sufficient spatial reso-lution supports estimating the availability ofdebris in a potential flood path and its slope(i.e. disposition to erosion or deposition).
see (1)
(3.6) Interaction between volcanic activityand glaciersPotentially among the most devastatingglacier disasters. Enhanced geothermal ac-tivity, geometric and mechanic changes, de-position of hot eruptive materials, or albedochange by volcanic ash can lead to drasticmelt of ice or ice break-off on ice-clad vol-canoes and to volcanic landslides or lahars.Ash layers thicker than some mm-cm insu-late the underlying ice.
Ice cover on volcanoes and its changes (andpartially also volcanic activity) can be moni-tored by remote sensing (see 2)
(Bjornsson et al., 2001;Dean et al., 2004; JulioMiranda et al., 2005)(Fig. 23)

A. Kaab et al.: Remote sensing of glacier and permafrost hazards 531
Table 1. Continued.
Hazardtype
Processes Remote sensing Selected remote sensingapplications
(4) Perma-frost- andground ice-related massmovements
(4.1) Adverse effects of permafrost creepPermafrost creep (often forming rock-glaciers) can inundate land and destabiliseor destroy constructions situated on or in it.Cause: gravity-driven deformation of ice-rich debris.
Monitoring of permafrost deformation by re-peat high-resolution optical remote sensingand DInSAR.
(Kaab, 2000; Kaab,2002; Kenyi and Kauf-mann, 2003; Strozzi etal., 2004), (Figs. 11 and18)
(4.2) Thaw settlement and frost heaveChanges in permafrost surface geometrydue to changes in ground ice content fromice-lense accumulation or thermokarst pro-cesses. Affecting constructions; possiblytriggering thermokarst lakes (1.4). Thawand frost heave processes may be caused byconstructions (e.g. changes in snow coverregime, basement heating).
Monitoring of geometry changes from repeathigh-precision DTMs.
(Kaab et al., 1997),(Fig. 11)
(4.3) Debris flows from permafrostPermafrost thaw changes mechanic and hy-drological conditions in permafrost. As aconsequence the disposition of periglacialdebris flows may increase. Temporary runoffconcentration (1.6) and ground saturation is,thereby, often involved as trigger.
Only detectable using remote sensing whenaccompanied by changes in surface geome-try (4.2).
(Kaab, 1996; Hoelzle etal., 1998)
(4.4) Rockfall from rockglacier frontAdvance of rockglaciers involves continu-ous transport of surface debris over the rock-glacier front. This may lead to local rockfallendangering people and mountain infrastruc-ture.
Remote sensing see (4.1) (Bauer et al., 2003; Kaaband Reichmuth, 2005)
(4.5) Destabilisation of frozen debris slopesIn rare cases entire sections of rockglaciersor frozen debris slopes might destabilise.Reasons largely unknown (dynamic, groundwarming, ?). Can lead to (4.1), (4.3), and(4.4).
For slow movements detectable using high-resolution remote sensing (4.1 and crevasseformation).
(Kaufmann andLadstadter, 2002; Roeret al., 2005), (Fig. 14)
(4.6) Rockfall and rock avalanches fromfrozen rock facesThe thermal regime and ground ice in frozenrock faces have complex thermal, mechan-ical, hydraulic and hydrological effects onrock stability. Related changes can causemass movements. Processes often also re-lated to surface ice (3.2).
Remote sensing see (3.2). (Fischer, 2004; Noetzliet al., 2005), (Fig. 2)
time a comprehensive overview of remote sensing methodsavailable for glacier and permafrost hazard assessments inmountains. The wide range of, partially novel, applicationstudies discussed aims at evaluating and demonstrating thepotential and limits of remote sensing in the topic considered.In this way the contribution intends to elaborate present re-search needs, but also to contribute to the dissemination of re-mote sensing methods for high-mountain hazard assessmentand management.
The first part of the paper concentrates on the acquisitionof base data, covering a method overview (Sect. 2), imageclassification (Sect. 3), production of digital terrain models
(DTMs; Sect. 4), computation and analysis of terrain eleva-tion changes (Sect. 5), and measurement of surface displace-ments (Sect. 6). The second part focuses on the integration ofthese data into hazard assessments, and on advanced analysismethods including the detection of hazard sources (Sect. 7),modelling of hazard potentials (Sect. 8), and disaster man-agement (Sect. 9). Conclusions and perspectives finalize thisoverview article.
532 A. Kaab et al.: Remote sensing of glacier and permafrost hazards
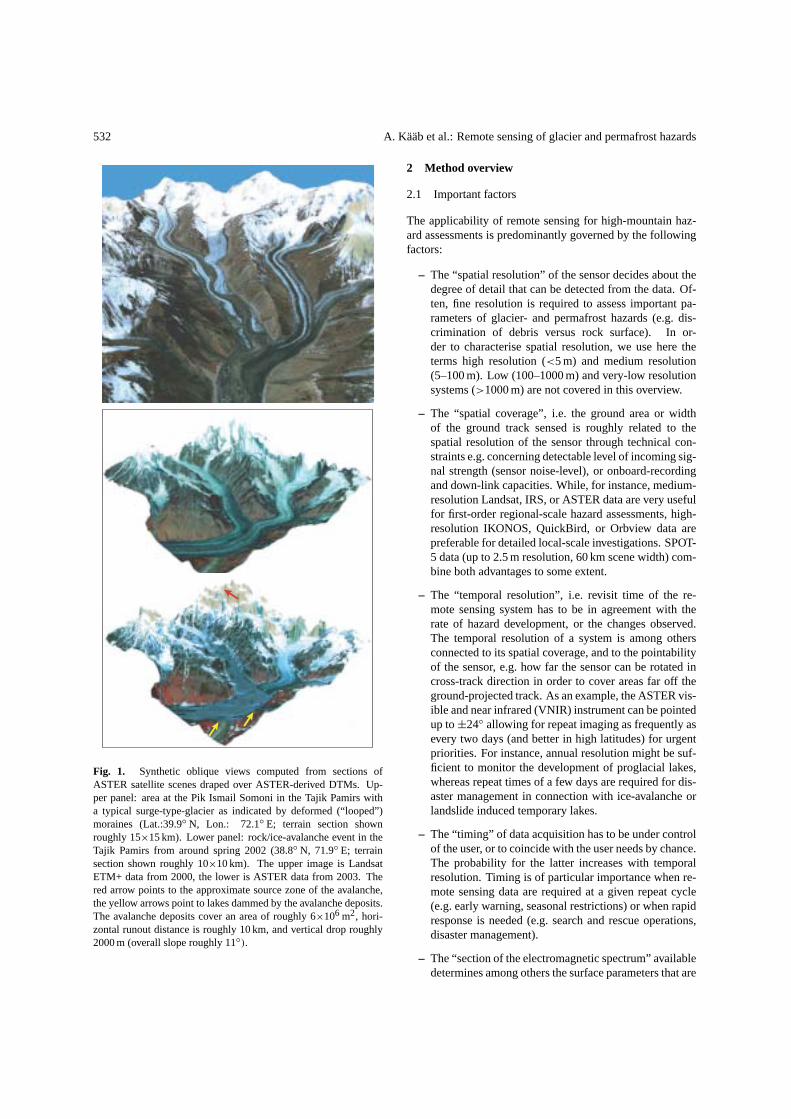
Fig. 1. Synthetic oblique views computed from sections ofASTER satellite scenes draped over ASTER-derived DTMs. Up-per panel: area at the Pik Ismail Somoni in the Tajik Pamirs witha typical surge-type-glacier as indicated by deformed (“looped”)moraines (Lat.:39.9◦ N, Lon.: 72.1◦ E; terrain section shownroughly 15×15 km). Lower panel: rock/ice-avalanche event in theTajik Pamirs from around spring 2002 (38.8◦ N, 71.9◦ E; terrainsection shown roughly 10×10 km). The upper image is LandsatETM+ data from 2000, the lower is ASTER data from 2003. Thered arrow points to the approximate source zone of the avalanche,the yellow arrows point to lakes dammed by the avalanche deposits.The avalanche deposits cover an area of roughly 6×10⁶ m2, hori-zontal runout distance is roughly 10 km, and vertical drop roughly2000 m (overall slope roughly 11◦).
2 Method overview
2.1 Important factors
The applicability of remote sensing for high-mountain haz-ard assessments is predominantly governed by the followingfactors:
– The “spatial resolution” of the sensor decides about thedegree of detail that can be detected from the data. Of-ten, fine resolution is required to assess important pa-rameters of glacier- and permafrost hazards (e.g. dis-crimination of debris versus rock surface). In or-der to characterise spatial resolution, we use here theterms high resolution (<5 m) and medium resolution(5–100 m). Low (100–1000 m) and very-low resolutionsystems (>1000 m) are not covered in this overview.
– The “spatial coverage”, i.e. the ground area or widthof the ground track sensed is roughly related to thespatial resolution of the sensor through technical con-straints e.g. concerning detectable level of incoming sig-nal strength (sensor noise-level), or onboard-recordingand down-link capacities. While, for instance, medium-resolution Landsat, IRS, or ASTER data are very usefulfor first-order regional-scale hazard assessments, high-resolution IKONOS, QuickBird, or Orbview data arepreferable for detailed local-scale investigations. SPOT-5 data (up to 2.5 m resolution, 60 km scene width) com-bine both advantages to some extent.
– The “temporal resolution”, i.e. revisit time of the re-mote sensing system has to be in agreement with therate of hazard development, or the changes observed.The temporal resolution of a system is among othersconnected to its spatial coverage, and to the pointabilityof the sensor, e.g. how far the sensor can be rotated incross-track direction in order to cover areas far off theground-projected track. As an example, the ASTER vis-ible and near infrared (VNIR) instrument can be pointedup to ±24◦ allowing for repeat imaging as frequently asevery two days (and better in high latitudes) for urgentpriorities. For instance, annual resolution might be suf-ficient to monitor the development of proglacial lakes,whereas repeat times of a few days are required for dis-aster management in connection with ice-avalanche orlandslide induced temporary lakes.
– The “timing” of data acquisition has to be under controlof the user, or to coincide with the user needs by chance.The probability for the latter increases with temporalresolution. Timing is of particular importance when re-mote sensing data are required at a given repeat cycle(e.g. early warning, seasonal restrictions) or when rapidresponse is needed (e.g. search and rescue operations,disaster management).
– The “section of the electromagnetic spectrum” availabledetermines among others the surface parameters that are

A. Kaab et al.: Remote sensing of glacier and permafrost hazards 533
recorded at the sensor and the dependence of the sensorto weather and illumination conditions (e.g. all-weatherand night-time capability of microwave sensors, night-time capability of thermal infrared (TIR) sensors).
– “Stereo, interferometric or ranging capability” of the re-mote sensing system enables the computation of terrainelevations, often a crucial prerequisite for the analysisof high-mountain environments in the absence of ap-propriate topographic maps.
– “Usability of data” for the user, with the respect toe.g. existence and access to data archives, speed of on-demand acquisition, speed of delivery, simplicity ofdata formats and size, financial resources as well ashard- and software resources, and processing and anal-ysis knowledge of the user.
2.2 Airborne remote sensing
Airborne remote sensing technologies that are applicablefor high-mountain hazard assessments include the followingtechniques (Fig. 2):
– Hard-copy or digital aero-photogrammetry based onframe imagery or linear array CCD sensors are wellestablished techniques for generation of digital terrainmodels (DTMs), detection of vertical terrain changes,measurement of terrain displacements, and detailed in-terpretation (Baltsavias et al., 1996; Hauber et al., 2000;Kaab, 2000, 2002; Kaufmann and Ladstadter, 2002; Mi-randa and Granados, 2003).
– Whereas modern digital air cameras have also multi-spectral capabilities by including a few bands in the visi-ble and near infrared (VNIR), there are also some hyper-spectral sensors available with tens to hundreds of nar-row bands in the VNIR and SWIR (short-wave infrared)spectrum. Airborne hyperspectral remote sensing al-lows for detailed spectral analysis of the ground sur-face (e.g. lithology, vegetation, lake water) (e.g. Kelleret al., 1998), but is so far little applied directly for moun-tain hazard assessments due to the high data acquisitioncosts and the large expertise required for data analysis.As yet the method is subject to scientific research ratherthan available on an operational level.
– Airborne laserscanning is an upcoming and highlypromising tool for acquiring high-resolution DTMs(Baltsavias et al., 2001; Geist et al., 2003; Janeras et al.,2004). From repeat DTMs it is also possible to deriveterrain displacements. Some laserscanning instrumentsare able to record the signal intensity and, thus, to in-clude spectral terrain characteristics (Lutz et al., 2003).
– Airborne synthetic aperture radar (SAR) is rarely usedin high-mountains, mainly due to topographic restric-tions. The applied microwave spectrum, however, bears
SAR Altimeter OpticalOptical
Space Air
SAR LIDAR
100-10 m 1000-10 m 1-0.01 m100-1 m 1-0.1 m 0.1 m
DTM
Platform:
Data:
Sensor:
Thickness change
Horizontal surface displacements
Vertical surface displacements
Classification of surface and changes
Stereo parallaxes, (photo- clinometry)
Repeat DTM
Image matching, (change detection)
Multispectral segmentation, DTM analysis, change detection
Multi-, hyper- spectral analysis, thermal IR change det.
Multi-, hyper- spectral analysis, thermal IR, change detect.
(Multi-) spectral segmentation, DTM analysis
(Backscatter, polarimetry, multifrequency;interfer. coherence)
Backscatter, polarimetry, multifrequency, interfer. coherence, change detect.
(Backscatter, polarimetry, multi-freq., DTM analysis)
Backscatter, polarimetry, multi- frequency, change detect.
Image matching, (image algebra, DTM matching)
Image matching in multitemp. stereo models
DTM matching
(DTM matching)
Intensity segmen- tation, DTM analysis
Intensity (,multi- frequency)
Differential InSAR
Differential InSAR
(Differential InSAR)
(Differential InSAR)
Repeat DTM
Repeat DTM
Repeat DTM
Repeat DTM
Repeat meas.
Stereo parallaxes
Interfero- metry
Interfero- metry
Laser-scanning, -profiling
-
--
-
-
(RADAR, LIDAR, interfero- metry)
Surface characteristic and changes
GIFOV:
Fig. 2. Overview of remote sensing methods suitable for high-mountain hazard assessment, in relation to platforms and sensors,and data types to be derived. Abbreviations: DTM: digital terrainmodel; GIFOV: ground-projected instantaneous field of view (i.e.spatial sensor resolution); IR: infrared; LIDAR: light detection andranging (laserscanning); SAR: synthetic aperture radar; InSAR: in-terferometric SAR.
a high potential due to its all-weather and day/night ca-pability, and for extracting surface and sub-surface char-acteristics that influence the complex di-electrical con-stant of the ground (e.g. roughness, humidity) (Vachonet al., 1996; Stevens et al., 2003).
Airborne remote sensing campaigns in mountains coverusually of a few or a few tens of km2 by one scene/image.Data costs range from a few EUR/km2 for reproduction ofexisting data to hundreds of EUR/km2 for original acquisi-tions. Beside many advantages of airborne remote sensingsuch as level of detail and direct customer control, this classof platforms is often not applicable for areas where major to-pographic, political, security or financial restrictions are in-volved. Satellite sensors overcome these restrictions in parts.They are able to cover large areas without ground accessneeded, data are comparably cheap and well accessible, andfor some sensors a repeat cycle of a few days is possible (Gaoand Liu, 2001; Huggel, 2004; Kaab, 2004).
2.3 Spaceborne remote sensing
Spaceborne remote sensing technologies suitable for high-mountain hazard assessments include the following tech-niques (Fig. 2):
– Optical multispectral spaceborne imaging represents awell-established satellite remote sensing method for

534 A. Kaab et al.: Remote sensing of glacier and permafrost hazards
Fig. 3. Changes in glacier extent in the Monte Rosa east face(45.9◦ N, 7.9◦ E) as derived from orthophotos between 1956 (lightblue) and 2001 (dark blue). In the recently de-glaciated zones dras-tic mechanical, thermal, hydraulic and hydrological changes affectthe frozen and unfrozen rock and debris deposits, and cause in-creased rock fall activity. Background: topographic map, sheet Zer-matt, by Swisstopo, permission BA046472.
mapping and monitoring ground cover and its changes.It is often used for detecting hazard source areas andterrain changes, and for mapping of endangered zones(Buchroithner et al., 1982; Kaab et al., 2000, 2003c;Huggel et al., 2002, 2004c; Liu et al., 2005; Silverioand Jaquet, 2005).
– Satellite optical stereo, usually combined with multi-spectral imaging, enables the computation of DTMs,a crucial prerequisite for most high-mountain studies(Toutin, 2001; Gamache, 2004; Kaab, 2004).
– Interferometric SAR (InSAR) from space can also beused to derive DTMs. In particular useful for supportinghazard assessments in remote areas is the DTM from thesingle pass InSAR campaign Shuttle Radar TopographyMission (SRTM). Repeat InSAR can further be appliedto measure terrain movement (e.g. differential InSAR,DInSAR) (Gens and van Genderen, 1996; Mantovani etal., 1996; Rignot et al., 1996; Kelley et al., 1997; Moor-man and Vachon, 1998; Toutin and Gray, 2000; Strozziet al., 2004). In addition, the microwave backscatter (i.e.the intensity of the return-signal recorded at the sen-sor), the interferometric phase coherence, and the signal(de-)polarisation can be analysed (Coltelli et al., 1996)(see Sect. 3).
Spaceborne remote sensing data of medium resolution coverup to tenthousands of km2 by one scene. Data costs are onthe order of few EUR/km2 or much less.
Here, we do not cover terrestrial remote sensing meth-ods since the focus of our contribution is on remote areas.However, it should be stressed that, for instance, terrestrialphotogrammetry (Brecher and Thompson, 1993; Kaufmannand Ladstadter, 2004; Pitkanen and Kajutti, 2004), touch-lesslaser rangers, terrestrial laser scanning (Bauer et al., 2003;Janeras et al., 2004) and terrestrial SAR (Tarchi et al., 2003)can be highly valuable techniques for detailed monitoringtasks.
3 Image classification
The most common application of remotely sensed image datafor high-mountain hazard assessment consists in the inter-pretation and classification of the image content. Thereby,both the spectral image information and the spatial context ofsuch information are exploited. The technologically simplestform of image analysis (though by no means the least impor-tant and easiest analysis!) is the manual mapping of featuresof interest from the imagery available (Fig. 3). In particu-lar under conditions of difficult topography and weak opti-cal contrast, or for highly complex assessment tasks, manualimage segmentation might be superior to semiautomatic andautomatic techniques. A number of image enhancement andfusion techniques are available to facilitate manual interpre-tation (Lillesand and Kieffer, 2000).
However, for rapid, repeated, and/or large-area quanti-tative applications, automatic image classification is ableto offer valuable support. The large variety of avail-able techniques ranges from mono-spectral (i.e. grey-value)segmentations, multi- and hyperspectral classifications, tospatio-spectral analyses utilising not only the spectral in-formation of the image pixels but also their spatial context(Schowengerdt, 1997; Lillesand and Kieffer, 2000; Kaab,2004).
For instance, glacierized areas (Hall et al., 1989; Aniyaet al., 1996; Kaab et al., 2000, 2003a; Albert, 2002; Paul,2002; Paul et al., 2002, 2004b; Salzmann et al., 2004) orglacier lakes (Huggel et al., 2002; Wessels et al., 2002) canbe mapped automatically. Archived data sets are an invalu-able source for comparison between past and present situa-tions (Fig. 4) (Kaab and Haeberli, 2001; Kaab et al., 2003c;Silverio and Jaquet, 2005).
Mountain permafrost, a purely thermal phenomenon, canhardly be remotely sensed in a direct way, but related indi-cators such as rockglaciers, thaw lakes, polygones, etc. canbe detectable in remote sensing data (e.g. Lewkowicz andDuguay, 1999; Frauenfelder et al., 2005).
Many glacier- and permafrost-related hazards are con-nected to terrain changes. Thus, multitemporal applicationsare of particular interest for assessing high-mountain haz-ards. Beside the measurement of elevation changes and ter-rain displacements as discussed in the following sections, a
A. Kaab et al.: Remote sensing of glacier and permafrost hazards 535
22/07/2001 27/09/2002 09/04/20041 km1 km
KarmadonKarmadon
avalancheavalanchedepositsdeposits
lakeslakes
pondspondsdecay decay structuresstructures
gorgegorge
N riversrivers
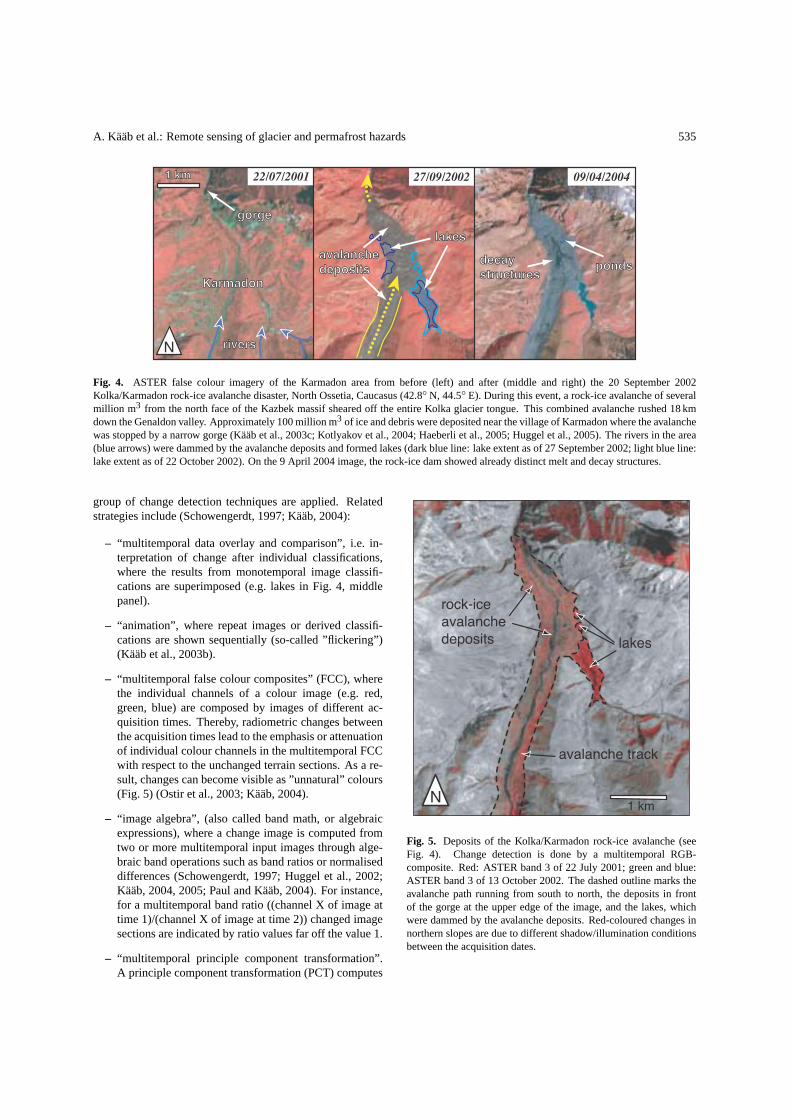
Fig. 4. ASTER false colour imagery of the Karmadon area from before (left) and after (middle and right) the 20 September 2002Kolka/Karmadon rock-ice avalanche disaster, North Ossetia, Caucasus (42.8◦ N, 44.5◦ E). During this event, a rock-ice avalanche of severalmillion m3 from the north face of the Kazbek massif sheared off the entire Kolka glacier tongue. This combined avalanche rushed 18 kmdown the Genaldon valley. Approximately 100 million m3 of ice and debris were deposited near the village of Karmadon where the avalanchewas stopped by a narrow gorge (Kaab et al., 2003c; Kotlyakov et al., 2004; Haeberli et al., 2005; Huggel et al., 2005). The rivers in the area(blue arrows) were dammed by the avalanche deposits and formed lakes (dark blue line: lake extent as of 27 September 2002; light blue line:lake extent as of 22 October 2002). On the 9 April 2004 image, the rock-ice dam showed already distinct melt and decay structures.
group of change detection techniques are applied. Relatedstrategies include (Schowengerdt, 1997; Kaab, 2004):
– “multitemporal data overlay and comparison”, i.e. in-terpretation of change after individual classifications,where the results from monotemporal image classifi-cations are superimposed (e.g. lakes in Fig. 4, middlepanel).
– “animation”, where repeat images or derived classifi-cations are shown sequentially (so-called ”flickering”)(Kaab et al., 2003b).
– “multitemporal false colour composites” (FCC), wherethe individual channels of a colour image (e.g. red,green, blue) are composed by images of different ac-quisition times. Thereby, radiometric changes betweenthe acquisition times lead to the emphasis or attenuationof individual colour channels in the multitemporal FCCwith respect to the unchanged terrain sections. As a re-sult, changes can become visible as ”unnatural” colours(Fig. 5) (Ostir et al., 2003; Kaab, 2004).
– “image algebra”, (also called band math, or algebraicexpressions), where a change image is computed fromtwo or more multitemporal input images through alge-braic band operations such as band ratios or normaliseddifferences (Schowengerdt, 1997; Huggel et al., 2002;Kaab, 2004, 2005; Paul and Kaab, 2004). For instance,for a multitemporal band ratio ((channel X of image attime 1)/(channel X of image at time 2)) changed imagesections are indicated by ratio values far off the value 1.
– “multitemporal principle component transformation”.A principle component transformation (PCT) computes
1 km
lakes
rock-ice avalanchedeposits
avalanche track
N
Fig. 5. Deposits of the Kolka/Karmadon rock-ice avalanche (seeFig. 4). Change detection is done by a multitemporal RGB-composite. Red: ASTER band 3 of 22 July 2001; green and blue:ASTER band 3 of 13 October 2002. The dashed outline marks theavalanche path running from south to north, the deposits in frontof the gorge at the upper edge of the image, and the lakes, whichwere dammed by the avalanche deposits. Red-coloured changes innorthern slopes are due to different shadow/illumination conditionsbetween the acquisition dates.
536 A. Kaab et al.: Remote sensing of glacier and permafrost hazards
1
10
100
1000
Vertical DTM difference (m)
20% 40% 60% 80% 100%0
Percentage of DTM points
SRTM3 – ASTER 30 m, BhutanSRTM3 – ASTER 120 m, Bhutan
max. 3200 m
max. 1100 m
1
10
100
1000
Vertical DTM difference (m)
20% 40% 60% 80% 100%0Percentage of DTM points
Ref.-DTM – SRTM3, Chico
Ref.-DTM – ASTER, ChicoRef.-DTM – SRTM3, Gruben
Ref.-DTM – ASTER, Gruben
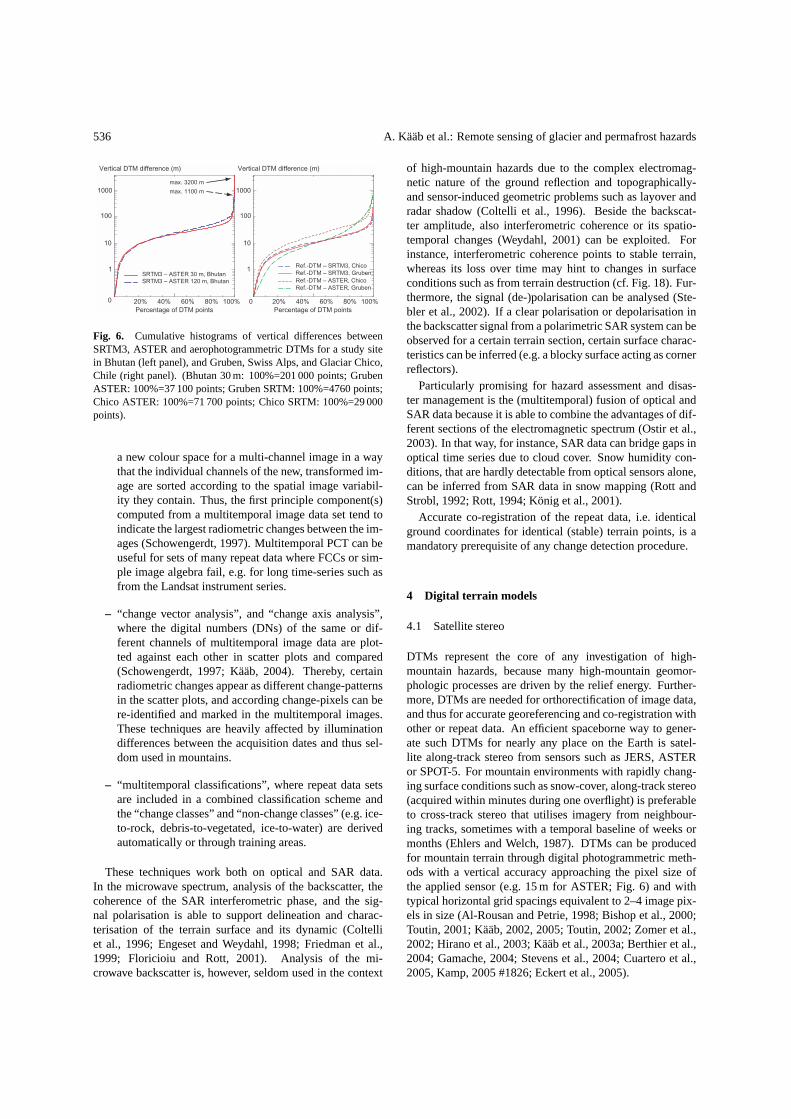
Fig. 6. Cumulative histograms of vertical differences betweenSRTM3, ASTER and aerophotogrammetric DTMs for a study sitein Bhutan (left panel), and Gruben, Swiss Alps, and Glaciar Chico,Chile (right panel). (Bhutan 30 m: 100%=201 000 points; GrubenASTER: 100%=37 100 points; Gruben SRTM: 100%=4760 points;Chico ASTER: 100%=71 700 points; Chico SRTM: 100%=29 000points).
a new colour space for a multi-channel image in a waythat the individual channels of the new, transformed im-age are sorted according to the spatial image variabil-ity they contain. Thus, the first principle component(s)computed from a multitemporal image data set tend toindicate the largest radiometric changes between the im-ages (Schowengerdt, 1997). Multitemporal PCT can beuseful for sets of many repeat data where FCCs or sim-ple image algebra fail, e.g. for long time-series such asfrom the Landsat instrument series.
– “change vector analysis”, and “change axis analysis”,where the digital numbers (DNs) of the same or dif-ferent channels of multitemporal image data are plot-ted against each other in scatter plots and compared(Schowengerdt, 1997; Kaab, 2004). Thereby, certainradiometric changes appear as different change-patternsin the scatter plots, and according change-pixels can bere-identified and marked in the multitemporal images.These techniques are heavily affected by illuminationdifferences between the acquisition dates and thus sel-dom used in mountains.
– “multitemporal classifications”, where repeat data setsare included in a combined classification scheme andthe “change classes” and “non-change classes” (e.g. ice-to-rock, debris-to-vegetated, ice-to-water) are derivedautomatically or through training areas.
These techniques work both on optical and SAR data.In the microwave spectrum, analysis of the backscatter, thecoherence of the SAR interferometric phase, and the sig-nal polarisation is able to support delineation and charac-terisation of the terrain surface and its dynamic (Coltelliet al., 1996; Engeset and Weydahl, 1998; Friedman et al.,1999; Floricioiu and Rott, 2001). Analysis of the mi-crowave backscatter is, however, seldom used in the context
of high-mountain hazards due to the complex electromag-netic nature of the ground reflection and topographically-and sensor-induced geometric problems such as layover andradar shadow (Coltelli et al., 1996). Beside the backscat-ter amplitude, also interferometric coherence or its spatio-temporal changes (Weydahl, 2001) can be exploited. Forinstance, interferometric coherence points to stable terrain,whereas its loss over time may hint to changes in surfaceconditions such as from terrain destruction (cf. Fig. 18). Fur-thermore, the signal (de-)polarisation can be analysed (Ste-bler et al., 2002). If a clear polarisation or depolarisation inthe backscatter signal from a polarimetric SAR system can beobserved for a certain terrain section, certain surface charac-teristics can be inferred (e.g. a blocky surface acting as cornerreflectors).
Particularly promising for hazard assessment and disas-ter management is the (multitemporal) fusion of optical andSAR data because it is able to combine the advantages of dif-ferent sections of the electromagnetic spectrum (Ostir et al.,2003). In that way, for instance, SAR data can bridge gaps inoptical time series due to cloud cover. Snow humidity con-ditions, that are hardly detectable from optical sensors alone,can be inferred from SAR data in snow mapping (Rott andStrobl, 1992; Rott, 1994; Konig et al., 2001).
Accurate co-registration of the repeat data, i.e. identicalground coordinates for identical (stable) terrain points, is amandatory prerequisite of any change detection procedure.
4 Digital terrain models
4.1 Satellite stereo
DTMs represent the core of any investigation of high-mountain hazards, because many high-mountain geomor-phologic processes are driven by the relief energy. Further-more, DTMs are needed for orthorectification of image data,and thus for accurate georeferencing and co-registration withother or repeat data. An efficient spaceborne way to gener-ate such DTMs for nearly any place on the Earth is satel-lite along-track stereo from sensors such as JERS, ASTERor SPOT-5. For mountain environments with rapidly chang-ing surface conditions such as snow-cover, along-track stereo(acquired within minutes during one overflight) is preferableto cross-track stereo that utilises imagery from neighbour-ing tracks, sometimes with a temporal baseline of weeks ormonths (Ehlers and Welch, 1987). DTMs can be producedfor mountain terrain through digital photogrammetric meth-ods with a vertical accuracy approaching the pixel size ofthe applied sensor (e.g. 15 m for ASTER; Fig. 6) and withtypical horizontal grid spacings equivalent to 2–4 image pix-els in size (Al-Rousan and Petrie, 1998; Bishop et al., 2000;Toutin, 2001; Kaab, 2002, 2005; Toutin, 2002; Zomer et al.,2002; Hirano et al., 2003; Kaab et al., 2003a; Berthier et al.,2004; Gamache, 2004; Stevens et al., 2004; Cuartero et al.,2005, Kamp, 2005 #1826; Eckert et al., 2005).
A. Kaab et al.: Remote sensing of glacier and permafrost hazards 537
30 m ASTER DTM 60 m ASTER DTM 25 m aerophot. DTM
ASTER band 3N60 m DTM errors30 m DTM errors
30 m matching score 60 m matching score1 km
DTM errors
Matching score
600 m0 m
1 (high)0 (low)
N
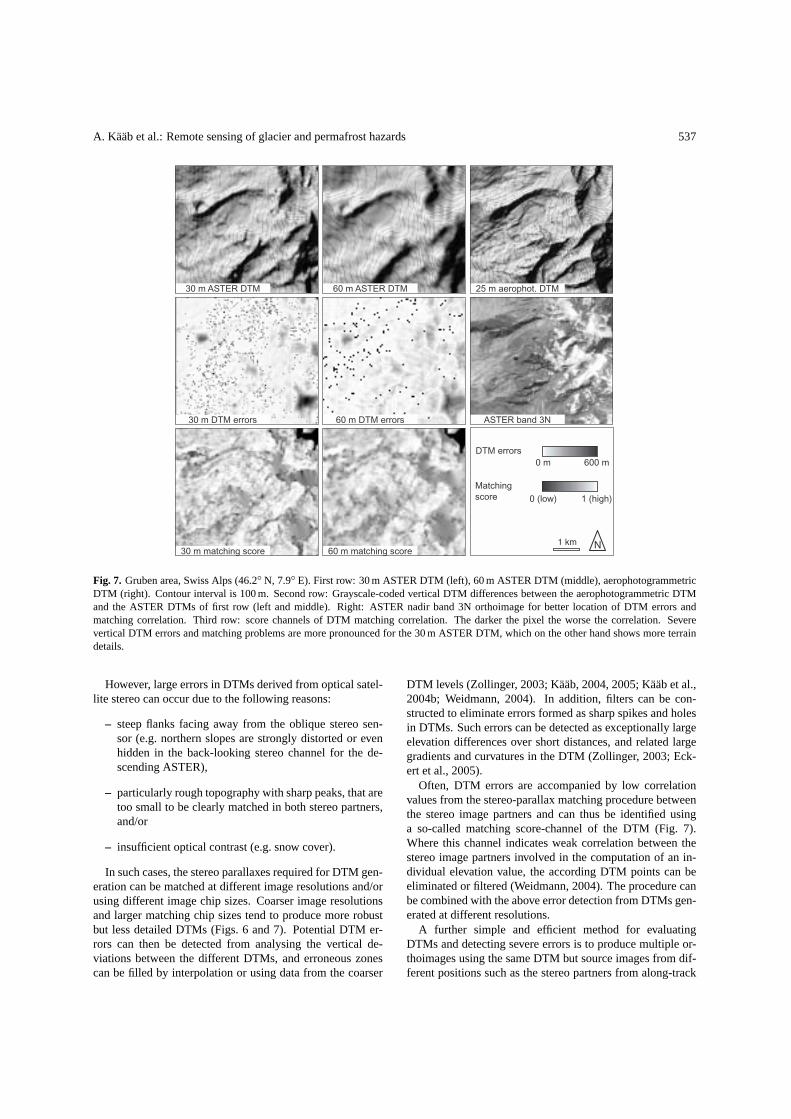
Fig. 7. Gruben area, Swiss Alps (46.2◦ N, 7.9◦ E). First row: 30 m ASTER DTM (left), 60 m ASTER DTM (middle), aerophotogrammetricDTM (right). Contour interval is 100 m. Second row: Grayscale-coded vertical DTM differences between the aerophotogrammetric DTMand the ASTER DTMs of first row (left and middle). Right: ASTER nadir band 3N orthoimage for better location of DTM errors andmatching correlation. Third row: score channels of DTM matching correlation. The darker the pixel the worse the correlation. Severevertical DTM errors and matching problems are more pronounced for the 30 m ASTER DTM, which on the other hand shows more terraindetails.
However, large errors in DTMs derived from optical satel-lite stereo can occur due to the following reasons:
– steep flanks facing away from the oblique stereo sen-sor (e.g. northern slopes are strongly distorted or evenhidden in the back-looking stereo channel for the de-scending ASTER),
– particularly rough topography with sharp peaks, that aretoo small to be clearly matched in both stereo partners,and/or
– insufficient optical contrast (e.g. snow cover).
In such cases, the stereo parallaxes required for DTM gen-eration can be matched at different image resolutions and/orusing different image chip sizes. Coarser image resolutionsand larger matching chip sizes tend to produce more robustbut less detailed DTMs (Figs. 6 and 7). Potential DTM er-rors can then be detected from analysing the vertical de-viations between the different DTMs, and erroneous zonescan be filled by interpolation or using data from the coarser
DTM levels (Zollinger, 2003; Kaab, 2004, 2005; Kaab et al.,2004b; Weidmann, 2004). In addition, filters can be con-structed to eliminate errors formed as sharp spikes and holesin DTMs. Such errors can be detected as exceptionally largeelevation differences over short distances, and related largegradients and curvatures in the DTM (Zollinger, 2003; Eck-ert et al., 2005).
Often, DTM errors are accompanied by low correlationvalues from the stereo-parallax matching procedure betweenthe stereo image partners and can thus be identified usinga so-called matching score-channel of the DTM (Fig. 7).Where this channel indicates weak correlation between thestereo image partners involved in the computation of an in-dividual elevation value, the according DTM points can beeliminated or filtered (Weidmann, 2004). The procedure canbe combined with the above error detection from DTMs gen-erated at different resolutions.
A further simple and efficient method for evaluatingDTMs and detecting severe errors is to produce multiple or-thoimages using the same DTM but source images from dif-ferent positions such as the stereo partners from along-track

538 A. Kaab et al.: Remote sensing of glacier and permafrost hazards
1 km
a b c
d e
ASTER
AerophotogrammetryWeights for fusion
SRTMASTER
ASTER-SRTM fusionSRTM
N
Fig. 8. Fusion between a DTM from ASTER stereo and SRTM. (a)hillshade of an ASTER DTM of the Gruben area, Swiss Alps, de-rived at 60 m resolution; (b) SRTM DTM with data gaps in white;(c) fusion between both DTMs; (d) fusion weights for filling theSRTM gaps with ASTER DTM data (white: SRTM is used, black:ASTER is used; grey: weight of SRTM elevation values with re-spect to ASTER DTM); (e) aerophotogrammetric DTM for com-parison.
stereo. Thereby, vertical DTM errors translate into horizontaldistortions, which become different for different incidenceangles and can thus be easily visualised by animated overlayor other change detection techniques between the differentorthoimages (Kaab, 2004, 2005).
DTMs from satellite stereo show characteristics such asdata gaps, accuracy, etc., that are in parts different from thecharacteristics of InSAR-derived DTMs. It can, therefore,be of particular interest to merge DTMs from satellite stereowith DTMs from satellite InSAR, namely the SRTM DTM,in order to combine the advantages of both sensor types.Such DTM-fusion helps especially in finding severe verti-cal and horizontal DTM errors, and filling data gaps in eitherof the DTMs to be fused. DTM-merging techniques rangefrom replacement of data (Kaab, 2005), weighted fusion re-sulting in smooth transitions between DTMs (Fig. 8) (Wei-dmann, 2004), to merging in support of the DTM process-ing itself (e.g. DTM-approximation in order to geometricallyconstrain stereo parallax matching or interferometric phaseunwrapping) (Honikel, 2002).
Photoclinometry, i.e. the inversion of terrain shading to de-rive terrain geometry (also called ”shade-to-shape” or ”shapefrom shading”) is hardly useful for mountain hazard studiesbecause a constant reflectivity over the terrain is necessary inorder to attribute changes in reflection to terrain slope and as-pect alone (Bindschadler and Vornberger, 2000). Therefore,the technique has been applied to ice sheets.
An important processing step before merging or compar-ing multi-source DTMs is to ensure accurate co-registrationof the multiple data sets. If the original sensor model andorientation is inaccessible, cross-correlation and accordingtransformations between the DTMs to be compared, or be-tween products derived thereof (e.g. orthoimages) is recom-
mended (for more details see below section on elevationchanges).
4.2 Radar interferometry; Shuttle Radar Topography Mis-sion
Sensors in the microwave spectrum are able to overcomelimitations connected to optical sensors, namely the weatherand sunlight dependency. Interferometric synthetic aper-ture radar (InSAR) is used to generate DTMs (Renouard etal., 1995; Toutin and Gray, 2000; Crosetto, 2002). DTMsfrom spaceborne repeat-pass interferometry such as fromENVISAT, ERS-1/2, or Radarsat reach a vertical accuracyin the order of metres and a spatial resolution of tens of me-tres (Renouard et al., 1995; Sties et al., 2000; Crosetto, 2002;Stevens et al., 2003; Strozzi et al., 2003b).
A particularly interesting campaign is the single-passShuttle Radar Topography Mission (SRTM) of February2000, which produced DTMs with about 30 m (1 arc-second,SRTM1) and 90 m (3 arc-seconds, SRTM3) grid size, andwith a vertical accuracy of a few meters to decameters(Fig. 6) (Rabus et al., 2003; Rignot et al., 2003; Stevens etal., 2003; Kaab, 2005). The SRTM covered the continentsbetween 60◦ N and 54◦ S. Where available, the SRTM in-deed represents a revolutionary data set for all kinds of terrainstudies, in particular also for high-mountain hazard assess-ments. However, due to radar shadow, foreshortening, lay-over and insufficient interferometric coherence, the SRTMDTM has significant voids in high mountains (Fig. 8). Insuch cases, we regard the fusion between spaceborne pho-togrammetric DTMs and the SRTM DTM as a promising ap-proach (see previous section on satellite stereo; Fig. 8).
The spatial resolution of airborne SAR DTMs is in the or-der of metres or even less, and their vertical accuracy formountainous terrain lies in the order of decimetres to metres,both depending on the wavelength applied. Current systems(e.g. AeS-1, GeoSAR, TOPSAR) use X- to P-band SAR (i.e.around 3 to 80 cm wavelength) (Vachon et al., 1996; Stevenset al., 2003; Stebler et al., 2004). Airborne InSAR sensorsusually apply single-pass interferometry. However, multipleoverflights with different azimuths may be required to over-come limitations from radar shadow or layover.
4.3 Aerial photogrammetry
Airborne photogrammetry applies similar techniques com-pared to the spaceborne optical methods, though with higheraccuracy due to the better spatial image resolution generallyavailable. The method is still, in most cases, based on ana-logue (i.e. hard-copy) airphotos (Kaab, 2000). Digital pho-togrammetry based on digitised hard-copy images or digi-tal imagery enables automatic DTM and orthoimage genera-tion (Chandler, 1999; Hauber et al., 2000; Kaab and Vollmer,2000; Zhang and Grun, 2004). Related DTMs have, depend-ing on the image scale and pixel size, a vertical accuracy onthe order of centimetres to metres, and a spatial resolution
A. Kaab et al.: Remote sensing of glacier and permafrost hazards 539
on the order of metres to decametres (Baltsavias et al., 1996;Kaab and Vollmer, 2000; Mora et al., 2003).
Aerial photogrammetry is a particularly important tool inview of the existing archives of analogue airphotos, whichrepresent an invaluable source to quantitatively compare tem-poral evolutions (Fox and Nuttall, 1997; Kaab and Vollmer,2000; Weber and Herrmann, 2000; Haeberli et al., 2001;Kaab and Haeberli, 2001; Julio Miranda et al., 2005). Al-though most aerial photographs are taken in an analogueway, digital frame or linear array cameras are increasinglyapplied (Hauber et al., 2000; Grun and Zhang, 2002; Roeret al., 2005). Due to the large technical knowledge and spe-cial equipment needed to handle airborne digital imaging, itis difficult to use this technique worldwide, so far. How-ever, the possibility from digital imaging to generate DTMsand orthophotos nearly in real-time (literally “on the flight”)has, in theory, an important advantage in disaster manage-ment and response.
4.4 Laserscanning (airborne LIDAR)
DTM accuracy similar to the one of airborne photogram-metry can be obtained from airborne laserscanning (or lightdetection and ranging, LIDAR) – a promising techniquein particular for glacier and permafrost monitoring (Faveyet al., 1999; Baltsavias et al., 2001; Geist et al., 2003;Lutz et al., 2003; Janeras et al., 2004). In terms of flightconditions required, laserscanning is comparable to aero-photogrammetry. As an active sensor it provides also goodresults over snow cover, where photogrammetric methodsfail due to the lack of optical contrast. DTMs from laser-scanning have a spatial resolution on the order of meters.The resulting high degree of terrain details represented en-ables new methods of geomorphometric terrain analysis aswell as terrain dynamics analysis. If available – what willbe rarely the case in remote areas, though – laserscanningis a method, which should be considered whenever accurateDTMs and elevation changes are required for hazard assess-ments and disaster management. Airborne laserscanners areincreasingly able to record the signal intensity (Lutz et al.,2003) or are equipped with electro-optical imaging devices,too, enabling combined analyses.
5 Terrain elevation changes (DTM differences)
Terrain elevation changes over time, i.e. vertical differencesbetween repeat DTMs, are indicators for glacial and geomor-phodynamic processes such as glacier fluctuations and massmovements. Thus, their detection can be an important stepof high-mountain hazard assessment and disaster mapping(Kaab, 1996, 2000).
In general, changes in terrain elevation are derived by sub-tracting repeat DTMs. The accuracy of such-derived verticalchanges is, in principle, on the order of the accuracy of therepeat DTMs that are used. If the DTMs compared repre-sent independent measurements, the root mean square error
200 m
N
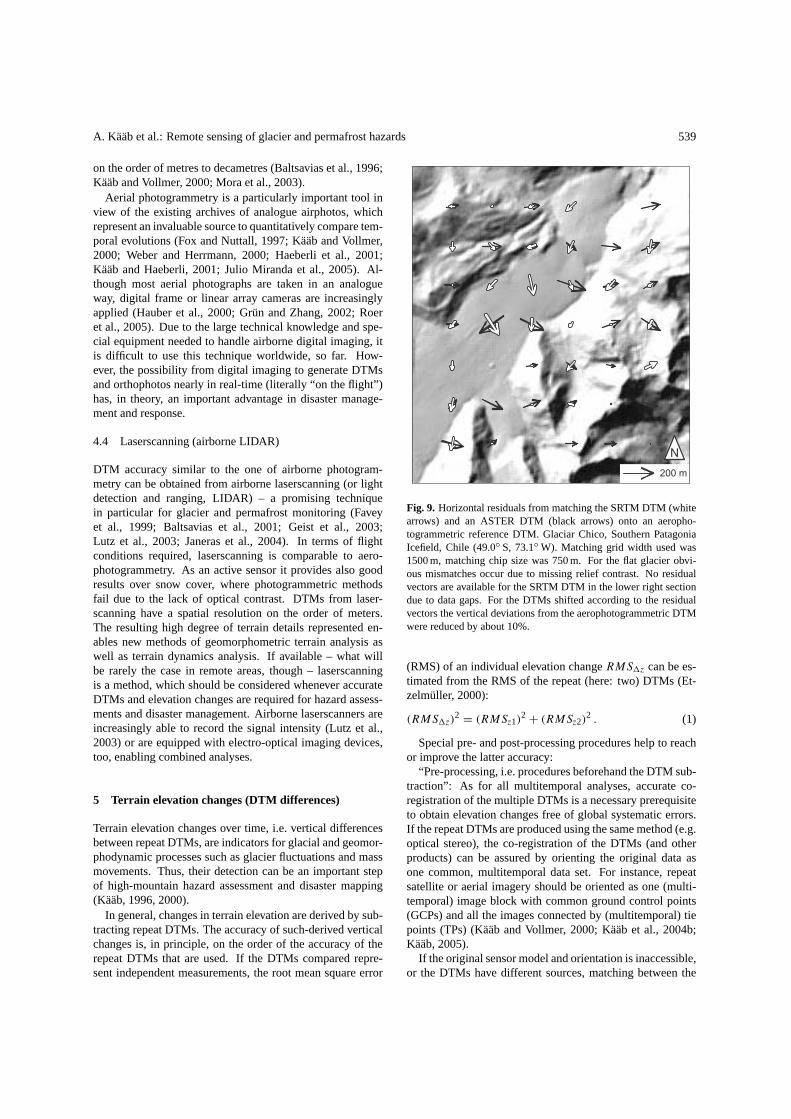
Fig. 9. Horizontal residuals from matching the SRTM DTM (whitearrows) and an ASTER DTM (black arrows) onto an aeropho-togrammetric reference DTM. Glaciar Chico, Southern PatagoniaIcefield, Chile (49.0◦ S, 73.1◦ W). Matching grid width used was1500 m, matching chip size was 750 m. For the flat glacier obvi-ous mismatches occur due to missing relief contrast. No residualvectors are available for the SRTM DTM in the lower right sectiondue to data gaps. For the DTMs shifted according to the residualvectors the vertical deviations from the aerophotogrammetric DTMwere reduced by about 10%.
(RMS) of an individual elevation change RMS�z can be es-timated from the RMS of the repeat (here: two) DTMs (Et-zelmuller, 2000):
(RMS�z)2 = (RMSz1)
2 + (RMSz2)2 . (1)
Special pre- and post-processing procedures help to reachor improve the latter accuracy:
“Pre-processing, i.e. procedures beforehand the DTM sub-traction”: As for all multitemporal analyses, accurate co-registration of the multiple DTMs is a necessary prerequisiteto obtain elevation changes free of global systematic errors.If the repeat DTMs are produced using the same method (e.g.optical stereo), the co-registration of the DTMs (and otherproducts) can be assured by orienting the original data asone common, multitemporal data set. For instance, repeatsatellite or aerial imagery should be oriented as one (multi-temporal) image block with common ground control points(GCPs) and all the images connected by (multitemporal) tiepoints (TPs) (Kaab and Vollmer, 2000; Kaab et al., 2004b;Kaab, 2005).
If the original sensor model and orientation is inaccessible,or the DTMs have different sources, matching between the

540 A. Kaab et al.: Remote sensing of glacier and permafrost hazards
1000 2000 30000 25001500 3500500
1800
1900
2000
2100
2200
2300
2400
2500
260012 Oct 19952 Sep 19996 Sep 200111 Oct 2001
Ele
vatio
n (m
a.s
.l.)
Distance (m)
Fig. 10. Repeated longitudinal surface profiles over Ghiacciaiodel Belvedere (45.9◦ N, 7.9◦ E). The position of the summer 2002supraglacial lake is indicated schematically. Since autumn 2000 theglacier experienced a surge-type movement with severe glacial haz-ards associated (Haeberli et al., 2002; Kaab et al., 2003c, 2004a)(see also Fig. 13).
individual DTMs to be compared is recommended. Throughcross-correlation techniques the vertical and horizontal shiftsof selected sections of the “slave DTM” with respect to the“master-DTM” can be measured so that the vertical differ-ences between the DTMs to be co-registered become min-imal for the stable terrain sections. From these shift vec-tors (Fig. 9) an optimal horizontal and vertical shift, rotation,scale, etc., between the DTMs to be compared can be com-puted and the “slave DTM” transformed accordingly (Pil-grim, 1996a, b; Li et al., 2001; Weidmann, 2004). The cross-correlation focuses on stable terrain with sufficient relief (i.e.topographic contrast). Alternatively, also products of theDTMs can be matched, for instance orthoimages (Berthieret al., 2004), or DTM derivatives such as slope or curvaturemaps, or edge-filtered DTMs.
“Post-processing of the elevation differences”: Once theraw differences between repeat DTMs are computed it is of-ten necessary to filter the elevation differences obtained, be-cause the noise in the derived differences is larger than inthe original DTMs (see Eq. 1) (Etzelmuller, 2000; Kaab,2004). The task is to define a noise model adapted to the na-ture of the process under investigation. For instance, thick-ness changes of a debris-free glacier are expected to showa smooth spatial variability so that a coarse filter might beapplied. Coarse filters are less suited for mass movementssuch as landslides with a high spatial variability and withmany secondary local terrain movements overlain, becausethe filter tends to remove important “real” signals. In gen-eral, low-pass filters exist in the spatial domain (e.g. median,medium, Gauss, etc.) or for the spectral domain (e.g. fourieror wavelet) (Kaab et al., 1997; Gudmundsson and Bauder,1999; Etzelmuller, 2000; Kaab, 2004).
A well-established method for detecting terrain elevationchanges is the subtraction of repeat aero-photogrammetric
50 m 200 m
1 m a-1
– 1.0 m a-1
+ 0.3 m a-1
0 m a-1
2800
2900
glacier tongue
ice -
lakedammed
N
Fig. 11. Gruben rockglacier, Swiss Alps (46.2◦ N, 7.9◦ E). Overlayof the horizontal surface velocities (vectors) and the colour-codedchanges in elevation, both for 1970 to 1995. The multitemporalthree-dimensional data merging clearly reveals differences withinthe rockglacier in terms of dynamics and thermal equilibrium. Tothe north-east, a patchy distribution of horizontal velocities and highrates of thaw settlement indicate dead ice occurrences that are notin thermal equilibrium. To the south-west, a coherent flow field andalmost constant thickness point to creeping permafrost in thermalequilibrium (Kaab et al., 1997). The lakes on Gruben rockglacierwere subject to hazard assessments and mitigation measures (Hae-berli et al., 2001).
DTMs. A large number of applications exists ranging from,for instance, measuring glacier thickness changes (Fig. 10)(Benson and Follet, 1986; Fox and Nuttall, 1997; Kaab andFunk, 1999; Kaufmann and Plosch, 2000; Jiskoot et al.,2001; Julio Miranda and Delgado Granados, 2003), volumesof deposited materials (Clague and Evans, 2000), permafrostagradation (i.e. development of ice lenses and connectedfrost heave) or degradation (e.g. melt-out of ground ice andconnected thaw settlement) (Kaab et al., 1997), develop-ment of thermokarst processes or many types of peri- andparaglacial slope instabilities (Fig. 11) (Kaab, 2000, 2004;Kaab and Vollmer, 2000). Repeat laserscanning will increas-ingly be applied for similar studies (Geist et al., 2003).
Compared to airborne techniques, elevation changes fromrepeat satellite stereo can only be measured for a limitednumber of geomorphodynamic processes due to the reducedaccuracy of the according DTMs. Nevertheless, the accu-racy obtained might be sufficient to detect and quantify largechanges in terrain geometry, such as from avalanche depositsor glacier mass changes (Fig. 12) (Berthier et al., 2004; Kaab,2004).
Sometimes, also differential SAR interferometry (DIn-SAR) can be used to detect vertical terrain changes (e.g.Bjornsson et al., 2001). However, strictly speaking thistechnique does track three-dimensional terrain surface shifts

A. Kaab et al.: Remote sensing of glacier and permafrost hazards 541
rather than elevation changes at fixed positions. The tech-nique is therefore covered in the following section.
6 Surface displacements
Terrain movements can directly pose a hazard (e.g. land-slides) or provoke follow-up processes, which then developinto hazards (e.g. river damming by a glacier surge). Themeasurement of terrain displacements from repeat imagedata can thus support high-mountain hazard assessments(Powers et al., 1996; Kaab et al., 1997; Knizhnikov et al.,1998; Kaab and Funk, 1999; Weber and Herrmann, 2000;Jiskoot et al., 2001; Kaab, 2002; Casson et al., 2003; Dela-court et al., 2004).
If digital image correlation techniques are used, the mea-surements are possible at a horizontal accuracy on the orderof the pixel size of the sensor applied (Kaab, 2002). Sub-pixel accuracy can be reached as well but is often limited bychanges in terrain and illumination conditions between therepeat data acquisitions. Image matching techniques can beapplied equally to terrestrial photos, air photos, optical satel-lite images, SAR images (Michel and Rignot, 1999; Strozziet al., 2002) or high-resolution DTMs (e.g. derived fromlaserscanning, or aerophotogrammetry). Depending on thedata and technique employed either the horizontal compo-nent of the surface displacement is measured or the fullythree-dimensional surface displacement vector (Kaufmannand Ladstadter, 2002; Kaab, 2004).
The rate of terrain movement, which can be detected ata statistically significant level of accuracy, depends amongothers on the image pixel size, the temporal baseline, andthe terrain preservation between the repeated data acquisi-tions. From air and high-resolution satellite images slopeinstabilities such as rock mass movements, or permafrostcreep can be detected (i.e. movement rates in the order ofcm to m per year; Figs. 11, 14 and 15) (Kaab, 2002; Dela-court et al., 2004). Comparably fast movements, in particularglacier flow (i.e. rates of tens to hundreds of metres per year),can be sometimes quantified from airphotos (Fig. 13), butalso from medium-resolution satellite imagery (e.g. Land-sat ETM+, ASTER) (Figs. 16 and 17) (Kaab, 2002, 2005;Dowdeswell and Benham, 2003; Skvarca et al., 2003; Kaabet al., 2004b; Berthier et al., 2005).
Differential InSAR (DInSAR) enables measuring slow ter-rain movement with an accuracy of a few millimetres. Ap-plicability of the method depends on terrain topography andSAR imaging geometry, leading to areas of missing infor-mation in layover and shadow, and on preservation of in-terferometric coherence (Ferretti et al., 2001; Nagler et al.,2002; Eldhuset et al., 2003; Strozzi et al., 2004). Coherenceis usually lost when, among others, the terrain is destruc-ted or the surface humidity changes significantly (Weydahl,2001). In high mountains the presence of snow and its tem-poral changes have significant influence on the electromag-netic response in the microwave spectrum. Related interfero-metric de-correlation effects can be avoided by short tempo-
0-30 m
30-60 m
60-90 m
90-120 m
120-150 m
1 km
N
Fig. 12. Thickness of the 20 September 2002 avalanche depositsat Karmadon computed from ASTER DTMs of 22 July 2001 and6 October 2002. The strong elevation changes to the upper rightcorner are due to errors in the ASTER DTMs in steep slopes (seealso Figs. 4 and 5).
ral baselines, when the observed terrain movements are fastenough to be detectable over such short periods (see Fig. 18).DInSAR directly provides the line-of-sight displacement, i.e.the projection of the actual terrain displacement vector onthe line between terrain point and sensor. Except for highlatitudes, where ascending and descending satellite-track az-imuths are significantly different, the line-of-sight displace-ment cannot be well decomposed into horizontal components(Joughin et al., 1999). The horizontal and vertical displace-ment components can be separated by combining the line-of-sight displacements measured from ascending and descend-ing orbits, at least in theory. In mountain areas such pro-cedure is often hindered by the fact that slopes which arewell visible from the ascending orbit lie in shadow or lay-over in the descending orbit, and vice versa. The vertical andhorizontal components have rather to be estimated or mod-elled from the type of terrain movement under investigation(Wang and Li, 1999; Strozzi et al., 2001). Typical DInSARapplications in high-mountains are the detection of rock massmovements, glacier flow and permafrost creep (Figs. 18 and19) (Fruneau et al., 1996; Rignot et al., 1996; Mattar et al.,1998; Joughin et al., 1999; Rott et al., 1999; Ferretti et al.,2001; Kenyi and Kaufmann, 2001; Nagler et al., 2002; Eld-huset et al., 2003; Forster et al., 2003; Squarzoni et al., 2003;Strozzi et al., 2004).
For glacier hazard assessments, DInSAR and optical im-age matching methods for deriving terrain movement arehighly complementary in terms of accuracy and applicabil-ity. As a very general rule, DInSAR has the potential to workwhere image matching fails, and vice versa (Kaab, 2004).

542 A. Kaab et al.: Remote sensing of glacier and permafrost hazards
200 m 1 km
Lago Lago delle Loccedelle Locce
Rifugio Rifugio ZamboniZamboni
BelvedereBelvedere
100
100
100100
100100
160160
200200
112112 104104108108 108 92
981021023838
3737
43433535
3232
N
Fig. 13. Surface velocity field on Ghiacciaio del Belvedere, Italian Alps, between 6 September 2001 and 11 October 2001. Underlyingorthoimage of 11 October 2001 (original air-photo © CNR-IRPI/Glaciorisk). The black numbers and isolines indicate the glacier speedsof the autumn 2001 period. The large white numbers (92–112 m a−1) give speeds at selected points between 2 September 1999 and 6September 2001; the smaller white numbers (32–43 m a−1) indicate speeds from 12 October 1995 to 2 September 1999. Speeds are givenin metres per year.
7 Detection of hazard sources
A natural hazard can be defined by (a) the kind of physi-cal process involved, (b) the magnitude of the event, and (c)its probability or frequency. The detection of potential haz-ard sources and their characterisation is, therefore, an im-portant first step in assessing glacial, peri- and paraglacialhazards. According to the complex nature of high-mountainprocesses, multidomain (or multidimensional) classificationapproaches that integrate spatial, spectral and temporal infor-mation are most promising for that task. No detailed rules forsuch multidomain classifications can be given due to the va-riety of specific requirements. In general, however, the com-bination of a single or repeat DTM(s) with (possibly multi-temporal) multispectral data is a particularly powerful toolfor detecting potential high-mountain hazard sources.
Selected examples:
– Steep glaciers, a frequent source of ice break-offs andice avalanches, can be detected on a regional scalethrough the combination of a multispectral glacier clas-sification with the DTM slope. The result is a map ofsteep glaciers, i.e. glaciers above a certain slope thresh-old (Fig. 20) (Salzmann et al., 2004).
– A texture analysis based on high-resolution satellite (oraerial) imagery combined with DTM slope helps to de-tect steep, and possibly frozen, debris slopes prone todebris flow initiation (Huggel et al., 2004c).
– Glacier slope, extent of debris cover, thickness changesand ice velocities can help to estimate the evolution of
ice-marginal lakes or detecting glacier zones prone tothe development of supraglacial lakes (Fig. 21) (Paul etal., 2004a; Kaab, 2005).
– Glacier length changes, possibly resulting in a changeof ice-avalanche hazard or in proglacial lakes, can betracked from multitemporal and -spectral classification(Paul, 2002; Paul et al., 2004a).
– Similarly, the (change in) ice cover on glacier-clad vol-canoes can be detected from (repeat) multispectral im-agery or aerophotogrammetry. Ice volumes situated onvolcanoes can be an important factor for devastating la-hars, in particular in connection with volcanic activity(Benson and Follet, 1986; Major and Newhall, 1989;Julio Miranda et al., 2005).
– Freshly deglaciated terrain sections (detectable bymulti-temporal and -spectral ice classification) of rockwalls (detectable through steep DTM slope, missingvegetation, and possibly texture analysis) indicate zonesof potentially enhanced rockfall activity due to the ther-mal, mechanical, hydraulic and hydrological conse-quences accompanying glacier retreat (Haeberli et al.,1997).
A second class of multidomain classifications utilises notonly the remotely sensed data itself, but also the outputs fromprocess models, which might in turn be fed by remote sens-ing data. For instance, mountain permafrost distribution ishighly dependent on elevation (as a surrogate for air temper-ature) and direct incoming solar radiation. The latter can bemodelled based on a DTM (Hoelzle, 1996). A permafrost

A. Kaab et al.: Remote sensing of glacier and permafrost hazards 543
distribution map is then a valuable requisite for detectingpossible slope instabilities connected to permafrost or per-mafrost thaw in debris or rock slopes (Zimmermann et al.,1997; Noetzli et al., 2003). As a second example, potentiallydebris-producing rock walls can be approximated as steepDTM sections without vegetation. Rockfall modelled fromsuch terrain sections can then support remote sensing-baseddetection of debris slopes (Zemp et al., 2005).
8 Modelling of hazard potentials
Once potential hazard sources have been detected, massmovement models help estimating potentially affected zones.The most important prerequisite of such models is a DTM,best obtained through remote sensing. This relates to theimportance of topography for controlling mass-movementdownslope propagation. Further, remote sensing sup-ports mass movement modelling by providing model in-puts through image classification such as surface cover, sur-face roughness, material to be potentially mobilised, etc.Types of mass movement models applied to glacial, peri- andparaglacial hazards are (Huggel, 2004):
– “empirical rules and models”, where important parame-ters such as maximum discharge of lake outbursts, start-ing slope and volume of ice avalanches, or maximumtravel distances for glacier floods, debris flows, or iceand rock avalanches are statistically estimated from ac-cording events (e.g. Huggel et al., 2004a). Some ofthese parameters can be derived through remote sens-ing data from before and/or after an event (e.g. Figs. 4and 12).
– “numerical models”, where the governing physics of amass movement type are typically represented by differ-ential equations, which are then solved through numeri-cal methods such as numerical integration, finite differ-ences or finite elements. Other models of the numericaltype simulate, for instance, the forces and related move-ment of point masses (e.g. Bottino et al., 2002). Re-motely sensed data are often used to define the boundaryconditions of numerical models (e.g. terrain geometry,velocities; Figs. 10–19).
– “probabilistic models”, which result in the probabil-ity of a certain action, for instance related to geomor-phometric parameters such as slope, slope length, etc.(Mostyn and Li, 1993; Harbitz et al., 2001). Alterna-tively, a mass movement is modelled by many repeatruns with changing starting, transition and depositionconditions (so-called Monte Carlo models) (Gamma,2000; Barbolini and Savi, 2001). The resulting patternof how often a terrain cell is hit by the mass movementreflects then some kind of probability. A similar class ofmodels aims to estimate the possibility of an event, forinstance through fuzzy logic. Typically, remote sensing-derived DTMs form the base for probabilistic models.
2500 2500
26002600
N2 m a-1 100 m100 m
1975 1987
20011993
Fig. 14. Instability of a rockglacier terminus, Turtmanntal, SwissAlps (46.2◦ N, 7.7◦ E). Upper panel: velocity vectors measuredfrom airphotos of 1987 and 1993; lower panels: orthophotos ofthe terminus section of the rockglacier. Images of 1975, 1987, and1993 are courtesy of swisstopo; the 2001 image is a linear arrayCCD (pushbroom) image taken by the HRSC-A camera, courtesyof Department of Geography, University of Bonn. The rockglacierinstability led to enhanced rockfall and required construction of aprotection dam (not depicted) (see also Roer et al., 2005).
– “hydrological flow-routing models”, where the massmovement is for the most part purely gravity-driven.Different approaches exist how the (maximum) slopeis determined, which decides about the flow direction
544 A. Kaab et al.: Remote sensing of glacier and permafrost hazards
2000
1800
1600
1976
1995
50m 200m
2 m1960s-70sslope failure
N
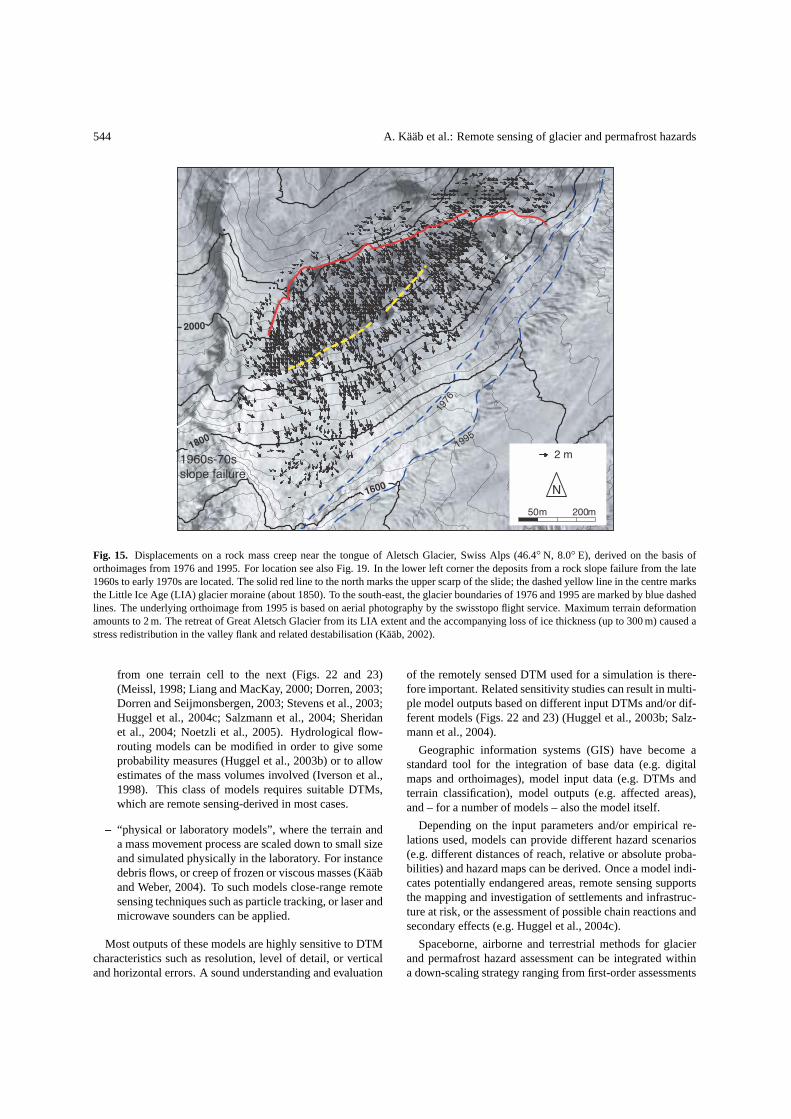
Fig. 15. Displacements on a rock mass creep near the tongue of Aletsch Glacier, Swiss Alps (46.4◦ N, 8.0◦ E), derived on the basis oforthoimages from 1976 and 1995. For location see also Fig. 19. In the lower left corner the deposits from a rock slope failure from the late1960s to early 1970s are located. The solid red line to the north marks the upper scarp of the slide; the dashed yellow line in the centre marksthe Little Ice Age (LIA) glacier moraine (about 1850). To the south-east, the glacier boundaries of 1976 and 1995 are marked by blue dashedlines. The underlying orthoimage from 1995 is based on aerial photography by the swisstopo flight service. Maximum terrain deformationamounts to 2 m. The retreat of Great Aletsch Glacier from its LIA extent and the accompanying loss of ice thickness (up to 300 m) caused astress redistribution in the valley flank and related destabilisation (Kaab, 2002).
from one terrain cell to the next (Figs. 22 and 23)(Meissl, 1998; Liang and MacKay, 2000; Dorren, 2003;Dorren and Seijmonsbergen, 2003; Stevens et al., 2003;Huggel et al., 2004c; Salzmann et al., 2004; Sheridanet al., 2004; Noetzli et al., 2005). Hydrological flow-routing models can be modified in order to give someprobability measures (Huggel et al., 2003b) or to allowestimates of the mass volumes involved (Iverson et al.,1998). This class of models requires suitable DTMs,which are remote sensing-derived in most cases.
– “physical or laboratory models”, where the terrain anda mass movement process are scaled down to small sizeand simulated physically in the laboratory. For instancedebris flows, or creep of frozen or viscous masses (Kaaband Weber, 2004). To such models close-range remotesensing techniques such as particle tracking, or laser andmicrowave sounders can be applied.
Most outputs of these models are highly sensitive to DTMcharacteristics such as resolution, level of detail, or verticaland horizontal errors. A sound understanding and evaluation
of the remotely sensed DTM used for a simulation is there-fore important. Related sensitivity studies can result in multi-ple model outputs based on different input DTMs and/or dif-ferent models (Figs. 22 and 23) (Huggel et al., 2003b; Salz-mann et al., 2004).
Geographic information systems (GIS) have become astandard tool for the integration of base data (e.g. digitalmaps and orthoimages), model input data (e.g. DTMs andterrain classification), model outputs (e.g. affected areas),and – for a number of models – also the model itself.
Depending on the input parameters and/or empirical re-lations used, models can provide different hazard scenarios(e.g. different distances of reach, relative or absolute proba-bilities) and hazard maps can be derived. Once a model indi-cates potentially endangered areas, remote sensing supportsthe mapping and investigation of settlements and infrastruc-ture at risk, or the assessment of possible chain reactions andsecondary effects (e.g. Huggel et al., 2004c).
Spaceborne, airborne and terrestrial methods for glacierand permafrost hazard assessment can be integrated withina down-scaling strategy ranging from first-order assessments

A. Kaab et al.: Remote sensing of glacier and permafrost hazards 545
1 km
10010040
50
50
60006000
5500
5500
N
Fig. 16. Horizontal surface velocities on a glacier (name unpub-lished) at the northern slope of the Bhutan Himalaya towards theTibet plateau (28.2◦ N, 90.0◦ E), derived from ASTER data of 20January 2001 and 20 November 2001. Speed isolines are in m peryear. Contour lines are in m a.s.l. and derived from the SRTMDTM. The dotted line at the calving front marks its position in01/2001; the bold line is the 11/2001 position. Ice flux is an im-portant factor influencing the development of proglacial ice-contactlakes.
1 km
< 200
500
1000
1500 m
N
Fig. 17. Velocity field for a section of Mittie glacier, Manson icecap, Ellesmere Island, Canadian High Arctic (76.7◦ N, 79.2◦ W),computed from Landsat ETM+ pan orthoimagery of 13 July 1999and 27 June 2000. Displacements amount up to 1500 m. Originalmeasurements were performed with 100 m spacing, but are depictedwith 200 m spacing for better readability. Mittie glacier was surgingduring the observation period (Copland et al., 2003). The Landsatimagery was processed and provided by Luke Copland, Departmentof Earth and Atmospheric Sciences, University of Alberta, Edmon-ton.
with regional coverage towards detailed local investigations.Even when dealing with local problems such as known haz-ard sources or disaster management, regional-scale first-order assessments should be part of hazard assessments inhigh mountains in order to account for hazard combinations,
1 km1 km N
Fig. 18. Differential Interferometric Synthetic Aperture Radar(DInSAR) interferograms over the Gruben area, Swiss Alps (seeFig. 11). Upper panel: glacier flow (arrows) as detected from anERS 1/2 pair of 7–8 March 1996 (maximum speed on the orderof 10–20 cm d−1). Lower panel: rockglacier creep (arrows) as de-tected from a JERS pair of 21 June 1996–17 September 1996 (maxi-mum speed on the order of 50 cm a−1) (Strozzi et al., 2003a; Strozziet al., 2004). One colour cycle indicates a displacement of about2.8 cm for ERS, or 11.5 cm for JERS, in the line-of-sight direction,i.e. in approximately east-west direction. Background map by per-mision of Swisstopo BA024706. For the interferogram with a 1-daytemporal baseline (upper panel) the comparable fast glacier flowcan well be detected, whereas the slow permafrost creep gives nomovement signal. On the other hand, the permafrost creep can wellbe detected in the interferogram with an 88-day temporal baseline,where interferometric phase de-correlation prevails on the glaciersdue to snow- and ice-melt and due to too large displacements.
chain reactions, and secondary hazards. In particular satelliteremote sensing is the method of choice for such work.
9 Disaster management
Above section relates to hazards, i.e. potential processes, thefollowing section to actions after a catastrophic event. Inte-grating remote sensing in the management of glacier- andpermafrost-related disasters can serve three major applied

546 A. Kaab et al.: Remote sensing of glacier and permafrost hazards
< -10 cm > +2cm
500 m500 m
N
N500 m
Fig. 19. Aletschwald, Swiss Alps (46.4◦ N, 8.0◦ E). Upper panel:displacement magnitude map for a time interval of 1144 days (17June 1993–4 August 1996) derived from repeat JERS SAR data.Displacement direction is assumed to be down-slope to the north-west. As yet the site has not been investigated in detail. However,a number of comparable movements situated nearby and studied al-ready (see lower panel) hint to rock-slope creeping to be the causefor the displacements observed. Lower panel: Tongue of AletschGlacier with white rectangles indicating the location of this DIn-SAR study (lower rectangle) and the photogrammetric study Fig. 15(upper rectangle).
and scientific needs: (i) overview of disaster and damage ex-tent, (ii) frequent monitoring, and (iii) documentation. (i)and (ii) are directed towards search and rescue operationsand civil protection, and primarily require a rapid and re-peat data acquisition and processing (e.g. Kaab et al., 2003c).Due to the limitations of optical remote sensing during cloudcover and night time, the application of (repeat) weather-and sun-independent SAR data can be especially important(Kerle and Oppenheimer, 2002). The major problems re-lated to (i) and (ii) are the enduser-capacity to handle andanalyse the data, and the speed of data acquisition and deliv-ery. Remotely sensed documentation of a disaster (iii), evenif the data are not analysed immediately, can be an uniquesource for thoroughly investigating the processes involved,and drawing scientific and applied conclusions of broader in-terest (Huggel et al., 2005).
The International Charter “Space and Major Disasters” of-fers potentially important remote-sensing support for man-
1 km 5 km N
Fig. 20. Steep glaciers as determined by a combination of a thresh-olded ASTER band 3/ASTER band 4 ratio-image and a thresholdedslope map with slope greater than 30◦ (Unteraar Glacier, SwissAlps, 46.6◦ N, 8.2◦ E). The image resulting from this procedure wascoloured red and the intensity component taken from ASTER band3. As a result glaciers steeper than 30◦ appear red in the figure. De-tection of steep glaciers is e.g. a prerequisite for the modelling ofice-avalanche hazard potentials. According to empirical investiga-tions in the Swiss Alps cold glaciers produce ice avalanches froma minimum bed slope of 45◦, temperate glaciers from 25◦ (Alean,1985; Salzmann et al., 2004).
aging large glacier and permafrost disasters. Within thiscontract, a number of space agencies and commercial satel-lite companies provide under certain circumstances rapidand free emergency imaging. Currently involved sen-sors include ENVISAT, ERS, IRS, Radarsat, or SPOT.Only selected national and international civil protection,rescue and security authorities can activate the Charter(www.disasterscharter.org). Also, the ASTER sensor on-board the Terra spacecraft can be activated for supportingdisaster management (Kaab et al., 2003c).
10 Conclusions and perspectives
Remote sensing will increasingly become an important andintegrative component of managing glacier and permafrosthazards. In this contribution we give an overview of air- andspaceborne techniques available to support the assessment ofglacier and permafrost hazards. We evaluate their potentialand limitations by means of various case studies.
The best-established and most robust remote-sensingmethod for detailed investigations considered in this workis aerophotogrammetry, which enables image interpreta-tion, DTM generation, and displacement measurement with

A. Kaab et al.: Remote sensing of glacier and permafrost hazards 547
N
Debris-free ice
Debris-covered ice1 km 5 km
Fig. 21. Automatic mapping of debris-covered ice from mergingspectral data and DTM-slope (46.4◦ N, 7.9◦ E). Areas that (1) havea slope <23◦, (2) are not vegetated according to the normalized dif-ference vegetation index (NDVI), and (3) are in direct contact withdebris-free ice as mapped from a thresholded ratio-image (LandsatTM band 4/Landsat TM band 5) are classified as debris-covered ice(Paul, 2004). The black glacier outlines are taken from the 1973Swiss glacier inventory (Maisch et al., 1999). Often, the distribu-tion of supraglacial lakes is connected to flat, debris-covered glaciertongues.
centimetre- to metre-accuracy. For regional scale investiga-tions and/or areas that are inaccessible on ground and by air-borne platforms, spaceborne optical remote sensing is thetool, which works most robust and is most easily applied.This method enables (semi-)automatic classifications, mea-surement of strong and large-scale displacements, and forcertain instruments also DTM generation – all with an accu-racy on the order of metres to tens of metres. Air- and space-borne photogrammetry are presently converging through theadvent of high-resolution space sensors.
SAR data have a large potential to overcome some limi-tations of optical data, or to complement results from opti-cal data (e.g. DTM generation, displacement measurementwith millimetre-accuracy). Thus, the SRTM DTM indeedsignificantly facilitates hazard assessments in remote high-mountain areas. However, the dissemination of expertiseabout SAR technology has to be improved, and the analy-sis methods have to become more robust and cheaper in or-der to facilitate the widespread application of the techniqueto glacier and permafrost hazard in mountains. Further re-search is in particular needed to better understand the com-plex microwave backscatter and to retrieve information aboutthe surface and its changes from this backscatter.
1 km
1931 rock-ice avalanche
MSFD model
FLOWROUTE modelAvalanche starting
N
Fig. 22. Models of the 1931 rock-ice avalanche from Fletschhorn,Simplon, Swiss Alps (46.2◦ N, 8.0◦ E). Blue outline: actualavalanche path; yellow to red zone: modified single flow direc-tion model (Huggel et al., 2003b; Noetzli, 2003; Noetzli et al.,2005); blue zones: mass movement model based on energy con-servation and impulse; pink zones: as blue zones, but resampledDTM (Schlaefli, 2005).
Air- and spaceborne remote sensing offers support forassessing the hazard disposition (i.e. the hazard potential),rather than enabling the observation of trigger conditions andthe direct short-term forecast of events. In rare occasions, anexception of this general rule might be high-frequency imag-ing (e.g. monitoring of meteorological events, Kniveton etal., 2000; Buchroithner, 2002). However, the early warn-ing from impending disasters is an ultimate, long-term goalof earth observation from space and air, and of the relatedtechnological development. For the estimation of event mag-nitude and frequency remote sensing data have typically tobe combined with models and/or empirical data.
A major factor currently limiting the accuracy and applica-bility of spaceborne sensors for glacier and permafrost haz-ards is their spatial resolution. Data from high-resolutionsensors such as IKONOS, QuickBird or Orbview3 open newpossibilities in this respect, but are still very expensive andonly able to cover small areas. An increasing number ofsatellites with SAR instruments onboard such as ERS-2,Radarsat-1, ENVISAT or the planned TerraSAR-X, ALOSand Radarsat-2, will make SAR a progressively interestingtool for glacier and permafrost hazard assessments.
Spaceborne methods are clearly preferable, or even theonly possibility, to obtain base data for regional-scale glacierand permafrost hazard assessments in mountains. Their lim-itations with respect to spatial resolution and accuracy makethese methods rather applicable for the detection of hazardpotentials, or for the level of hazard indication maps (scales1:25 000–1:50 000). For more detailed hazard assessments,

548 A. Kaab et al.: Remote sensing of glacier and permafrost hazards
2 km
N
Fig. 23. Simulated lahars from the west flank of the ice-clad Iz-taccihuatl volcano, Mexico (19.2◦ N, 98.7◦ W). Background hill-shade with colour-coded elevations and topographic base of bothmodel runs is from the SRTM3 DTM. Upper panel: the modifiedsingle flow model MSF (Huggel et al., 2003b) initiated at the vol-cano top and stopped at 19% overall slope. Lower panel: the LA-HARZ model (Iverson et al., 1998) with volumes of 100 000 m3
(red), 500 000 m3 (orange), and 1 000 000 m3 (yellow) starting atthe so-called high-energy cone of the volcano (white outline).
above-presented airborne methods, high-resolution space-borne methods, or terrestrial surveys are necessary.
Modern space technologies enable initial estimation ofhazard potentials to be performed by virtually everyone andeverywhere, independent of political and geographical re-strictions. This fundamental “democratisation” process re-lated to high-mountain (and other) hazards involves a num-ber of new opportunities, dangers and responsibilities for thepublic, the authorities in charge, and the experts involved.Hazard assessment based on spaceborne remote sensing has,
therefore, to follow certain rules considering these responsi-bilities and the consequences of their disregard. Accordingrecommendations are presently compiled by the internationalworking group on glacier and permafrost hazards in moun-tains by the Commission on Cryospheric Sciences (CCS) andthe International Permafrost Association (IPA).
Acknowledgements. Special thanks are due to M. Chiarle andan anonymous referee for their helpful comments. The ASTERscenes used in the presented studies were provided within theframework of the Global Land Ice Measurements from Spaceproject (GLIMS) through the EROS data center, and are courtesy ofNASA/GSFC/METI/ERSDAC/JAROS, and the US/Japan ASTERscience team. The airphotos used for the Gruben and Aletschstudies are courtesy of the swisstopo flight service. ERS SAR datacourtesy AO3-178, © ESA; JERS SAR data courtesy J-2RI-001, ©NASDA; processing GAMMA, Berne. Some of the studies wereconducted for, or in close co-operation with the Swiss Agencyfor Development and Cooperation (SDC), the Macugnaga studiesin co-operation with the regional and national civil protectionauthorities.
Edited by: F. GuzzettiReviewed by: M. Chiarle and another referee
References
Ageta, Y., Iwata, S., Yabuki, H., Naito, N., Sakai, A., Narama,C., and Karma: Expansion of glacier lakes in recent decades inthe Bhutan Himalayas, in: Debris-Covered Glaciers, edited by:Nakawo, M., Raymond, C. F., and Fountain, A., IAHS Publica-tion, 264, 165–175, 2000.
Al-Rousan, N. and Petrie, G.: System calibration, geometric accu-racy testing and validation of DEM & orthoimage data extractedfrom SPOT stereopairs using commercially available image pro-cessing systems, International Archives of Photogrammetry &Remote Sensing, 34, 4, 8-15, 1998.
Albert, T.: Evaluation of remote sensing techniques for ice-areaclassification applied to the tropical Quelccaya ice cap, Peru, Po-lar Geography, 26, 3, 210–226, 2002.
Alean, J.: Ice avalanche activity and mass balance of high-altitudehanging glaciers in the Swiss Alps, Annals of Glaciology, 6,248–249, 1985.
Aniya, M., Sato, H., Naruse, R., Skvarca, P., and Casassa, G.: Theuse of satellite and airborne imagery to inventory outlet glaciersof the Southern Patagonia Icefield, South America, Photogram-metric Engineering and Remote Sensing, 62, 1361–1369, 1996.
Baltsavias, E. P., Favey, E., Bauder, A., Boesch, H., and Pateraki,M.: Digital surface modelling by airborne laser scanning anddigital photogrammetry for glacier monitoring, PhotogrammetricRecord, 17, 98, 243–273, 2001.
Baltsavias, E. P., Li, H., Mason, S., Stefanidis, A., and Sinning,M.: Comparison of two digital photogrammetric systems withemphasis on DTM generation: case study glacier measurement,International Archives of Photogrammetry and Remote Sensing,31, 4, 104–109, 1996.
Barbolini, M. and Savi, F.: Estimate of uncertainties in avalanchehazard mapping, Annals of Glaciology, 32, 299–305, 2001.
Bauer, A., Paar, G., and Kaufmann, V.: Terrestrial laser scanning forrock glacier monitoring. Proceedings, Eighth International Con-ference on Permafrost, Zurich, Balkema, 1, 55–60, 2003.

A. Kaab et al.: Remote sensing of glacier and permafrost hazards 549
Benson, C. S. and Follet, A. B.: Application of photogrammetryto the study of volcano-glacier interactions on Mount Wrangell,Alaska, Photogrammetric Engineering and Remote Sensing, 52,6, 813–827, 1986.
Berthier, E., Arnaud, Y., Baratoux, D., Vincent, C., and Remy,F.: Recent rapid thinning of the “Mer de Glace” glacier derivedfrom satellite optical images, Geophys. Res. Lett., 31, L17401,doi:10.1029/2004GL020706, 2004.
Berthier, E., Vadon, H., Baratoux, D., Arnaud, Y., Vincent, C.,Feigl, K. L., Remy, F., and Legresy, B.: Surface motion of moun-tain glaciers derived from satellite optical imagery, Rem. Sen.Env., 95, 14–28, 2005.
Bindschadler, R. and Vornberger, P.: Detecting ice-sheet topogra-phy with AVHRR, RESURS-01, and Landsat TM imagery, Pho-togrammetric Engineering and Remote Sensing, 66, 4, 417–422,2000.
Bishop, M. P., Kargel, J. S., Kieffer, H. H., MacKinnon, D. J., Raup,B. H., and Shroder, J. F.: Remote-sensing science and technologyfor studying glacier processes in high Asia, Annals of Glaciol-ogy, 31, 164–170, 2000.
Bjornsson, H., Rott, H., Gudmundsson, S., Fischer, A., Siegel, A.,and Gudmundsson, M. T.: Glacier-volcano interactions deducedby SAR interferometry, J. Glaciol., 47, 156, 58–70, 2001.
Bottino, G., Chiarle, M., Joly, A., and Mortara, G.: Modelling rockavalanches and their relation to permafrost degradation in glacialenvironments, Permafrost and Periglacial Processes, 13, 4, 283–288, 2002.
Brecher, H. and Thompson, L. G.: Measurement of the retreat ofQori Kalis in the tropical Andes of Peru by terrestrial photogram-metry, Photogrammetric Engineering and Remote Sensing, 59,1017–1022, 1993.
Buchroithner, M. F.: Meteorological and earth observation remotesensing data for mass movement preparedness, Adv. Space Res.,29, 1, 5–16, 2002.
Buchroithner, M. F., Jentsch, G., and Waniverhaus, B.: Monitoringof recent glaciological events in the Khumbu Area (Himalaya,Nepal) by digital processing of Landsat MSS data, Rock Me-chanics, 15, 4, 181–197, 1982.
Casson, B., Delacourt, C., Baratoux, D., and Allemand, P.: Seven-teen years of the “La Clapiere” landslide evolution analysed fromortho-rectified aerial photographs, Engineering Geology, 68, 1–2, 123–139, 2003.
Chandler, J.: Effective application of automated digital photogram-metry for geomorphological research, Earth Surface Processesand Landforms, 24, 1, 51–63, 1999.
Clague, J. J. and Evans, S. C.: A review of catastrophic drainage ofmoraine-dammed lakes in British Columbia, Quaternary ScienceReviews, 19, 17–18, 1763–1783, 2000.
Coltelli, M., Fornaro, G., Franceschetti, G., Lanari, R., Migliaccio,M., Moreira, J. R., Papathanassiou, K. P., Puglisi, G., Riccio,D., and Schwabisch, M.: SIR-C/X-SAR multifrequency multi-pass interferometry: A new tool for geological interpretation, J.Geophys. Res., 101, 23 127–23 148, 1996.
Copland, L., Sharp, M. J., and Dowdeswell, J.A.: The distributionand flow characteristics of surge-type glaciers in the CanadianHigh Arctic, Annals of Glaciology, 36, 73–81, 2003.
Crosetto, M.: Calibration and validation of SAR interferometry forDEM generation, ISPRS Journal of Photogrammetry and RemoteSensing, 57, 3, 213–227, 2002.
Cuartero, A., Felicisimo, A. M., and Ariza, F.J.: Accuracy, relia-bility, and depuration of SPOT HRV and Terra ASTER digitalelevation models, IEEE Transactions on Geoscience and Remote
Sensing, 43, 2, 404–407, 2005.Dean, K. G., Dehn, J., Papp, K. R., Smith, S., Izbekov, P., Peterson,
R., Kearney, C., and Steffke, A.: Integrated satellite observationsof the 2001 eruption of Mt. Cleveland, Alaska, Journal of Vol-canology and Geothermal Research, 135, 1–2, 51–73, 2004.
Delacourt, C., Allemand, P., Casson, B., and Vadon, H.: Velocityfield of “La Clapiere” landslide measured by the correlation ofaerial and QuickBird satellite images, Geophys. Res. Lett., 31,15, L15619, doi:10.1029/2004GL020193, 2004.
Dorren, L. K. A.: A review of rockfall mechanics and modellingapproaches, Progress in Physical Geography, 27, 1, 69–87, 2003.
Dorren, L. K. A. and Seijmonsbergen, A. C.: GIS-based rockfallmodelling at regional scale, Geomorphology, 56, 1–2, 49–64,2003.
Dowdeswell, J. A. and Benham, T. J.: A surge of Perseibreen,Svalbard, examined using aerial photography and ASTER high-resolution satellite imagery, Polar Research, 22, 2, 373–383,2003.
Eckert, S., Kellenberger, T., and Itten, K.: Accuracy assessment ofautomatically derived digital elevation models from ASTER datain mountainous terrain, International Journal of Remote Sensing,26, 9, 1943–1957, 2005.
Ehlers, M. and Welch, R.: Stereocorrelation of Landsat TM images,Photogrammetric Engineering and Remote Sensing, 53, 1231–1237, 1987.
Eldhuset, K., Andersen, P. H., Hauge, S., Isaksson, E., and Wey-dahl, D. J.: ERS tandem INSAR processing for DEM genera-tion, glacier motion estimation and coherence analysis on Sval-bard, International Journal of Remote Sensing, 24, 7, 1415–1437,2003.
Engeset, R. V. and Weydahl, D. J.: Analysis of glaciers and geomor-phology on Svalbard using multitemporal ERS-1 SAR images.IEEE Transactions on Geosciences and Remote Sensing, 36, 6,1879–1887, 1998.
Espizua, L. E. and Bengochea, J. D.: Surge of Grande del NevadoGlacier (Mendoza, Argentina) in 1984: its evolution throughsatellite images, Geografiska Annaler, 72A, 3–4, 255–259, 1990.
Etzelmuller, B.: On the quantification of surface changes using grid-based digital elevation models (DEMs), Transactions in GIS, 4,2, 129–143, 2000.
Evans, S. G. and Clague, J. J.: Recent climatic change and catas-trophic geomorphic processes in mountain environments, Geo-morphology, 10, 107–128, 1994.
Favey, E., Geiger, A., Gudmundsson, G. H., and Wehr, A.: Evalu-ating the potential of an airborne laser scanning system for mea-suring volume changes of glaciers, Geografiska Annaler, 81A, 4,555–561, 1999.
Ferretti, A., Prati, C., and Rocca, F.: Permanent Scatterers in SARinterferometry, IEEE Transactions of Geosciences and RemoteSensing, 39, 1, 8–20, 2001.
Fischer, L.: Monte Rosa Ostwand – Geologie, Vergletscherung,Permafrost und Sturzereignisse in einer hochalpinen Steilwand,Diploma thesis, Department of Geography, University of Zurich,and Department of Earth Sciences, ETH Zurich, 2004.
Floricioiu, D. and Rott, H.: Seasonal and short-term variability ofmultifrequency, polarimetric radar backscatter of alpine terrainfrom SIR-C/X-SAR and AIRSAR data, IEEE Transactions onGeoscience and Remote Sensing, 39, 12, 2634–2648, 2001.
Forster, R. R., Jezek, K. C., Koenig, L., and Deeb, E.: Measurementof glacier geophysical properties from InSAR wrapped phase,IEEE Transactions on Geosciences and Remote Sensing, 41, 11,2595–2604, 2003.

550 A. Kaab et al.: Remote sensing of glacier and permafrost hazards
Fox, A. J. and Nuttall, A. M.: Photogrammetry as a research toolfor glaciology, Photogrammetric Record, 15, 89, 725–738, 1997.
Frauenfelder, R., Zgraggen-Oswald, S., Huggel, C., Kaab, A., Hae-berli, W., Galushkin, I., and Polkvoy, A.: Permafrost distributionassessments in the North-Ossetian Caucasus: first results, Geo-phys. Res. Abstr., 7, 01619, 2005.
Friedman, K. S., Clemente, C. P., Pichel, W. G., and Li, X.: Rou-tine monitoring of changes in the Columbia Glacier, Alaska, withsynthetic aperture radar, Rem. Sen. Env., 70, 257–264, 1999.
Fruneau, B., Achache, J., and Delacourt, C.: Observation and mod-elling of the Saint-Etienne-de-Tinee landslide using SAR inter-ferometry, Tectonophysics, 265, 3–4, 181–190, 1996.
Gamache, M.: Free and Low Cost Datasets for International Moun-tain Cartography, Proceedings, 4th ICA Mountain CartographyWorkshop, Vall de Nuria, Catalonia, Spain, 2004.
Gamma, P.: dfwalk – Ein Murgang-Simulationsprogramm zurGefahrenzonierung. PhD thesis, Department of Geography, Uni-versity of Berne, Geographica Bernensia G66, 2000.
Gao, J. and Liu, Y. S.: Applications of remote sensing, GIS andGPS in glaciology: a review, Progress in Physical Geography,25, 4, 520–540, 2001.
GAPHAZ: Joint international working group on glacier and per-mafrost hazards in mountains, Commission on Cryospheric Sci-ences and International Permafrost Association, http://www.geo.unizh.ch/gaphaz, 2004.
Geist, T., Lutz, E., and Stotter, J.: Airborne laser scanning technol-ogy and its potential for applications in glaciology, Proceedings,ISPRS Workshop on 3-D reconstruction from airborne laserscan-ner and INSAR data, Dresden, Germany, 2003.
Gens, R. and van Genderen, J. L.: SAR interferometry – Issues,techniques, applications, International Journal of Remote Sens-ing, 17, 1803–1835, 1996.
Grove, J. M.: Glacier fluctuations and hazards, Geographical Jour-nal, 153, 351–369, 1987.
Grun, A. and Zhang, L.: Automatic DTM generation from three-line-scanners (TLS) images, Proceedings, International Sympo-sium Photogrammetry meets Geoinformatics – Kartdagar 2002,Jonkoping, Sweden, 2002.
Gudmundsson, G. H. and Bauder, A.: Towards an indirect determi-nation of the mass-balance distribution of glaciers using the kine-matic boundary condition, Geografiska Annaler, 81A, 4, 575–583, 1999.
Haeberli, W.: Frequency and characteristics of glacier floods in theSwiss Alps, Annals of Glaciology, 4, 85–90, 1983.
Haeberli, W. and Beniston, M.: Climate change and its impacts onglaciers and permafrost in the Alps, AMBIO, 27, 4, 258–265,1998.
Haeberli, W., Huggel, C., Kaab, A., Oswald, S., Polvoj, A., Zotikov,I., and Osokin, N.: The Kolka-Karmadon rock/ice slide of 20September 2002 – an extraordinary event of historical dimen-sions in North Ossetia (Russian Caucasus), J. Glaciol., in press,2005.
Haeberli, W., Kaab, A., Paul, F., Chiarle, M., Mortara, G., Mazza,A., and Richardson, S.: A surge-type movement at Ghiacciaiodel Belvedere and a developing slope instability in the east faceof Monte Rosa, Macugnaga, Italian Alps, Norwegian Journal ofGeography, 56, 2, 104–111, 2002.
Haeberli, W., Kaab, A., Vonder Muhll, D., and Teysseire, P.: Pre-vention of debris flows from outbursts of periglacial lakes atGruben, Valais, Swiss Alps, J. Glaciol., 47, 156, 111–122, 2001.
Haeberli, W., Rickenmann, D., Zimmermann, M., and Rosli, U.:Investigation of 1987 debris flows in the Swiss Alps: general
concept and geophysical soundings, Hydrology in moutainousregions II, artificial reservois, water and slopes, IAHS, 194, 303–310, 1990.
Haeberli, W. and Rothlisberger, H.: Beobachtungen zum Mecha-nismus und zu den Auswirkungen von Kalbungen am Gruben-gletscher (Saastal, Schweiz), Zeitschrift fur Gletscherkunde undGlazialgeologie, 11, 2, 221–228, 1975.
Haeberli, W., Wegmann, M., and Vonder Muhll, D.: Slope stabilityproblems related to glacier shrinkage and permafrost degradationin the Alps, Eclogae Geologicae Helvetiae, 90, 407–414, 1997.
Hall, D., Chang, A. T. C., Foster, J. L., Benson, C. S., and Kovalick,W. M.: Comparison of in situ and Landsat derived reflectancesof Alaskan glaciers, Rem. Sen. Env., 28, 493–504, 1989.
Harbitz, C., Harbitz, A., and Nadim, F.: On probability analysis insnow avalanche hazard zonation, Annals of Glaciology, 32, 290–298, 2001.
Hauber, E., Slupetzky, H., Jaumann, R., Wewel, F., Gwinner, K.,and Neukum, G.: Digital and automated high resolution stereomapping of the Sonnblick glacier (Austria) with HRSC-A. Pro-ceedings, EARSeL-SIG-Workshop Land Ice and Snow, Dresden,Germany, 246–254, 2000.
Hirano, A., Welch, R., and Lang, H.: Mapping from ASTER stereoimage data: DEM validation and accuracy assessment, ISPRSJournal of Photogrammetry and Remote Sensing, 57, 5–6, 356–370, 2003.
Hoelzle, M.: Mapping and modelling of mountain permafrost distri-bution in the Alps, Norwegian Journal of Geography, 50, 11–15,1996.
Hoelzle, M., Wagner, S., Kaab, A., and Vonder Muhll, D.: Sur-face movement and internal deformation of ice-rock mixtureswithin rock glaciers in the Upper Engadin, Switzerland, Proceed-ings, 7th International Conference on Permafrost, Yellowknife,Canada, 465–472, 1998.
Honikel, M.: Fusion of spaceborne stereo-optical and interferomet-ric SAR data for digital terrain model generation, Mitteilungendes Institutes fur Geodasie und Photogrammetrie, 76, 2002.
Huggel, C.: Assessment of glacial hazards based on remote sens-ing and GIS modeling, Department of Geography, University ofZurich, Physical Geography Series, 44, 2004.
Huggel, C., Haeberli, W., Kaab, A., Ayros, E., and Portocarrero, C.:Assessment of glacier hazards and glacier runoff for different cli-mate scenarios based on remote sensing data: a case study for ahydropower plant in the Peruvian Andes, EARSel eProceedings,2, 22–33, 2003a.
Huggel, C., Haeberli, W., Kaab, A., Bieri, D., and Richardson, S.:Assessment procedures for glacial hazards in the Swiss Alps,Canadian Geotechnical Journal, 41, 6, 1068–1083, 2004a.
Huggel, C., Kaab, A., Haeberli, W., and Krummenacher, B.:Regional-scale GIS-models for assessment of hazards fromglacier lake outbursts: evaluation and application in the SwissAlps, Nat. Hazards Earth Sys. Sci., 3, 6, 647–662, 2003b,SRef-ID: 1684-9981/nhess/2003-3-647.
Huggel, C., Kaab, A., Haeberli, W., Teysseire, P., and Paul, F.:Satellite and aerial imagery for analysing high mountain lakehazards, Canadian Geotechnical Journal, 39, 2, 316–330, 2002.
Huggel, C., Kaab, A., Reynolds, J. M., and Heald, A.: Impact-oriented models for potential lake outbursts and ASTER-basedapplication in the Peruvian Andes. Proceedings, FachtagungSchweizerische Geomorphologische Gesellschaft, Erstfeld, 129–143, 2004b.
Huggel, C., Kaab, A., and Salzmann, N.: GIS-based modelingof glacial hazards and their interactions using Landsat TM and

A. Kaab et al.: Remote sensing of glacier and permafrost hazards 551
Ikonos imagery, Norwegian Journal of Geography, 58, 61–73,2004c.
Huggel, C., Zgraggen-Oswald, S., Haeberli, W., Kaab, A., Polkvoj,A., Galushkin, I. and Evans, S.G.: The 2002 rock/ice avalancheat Kolka/Karmadon, Russian Caucasus: assessment of extraordi-nary avalanche formation and mobility, and application of Quick-Bird satellite imagery, Nat. Hazards Earth Sys. Sci., 5, 173–187,2005, SRef-ID: 1684-9981/nhess/2005-5-173.
Iverson, R. M., Schilling, S. P., and Vallance, J. W.: Objective de-lineation of lahar-inundation hazard zones. Geological Society ofAmerica Bulletin, 110, 8, 972–984, 1998.
Janeras, M., Navarro, M., Arno, G., Ruiz, A., Kornus, W., Talaya, J.,Barbera, M. and Lopez, F.: LIDAR applications to rock fall haz-ard assessment in Vall de Nuria. Proceedings, 4th ICA MountainCartography Workshop, Vall de Nuria, Catalonia, Spain, 2004.
Jiskoot, H., Pederson, A. K., and Murray, T.: Multi-model pho-togrammetric analysis of the 1990s surge of Sortebræ, EastGreenland, J. Glaciol., 47, 677–687, 2001.
Joughin, I. R., Kwok, R., and Fahnestok, M. A.: Interferometric es-timation of three-dimensional ice-flow using ascending and de-scending passes, IEEE Transactions on Geoscience and RemoteSensing, 36, 1, 25–37, 1999.
Julio Miranda, P. and Delgado Granados, H.: Fast hazard evalua-tion employing digital photogrammetry: Popocatepetl glaciers,Mexico, Geofısica Internacional, 42, 2, 275–283, 2003.
Julio Miranda, P., Gonzales-Huesca, A. E., Delgado Granados,H., and Kaab, A.: Ice-fire interactions on Popocatepetl volcano(Mexico): case study of the 22 January 2001 eruption, Zeitschriftfur Geomorphologie, in press, 2005.
Kaab, A.: Photogrammetrische Analyse zur Fruherkennunggletscher- und permafrostbedingter Naturgefahren im Hochge-birge, Mitteilungen der Versuchsanstalt fur Wasserbau, Hydrolo-gie und Glaziologie der ETH Zurich, 145, Zurich, 182 pp., 1996.
Kaab, A.: Photogrammetry for early recognition of high mountainhazards: new techniques and applications, Phys. Chem. Earth B.,25, 9, 765–770, 2000.
Kaab, A.: Monitoring high-mountain terrain deformation from air-and spaceborne optical data: examples using digital aerial im-agery and ASTER data, ISPRS Journal of Photogrammetry andRemote Sensing, 57, 1–2, 39–52, 2002.
Kaab, A.: Mountain glaciers and permafrost creep. Methodicalresearch perspectives from earth observation and geoinformat-ics technologies, Habilitation thesis, Department of Geography,University of Zurich, 205 pp., 2004.
Kaab, A.: Combination of SRTM3 and repeat ASTER data forderiving alpine glacier flow velocities in the Bhutan Himalaya,Rem. Sen. Env., 94, 4, 463–474, 2005.
Kaab, A. and Funk, M.: Modelling mass balance using photogram-metric and geophysical data, A pilot study at Gries glacier, SwissAlps, J. Glaciol., 45, 151, 575–583, 1999.
Kaab, A. and Haeberli, W.: Evolution of a high-mountainthermokarst lake in the Swiss Alps, Arctic, Antarctic, and AlpineResearch, 33, 4, 385–390, 2001.
Kaab, A., Haeberli, W., and Gudmundsson, G.H.: Analysing thecreep of mountain permafrost using high precision aerial pho-togrammetry: 25 years of monitoring Gruben rock glacier, SwissAlps, Permafrost and Periglacial Processes, 8, 4, 409–426, 1997.
Kaab, A., Haeberli, W., Huggel, C., and Paul, F.: Glacier- andpermafrost-related hazards in high mountains: integrative as-sessment in the Swiss Alps based on remote sensing and geo-information systems. Proceedings, X Congresso Peruano de Ge-ologia, Lima, CD-ROM, 2000.
Kaab, A., Huggel, C., Barbero, S., Chiarle, M., Cordola, M., Epi-fani,, F., Haeberli, W., Mortara, G., Semino, P., Tamburini, A.,and Viazzo, G.: Glacier hazards at Belvedere Glacier and theMonte Rosa east face, Italian Alps: processes and mitigation,Proceedings, Interpraevent, 1, 67–78, 2004a.
Kaab, A., Huggel, C., Paul, F., Wessels, R., Raup, B., Kieffer, H.,and Kargel, J.: Glacier monitoring from ASTER imagery: accu-racy and applications, EARSel eProceedings, 2, 43–53, 2003a.
Kaab, A., Isakowski, Y., Paul, F., Neumann, A., and Winter, R.:Glaziale und periglaziale Prozesse: Von der statischen zur dy-namischen Visualisierung, Kartographische Nachrichten, 53, 5,206–212, 2003b.
Kaab, A., Lefauconnier, B., and Melvold, K.: Flow field of Kro-nebreen, Svalbard, using repeated Landsat7 and ASTER data,Annals of Glaciology, 42, in press, 2004b.
Kaab, A. and Reichmuth, T.: Advance mechanisms of rockglaciers,Permafrost and Periglacial Processes, 16, 2, 187–193, 2005.
Kaab, A., Reynolds, J. M., and Haeberli, W.: Glacier and per-mafrost hazards in high mountains, in: Global Change andMountain Regions (A State of Knowledge Overview), edited by:Huber, U. M., Bugmann, H. K. M., and Reasoner, M. A., Ad-vances in Global Change Research, Springer, Dordrecht, 225–234, 2005.
Kaab, A. and Vollmer, M.: Surface geometry, thickness changes andflow fields on creeping mountain permafrost: automatic extrac-tion by digital image analysis, Permafrost and Periglacial Pro-cesses, 11, 4, 315–326, 2000.
Kaab, A. and Weber, M.: Development of transverse ridges on rock-glaciers. Field measurements and laboratory experiments, Per-mafrost and Periglacial Processes, 15, 4, 379–391, 2004.
Kaab, A., Wessels, R., Haeberli, W., Huggel, C., Kargel, J., andKhalsa, S. J. S.: Rapid ASTER imaging facilitates timely assess-ment of glacier hazards and disasters, EOS Transactions, Amer-ican Geophysical Union, 84, 13, 117, 121, 2003c.
Kaufmann, V. and Ladstadter, R.: Spatio-temporal analysis of thedynamic behaviour of the Hochebenkar rock glaciers (OetztalAlps, Austria) by means of digital photogrammetric methods,Grazer Schriften der Geographie und Raumforschung, 37, 119–140, 2002.
Kaufmann, V. and Ladstadter, R.: Documentation of the retreat ofa small debris-covered cirque glacier (Goessnitzkees, AustrianAlps) by means of teresstrial photogrammetry, Proceedings, 4thICA Mountain Cartography Workshop, Vall de Nuria, Catalonia,Spain, 2004.
Kaufmann, V. and Plosch, R.: Reconstruction and visualisationof the retreat of two small cirque glaciers in the Austrian Alpssince 1850, in: High Mountain Cartography 2000, edited by:Buchroithner, M., Kartographische Bausteine, Dresden Univer-sity of Technology, 18, 239–253, 2000.
Keller, P., Keller, I., and Itten, K. I.: Combined hyperspectraldata analysis of two Alpine lakes using CASI and DAIS 7915imagery, Proceedings, EARSeL workshop, Zurich, CD-ROM,1998.
Kelley, R., Engeset, R., Kennett, M., Barrett, E. C., and Theakstone,W.: Characteristic snow and ice properties of a Norwegian icecap determined from complex ERS SAR. Proceedings, 3rd ERSSymposium (ESA), Florence, Italy, CD-ROM, 1997.
Kenyi, L. W. and Kaufmann, V.: Estimation of alpine permafrostsurface deformation using InSAR data, Proceedings, IEEE Inter-national Geoscience and Remote Sensing Symposium, Sydney,Australia, CD-ROM, 2001.
Kenyi, L. W. and Kaufmann, V.: Measuring rock glacier surface
552 A. Kaab et al.: Remote sensing of glacier and permafrost hazards
deformation using SAR interferometry, Proceedings, Eighth In-ternational Conference on Permafrost, Zurich, Balkema, 1, 537–541, 2003.
Kerle, N. and Oppenheimer, C.: Satellite remote sensing as a toolin lahar disaster management, Disasters, 26, 2, 140–160, 2002.
Kniveton, D. R., De Graff, P. J., Granica, K., and Hardy, R. J.: Thedevelopment of a remote sensing based technique to predict de-bris flow triggering conditions in the French Alps, InternationalJournal of Remote Sensing, 21, 3, 419–434, 2000.
Knizhnikov, Y. F., Gelman, R. N., Osipova, G. B., and Tsvetkov,D. G.: Aerophotogrammetric study of ice movement in surgingglaciers, Zeitschrift fur Gletscherkunde und Glazialgeologie, 34,1, 69–84, 1998.
Konig, M., Winther, J.-G., and Isaksson, E.: Measuring snow andice properties from satellite, Reviews of Geophysics, 39, 1, 1–27,2001.
Kotlyakov, V. M., Rototaeva, O. V., and Nosenko, G. A.: TheSeptember 2002 Kolka glacier catastrophe in North Ossetia, Rus-sian Federation, Evidence and Analysis, Mountain Research andDevelopment, 24, 1, 78–83, 2004.
Lewkowicz, A. G. and Duguay, C. R.: Detection of permafrostfeatures using SPOT panchromatic imagery, Fosheim Peninsula,Ellesmere Island, N.W.T., Canadian Journal of Remote Sensing,25, 1, 34–44, 1999.
Li, Z., Xu, Z., Cen, M., and Ding, X.: Robust surface matching forautomated detection of local deformations using least-median-of-squares estimator, Photogrammetric Engineering and RemoteSensing, 67, 11, 1283–1292, 2001.
Liang, L. and MacKay, D. S.: A general model of watershed ex-traction and representation using globally optimal flow paths andup-slope contributing areas, International Journal of GeographicInformation Science, 14, 4, 337–358, 2000.
Lillesand, T. M. and Kieffer, R. W.: Remote Sensing and imageinterpretation - fourth edition, Wiley, New York etc., 2000.
Liu, J. G., Mason, P. J., Clerici, N., Chen, S., Davis, A., Miao,F., Deng, H., and Liang, L.: Landslide hazard assessment in theThree Gorges area of the Yangtze river using ASTER imagery:Zigui-Badong, Geomorphology, 61, 1–2, 171–187, 2005.
Luckman, A., Murray, T., and Strozzi, T.: Three-dimensionalsurface flow evolution throughout a glacier surge measuredby satellite radar interferometry, Geophys. Res. Lett., 29, 23,doi:10.1029/2001GL014570, 2002.
Lutz, E., Geist, T., and Stotter, J.: Investigations of airborne laserscanning signal intensity on glacial surfaces – Utilizing compre-hensive laser geometry modelling and orthophoto surface mod-elling (A case study: Svartisheibreen, Norway), Proceedings, IS-PRS Workshop on 3-D reconstruction from airborne laserscannerand INSAR data, Dresden, Germany, 2003.
Maisch, M., Wipf, A., Denneler, B., Battaglia, J., and Benz, C.:Die Gletscher der Schweizer Alpen: Gletscherhochstand 1850– Aktuelle Vergletscherung - Gletscherschwund-Szenarien 21.Jahrhundert, Schlussbericht NFP31 vdf Hochschulverlag, ETHZurich, 1999.
Major, J. J. and Newhall, C. G.: Snow and ice perturbation dur-ing historical volcanic eruptions and the formation of lahars andfloods, Bulletin of Volcanology, 52, 1–27, 1989.
Mantovani, F., Soeters, R., and Van Westen, C. J.: Remote sensingtechniques for landslide studies and hazard zonation in Europe,Geomorphology, 15, 3–4, 213–225, 1996.
Mattar, K. E., Vachon, P. W., Geudtner, D., Gray, A. L., Cum-ming, I. G., and Brugman, M.: Validation of alpine glacier veloc-ity measurements using ERS tandem-mission SAR data, IEEE
Transactions on Geosciences and Remote Sensing, 36, 3, 974–984, 1998.
Meissl, G.: Modellierung der Reichweite von Felssturzen –Fallbeispiele zur GIS-gestutzten Gefahrenbeurteilung aus demBayrischen und Tiroler Alpenraum, Innsbrucker GeographischeStudien, Innsbruck, 1998.
Michel, R. and Rignot, E.: Flow of Moreno Glaciar, Argentina,from repeat-pass Shuttle Imaging Radar images: comparisonof the phase correlation method with radar interferometry, J.Glaciol., 45, 149, 93–100, 1999.
Mool, P. K., Bajracharya, S. R., and Joshi, S. P.: Inventory ofglaciers, glacial lakes and glacial lake outburst floods, Nepal, In-ternational Centre for Integrated Mountain Development, Kath-mandu, Nepal, 365 pp., 2001a.
Mool, P. K., Wangda, D., Bajrachary, S. R., Kunzang, K., Gurung,D. R., and Joshi, S. P.: Inventory of glaciers, glacial lakes andglacial lake outburst floods, Bhutan, International Centre for In-tegrated Mountain Development, Kathmandu, Nepal, 227 pp.,2001b.
Moorman, B. J. and Vachon, P. W.: Detecting ground ice melt withinterferometric synthetic aperture radar, Proceedings, 20th Cana-dian Symposium on Remote Sensing, Calgary, Canada, 1998.
Mora, P., Baldi, P., Casula, C., Fabris, M., Ghirotti, M., Mazzini,M., and Pesci, A.: Global Positioning Systems and digital pho-togrammetry for the monitoring of mass movements: applicationto the Ca’ di Malta landslide (northern Apennines, Italy), Engi-neering Geology, 68, 1–2, 103–121, 2003.
Mostyn, G. R. and Li, V.: Probabilistic slope analysis – state of play,Proceedings, Conference on Probabilistic Methods in Geotechni-cal Engineering, Canberra, Australia, A.A. Balkema, Rotterdam,89–110, 1993.
Muller, D.: Auflaufen und Uberschwappen von Impulswellen anTalsperren, Mitteilungen VAW/ETH Zurich, 137, 1995.
Nagler, T., Mayer, C., and Rott, H.: Feasibility of DInSAR for map-ping complex motion fields of Alpine ice- and rock-glaciers, Pro-ceedings, 3rd International Symposium on Retrieval of Bio- andGeophysical Parameters from SAR Data for Land Application,Sheffield, UK, SP, 475, 377–382, 2002.
Noetzli, J.: Felssturze aus Permafrost uber Gletschern, Diplomathesis, Department of Geography, University of Zurich, 2003.
Noetzli, J., Hoelzle, M., and Haeberli, W.: Mountain permafrostand recent Alpine rock-fall events: a GIS-based approach to de-termine critical factors, Proceedings, 8th International Confer-ence on Permafrost, Zurich, Balkema, 827–832, 2003.
Noetzli, J., Huggel, C., Hoelzle, M., and Haeberli, W.: GIS-basedmodelling of rock/ice avalanches from Alpine permafrost areas,Computational Geosciences, in press, 2005.
Ostir, K., Veljanovski, T., Podobnikar, T., and Stancic, Z.: Appli-cation of satellite remote sensing in natural hazard management:the Mount Mangart landslide case study. International Journal ofRemote Sensing, 24, 20, 3983–4002, 2003.
Paul, F.: Changes in glacier area in Tyrol, Austria, between 1969and 1992 derived from Landsat 5 Thematic Mapper and AustrianGlacier Inventory data, International Journal of Remote Sensing,23, 4, 787–799, 2002.
Paul, F.: The new Swiss glacier inventory 2000 – Application ofremote sensing and GIS, PhD thesis, Department of Geography,University of Zurich, 2004.
Paul, F., Huggel, C., and Kaab, A.: Mapping of debris-coveredglaciers using multispectral and DEM classification techniques,Rem. Sen. Env., 89, 4, 510–518, 2004a.
Paul, F. and Kaab, A.: Challenges for glacier inventorying from

A. Kaab et al.: Remote sensing of glacier and permafrost hazards 553
multispectral satellite data in the Canadian Arctic: CumberlandPeninsula, Baffin Island, Annals of Glaciology, 42, in press,2004.
Paul, F., Kaab, A., Maisch, M., Kellenberger, T., and Haeberli,W.: The new remote-sensing-derived Swiss glacier inventory: I.Methods, Annals of Glaciology, 34, 355–361, 2002.
Paul, F., Kaab, A., Maisch, M., Kellenberger, T., and Haeberli, W.:Rapid disintegration of Alpine glaciers observed with satellitedata, Geophys. Res. Lett., L21402, doi:10.1029/2004GL020816,2004b.
Pilgrim, L.: Robust estimation applied to surface matching, ISPRSJournal of Photogrammetry and Remote Sensing, 51, 243–257,1996a.
Pilgrim, L. J.: Surface matching and difference detection withoutthe aid of control points, Survey Review, 33, 259, 291–303,1996b.
Pitkanen, T. and Kajutti, K.: Close-range photogrammetry as atool in glacier change detection, ISPRS International Archives ofPhotogrammetry, Remote Sensing and Spatial Information Sci-ences, XXXV(B7), 769–773, 2004.
Powers, P. S., Chiarle, M., and Savage, W. Z.: A digital photogram-metric method for measuring horizontal surficial movements onthe Slumgullion earthflow, Hinsdale county, Colorado, Comput-ers and Geosciences, 22, 6, 651–663, 1996.
Quincey, D., Lucas, R. M., Richardson, S. D., Glasser, N. F., Ham-brey, M. J., and Reynolds, J. M.: Optical remote sensing tech-niques in high-mountain environments: application to glacialhazards, Progress in Physical Geography, in press, 2005.
Rabus, B., Eineder, M., Roth, A., and Bamler, R.: The shuttle radartopography mission – a new class of digital elevation models ac-quired by spaceborne radar, ISPRS Journal of Photogrammetryand Remote Sensing, 57, 4, 241–262, 2003.
Renouard, L., Perlant, F., and Nonin, P.: Comparison of DEMgeneration from SPOT stereo and ERS interferometric SARdata, EARSeL Advances in Remote Sensing – Topography fromSpace, 4, 2, 103–109, 1995.
Reynolds, J. M.: On the formation of supraglacial lakes ondebris-covered glaciers, in: Debris-Covered Glaciers, edited by:Nakawo, M., Raymond, C. F., and Fountain, A., IAHS publica-tions, 264, 153–161, 2000.
Richardson, S. D. and Reynolds, J. M.: An overview of glacial haz-ards in the Himalayas, Quaternary International, 65/66, 31–47,2000.
Rignot, E., Forster, R., and Isacks, B.: Interferometric radar obser-vations of Glaciar San Rafael, Chile, J. Glaciol., 42, 141, 279–291, 1996.
Rignot, E., Rivera, A., and Casassa, G.: Contribution of the Patag-onia Icefields of South America to sea level rise, Science, 302,434–437, 2003.
Roer, I., Kaab, A., and Dikau, R.: Rockglacier kinematics derivedfrom small-scale aerial photography and digital airborne push-broom imagery, Zeitschrift fur Geomorphologie, 49, 1, 73–87,2005.
Rolstad, C., Amlien, J., Hagen, J. O., and Lunden, B.: Visible andnear-infrared digital images for determination of ice velocitiesand surface elevation during a surge on Osbornebreen, a tidewa-ter glacier in Svalbard, Annals of Glaciology, 24, 255–261, 1997.
Rott, H.: Thematic studies in alpine areas by means of polarimet-ric SAR and optical imagery, Adv. Space Res., 14, 3, 217–226,1994.
Rott, H., Scheuchel, A., Siegel, A., and Grasemann, B.: Monitoringvery slow slope movements by means of SAR interferometry: a
case study from mass waste above a reservoir on the Otztal Alps,Austria, Geophys. Res. Lett., 26, 11, 1629–1632, 1999.
Rott, H. and Strobl, D.: Synergism of SAR and Landsat TM im-agery for thematic mapping in complex terrain, Adv. Space Res.,12, 7, 425–431, 1992.
Sabins, F. F.: Remote sensing: principles and interpretation, Free-man, New York, 1997.
Salzmann, N., Kaab, A., Huggel, C., Allgower, B., and Haeberli,W.: Assessment of the hazard potential of ice avalanches usingremote sensing and GIS-modelling, Norwegian Journal of Geog-raphy, 58, 74–84, 2004.
Schlaefli, S.: Interaktive, GIS-basierte Modellierung vonMurgangen, Fels- und Eislawinen, Diploma thesis, Departmentof Geography, University of Zurich, 2005.
Schowengerdt, R. A.: Remote sensing. Models and methods forimage processing - second edition, Academic Press, San Diegoand Chestnut Hill, 1997.
Sheridan, M. F., Hubbard, B., Carrasco-Nunez, G., and Siebe, C.:Pyroclastic flow hazard at Volcan Citlaltepetl, Nat. Haz., 33, 2,209–221, 2004.
Silverio, W. and Jaquet, J.-M.: Glacial cover mapping (1987–1996)of the Cordillera Blanca (Peru) using satellite imagery, Rem.Sens. Env., 95, 342–350, 2005.
Singhroy, V. and Molch, K.: Characterizing and monitoring rock-slides from SAR techniques, Adv. Space Res., 33, 3, 290–295,2004.
Skvarca, P., Raup, B., and De Angelis, H.: Recent behaviour ofGlaciar Upsala, a fast-flowing calving glacier in Lago Argentino,southern Patagonia, Annals of Glaciology, 36, 184–188, 2003.
Squarzoni, C., Delacourt, C., and Allemand, P.: Nine years of spa-tial and temporal evolution of the La Valette landslide observedby SAR interferometry, Engineering Geology, 68, 1–2, 53–66,2003.
Stebler, O., Barmettler, A., Divis, L., Small, D., Schwerzmann, A.,Meier, E., and Nuesch, D.: Swiss Alpine Airborne SAR Exper-iment (SASARE) part I: Multi-baseline polarimetric SAR inter-ferometry studies at L- and P-band, Proceedings, IEEE Interna-tional Geoscience and Remote Sensing Symposium (IGARSS),Anchorage, Alaska, 2, 1116–1120, 2004.
Stebler, O., Meier, E., and Nuesch, D.: Multi-baseline polarimetricSAR interferometry – first experimental spaceborne and airborneresults, ISPRS Journal of Photogrammetry and Remote Sensing,56, 3, 149–166, 2002.
Stevens, N. F., Garbeil, H., and Mouginis-Mark, P. J.: NASAEOS Terra ASTER: Volcanic topographic mapping and capabil-ity, Rem. Sen. Env., 90, 405–414, 2004.
Stevens, N. F., Manville, V., and Heron, D. W.: The sensitivity of avolcanic flow model to digital elevation model accuracy: exper-iments with digitised map contours and interferometric SAR atRuapehu and Taranaki volcanoes, New Zealand, Journal of Vol-canology and Geothermal Research, 119, 1–4, 89–105, 2003.
Sties, M., Kruger, S., Mercer, J. B., and Schnick, S.: Compari-son of digital elevation data from airborne laser and interfero-metric SAR systems, International Archives of Photogrammetryand Remote Sensing, 33, 866–873, 2000.
Strozzi, T., Gudmundsson, H., and Wegmuller, U.: Estimation ofthe surface displacement of Swiss alpine glaciers using satelliteradar interferometry, EARSel eProceedings, 2, 1, 3–7, 2003a.
Strozzi, T., Kaab, A., and Frauenfelder, R.: Detecting and quantify-ing mountain permafrost creep from in-situ, airborne and space-borne remote sensing methods, International Journal of RemoteSensing, 25, 15, 2919–2931, 2004.

554 A. Kaab et al.: Remote sensing of glacier and permafrost hazards
Strozzi, T., Luckman, A., Murray, T., Wegmuller, U., and Werner,C. L.: Glacier motion estimation using SAR offset-tracking pro-cedures, IEEE Transactions on Geosciences and Remote Sens-ing, 40, 11, 2384–2391, 2002.
Strozzi, T., Wegmuller, U., Tosi, L., Bitelli, G., and Spreckels, V.:Land subsidence monitoring with differential SAR interferome-try, Photogrammetric Engineering and Remote Sensing, 67, 11,1261–1270, 2001.
Strozzi, T., Wegmuller, U., Wiesmann, A., and Werner, C.: Valida-tion of the X-SAR SRTM DEM for ERS and JERS SAR geocod-ing and 2-pass differential interferometry in alpine regions, Pro-ceedings, IGARSS’03, Toulouse, France, 2003b.
Tarchi, D., Casagli, N., Fanti, R., Leva, D.D., Luzi, G., Pasuto, A.,Pieraccini, M., and Silvano, S.: Landslide monitoring by usingground-based SAR interferometry: an example of application tothe Tessina landslide in Italy, Engineering Geology, 68, 1–2, 15–30, 2003.
Tinti, S., Maramai, A., and Cerutti, A. V.: The Miage Glacier inthe Valley of Aosta (western Alps, Italy) and the extraordinarydetachment which occurred on 9 August 1996, Phys. Chem EarthA., 24, 2, 157–161, 1999.
Toutin, T.: DEM generation from new VIR Sensors: Ikonos,ASTER and Landsat 7, Proceedings, IGARSS ’01, Sydney, Aus-tralia, 2001.
Toutin, T.: Three-dimensional topographic mapping with ASTERstereo data in rugged topography, IEEE Transactions on Geo-science and Remote Sensing, 40, 10, 2241–2247, 2002.
Toutin, T. and Gray, L.: State-of-the-art of elevation extraction fromsatellite SAR data, ISPRS Journal of Photogrammetry and Re-mote Sensing, 55, 1, 13–33, 2000.
Vachon, P. W., Geudtner, D., Gray, A. L., Mattar, K., Brugman, M.,and Cumming, I. G.: Airborne and Spaceborne SAR Interferom-etry: Application to the Athabasca Glacier Area, Proceedings,IGARSS ’96, Lincoln, Nebraska, 2255–2257, 1996.
Wagnon, P., Ribstein, P., Kaser, G., and Berton, P.: Energy balanceand runoff seasonality of a Bolivian glacier, Global and PlanetaryChange, 22, 49–58, 1999.
Walder, J. S. and Driedger, C. L.: Frequent outburst floods fromSouth Tahoma Glacier, Mount Rainier, USA: relation to debrisflows, meteorological origin and implications for subglacial hy-drology, J. Glaciol., 41, 1–10, 1995.
Walder, J. S., Watts, P., Sorensen, O. E., and Janssen, K.: Waterwaves generated by subaerial mass flows, J. Geophys. Res., 108,B5, 2236–2255, 2003.
Wang, Z. and Li, S.: Detection of winter frost heaving of the activelayer of arctic permafrost using SAR differential interferometry,Proceedings, IEEE Geoscience and Remote Sensing SymposiumIGARSS’99, Hamburg, 1946–1948, 1999.
Weber, D. and Herrmann, A.: Contribution of digital photogram-metry in spatio-temporal knowledge of unstable slopes: the ex-ample of the Super-Saute landslide (Alpes-de-Haute-Provence,France), Bulletin de la Societe Geologique de France, 171, 6,637–648, 2000.
Weidmann, Y.: Kombination von ASTER- und SRTM-Hohenmodellen fur die Abschatzung von Naturgefahren imPamir Gebirge, Tadschikistan, Diploma thesis, University ofApplied Sciences, Muttenz, Basel, 2004.
Wessels, R., Kargel, J. S., and Kieffer, H. H.: ASTER measure-ment of supraglacial lakes in the Mount Everest region of theHimalaya, Annals of Glaciology, 34, 399–408, 2002.
Weydahl, D. J.: Analysis of ERS tandem SAR coherence fromglaciers, valleys, and fjord ice on Svalbard. IEEE Transactionson Geoscience and Remote Sensing, 39, 9, 2029–2039, 2001.
Zemp, M., Kaab, A., Hoelzle, M., and Haeberli, W.: GIS-basedmodelling of glacial sediment balance, Zeitschrift fur Geomor-phologie, Supplements, 138, 113–129, 2005.
Zhang, L. and Grun, A.: Automatic DSM generation from lineararray imagery data, International Archives of Photogrammetryand Remote Sensing, 15, B3, 128–133, 2004.
Zhang, W.: Identification of glaciers with surge characteristics onthe Tibetan Plateau, Annals of Glaciology, 16, 168–172, 1992.
Zimmermann, M. and Haeberli, W.: Climatic change and debrisflow activity in high-mountain areas – a case study in the SwissAlps, in: Catena Supplement, edited by: Boer, M. and Koster, E.,22, 59–72, 1992.
Zimmermann, M., Mani, P., Gamma, P., Gsteiger, P., Hunziker,G., and Heiniger, O.: Beurteilung der Murganggefahrdung mitHilfe eines Geographischen Informationssystems. Analyse derraumlichen Entwicklung infolge von Klimaanderungen, Schluss-bericht NFP31, Verlag der Fachvereine ETH Zurich, Zurich,1997.
Zollinger, S.: Ableitung von Parametern fur die Identifikation undBeobachtung gefahrlicher Gletscherseen in Nepal aus ASTERSatellitendaten, Diploma thesis, Department of Geography, Uni-versity of Zurich, 2003.
Zomer, R., Ustin, S., and Ives, J.: Using satellite remote sensingfor DEM extraction in complex mountainous terrain: landscapeanalysis of the Makalu Barun National Park of eastern Nepal,International Journal of Remote Sensing, 23, 1, 125–143, 2002.
Zweifel, A.: Impulswellen: Effekte der Rutschdichte und derWassertiefe, Mitteilungen VAW/ETH Zurich, 186, 2004.