remote sensing based rice acreage and production …nesac.gov.in/download/updated.pdf · 5 nrc-land...
TRANSCRIPT

Summary of RS & GIS projects – NESAC inputs for briefing the Parliamentary Standing Committee (2012 – 2014)
Sl. Project Title Status
APPLICATIONS (NATIONAL/DOS/INHOUSE) PROJECTS
1 Mapping of Keibul Lamjao National Park, Manipur Completed
2 Spatial Assessment of Soil Carbon Pool of India: under NCP project Completed
3 Assessment of irrigation potential created under Accelerated Irrigation Benefit Programme (AIBP) for Jmuna and Pahumara modernization of Jamuna irrigation Project
Completed
4 NRC-Ground Water Prospect Mapping and Quality mapping – Phase IV - Meghalaya
Completed
5 NRC-Land use land cover mapping using Multi-temporal Satellite Data. (LULC 50K 2nd Cycle)
Complete
6 Remote Sensing based Rice Acreage and Production Estimation in 4 NE states viz., Arunachal Pradesh, Meghalaya Mizoram and Tripura (Under FASAL)
Ongoing
7 North Eastern District Resources Plan (NEDRP) for Meghalaya Ongoing
8 Space Based Information KIOSK on North Eastern Region (SBIK-NER) – pilot work
Ongoing
9 Land use/ Land cover Mapping Using Multi-temporal AWIFS Data in NE states 9th Cycle
Ongoing
10 Space Based Information Support for Decentralized Planning (SIS-DP)
Ongoing
R&D PROJECTS (INHOUSE, EOAM)
11 Habitat mapping and identification of corridors for the movement of elephant using remote sensing and GIS in selective site of Assam
Completed
12 Integrated watershed development planning for Bagra Watershed of Meghalaya (including Cherapunjee) - a RS & GIS based approach.
Completed
13 GIS mapping of mosquito vector borne diseases in north east India Completed
14 Mapping of forest flora in East Khasi Hills district of Meghalaya and identification of potential areas for medicinal & aromatic plants using high resolution satellite imagery
Completed
15 Studies on bio-ecology of Helopeltis theivora and development of a forecasting model of its incidence for effective management
Completed
16 Remote Sensing and GIS Based Input for Road Realignment Planning in the Disaster Prone Areas of NER (Silchar to Imphal)
Completed
17 Development of effective classification schemes for hyperspectral satellite data with potential applications in NER
Ongoing
18 Development of an early working system for the outbreak of Japanese Encephalitis (JE) with the help of remote sensing and GIS in conjunction with the epidemiological studies in Assam (Operational phase)
Ongoing
19 Soil Nutrient Management Plan for a micro watershed of Ri-Bhoi District of Meghalaya
Ongoing
20 Urban Information System of Nongpoh Town Ongoing
21 Impacts of land use/ land cover change with particular reference to forest cover and habitation pattern on the climate of Barak basin in
Ongoing

North East India
USER FUNDED
22 Satellite based assessment of snow fed and rain fed catchment area in Lohit basin and Mapping of glacial lake in it
Completed
23 Ortho product generation and thematic map preration for ETALIN Hydro Electric Power Project
Completed
24 Remote Sensing & GIS based Forest Working Plan Inputs Preparations for Mizoram state
Completed
25 Remote Sensing and GIS Based Input for Hazard Risk Vulnerability Assessment of Guwahati city, Silchar, Dibrugarh towns and Dhemaji district, Assam
Completed
26 Remote Sensing and GIS Based Landslide Hazard Zonation map and reservoir rim stability studies for Subansiri Lower Hydro-Electric (SLP).
Completed
27 Geo-Spatial Studies for Locating Suitable Sites of Mobile Communication Towers in North Eastern Region
Completed
28 Study of the catchment of Ranganadi Hydroelectric Power Plant (RHEP) using remote sensing & GIS to assess the status of soil erosion and silt deposition in the reservoir .
Completed
29 Watershed ATLAS of Meghalaya Completed
30 Application of Remote Sensing and GIS in forecasting inflow/discharge into the reservoir of Kameng Hydro Electric Project
Ongoing
31 Remote Sensing based inputs for E-Working Plan of Arunachal Pradesh
Ongoing
32 Preparation of land resource and land use maps of Meghalaya of Forest Working Plan Inputs Preparations for Mghalaya state
Ongoing
33 Remote Sensing & GIS based Forest Working Plan Inputs Preparations for Assam state
Ongoing
34 Applications of Remote Sensing and GIS in Sericulture Development.
Ongoing
35 Flood Early Warning System (FLEWS) for Assam Ongoing
36 Soil and land capability mapping for all the agricultural districts of the NE Region
Ongoing
37 Soil Resource Mapping (SRM) on 1:50K for selected districts of Assam
Ongoing
38 Applications of RS and GIS for development of Agriculture for the state of Assam
Ongoing

Remote Sensing and GIS Projects carried out/being carried out by
North EasternSpace Applications Centre (NESAC)
Project 1
Project Title Mapping of Keibul Lamjao National Park, Manipur
Scope and Objectives To map the land use/cover change and prepare the vegetation map of Keibul
Lamjao NP
Centre/Unit NESAC
Funding Agency In House
Cost Nil
Duration 6 months (2013)
Study Area Keibul Lamjao, Bishenpur District, Manipur
Methodology Satellite data of past 10 years (5 multi date imageries) were used to map Land
use/cover categorized into 11 classes and analysed their changes over the years.
Vegetation type map was prepared using field survey data with added reference
from merged cartosat and LISS IV data. Landsat data pertaining to April 2009
was used for mapping the fire scar area of the park.
Data Used Landsat, IRS LISS III, LISS IV and Cartosat
Status of Project Completed
Land Use/Cover and land feature change in KeibulLamjaoNational Park (2000-2011)

Results of Project The Land use/cover maps of the park was generated for different years and the
change in area statistics were compared and major changes in the athaphum fish farming and
thin phumdis were highlighted. Using field sampling data vegetation type map was prepared
based on the vegetation composition and the corresponding signatures of the imagery. The area
extent of the damage due to the February 2009 fire in the park was also mapped.
Land use/cover and land feature change from 2000 to 2011 (area in km2)
LULC/land feature 2000 2004 2006 2009 2011
Phumdi 26.11 26.62 27.17 27.81 25.91
Marshy area 1.11 2.43 2.93 0.1 0.26
Dry land 0.62 0.64 0.63 0.63 0.63
Hillock 0.47 0.47 0.47 0.47 0.47
Open water bodies 7.46 4.95 3.78 5.58 7.13

Utilisation The report was submitted to the Chief Wild life Warden, Forest Department,
Manipur and the results of the study was used to update the management plan
of the park for 2011-2020.
Rivers/streams 0.07 0.07 0.07 0.07 0.07
Cultivation 0.15 0.14 0.14 0.14 0.12
Settlement 0.13 0.13 0.13 0.13 0.12
Fish farm 2.79 3.33 3.7 4.01 4.06
Athaphums 0.43 0.63 0.78 0.68 1.02
Floating vegetation 0.46 0.41 0.01 0.19 0.01
Total 39.8 39.8 39.8 39.8 39.8
Number of athaphums 82 146 187 130 200

Project 2
1. Project Title: Spatial Assessment of Soil Carbon Pool of India: under NCP project
2. Scope and Objectives: Over the years, Land use has been changing due to increase in population
which resulted in increased carbon emission from terrestrial ecosystem. In general conversion of natural
vegetation to agricultural systems leads to depletion of soil organic carbon the largest C pool. Most of the
soils lose as much as 50% of their original pool within 5 to 10 years of conversion in tropics. Interest in
soil organic C has greatly increased in recent years because terrestrial organic C can be a key factor in
understanding the effect of C emission on global climate change. Hence assessing the soil carbon stock
assumes significance to understand the anthropogenic effects, potential of soils to act as a sink for
atmospheric carbon and to properly manage the various production systems in the country. Hence,
creation of consistent and reliable national scale digital database is essential to understand balance of
temporal changes in net carbon balance as well as spatial pattern. Spatial assessment of soil carbon pool is
an input to National Carbon Pool project, which will be executed jointly by Indian Institute of Remote
Sensing (IIRS) and North Eastern Space Applications Centre (NESAC) in 5 states of North Eastern
Region.Under this project NESAC is responsible for Selection of sample sites and collection of soil
samples from the study area in collaboration with state centre and supply the samples for analysis.
3. Centre/Unit & Focal Point: North Eastern Space Applications Centre
4. Funding agency : ISRO
5. Cost: Rs.4,37,25/-
6. Duration: 2 Years
7. Study area: Assam, Meghalaya, Arunachal Pradesh, Mizoram and Nagaland
8. Methodology: The primary mapping units have been generated byintegrating land use, land form, soil
map and agro ecological sub region in GIS and sample sites selected in each primary mapping unit. Soil
samples have to be collected in the selected sites from different depths (0-15cm, 15-30cm, 30-50cm and
50-100cm in the crop lands and 0-30cm, 30-50cm and 50-100cm in forest and other land use areas). Two
adjacent surface soil samples have also to be collected to ensure estimate of variance without bias. The
samples thus collected have to be analysed in the laboratory for organic carbon, pH, soil texture and bulk
density. Per cent coarse fragments, volume of coarse fragments and organic litter has to be estimated from
field observations. At the site of sampling the field description form has to be filled properly. This
requires information about the site characteristics, profile depth, sample codes and management practices.
9. Data Used:
LISS III image
Landform map
agro ecological sub regions
LULC 50K map
Soil map
Base map available at (NESAC)
10. Status of Project: Completed

11. Result of the project (Kindly provide 2-3 good illustrations): Assigned work of selection of sample
sites and collection of soil samples have been completed (fig 1) and submitted to NRSC, Hyderabad.
Fig.1: Location of sites from where soil samples were collected
12. Utilization/success stories (Kindly provide 2-3 good illustrations): The inputs provided by NESAC
to NRSC will be used for assessment of soil carbon pool of India.
13. Any other details: Nil

Project 3
1. Project title: Assessment of irrigation potential created under Accelerated Irrigation
Benefit Programme (AIBP) for Jmuna and Pahumara modernization of Jamuna irrigation
Project
2.Scope & Objective:
The study has been conducted with an aim of assessing irrigation potential created in AIBP
funded irrigation project through mapping of irrigation infrastructure using Cartosat satellite data
as on march 2010 along with irrigation index map collected from concerned department and
extensive ground truth. Orthorectified Cartosat satellite data of 2.5m resolution was utilized to
extract irrigation infrastructure (canal network, associated structures). Based on the satellite
derived information in terms of number of canals, their physical status and hydraulic connectivity
from the source, irrigation potential created in a project was assessed by comparing with
planned / design – canal-wise irrigation potentials. All the geospatial information generated in
the study is organized in a systematic geodatabase using a schema developed for the project.
3.Centre/Unit: NESAC
4. Funding Agency: NRSC
4.Cost: Rs. 1,67,720
6. Duration: Six Months (2012)
7. Study Area: Pahumara Irrigation scheme is in Nalbari district of Assam. Jamuna Irrigation
scheme is in Karbi Anglong district of Assam
8. Methodology:
Orthorectified Cartosat satellite data of 2.5m resolution was utilized to extract irrigation
infrastructure (canal network, associated structures). Based on the satellite derived information
in terms of number of canals, their physical status and hydraulic connectivity from the source,
irrigation potential created in a project was assessed by comparing with planned / design –
canal-wise irrigation potentials. All the geospatial information generated in the study is
organized in a systematic geodatabase using a schema developed for the project. The detailed
flow chart of the methodology is as given below.


9. Data used: IRS P5 satellite imagery used of 2010 & 2011
10.Status of Project: Completed
11.Results:
Jamuna Projects: Based on thesatellite derived irrigation infrastructure status, the irrigation
potential estimatedfor Jamuna irrigation scheme is 38473.71 ha against the revised declared
(March 2009) target potential of 41014 ha.Hence, there are 2540 ha balance irrigation potential
to be created in the project.Since the AIBP component was to modernization of infrastructures
only, not creation of new canal. But the balance potential is because of shortage of canal length
in above mentioned canals. From field report and during field visit it is seen that the
modernization work is completed.

Based on thesatellite derived irrigation infrastructure status, the irrigation potential estimated for
Pahumara irrigation sheme is 9187.4 ha against the target AIBP potential of 11755 ha.Hence,
the balance irrigation potential to be created in the project is 3567.6. Even though the
component like canal pitching, lining etc considered under AIBP could not assess from satellite
data, but the deficit in irrigation potential is due to shortage of canal length and gaps.

Project 4
1. Project Title : NRC-Ground Water Prospect Mapping and Quality mapping,
Phase -IV of Meghalaya State.
2. Scope and Objectives:The project aims to provide drinking water source by
delineating and categorizing ground water prospective zones along with augmenting
the recharge conditions of the aquifer to assure the sustainability of the sources. The
objective of the project is to prepare the ground water prospects and quality maps in
1:50,000scale.
3. Centre : North Eastern Space applications Centre, Umiam , Meghalaya.
4. Funding Agency :Dept. of Drinking Water Supply (DDWS), MoRD, Govt. of India
under Rajiv Gandhi National Drinking Water Mission (RGNDWM) and nationally
coordinated by National Remote Sensing Centre (NRSC), Hyderabad.
5. Cost : Rs. 64,54,890.00Lakhs
6. Duration : 2 years. (Completion date Dec'13)
7. Study Area: Entire State of Meghalaya
8. Methodology : Methodology developed under RGNDWM Phase III and IV by
NRSC, Hyderabad was followed for mapping. The project can be divided into two
main parts: ground water prospect and quality mapping. For the first part
hydrogeomorphic units were delineated considering 17 thematic parameters
influencing the hydro geological properties of the study area. For the ground water
quality mapping source of legacy data is state PHED . Total 33 elements are grouped
in to essential and desirable categories.

9. Data Used : IRS P6 LISS III
GSI, CGWB maps-reports etc, legacy data from PHED.
10. Status of the Project : Prospect maps are completed and submitted while quality
mapping could not be addressed due to lack of legacy data.
11. Results of the Project :
Ground water prospect maps are composed according to SOI topo grid in 1:50,000
scale for entire state of Meghalaya. The study provides a spatial database on the
existing areas of entire Meghalaya state along with the possible recharge locations.
Although, the state of Meghalaya is of Hard Rock terrain, devoid of primary porosity.
However, a good control of structure (secondary porosity) and landform is observed for
ground water prospect. Prospect map of Shillong city, capital of Meghalaya state is
shown below.
12. Utilization/Success Stories:NA (database has been released one year back).
Ground Water Prospects
Map of Assam

Project 5
1 Name of the agency executing the project
North Eastern Space Applications Centre (NESAC)
2 Project title Remote Sensing based Rice Acreage and Production Estimation in 4 NE states viz., Arunachal Pradesh, Meghalaya Mizoram and Tripura (Under FASAL)
3 Name of the Sponsoring Agency/ In-house
Ministry of Agriculture and Cooperation, Govt. of India under FASAL programme
4 Year of Commencement
2011
5 Objectives
i) To develop Remote Sensing based methodology for rice crop acreage estimation in the selected states
ii) to develop appropriate techniques for rice production estimation with ground data.
6 Study Area 4 NE states viz., Arunachal Pradesh, Meghalaya Mizoram and Tripura
7 Current Status
(Year of completion, if completed)
Satellite data analysis for Rice acreage estimates for 2014is in final stage of completion in all the selected four states.
Rice production estimation is attempted in two selected districts of Meghalaya viz., East Khasi Hills and East Garo Hills on a pit basis with the integration of Crop Cutting Experiment (CCE) data provided by Directorate of Economics and Statistics, Govt. of Meghalaya.
8 Cost of the Project
(in Lakh Rs)
Rs. 26 Lakhs
9 Significant achievements
NA
10 User feedback NA

Project 6
Project title: NRC-Land use land cover mapping using Multi-temporal Satellite Data. (LULC 50K 2nd
Cycle)
Objectives: The objective of the project is to generate land use/cover map of 2011-12 for the
entire country using three season data.
Funding agency: NRSC, DOS
Study Area: NER states
Methodology
Updation of land use land cover map of 2005 and 2006 using three seasons (kharif/rabi/zaid)
satellite data of 2011-12 to prepare LULC map of 2011-12 and also the LULC change map.
Data used:
Resourcesat 2 LISS III data for the year 2011-12.
Status of project: Completed
Results of the project:
State wise seamless land use/land cover GIS data for 2011-12
State wise GIS layers for administrative boundaries and base information
Land use/land cover atlas for 2011-12 with change matrix.
Utilization/success stories:
NRC LULC 1st Cycle map of 2005-06 was used by various organization/institutes or
government departments for various uses as follows:
Used in preparation of detailed project report (DPR) by various line department.
Preparation of different action plan on agriculture, horticulture, forestry, water
resource etc.
Helps in study the land use land cover changes over the years.
The LULC map of NER is the baseline for other projects.
Cost and Duration: Rs. 12110100 (For 8 NER states), till June 2013.

Project 7
1. Projecttitle: North Eastern District Resources Plan (NEDRP) 2. Scope & Objectives: The North Eastern Region (NER) has a unique amalgamation of
geographical position, cultural and socio-economic conditions, but this region of our country has not made much progress as compared to the rest of the country due to various reasons viz., infrastructure bottlenecks, institutional weakness, technological gaps, etc. Many a times the programs undertaken by Government institutions to address specific problems of rural masses get poorly implemented due to insufficient technical inputs, lack of zeal and transparency in implementation and ineffective monitoring methods. In spite of tremendous information available in the custodies of different stake holders and agencies in the form of resources maps, land and water resource plans at micro watershed level, etc. but dissemination of information to the decision makers, planners and grass root level users in the specified format like Detailed Project report (DPR) etc. is not rapid enough due to poor awareness among the people in NER. Detailed Project Report (DPR) and master plan document are the actual basis for implementation of any developmental schemes or plans of Government. In general, a DPR gives information on project overview, general description of project area, baseline survey details, institution building and project management, management and action plans, capacity building, budget etc. Geospatial inputs forms the core of a DPR along with a socio economic data collected through Participatory Rural Appraisal (PRA) survey.
Considering the requirements specific to the preparation of DPR or master plan document
and understanding the location specific needs of users, there is a need for development of
an efficient information dissemination mechanism with the capability of Decision Support
System (DSS) in order to address these issues through effective utilization, management
and planning of natural resources in the region. Geospatial based solutions can be
developed in an integrated environment to help decision making, strategic planning,
effective resource management and operations management.
NEDRP aims to provide need & demand based location specific geospatial inputs in the
form of DSS developed using open source GIS packages & standards. This is unique in
nature which can be realized through the following tasks:
To identify the needs of geospatial inputs for district administration and concerned line departments towards preparation of DPR, master plan document etc. through proper awareness programme and demonstration of geospatial applications.
To generate need based location specific geospatial inputs for land and water resources action plans.
To develop a single window geoportal to integrate geospatial inputs for various action plans with necessary geoservices using open sources GIS software packages.
To deploy NEDRP portal in each of the district headquarters with a system, printer and dedicated manpower to operate and act as an authentic gateway for various data generating agencies to share the information across various government departments, NGOs, academies and industries.

3.Centre/Unit:North Eastern Space Applications Centre 4. Funding Agency:North Eastern Council (NEC) 5. Cost:` 144.25 lakhs 6. Duration: 3 years (2012-2015) 7. Study area: 25 selected districts of NE region. 8. Methodology: Natural resources (NR) database containing information on current land use,
wastelands, wetlands, soil, watershed, wetlands, crop, infrastructure etc. prepared under various national, user funded projects etc. are made available to NEDRP at district (1:50K) and block (1:25K) levels as per NNRMS standard with a proper linkage to socio-economic data. District developmental planning inputs on infrastructure development, utilization of wastelands, cropping pattern, soil crop suitability, forest working plan, soil conservation, watershed prioritization, etc. have been derived from the NR database using various GIS analysis and modeling tools as per Integrated Mission Sustainable Development (IMSD) guidelines. The information as and when is updated is planned to be made available from a recently launched Space Based Information Support for Decentralized Planning (SIS-DP) programme at 1:10,000 scale and networked for easy access at Panchayat level for decentralized planning to uplift grass root people by rightly implementing the Government of India plans such as MGNREGS, watershed development plan, aforestation and soil conservation measures etc.
9. Data Used: Carto-1, LISS IV etc. 10. Status of project: Development of NEDRP portal for 25 districts of NE region has been
completed and ready for launching. NEDRP portal is also ready for 3 districts of Assam, 2 districts of Mizoram and 3 districts of Manipur. Recent version of NEDRP is populated with large scale map of land use, infrastructure etc. apart from other geospatial information. New GIS tools such as shortest path calculations on district road, customize or interactive retrieval of spatial statistics has been integrated into the portal. Multi-criteria spatial modeling is one of the important components of NEDRP. NEDRP portal is registered with www.nedrp.gov.in and will be available in public domain very soon. Users of NEDRP can also interact with Bhuvan and can consume Bhuvan services and applications.

Existing land use map Land resources map using fuzzy overlay
11. Results of the project: Integration of action plan inputs for land and water resources
activities forms the basis of NEDRP programme. It can deliver relevant information for prevention of soil run-off, regeneration of natural vegetation, rain water harvesting and recharging of the ground water table which in turn helps for expansion of agricultural, agro-horticultural and other activities in a particular watershed area.
It is planned to install NEDRP portal in each of the district Head Qtr and the offices of
concerned Line Departments of NE region for their planning and developmental activities. Many user departments like Soil Conservation Department, Basin Development Authority, and District Disaster Management Authority are benefited from the inputs generated under NEDRP programme.
12. Utilization/Success stories: Large numbers of Line Depts have been utilizing the NEDRP
inputs as per latest records for preparation of DPR, Master plan document etc. for developmental projects. NEDRP has been installed in many Line Depts on request. NEDRP has been recognized as one of the finalists for eNorthEast 2012 Award Summit for such effort.
13. Any other details: NEDRP will be extended to the remaining districts of NER.

Project 8
1. Title: Space Based Information KIOSK on North Eastern Region (SBIK-NER) 2. Scope & objectives: The Space Based Information KIOSK on North Eastern Region (NER)
(SBIK-NER) is conceptualized by NESAC to showcase the strength of existing geospatial inputs of NER for natural resources management and other various developmental and planning activities in the region. The main objective of SBIK-NER is to provide relevant information on each of the eight states of NER to the Hon‟ble Minister for Development of North Eastern Region (DoNER), Secretaries and officials as well as the visitors of the region in a touch screen based display panel through user friendly software environment developed by NESAC.
3. Centre/Unit: NESAC 4. Funding Agency: North Eastern Council (NEC) 5. Cost:` 31.62 lakhs 6. Duration: 2 year (2012-2014) 7. Study area: All eight states of NER 8. Methodology: As mentioned below:
GIS data integration as per NNRMS standard
GIS modelling and generation of value added information (e.g.
action plan inputs for land & water resources)
Meta data generation
Portal design
Portal development
9. Data Used: Carto-1 & LISS IV etc. 10. Status of project: Development of Space Based Information KIOSK (SBIK) portal has
been completed and launched in all the states of NE region 11. Results: of projects: One KIOSK containing all the information related to natural resource
management, infrastructure, disaster management support etc. was installed in the office of DoNER which was launched by the Hon‟ble Union Minister of state for DoNER and President, NESAC Society, Paban Singh Ghatowar on 26th June, in the VigyanBhavan, New Delhi.
Hon‟ble Chief Minister of Assam ShriTarunGogoi has inaugurated the Space SBIK portal for the
state of Assam on 30th May, 2014 in Guwahati, Assam. NESAC has then installed the smart Touch-Screen based system containing SBIK portal in the Office of Hon‟ble Chief Minister of Assam. Other SBIK portals have been released by the respective Chief Secretaries of the states of NE region. Further, NESAC has also initiated the installation of SBIK portal in various Line Departments as per the directives of the concerned state Governments.

SBIK Geo-explorer presenting land use map of Assam
12. Utilization/Success stories:SBIK is one of the most significant programme taken up by
NESAC for each of the state of NE region. SBIK is sponsored by the Ministry of DoNER and executed by NESAC, in collaboration with SRSACs of NE region to support users and Line Departments of respective state Governments for developmental planning. Each of the SBIK is populated with geospatial layers on natural resources, infrastructure, disaster management etc. with proper linkages to the socio-economic data. In addition, it also contains information related to action plans for forest and environment, agriculture, soil conservation, infrastructure etc. for preparation of detailed project report (DPR) etc. SBIK has numerous GIS tools for data visualization, navigation, analysis and printing of the final map. The detail map statistics for spatial layers can also be generated based on user defined area of interest. SBIK is conceptualized to strengthen the planning and monitoring mechanisms of the projects funded by DoNER Ministry & other Central Government funded projects such as Integrated Watershed Management Programme (IWMP), Mahatma Gandhi National Rural Employment Guarantee Act (MGNREGA), PradhanMantri Gram SadakYojna (PMGSY) etc.
13. Any other details: Nil

Project 9
Land use/ Land cover Mapping Using Multi-temporal AWIFS Data in NE states 8th, 9th& 10th Cycle
Scope and Objective: The mapping of land use/land cover (LULC) on 1:250,000 scale under the Natural Resource
Census (NR-Census) is focused on the rapid assessment of National Level LULC on 1:250,000 scale using multi-
temporal AWiFS datasets with an emphasis on net sown area for different cropping season.
Centre/Unit: NESAC
Funding Agency: NRSC, Hyderabad
Cost: - Rs.5 Lakh
Duration: Three seasons mapping every year
Study area: Entire NER
Methodology: Digital image classification
Data Used: IRS P6 AWiFS
Status of project: 10th cycle completed. Ongoing activity
Results: The mapping using satellite data along with ground truth collection has shown little increase in the
wasteland categories and built up areas in many parts of NER. Whereas, the cropped areas are not showing marked
change in the cultivation areas. Shifting cultivation areas have increased particularly in the NE states of Mizoram
and Nagaland. Nagaland also shows increase in the areas under scrub lands.

Utilization: Inputs used for particularly crop area estimation for the whole country
Settlements
Kharif crop
Rabi crop
zaid crop
double/triple crop
current fallow
Plantation
evergreen forest
Deciduous forest
degraded forest
littoral swamp
grassland
other wastelands
gully/ravines
scrub land
water
snow cover
shifting cultivation
Integrated LULC map of 2013-14

Project 10
1. Title: Space Based Information Support for Decentralized Planning (SIS-DP) 2. Scope & objectives: SIS-DP aims at generating Thematic geo-spatial layers on 1:10K scale
on natural resources / infrastructure (land cover, settlements, etc.), creating inventory of resources (water sources, road network, drainage, rail network etc.) from high resolution orthorectified satellite Cartosat-1 PAN, LISS-IV MX and merged images. Respective stakeholder departments‟ data will be integrated with the spatial layer in GIS environment.
3. Centre/Unit: NESAC 4. Funding Agency: NRSC/ISRO 5. Cost:` 36.25 lakhs
6. Duration: 5 years (2012-2017) 7. Study area: Meghalaya 8. Methodology: As mentioned below:
Generation of digital elevation model (DEM) and other ortho-rectified products
like Carto-1 and LISS IV.
Large scale mapping of land use and infrastructures at 1:10K scale.
Integration of Stakeholder's data
Integration of legacy databse.
Dissemination through Bhuvan portal and other means.
9. Data Used: Carto-1 & LISS IV etc. 10. Status of project: Work completed for the state of Meghalaya and the database is available
in Bhuvan portal. 11. Results of projects: Large scale land use and infrastructure maps, village cadastral maps
prepared using high resolution Carto-1 + LISS4 fused imagery at 1:10K scale are the significant deliverables under this programme for decentralized planning. Carto-1 DEM and the seamless mosaic of orthorectified Carto-1 and LISS4 satellite data are not only used for generation of large scale maps, but also considered as base reference for other ongoing and future project activities taken up in the region. Generation of large scale maps of land use and infrastructures have been completed for most of the states of NE region. Other legacy data have been brought to the SIS-DP referencing system and linked with Census 2011 and Line Departments data.
Deliverables generated under this programme has been effectively used for decentralized
planning of IWMP, MGNREGA, PMGSY schemes of Government.

Geo-visualization of land use map of Ri-Bhoi district of Meghalaya
12. Utilization/Success stories:The programme aims at generating geo-spatial layers on
1:10K scale on natural resources /infrastructure (land cover, settlements, soils, ground water prospect maps etc.), creating inventory of resources (water sources, road network, public utilities, communication network, health care etc.) and disseminating them by using platforms like Web enabled information system, digital CD/DVD ROMs etc. for use in planning at grassroots level. The project also aims at developing site specific interactive Decision Support System (DSS) for local level planning.
14. Any other details:

R&D PROJECTS (INHOUSE, EOAM)
Project 11
1. Project Project Title : Habitat mapping and identification of corridors for the movement
of elephant using remote sensing and GIS in selective site of Assam
2. Scope and Objectives
Garbhanga and Rani Reserve Forest in Assam are important habitats of the elephant. In the recent years
there is a threat to these habitats due to encroachment as well as the deforestation taking place in and
around these areas. Moreover elephants require vast area for fodder and survival.
The objectives of this project are:
To map vegetation type and forest cover/density
To map the existing elephant habitats
To identify potentials elephant corridors
3. Centre & Focal point : North Eastern Space applications Centre
4. Funding Agency : EOAM. Dept. of Space
5. Study Area : Garbhanga and Rani Reserve Forest in Assam
6. Brief Methodology : The methodology involves visual image interpretation of high resolution
satellite data (IRS P6 LISS IV) in combination with LISS III. Satellite data was used for generating
information on vegetation type, forest density/cover and water bodies. Habitat suitability and
elephant corridor were analyzed in GIS environment. Corridors favourable for elephant passage was
identified based on the habitat suitability map generated.
7. Data Used
IRS P6 LISS-IV (MX) (2 scenes)
IRS ID LISS-III (1 scene)
LANDSAT-TM (1 scene)
8. Status of the Project : Completed
9. Results of the Project :
Habitat suitability map was generated and also identified elephant corridor in GIS environment
based on the vegetation types, slope, elevation, distance from water bodies/drainage, settlement,
infrastructure (road, rail, etc.). From the habitat suitability analysis, it has been observed that most
of the suitable habitats for elephants are located in the northern portion of both the reserve forests.

The northern portion of the reserves lies adjacent to expanding Guwahati city. Further Deepar beel
that also lies in the northern part of Rani reserve forest form a complex ecosystem, thus serving an
important habitat for elephants and other wildlifes. It has also been observed that the core area of
both the reserves remained almost undisturbed. However, the southern part of Garbhanga is
unsuitable due to steep sloping. The forest fringes needs more attention for protection as there is
chances of encroaching particularly from expanding Guwahati city. Therefore, a close monitoring of
the reserve is very important in order to protect this complex ecosystem which is under threat from
severe biotic pressure..
10. Utilization/Success Stories:Workshop on elephant depredation in Assam was organized
in collaboration with Assam Forest Department at Guwahati.
11. Cost : Rs. 6.54 lakhs Lakhs
12. Duration : 2007 to 2011


Project 12
1. PROJECT TITLE Integrated watershed development planning for Bagra Watershed
of Meghalaya (including Cherapunjee) - a RS & GIS based
approach.
2. SCOPE & OBJECTIVES : Watershed development refers to the conservation, regeneration
and the judicious use of all the natural resources like land, water, plants, animal) and human
within the watershed area. Watershed Management tries to bring about the best possible
balance in the environment between natural resources. Bagra is a watershed in “South flowing
drainage of Meghalaya” catchment under Brahmaputra basin. The uniqueness of the watershed
is in spite of the presence of Charapunjee „the place receiving highest rainfall in the world‟ there
is shortage of drinking water, poor in ground water prospect. As viewed from satellite image
40% area of the watershed is barren. The watershed have moderate to steep slope area. So,
physiography of the watershed is prone to soil erosion. The intensive rainfall makes the
watershed more vulnerable to soil erosion. Appropriate combination of engineering and non-
engineering soil conservation measures can resist soil erosion up to a great extent which in turn
takes an important rule in ground water recharging.
The specific objectives of the study are:
Characterization of micro watershed
Prioritization of micro-watershed.
Preparation of alternate land use plans for barren areas to resist soil erosion.
To find out low cost and simple technology for rain water harvesting for the purpose of
irrigation, plantations including horticulture, fisheries etc.
Design of suitable structural measures (Trenching, Bunding, Hedging & Terraching etc.)
to restrict soil erosion for barren high lands as well as artificial ground water recharging
3. CENTRE/UNIT : North Eastern Space Applications Centre (NESAC)
FOCAL POINT : Sri Ranjit Das,
4. FUNDING AGENCY : DOS (EOAM)
5. COST : 7.15 Lakh
6. DURATION : 18 months (completed 2013)
7. STUDY AREA:
Bagra Watershed is situated in southern part of East Garo Hills District of Meghalaya. The
watershed is bordering to Bangladesh.
8. METHODOLOGY :

The prioritization of micro-watershed will be done by analyzing topographic factors like land use
land cover, slope and drainage density etc. in GIS environment. Similarly, the suitable sites and
the alignment of the rain water harvesting structures and runoff velocity retarding structures can
be decided by analyzing topographic factors in GIS. Again, incorporating soil type and climatic
factors to topographic factors a sustainable alternate land use plane can be suggest.
9. Data used: Cartosat – I stereo pair, Either IRS-P6 LISS IV or LISS III (Preferably IRS-P6
LISS IV)
10. Status of Project : completed
:

Project 12
1 Name of the agency executing the project
North Eastern Space Applications Centre (NESAC)
2 Project title GIS mapping of mosquito vector borne diseases in north east India
3 Name of the Sponsoring Agency/ In-house
EOAM, Dept. of Space
4 Year of Commencement
2011
5 Objectives
1. Creation of a GIS database with spatial and temporal distribution of vector borne diseases in the north eastern region (NER) of India.
2. To map the spatial locations of disease occurrence and analyze the correlation of disease with landscape, meteorology and socio-economic parameters.
3. To identify the disease hotspots using spatial statistical tools for designing appropriate intervention measures.
6 Study Area 8 states of NER.
7 Current Status
(Year of completion)
Completed in 2014
8 Cost of the Project
(in Lakh Rs)
Rs. 29.5 Lakhs
9 Significant achievements
An up to date GIS database with spatial and temporal distribution ofsix vector (mosquito) borne diseases viz, Malaria, Japanese Encephalitis, Chicungunya, Dengue, Filariasis and West Nile Virus at 1:50,000 scale has been completed. Disease hotspots have beeb identified using spatial statistical tools for taking appropriate intervention measures.
10 User feedback NIL

Project 14
1. Project Title : Mapping of forest flora in East Khasi Hills district of Meghalaya and
identification of potential areas for medicinal & aromatic plants using high resolution satellite
imagery
2. Scope and Objectives: Forest in the region is rich in biodiversity. However, it is under
severe pressure due to human interference such as illicit logging of trees for timber and
firewood and expansion of human habitation. As a result, forest cover in the region is
disappearing at an alarming rate. These forests also harbour aromatic and medicinal plants.
The indigenous people from this region are also dependent on these medicinal plants.
Therefore, mapping of the forests is important to understand the spatial distribution of these
plants for conservation and also identifying suitable sites for reintroduction.
i. To identify/characterise different forests types.
ii. To identify the distribution pattern of aromatic and medicinal plants with respect to
these forest types
iii. To understand the composite spectral signatures of vegetation and forest cover
types.
iv. To identify potential sites for medicinal and aromatic plants.
3. Centre : North Eastern Space applications Centre, Umiam, Meghalaya
Collaborating Agencies: Botanical Survey of India, Shillong.
4. Funding Agency : EOAM
5. Study Area : Mawphlang and Pynursla blocks of East Khasi Hills District of
Meghalaya
6. Brief Methodology :
7. The methodology involves visual interpretation of high resolution satellite data (IRS P6
LISS IV). Information on forest type generated from satellite data based will be
correlated with ground truth information (field data). Other important parameters like
slope and elevation will also be used for identifying potential sites for medicinal and
aromatic plants.
8. Data Used : IRS P6 LISS III & IRS P6 LISS IV
9. Status of the Project: Completed
10. Results of the Project :

Very Low
Low
Medium
High
Predicted potential habitat suitability sites for medicinal plant ( Caryota urens)Pynursla block
Forest type and forest crown density map are prepared from LISS IV MX and LISS-III imagery.
All forest patches was stratified using the combination of forest type, density and elevation
layers for distributing the sample plots to get a fair representation of all possible habitat sites of
medicinal and aromatic plants. A total of 100 sample points were generated for both the blocks
(64 in Pynursla and 36 in Mawphlang block) based on the stratified forest map in order to
understand and identify the distribution pattern of important medicinal and aromatic plants in the
blocks. Detailed inventory have been done in 70 sample plots and work in the remaining plots is
in progress by Botanical Survey of India (BSI), Shillong. The preliminary analysis of data shows
that there is a good correlation exist, in having good number of medicinal plant species in the
microclimatic zones.Maxentmodel has been used to identify potential sites for medicinal and
aromatic plant species.
11. Cost: : Rs. 15.5 lakh
12. Duration : 2010 to 2014.

Project 15
1. Project Title : Studies on bio-ecology of Helopeltis theivora and development of a
forecasting model of its incidence for effective management
2. Scope and Objectives:H. theivora is an important pest of tea that causes significant
economic loss to tea crops. Nymphs and adults both suck the cell sap from pluckable tender
tea shoots. During June-July, the insect completes its life cycle within one month. For
controlling this pest, tea planters often use heavy doses of different contact and systemic
insecticides, which caused residue problems in tea prepared for consumption. A suitable
model for predicting pest infestence would assist tea growers to know better about the
occurrence of pest and thus help them to take preventive measures against the pest, which
consequently minimize the pesticidal load and encourage effective management.
Objectives of the project are:
Objectives 1: Survey of H. theivora and documentation of ecological parameters in different
tea plantations of all agro-climatic conditions of NE India.
Objectives 2: Studies on morphological, biochemical and genetic variation of H. theivora.
Objectives 3: Development of a prediction model of H. theivora occurrence.
Objectives 4: Development of management practice of H. theivora in different agroclimatic
zones.
3. Centre/Unit : North Eastern Space applications Centre, Umiam , Meghalaya
Collaborating Centre: North East Institute of Science & Technology, Jorhat
Tezpur university, Tezpur
Project Investigator: Dr. K K Sarma (NESAC)
4. Funding Agency : Department of Biotechnology (DBT)
5. Cost : Rs. 21.53 Lakh
6. Duration : 3 years (April 2011 – March, 2014)
7. Study Area : 10 tea gardens covering 10 agroclimatic zones of North Eastern
Regions have been selected as study sites.
8. Brief Methodology : Ecological parameters (including land use pattern/change, soil
properties and local weather conditions) will be used to develop a model in Gepgraphic
Information System (GIS) platform for forecasting the occurrence of H. theivora in different
agro-climatic zones. By considering the ecological complexity, small details like age of the
plant in respective plantation, plucking tea shoot length, plucking period etc. also will be
studied for probable critical parameters and will try to feed to the GIS platform for a finely

tuned predictive model. The model will be verified during project time in different agro-
climatic conditions.
9. Data Used: IRS P6 LISS III, LISS IV(MX) & IRS P5 & meteorological data.
10. Status of the Project: Complete
11. Results of the Project: A very good relationship between crop land, scrubland and disease
infestation level has been established. Some of the important findings are:
Ill-maintenance of gardens contributes to the mosquito bug infestation.
Presnce of Bamboo plants and forests surrounding the garden contributes to Helopeltis
infestation.
More weeds, more Mikania , more large-canopied shade trees (like Peepul-Ficus
religiosa,Mango-Mangifera indica and climbers present on these, etc) contributes to
Helopeltis presence.
Mild rainfall triggers more infestation – as they like cool, moist conditions ; but heavy rainfall
reduces them.
Mikania is the secondary host of Helopeltis, so they are found more if the tea gardens have
presence of Mikania.
Tea gardens having Neem and Citronella plantations have less Helopeltis infestation.
12. Utilization/ Success stories : nil


Project 16
1. Project Title: Remote Sensing and GIS Based Input for Road Realignment Planning in the
Disaster Prone Areas of NER (Silchar to Imphal)
2. Scope & Objective:
Disruption of communication links during rainy season due to landslides and mudslides has
become a major hurdle in the NER, especially in the hilly terrain. Moreover search for alternate
route which is free from any kind of natural disaster such as landslide, subsidence etc. is urgently
needed in the region. In this regard the present study is proposed to be carried out to prepare
disaster prone areas along Imphal – Silchar road corridor (NH-53). The objective of the project is
to prepare a map showing disaster prone areas on 1:25000 scale or larger along Imphal - Silchar
Highway corridor (NH-53) using remote sensing and GIS techniques in conjunction with the
ground surveys and existing collateral data. The work also aims to validate the usefulness of DEM
generated from CARTOSAT –I Stereopair in such terrain conditions where slope plays a very
important role.
3. Centre/ Unit: North Eastern Space Applications Centre, NE-SAC.
Focal Point: M. Somorjit Singh & Miss Kuntala Bhusan Scientist/Engineer „SC‟, NE-SAC.
4. Funding Agency:EOAM/DOS.
5. Study area:
Silchar – Imphal NH-53 (235.425 Km Assam and Manipur)
6. Methodology :
The present study will be carried out in the following major steps – data collection, database
generation (with pre & post field interpretation) ground truth collection and analysis. The average
width of the corridor to be taken will be about 5 km (2.5 km. on either side of the road), although it
may change slightly depending on the accessibility and terrain conditions.
A final draft of the project execution document with detail methodology is under preparation.
7.Data Used:
Resourcesat I LISS – IV MX, products on 1: 25,000 scale in digital form.
CARTOSAT – I, Stereopair.(6 stereopair)
Existing maps and literature
Data collected from ground surveys.
8. Status of Project: Complete
9. Progress of the Project: Generation of hazard map and preparation of suggested newly
aligned road complete.

10. Cost and Duration: Total Cost: Rs 8.59 Lakhs
11. Duration 3 years
Existing and suggested road in and around Kharam Village (NH-53)
Index
Existing Road (NH-53) Suggested Road (Newly Aligned)
Existing Road Segment - Distance (source to destination)-16.98Km
Suggested Road Segment - Distance (source to destination)-5.8Km - Shortened – 11.13 Km - Crossed on stream – KharamLok
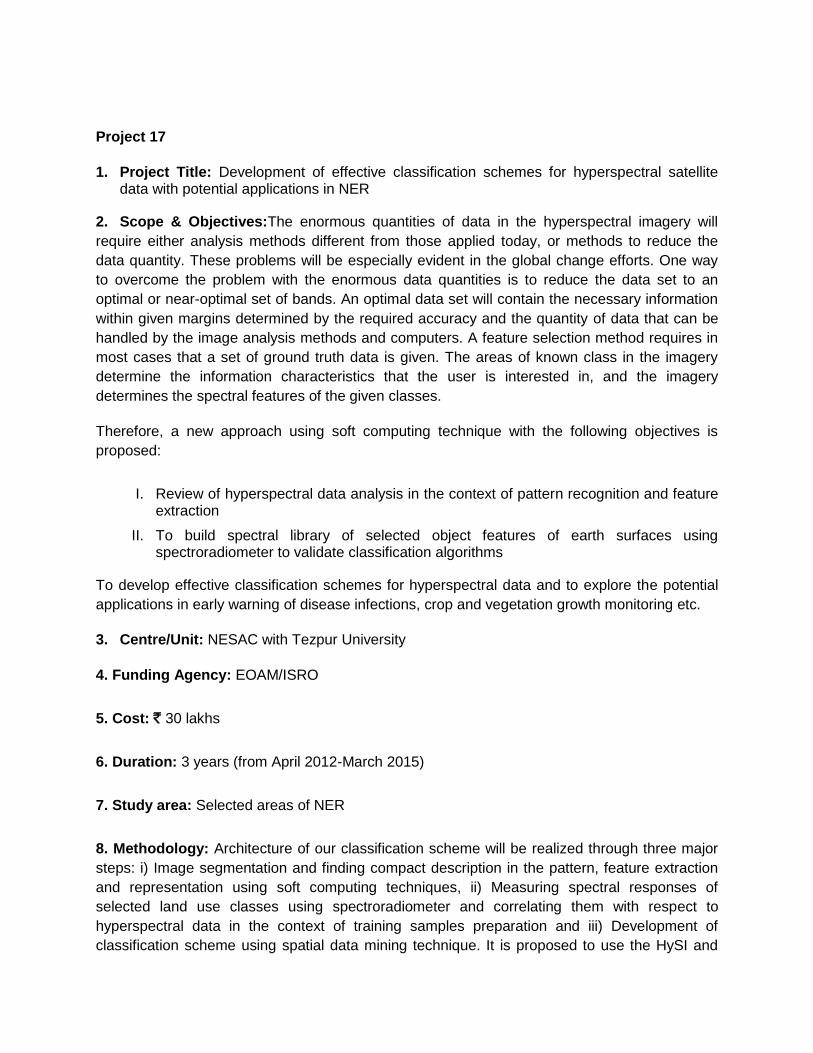
Project 17
1. Project Title: Development of effective classification schemes for hyperspectral satellite data with potential applications in NER
2. Scope & Objectives:The enormous quantities of data in the hyperspectral imagery will
require either analysis methods different from those applied today, or methods to reduce the
data quantity. These problems will be especially evident in the global change efforts. One way
to overcome the problem with the enormous data quantities is to reduce the data set to an
optimal or near-optimal set of bands. An optimal data set will contain the necessary information
within given margins determined by the required accuracy and the quantity of data that can be
handled by the image analysis methods and computers. A feature selection method requires in
most cases that a set of ground truth data is given. The areas of known class in the imagery
determine the information characteristics that the user is interested in, and the imagery
determines the spectral features of the given classes.
Therefore, a new approach using soft computing technique with the following objectives is
proposed:
I. Review of hyperspectral data analysis in the context of pattern recognition and feature extraction
II. To build spectral library of selected object features of earth surfaces using spectroradiometer to validate classification algorithms
To develop effective classification schemes for hyperspectral data and to explore the potential
applications in early warning of disease infections, crop and vegetation growth monitoring etc.
3. Centre/Unit: NESAC with Tezpur University
4. Funding Agency: EOAM/ISRO
5. Cost: ` 30 lakhs
6. Duration: 3 years (from April 2012-March 2015)
7. Study area: Selected areas of NER
8. Methodology: Architecture of our classification scheme will be realized through three major
steps: i) Image segmentation and finding compact description in the pattern, feature extraction
and representation using soft computing techniques, ii) Measuring spectral responses of
selected land use classes using spectroradiometer and correlating them with respect to
hyperspectral data in the context of training samples preparation and iii) Development of
classification scheme using spatial data mining technique. It is proposed to use the HySI and

Hyperion satellite data. A set of classification schemes for the above hyperspectral satellite data
will be proposed by investigating different aspects such as segmentation parameters, pattern
recognition, spectral and object characteristics, appropriate classifier and validation.
9. Data Used: Hyperspectral (Hyperion/Airborne etc.)
10. Status of the project: Ongoing
11. Results of the project: An effective classification model for classification of hyperspectral
remotely sensed data was conceptualized and developed. It is characterized by an appropriate
dimensionality reduction and feature selection technique for achieving higher classification
performances. Also, an object-based Classification supported by SVM referred as OBCsvmFS
is proposed for classification of hyperspectral RS data. Three feature selection techniques are
used and SVM-based feature selection is proposed after evaluation of OBCsvmFS in the
context of classification accuracy.
Fig. Classified image with distinct classes (NN-classifier)
12. Utilization/Success stories:Two approaches developed for classification of hyperspectral
remotely sensed data which can be used for applications in early warning of disease infections,
crop and vegetation growth monitoring etc.
13. Any other details:

Project 18
Project Title: Development of an early working system for the outbreak of Japanese
Encephalitis (JE) with the help of remote sensing and GIS in conjunction with the
epidemiological studies in Assam (Operational phase)
Scope and Objectives:
In the pilot phase of the project, it was attempted to develop a spatially explicit classification
model in the district of Dibrugarh, Assam capable of identifying, categorizing and ranking JE
prone areas by conducting entomological studies in corroboration with remotely sensed data.
Based on the success of the operational phase of the project, the project has been extended to
two more endemic districts viz, Tinsukia and Sivsagar.
The salient objectives of the operational phase are-
- To forecast disease onset, intensity and the villages having likely outcome at least
one month ahead of onset of the disease.
- Disseminate the early warning bulletin of the disease to the concerned health
department in Assam along with maps.
Centre : North Eastern Space applications Centre, Umiam, Meghalaya
Collaborating Agency : Regional Medical Research Centre (ICMR), Dibrugarh
Funding Agency : NESAC, Dept. of Space
Cost : Not specified
Duration: : 2008 Onwards
Study Area : Three JE endemaic districts in Assam viz., Dibrugarh, Tinsukia and
Sivsagar
Brief Methodology :
Remote sensing data have been utilized for delineating the potential JE vector habitats in the
study area. Methodology developed to forecast development of mosquito build up (especially
potential JE vectors) with the study of corresponding weather parameters. Attempt has been
made to develop models for forecasting of JE onset by establishing relationship between
weather parameters and historical data on occurrence of JE. Study has been madeto establish
relationship between JE outbreaks and environmental changes like flood, water logging,
vegetation etc. Based on the analysis of various factors, different level of categorization has
been made such as high, medium and low JE prone areas.
Data Used : IRS P6 LISS III/LISS IV

Status of the Project : Operationalised in three JE endemaic districts in Assam viz.,
Dibrugarh, Tinsukia and Sivsagar
Results of the Project :
The study shows that an integrated approach, involving meteorological data, landscape
parameters and socio-economic variables, allows early warning of JE at sub-district level. The
tools of remote sensing and GIS have helped in Forecast the disease progression across geo-
spatial domain. The JE prone villages of Dibrugarh district forecasted for the year 2012 is shown
below-
Utilization/Success Stories:
Every year in the month of March/ April early warning is made and bulletin with list of JE prone
villages sent to Health Department of Assam via Regional medical Research Centre, Dibrugarh.
These are found to be quite helpful by the Heath department in taking timely intervention
measures.
The project has been selected as Translational Research Project by ICMR, New Delhi

Project 19
1. Project title: Soil Nutrient Management Plan for a micro watershed of Ri-Bhoi District of
Meghalaya
2. Scope and Objectives The soil management plan involves evaluation of the health or quality of a
soil as a function of its characteristics, water, plant and other biological properties. It is a tool to help the
farmer to monitor and improve soil health based on their own field experience and working knowledge of
their soils. Regular use will allow them to record long term trends in soil health and to assess the effects
of different soil management practices. Again, Monitoring of spatial and temporal distribution of soil
moisture is also important as it plays most important role in nutrient uptake under rain-fed agriculture.
Agriculture in Meghalaya is mostly rain-fed and therefore, precipitation plays the most important role in
agricultural productivity. Although the average annual precipitation of Meghalaya is quite high, this is not
uniformly distributed throughout the year. Most of the annual precipitation is received during the
monsoon months of May to October leading to draught like situation during January to March. Therefore,
it is very important to know the status of soil moisture during winter (December to March) which is
critical for growing the rabi crops. Hence this project is proposed with the following objectives:
i. To prepare soil fertility map of the study area
ii. Generation of soil moisture map using multi temporal RISAT-1 SAR
data
iii. To prepare soil health card for arable land and communicate to farmers
iv. To prepare alternate land use map for sustainable development
3. Centre/Unit & Focal Point: North Eastern Space Applications Centre
4. Funding Agency: In house
5. Cost: Rs. 4.20 Lakh
6. Duration: 1 Years (2013)
7. Study area: One micro watershed of Meghalaya
8. Methodology: To prepare soil fertility map, surface soil samples will be collected based on variations
in landuse and physiography. Soil samples will be analysed in soil testing laboratory of NESAC. Soil
fertility map will be prepared for soil pH and available macronutrients i.e. NPK. Soil fertility map in
terms of pH, available Nitrogen, Phosphorus and Potassium and will be generated in Arc GIS with the
help of spatial analyst tool (Fig.2). To prepare soil moisture map back scatter coefficient will be
generated using RISAT-1 SAR data. Ground truth data will be collected in synchronization to the RISAT-
I pass and soil sample from each sample point will be collected and moisture content will be determined.
Finally soil moisture map will be generated through correlation/ regression study between back scatter

coefficient and near real time soil moisture content. The soil fertility map along with results of the soil
analysis and soil moisture map will be used to prepare soil nutrient management plan and handed over to
the respective farmers in the form of soil health cards. The soil health card will contain the information on
the soil fertility status showing the available nutrients. Based on the available nutrients and soil moisture,
fertilizer recommendations will be proposed in the card for the crop to be grown by the farmers. An
alternate land use plan will be developed based on soil, slope and existing land use map.
9. Data Used:Satellite data: IRS-P6 (RESOURCESAT-I) LISS-IV, RISAT- I data
Collateral Data: Physiography map, slope map, farmer’s name and crops to be grown
10. Status of Project: Ongoing
Progress of the project: Prepared all base maps and selected sample sites and collected soil samples
(Fig.3). Sample analysis for determining soil pH, organic carbon and available N, P, K is in progress at
soil laboratory of NESAC, Umiam.
Fig.3: Location of soil sampling sites
!(
!(!(
!(
!(!(
!(
!(
!(
!(
!(
!(
!(!(
!(
!(
9
8
7
6
54
3
2 1
0
15
14
13 12
11
10

11. Results of the Project (Kindly provide 2-3 good illustrations):
12. Utilization/success stories (Kindly provide 2-3 good illustrations):
13. Any other details:

Project 19
1. Project Title: Urban Information System of Nongpoh Town
2. Scope and Objectives: Nongpoh is the administrative centre of Ri-Bhoi district in the state of Meghalaya in India,
located on NH40, 52 kilometers from the state Capital, Shillong and 48 kilometer from
Guwahati, Assam. Nongpoh Town is located at 25° 51′ N to 25.57′ N and 91° 50′E to 91° 54′
E(Figure 1). It has an average elevation of 485 meters. Based on the requirement for
preparation of Disaster Management Plan for Nongpoh town, the Urban information system for
Nongpoh Town was prepared. The main objective of the study is to generate urban information
system of Nongpoh town. Following detailed objectives are:
I. To generate i.e. land use/land cover and base layers
II. To generate infrastructure database which includes road network, building
characteristics and location of various public, semi-public, amenities, etc.
III. To generate soil and geomorphology layers
3. Centre : North Eastern Space applications Centre, Umiam , Meghalaya
4. Collaborating Agencies : NIC, Ri Bhoi District
5. Funding Agency :North Eastern Space applications Centre, Umiam, Meghalaya
6. Cost : Nil (inhouse)
7. Total Duration : 2 years (2012-2014)
8. Study Area : Nongpoh Town,Ribhoi district of Meghalaya
9. Brief Methodology Satellite data (Cartosat-I (2007) and Resourcesat-I LISS III & LISS-IV (2011-12)) of Nongpoh town were used for extracting information of urban land-use/ land -cover, building types, geomorphology, soil and base details (roads, locations of villages and various public and semi- public services areas). Different types of buildings with information on the roof types, wall material, age of the buildings, floor materials, floor material, number of floors, roof material, structure and usage were identified.
10. Data Used : Cartosat-I (2007) and Resourcesat-I LISS III & LISS-IV (2011-12) 11. Status of the Project: On Going 12. Results:
Nongpoh town has good connectivity of road network. The national highway 40 (4 lane) pass through the town. This national highway is under construction. The town also have connectivity of state highways and district roads. Since it is the administrative town it has
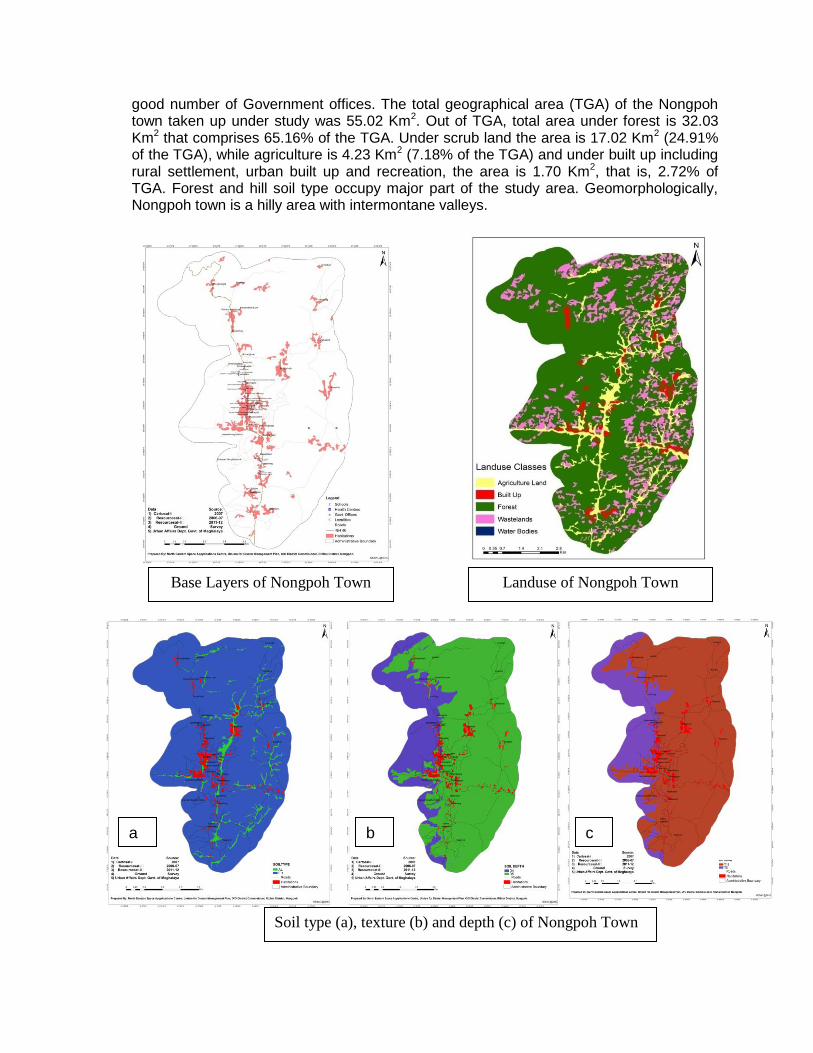
good number of Government offices. The total geographical area (TGA) of the Nongpoh town taken up under study was 55.02 Km2. Out of TGA, total area under forest is 32.03 Km2 that comprises 65.16% of the TGA. Under scrub land the area is 17.02 Km2 (24.91% of the TGA), while agriculture is 4.23 Km2 (7.18% of the TGA) and under built up including rural settlement, urban built up and recreation, the area is 1.70 Km2, that is, 2.72% of TGA. Forest and hill soil type occupy major part of the study area. Geomorphologically, Nongpoh town is a hilly area with intermontane valleys.
Landuse of Nongpoh Town Base Layers of Nongpoh Town
a
Soil type (a), texture (b) and depth (c) of Nongpoh Town
b c

Most of the buildings near to highway are of pucca and RCC type that varies from single story to
double and very few are three stories. Majority of the houses within the town area are concrete
and two floors. A good number of Assam type of houses with tin roofs are found in the town.
Some houses are rural structures made up of wood. Almost all the houses have cemented
floors. Buildings are more than 15 years old, but in the commercial areas are buildings which
are Most of the building within the core area of the town are having brick walls, whereas the
rural settlement buildings are mostly made of bamboo and other material. Residential, Mixed
built-up, Public, semi-public
and commercial buildings like Nongpoh Civil hospital, educational centres, banks, recreational
facilities such as stadium and newly built shopping complex are of concrete structure.
13. Utilisation/Success Stories: The inputs will be used for urban planning of the town and disaster management plan by the district administrators.
Building Characteristics in Nongpoh Town
Project 21
1. Project title: Impacts of land use/ land cover change with particular reference to forest cover and habitation pattern on the climate of Barak basin in North East India
2. Scope and Objective: Temporal mapping of land use / land cover (LULC) in Barak basin
and identify the driver of change and its relation to climate of the region.
3. Centre : North Eastern Space applications Centre, Umiam , Meghalaya
4. Funding agency: ISRO-GBP
5. Cost: 10 Lakhs
6. Study area: Barak basin of North Eastern India
7. Methodology: Visual interpretation of the temporal images and perform agent based
models to identify drivers of change at 50,000 scale.
8. Data Used : Landsat TM and IRS LISS III
9. Status of the project: ongoing.
10. Results: LULC mapping for two selected watersheds covering parts of Mizoram for the
years 1985, 1997, 2005 & 2010 completed. LULC change will be observed in the mapped
areas .
11. Utilization/ Success stories: nil
12. Any other details: nil

Remote Sensing and GIS Projects carried out/being carried out by
North EasternSpace Applications Centre (NESAC)
USER FUNDED
Project 22
1. Satellite based assessment of snow fed and rain fed catchment area in Lohit basin and Mapping of glacial lake in it.
2.Scope& Objective:
Many of Asian major rivers originate from Tibetan Mountains. Due to high altitude in Tibet a huge landmass covered by seasonal snow which supplies a significant amount of fresh water to the river system. The Lohit river also one of the rivers that originate in Tibetan Moutains and flow into india.
Larsen & Toubro (L & T) Limited is proposing to construct a dam across the river Lohit. As a part of hydraulic investigation L & T approached NESAC to estimate the rain feed and snow feed area in Lohit river basin and glacial lakes presents in it.
3.Centre/Unit: NESAC
4. Funding Agency: Larsen & Toubro (L&T) Limited
4.Cost: Rs 2.486
6. Duration: One year (2012)
7. Study Area:
The Lohit river is originate from South Eastern Tibet and flows in Southeastern direction
then takes western turn to enter into India. It enters into Anjaw district of
Arunachalpradesh and passes through Lohit district and enters into Assam. The study
area fall in between 960 0‟- 9700‟ East and 27030‟ - 2900‟ North.
8. Methodology
The snow because of its high reflectance is well identifiable in satellite data in visible, Near Infra Red and Short Wave Infra Red bands of electromagnetic spectrum. The complexities in the mapping of snow cover are mix with clouds, snow under vegetation and patchy snow etc. Normalized Difference Snow Index (NDSI) takes care of such complexities (H S Negi, A V Kulkari).The NDSI is analogous to the. Normalized Difference Vegetation Index (NDVI) and useful for the identification and snow/ice and discriminating snow/ice from cumulus clouds. However, identification of snow cover areas using NDSI is difficult if snow cover area mixed with vegetation. To identify snow under vegetation normalized snow index S3 was also proposed (Saito and Yamazaki 1999):
S3={NIR(RED-SWIR)}/{(NIR+RED)(NIR-SWIR)}

Where NIR, Red and SWIR are the reflectances of the near-infrared, red and shortwave infrared bands respectively. S3 uses the reflectance characteristics of snow and vegetation to reduce the errors caused by snow covered areas mixed with vegetation. Shimamura et al (2006), found the threshold value of S3 index for snow cover area greater than0.18 and snow under vegetation it is distributed from 0.05 to.18.The snow cover is a dynamic in extent and therefore seasonal (summer and winter) satellite data was used to map the temporary snow cover available in the basin.
Basin delineation:
The Lohit basin falls mostly outside India. SRTM DEM is used delineate the basin boundary. For
this purpose the DEM is classified into five classes. The classified DEM is used to visual
delineation of the basin boundary following the ridge line. The area of the catchment is
15764.42 Sq. Km.
Mapping of Glacial Lake:
Glacial lakes are bounded by snow cover. Due to high reflectance of snow cover and low
reflectance of water body it is well identifiable in visible band of satellite data in summer season.
The availability snow covers over these lakes were verified from Rabi season satellite data.
Lohit basin has 276 numbers glacial lake of different size covering total of 26.3 sq. km area.
Snow Cover Mapping
Geo coded multi date Satellite (winter and summer) were procured for the basin area and
calculated Snow index for both the season. The output image of snow indices gives the extent
of snow cover and vegetative cover of the basin. The extent of seasonal change in snow cover
was estimated by comparing the snow index map of both the season.
Using Aster Digital Elevation Model, Five elevation zones were identified in Lohit basin.
The Spatial snow cover area statistics in each elevation zone were generated in Arc GIS
environment.

11.Results:
Analyzing the satellite data by snow indices it found that Lohit basin have 7997.9 sq. km
snow cover area in winter period which is 7595.2 sq. km in summer. Other hand forest cover is
8147.5 sq. km in summer and 7744.9 sq. km in winter. It implies that snow cover area in Lohit
basin reduces by 402.6 sq. km in summer than winter season. Moreover, seasonal analysis of
satellite data shows that Lohit catchment has 276 numbers glacial lake of different size covering
total of 26.3 sq. km area.
Snow fed area:
The maximum snow cover area is the snow feed area for a basin containing snows in it.
Analysis of winter season data shows higher snow cover extent than summer. In Lohit basin
snow cover extent is 7997.87 sq. Km. which is 50.73 % of the catchment area.
Rain fed area:
The rain fed catchment area is the portion of the basin area where rainfall is expected
during any part of the year and any year. Using satellite data it is difficult to delineate the rain
fed area. The occurrence of rainfall over the snow cover is also a possible event. Neglecting the
occurrence of rainfall over the snow cover area, non-snow portion of the basin is assumed as
the rain fed area.

Project 23
1. Project Title: Ortho product generation and thematic map preration for ETALIN Hydro Electric Power Project. 2. Scope & Objective The objectives of the project are a. To generate Contours from Cartosat-1 stereo data at 10m interval of Road Section (s)
corridor from ROING (Lower Dibang Valley District) to Etalin / Attunali (Dibang Valley District) of Arunachal Pradesh using Cartosat-1 (Stereo) Imagery.
b. To prepare four FCC (False Colour Composite) hard copy prints covering Survey of India 1: 250K Map Sheet Nos. (i) 82 O (ii) 82 P (iii) 91 C (iv) 91 D.
3. Centre/Unit North Eastern Space Applications Centre, Umiam, Meghalaya (NESAC) 4. Funding Agency: Jindal Power Limited, Gurgaon 5. Project Cost Total cost of the project is Rs 427,964/- (Rupees four lakhs twenty seven thousand nine hundred and sixty four only) 6. Project Duration : June 2012 - Oct 2012 7. Study Area The study area is Road Section (s) corridor from ROING (Lower Dibang Valley District) to Etalin / Attunali (Dibang Valley District) of Arunachal Pradesh. The approximate total length of existing road is 180 km. 8. Methodology The objective of the project has been realized based on advanced state-of-art technology, including: 1. Ortho-rectified Cartosat-1 satellite images from Indian Remote Sensing Satellites forming
the core of the 1:10K mapping activity. 2. Referenced ortho-rectified high resolution satellite imagery and Digital Elevation Model have
been used for ortho-rectify the mapping. 3. The Digital Photogrammetry and GIS techniques have been used to generate the Digital
Elevation Model with 10m resolution, ortho-rectified Cartosat-1 satellite imagery and generation of thematic maps.
Methodology is described in details in the following flowchart.

9. Data Used Satellite imagery: IRS P5 Cartosat I with spatial resolution 2.5m are used for the preparation of thematic maps. SOI toposheets: 1:50,000 scale SOI toposheets as provided by the funding agency for the study area. 10. Project Status: Completed. 11. Results of the Project The deliverables as per the objectives are submitted to the user funding agency. CARTO-DEM presented planimetric accuracy compatible with the scale 1:10,000 and altimetric accuracy compatible with the scale 1:25,000. 12. Utilization/Success stories The data is been used by the funding agency for Designing of Road Widening / Bridges / Via-ducts / Tunnels and Stabilization of Hill slopes from Geological point of view. 13. Any other details: nil

Project 24
1. Project Title : Remote Sensing & GIS based Forest Working Plan Inputs
Preparations for Mizoram state
2. Scope and Objectives:
Objectives of the project are:
Preparation of forest canopy density map on 1:12,500 scale using IRS-P5 sensor
data and type map on 1:50,000 scale using LISS-III sensor data.
Designing Forest Inventory Procedures through sampling.
Preparation of area statistics through GIS for various levels of forest management.
Preparation of quantitative forest growing stock including bamboo details at forest
Compartment level.
To supply remote sensing based inputs for the Working Plan for all forest divisions
including Autonomous District Council areas.
3. Centre/Unit : North Eastern Space applications Centre, Umiam , Meghalaya
4. Funding Agency :North Eastern Council (NEC)
5. Cost : Rs. 57.43 Lakh
6. Duration : 4 years (April 2010 – March, 2014)
7. Study Area : Entire Mizoram State.
8. Brief Methodology :
To prepare a forest working plan for a division, first stage is to prepare the updated
status of vegetation in the form of stock maps and to carryout field inventory for the
assessment of quality and quantity of growing stock. Stock maps are generated with
information on canopy density, regeneration status, species composition and site
quality. A schematic of the steps involved in preparing the stock map is given in
following figure.

Density mapping
For the generation of forest density map, P5 imageries were used for visual image
interpretation at 1:12,500 scale for four density classes i.e., Class I (0-10%), Class II
(10-40%) , Class III ( 40-70%), & Class IV (>70%), for all the forest divisions.
Vegetation type mapping
Based on the spectral signatures, computer-based image processing and analysis
techniques were adopted to delineate and map the vegetation types.
Elevation, Slope & Aspect
Elevation, slope & Aspect map prepared from available DEM were used in the study.
Infrastructure Details
Infrastructure details such as forest divisional boundaries, ranges, blocks and
compartment neatly drawn on 1:50,000 scale collected from respective DFOs were
digitized and superimposing on the classified imagery and stratified maps for
determining the area statistics in each compartment levels.
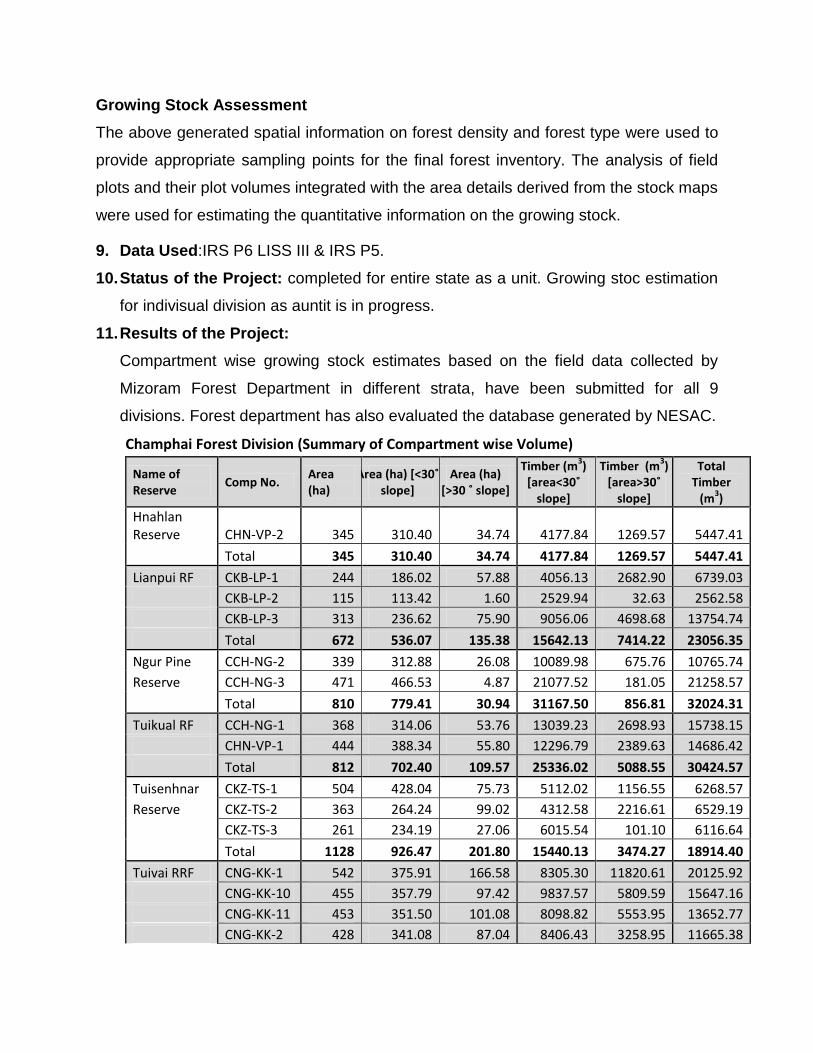
Growing Stock Assessment
The above generated spatial information on forest density and forest type were used to
provide appropriate sampling points for the final forest inventory. The analysis of field
plots and their plot volumes integrated with the area details derived from the stock maps
were used for estimating the quantitative information on the growing stock.
9. Data Used:IRS P6 LISS III & IRS P5.
10. Status of the Project: completed for entire state as a unit. Growing stoc estimation
for indivisual division as auntit is in progress.
11. Results of the Project:
Compartment wise growing stock estimates based on the field data collected by
Mizoram Forest Department in different strata, have been submitted for all 9
divisions. Forest department has also evaluated the database generated by NESAC.
Champhai Forest Division (Summary of Compartment wise Volume)
Name of Reserve
Comp No. Area (ha)
Area (ha) *<30˚ slope]
Area (ha) *>30 ˚ slope+
Timber (m3)
*area<30˚ slope]
Timber (m3)
*area>30˚ slope]
Total Timber
(m3)
Hnahlan Reserve CHN-VP-2 345 310.40 34.74 4177.84 1269.57 5447.41
Total 345 310.40 34.74 4177.84 1269.57 5447.41
Lianpui RF CKB-LP-1 244 186.02 57.88 4056.13 2682.90 6739.03
CKB-LP-2 115 113.42 1.60 2529.94 32.63 2562.58
CKB-LP-3 313 236.62 75.90 9056.06 4698.68 13754.74
Total 672 536.07 135.38 15642.13 7414.22 23056.35
Ngur Pine CCH-NG-2 339 312.88 26.08 10089.98 675.76 10765.74
Reserve CCH-NG-3 471 466.53 4.87 21077.52 181.05 21258.57
Total 810 779.41 30.94 31167.50 856.81 32024.31
Tuikual RF CCH-NG-1 368 314.06 53.76 13039.23 2698.93 15738.15
CHN-VP-1 444 388.34 55.80 12296.79 2389.63 14686.42
Total 812 702.40 109.57 25336.02 5088.55 30424.57
Tuisenhnar CKZ-TS-1 504 428.04 75.73 5112.02 1156.55 6268.57
Reserve CKZ-TS-2 363 264.24 99.02 4312.58 2216.61 6529.19
CKZ-TS-3 261 234.19 27.06 6015.54 101.10 6116.64
Total 1128 926.47 201.80 15440.13 3474.27 18914.40
Tuivai RRF CNG-KK-1 542 375.91 166.58 8305.30 11820.61 20125.92
CNG-KK-10 455 357.79 97.42 9837.57 5809.59 15647.16
CNG-KK-11 453 351.50 101.08 8098.82 5553.95 13652.77
CNG-KK-2 428 341.08 87.04 8406.43 3258.95 11665.38

CNG-KK-3 543 421.44 121.16 26361.20 13468.20 39829.39
CNG-KK-4 391 335.80 55.65 22591.21 5307.96 27899.17
CNG-KK-5 385 327.01 57.79 18685.95 7144.53 25830.48
CNG-KK-6 464 299.25 165.24 9774.54 10339.53 20114.08
CNG-KK-7 303 245.87 56.82 5295.59 2747.09 8042.68
CNG-KK-8 403 261.88 140.78 8191.28 5681.64 13872.91
CNG-KK-9 439 386.23 52.54 6416.93 1400.19 7817.13
Total 4806 3703.76 1102.11 131964.83 72532.24 204497.06
Tuivawl RRF CKK-SC-1 410 402.02 7.53 1260.59 60.47 1321.06
CKK-SC-2 316 309.08 7.31 2544.63 26.59 2571.22
CKK-SC-3 425 398.60 26.42 9017.82 1011.57 10029.39
CKK-SC-4 356 336.82 19.51 4436.80 676.10 5112.90
CKK-SC-5 377 352.54 24.15 8320.01 1086.87 9406.88
CKK-SC-6 237 230.62 6.46 7280.99 316.09 7597.08
CKK-SC-7 391 364.23 26.47 17616.76 3079.06 20695.81
CKK-SC-8 375 340.79 34.45 9185.22 1629.99 10815.22
Total 2887 2734.70 152.31 59662.83 7886.74 67549.57
12. Utilization/ Success stories: The database generated from the project in terms of
compartment wise growing stock, density maps for all the Reserved Forests &
Riverine Reserved Forests are used by the Mizoram State Forest Department for
writing the Forest Working Plans for different Forest Divisions of the state.

Project 25
1. Project title: Remote Sensing and GIS Based Input for Hazard, Vulnerability and Risk
Assessment (HRVA) of Guwahati city, Silchar, Dibrugarh towns and Dhemaji district,
Assam.
2. Scope & Objectives: The project is funded by Assam State Disaster Management Authority
(ASDMA) under the Revenue and disaster management department, Government of Assam.
The project has two broad objectives. (I) To prepare GIS based multi hazard maps for Guwahati
city, Silchar & Dibrugarh towns (1:10,000 scale) and for Dhemaji district (1:25,000 scale). (II) To
prepare vulnerability and risk assessment maps for probable multi hazards for the areas under
study.
3. Centre/Unit: North Eastern Space Applications Centre.
4. Funding Agency:Assam State Disaster Management Authority (ASDMA).
5. Cost: Total 70.0 lakh.
6. Duration: 2 years& 6 months (March, 2013)
7. Study Area(s):
(i) Guwahati City
(ii) Dibrugarh Town
(iii) Silchar Town
(iv) Dhemaji District
8. Methodology:
The project is carried out in 3 major phases:
assessment of frequency-magnitude- damages
related to past hazardous events for each study
areas ; preparation of hazard zonation maps for
probable hazards ; and assessment of physical &
social vulnerability and risk for each hazards.
Hazard zonation maps are prepared considering
available historical records, frequency of each hazard,
various resource/thematic maps in spatial domain, and sophisticated models for assessing
nature, their probable impact to the study areas.
Vulnerability and risk was assessed for infrastructure and population through socio-economic
survey using the samples of buildings derived from high resolution data along with physical
survey of population characteristics and their pattern and temporal distribution. The use of
space technology, especially the high resolution satellite data of Worldview coupled with
Cartosat 1 have made it possible to identify buildings types in the study area. By integrating
all these in GIS platform, final risk map for each of the hazard under study were generated.
9. Data Used: Cartosat I stereo data, World View (WV) I and WV II Multispectral data of 2009-
2011 were used for generation of various resource/thematic maps in 1:10,000 scale using
UTM projection and WGS84 datum. In addition, data from various ground surveys carried
out during 2011-2012 are integrated for deriving hazard zonation, vulnerability and risk
maps. These are, Real Time Kinematic (RTK) / Electronic Total Station (ETS) survey in
urban areas for generation of hybrid Digital Elevation Model (DEM) of 1 m spatial resolution
used for flash/urban flood hazard zonation; determination of rock and soil strength, Rock
Quality Designation (RQD) analysis used for landslide hazard zonation; population and
building survey used for vulnerability and risk assessment.
10. Status of project: Completed
11. Results: Findings of the project are presented in four
different atlases of which Volume I is for the Guwahati city,
Volume II is for Silchar Town, Volume III is for Dibrugarh
Town and Volume IV is for Dhemaji District. Different hazard
classes as well as risk levels are depicted by colour coding
in map forms. Percentage areas, locality details as well as
approximate number of people and their distribution in
various wards/revenue circles are provided in tabular form. For each hazard, detailed
recommendations as well as future scopes are also highlighted in the report.
12.Utilization/Success Stories: NA (results/atlas have been submitted one year back).
13.Any other details:
Based on the findings of this project, ASDMA as well as Guwahati Metropolitan
Development Authority (GMDA) have come forward with new proposals to NESAC.

Project No. 26
Project title:Remote Sensing and GIS Based Landslide Hazard Zonation map and reservoir rim
stability studies for Subansiri Lower Hydro-Electric (SLP).
2. Scope & Objectives:A reconnaissance level of study using aerial photographs or remote
sensing imagery is must for Pre-feasibility phase of reservoir slope stability studies as per the
ICOLD bulletin guideline followed for construction of dams and reservoir. The study has two
major objectives, namely to prepare Landslide Hazard Zonation (LHZ) / Landslide
susceptibilityMap in 1:25,000 scale and to assess Reservoir rim stability with special reference
to past earthquake incidences. Generation of contours from Cartosat-1 stereo data at 10m
interval as well as preparation of cross-sections at 2km interval in present land slide areas are
other two objectives of the project.
3.Centre/Unit: North Eastern Space Applications Centre.
4. Funding Agency: NHPC, Ltd.
5. Cost: 29,28,270.35lakh
6. Duration: 1 year and 6 months, June'2013
7. Study Area: The study area is about 659.3 sq km, located near Gerukhamukh area of Assam-
Arunachal Border and mostly covered by dense vegetation and is one of the severely landslide
affected areas during 1950's Assam Great Earthquake.
8. Methodology:In the present study, contours from Cartosat-1 stereo data at 10m interval is
generated using digital photogrammetric techniques. Landslide Hazard Zonation(LHZ) rather
landslide susceptibility mapping was carried qualitatively, following major steps – preparation
landslide inventory (temporal) from image interpretation, integration of various thematic
parameter, namely, lithology, slope criteria, geological structure/lineament density, and drainage
density using Analytical Hierarchy Process (AHP). However, the landslide susceptibility map was
prepared based on the assumption that the factors which caused slope-failure in a region are the
same as those which will generate landslides in the future also.In absence of approach route and
inaccessible terrain condition quantitative evaluation of the reservoir rim stability could not be
addressed. However, Stability of the reservoir rim was qualitatively evaluated considering
proximity of the reservoir area with respect to different landslide susceptibility zones and spatial
distribution of landslides.

9. Data Used: Temporal satellite imagery of Landsat TM and ETM (1987,1990,1995,1996 and
2000), IRS P5 (Cartosat 1stereo data from 2007 to 2011 ) and IRS P6 (Resourcesat, LISS IV
MX of 2008,2009 and 2012) along with SOI topographical maps( surveyed during 1960-62 and
1963-64) were used for the study.
10. Status of project: Completed
11. Results: In the study area dominant drainage pattern is dendritic, followed by sub dendritic
and trellis indicating homogeneity in rock types, structural control and folded sedimentary rocks
respectively. The study area mainly falls in Siwalik Group, Gondwana Super Group and
quartzite of Miri Fr, while majority portion of the reservoir area fall under Siwalik Group and
Gondwana Super Group. Landslide Susceptibility map was prepared based on the assumption
that the factors which has caused slope-failure in a region are the same as those which will
generate landslides in the future also. In absence of quantitative data, stability of the reservoir
rim was qualitatively evaluated considering proximity of the reservoir area with respect to
different landslide susceptibility zones and spatial distribution of landslides. A good correlation
of landslide distribution with slope is observed in the study area. From temporal landslide
inventories from 1962-2012, presently only a few landslides of smaller dimension are seen
within the peripheral region of reservoir rim, mainly contributing to watersheds of tributaries of
river Subansiri. In the 1950
landslide area, presently
vegetation growth is observed with
few smaller landslides along the
radial cracks. 29.46%, 55.28% and
15.25% areas within the reservoir
rim falls under low, moderate, high
landslide susceptibility lasses
respectively. Approximately at
94°19ʹ 26.73ʺ longitude and 27° 44ʹ
03.55ʺ latitude, reservoir rim is in
direct connect with an active
landslide (probably a rockslide),
located near Lelin further up of Cross section profile at 2km interval in present land slide areas
derived using Carto DEM. Section 18 is drown across an active
rock slide area in quartzite rock of Miri Formation.

Subansiri and Sidi Kro confluence near the tail end of the reservoir rim. This slide is active since
1987. However, presently no blockage is seen on the Subansiri river course. In addition to
landslide(s), siltation may cause problem to the reservoir area due to extensive shifting
cultivation near Siberite, Tango and Gengi. Appropriate engineering measures need to be
taken to control siltation too.
12. Utilization/Success stories: The findings of the study will help NHPC Limited in taking up
detailed field base study as well as necessary precautionary measures towards reducing landslide
risk in reservoir area and at Dam site.
13. Any other details: NA

Project No. 27
Project title: Geo-Spatial Studies for Locating Suitable Sites of Mobile Communication Towers in
North Eastern Region
2. Scope & Objectives:The objectives of the project are
To identify, locate and generate the latitude and longitude information of the village
names from the Census data of 2011.
To prepare GIS map at 10,000 scale with the villages and road networks.
To identify the uncovered villages by the existing telecom towers/networks.
To locate suitable sites/village point locations for setting up Telecommunication tower by
comparing and analyzing different viewshed from village point locations acting as
observer point.
3.Centre/Unit: North Eastern Space Applications Centre.
4. Funding Agency: USOFA, Ministry of Communications & IT
5. Cost: 36,49,467 lakh
6. Duration: One month, January 2013
7. Study Area:
The study area has been divided into two phases, namely, Phase-I which comprises of six
states of NER (Meghalaya, Manipur, Mizoram, Nagaland, Sikkim and Tripura States) and
Phase-II comprises of Assam and Arunachal Pradesh States.
Fig. 1: Study Area
8. Methodology:
Survey of India (SOI) toposheets of the scale 1:50,000 are used for generation of base map.
Stereo pair cartosat-1 data are used for generation of Digital Elevation Model and contour
map. Ortho-rectified high resolution Cartosat-1 satellite data are used for updating of road

network and to make further analysis. The list of villages provided by Department of
Telecommunication, Govt of India, based on the census 2011 data are located and updated
using the base map and other legacy and ancillary data available at NESAC. The latitude
and longitude for the villages of the respective states in NER are generated. These villages
are then clustered based on line of sights with reference to the topographic structure for the
respective states of NE region using CartoDEM. Considering the coverage estimations and
height of the tower (based on the TRAI recommendation), the analysis for the optimization
of communication tower locations are done by generation of Viewsheds and Line of Sights,
using 3D GIS technique. The methodology flow chart is shown below:
9. Data Used:
Cartosat-1 stereo pair imagery for DEM and contour generation and identification of
village locations

Resourcesat-I & II LISS – IV MX data mainly for thematic layers generation
Census-2011 data for village names
Existing maps and literature
Existing tower location information from DoT
SOI toposheets at 1:50,000 scale
10. Status of project: Completed
11. Results: The state-wise lists of identified and located uncovered villages, as per the list
provided by Department of Telecommunication & IT, along with the geo-coordinates are
submitted to the user as per the terms and conditions of the project definition.
12. Utilization/Success stories:
• Telecommunications Consultants India Ltd (TCIL) could prepare the DPR for 2G coverage in
uncovered villages of North Eastern States based on the resultant of this project.
• The Union Cabinet has given its approval for implementing a Comprehensive Telecom
Development Plan for the Northeastern region [Source: the Shillongtimes, dated 11th Sep,
2014]
13. Any other details:
Project No. 28
1. Project title: Study of the catchment of Ranganadi Hydroelectric Power Plant
(RHEP)using remote sensing & GIS to assess the status of soil erosion and silt
deposition in the reservoir .
2.Scope & Objective:
The soil of the catchment of Ranganadi Hydroelectric Power Plant (RHEP) is non cohesive
resulting high rate of siltation in the reservoir. Knowing this fact North Eastern Electric Power
corporation (NEPCO) Ltd. wanted to estimate the rate of soil erosion in the catchment area and
siltation in the reservoir using RS and GIS. The reservoir capacity was re-estimated using RS
and GIS and it was compared to the capacity estimated using echo sounder.
3.Centre/Unit: NESAC
4. Funding Agency: NEEPCO
4.Cost: Rs. 18,86,161
6. Duration: Two Years
7.Study Area: Catchment area of RHEP fall partially in Lower Subansiri and Papumpare district
of Arunachal Pradesh.
8. Methodology:
Morgan, Morgan and Finney methods were used for estimation of soil erosion from the
catchment and siltation in the reservoir. Different parameters like land use land cover, soil
texture, physiography etc. required for this model were estimated using RS and GIS at 1:25000
scale. The model was executed using geospatial tool in Arc GIS.
Finite difference methods adopted to estimate the reservoir capacity . The basic concept
is to find out the water spread area from satellite data for different known water levels between
(Minimum draw down level) MDDL and FRL (Full reservoir level). A relationship between water
depth and corresponding water spread of the reservoir was established. With this relationship,
reservoir volume was estimated using differential calculus at sufficient numbers of water level to
develop reservoir capacity curve.
9. Data used: Cartosat 1 and LISS IV MX
10.Status of Project: Completed
11.Results:

The total soil erosion and the transport capacity of runoff compared in GIS environment to
estimate the net soil loss. It is
found that the study area
having lower value of
transport capacity than the
total soil erosion. Therefore,
the area weighted transport
capacity i.e. As 15.6 Kg/m2
of runoff is the net annual
soil loss from the study area,
which is as per the report
prepared by Department of
Agriculture, Arunachal
Pradesh (Report of
Department of Agriculture'
2012). The map of net soil
erosion is same as the
transport capacity map.
Capacity Curve of Ranganadi reservoir
Legend
Agricultural Land-Crop Land
Built up area (Rural)
Forest-Forest Plantation
Forest/Evergrean/Semievergreen/Dense/Closed
Others/Shifting Cultivation/Abandoned
Others/Shifting Cultivation/Current
Waterbodies/Reservoirs/Tanks/Perennial
Waterbodies/River/Stream/Perennial
Built up area (Urban)
Forest-Evergreen / Semi Evergreen/ Open
Wastelands/Barren Rocky/Stony Waste
Wastelands/Scrub Land/Dense Scrub
Wastelands/Scrub Land/Open Scrub
±
Legend
Kg/Sq.m
150.0000001 - 300
300.0000001 - 500
500.0000001 - 844.8
844.8000001 - 950.4
950.4000001 - 1,056
0
0 - 1
1.000000001 - 50
50.00000001 - 100
100.0000001 - 150
Legend
Kg/Sq.m
0
0 - 1
1 - 50
50 - 100
100 - 150
150 - 300
300 - 500
500 - 844.8
844.8 - 950.4
950.4 - 1,056
Soil erosion map of the catchment area (Kg/M2)

Project No. 29
2. Projecttitle:Watershed ATLAS of Meghalaya
2. Scope & Objectives:
watershed is a unit of area on the earth whose boundary is defined by the topography of the earth.
further, it can be defined as a unit of area bounded by the nearest ridgeline from where all surface
runoff flows into the same outlet. Now a days it is felt necessary to do management or development
activities of natural resources on the basis of watershed because of it’s homogeneity in different natural
phenomenon. so, delineation of watersheds plays an important part in natural resources
management.conservation of land and water resources taking watershed as a unit for interventions is
well accepted and in vogue since many decades. the formulation of proper watershed management
programme for sustainable development requires priority classification of watershed so that the limited
financial resources are prudentially allocated. a watershed with very high soil erosion needs to be given
higher priority for soil conservation measures to be adopted. It is not only essential to delineate
watershed but also to codify them so that each watershed could be identified as an individual entity
with its linkage with bigger units viz. region, basin, catchment and sub-catchment. Water resources
development has many faces. at macro level, it is primarily dealt through construction of large dams and
reservoirs for irrigation and power generation. at micro level, watershed development programme plays
a major role for conservation of soil and water resources. however both macro and micro level activities
need basic hydrologic and tomographic information such as drainage network, water availability,
gradient etc.. for deriving manageable unit of interventions.
3.Centre/Unit:North Eastern Space Applications Centre 4. Funding Agency: Soil Conservation Department of Meghalaya 5. Cost: Rs 1.316 lakhs
6. Duration: 6 months 7. Study area: Meghalaya 8. Methodology:
the watersheds are delineated with the help of topographicmaps as well as sattelite data. the
boundaries of the watershed are traced by following the ridge line surrounding to a stream mouth.
limiting to certain range of area fixed by national bureau of soil sciences and land use planning, there
are eight natural units like region, basin, catchment, sub-catchment, watershed, sub-watershed, mini
watershed and microwatershed. alpha- numeric symbolic codes have been used to designate various
stages of delineation. these consist of alternate Arabic/ numerals and engish alphabet. using irs p5
data/carto dem along with topographic maps, the state of Meghalaya is divided upto microwatershed
level. Carto DEM was used to delineate watershed boundaries in the Bangladesh bordering area where

soi toposheet are not available. the drainage layer was created using carto DEM with the help of
spatial analysis tools in arc gis. the drainage layer was overlayed to the classified carto DEM to delineate
the watershed boudaries
9. Data Used: 10. Status of project: Completed 11. Results of the project: Entire Meghalaya State falls in Brahmaputra & North eastern state rivers region, it covers partly two basin, three catchments, namely “Bangladesh border to kalang confluence”, “kalang to dhansiri confluence” and the third is “south flowing drainage of Meghalaya”. The state has 8 numbers of Sub-catchments, 35 Watersheds, 179 Sub-watersheds, 595 Mini watersheds and 2776 Micro watersheds.
12. Utilization/Success stories: Utilized for preparation of IWMP, IDLP projects. 13. Any other details:

Project No. 30
1 Project Title:Application of Remote Sensing and GIS in forecasting inflow/discharge into the reservoir of Kameng Hydro Electric Project
2. Scope & objectives:
Hydro Electric Power Project are the prime among all Water Resources Development activities.
Appropriate reservoir operation method may increase capacity of power generation
tremendously. It may help greatly to save the downstream of the reservoir from flood like
situation. Appropriate management of reservoir includes operation of sluice gate judiciously.
Advance Knowledge of discharge inflow into the reservoir may help in judicious operation of
reservoir gate.North Eastern Electric Power Corporation Limited (NEEPCO) is an electricity
generation public sector undertaking own by the Government of India under the Ministry of
Power. Kameng Hydro Electric Project (600 MW) is one of NEEPCO's ongoing project. It has
been constructed as a run of river schemes situated in west Kameng District of Arunachal
Pradesh. Under R&D, NEEPCO wants have a Remote sensing and GIS based inflow/ discharge
forecasting system for Kameng reservoir and the work has been given to North Eatern Space
Applications Centre.The scope of the Project is as follows:
1. Forecasting of inflow/discharge into the reservoir of Kameng Hydro Electri Project
through remote sensing and GIS. (Using HEC-GeoHMS, HEC-HMS & HEC-Geo RAS)
2. Development of Model and Submission of Phase -I report
3. Validation of the Model and Submission of final report
3. Centre/Unit: NESAC 4. Funding Agency: NEEPCO 5. Cost:` 18.4 lakhs
6. Duration: 2 years (2013-2015) 7. Study area: catchment area of Kameng Hydro Electric Power Project 8. Methodology:
Coupled Hydro-Meteorological models are run worldwide to forecast flood; advanced estimation
of exact rainfall plays the crucial role here. During the last decade only technique employed to
predict the weather condition for advanced forecast is the high resolution Numerical Weather
Prediction (NWP) model. WEATHER REASEARCH FORECASTNG MODEL (WRF) is one of
the mostly used NWP models in the weather forecast community because of its highly developed
physics schemes and better time integration method to give improved output at shorter duration.
To run an NWP model the basic inputs are the initial condition of the atmosphere and the
boundary condition of the domain. These data are available from NCEP global forecast system

(GFS) analysis at 0.5°×0.5° horizontal resolution from
ftp://ftp.ncep.noaa.gov/pub/data/nccf/com/gfs/prod. Until and unless the initial condition
represents the true state of the atmosphere, the model forecast cannot be accurate. In recent time,
the common practice to improve the initial condition is assimilation of local atmospheric
conditions such as Satellite radiances, Surface and Upper Air data from various sources. With
WRF 3DVAR local observed data can be ingested in the model to further improve the initial
conditions. In our study we are using data for assimilation from various sources such as AWS,
INSAT-3D, AMSUA, MHS, HIRS and GFS Prepbufr.
A distributed hydraulic modeling was done with HEC-HMS. The spatial inputs required for this
model was created in HEC-GeoHMS (ArcGIS 10.2 version). The rainfall forecasted in 24 hours
advance is used to feed to this hydraulic model to forecast the peak inflow into the reservoir.
9. Data Used:AWS, INSAT-3D, AMSUA, MHS, HIRS, GFS, Cartosat1stereo pair (DEM) etc
10. Status of project: Ongoing 11. Results of the project: Development of the model is completed, validation is in progress.
The layout of HEC-HMS model is shown in the figure.
Layout of the HEC-HMS model
Project No. 31

1. Project Title : Remote Sensing based inputs for E-Working Plan of Arunachal
Pradesh
2. Scope and Objectives:
Objectives of the project are:
Preparation of forest canopy density map on 1:12,500 scale using IRS-P5 sensor
data and type map on 1:50,000 scale using LISS-III sensor data.
Preparation of area statistics through GIS for various levels of forest management.
Preparation of quantitative forest growing stock.
3. Centre/Unit : NESAC, Umiam , Meghalaya
4. Funding Agency :Arunachal Pradesh Forest Department
5. Cost : Rs. 451.72 Lakh
6. Duration :4 years (April 2011 – March, 2015)
7. Study Area :Entire Arunachal Pradesh.
8. Brief Methodology :
Preparing an updated status of vegetation in the form of stock maps is a pre-requisite
for writing a forest working plan for all RFs under respective divisions. Strategic field
surveys base on RS & GIStechniques for the assessment of quality and quantity of
growing stock has found to be efficient and cost effective. A schematic diagram of the
steps involved in preparing the stock map is given in following figure.
Density mapping

For the generation of forest density map, P5 imageries are used for visual image
interpretation at 1:12,500 scale for four density classes i.e., Class I (0-10%), Class II
(10-40%) , Class III ( 40-70%), & Class IV (>70%), for the entire divisions.
Vegetation type mapping
Based on the spectral signatures, computer-based image processing and analysis
techniques are adopted to delineate and map the vegetation types.
Elevation, Slope & Aspect
Elevation, slope & Aspect map prepared from available DEM are used in the study.
Infrastructure Details
Infrastructure details such as forest divisional boundaries and ranges neatly traced on
1:50,000 scale collected from DFO were digitized and superimposing on the classified
imagery and stratified maps for determining the area statistics in each Range.
Growing Stock Assessment
The above generated spatial information on forest density and forest type were used to
provide appropriate sampling points for the final forest inventory. The analysis of field
plots and their plot volumes integrated with the area details derived from the stock maps
will be used for estimating the quantitative information on the growing stock.
9. Data Used:IRS P6 LISS III & IRS P5.
10. Status of the Project: on-going
11. Results of the Project:
Forest type maps and density maps generated were used for stratifying the forest
including elevation criteria. Sampling points were allotted and provided to Forest
Department for collecting the field sampling. Tree enumeration data are analysed to
generate strata wise average volume to estimate the timber volume stocks.

12. Utilization/ Success stories: The database generated from the project in terms of
compartment wise/Range wise growing stock, density maps etc., will be used by the
Arunachal Pradesh Forest Department for writing the Forest Working Plans for.
Arunachal Pradesh
Forest Crown density

Project 32
1. Project Title: Preparation of land resource and land use maps of Meghalaya of
Forest Working Plan Inputs Preparations for Meghalaya state
2. Scope and Objectives:
Objectives of the project are:
Preparation of forest canopy density map on 1:10,000 scale using IRS-P5 sensor
data and type map on 1:50,000 scale using LISS-III sensor data.
Designing Forest Inventory Procedures through sampling.
Preparation of area statistics through GIS for various levels of forest management.
Preparation of quantitative forest growing stock including at forest Compartment
level wherever available.
Preparation of other layers like base, slope, aspect, waterbodies & river maps.
To supply remote sensing based inputs for the Working Plan for all forest divisions
including Autonomous District Council areas.
3. Centre/Unit : North Eastern Space applications Centre, Umiam , Meghalaya
Collaborating Centre: Meghalaya Forest Department &
4. Funding Agency :Meghalaya Forest Department, Shillong
5. Cost : Rs. 216.27 lakh.
6. Duration : 18 months (April 2012 – March, 2015)
7. Study Area : Entire Meghalaya State.
8. Brief Methodology :
In preparation of working plan inputs, first stage is to prepare the updated the status of
vegetation in the form of stock maps and to carryout field inventory for the assessment
of quality and quantity of growing stock. Stock maps are generated with information on
canopy density, regeneration status, species composition and site quality. A schematic
of the steps involved in preparing the stock map is given in following figure.

Density mapping
For the generation of forest density map, P5 imagery used for visual image
interpretation at 1:12,500 scale for four density classes i.e., Class I (0-10%), Class II
(10-40%) , Class III ( 40-70%), & Class IV (>70%), for all the forest divisions.
Vegetation type mapping
Based on the spectral signatures, computer-based image processing and analysis
techniques adopted to delineate and map the vegetation types.
Elevation, Slope & Aspect
Elevation, slope & Aspect map prepared from available DEM and used in the study.
Infrastructure Details
Infrastructure details such as forest divisional boundaries, ranges, blocks and
compartment neatly drawn on 1:50,000 scale collected from respective States Forest

Departments for superimposing on the classified imagery and for determining the area
statistics in each compartment levels.
Growing Stock Assessment
The above generated spatial information on forest density and forest type details used
to provide appropriate sampling intensity for the final forest inventory. The analysis of
field plots and their plot volumes integrated with the area details derived from the stock
maps for estimating the quantitative information on the growing stock.
9. Data Used:IRS P6 LISS III & IRS P5.
10. Status of the Project: ongoing
11. Results of the Project:
Final database for all 27 RFs under 3 forest divisions have been submitted and
Working plan for these three division approved by MoEF. Database for 39 blocks to
prepare working scheme is in grogress.

12. Utilization/ Success stories: Thedatabase thus generated used by the Meghalaya
State Forest Department for writing the Forest Working Plans for the state.
Meghalaya
(Forest crown density)

Project 33
1. Remote Sensing & GIS based Forest Working Plan Inputs Preparations for 21
Forest Divisions of Assam.
2. Scope and Objectives:
Objectives of the project are:
Preparation of forest canopy density map on 1:10,000 scale using IRS-P5 sensor
data and type map on 1:50,000 scale using LISS-III sensor data.
Designing Forest Inventory Procedures through sampling.
Preparation of area statistics through GIS for various levels of forest management.
Preparation of quantitative forest growing stock including at forest Compartment
level wherever available.
Preparation of other layers like base, slope, aspect, waterbodies & river maps.
To supply remote sensing based inputs for the Working Plan for all forest divisions
including Autonomous District Council areas.
3. Centre/Unit : North Eastern Space applications Centre, Umiam , Meghalaya
Collaborating Centre: Assam Forest & Environment Department, Assam
& ARSAC, Guwahati
4. Funding Agency :Assam Forest & Environment Department, Guwahati,
Assam
5. Cost : Rs. 147.23 lakh.
6. Duration : 3 years (April 2012 – March, 2016)
7. Study Area : 21 Forest Divisions of Assam.
8. Brief Methodology :
In preparation of working plan inputs, first stage is to prepare the updated the status of
vegetation in the form of stock maps and to carryout field inventory for the assessment
of quality and quantity of growing stock. Stock maps are generated with information on
canopy density, regeneration status, species composition and site quality. A schematic
of the steps involved in preparing the stock map is given in following figure.

Density mapping
For the generation of forest density map, P5 imagery used for visual image
interpretation at 1:12,500 scale for four density classes i.e., Class I (0-10%), Class II
(10-40%) , Class III ( 40-70%), & Class IV (>70%), for all the forest divisions.
Vegetation type mapping
Based on the spectral signatures, computer-based image processing and analysis
techniques adopted to delineate and map the vegetation types.
Elevation, Slope & Aspect
Elevation, slope & Aspect map will be prepared from available DEM and used in the
study.
Infrastructure Details

Infrastructure details such as forest divisional boundaries, ranges, blocks and
compartment neatly drawn on 1:50,000 scale to be collected from respective Forest
Division of Forest Departments for superimposing on the classified imagery and for
determining the area statistics in each compartment levels.
Growing Stock Assessment
The above generated spatial information on forest density and forest type details will be
used to provide appropriate sampling intensity for the final forest inventory. The analysis
of field plots and their plot volumes integrated with the area details derived from the
stock maps for estimating the quantitative information on the growing stock.
9. Data Used:IRS P6 LISS III & IRS P5.
10. Status of the Project: ongoing
11. Results of the Project:
Pre-inventory sample point location for entire Assam has been given for field
inventory. Field inventory data from 5 divisions received and analysis initiated.
Forest crown density mapping for 6 priority divisions are in progress.

12. Utilization/ Success stories: It is expected that the database thus generated will be
used by the Meghalaya State Forest Department for writing the Forest Working
Plans for the state.
RF areas of Assam
(Forest crown density)

Project 34
1 Name of the agency executing the project
North Eastern Space Applications Centre (NESAC)
2 Project title Applications of Remote Sensing and GIS in Sericulture Development.
3 Name of the Sponsoring Agency/ In-house
Central Silk Board (CSB), Bangalore
4 Year of Commencement
2008
5 Objectives
i) Under the component - Identification of additional potential areas for development of silkworm food plants, 41 districts covering 8 NE States, 44 districts from the states of Bihar, Chhattisgarh, Himachal Pradesh, Jharkhand, Kerala, Madhya Pradesh, Maharashtra, Orissa, Punjab, Uttarakhand, and Uttar Pradesh and 22 districts from 5 traditional sericulture states viz., Andhra Pradesh, Karnataka, Tamil Nadu, Jammu and Kashmir and West Bengal.
ii) A few selected Taluks/Blocks in four selected states is
being covered under the component- appraisal survey. iii) Sericulture Information Linkages and Knowledge System
(SILKS) webportal for all the selected 107 districts.
6 Study Area 108 districts in 24 states
7 Current Status
(Year of completion, if completed)
All the major components of the project have been completed. Mapping of potential areas for sericulture development has been completed for all the selected 108 districts in the country. Webpotal developed under the project called SILKS (Sericulture Information Linkages and Knowledge System) has been hosted in the public domain under the name http://silks.csb.gov.in. The webportal has been formally inaugurated by Hon'ble Minister of Textiles, Govt. of India on Oct 09,2013 in New Delhi. The portal is now made available in 12 languages. Sericulture Advisory Services has been provided through the portal with the support of Indian Meteorological Department.

8 Cost of the Project
(in Lakh Rs)
Rs. 297.95 Lakhs
9 Significant achievements
The project is an excellent example of integrating and use of legacy database prepared under a number of DOS sponsored programmes. Potential area maps have been extensively used by different user departments in planning and expansion activities for silkworm host plants. SILKS portal, developed using open source GIS is of immense help to planners, administrators, sericulturists and farmers for planning and decision making
The project has been awarded National E-Governance Award 2014-15 in the Category of Innovative Use of GIS in e-Governance.
10 User feedback Received good feedback from the Funding agency and also from different user departments.


Project 35
1 Project Title Flood Early Warning System (FLEWS) for Assam 2 Scope &
Objectives Hydro-met based rainfall run-off forecasting leading to Early warning of Flood. &Post flood Embankment monitoring
3 Centre/ Unit NESAC 4 Funding agency ASDMA, Govt. of Assam 5 Cost 93 Lacs 6 Duration 3 years 7 Study area Fourteen flood prone districts of Assam (2012)
Fifteen flood prone districts of Assam (2013) All (27) flood prone districts of Assam (2014)
8 Methodology (1) Satellite based rainfall forecasting (WRF Model) and Synoptic weather monitoring (2) Lumped and distributed hydrological modeling for stream flow forecasting leading to early warning of flood. (3) Post flood river embankment monitoring leading to identification of breaches.
9 Data used Kalpana and Oceansat weather data, AWS rainfall data, IRS P6 LISS-III and LISS-IV and Cartosat - I data, Different ground hydro-met data, RiSAT data etc.
10 Status of project Ongoing till March, 2015. 11 Results (1) Average 75% alert success during last three flood
seasons of 2012, 2013, 2014 with regular increase in study area (2) States like Bihar, West Bengal has also shown interest to implement FLEWS with NESAC collaboration
12 Utilization /Success story
(1) The project has been declared as a Good Governance Practice by Ministry Of Public Grievances and Pensions, Govt. of India for 2012. (2) Also shortlisted for consideration Prime Minister awards for innovations in 2012. (3) Winner of e-North East award, 2013 for e-governance and Citizen services delivery
13 Other details Initiated in 2009. After having three successful season till 2011, the user i.e ASDMA decided to fund it for a three year period from 2012 to 2014.Govt. Assam has requested NESAC for fresh proposal to extend the project again from 2015 onward.

Fig 1: Overall FLEWS Methodology

Fig 2: Operationalisation of districts under FLEWS during 2012 to 2014
Fig 3: Success rate of Flood Alerts issued during 2013-14
40%
46%
14%
Alerts issued in 2013 (15 districts)
Absolute success
Partial success
Failure
60%32%
8%
Alerts Issued in 2014 (27 districts)
Absolute Success
Partial Success
Failure
Project 36
1. Project Title: Soil and land capability mapping for all the agricultural districts of the NE
Region:
2. Scope and Objectives: The land productivity in the north eastern part of our country at about
1500 kg/ha, is very low in the region, and its growth rate is much below the population growth.
The growth of food grain productivity has to be accelerated to achieve a 4 percent growth by
2020. The strategies for accelerating the agriculture growth in the plains and hills have to be
different. Crop, intensification in the plains and crop diversification in the hills are immediate
priority. The study will benefit the entire NE region in delineating the potentialities of soil and
land based on which development strategies could be prescribed.
Soil mapping of selected agricultural districts of NER
Land capability/suitability assessment
Identification of blocks/districts for intensive agriculture.
3. Centre/Unit & Focal Point: North Eastern Space Applications Centre 4. Funding Agency: NEC
5. Cost: Rs. 45 lakhs 6. Duration: 3 Years 7. Study area: Selected agricultural districts of NER 8. Methodology: Soil survey has been done based on base maps prepared from remotely
sensed data and the standard soil survey procedures. FCC of satellite imagery were used for
generation of landscape/geological boundary, physiographic unit, and land use/land cover map.
Slope and aspect map were derived from digital Elevation Model. Each map represents the
factors which influence soil formation. All theses maps were transferred to GIS environment,
overlaid and used as base map for the survey. Based on variations of these factors, sites for
profile digging were selected for detailed morphological study of the horizons. The soil profiles
were excavated upto a depth of about 1.5 meters or upto lithic or paralithic contact. The
morphological characteristics of each horizon of a soil profile were examined and recorded in a
standard format following the soil survey manual and guidelines of SLUSI. Soil site information
were also recorded. Horizon wise soil samples were collected from the profile for detailed
physical and chemical analysis in the laboratory to incorporate the results with field observations
and affirm soil taxonomy. The soil boundary were delineated based on the boundary inferred by
base layer in GIS environment. Land capability/suitability will be evaluated by matching the land
qualities and requirements for the land use. It needs interpretation and integration of soils,
climatic parameters, vegetation and other aspects of land, like wastelands and slope using GIS.
9. Data Used:

LISS III image of RESOURCESAT
ASTERDEM
Lithology map from Rajib Gandhi National Drinking Water Mission project
Physiography map by interpreting LISS III image along with slope map derived
from ASTERDEM
LULC 50K map
Collateral data like Rainfall, temperature data etc.
10. Status of Project: Ongoing
11. Results of the Project ((Kindly provide 2-3 good illustrations): The study has been taken
up to delineate the potentialities of soil and land capability maps in 49 intensive agricultural
districts of NER based on which districts will be prioritized and alternate action plan will be
generated. However, 12 districts have been taken under phase-I out of which soil mapping has
been completed for 8 (eight) districts viz. Bongaigaon, Dhubri, Goalpara, Golaghat & Kokrajhar
district of Assam and Champhai, Lawngtlai & Lunglei district of Mizoram. Soil boundary
delineation is in progress for remaining 4 districts viz. Jaintia Hills, Ribhoi & West Khasi Hills
district of Meghalaya and Karbianglong district of Assam.
Fig: Soil and land capability map of 4 districts of Assam (Bongaigaon, Dhubri, Goalpara & Kokrajhar) 12.Utilization/success stories (Kindly provide 2-3 good illustrations): NA 13. Any other details: Nil

Project 37
Project title: Soil Resource Mapping (SRM) on 1:50K for selected districts of Assam.
2. Scope and Objectives: Under the project titled “Natural Resources Census” Nationwide
mapping of soils is one the seven objectives. Soil and Land use Survey of India (SLUSI) is
involved in Soil Resource Mapping (SRM) of the areas for which information is not available at
1:50K scale. The project is scheduled for conclusion by December 2011. Therefore, to complete
the project in time SLUSI and Ministry of Agriculture has requested NESAC to be partner in this
effort. Accordingly the North Eastern Space Applications Centre (NESAC) has agreed to take
up the task of conducting SRM as per the terms of reference enclosed to letter from Chief Soil
Survey Officer, SLUSI vide letter No.RS.6-14/2007/SLU/3316 dt.19.08.2009.
3. Centre/Unit & Focal Point: North Eastern Space Applications Centre Focal Point: Smt. Pratibha Thakuria Das
4. Funding Agency: Soil and Land use Survey of India (SLUSI).
5. Cost: Rs. 23.09lakhs @ Rs.74, 500 per effective toposheet 6. Duration: 2 Years 7. Study area: 7 districts of Assam (Table1)
8. Methodology: The soil mapping was done studying the soils in their natural environment,
collection of soil samples and their laboratory analysis in soil testing laboratory, soil
classification, establising soil physiographic relationship and delineation of soil boundaries
based on physiography, landscape/geology, slope, climate and vegetation of the area on
standard base map, confirmation through field work and laboratory data. All thematic maps
except slope map were prepared from LISS III image of IRS P6 satellite. Slope and aspect
maps were derived from Digital Elevation Model. Each map represents the factors which
influence soil formation. All these maps were transferred to GIS environment and overlaid and
used as base map for the survey. Based on variations of these factors, sites for profile digging
were selected for detailed morphological study of the soils. The soil profiles were excavated up
to a depth of about 1.5 meters or up to lithic or paralithic contact. The morphological
characteristics of each soil profile was examined in detail and recorded in a standard format
following the soil survey manual and FAO Guidelines for soil profile descriptions. Soil site
information was also recorded. Horizon wise soils were collected analyzed in for physical and
chemical properties to incorporate the results with field observations and the soils were
classified taxonomically (Keys to Soil Taxonomy, 2006). The soil boundary was delineated
based on the boundary inferred by combination of different layers representing soil forming
factors that were used in the base map. The polygons representing similar physiographic unit,
parent material, slope and vegetation cover was put under same soil type which is confirmed by
image characteristics and field survey.
9. Data Used:
LISS III image of RESOURCESAT

ASTERDEM
Lithology map from Rajib Gandhi National Drinking Water Mission project
Physiography map by interpreting LISS III image along with slope map derived
from ASTERDEM
LULC 50K map
Collateral data like Rainfall, temperature data etc.
10. Status of Project: Completed
11. Results of the Project (Kindly provide 2-3 good illustrations):
Under the project digital soil map of 7 districts of Assam viz., Cachar, Dhemaji, Hailakandi,
Karimganj, Lakhimpur, Nagaon and Sonitpur has been generated and data-base has been
submitted to SLUSI, New Delhi.
Fig: Soil map of seven districts of Assam on 1:50,000 scale
12. Utilization/success stories (Kindly provide 2-3 good illustrations): The soil map is used for evaluation of land capability, soil irrigability, land Irrigability and fertility capability of soil. The soil map will be used to prepare site suitability map for different crop and to suggest alternate land use plan. 13. Any other details: Nil

Project 38
1 Name of the agency executing the project
North Eastern Space Applications Centre (NESAC)
2 Project title Applications of RS and GIS for development of Agriculture for the state of Assam
3 Name of the Sponsoring Agency/ In-house
Department of Agriculture, Govt. of Assam
4 Year of Commencement
2012
5 Objectives
i) Pre-harvest and post harvest acreage estimation of rice
crop
ii) Assessment of crop damage due to floods and droughts
iii) Cropping pattern analysis with existing and suggested
cropping patterns.
6 Study Area State of Assam
7 Current Status
(Year of completion, if completed)
District level acreage estimation of rice crop (winter and summer rice) have been completed during 2012-13 crop season and report submitted to Govt. of Assam and along with the report of flood damage assessment. Considering the view that there is variation in terms of acreage with DES estimates for some of the districts, an intensive study was carried out in the district of Nagaon during 2013 crop season jointly with Department of Agriculture, Dept. of Revenue and Directorate of Economics and Statistics
8 Cost of the Project
(in Lakh Rs)
Rs. 15.1 Lakhs
9 Significant achievements
Remote sensing based acreage estimation of rice crop in the

state could be made at district level for the first time. Efficient utilisation of Risat-1 data in crop acreage estimation of rice crop in the state was another significant achievement.
10 User feedback Received good feedback from the Dept. of Agriculture, Govt. of Assam

1. Project Title: Soil and land capability mapping for all the agricultural districts of the NE
Region:
2. Scope and Objectives: The land productivity in the north eastern part of our country at about
1500 kg/ha, is very low in the region, and its growth rate is much below the population growth.
The growth of food grain productivity has to be accelerated to achieve a 4 percent growth by
2020. The strategies for accelerating the agriculture growth in the plains and hills have to be
different. Crop, intensification in the plains and crop diversification in the hills are immediate
priority. The study will benefit the entire NE region in delineating the potentialities of soil and
land based on which development strategies could be prescribed.
Soil mapping of selected agricultural districts of NER
Land capability/suitability assessment
Identification of blocks/districts for intensive agriculture.
3. Centre/Unit & Focal Point: North Eastern Space Applications Centre 4. Funding Agency: NEC
5. Cost: Rs. 45 lakhs 6. Duration: 3 Years 7. Study area: Selected agricultural districts of NER 8. Methodology: Soil survey will be done based on base maps prepared from remotely sensed
data and the standard soil survey procedures. FCC of satellite image will be used for generation
of landscape/geological boundary, physiographic unit, and land use/land cover map. Slope and
aspect map derived from digital Elevation Model will be used. Each map represents the factors
which influence soil formation. All theses maps will be transferred to GIS environment and
overlaid and used as base map for the survey. Based on variations of these factors, sites for
profile digging will be selected for detailed morphological study of the soils. The soil profiles will
be excavated upto a depth of about 1.5 meters or upto lithic or paralithic contact. The
morphological characteristics of each soil profile will be examined in detail and recorded in a
standard format following the soil survey manual and guidelines supplied by SLUSI. Soil site
information will also be recorded. Horizon wise soils will be collected from the profile for detailed
physical and chemical analysis in the laboratory to incorporate the results with field observations
and affirm soil taxonomy. The soil boundary will be delineated based on the boundary inferred
by base layer in GIS environment. Land capability/suitability will be evaluated by matching the
land qualities and requirements for the land use. It needs interpretation and integration of soils,
climatic parameters, vegetation and other aspects of land, like wastelands and slope using GIS.
9. Data Used:

LISS III image of RESOURCESAT
ASTERDEM
Lithology map from Rajib Gandhi National Drinking Water Mission project
Physiography map by interpreting LISS III image along with slope map derived
from ASTERDEM
LULC 50K map
Collateral data like Rainfall, temperature data etc.
10. Status of Project: Ongoing
Progress of the project: The work has been started in 14 districts of NER. The detail progress
of the project is given bellow:
Sl.No. Districts Status of Soil Resource Mapping
Status of Land
Capability Mapping
Pre field interpretation
Field
survey
Soil sample analysis
Soil classification
Digital soil map
1 Champhai
Completed
Completed
Completed
Completed
Completed
Completed 2 Lawngtlai
3 Lunglei
4 Golaghat
Completed Completed Completed Completed In progress
Not initiated
5 Dhubri
6 Bongaigaon
7 Goalpara
8 Kokrajhar
9 Ri- Bhoi Completed Completed Completed In progress Not initiated
10
South Garo
Hills
Completed In
progress Not
initiated Not initiated
Not initiated 11
West Khasi
Hills
12 Jaintia Hills

13 Karbianglong
Completed
Not
initiated
Not
initiated Not initiated
Not
initiated
14 N.C.hills
11. Results of the Project ((Kindly provide 2-3 good illustrations): Soil and land capability map of selected 3 district of Mizoram is given in Fig. 2.
Inceptisols
Land Capability Class
IIe
IIIe
IVe
VIe
VIIe
Buit up
Waterbody
Land Capability Class-VIe
Alfisols
Legend
Soil type
Clayey Typic Hapludults ,F.L. Typic Dystrochrepts , F.L. Typic Hapludults
Clayey Typic dystrochrepts , L.S. Umbric Dystrochrepts, L.S. Typic Hapludults
F.L. Aquic Dystrochrepts ,F.L. Fluventic Dystrochrepts ,F.L. Fluventic Umbric Dystrochrepts
F.L. Humic Hapludults ,F.L. Umbric Dystrochrepts , Clayey Typic Dystochrepts
F.L. Typic Dystrochrepts , L.S. Typic Hapludults ,Clayey Typic Dystochrepts
F.L. Typic Hapludults , L.S. Typic Dystochrepts ,L.S. Umbric Dystrochrepts
F.L. Umbric Dystrochrepts ,F.L. Humic Hapludults ,Clayey Typic Hapludults
F.L. Umbric Dystrochrepts ,F.L. Humic Hapludults ,L.S. Typic Hapludults
L.S. Humic Hapludults ,Clayey Typic Dystrochrepts ,F.L. Umbric Dystrochrepts
L.S. Humic Hapludults ,F.L. Umbric Dystrochrepts , L.S. Typic Hapludults
L.S. Typic Dystrochrepts ,L.S. Typic Udorthents, L.S. Typic Hapludults
L.S. Typic Hapludults ,L.S. Umbric Dystrochrepts ,F.L. Humic Hapludults
L.S. Umbric Dystrochrepts , L.S. Humic Hapludults , F.L. Umbric Dystrochrepts
L.S. Umbric Dystrochrepts ,F.L. Humic Hapludults,L.S. Typic Hapludults
Buit up
Waterbody
District boundary
Soil Map
Land Capability Map
Fig.2: Soil and land capability map of Mizoram
12.Utilization/success stories (Kindly provide 2-3 good illustrations): NA 13. Any other details: Nil

Project 39
1. Project title: Soil Resource Mapping (SRM) on 1:50K for selected districts of Assam.
2. Scope and Objectives: Under the project titled “Natural Resources Census” Nationwide
mapping of soils is one the seven objectives. Soil and Land use Survey of India (SLUSI) is
involved in Soil Resource Mapping (SRM) of the areas for which information is not available at
1:50K scale. The project is scheduled for conclusion by December 2011. Therefore, to complete
the project in time SLUSI and Ministry of Agriculture has requested NESAC to be partner in this
effort. Accordingly the North Eastern Space Applications Centre (NESAC) has agreed to take
up the task of conducting SRM as per the terms of reference enclosed to letter from Chief Soil
Survey Officer, SLUSI vide letter No.RS.6-14/2007/SLU/3316 dt.19.08.2009.
3. Centre/Unit & Focal Point: North Eastern Space Applications Centre Focal Point: Smt. Pratibha Thakuria Das
4. Funding Agency: Soil and Land use Survey of India (SLUSI).
5. Cost: Rs. 23.09lakhs @ Rs.74, 500 per effective toposheet 6. Duration: 2 Years 7. Study area: 7 districts of Assam (Table1)
8. Methodology: Soil survey will be done based on base maps prepared from remotely sensed
data and the standard soil survey procedures. FCC of satellite image will be used for generation
of landscape/geological boundary, physiographic unit, and land use/land cover map. Slope and
aspect map derived from digital Elevation Model will be used. Each map represents the factors
which influence soil formation. All theses maps will be transferred to GIS environment and
overlaid and used as base map for the survey. Based on variations of these factors, sites for
profile digging will be selected for detailed morphological study of the soils. The soil profiles will
be excavated upto a depth of about 1.5 meters or upto lithic or paralithic contact. The
morphological characteristics of each soil profile will be examined in detail and recorded in a
standard format following the soil survey manual and guidelines supplied by SLUSI. Soil site
information will also be recorded. Horizon wise soils will be collected from the profile for detailed
physical and chemical analysis in the laboratory to incorporate the results with field observations
and affirm soil taxonomy. The soil boundary will be delineated based on the boundary inferred
by base layer in GIS environment.
9. Data Used:
LISS III image of RESOURCESAT
ASTERDEM
Lithology map from Rajib Gandhi National Drinking Water Mission project

Physiography map by interpreting LISS III image along with slope map derived
from ASTERDEM
LULC 50K map
Collateral data like Rainfall, temperature data etc.
10. Status of Project: Ongoing
Progress of the project: The detail progress of the project is given bellow:
Sl. No.
Name of the
district
Image interpretation
Field survey
Sample analysis
Soil classification
Status of digital database creation
1 Dhemaji
Completed Completed Completed Completed
Completed and submitted to SLUSI
2 Nagaon Completed but database will be submitted after correction of layers as per the suggestions of QC expert
3 Lakhimpur
4 Hailakandi
5 Karimganj
6 Cachar
7 Sonitpur
11. Results of the Project (Kindly provide 2-3 good illustrations): The soils of Dhemaji district is mostly Entisols followed by Inceptisols covering 73% and 27 % of the total geographycal area respectively. 16 dominant soil series are found in the district. The dominant soil series along with their soil taxonomy is presented in the table below and figure2.
Dominant Soil Series Soil Taxonomy Area (Ha)
Piang Chapori Coarse loamy, Typic Endoaquents 42039.72
Bhomuraguri Fine, Typic Endoaquepts 29586.67
Dimau Chariali Coarse loamy, Typic Udifluvents 23869.26
Santipur Kothgaon Coarse loamy, Typic Fluvaquents 23802.81
Sadarchuk Coarse loamy, Typic Fluvaquents 21499.76
Bagalijan Abutani Coarse loamy, Aeric Epiaquepts 12522.73
Baligaon Coarse loamy, Typic Fluvaquents 10229.04
Pukiagaon Fine loamy, Typic Endoaquents 9541.40
Madanpur Fine loamy, Oxic Dystrudepts 8755.73
Misingpur Coarse loamy, Aquic Udorthents 5706.46
Dhekial gaon Fine silty, Fluvaquentic Endoaquepts 4421.29
Kheranigaon Fine, Typic Udifluvents 4324.77
Hahchora Fine, Typic Udorthents 194.99
Khanagaon Fine silty, Aquic Udorthents 157.86
Kangku Fine loamy, Typic Dystrudepts 108.06
Bokalgaon Coarse loamy, Typic Udorthents 63.48

Water body Water body 53878.35
Built-up Built-up 427.34
Fig.2: Soil map of Dhemaji District
12. Utilization/success stories (Kindly provide 2-3 good illustrations): The soil map is used for evaluation land Capability Class and land Irrigability Class. The soil map will be used to prepare site suitability map for different crop and to suggest alternate land use plan. 13. Any other details:
Legend

Project 40
9. Project title: Remote Sensing and GIS Based Input for Hazard Risk Vulnerability
Assessment of Guwahati city, Silchar, Dibrugarh towns and Dhemaji district, Assam
10. Scope & Objectives: The project is funded by Assam State Disaster Management Authority
(ASDMA) under the Revenue and disaster management department, Government of
Assam.The project has two broad objectives. (I) To prepare GIS based multi hazard maps for
Guwahati city, Silchar & Dibrugarh towns (1:10,000 scale) and for Dhemaji district (1:25,000
scale). (II) To prepare vulnerability and risk assessment maps for probable multi hazards for the
areas under study.
11. Centre/Unit: North Eastern Space Applications Centre,
12. Funding Agency:Assam State Disaster Management Authority (ASDMA)
13. Cost: Total 55.0 lakh
14. Duration: Two years (March, 2013)
15. Study Area:
(v) Guwahati City
(vi) Dibrugarh Town
(vii) Silchar Town
(viii) Dhemaji District
16. Methodology: Multi hazard risk atlas will be generated by preparation of multi hazard zonation
maps and analysis of social and physical vulnerability. The mapping scale is on 1: 10,000 for
the city and towns while for the district it is on 1:25,000. The identified study areas are
vulnerable to earth earthquake and frequent flood incidences, while Guwahati city is prone to
landslide activities especially during monsoon period. There are some major industrial
installations in and around the study areas, which also make them vulnerable to industrial
hazard and related issues. Overall work is divided into three major phases: assessment of
frequency-magnitude- damages related to past hazardous events for each study areas ;
preparation of hazard zonation maps for probable hazards ; assessment of physical & social
vulnerability and risk for each hazards.

17. Data Used: IRS P6 LISS IV (MX), Stereo Pair from IRS P5 and other available high resolution
satellite imageries, eg,Quick Bird and World View; detailed survey report and available
ancillary/legacy data.
18. Status of project: Ongoing
19. Results:
20. Utilization/Success stories: nil
21. Any other details:
Flood hazard zonation map of Dhemaji District
Industrial vulnerability maps of Silchar Town

Project 41
1. Project title: Remote Sensing and GIS Based Landslide Hazard Zonation map and reservoir
rim stability studies for Subansiri Lower Hydro-Electric (SLP).
2. Scope & Objectives:The objectives of the project are
To generate Contours from Cartosat-1 stereo data at 10m interval.
To prepare Landslide Hazard Zonation (LHZ) Map in 1:25,000 scale.
To assess Reservoir rim stability with special reference to past earthquake
incidences.
To prepare cross-sections at 2km interval for present land slide areas
3.Centre/Unit: North Eastern Space Applications Centre.
4. Funding Agency: NHPC, Ltd.
5. Cost: 29,28,270.35lakh
6. Duration: one year, June'2013
7. Study Area:
The study area is in Gerukhamukh area of Assam-Arunachal Border covered
between 27˚ 29' 26" N to 27˚ 49' 07" N latitude and 94˚ 03' 59" E to 94˚ 28'
46" E longitude as provided by NHPC, Ltd. The approx length of the reservoir
is 50km and the total area to be studied is 659.3 sq km approx.

8. Methodology: In the present study Landslide Hazard Zonation(LHZ) will be carried out in the
following major steps – Inventory data collection, database generation for various geo
environmental parameters (with pre & post field interpretation) ground truth collection followed by
integration and analysis.
Contours from Cartosat-1 stereo data at 10m interval will be generated using digital
photogrammetric techniques. To increase locational accuracy GCPs collected from DGPS survey
using dual frequency receivers will be incorporated for triangulation of stereo pairs.
History says collapse of an artificial Dam in Subansiri River caused death of 500 people
because of 1950‟s earthquake. Hence along with landslide Hazard Zonation Reservoir rim stability
analysis will also be carried out to assess the stability of the slope. This will be carried out through
structural analysis of discontinuities, geotechnical investigation and Factor of Safety (F) of the slope
will be calculated. Geotechnical investigation, for e.g. determination of RMRbasic ( Rock Mass
Rating ) and direct Shear test, of Rock Mass( Markland Test, Limit Equilibrium Analysis, Shear
Strength Parameters etc ) will be determined mainly from field investigation depending on the
accessibility and terrain conditions
9. Data Used:
Resourcesat I LISS – IV MX data mainly for thematic layers generation.
CARTOSAT – I, Stereo pair for DEM and contour generation
Existing maps and literature
Detailed history of past landslide in the study area.
Rainfall and Seismic related corresponding to past landslide occurrences.
Available geotechnical parameters for soil and rock samples.
10. Status of project: Ongoing
11. Results: At present only interpretation of thematic layers are initiated.
12. Utilization/Success stories: NA
13. Any other details:
Remote Sensing and GIS Projects carried out/being carried out by
North EasternSpace Applications Centre (NESAC)

R