remote sensing and gis 15cv563 - vtuupdates.in · remote sensing and gis 15cv563 dept. of civil...
TRANSCRIPT
Remote sensing and GIS 15CV563
Dept. of Civil Engineering ,ATMECE
MODULE 1
DEFINITION AND PROCESS OF REMOTE SENSING
INTRODUCTION
Now-a-days the field of Remote Sensing and GIS has become exciting and glamorous with
rapidly expanding opportunities. Many organizations spend large amounts of money on these
fields. Here the question arises why these fields are so important in recent years. Two main
reasons are there behind this. 1) Now-a-days scientists, researchers, students, and even common
people are showing great interest for better understanding of our environment. By environment
we mean the geographic space of their study area and the events that take place there. In other
words, we have come to realize that geographic space along with the data describing it, is part of
our everyday world; almost every decision we take is influenced or dictated by some fact of
geography. 2) Advancement in sophisticated space technology (which can provide large volume
of spatial data), along with declining costs of computer hardware and software (which can handle
these data) has made Remote Sensing and G.I.S. affordable to not only complex environmental /
spatial situation but also affordable to an increasingly wider audience.
REMOTE SENSING AND ITS COMPONENTS:
Remote sensing is the science of acquiring information about the Earth's surface without actually
being in contact with it. This is done by sensing and recording reflected or emitted energy and
processing, analyzing, and applying that information." In much of remote sensing, the process
involves an interaction between incident radiation and the targets of interest. This is exemplified
by the use of imaging systems where the following seven elements are involved. However that
remote sensing also involves the sensing of emitted energy and the use of non-imaging sensors.-
Components of Remote Sensing
Remote sensing and GIS 15CV563
Dept. of Civil Engineering ,ATMECE
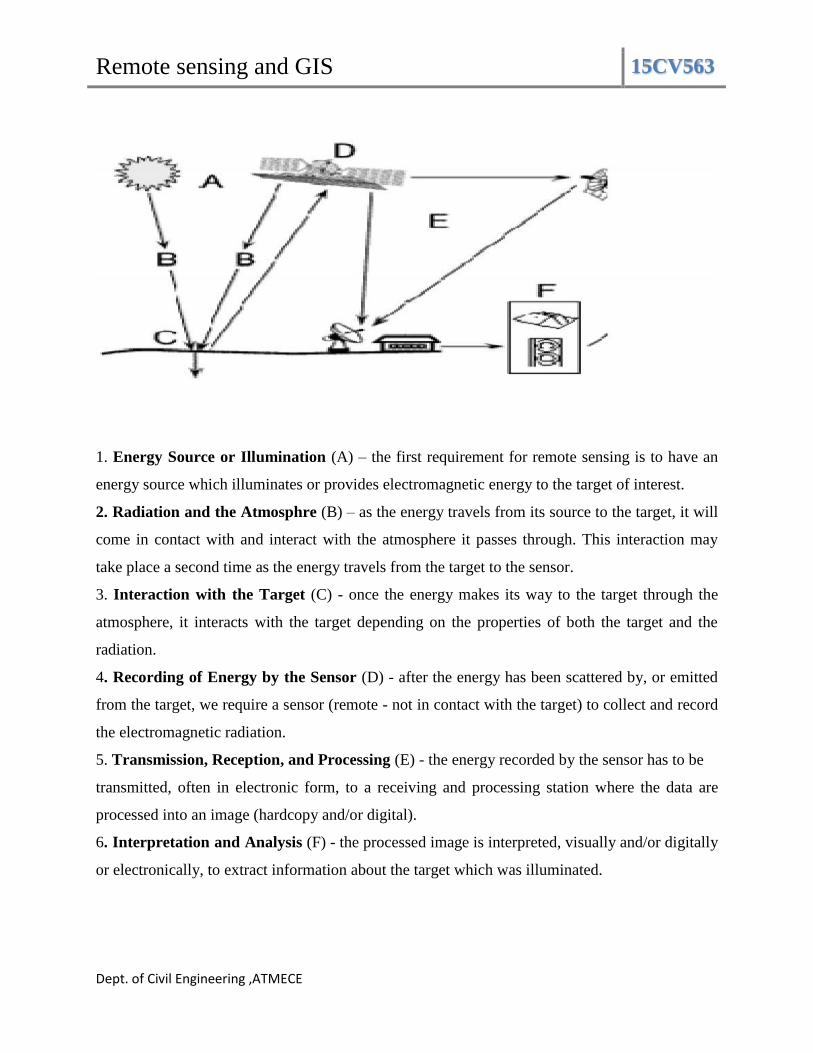
1. Energy Source or Illumination (A) – the first requirement for remote sensing is to have an
energy source which illuminates or provides electromagnetic energy to the target of interest.
2. Radiation and the Atmosphre (B) – as the energy travels from its source to the target, it will
come in contact with and interact with the atmosphere it passes through. This interaction may
take place a second time as the energy travels from the target to the sensor.
3. Interaction with the Target (C) - once the energy makes its way to the target through the
atmosphere, it interacts with the target depending on the properties of both the target and the
radiation.
4. Recording of Energy by the Sensor (D) - after the energy has been scattered by, or emitted
from the target, we require a sensor (remote - not in contact with the target) to collect and record
the electromagnetic radiation.
5. Transmission, Reception, and Processing (E) - the energy recorded by the sensor has to be
transmitted, often in electronic form, to a receiving and processing station where the data are
processed into an image (hardcopy and/or digital).
6. Interpretation and Analysis (F) - the processed image is interpreted, visually and/or digitally
or electronically, to extract information about the target which was illuminated.
Remote sensing and GIS 15CV563
Dept. of Civil Engineering ,ATMECE
7. Application (G) - the final element of the remote sensing process is achieved when we apply
the information we have been able to extract from the imagery about the target in order to better
understand it, reveal some new information, or assist in solving a particular
problem.
HISTRY OF REMOTE SENSING:
1839 - first photograph
1858 - first photo from a balloon
1903 - first plane
1909 first photo from a plane
1903-4 -B/W WW I and WW II infrared film
1960 - space
ELECTROMAGNETIC SPECTRUM
The first requirement for remote sensing is to have an energy source to illuminate the target
(unless the sensed energy is being emitted by the target). This energy is in the form of
electromagnetic radiation. All electromagnetic radiation has fundamental properties and behaves
in predictable ways according to the basics of wave theory.
Electromagnetic radiation consists of an electrical field (E) which varies In magnitude in a
direction perpendicular to the direction in which the radiation is traveling, and a magnetic field
(M) oriented at right angles to the electrical field. Both these fields travel along with the speed of
light(c). Two characteristics of electromagnetic radiation are particularly important to understand
remote sensing. These are the wavelength and frequency.
Electromagnetic radiation (EMR) as an electromagnetic wave that travels through space at the
speed of light C which is 3x10⁸ meters per second. Theoretical model of random media including
the anisotropic effects, random distribution discrete scatters, rough surface effects, have been
studied for remote sensing with electromagnetic waves.
Wavelength and frequency
The wavelength is the length of one wave cycle, which can be measured as the distance between
successive wave crests. Wavelength is usually represented by the Greek letter lambda (λ).
Wavelength is measured in meters (m) or some factor of meters such as nanometers (nm, 10-9
meters), micrometers (μm, 10-6 meters) (μm, 10-6 meters) or centimeters (cm, 10-2 metres).
Frequency refers to the number of cycles of a wave passing a fixed point per unit of time.
Remote sensing and GIS 15CV563
Dept. of Civil Engineering ,ATMECE
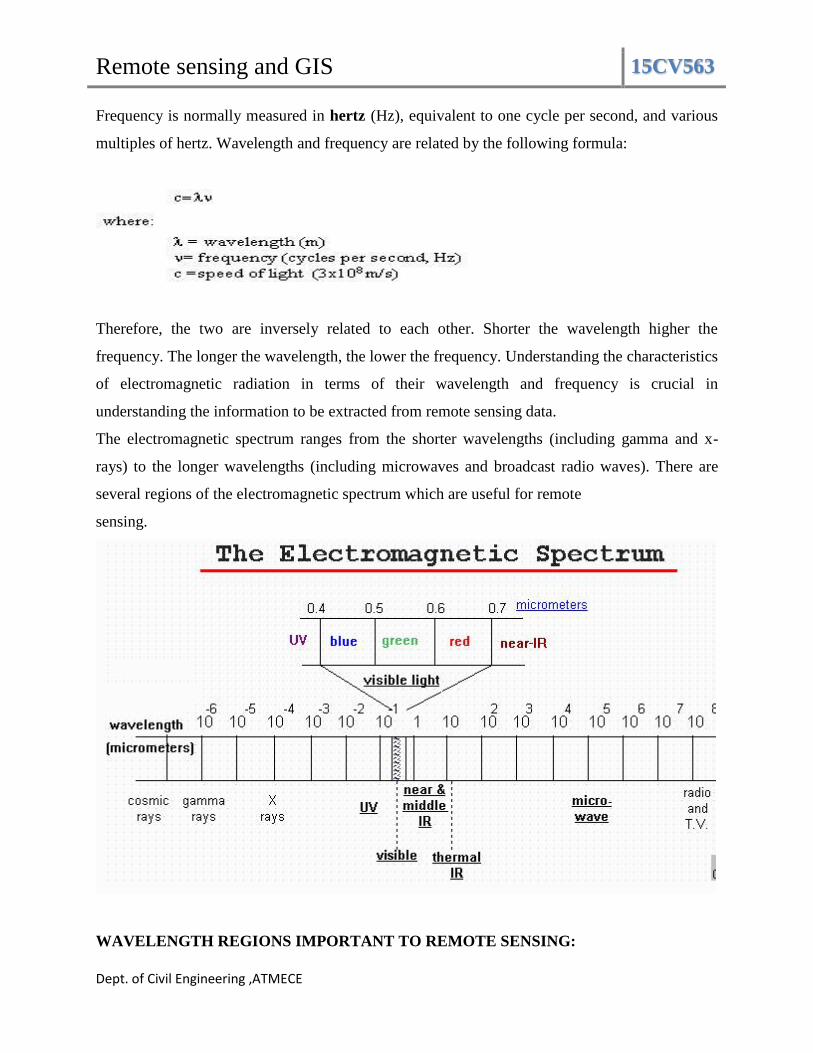
Frequency is normally measured in hertz (Hz), equivalent to one cycle per second, and various
multiples of hertz. Wavelength and frequency are related by the following formula:
Therefore, the two are inversely related to each other. Shorter the wavelength higher the
frequency. The longer the wavelength, the lower the frequency. Understanding the characteristics
of electromagnetic radiation in terms of their wavelength and frequency is crucial in
understanding the information to be extracted from remote sensing data.
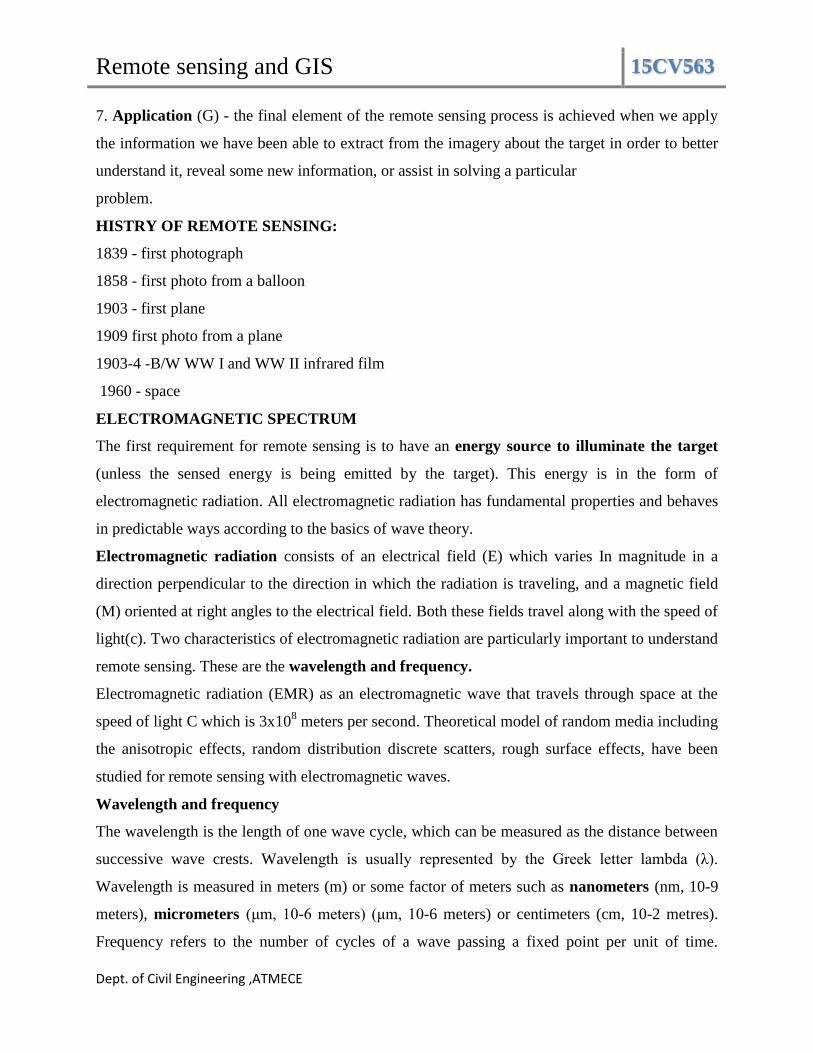
The electromagnetic spectrum ranges from the shorter wavelengths (including gamma and x-
rays) to the longer wavelengths (including microwaves and broadcast radio waves). There are
several regions of the electromagnetic spectrum which are useful for remote
sensing.
WAVELENGTH REGIONS IMPORTANT TO REMOTE SENSING:

Remote sensing and GIS 15CV563
Dept. of Civil Engineering ,ATMECE
1 Ultraviolet or UV
For the most purposes ultraviolet or UV of the spectrum shortest wavelengths are practical for
remote sensing. This wavelength beyond the violet portion of the visible wavelengths hence it
name. Some earth surface materials primarily rocks and materials are emit visible radiation when
illuminated by UV radiation.
2 Visible Spectrums
The light which our eyes - our "remote sensors" - can detect is part of the visible spectrum. It is
important to recognize how small the visible portion is relative to the rest of the spectrum. There
is a lot of radiation around us which is “invisible" to our eyes, but can be detected by other
remote sensing instruments and used to our advantage. The visible wavelengths cover a range
from approximately 0.4 to 0.7 μm. The longest visible wavelength is red and the shortest is
violet. Common wavelengths of what we perceive as particular colours from the visible portion
of the spectrum are listed below. It Is important to note that this is the only portion of the
spectrum we can associate with the concept of colors.
Violet: 0.4 -0.446 μm
Blue: 0.446 -0.500 μm
Green: 0.500 -0.578 μm
Yellow: 0.578 -0.592 μm
Orange: 0.592 -0.620 μm
Red: 0.620 -0.7 μm
Blue, green, and red are the primary colours or wavelengths of the visible spectrum. They are
defined as such because no single primary colour can be created from the other two, but all other
colours can be formed by combining blue, green, and red in various proportions. Although we
see sunlight as a uniform or homogeneous colour, it is actually composed of various wavelengths
of radiation in primarily the ultraviolet, visible and infrared portions of the spectrum. The visible
portion of this radiation can be shown in its component colours when sunlight is passed through
a prism, which bends the light in differing amounts according to wavelength.
3 Infrared (IR)

Remote sensing and GIS 15CV563
Dept. of Civil Engineering ,ATMECE
The next portion of the spectrum of interest is the infrared (IR) region which covers the
wavelength range from approximately 0.7 μm to 100 μm more than 100 times as wide as the
visible portion. The infrared can be divided into 3 categories based on their radiation properties-
the reflected near- IR middle IR and thermal IR. The reflected near IR covers wavelengths from
approximately 0.7 μm to 1.3 μm is commonly used to expose black and white and color-infrared
sensitive film. The middle-infrared region includes energy with a wavelength of 1.3 to 3.0 μm.
The thermal IR region is quite different than the visible and reflected IR portions, as this energy
is essentially the radiation that is emitted from the Earth's surface in the form in the form of heat.
The thermal IR covers wavelengths from approximately 3.0 μm to 100 μm.
4 Microwave
This wavelength (or frequency) interval in the electromagnetic spectrum is commonly referred to
as a band, channel or region.The major subdivision The portion of the spectrum of more recent
interest to remote sensing is the microwave region from about 1 mm to 1 m. This covers the
longest wavelengths used for remote sensing. The shorter wavelengths have properties similar to
the thermal infrared region while the longer wavelengths approach the wavelengths used for

Remote sensing and GIS 15CV563
Dept. of Civil Engineering ,ATMECE
radiobroadcast.

Remote sensing and GIS 15CV563
Dept. of Civil Engineering ,ATMECE
ENERGY INTERACTIONS WITH THE ATMOSPHERE
Before radiation used for remote sensing reaches the Earth's surface it has to travel through some
distance of the Earth's atmosphere. Particles and gases in the atmosphere can affect the incoming
light and radiation. These effects are caused by the mechanisms of scattering and absorption.
Energy Interaction with Atmosphere
SCATTERING
Scattering occurs when particles or large gas molecules present in the atmosphere interact with
and cause the electromagnetic radiation to be redirected from its original path. How much
scattering takes place depends on several factors including the wavelength of the radiation, the
abundance of particles or gases, and the distance the radiation travels through the atmosphere.
There are three (3) types of scattering which take place.
RAYLEIGH SCATTERING
Rayleigh scattering occurs when particles are very small compared to the wavelength of the
radiation. These could be articles such as small specks of dust or nitrogen and oxygen molecules.
Rayleigh scattering causes shorter wavelengths of energy to be scattered much more than longer
wavelengths. Rayleigh scattering is the dominant scattering mechanism in the upper
atmosphere.The fact that the sky appears "blue" during the day is because of this phenomenon.
As sunlight passes through the atmosphere, the shorter wavelengths (i.e. blue) of the visible
spectrum are scattered more than the other (longer) visible wavelengths. At sunrise and sunset
the light has to travel farther through the atmosphere than at midday and the scattering of the

Remote sensing and GIS 15CV563
Dept. of Civil Engineering ,ATMECE
shorter wavelengths is more complete; this leaves a greater proportion of the longer wavelengths
to penetrate the atmosphere.
Raleigh Scattering
ABSORPTION
Absorption is the other main mechanism at work when electromagnetic radiation interacts with
the atmosphere. In contrast to scattering, this phenomenon causes molecules in the atmosphere to
absorb energy at various wavelengths. Ozone, carbon dioxide, and water vapor are the three
main atmospheric constituents which absorb radiation. Ozone serves to absorb the harmful (to
most living things) ultraviolet radiation for the sun. Without this protective layer in the
atmosphere our skin would burn when exposed to sunlight. Carbon dioxide referred to as a
greenhouse gas. This is because it tends to absorb radiation strongly in the far infrared portion of
the spectrum - that area associated with thermal heating - which serves to trap this heat inside the
atmosphere. Water vapour in the atmosphere absorbs much of the incoming long wave infrared
and shortwave microwave radiation (between 22μm and 1m). The presence of water vapour in
the lower atmosphere varies greatly from location to location and at different times of the year.
For example, the air mass above a desert would have very little water vapour to absorb energy,
while the tropics would have high concentrations of water vapour (i.e. high humidity).
MIE SCATTERING
Remote sensing and GIS 15CV563
Dept. of Civil Engineering ,ATMECE
Mie scattering occurs when the particles are just about the same size as the wavelength of the
radiation. Dust, pollen, smoke and water vapour are common causes of Mie scattering which
tends to affect longer wavelengths than those affected by Rayleigh scattering. Mie scattering
occurs mostly in the lower portions of the atmosphere where larger particles are more abundant,
and dominates when cloud conditions are overcast. The final scattering mechanism of
importance is called nonselective scattering. This occurs when the particles are much larger
than the wavelength of the radiation. Water droplets and large dust particles can cause this type
of scattering. Nonselective scattering gets its name from the fact that all wavelengths are
scattered about equally. This type of scattering causes fog and clouds to appear white to our eyes
because blue, green, and red light are all scattered in approximately equal quantities
(blue+green+red light = white light).
ATMOSPHERIC WINDOWS
While EMR is transmitted from the sun to the surface of the earth, it passes through the
atmosphere. Here, electromagnetic radiation is scattered and absorbed by gases and dust
particles. Besides the major atmospheric gaseous components like molecular nitrogen and
oxygen, other constituents like water vapour, methane, hydrogen, helium and nitrogen
compounds play important role in modifying electro magnetic radiation. This affects image
quality. Regions of the electromagnetic spectrum in which the atmosphere is transparent are
called atmospheric windows. In other words, certain spectral regions of the electromagnetic
radiation pass through the atmosphere without much attenuation are called atmospheric
windows. The atmosphere is practically transparent in the visible region of the electromagnetic
spectrum and therefore, many of the satellite based remote sensing sensors are designed to
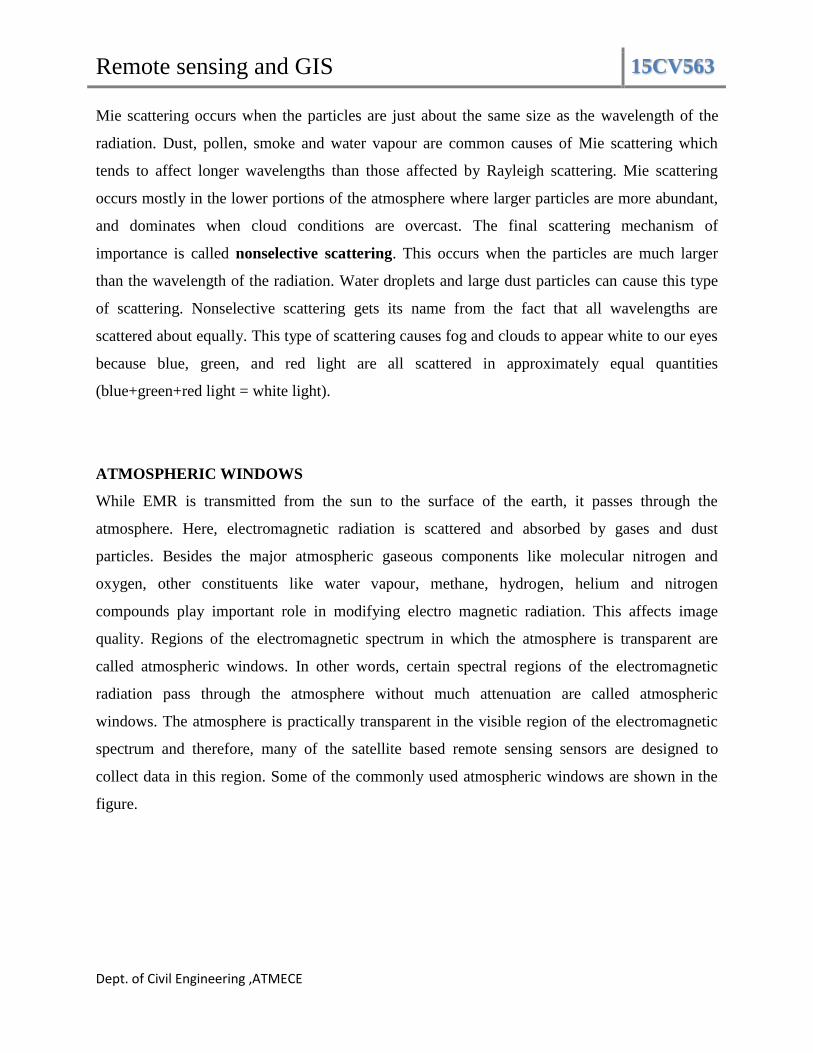
collect data in this region. Some of the commonly used atmospheric windows are shown in the
figure.
Remote sensing and GIS 15CV563
Dept. of Civil Engineering ,ATMECE
Figure . They are: 0.38-0.72 microns (visible), 0.72-3.00 microns (near infra-red and middle
infra-red), and 8.00-14.00 microns (thermal infra-red).
Transmission100%UVVisibleInfraredEnergy Blocked0.3 Wavelength (microns)1101001 mm
SPECTRAL SIGNATURE CONCEPTS-TYPICAL SPECTRAL REFLECTANCE
CHARACTRISTICS OF WATER, VEGETATION AND SOIL:
A basic assumption made in remote sensing is that a specific target has an individual and
characteristic manner of interacting with incident radiation. The manner of interaction is
described by the spectral response of the target. The spectral reflectance curves describe the
spectral response of a target in a particular wavelength region of electromagnetic spectrum,
which, in turn depends upon certain factors, namely, orientation of the sun (solar azimuth), the
height of the Sun in the sky (solar elevation angle), the direction in which the sensor is pointing
relative to nadir (the look angle) and nature of the target, that is, state of health of vegetation.
Spectral Reflectivity
•Reflectivity is the fraction of incident radiation reflected by a surface
•The reflectance characteristics of Earth’s surface features may be quantified by measuring the
portion of incident energy that is reflected
•This is measured as a function of wavelength (λ) and is called spectral reflectance (rλ).

Remote sensing and GIS 15CV563
Dept. of Civil Engineering ,ATMECE
SPECTRAL REFLECTANCE CURVE
Chlorophyll strongly absorbs energy in the wavelength bands centred at about
0.45μm(blue) and 0.67 μm(red)
Our eyes perceive healthy vegetation as green in colour because of the very high
reflection of green light

Remote sensing and GIS 15CV563
Dept. of Civil Engineering ,ATMECE
If a plant is subject to some form of stress, it may decrease chlorophyll production
resulting in less chlorophyll absorption in the blue and red bands
Often the red reflectance increases to the point that we see the plant turn yellow
(combination of green and red)
Spectral reflectance of Vegetation
• In the range from about 0.7 to 1.3 μma plant leaf typically reflects 40 -50% of the energy
incident upon it primarily due to the internal structure of plant leaves
• Because the internal structure of leaves are highly variable between plant species, reflectance
measurements in this range often permit us to discriminate between species (even if they look the
same in visible wavelengths)
• Many plant stresses alter the reflectance in this region, and sensors operating in this range are
often used for vegetation stress detection
Spectral reflectance of Vegetation
• Beyond 1.3 μm energy incident upon vegetation is essentially absorbed or reflected with little
to no transmittance of energy
• Dips in reflectance occur at 1.4, 1.9 and 2.7 μm because water in the leaf absorbs strongly at
these wavelengths (water absorption bands)
• Reflectance peaks occur at about 1.6μmand 2.2 μm, between the absorption bands
Remote sensing and GIS 15CV563
Dept. of Civil Engineering ,ATMECE
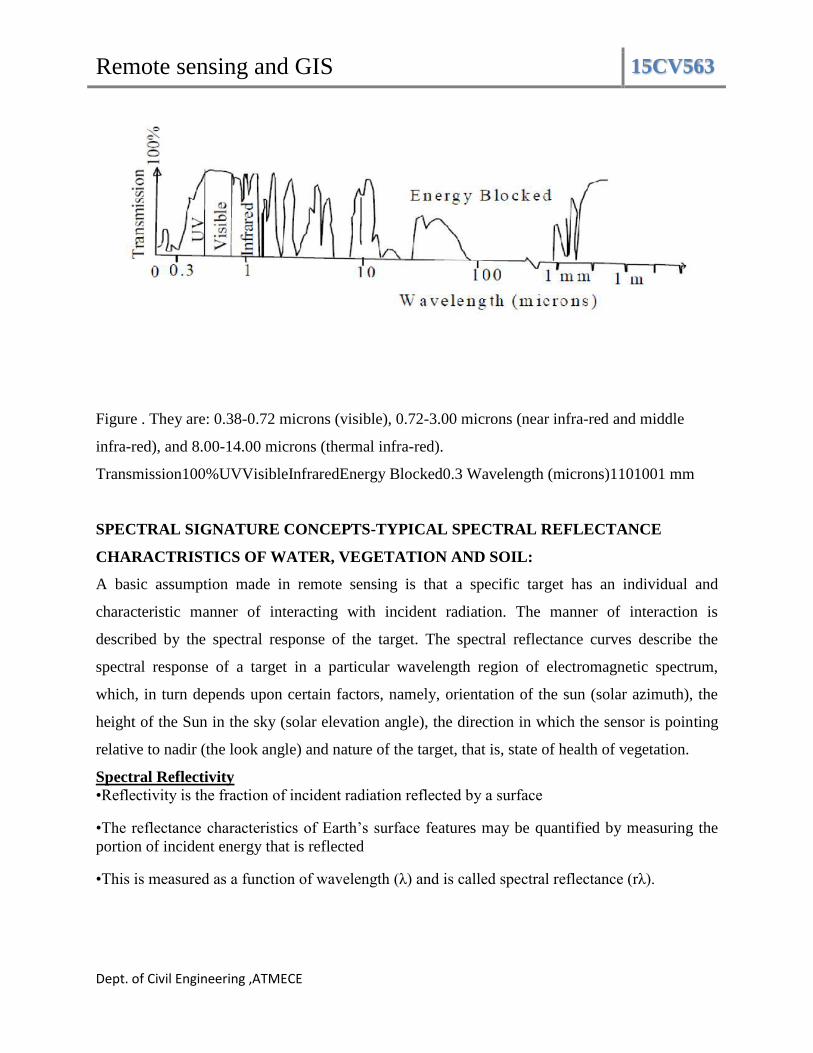
• Throughout the range beyond 1.3 μm, leaf reflectance is approximately inversely related to the
total water present in a leaf which is a function of both the moisture content and the thickness of
a leaf
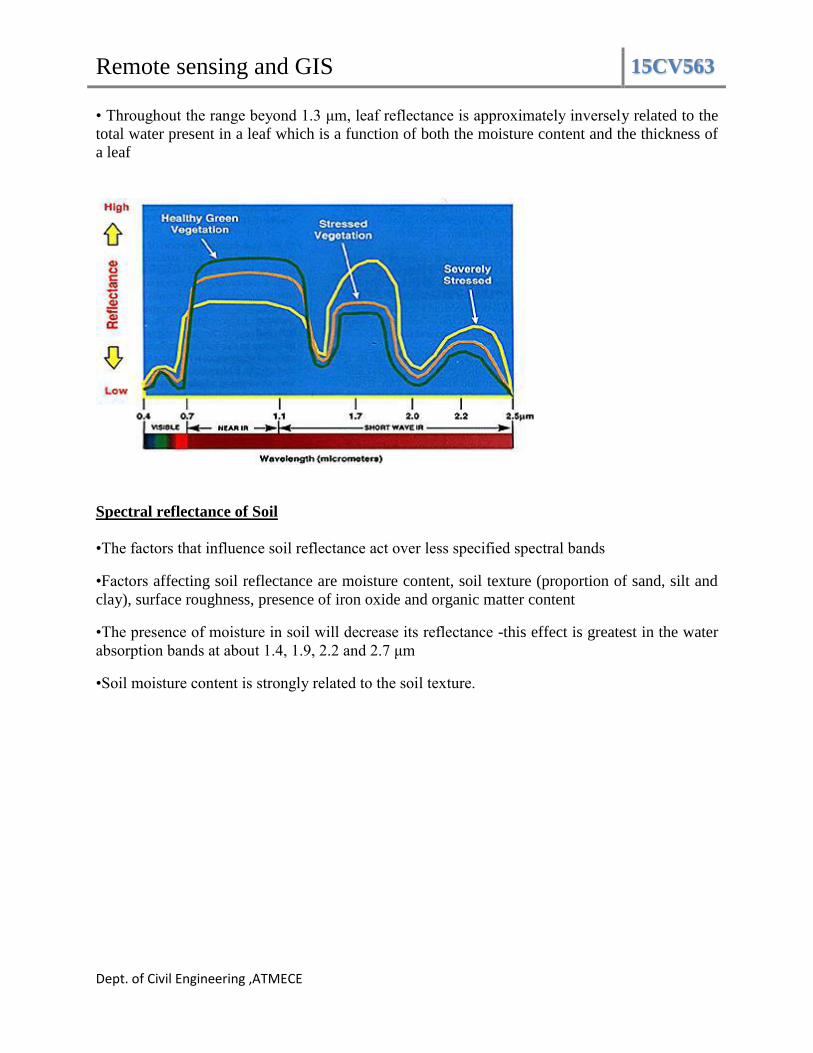
Spectral reflectance of Soil
•The factors that influence soil reflectance act over less specified spectral bands
•Factors affecting soil reflectance are moisture content, soil texture (proportion of sand, silt and
clay), surface roughness, presence of iron oxide and organic matter content
•The presence of moisture in soil will decrease its reflectance -this effect is greatest in the water
absorption bands at about 1.4, 1.9, 2.2 and 2.7 μm
•Soil moisture content is strongly related to the soil texture.
Remote sensing and GIS 15CV563
Dept. of Civil Engineering ,ATMECE
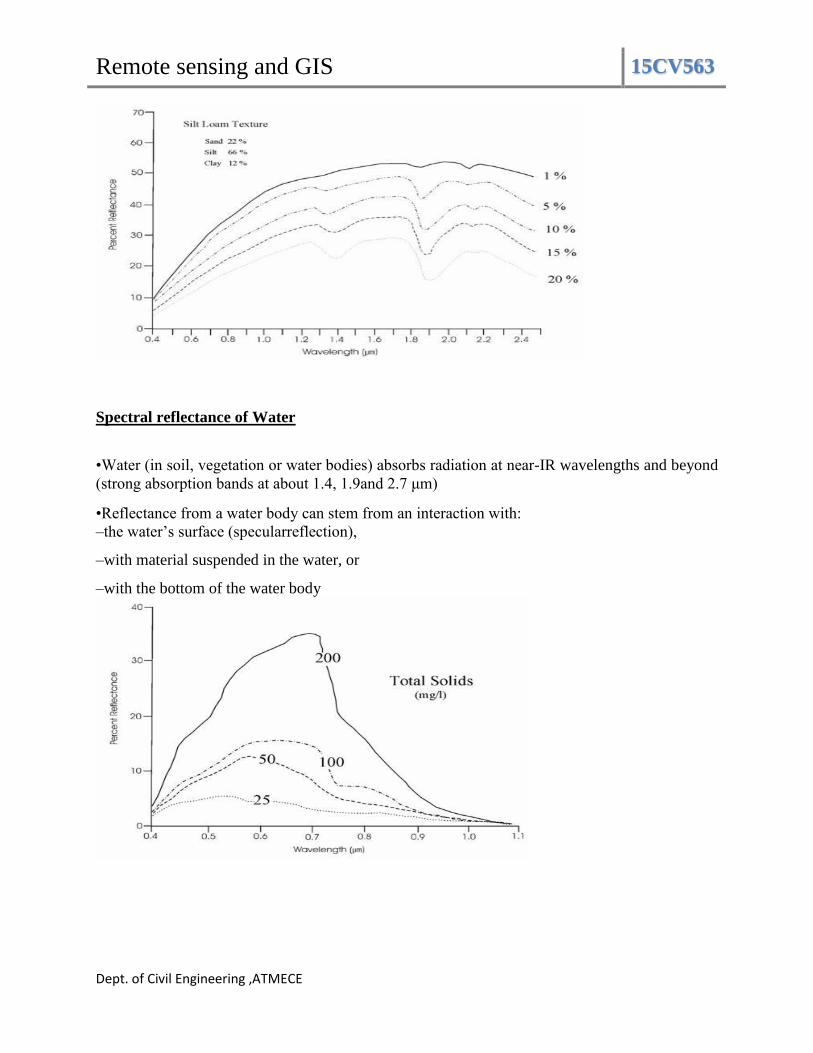
Spectral reflectance of Water
•Water (in soil, vegetation or water bodies) absorbs radiation at near-IR wavelengths and beyond
(strong absorption bands at about 1.4, 1.9and 2.7 μm)
•Reflectance from a water body can stem from an interaction with:
–the water’s surface (specularreflection),
–with material suspended in the water, or
–with the bottom of the water body
Remote sensing and GIS 15CV563
Dept. of Civil Engineering ,ATMECE
ELEMENTS OF VISUAL INTERPRETATION TECHNIQUES
A systematic study of aerial photographs and satellite imageries usually, involves several
characteristics of features shown on an image and it depend upon field of application.
Most of the application consider the following basic characteristics or variation in them
which aid the visual interpretation process of satellites imagery
Although there is a difference of opinion on the number of elements ,there is namely
tone, size, shape, texture, pattern, location, association, shadow and resolution
Tone:- refers to the relative brightness or colour of objects in an image. Generally, tone is the
fundamental element for distinguishing between different targets or features. Variations in tone
also allows the elements of shape, texture, and pattern of objects to be distinguished.
Shape:- refers to the general form, structure, or outline of individual objects. Shape can be a
very distinctive clue for interpretation. Straight edge shapes typically represent urban or
agricultural (field) targets, while natural features, such as forest edges, are generally more
irregular in shape, except where man has created a road or clear cuts. Farm or crop land irrigated
by rotating sprinkler systems would appear as circular shapes.
Size:- of objects in an image is a function of scale. It is important to assess the size of a target
relative to other objects in a scene, as well as the absolute size, to aid in the interpretation of that
target. A quick approximation of target size can direct interpretation to an appropriate result
more quickly. For example, if an interpreter had to distinguish zones of land use, and had
identified an area with a number of buildings in it, large buildings such as factories or
warehouses would suggest commercial property, whereas small buildings would indicate
residential use
Remote sensing and GIS 15CV563
Dept. of Civil Engineering ,ATMECE
Pattern:- refers to the spatial arrangement of visibly discernible objects. Typically an orderly
repetition of similar tones and textures will produce a distinctive and ultimately recognizable
pattern. Orchards with evenly spaced trees, and urban streets with regularly spaced houses are
good examples of pattern.
Texture:- refers to the arrangement and frequency of tonal variation in particular areas of an
image. Rough textures would consist of a mottled tone where the grey levels change abruptly in
a small area, whereas smooth textures would have very little tonal variation. Smooth textures are
most often the result of uniform, even surfaces, such as fields, asphalt, or grasslands. A target
with a rough surface and irregular structure, such as a forest canopy, results in a rough textured
appearance. Texture is one of the most important elements for distinguishing features in radar
imagery.
Shadow:- is also helpful in interpretation as it may provide an idea of the profile and relative
height of a target or targets which may make identification easier. However, shadows can also
reduce or eliminate interpretation in their area of influence, since targets within shadows are
much less (or not at all) discernible from their surroundings. Shadow is also useful for enhancing
or identifying topography and landforms, particularly in radar imagery.
Association:- takes into account the relationship between other recognizable objects or features
in proximity to the target of interest. The identification of features that one would expect to
associate with other features may provide information to facilitate identification. In the example
given above, commercial properties may be associated with proximity to major transportation
routes, whereas residential areas would be associated with schools, playgrounds, and sports
fields. In our example, a lake is associated with boats, a marina, and adjacent recreational land.
Site:-refers to the vocational characteristic of object such as topography, soil, vegetation and
cultural features
FALSE COLOUR COMPOSITE
THE display OF colour assignment for any bands of a spectral image can be done entirely in the
orbitary manner in this case the colour of the target in the displayed image does not have any
resemblance to its actual colour this resulting product is called FCC. A very common FCCs
given for displaying a SPOT multispectral image is
R- near higher band
G- red bands » rivers
B- green bands
This false color composite beam allows vegetations to be detected in the image. In this type of
FCC images vegetations appears in different shapes of red depending on the types and conditions
Remote sensing and GIS 15CV563
Dept. of Civil Engineering ,ATMECE
of the vegetations. Clear water appears as dark blue(higher green band reflectance ), while turbid
water appear cyan it means higher reflectance of red compared to clear water.
Bare soils roads and buildings may appear in various shapes of blue yellow depending on their
compositions.
RESOLUTION
Resolution is a term used to describe the number of dots or pixels used to display an image. High
resolution implies more pixels are used to create the image resulting in clear image, low
resolution will be having fewer pixels to create the image resulting in less clear image.
SPATIAL RESOLUTION:
It is a measure of the smallest angular or linear separation between two objects that
can be resolved by the sensor. The greater the sensor’s resolution, the greater the data
volume and smaller the area covered. In fact, the area coverage and resolution are
inter‐dependent data these factors determine the scale of the imagery.
Spatial resolution describes how much detail in a photographic image is visible to the
human eye. The ability to resolve or separate, small details of the earth surface features.
Spatial resolution is a complex concept which can, for the purpose of remote sensing of
Polar Regions, be defined as the smallest object that can be detected and distinguished
from a point.
The factors effecting spatial resolution; Atmosphere, smoke, low light, blurred sensor
system.
SPECTRAL RESOLUTION:
It refers to the dimension and number of specific wavelength intervals in the
electromagnetic spectrum to which a sensor is sensitive. In the other words sensitivity of
a sensor to respond to a specific spectral wave energy.
Narrow bandwidths in certain regions of the electromagnetic spectrum allow the
discrimination of various features more easily.
These waves include not only visible light but also non visible waves of electromagnetic
radiation energy. Spectral resolution depends on Number of spectral bands, width of each
band.
Based on the number of spectral band absorbing by sensor there are four types of spectral
resolution.
Panchromatic-1 band
Colour-3 band
Multispectral-4+ bands
Hyper spectral-hundreds of bands
TEMPORAL RESOLUTION:

Remote sensing and GIS 15CV563
Dept. of Civil Engineering ,ATMECE
It refers to how often a given sensor obtains imagery of a particular area. Ideally, the sensor
obtains data repetitively to capture unique discriminating characteristics of the phenomena of
interest.
RADIOMETRIC RESOLUTION:
It is the capability to differentiate the spectral reflectance/ remittance from various
targets. This depends on the number of quantization levels within the spectral band. In
other words, the number of bits of digital data in the spectral band will decide the
Sensitivity of the sensor.
It is the smallest difference in exposure that can be detected in a given film analysis. It is
also the ability of a given sensing system to discriminate between density leve:s. In
general, the radiometric resolution is inversely proportional to contrast, so that higher
Contrast film is able to resolve smaller differences in exposure.
Low contrast films have greater radiometric range while highest contrast films have
smaller exposure range and lower radiometric range.
Remote sensing and GIS 15CV563
Dept. of Civil Engineering ,ATMECE
MODULE 2:
The sensors are a transducer that converts the physical property into an electrical signal. The
physical property can be weight, temp, pressure, force, electric, magnetic or electromagnetic
Sensors must have following significant characters
1. Range: Every sensor has a range in which they work with an acceptable error. It has the
maximum and minimum value over which the sensor will work if the input is not in range then
the output is unpredictable
2. Drift: The signal level varies for the same input over a long period. This is the low frequency
changed in the sensor with time. It is often associated with electronic aging of components (or) a
reference standard sensor.
3. Sensitivity (additional): It is defined as the ratio of the incremental change in the sensor
output to the incremental change in the measured input.
4. Selectivity: It’s a system’s ability to measure a target in the presence of others interference.
5. Resolution: It’s a minimal change of measure and that can produce a detectable (clear images)
increment in the output.
6. Response and recovery time: The response time is the time taken by the sensors for its output
to reach 95% of its final value.

Remote sensing and GIS 15CV563
Dept. of Civil Engineering ,ATMECE
The recovery time is defined as the time taken by the sensor for its recovery to reach the final
value.
7. Linearity: If the sensitivity of the sensor is constant for the range then it is called as linearity.
Linear sensors are easier to use while the nonlinear sensors require complex mathematical
calculations
8. Hysteresis: It’s a characteristic of a sensor by which the sensor produces a different set of
output that the data is recorded in different directions.
9. Calibration: If a meaningful measurement is to be made it is necessary to tune the output of a
sensor with accurately known input.
10. Full scale output: It’s a difference between the output for maximum input and the output for
minimum input.
11. Precision: precision of a sensor is its ability to produce same output when repeatedly
measured of a same input
12. Accuracy: It defines how close the output is to the real value. It also defines the maximum
error the sensor may produce.
Platform
A platform is a vehicle or carrier for remote sensors for which they borne.
The platform on which a particular sensor is housed determine a number of attributes which
makes detect the use of a particular sensor. There are three broad categories of remote sensing
platforms.
Ground based
Air borne
Space borne
Ground based: A wide variety of ground-based platforms are used in remote sensing. Some of
the common ones are hand devices, tripods, towers and cranes.
Limitations:
*vehicle limited to roads and is confined to smaller areas along and around the road.
Airborne: Air borne platforms were sole non-ground-based platforms for early remote sensing.
The first aerial images were required with a camera carried along by a balloon
Balloons are rarely used today because they are always not predictable. At present air planes are
the most common airborne platforms.

Remote sensing and GIS 15CV563
Dept. of Civil Engineering ,ATMECE
Space borne: The most stable platform aloft is a satellite. The first remote sensing satellite was
launched in 1960 for methodology purpose (weather forecasting). Then the space shuttle is a
unique space craft that functions as a remote sensing satellite
Fundamental sensor types
There are several broad categories of basic sensor system. Types such as
1.Passive and active sensors
2.Imaging and non-imaging sensors
1.passive v/s Active sensors Passive sensors detect natural radiation that is emitted or reflected by the object or
surrounding areas. Reflected sunlight is the most common source of radiation measured by passive
sensors. Examples of passive remote sensors include film photography, infrared, charge-
coupled devices, and radiometers.
Active sensor
Active sensors are the ones which uses the electromagnetic radiations as a source. It is a
man made source.
Active Remote sensors create their own electromagnetic energy that is transmitted from the sensor towards the terrain, interacts with the terrain producing a backscatter of energy and is recorded by the remote sensor’s receiver.
Examples are RADAR and LASER
2.Imaging versus Non-imaging (Scanning sensors)
Data from imaging sensors can be processed to produce an image of an area within which
smaller parts of the sensors. whole view are resolved visually.
Non imaging sensors usually are hand held devices that register only a single response value
with no fine resolution
Imaging and non imaging data provides an opportunity to look at spatial relationships, objects
shapes and to estimates physical size based on the data spatial resolution and sampling.
Platforms
1.Land sat: [earth resource transformation satellite]
Jointly managed by NASA and US geological society [USGS]. Land sat programme is the
longest running interprise for acquisition of satellite imageries of earth on July 23rd
1972.

Remote sensing and GIS 15CV563
Dept. of Civil Engineering ,ATMECE
There was eventually renamed to Land sat for ERTS. LANDSAT 8 was the most recent satellite
launched on 11th
feb 2013.
LANDSAT 9 is in development with the launch date laid 2020.
The instruments abroad LANDAT satellites had acquired billions of images through the course
of the machine.
The data are valuable resource for global change research and application in agriculture, forestry,
geology, regional planning and education.
LANDSAT data can be downloaded to all users at no charge.
Common sensors used in LANDSAT are MSS(multispectral scanner), Enhanced tumatic
mapper(ETM), TM (thematic matter), OLI (operational land Image), Thermal infrared
sensor(TIR)
SPOT(satellite pour observation terre)
It was set up in 1978 by France in partnership with Belgium and Sweden. The spot satellite
offers acquisition and revisit to acquire image from anywhere in the world. The spot satellite
payloads comprise of two identical high-resolution optical imaging instrument which can operate
simultaneously on individual in either PAN or MSS.
SPOT-1
It was launched by Air Bus on 30th
june 2014,
IKONOS
It is a commercial earth observation satellite with high resolution sensor. On September 24th
1999 at Vander burg air force base California, U.S
The first IKONOS was launched and is operated by a company called digital globe.
Its application includes both urban and rural mapping of natural resources and disaster
management, Agriculture, Forestry, mining and construction
IKONOS has aa primary aperture of 0.7m and a folded optical local length of 10m. The
detectors act with mass of about 171 kg
ENVISAT
It is a large inactive earth observing satellite which is still in orbit. It is operated by European
space agency.

Remote sensing and GIS 15CV563
Dept. of Civil Engineering ,ATMECE
ENVISAT was launched on 1st march 2002 and ended its transmission in 8
thapril 2012 following
the unexpected loss of contact with satellite.
It carries a payload consisting of 10 instruments of advanced design and provides smooth
transaction.
ENVISAT performed optical, RADAR and spectroscopic measurements of the land, atmosphere
and ice ensuring data from ERS-1(European research satellite) and ERS-11. It weighs about
8211 kgs
IRS
IRS-1B
IRS-P2
IRS-P4
IRS-1C
IRS-P6
IRS-1A
IRS-1D
IRS-1A
IRS is the first series in remote sensing. Launched on 17th
march 1988.
IRS 1B
Launched on 29th
aug 1991
Payloads LISS_1,LISS 2b
IRS-P2
Launched on 15th
October 1994
Payloads are LISS 2A and LISS 2B
IRS-P4
Launch 26.05.1999, payloads OCM, MSMR
IRS_P6
Launch 17th
oct 2003, PSLV-C5
IRS-1C and 1D

Remote sensing and GIS 15CV563
Dept. of Civil Engineering ,ATMECE
On both tape recorders with capacity of 6240 enhanced, payloads like better special resolution
with additional spectral bands.
CARTOSAT
Its an Indian based satellite which started its machine in 2006. The most resent platform
CARTOSAT-2 is launched on 23rd
june 2017 with 30 co satellite at sathis dhawan space centre
at sri harikota.
It orbits 14 times per day and carries two pan sensors
Applications: urban management, mineral exploration, disaster management etc
Basics of Digital image Processing
A digital image is a representation of two-dimensional image of finite set of digital values
(or) pixels.
Pixel value typically represent grey levels, colours, heights and opacity.
Digitization implies that a digital image is an approximation of a real scene
Digital image processing focuses on two major tasks.
1. improvement of pictorial Information for human interpretation.
2. Processing of image data for storage transmission, and representation for . .
autonomous machine perception.
The use of digital image processing techniques
It has exploded and they are used for all kinds of tasks
Image enhancement
Medical visualization
Law enforcement
Industrial inspection
Human computer interface
Stages or process of DIP ( Digital image processing)

Remote sensing and GIS 15CV563
Dept. of Civil Engineering ,ATMECE
Digital data Images with a continuous grey tone like a photograph are called analog images.
A group of divided small cells with integer values of average intensity, the centre representing
the cell value is digital image.
Remote sensing data are the data digitised by a process of sampling and quantisation with
electromagnetic energy which is detected by the sensors.
The data that is acquired by the sensor has errors, the correction in the images are classified into
radiometric corrections and geometric corrections
Radiometric corrections: These are removal of sensors or atmospheric noise, more accurately
represent ground conditions
Geometric corrections: conversion of data to ground coordinates by removal of distortion from
sensor geometry. It enables mapping relative to data layers. It also enables mosaicing (merging
two images each other) or comparison.
There are methods of geometric corrections which includes systematic errors and non-
systematic errors.
Systematic errors
When the geometric reference data or geometric sensor are given or measured geometric
distortion can be theoretically or systematically avoided.
The source of systematic errors in RS are explained

Remote sensing and GIS 15CV563
Dept. of Civil Engineering ,ATMECE
Scan skew: caused when ground swath is not normal and is skew due to forward motion of the
platform during the time of scan
Platform velocity: caused due to change in speed of the platform in along track scale distortion
Earth rotation: caused due to the rotation of earth during scan period resulting in along scan
distortion.
Mirror scan velocity: caused when the ray of scanning is not constant resulting along scan
geometric distortion.
Panchromatic distortion: caused when the intensity of the source is greater or lesser resulting in
along scan image distortion.
Non-systematic error:
Polynomials to transform from a geographic co-ordinate system to image system or vice versa
will be determined by ground controlled points
Non-systematic errors are classified as below:
Attitude and altitude
Attitude: Errors due to attitude variation can be attributed to roll,pitch and yaw(shapes) of the
satellite . some of these errors can be corrected having knowledge about platform, ground-
controlled points, sensors characters, space craft velocity.
Altitude: caused due to the departure of sensors, altitude resulting in change of scale.
Data formats:
In order to properly process the remote sensing data the analyst must know how the data is
organised, stored on the digital tapes(storage devices) and how data is processed to computer
softwares.
There are 4 major data formats
1. Banded interleaved by pixel (BIP)
2. Banded interleaved by line (BIL)
3. Banded sequential format (BSQ)
4. Banded length and encoding format (BLE)
1 Banded interleaved by pixel
One of the earliest data format used for the satellite data. This format treats pixel as the separate
value. Brightness value of each pixel is sorted after the other.

Remote sensing and GIS 15CV563
Dept. of Civil Engineering ,ATMECE
2.Banded interleaved by line
Just as banded interleaved by pixel format each pixel of data has a separate unit. The banded
interleaved by line format is sorted by lines. Shows the logic of how the data is recorded in the
computer tape in sequential values of four bands.
3 Banded sequential format (BSQ)
The banded sequential format requires that all data from single band covering the entire scene
will be written as one file. Thus, if the analyst wanted to extract the area in the centre of the
scene in four bands it would be necessary to read it into this location in four separate folders and
to extract the desired information, many researchers like this format because it is not necessary to
be serially posted unwanted information or run length

Remote sensing and GIS 15CV563
Dept. of Civil Engineering ,ATMECE
4 BAND LENGTH AND ENCODING FORMAT
Its based on sequential format which keep tracking both the brightness value and number of
times brightness value occur along the scale line. However, the data is exceptionally
Heterogenous with very few similar brightness values, this format is no better than others.
Image enhancement
It is a technique that has been widely used in many applications of image processing where the
subjective quality of image is an important tractor in calculating an image.
The goal of image enhancement is to improve the usefulness of an image for the assigned task.
The reasons for doing this includes
1.Highlighting, intersecting details in images.
2. Removing noises from images
Remote sensing and GIS 15CV563
Dept. of Civil Engineering ,ATMECE
3. Making images more visually appealing.
4. The techniques can be categorized as contrast manipulation, special manipulation and
. multi image manipulation
Contrast manipulation
One of the most common defects of a photographic or electronic image. Poor contrast resulting
from either poor lighting conditions and small dynamic range.
This is further followed by three techniques
1. Grey level thresholding
2. Contrast stretching
3. Level slicing
1 Grey level Thresholding:
It’s a simple look up table which partitions the grey level in an image into one or two categories.
Those below the users selected threshold and those above the selected threshold.
Thresholding is the one of the many methods for creating the binary mass for an image. This
procedure is used to segment an image into two classes. One for those pixels having values
below an analyst and one for above those values.
Level slicing
It is an enhancement technique where by the digital numbers (DN) distributed along the x-axis of
an image.
Histograms is divided into a series with specified intervals of slices. All of DN’s falling with a
given interval is input image which are then displayed at a single DN in output image.
Contrast stretching
Most satellites and air borne sensors were designed to accommodate a wide range of illumination
conditions form poorly lit artic regions to high reflectance desert region. Because of the pixel
values the majority of digital scenes occupy a relatively small portion of the possible range.
If the pixel values are displayed in their original form only a small range of gre
y values are displayed and will be used, resulting in low contrast display on which similar
features might be undistinguishable.
Image filtering:
It is a technique for modifying or enhancing an image.
E.g.: you can filter an image to emphasize certain features or remove other features. image
processing operations is implemented with filtering includes smoothening, sharpening and edge
enhancement Filtering is neighbourhood operation in which the values of any given pixel in the
Remote sensing and GIS 15CV563
Dept. of Civil Engineering ,ATMECE
output image is determined by applying some algorithm to the values of the pixels, in the
neighbourhood.
High pass filters: it enhances difference between values of neighbouring pixels, these changes
in values are represented by edges and lines.
Edge: the border between two types of surfaces (forest and field)
Lines: rivers, streets, roads which are enhanced by high pass filters which are similar than half of
filter windows. these filters are used foe sharpening images, edges and lines.
Low pass filters: the rate of smoothening depends on the size of filters window, we can use
these filters to denoise post class correction.

Remote sensing and GIS 15CV563
Dept. of Civil Engineering ,ATMECE
MODULE 3 AND 4
What is GIS? DESCRIBE THE DIFFERENT COMPONENTS OF GIS
GIS is computer system designed to capture Store, Manipulate, Analysis, Manage and display spatial or
geospatial data
COMPONENTS OF GIS
A GIS divided into five components,
1. HARDWARE
2. SOFTWARE
3. DATA
4. PEOPLE
5. METHODS OR PROCEDURE all these components need to be in balance for the system to be
successful. no one part can run without the other
PEOPLE
The people are the component who actually makes the GIS work. They are responsible for maintenance
of the geographic database and provide technical support. People associated with GIS can be categorized
into viewers, general users and GIS specialists
General users are people who use GIS to conducting business, performing professional, services and
making decisions. They include facility managers, resource managers, planners, scientist, engineers,
lawyers, business, entrepreneurs etc.
GIS specialists are the people who make the GIS work. They include GIS managers, Database
administrators, and application specialists. System analysts and programmers.
METHODS OR PROCEDURE
They include how the data will be retrieved, input into the system, stored, managed, transformed,
analyzed and finally presented in a final output. The procedure are the steps taken to answered the
question need to be resolved
HARDWARE
Hardware: It consists of the equipments and support devices that are required to capture, store
process and visualize the geographic information. These include computer with hard disk,
digitizers, scanners, printers and plottersetc.
SOFTWARE:
Software is at the heart of a GIS system. The GIS software must have the basic capabilities of
data input, storage, transformations, analysis and providing desired outputs. The interfaces could

Remote sensing and GIS 15CV563
Dept. of Civil Engineering ,ATMECE
be different for different software’s. The GIS software being used today belong to either of the
category –proprietary or open source. ArcGIS by ESRI is the widely used proprietary GIS
software. Others in the same category are MapInfo, Micro station, Geomedia etc. The
development of open source GIS has provided us with freely available desktop GIS such as
Quantum, uDIG, GRASS, Map Window GIS etc., GIS software’s.
DATA:
The data is captured or collected from various sources (such as maps, field observations,
photography, satellite imagery etc) and is processed for analysis and presentation.
Write brief note on objectives of GIS
Some of the major objectives of GIS are to
Maximizing the efficiency of planning and decision making
Integrating information from multiple sources
Facilitating complex querying and analysis
Eliminating redundant data and minimizing duplication
Capacity to integrate information from many source
EXPLAIN THE ORIGIN AND MEANING OF GEOGRAPHIC INFORMATION
SCIENCE
GIS can answerer
Location information- means what exists at a point or particular location
Condition –identify location where certain condition exist
Trends- what has changed since?
Patterns -what spatial patterns exist?
Modeling- what if
Mapmaking (representation of geographical information) has evidences to show independent evolution of maps in
different parts of the earth. The direct evidence of mapping comes from Middle East in the form of Babylonian Clay
Tablets as early as 1000 B.C which depicted earth as a flat circular disk.
Around 200 B.C, Eratosthenes calculated the circumference of earth accurately. Later came, Ptolemy and Al-Idrisi
who made remarkable contributions in the field of cartography. Following them were Mercator and Newton, their
work paved way for the upcoming cartographers and geographers to better understand the earth and the geographical
phenomenon.
Putting layers of data on series of base maps to analyze things geographically has been into existence much longer
than the introduction of computers to the geographical world.

Remote sensing and GIS 15CV563
Dept. of Civil Engineering ,ATMECE
The French cartographer Louis-Alexandre Berthier had drawn the maps of the Battle of Yorktown (1781) that
contained hinged overlays to show troop movements.
Early Developments in GIS
Canada Geographic Information System (CGIS)
The earliest GIS, set up in mid 1960s by Roger Tomlinson and colleagues for Canadian
Land Inventory.
It was developed as a measuring tool (to measure area), a producer of tabular information
rather than a mapping tool.
Harvard Laboratory
The Harvard laboratory for Computer Graphics and Spatial Analysis was established in
1964 by Howard Fisher at Harvard University.
The GIS packages developed were SYMAP, CALFORM, SYMVU, GRID, POLYVRT,
ODYSSEY

Remote sensing and GIS 15CV563
Dept. of Civil Engineering ,ATMECE
Dual Independent Map Encoding (DIME)
Developed by US Bureau of Census in 1967 to conduct the 1970 census of population.
Digital records of all US streets were created to support automatic referencing and
aggregation of census records.
Environmental Systems Research Institute (ESRI)
Jack Dangermond founded ESRI in 1969 to undertake GIS projects.
In 1981, ESRI launched ArcInfo (major commercial GIS software system) based on
vector & relational database data model.
Longley et al (2001) have described the period from1980 to 2000 as the era of
commercialization in the field of GIS. The period marks the establishment of commercial
GIS industries, research centers, GPS, OpenGIS Consortium, Internet GIS products
along with publications on GIS and allied fields. The period after 2000 is referred to as
the era of exploitation. In 2000, it was estimated that GIS was being used by one million
core users and five million casual users.
Importance of GIS
GIS informs not only about the activities and the events but also where they exist. The
solutions to problems often require access to several types of information that can only be
linked by geography. GIS allows to store and manipulate information using geography
and to analyze patterns, relationships, and trends in that information to help in making
better decisions.
Application of GIS
GIS is involved in various areas. These include topographical mapping, socioeconomic
and environment modeling, and education. The role of GIS is best illustrated with respect
to some of the representative application areas that are mentioned below:
Tax Mapping: Raising revenue from property taxes is one of the important functions of
the government agencies. The amount of tax payable depends on the value of the land
and the property. The correct assessment of value of land and property determines the
equitable distribution of the community tax. A tax assessor has to evaluate new properties
and respond to the existing property valuation. To evaluate taxes the assessor uses details
on current market rents, sale, maintenance, insurance and other expenses. Managing as
well as analyzing all this information simultaneously is time consuming and hence comes
the need of GIS. Information about property with its geographical location and boundary
is managed by GIS. Land units stored in parcel database can be linked to their properties.
Querying the GIS database can locate similar type of properties in an area. The
characteristics of these properties can then be compared and valuation can be easily done

Remote sensing and GIS 15CV563
Dept. of Civil Engineering ,ATMECE
Business: Approximately 80 percent of all business data are related to location.
Businesses manage a world of information about sales, customers, inventory,
demographic profiles etc. Demographic analysis is the basis for many other business
functions: customer service, site analysis, and marketing. Understanding your customers
and their socioeconomic and purchasing behavior is essential for making good business
decisions. A GIS with relevant data such as number of consumers, brands and sites they
go for shopping can give any business unit a fair idea whether their unit if set up is going
to work at a particular location the way they want it to run.
Environment: GIS is being increasingly involved in mapping the habitat loss, urban
sprawl, land-use change etc. Mapping such phenomena need historical landuse data,
anthropogenic effects which greatly affect these phenomena are also brought into GIS
domain. GIS models are then run to make predictions for the future.
Logistics: Logistics is a field that takes care of transporting goods from one place to
another and finally delivering them to their destinations. It is necessary for the shipping
companies to know where their warehouses should be located, which routes should the
transport follow that ensures minimum time and expenditures to deliver the parcels to
their destinations. All such logistics decisions need GIS support.
EXPLAIN THE DIFFERENT STEPS INVOLVED IN GIS
SPATIAL DATA INPUT
ATTRIBUTE DATA MANAGEMENT
DATA DISPLAY
DATA EXPLANATION
DATA ANALYSIS
GIS MODELLING
1. Analysis and modeling in a GIS requires input of relevant data. The data consist of two
types: spatial data representing geographic features (points, lines and areas) and attribute
data (descriptive information). Data input should be done with utmost care, as the results
of analyses heavily depend on the quality of the input data. In ILWIS data can be entered
by: − 2. Digitizing, if you want to use data from analog (paper) maps; − 3. Keyboard entry, for entering tabular data; −
4. Scanning, if you want to use paper prints of satellite images, aerial photographs, maps 5. pictures; − Importing existing data files from other sources.

Remote sensing and GIS 15CV563
Dept. of Civil Engineering ,ATMECE
Maps aerial sensors field photographs observation
Computer digitations stereo scanners magnetic key board and plotter
Data input
Data base
Geographic database
Location
Topology attribute
Management system
Data storage and data base management sorcess the way in which data about the location,
linkages and attributes of geographical elements ( points, lines, atreas and more complex entities
representing objects on the earth surface) are structured and organized, both with respect to the
way they must be handled in the computer and how they are perceived by the uses of the system.
The computer program used to organize the database is known as a database management system
(DBMS)
DATA OUTPUT AND PRESENTATION:- concern the ways the data are displayed and how the
results of analyzer are reported to the user. Data may be presented as maps, table in a variety of
ways ranging from the ephemeral images on the computer screen through the hard copy, output
drawn on the printer or plotter to information recorded on magnetic media in digital form
Data output display and reporting

Remote sensing and GIS 15CV563
Dept. of Civil Engineering ,ATMECE
Maps Tables Graphs Video
DATA transformation embraces two classes of operation, namely transformation
added to remove error from the data as bring them up to data or to match them to other data sets
and the lorge assay of analysis methods that may be applied to the data in order to achieve
answer to the function asked of the GIS. Transformation can operate on the spatial, topological
and the non spatial aspects of the data, either separately or in combination
Transformation
The interaction between user and GIS for data and query input and the writing of models for the
data analysis in an aspect that has been neglected until recently. The introduction of the
personal computer, the mouse or pointing device and multi windowing has made it much easier
for many people to use completes through typing skills are still essential for most tasks.
Organizational context
Organizational aspect or context nothing but the way the information flows and the way in which
the analysis is done. The organizational context involve three sub components
a. data data isnothing but information bring used for the analysis
b. b. people the people involved in the analysis and the creation of the information system.
If also involve the uses
c. methods the methods is nothing but the steps, procedure which are used for the analysis
and in the making of the information system
Computer printer paper of optical and
Screen film plotter magnetic
media
Maintenance
And updating Utilization and analyzer

Remote sensing and GIS 15CV563
Dept. of Civil Engineering ,ATMECE
Management
Explain in detail on the different types of data utilize in GIS technology
DATA TYPE
Spatial data
Also known as geospatial data or geographic information it is the data or information that
identify of geographic location information system like feature and boundaries on earth such as
natural or constructed featute oceans and more, spatial data is usually stored as co ordinate and
topology and is data that can be mapped spatial data often accessed manipulated or analyzed
through GIS
DEFINITION 1 The conversion or abstraction of the earth and its properties to adatabase that
define location and properties of individual features of interest
DEFINITION 2. Duplicating the real world in the computer by collecting information about
things and where these things are located
Spatial data is : an inventory os assets land cover. Land use and other natural resources can be
considered assets
Information for
management
Aims and furrier from
management
Data gathering
Geographical
information system
Remote sensing and GIS 15CV563
Dept. of Civil Engineering ,ATMECE
Or
Non spatial data/a spatial/attribute data
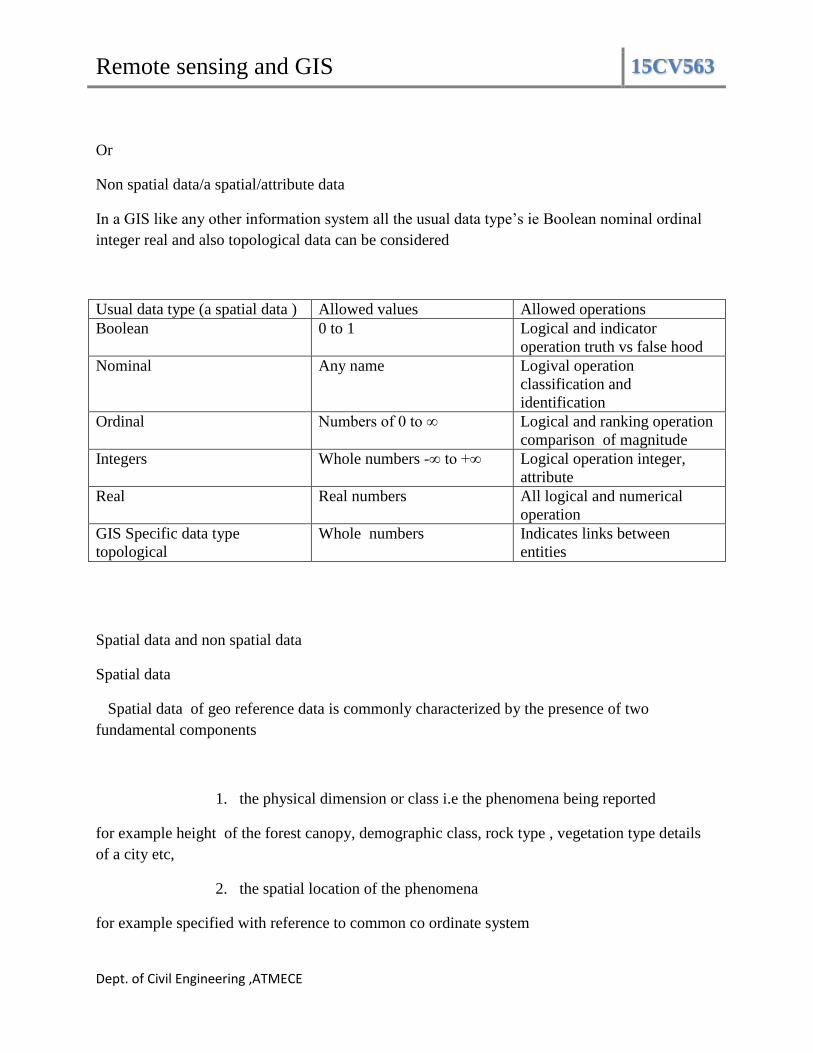
In a GIS like any other information system all the usual data type’s ie Boolean nominal ordinal
integer real and also topological data can be considered
Usual data type (a spatial data ) Allowed values Allowed operations
Boolean 0 to 1 Logical and indicator
operation truth vs false hood
Nominal Any name Logival operation
classification and
identification
Ordinal Numbers of 0 to ∞ Logical and ranking operation
comparison of magnitude
Integers Whole numbers -∞ to +∞ Logical operation integer,
attribute
Real Real numbers All logical and numerical
operation
GIS Specific data type
topological
Whole numbers Indicates links between
entities
Spatial data and non spatial data
Spatial data
Spatial data of geo reference data is commonly characterized by the presence of two
fundamental components
1. the physical dimension or class i.e the phenomena being reported
for example height of the forest canopy, demographic class, rock type , vegetation type details
of a city etc,
2. the spatial location of the phenomena
for example specified with reference to common co ordinate system
Remote sensing and GIS 15CV563
Dept. of Civil Engineering ,ATMECE
Non spatial/attribute/a spatial or tabular data
These are usually data tables that contain information about the spatial components of the GIS
theme . these can be numeric and or character data such as timber type, timber volume , road size
, well depth etc. the attribute are related back to the spatial feature by use of residual identifiers
that are stored both with the attribute table and the feature qualitative (low, medium, high
income) or quantitative the database allows use to manipulate information in many ways from
simple listing of attributes, sorting feature by some attribute grouping by attribute and singling
out groups by attribute
Non spatial data s is divided into
Vector data and raster data
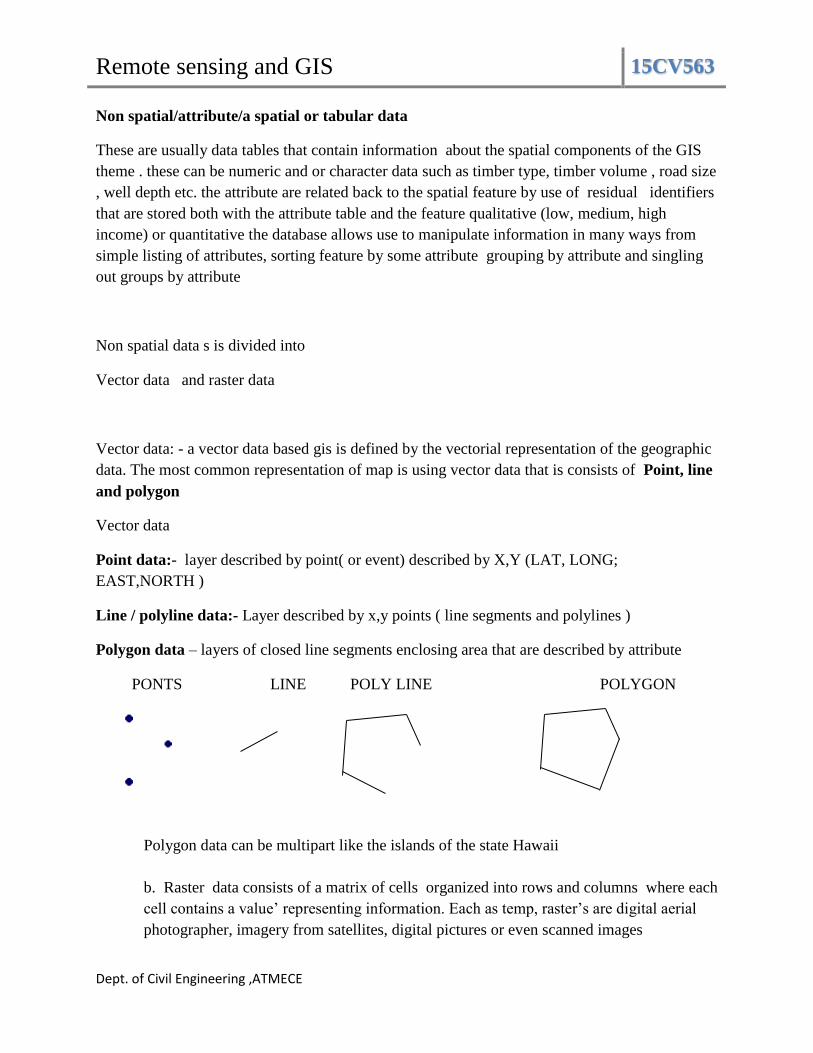
Vector data: - a vector data based gis is defined by the vectorial representation of the geographic
data. The most common representation of map is using vector data that is consists of Point, line
and polygon
Vector data
Point data:- layer described by point( or event) described by X,Y (LAT, LONG;
EAST,NORTH )
Line / polyline data:- Layer described by x,y points ( line segments and polylines )
Polygon data – layers of closed line segments enclosing area that are described by attribute
PONTS LINE POLY LINE POLYGON
Polygon data can be multipart like the islands of the state Hawaii
b. Raster data consists of a matrix of cells organized into rows and columns where each
cell contains a value’ representing information. Each as temp, raster’s are digital aerial
photographer, imagery from satellites, digital pictures or even scanned images
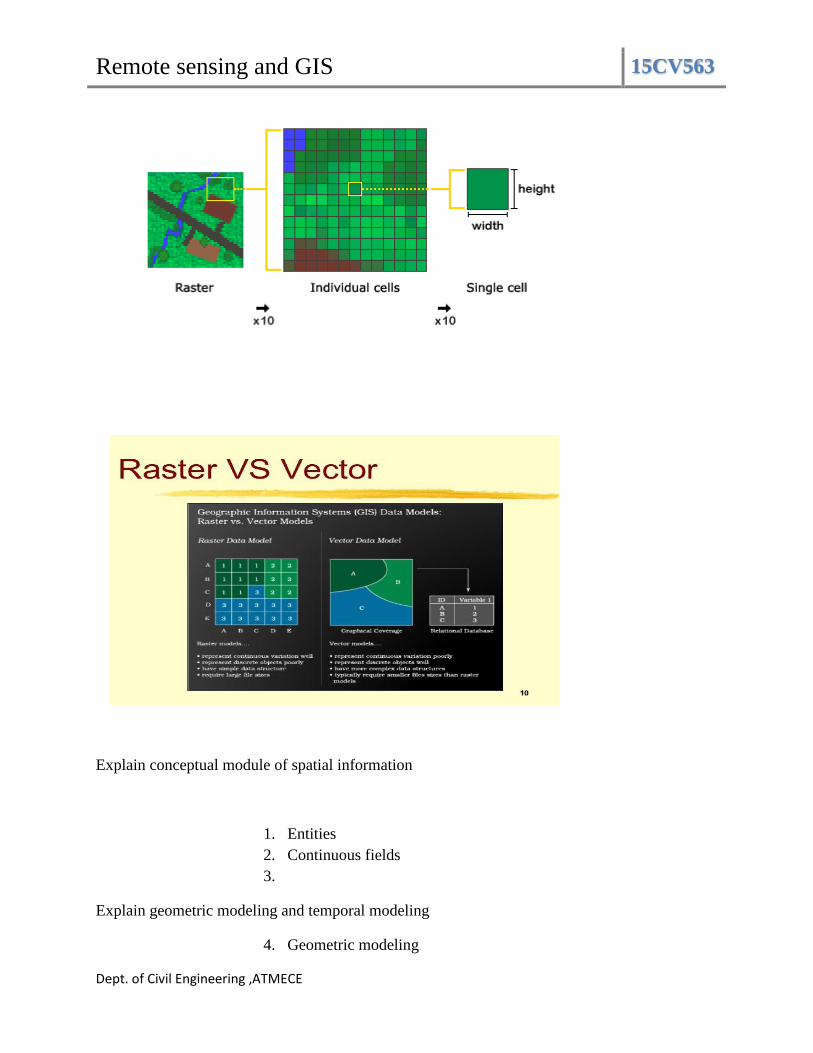
Remote sensing and GIS 15CV563
Dept. of Civil Engineering ,ATMECE
Explain conceptual module of spatial information
1. Entities
2. Continuous fields
3.
Explain geometric modeling and temporal modeling
4. Geometric modeling

Remote sensing and GIS 15CV563
Dept. of Civil Engineering ,ATMECE
5. Temporal modeling

Remote sensing and GIS 15CV563
Department of Civil Engineering, ATMECE
MODULE-5
HYPERSPECTRAL REMOTE SENSING Hyperspectral remote sensing, also known as imaging spectroscopy is a relatively new
technique used by researchers and scientists to detect terrestrial vegetation, minerals and land
use/land cover mapping. Though this data has been available since 1983 onwards, their
widespread use is initiated primarily due to a number of complicated factors serving
applications in various fields of engineering and science. Spectroscopy has been used by
scientists, especially physicists for many years for identifying material composition. Many
techniques employed for analyzing reflectance spectra have been developed in the field of
analytical chemistry. It detects individual absorption features based on the chemical bonds in
solids/liquids/gases. Technological advancements have enabled imaging spectroscopy to be
extended beyond laboratory settings to satellites so that its applications can be focused over a
global extent. In some books, hyperspectral has been used synonymously with the work
imaging spectrometer. Within the electromagnetic spectrum, it is well known that not all spectral bands are available
for remote sensing purposes. Atmospheric windows or regions in which remote sensing is
possible tend to separate the absorption bands. Hyperspectral images are measurements
acquired within these atmospheric windows. The technique of hyperspectral remote sensing
combines imaging and spectroscopy within a single system thereby resulting in large data
sets that require sophisticated processing methods. Generally, hyperspectral data sets will be
composed of about 100 to 200 spectral bands possessing relatively narrow bandwidths unlike
the multispectral data sets which possess just 5-10 bands of relatively larger bandwidths.
Some examples of hyperspectral sensors are Hymap or Hyperspectral Mapper used for
airborne imaging and Airborne Visible/ Infrared Imaging Spectrometer (AVIRIS) first
deployed by NASA in early 1980s.
Figure 1: Multispectral Vs Hyperspectral Remote Sensing
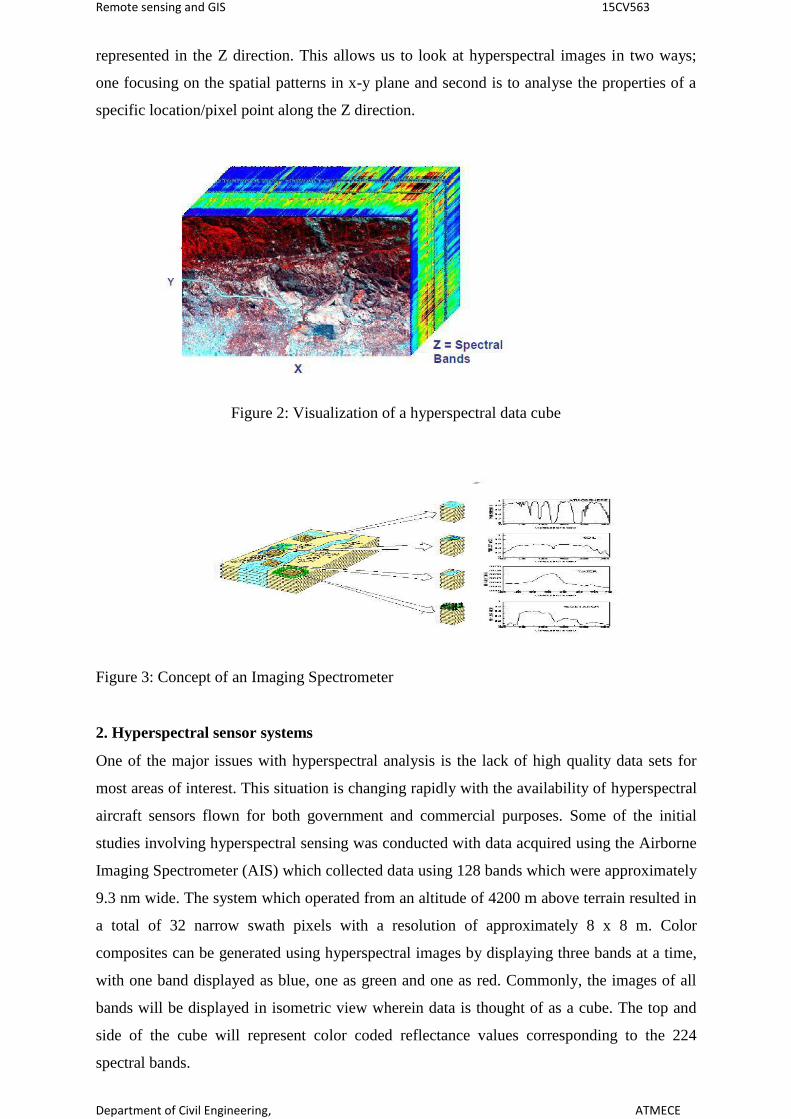
Hyperspectral imagery can be visualized in 3D space as a data cube of spatial information
collected in the X, Y plane wherein spectral information captured in various bands are
Remote sensing and GIS 15CV563
Department of Civil Engineering, ATMECE
represented in the Z direction. This allows us to look at hyperspectral images in two ways;
one focusing on the spatial patterns in x-y plane and second is to analyse the properties of a
specific location/pixel point along the Z direction.
Figure 2: Visualization of a hyperspectral data cube
Figure 3: Concept of an Imaging Spectrometer
2. Hyperspectral sensor systems One of the major issues with hyperspectral analysis is the lack of high quality data sets for
most areas of interest. This situation is changing rapidly with the availability of hyperspectral
aircraft sensors flown for both government and commercial purposes. Some of the initial
studies involving hyperspectral sensing was conducted with data acquired using the Airborne
Imaging Spectrometer (AIS) which collected data using 128 bands which were approximately
9.3 nm wide. The system which operated from an altitude of 4200 m above terrain resulted in
a total of 32 narrow swath pixels with a resolution of approximately 8 x 8 m. Color
composites can be generated using hyperspectral images by displaying three bands at a time,
with one band displayed as blue, one as green and one as red. Commonly, the images of all
bands will be displayed in isometric view wherein data is thought of as a cube. The top and
side of the cube will represent color coded reflectance values corresponding to the 224
spectral bands.

Remote sensing and GIS 15CV563
Department of Civil Engineering, ATMECE
The very first commercially made available hyperspectral scanner was the Compact Airborne
Spectrographic Imager (CASI) which collected data using 288 bands between 0.4 and 0.9
m with an instantaneous field of view of 1.2 mrad. This system was used in combination
with global positioning system GPS) so as to correct for aircraft altitude variations. The
Advance Airborne Hyperspectral Imaging Spectrometer (AAHIS) is another commercially
produced hyperspectral scanner which captures information in around 288 channels within
0.40 to 0.90 m ranges. Another such instrument is the Airborne Visible-Infrared Imaging
Spectrometer (AVIRIS) that collects data using 224 bands which are approximately 9.6 nm
wide between bands 0.40 and 2.45 m . This resulted in a ground pixel resolution of
approximately 20 m. As a follow up of AVIRIS, the Hyperspectral Digital Image Collection
Experiment (HYDICE) was developed with the sole intention to advance hyperspectral
scanner system with a higher spatial resolution. The TRW Imaging Spectrometer was
developed for use in both aircraft and spacecraft which uses around 384 channels operating in
the wavelength range between 0.40 to 0.25 m range. The HyMap (Hyperspectral Mapping)
system, the first commercially available sensor to provide high spatial and spectral resolution
data is built by Integrated Spectronics and is capable of sensing upto 200 bands. Its
availability has tapped the potential of commercial use of airborne imaging spectrometry. It is
possible for the airborne hyperspectral data to generate spectral reflectance curves for
minerals that are similar to those generated within laboratory settings. With the successful use of hyperspectral imagery from AVIRIS and HyMap, global
availability of high quality hyperspectral data has been given priority to cater to the needs of
various applications in engineering and sciences division. As a direct consequence, several
satellite systems are under development like Orbview-4, AIRES-1 etc. Orbview-4 is capable
of imaging earth at a spatial resolution of one meter panchromatic and four meter
multispectral which includes an imaging instrument comprising of 280 channels. ARIES-1 is
an Australian Resource Information and Environment Satellite, flying in low earth orbit and
carrying a hyperspectral sensor using reflected visible and infrared light. It has 32 contiguous
bands providing commercial use to the international remote sensing market place.
3. Hyperspectral Image Analysis Even though hyperspectral sensors enable to identify and discriminated between different
earth surface features, these suffer from disadvantages. Some of these are an increased
volume of data to be processed, poor signal to noise ratios and atmospheric interference.
Hence, analysis of hyperspectral images relies on physical and biophysical models than on

Remote sensing and GIS 15CV563
Department of Civil Engineering, ATMECE
other statistical techniques. Atmospheric gases and aerosols tend to absorb light at particular
wavelengths. Atmospheric attenuation exists in the form of scattering (addition of extraneous
source of radiance into the sensor’s field of view) and absorption (negation of radiance). As a
consequence, the radiance registered by a hyperspectral sensor cannot be compared to
imagery procured at other times/locations. Hyperspectral image analysis techniques are derived using the field of spectroscopy which
relates the molecular composition of a particular material with respect to the corresponding
absorption and reflection pattern of light at individual wavelengths. These images need to be
subjected to suitable atmospheric correction techniques so that the reflectance signature of
each pixel is compared with the spectra of known materials. The spectral information of
known materials like minerals, soils, vegetation types etc will usually be collected in
laboratory settings and stored as “libraries”. Different means are employed to compare the
reference spectra with the obtained spectral reflectance. Previously, individual absorption
features were identified in the image by selecting one spectral band occurring in the low point
and two bands located on either side of the absorption feature. This method will be subjected
to noise in the image data. Also, it will be difficult to deal with overlapping absorption
features. With an increase in the computational facilities, this approach has advanced to
comparison of entire spectral signatures rather than individual absorption features within a
signature. Another method is spectrum ratioing which is, dividing every reflectance value in
the reference spectrum by the respective value of the image spectrum. The disadvantage of
this method is that it fails when the average brightness of the image spectrum is higher/lower
than the average brightness of the reference spectrum as is observed over a topographically
shaded slope. Another technique commonly adopted is the spectral angle mapping (SAM).
This method considers an observed reflectance spectrum as a vector within a
multidimensional space. It allows the number of dimensions to be equal to the number of
spectral bands. The advantage of this method is that even with an increase/decrease in the
overall illumination, the vector length will increase/decrease but its angular orientation will
remain constant. In order to compare two spectra, it is required that the multidimensional
vectors are defined for each spectrum and the angle between the two vectors be calculated.
An angle value smaller than the given tolerance level will result in a match (between the
library reference spectrum and the image pixel spectrum) even if one spectrum is brighter
than the other. For a hyperspectral sensor with 300 or more bands, it becomes difficult for
humans to visualize the dimensionality of space wherein vectors are located. Different

Remote sensing and GIS 15CV563
Department of Civil Engineering, ATMECE
methods exist to process hyperspectral imagery. Though it is not possible to cover the entire
topic in this module, one such method is discussed below. 3.1 Derivative Analysis A digital image can be represented in terms of a 2 dimensional function that has a pixel value
(DN number) associated with each row (r) and column (c) so that pixel value=f(r,c) . But this
function is not continuous for every possible values of r and c and hence is non differentiable
in nature. Hence, to estimate the rate of change at a particular point, the method of
differences is adopted. Assume that the spectral reflectance curve of a target is collected by a
hyperspectral sensor. Let yi and yj denote the adjacent, discrete reflectance values on this
curve at wavelengths xi and xj such that the first difference value can be given by the
expression
y
yi
yj
x
xi
xj The first difference essentially gives the rate of change of function y with respect to its
distance along the x axis. Similarly, we can also obtain the second difference which gives the
rate of change of slope with distance along the x axis. This shows how rapidly the slope is
changing. The first and second differences calculated for one dimensional spectra or 2
dimensional images provide means to approximate the derivatives of a discrete function
which cannot be calculated. The analysis of position and magnitude of absorption bands in
the pixel spectrum can be estimated using the derivative analysis. The derivative methods
tend to amplify any noise if present in the data. Hence, various methods of noise removal are
applied to hyperspectral data ranging from simple filtering approaches to more complex
wavelet based methods.
3.2 Atmospheric Correction As mentioned earlier, atmosphere influences remote sensing measurements by the two major
phenomenons of scattering and absorption. The effects of absorption are more pronounced
due to water vapor with smaller contributions from ozone, carbon dioxide etc, The main step
to analyse hyperspectral imagery is to convert the data into reflectance values such that the
individual spectra can be compared with either laboratory libraries or field data. The
laboratory setting enables provision to calibrate the initial wavelengths. For example, in the
visible and near infrared regions of the electromagnetic spectrum, the narrow atmospheric

Remote sensing and GIS 15CV563
Department of Civil Engineering, ATMECE
bands at 0.69, 0.72 and 0.76 m can be utilized to calibrate wavelengths. Several methods
exist to empirically correct the atmospheric effects. Some techniques involve subtraction of
average normalized radiance value of each channel from each normalized spectrum resulting
in a residual image. Another method dealing with calculating the internal average relative
reflectance involves estimating an average spectrum for an entire imaging spectrometer
dataset. This can then be used for dividing each spectrum in the data set by the average
spectrum. The point to be noted is that all of these methods tend to eventually produce images
and spectra that have characteristics similar to reflectance. Hence, they result in relative
reflectance i.e., reflectance relative to a reference spectrum and not absolute reflectance. The
disadvantage associated with such practices is the presence of artifacts that gets incorporated
as the reference spectrum themselves might possess spectral characteristics related to specific
absorption features. On the positive note, conversion to an apparent reflectance doesn’t
require a priori knowledge regarding the site. To circumvent these issues, a standard area on
the ground can be used to correct the data to reflectance wherein two or more ground
locations can be chosen with albedos which span a wider range. Then, multiple pixels can be
selected within the data set associated with each ground target which can be incorporated
within a linear regression setting to estimate the gain and offsets required to convert the
digital number to reflectance values. Solution of this equation will provide estimates of the
standard error for each parameter at each wavelength. The final step in reflectance correction
is to multiply the instrument digital number values with the gain factor and to add the
corresponding offset values. This will essentially remove atmospheric effects of scattering
and absorption, geometry effects and other instrument related artifacts. Model based atmospheric correction techniques are also being developed like the
Atmospheric Removal Program (ATREM). Here, a three channel ratioing approach is
undertaken to estimate the water vapor on a pixel by pixel basis using the AVIRIS data. For
different water vapor amounts, a number of theoretical water vapor transmittance spectra can
be calculated using radiative transfer modeling. Such a modeled spectra can be run through
the three channel ratioing method and used to generate look up tables of water vapor
concentrations. These values can be used to convert the AVIRIS apparent reflectance
measurements to total column water vapor. As a result, we obtain the spatial distribution of
various water vapor concentrations for each pixel of AVIRIS data. This image can then be
used along with transmittance spectra derived for each of the atmospheric gases to produce a
scaled surface reflectance. The currently available models to correct atmospheric effects

Remote sensing and GIS 15CV563
Department of Civil Engineering, ATMECE
enable to quantitatively derive the physical parameters and analyze data without a priori knowledge.
4. Applications
a) Land use applications: Generally, remotely sensed images will be processed using digital image processing
methods like supervised and unsupervised classification. With the availability of hyperspectral data of increased
spatial and spectral resolution, the potential for land use classification has increased manifold. This imagery
acquired in various spectral bands complement the existing information from traditional remotely sensed images. A
special mention is to be made about vegetation mapping as it has unique spectral signatures during various stages of
its growth that varies with species type. Improved classification is ensured using the hyperspectral imagery owing to
the improved quality in the reference spectra.
b) Ecological Applications: Vegetation indices derived using hyperspectral sensors conclude better and more
sensitive than those derived using optical images. Knowledge regarding the reflectance spectrum of vegetation is
crucial for many applications. The biophysical factors which affect the spectrum of active vegetation are the leaf
chemistry which is responsible for the absorption characteristics of leaf spectrum in the visible wavebands.
Different vegetation has different spectral reflectance curves which can be characterized using vegetation indices.
These indices are essentially ratios that measure the steepness of the red-infrared region of the spectral reflectance
curve but not its position within the spectrum. Using data from hyperspectral sensor, it is possible to characterize
this steep rise in the reflectance curve in terms of a single wavelength.
c) Water Quality Hyperspectral images have been used to assess the water quality in many open water aquatic ecosystems indirectly
by classifying trophic status of lakes, characterizing algal blooms, predicting total ammonia concentrations to
monitor wetland water quality changes. Using remotely sensing images, the chlorophyll content is usually estimated
which in turn can be used for monitoring algal content and therefore water quality. Due to the narrow contiguous
bands, hyperspectral images allow for a better detection of chlorophyll and algae.
d) Flood Detection Previously, though satellite remote sensing enabled monitoring of inundated areas during floods or any other natural
calamity, near real time flood detection was not possible. To provide real time information about natural disasters
like floods, timely information of water conditions is required at sufficient spatial and temporal resolutions. Using
sensors such as Hyperion on board the EO-1 satellite, this is made possible. Many studies of USGS and NASA
utilize satellite based observations of precipitation, topography, soil moisture, evapotranspiration etc into early
warning systems. The hydraulic information obtained using remotely sensed images can be applied in flood routing
studies to generate flood wave in a synthetic river channel. Research is also underway to estimate river discharge
using satellite microwave sensors with an aim to improve warning systems.
e) Evapotranspiration (ET): Information regarding evapotranspiration is crucial for various applications involving
irrigation, reservoir loss study, runoff prediction, climatology etc to name a few. Even though it cannot be measured
by direct means, hyperspectral sensors offer means to estimate components of energy balance algorithms for

Remote sensing and GIS 15CV563
Department of Civil Engineering, ATMECE
spatially mapping ET values. Typically AVHRR and MODIS data are used to estimate evaporative fraction which is
a ratio of ET and available radiant energy. More information can be obtained in Batra et al (2006), Eichinger et al
2006 etc. Analysis of hyperspectral images possesses great potential to advance the quality of spectral data obtained
by sensing earth surface features. Research is currently underway to optimize the analysis of large volumes of
hyperspectral imagery. As mentioned earlier, this is crucial for various applications such as identification of
aerosols, gas plumes etc.
f) Geological Applications Hyperspectral remote sensing has great potential not only to identify but also to map specific chemical and
geometric patterns of land which can be relied to identify areas with economically valuable deposits of
minerals/oils.
4: Applications of hyperspectral remote sensing
Internet and GIS
Internet is a global network of computers connected through communication devices to one another for
information sharing. The use of internet for information dissemination and resource sharing has undergone a
rapid growth over the last few years. This is attributed to its capability to integrate information from various
sources in a seamless manner. The web environment facilitates sharing of data and cooperation among users
across the globe. The computers on the internet communicate with each other via Transmission Control Protocol/
Internet Protocol and use client-server architecture. The World Wide Web (WWW) is a system of Internet
servers and is most used aspect of the internet. It supports hypertext to access several Internet protocols on a
single interface. Hypertext Transfer Protocol (HTTP) is the client-server protocol that takes request from the
client and transmits the request to web server, which then sends back its response. HTTP is used to communicate
queries and response across the Internet.
The recent developments in IT sector have resulted in development of computing architectures that has helped
GIS on desktop to come and become functional over the internet. The GIS functionality is made available
through a web browser and a viewer with a simple, user-friendly interface. During 1960s-1970s, for a GIS to
work, hardware, software and data were needed to be present at one place on one computer. The LAN (local
area network) based desktop GIS follows the client-server model where the GIS programs on computers
(clients) communicate with the server. In this case the GIS programs are installed on the computers and one has
to access these computers to use the GIS. With the advent of distributed GIS, users do not need to purchase and
install expensive GIS software in order to access and work with maps and databases. Distributed GIS makes use
of internet and wireless network for data processing and communication. The users can access GIS tools and
data from internet or wireless data services. Thus web based GIS offers advantages such as worldwide access, a
standard interface and a cost effective maintenance over a stand-alone GIS system.
WebGIS can perform all GIS functions such as capturing, storing, editing, analysis and visualization. Given
below is a brief about its strengths:

Remote sensing and GIS 15CV563
Department of Civil Engineering, ATMECE
a) Visualization and Querying: GIS data and results are mostly represented as maps. Every feature on map has
certain information associated with it. On querying one may come to know the location of a particular feature
and the properties associated with it.
b) Collection of Geographical Information: Various organisations collect spatial information on web. One way of
doing this is by developing an application which is opened to public where public is asked for feeding in the
spatial information. The Wikimapia website which has more than 18 million places marked by the registered as
well as anonymous internet users is an example of such kind. Use of mobile GIS where field crew collects
information, validate it and post the updated information to the server and database kept in the office is another
way of collecting geographical information.
c) Dissemination of geospatial information: A lot of geospatial information is distributed through the WebGIS
platform. For example, India-WRIS is a web based platform through which one can visualize as well as
download the geospatial data related to water resources of India. In a similar manner various organisations have
been disseminating the data through such geospatial portals.

Remote sensing and GIS 15CV563
Department of Civil Engineering, ATMECE