rema ananthanarayanan, pranay k lohia, and srikanta … · · 2017-11-15rema ananthanarayanan,...
TRANSCRIPT
DataVizard: Recommending Visual Presentations for Structured Data
Rema Ananthanarayanan, Pranay K Lohia, and Srikanta Bedathur
IBM Research, India
November 15, 2017
Abstract
Selecting the appropriate visual presentation of the data such that it preserves the semantics of the underlying dataand at the same time provides an intuitive summary of the data is an important, often the final step of data analytics.Unfortunately, this is also a step involving significant human effort starting from selection of groups of columns in thestructured results from analytics stages, to the selection of right visualization by experimenting with various alternatives.In this paper, we describe our DataVizard system aimed at reducing this overhead by automatically recommending themost appropriate visual presentation for the structured result. Specifically, we consider the following two scenarios:first, when one needs to visualize the results of a structured query such as SQL; and the second, when one has acquireda data table with an associated short description (e.g., tables from the Web). Using a corpus of real-world databasequeries (and their results) and a number of statistical tables crawled from the Web, we show that DataVizard is capableof recommending visual presentations with high accuracy. We also present the results of a user survey that we conductedin order to assess user views of the suitability of the presented charts vis-a-vis the plain text captions of the data.
1 Introduction
Visual analytics today is an integral part of the data analytics pipeline and follows as a natural sequel or complementto other modes of data analytics through browsing, querying or search interfaces. Visual presentation of structured datain various formats ranging from simple bar-/line-charts to the use of stacked/grouped bar-charts for multi-dimensionaldata, facilitate visual analytics of the data by domain experts1. In most scenarios, the person who develops these visualpresentations, or charts, is skilled in one or more of the domains including data science, statistics, programming and/oruser interfaces. Given this scenario, the path to data visualization has taken one of the following alternatives: (i) thevisualization is developed as a specific solution for the problem or the domain at hand. This usually pre-supposes domainknowledge and/or extensive knowledge of how the data is to be interpreted as well as how the visualization is going to beused; (ii) Standard templates are used, where specific types of data sets result in charts of specific types, and the user thenhas the option of trying out other chart configurations for the same data. This is the approach in some of the common andpopularly used tools like Excel [11] and Google Sheets [6], where users can highlight the set of rows and columns, view thesystem-suggested default presentations for the data, and also have the option to view other configurations. Unfortunately,while these systems are quite powerful in terms of repertoire of analysis methods they embed, the support for visualizationthey extend is quite limited. The suggested visualizations are sensitive to the order of selected columns, and more over,they fail to make use of any metadata – often available in the form of captions, queries, headers and other forms – toappropriately recommend the visualization.
Recently, some attempts have been made to recommend charts for a dataset under consideration by taking naturallanguage hints — specifically the action clauses in the natural language (such as “compare”, “changed over”, etc.) [15].In our paper also we use the natural language semantics to infer the best type of chart. However, in contrast to using theaction clauses in the title or query, we focus on automatically generating recommendations by analysing the structuredquery outputs and Web tables in addition to the types of noun phrases in the title without having the user explicitlyprovide additional natural language hints.
We have been motivated by the need to be able to recommend the right chart in various scenarios where users query datafor insights, either while interacting with a relational database system using SQL queries or while analyzing the tabulardata extracted from the Web or other sources. In these settings, there is often supporting information such as the databasequery and schema, or the caption of the table, for instance. We started out by building a rule-based visual presentationrecommendation system by leveraging the best practices laid out through the rich work in the area of visual statistics. Sub-sequently, with the insight gained in the process, we were able to define features on the data sets that enabled us to automat-ically learn the most appropriate charts. Based on this, in DataVizard, which we describe in this paper, we focus on recom-mending the most relevant chart for the data under consideration. This may then be combined with other visualization gen-
1In this paper we use the term chart to refer to the various data representations of structured data such as bar charts, line charts, multi-linecharts, stacked bars and pie charts, among others.
1
arX
iv:1
711.
0497
1v1
[cs
.AI]
14
Nov
201
7
eration libraries or tools, to render visual summaries of the data from which the user may get insights for subsequent explo-ration. Our approach towards achieving this has been two-fold: first, identify the variables of interest and the dependenciesbetween the variable in a dataset, and, second, recommend the best chart based on the features identified in the first step.
In the caes of SQL, we consider the variables involved in the query as well as their inter-relationships using informationsuch as the result set and the schema information. In the case of non-SQL data –such as structured statistical tablesavailable on the Web– we used the caption as the input text describing the data in the same manner as a query. Weextract the variables and their dependencies from the caption using standard NLP techniques and combine it with thedata in the table to recommend the appropriate chart.
Overall, the primary contributions of this paper are as follows:
1. We present DataVizard, a system to automatically recommend best visualisations for a structured dataset by takinginto consideration the variables of interest and their interdependencies in both SQL as well as non-SQL settings.
2. We present the results of our experiments with a couple of SQL workloads over large relational datasets as well asmore than 550 non-SQL structured statistical tables crawled from the Web.
3. We present the results of a user-survey that we conducted to understand the expectations on the appropriateness ofthe chart for different queries.
The rest of the paper is structured as follows. In section 2 we discuss related work. In sections 3 and 4 we describeour technique for finding the variables of interest and recommending the best chart, for SQL data and non-SQL tabularor structured data respectively. In section 5 we describe the overview of our system, and present the system architecturewe used for building the recommender. In section 6, we discuss our experiments and results obtained for our chart rec-ommendation system and also discuss the results of a user survey on chart preferences. We conclude in section 7 with thefuture directions and open lines of work.
2 Background and related work
Many different streams of work have been actively pursued in the area of data visualization, in different contexts and withdifferent requirements. In this section we discuss some of the representative works.
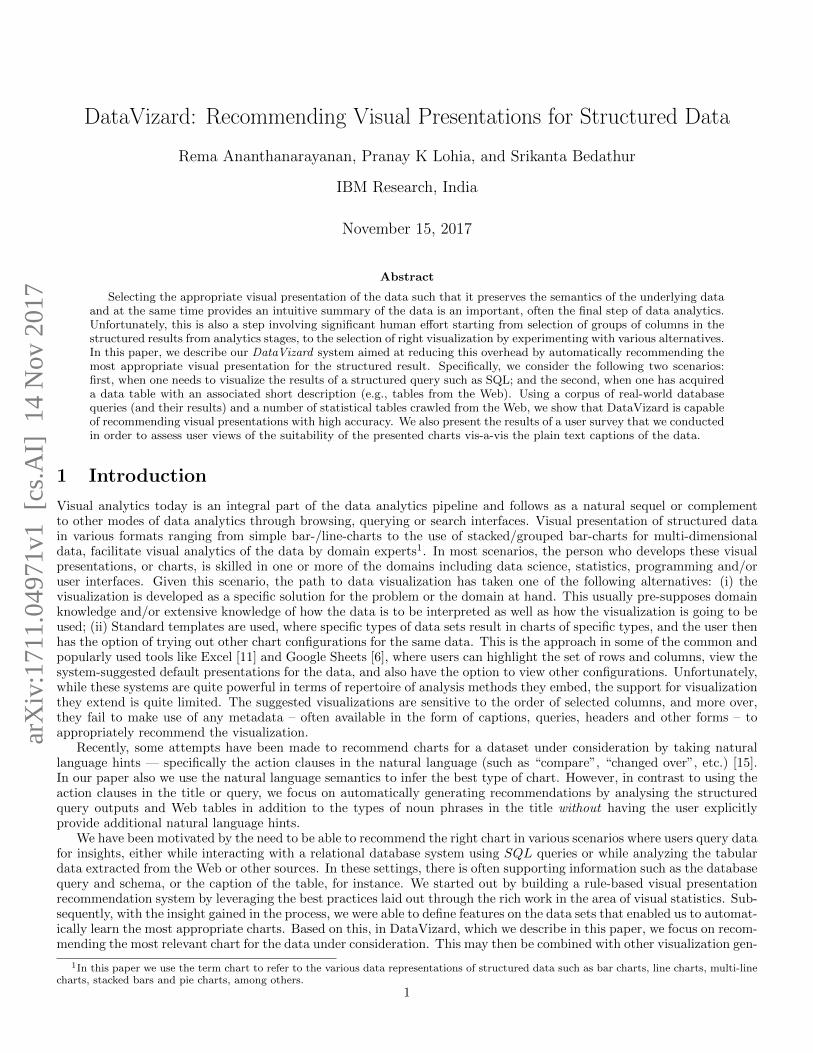
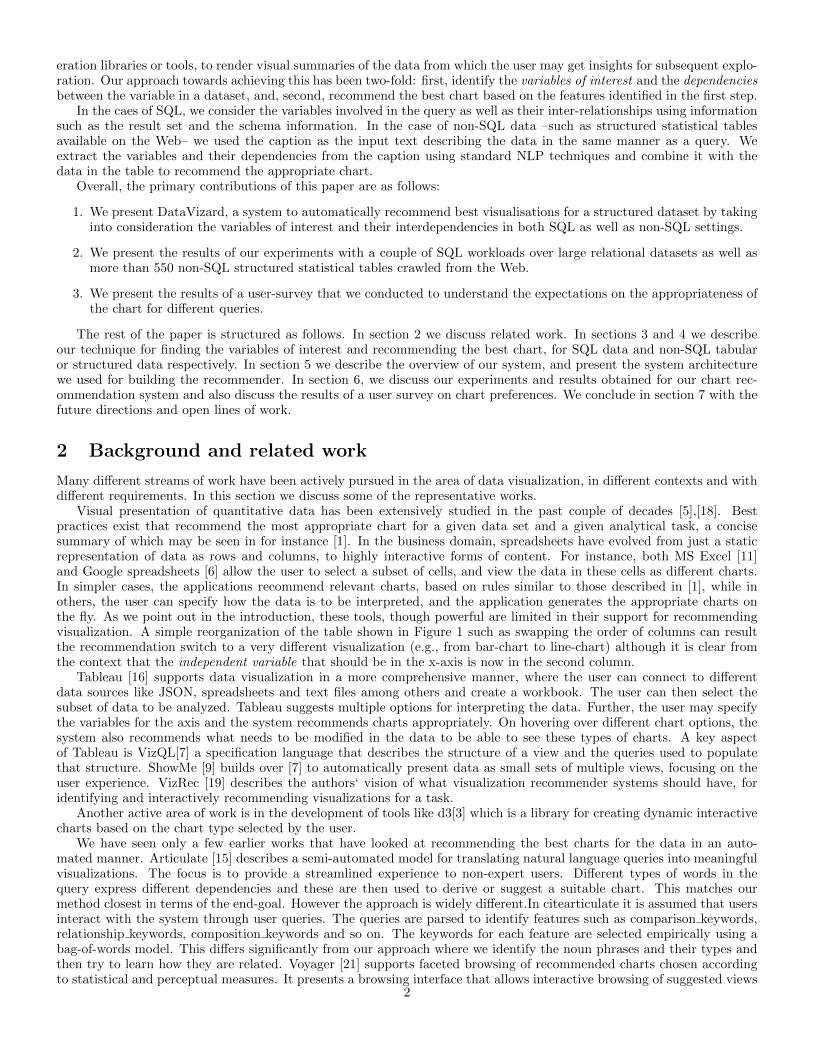
Visual presentation of quantitative data has been extensively studied in the past couple of decades [5],[18]. Bestpractices exist that recommend the most appropriate chart for a given data set and a given analytical task, a concisesummary of which may be seen in for instance [1]. In the business domain, spreadsheets have evolved from just a staticrepresentation of data as rows and columns, to highly interactive forms of content. For instance, both MS Excel [11]and Google spreadsheets [6] allow the user to select a subset of cells, and view the data in these cells as different charts.In simpler cases, the applications recommend relevant charts, based on rules similar to those described in [1], while inothers, the user can specify how the data is to be interpreted, and the application generates the appropriate charts onthe fly. As we point out in the introduction, these tools, though powerful are limited in their support for recommendingvisualization. A simple reorganization of the table shown in Figure 1 such as swapping the order of columns can resultthe recommendation switch to a very different visualization (e.g., from bar-chart to line-chart) although it is clear fromthe context that the independent variable that should be in the x-axis is now in the second column.
Tableau [16] supports data visualization in a more comprehensive manner, where the user can connect to differentdata sources like JSON, spreadsheets and text files among others and create a workbook. The user can then select thesubset of data to be analyzed. Tableau suggests multiple options for interpreting the data. Further, the user may specifythe variables for the axis and the system recommends charts appropriately. On hovering over different chart options, thesystem also recommends what needs to be modified in the data to be able to see these types of charts. A key aspectof Tableau is VizQL[7] a specification language that describes the structure of a view and the queries used to populatethat structure. ShowMe [9] builds over [7] to automatically present data as small sets of multiple views, focusing on theuser experience. VizRec [19] describes the authors‘ vision of what visualization recommender systems should have, foridentifying and interactively recommending visualizations for a task.
Another active area of work is in the development of tools like d3[3] which is a library for creating dynamic interactivecharts based on the chart type selected by the user.
We have seen only a few earlier works that have looked at recommending the best charts for the data in an auto-mated manner. Articulate [15] describes a semi-automated model for translating natural language queries into meaningfulvisualizations. The focus is to provide a streamlined experience to non-expert users. Different types of words in thequery express different dependencies and these are then used to derive or suggest a suitable chart. This matches ourmethod closest in terms of the end-goal. However the approach is widely different.In citearticulate it is assumed that usersinteract with the system through user queries. The queries are parsed to identify features such as comparison keywords,relationship keywords, composition keywords and so on. The keywords for each feature are selected empirically using abag-of-words model. This differs significantly from our approach where we identify the noun phrases and their types andthen try to learn how they are related. Voyager [21] supports faceted browsing of recommended charts chosen accordingto statistical and perceptual measures. It presents a browsing interface that allows interactive browsing of suggested views
2
(a) Initial Order
(b) Flipped Columns
Figure 1: Issues in Visualization Recommendations for a Portion of the Table Public Debt of the United States from 1990to 2016 (in billions USD) from MS-Excel
and aims to balance automation and manual specification. In [8] the authors describe a semi-automated visualizationrecommendation system where information is extracted from the data and the metadata, the latter providing the context.Domain-specific annotations are used on the information, to recommend the visualizations and the system assumes theavailability of a knowledgebase of visualizations used in the domain.
SeeDB[20] uses the user query to analyse the space of visualizations and recommends visualizations that appear promis-ing in terms of “usefulness” or “interestingness.” This is especially useful in high dimensional data, where performanceconsiderations would also be imperative.
In our work, we specifically focus on automatically recommending the most suitable charts for the given data, basedon existing best practices such as those summarised in [1], using both the data and the metadata, which may inclusecontext information like data captions. No domain knowledge or end-user expertise is assumed and it appears to be oneof the first end-to-end fully automated systems for chart recommendations. We describe our analysis, observations andexperiments in the following sections.
3 Analysis of SQL resultsets
The high-level steps in the analysis of both SQL queries and resultsets and non-SQL data comprises 2 steps a) determin-ing the variables of interest and b) determining their dependency, in terms of the independent variable(s) and dependentvariable(s). In this section we discuss in detail the steps for analysing SQL data and recommending visualizations.
3
3.1 Determining the variables of interest
The variables that are related need to be identified from the resultset. In the most general case, when no information isavailable except for a list of column names queried, we perform a pairwise identification of columns that may be related.Additional cues in the query such as GROUP BY clauses, presence of aggregate functions such as MAX, MIN and othershelp in identifying the exact relationship between the columns queried. Subsequently, where relevant, some pairs thathave common variables may be combined into a single visualization. Further, we categorize each column of data or eachvariable as either an independent variable, or a dependent variable. Independent variables are those variables that are inmany cases categorical in nature. For instance, in a SQL query that selects employee department and average income,average bonus for each department, the independent variable is the employee department, while the dependent variablesare the average income and the average bonus. In the most general case, a relationship between average income andaverage bonus is not ruled out; however in this specific case, based on the query, we would identify 2 relationships ofinterest, viz., <employee department, average income>, and<employee department, average bonus>. In the recommendation stage these may be combined in 1 chart, but at the levelof finding variables, these are identified as 2 relationships. Apart from categorical values, values representing time-periodsare in many cases independent variables, for instance, values of some quantities every year or every month.
In the case of SQL queries, a column that is a primary key, or a column that is the predicate of a GROUP BY is an in-dependent variable. Some queries may have multiple GROUP BY fields, in which case there are multiple independent vari-ables, with the possibility of creating a grouped chart. Similarly, a column whose value is aggregated in a query, is generallya dependent variable. By aggregation, here we mean SQL aggregation functions such as MAX, MIN , AV G and similar.In the very general case, when no primary key information is available, or when the query has no GROUP BY clause, we willuse the methods described in section 4 to understand the relationship between the terms in the query. In the case of SQL,the number of variables selected is read off the query result. Additional information of the data types of each of the columnscan be obtained by querying the schema, while the number of GROUP BY clauses can be obtained by using a SQL parser.
Based on these heuristics, at the end of this analysis, we can tag each column as an independent or dependent variable.For any columns where this is not possible, we fall back on the more general analysis that we descibe in section 4.
3.2 Recommending the appropriate chart, for SQL resultsets
As we mentioned earlier, many best practices exist that suggest which charts are the most appropriate for each data set interms of what people would like to do with the data — compare values, analyze trends, see the distributions or compositions.
In the case of SQL queries, we can capture this intent by analyzing the kinds of variables selected. Further, theactual relationships between the variables, in terms of how we would like to present the data, is determined by the typeof the dependent and independent variables. These 2 items of information suffice to suggest one or more of the relevantvisualizations, as depicted in a summary sheet like [1]. For instance, when the independent variable is of string type, as in“GROUP BY REGION” or “GROUP BY DEPARTMENT” and the dependent variable is a numerical quantity, then weinterpret this as a comparison of a numeric quantity across multiple categories, and hence our system would recommenda bar chart. When there is more than one GROUP BY clause, for instance, GROUP BY DEPARTMENT, REGIONthen our system would recommend a grouped bar chart. When the GROUP BY is related to a time-period variable, asin GROUP BY YEAR or GROUP BY MONTH, then the typical expectation is the trend of a quantity over time, andhence a line chart is shown. Similarly, when there are multiple GROUP BY clauses relating to time-periods, the systemwould recommend a multi-line chart.
3.3 Feature identification for SQL queries
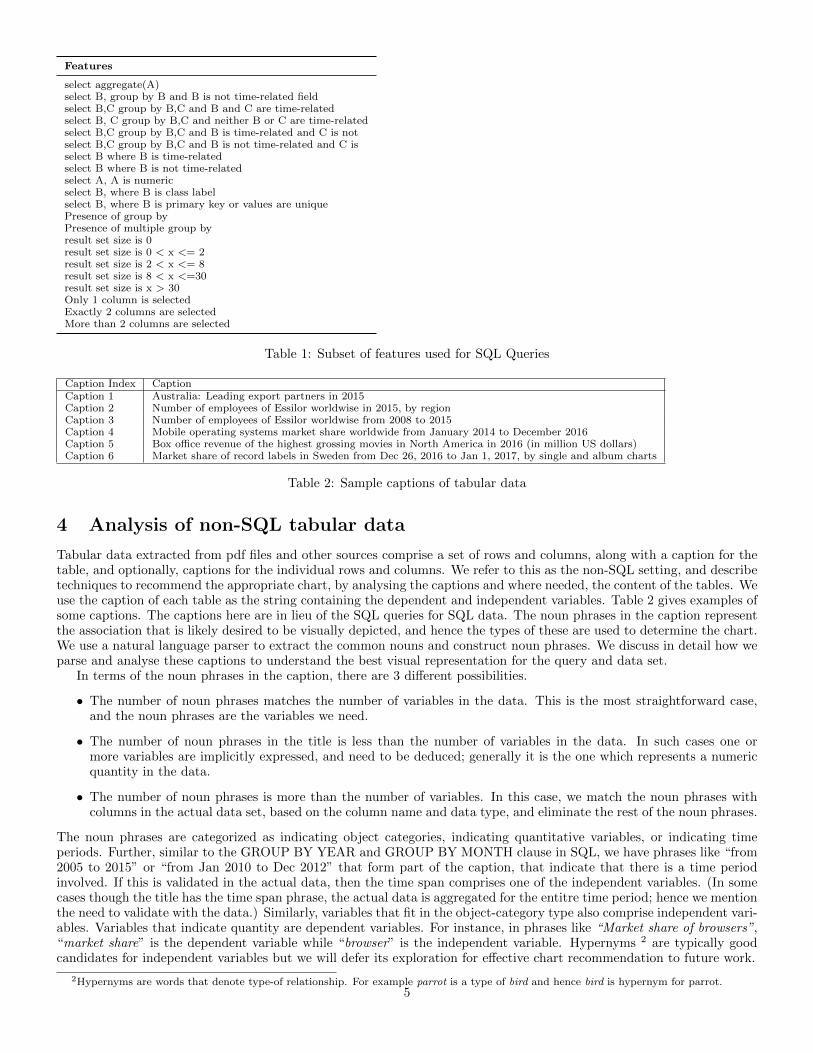
Sections 3.1 and 3.2 describe the heuristics we used to determine the most relevant chart for the result sets from a SQLquery. Based on our learning from the performance of these heuristics (we describe the performance in detail in Section 6 )we identified various features from the SQL queries and the result sets which we then used to train a chart recommendationsystem, for the SQL queries. We designed a total of 21 features which are listed in Table 1.
The features in Table 1 are defined in terms of the patterns and presence of various clauses in a SQL query.A,B,C, . . . represent column names. The term ‘select’ indicates the query has the SELECT keyword, The feature ‘presenceof group by’ implies the query has a GROUP BY clause, while ‘presence of multiple group by’ implies a GROUP BYon more than one column. Further, the size of the result set also has a bearing on the chart recommended and this isreflected in the features based on the size of the result set. Further, while the features are defined in terms of 2 or at most3 columns selected, in the more general case, we can take a pairwise grouping of columns and find the relationship, orwhen there are many columns in GROUP BY, we can analyse these multiple columns together. We describe some resultson the TPC-H queries, later. The performance of the recommender, based on the training with these features, is describedin section 6. In the next section we describe in detail the analysis of data to recommend charts in the non-SQL setting.
4
Features
select aggregate(A)select B, group by B and B is not time-related fieldselect B,C group by B,C and B and C are time-relatedselect B, C group by B,C and neither B or C are time-relatedselect B,C group by B,C and B is time-related and C is notselect B,C group by B,C and B is not time-related and C isselect B where B is time-relatedselect B where B is not time-relatedselect A, A is numericselect B, where B is class labelselect B, where B is primary key or values are uniquePresence of group byPresence of multiple group byresult set size is 0result set size is 0 < x <= 2result set size is 2 < x <= 8result set size is 8 < x <=30result set size is x > 30Only 1 column is selectedExactly 2 columns are selectedMore than 2 columns are selected
Table 1: Subset of features used for SQL Queries
Caption Index CaptionCaption 1 Australia: Leading export partners in 2015Caption 2 Number of employees of Essilor worldwise in 2015, by regionCaption 3 Number of employees of Essilor worldwise from 2008 to 2015Caption 4 Mobile operating systems market share worldwide from January 2014 to December 2016Caption 5 Box office revenue of the highest grossing movies in North America in 2016 (in million US dollars)Caption 6 Market share of record labels in Sweden from Dec 26, 2016 to Jan 1, 2017, by single and album charts
Table 2: Sample captions of tabular data
4 Analysis of non-SQL tabular data
Tabular data extracted from pdf files and other sources comprise a set of rows and columns, along with a caption for thetable, and optionally, captions for the individual rows and columns. We refer to this as the non-SQL setting, and describetechniques to recommend the appropriate chart, by analysing the captions and where needed, the content of the tables. Weuse the caption of each table as the string containing the dependent and independent variables. Table 2 gives examples ofsome captions. The captions here are in lieu of the SQL queries for SQL data. The noun phrases in the caption representthe association that is likely desired to be visually depicted, and hence the types of these are used to determine the chart.We use a natural language parser to extract the common nouns and construct noun phrases. We discuss in detail how weparse and analyse these captions to understand the best visual representation for the query and data set.
In terms of the noun phrases in the caption, there are 3 different possibilities.
• The number of noun phrases matches the number of variables in the data. This is the most straightforward case,and the noun phrases are the variables we need.
• The number of noun phrases in the title is less than the number of variables in the data. In such cases one ormore variables are implicitly expressed, and need to be deduced; generally it is the one which represents a numericquantity in the data.
• The number of noun phrases is more than the number of variables. In this case, we match the noun phrases withcolumns in the actual data set, based on the column name and data type, and eliminate the rest of the noun phrases.
The noun phrases are categorized as indicating object categories, indicating quantitative variables, or indicating timeperiods. Further, similar to the GROUP BY YEAR and GROUP BY MONTH clause in SQL, we have phrases like “from2005 to 2015” or “from Jan 2010 to Dec 2012” that form part of the caption, that indicate that there is a time periodinvolved. If this is validated in the actual data, then the time span comprises one of the independent variables. (In somecases though the title has the time span phrase, the actual data is aggregated for the entitre time period; hence we mentionthe need to validate with the data.) Similarly, variables that fit in the object-category type also comprise independent vari-ables. Variables that indicate quantity are dependent variables. For instance, in phrases like “Market share of browsers”,“market share” is the dependent variable while “browser” is the independent variable. Hypernyms 2 are typically goodcandidates for independent variables but we will defer its exploration for effective chart recommendation to future work.
2Hypernyms are words that denote type-of relationship. For example parrot is a type of bird and hence bird is hypernym for parrot.5
4.1 Determining the variables of interest
In the case of non-SQL tabular data, the captions of tables or data sets take the place of natural language equivalents ofqueries for our purposes. The parsing and extraction of the various variables is as under.
Identifying noun phrases in captions We used the Stanford Natural Language Parser [10] (Stanford NLP) foridentifying common nouns, since these are the variables of interest for us in the caption. The words tagged ‘NN’ and‘NNS’ by Stanford NLP were taken as the common nouns of that title. We needed to identify noun phrases also, which,in the context of our work here, we define as the longest sequence of common nouns occurring together. This definitionvaries from the ‘NP’ tag of the Stanford parser, but this is the definition we needed for our current work. The last nounin the noun phrase was treated as the operative noun or the noun that we tried to qualify as quantitative or categorical.
Identifying nouns with quantitative data We identified common nouns representing quantitative information asfollows. A word2vec model with a pretrained Google news corpus (3 billion running words) word vector model (3 million300-dimension English word vectors) was used. We used the gensim word2vec model [12] for our experiment. We defined aset of words which are synonyms of quantifiability - for instance, words such as value, measure, number, numeric, quantity,total, amount and percent. Using this set, we used the word2vec model to find, for each common noun in the title, itssimilarity score to one of these words in the set. Of all the common nouns in the title, we used the word which has highestscore as the word representing a quantity, in that caption.
Dealing with temporal context terms In some captions, besides the 2 or 3 variables in the data set, the captionhad additional information such as point-in-time phrases. For example, in the caption “US infant mortality by state in2016”, the term “in 2016” qualifies the variables but is not needed for identifying the variables. Hence such terms werepruned from each caption before performing the actual variable identification. The extraction of these phrases was doneusing a bag-of-words to represent such terms, such as months of the year, year patterns and days of the week.
Identifying caption subject The subject or topic of each caption was again identified using the Stanford NLP parseras follows. The parse tree for each caption was obtained, with the corresponding parent-child relationship highlightingthe dependencies. The tree was traversed in order, to identify the first noun as the subject. In most cases the subject washighly likely to be one of the variables of interest.
Presence of time-span Each title was classified into 2 classes, based on whether it contained time-span informationor not. For finding time-span information, presence of patterns like “from X to Y ” where X and Y represent point-in-timeterms described above, and minor variations of this pattern were used. If the timespan information was also part of thedata, then it was considered an independent variable. As a counter-example, in the caption “Movies in the US by genre,from 1995 to 2010”, the genre is identified as a categorical independent variable, while the time range is identified asanother independent time-related variable. However the data consisted of only 2 columns of information, the movie genre,and the number of movies in each genre; the content did not match any of the time-related information. Hence thisvariable was eliminated. and the caption was interpreted to represent only 2 variables.
In the case of SQL, the GROUP BY clauses or the primary keys were the independent variables. In the case of thetable captions, most captions have one or more noun phrases that describe the data set presented. Further, some nounphrases are preceded by by as in “by genre” or “by region”. These patterns, and others such as “by year”, “by region”,“by brand” and so on, indicate that the data is to be grouped along these categories, similar to the GROUP BY columnin SQL. We describe how these heuristics are applied in the examples in 5.
4.2 Feature identification from caption strings
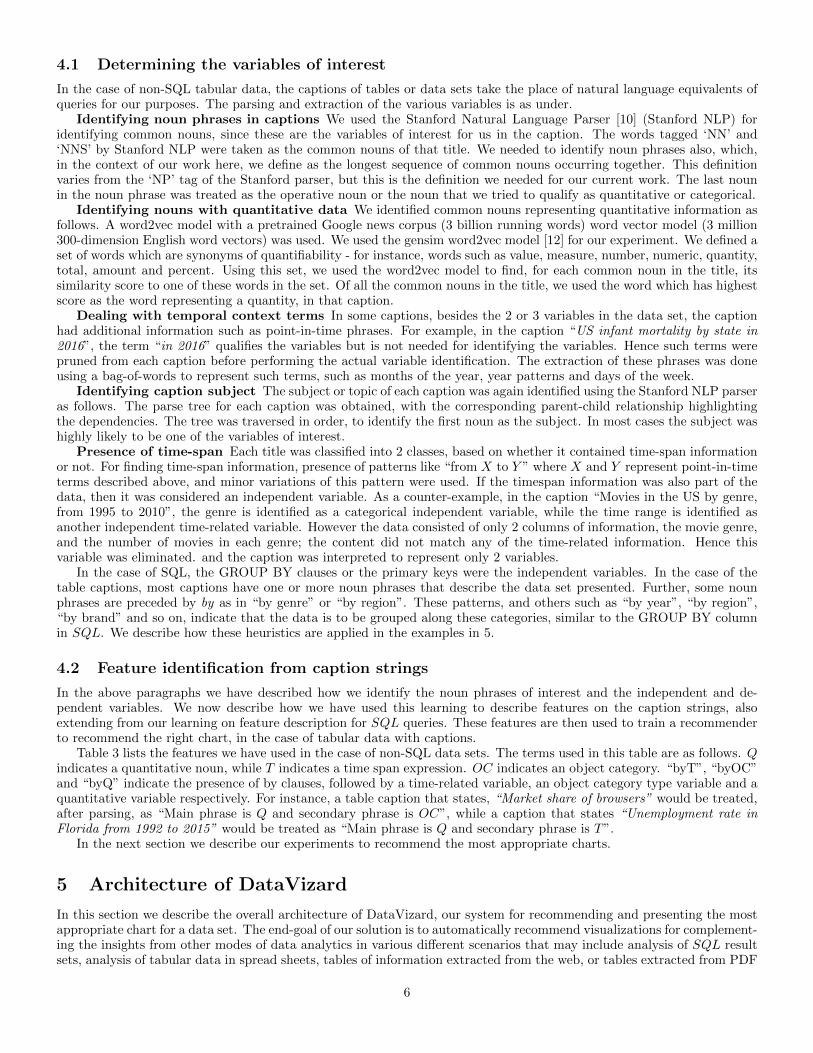
In the above paragraphs we have described how we identify the noun phrases of interest and the independent and de-pendent variables. We now describe how we have used this learning to describe features on the caption strings, alsoextending from our learning on feature description for SQL queries. These features are then used to train a recommenderto recommend the right chart, in the case of tabular data with captions.
Table 3 lists the features we have used in the case of non-SQL data sets. The terms used in this table are as follows. Qindicates a quantitative noun, while T indicates a time span expression. OC indicates an object category. “byT”, “byOC”and “byQ” indicate the presence of by clauses, followed by a time-related variable, an object category type variable and aquantitative variable respectively. For instance, a table caption that states, “Market share of browsers” would be treated,after parsing, as “Main phrase is Q and secondary phrase is OC”, while a caption that states “Unemployment rate inFlorida from 1992 to 2015” would be treated as “Main phrase is Q and secondary phrase is T”.
In the next section we describe our experiments to recommend the most appropriate charts.
5 Architecture of DataVizard
In this section we describe the overall architecture of DataVizard, our system for recommending and presenting the mostappropriate chart for a data set. The end-goal of our solution is to automatically recommend visualizations for complement-ing the insights from other modes of data analytics in various different scenarios that may include analysis of SQL resultsets, analysis of tabular data in spread sheets, tables of information extracted from the web, or tables extracted from PDF
6
Features
Main phrase is Q, secondary phrase is TMain phrase is Q, secondary phrase is OCMain phrase is T, secondary phrase is QMain phrase is OC, secondary is QMain phrase is Q, prepositional phrase is byTMain phrase is Q, prepositional phrase is byOCMain phrase is T, prepositional phrase is byQMain phrase is OC, preprositional phrase is byQMain phrase is Q, has timespan phraseMain phrase is Q, has OC1 and OC2Main phrase is OC, has Q1 and Q2Main phrase is Q, has OC and TMain phrase is Q, has T1 and T2Main phrase is OC, has term ’distribution’Only 1 data pointOnly 2 data points2 < nbr of data points <= 88 < nbr of data points <=3030 < nbr of data points
Table 3: Subset of features used for the captions
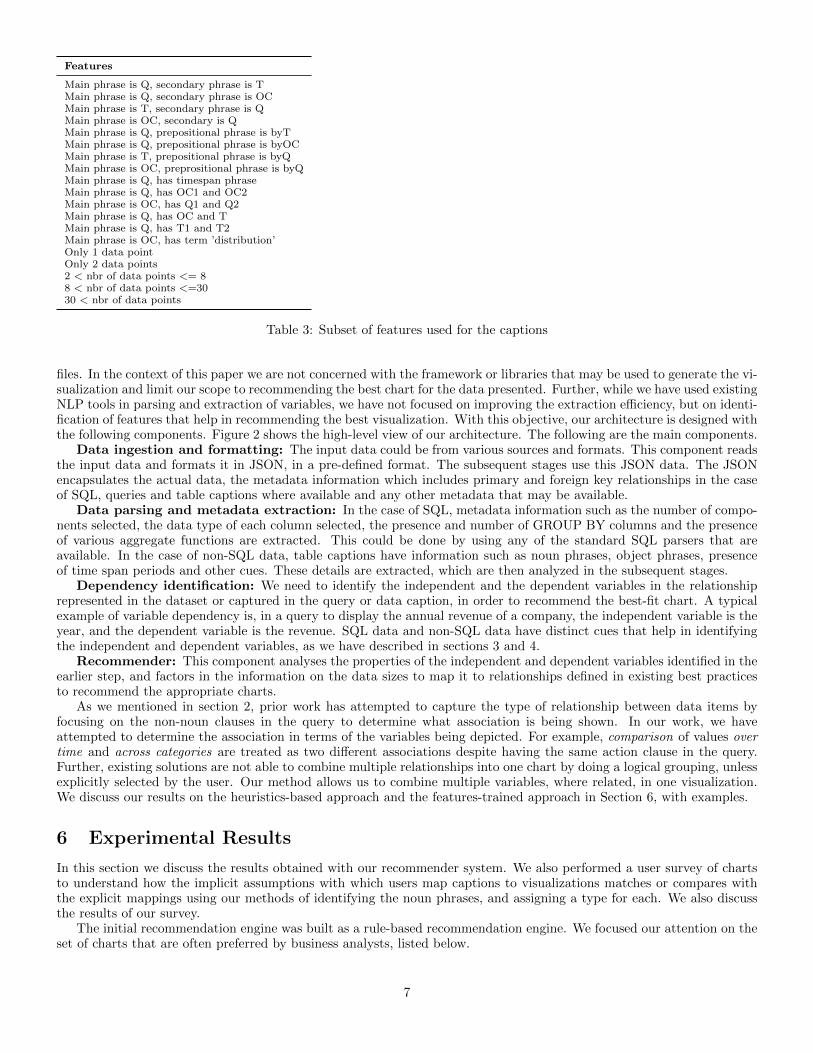
files. In the context of this paper we are not concerned with the framework or libraries that may be used to generate the vi-sualization and limit our scope to recommending the best chart for the data presented. Further, while we have used existingNLP tools in parsing and extraction of variables, we have not focused on improving the extraction efficiency, but on identi-fication of features that help in recommending the best visualization. With this objective, our architecture is designed withthe following components. Figure 2 shows the high-level view of our architecture. The following are the main components.
Data ingestion and formatting: The input data could be from various sources and formats. This component readsthe input data and formats it in JSON, in a pre-defined format. The subsequent stages use this JSON data. The JSONencapsulates the actual data, the metadata information which includes primary and foreign key relationships in the caseof SQL, queries and table captions where available and any other metadata that may be available.
Data parsing and metadata extraction: In the case of SQL, metadata information such as the number of compo-nents selected, the data type of each column selected, the presence and number of GROUP BY columns and the presenceof various aggregate functions are extracted. This could be done by using any of the standard SQL parsers that areavailable. In the case of non-SQL data, table captions have information such as noun phrases, object phrases, presenceof time span periods and other cues. These details are extracted, which are then analyzed in the subsequent stages.
Dependency identification: We need to identify the independent and the dependent variables in the relationshiprepresented in the dataset or captured in the query or data caption, in order to recommend the best-fit chart. A typicalexample of variable dependency is, in a query to display the annual revenue of a company, the independent variable is theyear, and the dependent variable is the revenue. SQL data and non-SQL data have distinct cues that help in identifyingthe independent and dependent variables, as we have described in sections 3 and 4.
Recommender: This component analyses the properties of the independent and dependent variables identified in theearlier step, and factors in the information on the data sizes to map it to relationships defined in existing best practicesto recommend the appropriate charts.
As we mentioned in section 2, prior work has attempted to capture the type of relationship between data items byfocusing on the non-noun clauses in the query to determine what association is being shown. In our work, we haveattempted to determine the association in terms of the variables being depicted. For example, comparison of values overtime and across categories are treated as two different associations despite having the same action clause in the query.Further, existing solutions are not able to combine multiple relationships into one chart by doing a logical grouping, unlessexplicitly selected by the user. Our method allows us to combine multiple variables, where related, in one visualization.We discuss our results on the heuristics-based approach and the features-trained approach in Section 6, with examples.
6 Experimental Results
In this section we discuss the results obtained with our recommender system. We also performed a user survey of chartsto understand how the implicit assumptions with which users map captions to visualizations matches or compares withthe explicit mappings using our methods of identifying the noun phrases, and assigning a type for each. We also discussthe results of our survey.
The initial recommendation engine was built as a rule-based recommendation engine. We focused our attention on theset of charts that are often preferred by business analysts, listed below.
7
Data Ingestion
Data Formatting
Data/Query Parsing and Metadata Extraction
Dependency Identification
Chart Recommender
Presentation Engine
SQL Query + Results OR
Web / PDF tables
Figure 2: Components in the DataVizard System
• Line
• Horizontal bar
• Vertical bar
• Pie
• Multi-line
• Grouped bar
• Stacked bar
• Scatter
• Table
The initial set of charts for a small set of SQL data sets and the non-SQL data sets were determined based on a setof rules relating the independent variable and the dependent variable. As expected, the accuracy was very high. Also thishelped to engineer features for automatically learning the most appropriate chart.
6.1 Results over SQL Queries and Tables
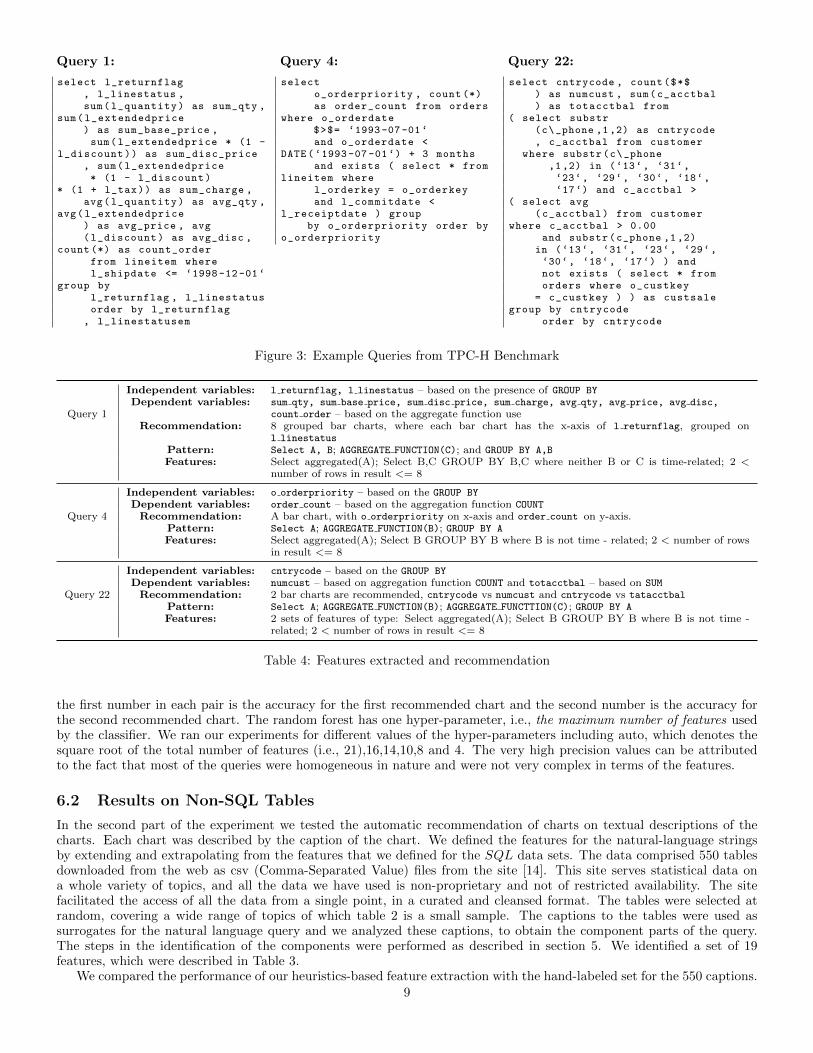
We tested our initial heuristics-based recommender on the queries in the TPC-H benchmark data set[17] and subsequentlyextended this to learn features for the SQL queries. From each SQL query, we used the subset of components that weneeded to recommend the chart. Some of these components were from the query string itself, and some from the metadata.In Figure 3 we list 3 queries from the TPC-H set and we then describe in detail how we perform the actual analysis. Thereason we used the TPC-H query set was, this is a standard set which also contains the patterns that captured the featureswe have used in our system.
Table 4 lists the variables identified by our heuristics and the charts recommended, the query patterns that determinethe features and the actual features used for learning, in the subsequent step of automated chart recommendation. Notethat the actual SQL query may be quite long, querying and joining across multiple tables, but the information we needfor the chart determination is mainly a subset of the patterns and the result set size. In Table 4 the line labeled “Pattern”indicates the information used for each SQL query. Through this we identified a total of 21 features, which were listed inTable 1.
We then tested our recommender on a dataset of 68 SQL queries over a financial services knowledge base obtainedfrom the authors of the paper [13]. We transformed these queries into the same feature representation over 21 featuresobtained from the TPC-H queries earlier. Note that these features are labeled in binary where 1 (0) represents the presence(absence) of a feature. The class labels –i.e., the best recommended chart as well as the second-best recommended chartwere manually applied using the rules derived from various best practices models [1].
We trained our recommendation model using the random forest classifier [4] and performed cross-validation with varyingk-fold (10, 5 and 3) as indicated in column 1 of table 6. The table shows the accuracy for the recommended charts, where
8
Query 1:
select l_returnflag, l_linestatus ,sum(l_quantity) as sum_qty ,
sum(l_extendedprice) as sum_base_price ,sum(l_extendedprice * (1 -
l_discount)) as sum_disc_price, sum(l_extendedprice* (1 - l_discount)
* (1 + l_tax)) as sum_charge ,avg(l_quantity) as avg_qty ,
avg(l_extendedprice) as avg_price , avg(l_discount) as avg_disc ,
count (*) as count_orderfrom lineitem wherel_shipdate <= ‘1998-12-01‘
group byl_returnflag , l_linestatusorder by l_returnflag
, l_linestatusem
Query 4:
selecto_orderpriority , count (*)as order_count from orders
where o_orderdate$>$= ‘1993-07-01‘and o_orderdate <
DATE (‘1993-07-01‘) + 3 monthsand exists ( select * from
lineitem wherel_orderkey = o_orderkeyand l_commitdate <
l_receiptdate ) groupby o_orderpriority order by
o_orderpriority
Query 22:
select cntrycode , count($*$) as numcust , sum(c_acctbal) as totacctbal from
( select substr(c\_phone ,1,2) as cntrycode, c_acctbal from customer
where substr(c\_phone,1,2) in (‘13‘, ‘31‘,‘23‘, ‘29‘, ‘30‘, ‘18‘,‘17‘) and c_acctbal >
( select avg(c_acctbal) from customer
where c_acctbal > 0.00and substr(c_phone ,1,2)
in (‘13‘, ‘31‘, ‘23‘, ‘29‘,‘30‘, ‘18‘, ‘17‘) ) andnot exists ( select * fromorders where o_custkey
= c_custkey ) ) as custsalegroup by cntrycode
order by cntrycode
Figure 3: Example Queries from TPC-H Benchmark
Query 1
Independent variables: l returnflag, l linestatus – based on the presence of GROUP BYDependent variables: sum qty, sum base price, sum disc price, sum charge, avg qty, avg price, avg disc,
count order – based on the aggregate function useRecommendation: 8 grouped bar charts, where each bar chart has the x-axis of l returnflag, grouped on
l linestatusPattern: Select A, B; AGGREGATE FUNCTION(C); and GROUP BY A,BFeatures: Select aggregated(A); Select B,C GROUP BY B,C where neither B or C is time-related; 2 <
number of rows in result <= 8
Query 4
Independent variables: o orderpriority – based on the GROUP BYDependent variables: order count – based on the aggregation function COUNTRecommendation: A bar chart, with o orderpriority on x-axis and order count on y-axis.
Pattern: Select A; AGGREGATE FUNCTION(B); GROUP BY AFeatures: Select aggregated(A); Select B GROUP BY B where B is not time - related; 2 < number of rows
in result <= 8
Query 22
Independent variables: cntrycode – based on the GROUP BYDependent variables: numcust – based on aggregation function COUNT and totacctbal – based on SUMRecommendation: 2 bar charts are recommended, cntrycode vs numcust and cntrycode vs tatacctbal
Pattern: Select A; AGGREGATE FUNCTION(B); AGGREGATE FUNCTTION(C); GROUP BY AFeatures: 2 sets of features of type: Select aggregated(A); Select B GROUP BY B where B is not time -
related; 2 < number of rows in result <= 8
Table 4: Features extracted and recommendation
the first number in each pair is the accuracy for the first recommended chart and the second number is the accuracy forthe second recommended chart. The random forest has one hyper-parameter, i.e., the maximum number of features usedby the classifier. We ran our experiments for different values of the hyper-parameters including auto, which denotes thesquare root of the total number of features (i.e., 21),16,14,10,8 and 4. The very high precision values can be attributedto the fact that most of the queries were homogeneous in nature and were not very complex in terms of the features.
6.2 Results on Non-SQL Tables
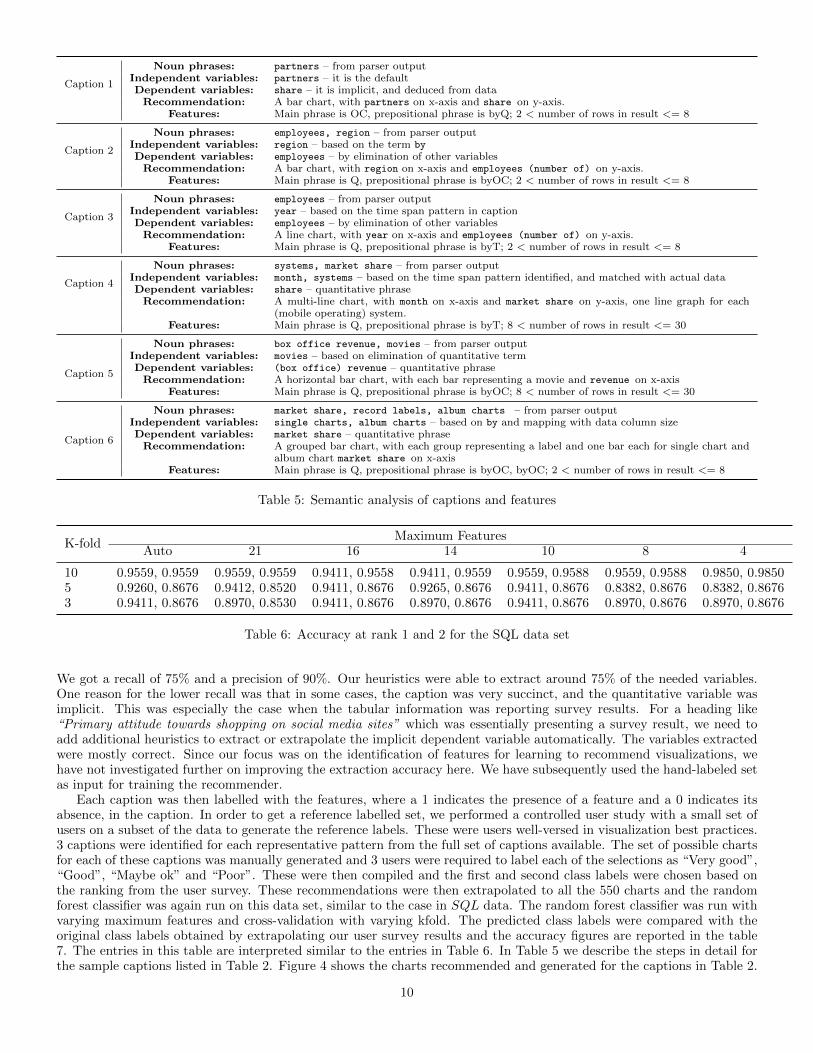
In the second part of the experiment we tested the automatic recommendation of charts on textual descriptions of thecharts. Each chart was described by the caption of the chart. We defined the features for the natural-language stringsby extending and extrapolating from the features that we defined for the SQL data sets. The data comprised 550 tablesdownloaded from the web as csv (Comma-Separated Value) files from the site [14]. This site serves statistical data ona whole variety of topics, and all the data we have used is non-proprietary and not of restricted availability. The sitefacilitated the access of all the data from a single point, in a curated and cleansed format. The tables were selected atrandom, covering a wide range of topics of which table 2 is a small sample. The captions to the tables were used assurrogates for the natural language query and we analyzed these captions, to obtain the component parts of the query.The steps in the identification of the components were performed as described in section 5. We identified a set of 19features, which were described in Table 3.
We compared the performance of our heuristics-based feature extraction with the hand-labeled set for the 550 captions.9
Caption 1
Noun phrases: partners – from parser outputIndependent variables: partners – it is the defaultDependent variables: share – it is implicit, and deduced from dataRecommendation: A bar chart, with partners on x-axis and share on y-axis.
Features: Main phrase is OC, prepositional phrase is byQ; 2 < number of rows in result <= 8
Caption 2
Noun phrases: employees, region – from parser outputIndependent variables: region – based on the term byDependent variables: employees – by elimination of other variablesRecommendation: A bar chart, with region on x-axis and employees (number of) on y-axis.
Features: Main phrase is Q, prepositional phrase is byOC; 2 < number of rows in result <= 8
Caption 3
Noun phrases: employees – from parser outputIndependent variables: year – based on the time span pattern in captionDependent variables: employees – by elimination of other variablesRecommendation: A line chart, with year on x-axis and employees (number of) on y-axis.
Features: Main phrase is Q, prepositional phrase is byT; 2 < number of rows in result <= 8
Caption 4
Noun phrases: systems, market share – from parser outputIndependent variables: month, systems – based on the time span pattern identified, and matched with actual dataDependent variables: share – quantitative phraseRecommendation: A multi-line chart, with month on x-axis and market share on y-axis, one line graph for each
(mobile operating) system.Features: Main phrase is Q, prepositional phrase is byT; 8 < number of rows in result <= 30
Caption 5
Noun phrases: box office revenue, movies – from parser outputIndependent variables: movies – based on elimination of quantitative termDependent variables: (box office) revenue – quantitative phraseRecommendation: A horizontal bar chart, with each bar representing a movie and revenue on x-axis
Features: Main phrase is Q, prepositional phrase is byOC; 8 < number of rows in result <= 30
Caption 6
Noun phrases: market share, record labels, album charts – from parser outputIndependent variables: single charts, album charts – based on by and mapping with data column sizeDependent variables: market share – quantitative phraseRecommendation: A grouped bar chart, with each group representing a label and one bar each for single chart and
album chart market share on x-axisFeatures: Main phrase is Q, prepositional phrase is byOC, byOC; 2 < number of rows in result <= 8
Table 5: Semantic analysis of captions and features
K-foldMaximum Features
Auto 21 16 14 10 8 4
10 0.9559, 0.9559 0.9559, 0.9559 0.9411, 0.9558 0.9411, 0.9559 0.9559, 0.9588 0.9559, 0.9588 0.9850, 0.98505 0.9260, 0.8676 0.9412, 0.8520 0.9411, 0.8676 0.9265, 0.8676 0.9411, 0.8676 0.8382, 0.8676 0.8382, 0.86763 0.9411, 0.8676 0.8970, 0.8530 0.9411, 0.8676 0.8970, 0.8676 0.9411, 0.8676 0.8970, 0.8676 0.8970, 0.8676
Table 6: Accuracy at rank 1 and 2 for the SQL data set
We got a recall of 75% and a precision of 90%. Our heuristics were able to extract around 75% of the needed variables.One reason for the lower recall was that in some cases, the caption was very succinct, and the quantitative variable wasimplicit. This was especially the case when the tabular information was reporting survey results. For a heading like“Primary attitude towards shopping on social media sites” which was essentially presenting a survey result, we need toadd additional heuristics to extract or extrapolate the implicit dependent variable automatically. The variables extractedwere mostly correct. Since our focus was on the identification of features for learning to recommend visualizations, wehave not investigated further on improving the extraction accuracy here. We have subsequently used the hand-labeled setas input for training the recommender.
Each caption was then labelled with the features, where a 1 indicates the presence of a feature and a 0 indicates itsabsence, in the caption. In order to get a reference labelled set, we performed a controlled user study with a small set ofusers on a subset of the data to generate the reference labels. These were users well-versed in visualization best practices.3 captions were identified for each representative pattern from the full set of captions available. The set of possible chartsfor each of these captions was manually generated and 3 users were required to label each of the selections as “Very good”,“Good”, “Maybe ok” and “Poor”. These were then compiled and the first and second class labels were chosen based onthe ranking from the user survey. These recommendations were then extrapolated to all the 550 charts and the randomforest classifier was again run on this data set, similar to the case in SQL data. The random forest classifier was run withvarying maximum features and cross-validation with varying kfold. The predicted class labels were compared with theoriginal class labels obtained by extrapolating our user survey results and the accuracy figures are reported in the table7. The entries in this table are interpreted similar to the entries in Table 6. In Table 5 we describe the steps in detail forthe sample captions listed in Table 2. Figure 4 shows the charts recommended and generated for the captions in Table 2.
10
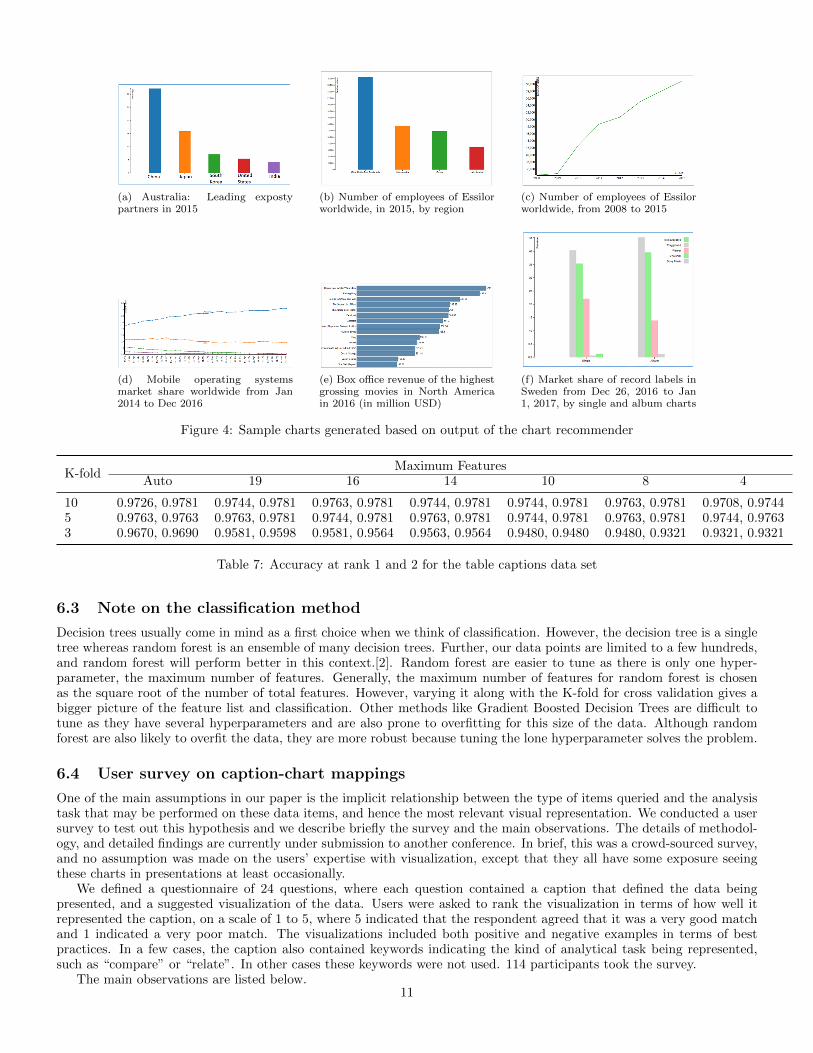
(a) Australia: Leading expostypartners in 2015
(b) Number of employees of Essilorworldwide, in 2015, by region
(c) Number of employees of Essilorworldwide, from 2008 to 2015
(d) Mobile operating systemsmarket share worldwide from Jan2014 to Dec 2016
(e) Box office revenue of the highestgrossing movies in North Americain 2016 (in million USD)
(f) Market share of record labels inSweden from Dec 26, 2016 to Jan1, 2017, by single and album charts
Figure 4: Sample charts generated based on output of the chart recommender
K-foldMaximum Features
Auto 19 16 14 10 8 4
10 0.9726, 0.9781 0.9744, 0.9781 0.9763, 0.9781 0.9744, 0.9781 0.9744, 0.9781 0.9763, 0.9781 0.9708, 0.97445 0.9763, 0.9763 0.9763, 0.9781 0.9744, 0.9781 0.9763, 0.9781 0.9744, 0.9781 0.9763, 0.9781 0.9744, 0.97633 0.9670, 0.9690 0.9581, 0.9598 0.9581, 0.9564 0.9563, 0.9564 0.9480, 0.9480 0.9480, 0.9321 0.9321, 0.9321
Table 7: Accuracy at rank 1 and 2 for the table captions data set
6.3 Note on the classification method
Decision trees usually come in mind as a first choice when we think of classification. However, the decision tree is a singletree whereas random forest is an ensemble of many decision trees. Further, our data points are limited to a few hundreds,and random forest will perform better in this context.[2]. Random forest are easier to tune as there is only one hyper-parameter, the maximum number of features. Generally, the maximum number of features for random forest is chosenas the square root of the number of total features. However, varying it along with the K-fold for cross validation gives abigger picture of the feature list and classification. Other methods like Gradient Boosted Decision Trees are difficult totune as they have several hyperparameters and are also prone to overfitting for this size of the data. Although randomforest are also likely to overfit the data, they are more robust because tuning the lone hyperparameter solves the problem.
6.4 User survey on caption-chart mappings
One of the main assumptions in our paper is the implicit relationship between the type of items queried and the analysistask that may be performed on these data items, and hence the most relevant visual representation. We conducted a usersurvey to test out this hypothesis and we describe briefly the survey and the main observations. The details of methodol-ogy, and detailed findings are currently under submission to another conference. In brief, this was a crowd-sourced survey,and no assumption was made on the users’ expertise with visualization, except that they all have some exposure seeingthese charts in presentations at least occasionally.
We defined a questionnaire of 24 questions, where each question contained a caption that defined the data beingpresented, and a suggested visualization of the data. Users were asked to rank the visualization in terms of how well itrepresented the caption, on a scale of 1 to 5, where 5 indicated that the respondent agreed that it was a very good matchand 1 indicated a very poor match. The visualizations included both positive and negative examples in terms of bestpractices. In a few cases, the caption also contained keywords indicating the kind of analytical task being represented,such as “compare” or “relate”. In other cases these keywords were not used. 114 participants took the survey.
The main observations are listed below.11
1. Overall there was a greater acceptance of the bar chart representation - where bar charts were used to visualize thedata, the users broadly seemed to agree that it was acceptable.
2. In the case of positive examples, there was no perceptible difference in the respondents“ ranking of the charts,independent of whether a task-related keyword was used or not.
3. In the case of negative examples also, there was a correlation between our ranking and the respondents‘ rankingwith and without task-related keywords.
The above seems to indicate that user expectations and acceptance of the visualization is dependent implicitly on thetypes of data being visualized, rather than on just the explicit task-related keywords.
7 Conclusions and future work
In this paper we presented the DataVizard system for generating automatic chart recommendations, based on the anal-ysis of data and the associated metadata such as queries, schema information, table captions. We have discussed theheuristics-cased approach, and the subsequent automated approach based on feature identification and extraction, forrecommending the most appropriate visualization. To the best of our knowledge, DataVizard is the first system that goesbeyond recommending relatively simple charts in 2-variables. Our system can handle both SQL and non-SQL datasets,and with little programming effort can easily be embedded into any analysis workflow. Through a user-study we haveshown that our approach provides significantly high-quality chart recommendation, and forms an important step towardscompletely automating the visual presentation of data.
We believe that the work of recommending visual presentation is just at a very nascent stage, and there are a numberof directions for future work including: expand the repertoire of visual presentations to include sophisticated visualiza-tions; more advanced usage of data values to discover automatic aggregations that make visual presentations semanticallymeaningful, and more.
References
[1] A. Abela. Chart suggestions-a thought-starter, 2009. http://extremepresentation.typepad.com/files/choosing-a-good-chart-09.pdf.
[2] Simon Bernard, Laurent Heutte, and Sebastian Adam. Influence of hyperparameters on random forest accuracy.volume 5519 of Lecture Notes in Computer Science. Springer-Verlag, 2009.
[3] Michael Bostock, Vadim Ogievetsky, and Jeffrey Heer. D3: Data-driven documents. In IEEE Transactions onVisualization and Computer Graphics, Volume 17, Issue 12, pages 2301–2309, 2011.
[4] Leo Breiman. Random forests. Machine Learning, 45(1):5–32, October 2001.
[5] William S. Cleveland. The Elements of Graphing Data. AT&T Bell Laboratories, 1994.
[6] Google. Google spreadsheets, 2017. https://docs.google.com/spreadsheets.
[7] Pat Hanrahan and Chris Stolte. Vizql: A language for query, analysis and visualization. In Proceedings of the 2006ACM SIGMOD conference on Management of Data, 2006.
[8] Pawandeep Kaur, Michael Owonibi, and Birgitta Koenig-Ries. Towards visualization recommendation a semi-automated domain-specific learning approach. In 27th GI Workshop on Foundations of Databases, pages 30–35, 2015.
[9] Jock Mackinlay, Pat Hanrahan, and Chris Stolte. Show me: Automatic presentation for visual analysis. In IEEETransactions on Visualization and Computer Graphics, Vol 13, No 6, 2007.
[10] Christopher D Manning, Mihai Surdeanu, John bauer, Jerry Finkel, Steven J Bethard, and David McClosky. Thestanford corenlp natural language processing toolkit. In Proceedings of the 52nd annual meeting of the Associationfor Computational Linguistics: System Demonstrations, 2014.
[11] Microsoft. Microsoft excel, 2017. https://products.office.com/en-in/excel.
[12] Radim Rehurek. gensim topic modelling for humans, 2017. https://radimrehurek.com/gensim/models/word2vec.html.
[13] Diptikalyan Saha, Avrilia Floratou, Karthik Shankaranarayanan, Umar Farooq Minhas, Ashish R Mittal, and FatmaOzcan. Athena an ontology driven system for natural language querying over relational data stores. In Proceedingsof the VLDB Endowment, Vol 9 No 12, 2016.
[14] Statista. Statista web site, 2017. http://www.statista.com.12
[15] Yiwen Sun, Jason Leigh, Andrew Johnson, and Sangyoon Lee. Articulate: A semi-automated model for translatingnatural language queries into meaningful visualizations. In 10th International Symposium, SG 2010, pages 84–195,1991.
[16] Tableau. Tableau, 2017. http://www.tableau.com.
[17] TPC-H. Tpc-h benchmark data, 2017. http://www.tpc.org/information/benchmarks.asp.
[18] Edward R. Tufte. The Visual Display of Quantitative Information. Graphics Press, Cheshire,CT, 1983.
[19] Manasi Vartak, Silu huang, Tarique Siddiqui, Samuel Madden, and Aditya Parameswaran. Towards visualizationrecommendation systems. In Proceedings of the VLDB Endowment, Vol 9 No 12, 2016.
[20] Manasi Vartak, Sajjadur Rahman, Samuel Madden, Aditya Parameswaran, and Neoklis Polyzotis. Seedb: Efficientdata-driven visualization recommendations to support visual analytics. In Proceedings of the VLDB Endowment, 2015.
[21] Kanit Wongsuphasawat, Dominik Moritz, Anushka Anand, Jock Mackinlay, and Jeffrey Heer. Voyager: Exploratoryanalysis vis faceted browsing of visualization recommendations. In IEEE Transactions on Visualization andComputer Graphics, (ProcInfoVis), 2016.
13