rel/rl development in indonesia · rel/rl development for redd+ in indonesia technical workshop on...
TRANSCRIPT
REL/RL DEVELOPMENT FOR REDD+ IN INDONESIA
Technical Workshop on National Reference Levels for REDD+Washington, DC, November 9-10, 2011
Anna TosianiDirectorate of Forest Resources Inventory and Monitoring
Ministry of Forestry Republic of Indonesia

Outline
•Background
•Concept of REL/RL
•REL Development in Indonesia
•Availability of Data
•Carbon Estimation (some current efforts)
•Near future development (INCAS)
Background
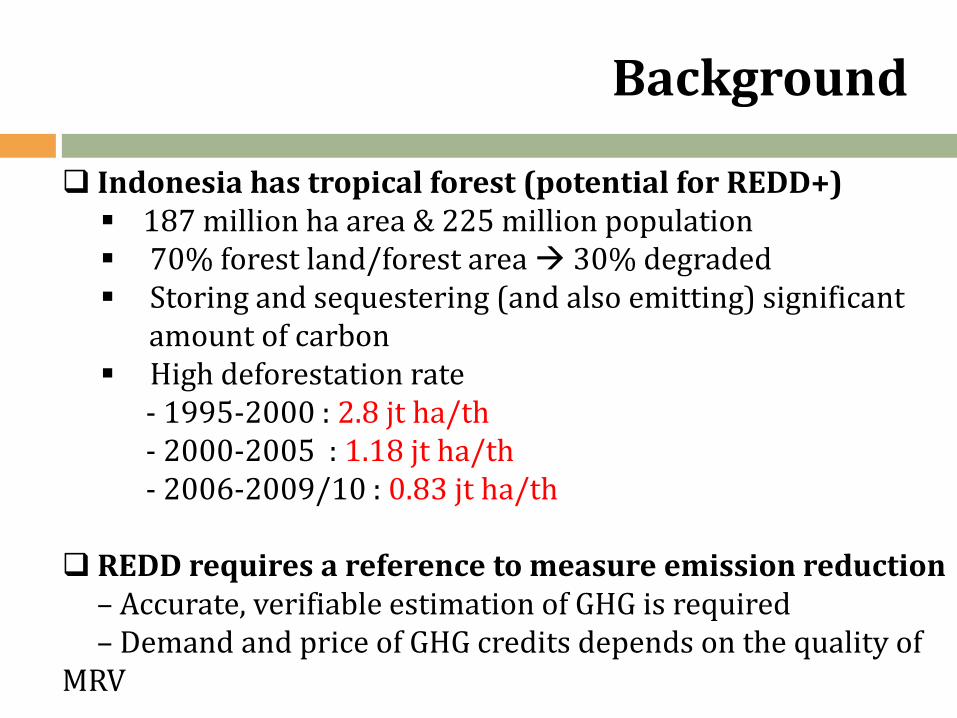
Indonesia has tropical forest (potential for REDD+) 187 million ha area & 225 million population 70% forest land/forest area 30% degraded Storing and sequestering (and also emitting) significant
amount of carbon High deforestation rate
- 1995-2000 : 2.8 jt ha/th- 2000-2005 : 1.18 jt ha/th- 2006-2009/10 : 0.83 jt ha/th
REDD requires a reference to measure emission reduction – Accurate, verifiable estimation of GHG is required– Demand and price of GHG credits depends on the quality of
MRV
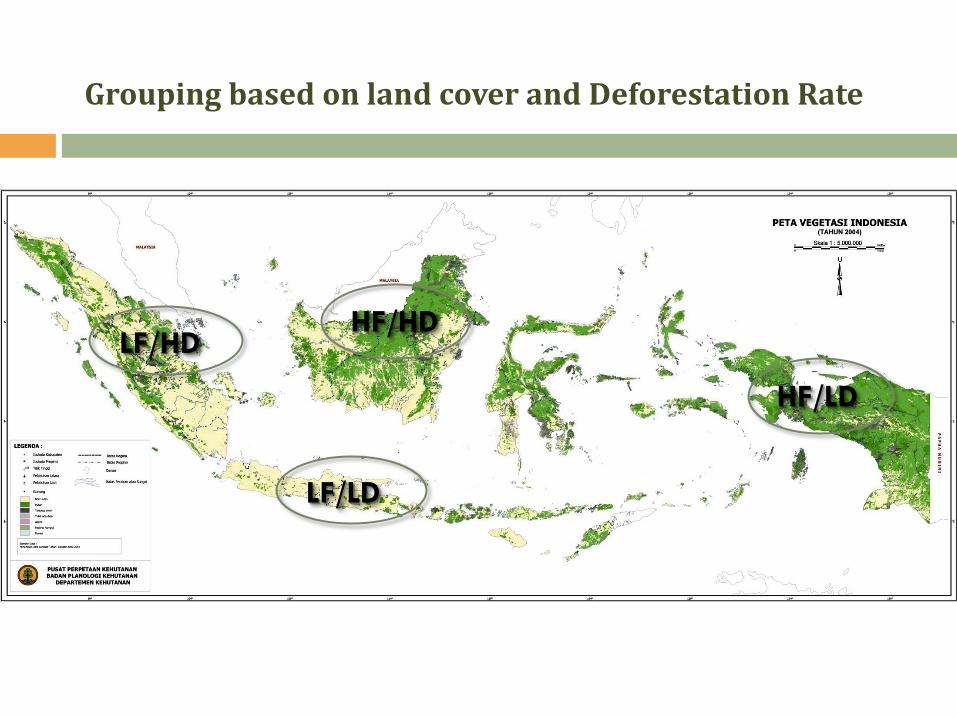
HF/LD
HF/HDLF/HD
LF/LD
Grouping based on land cover and Deforestation Rate
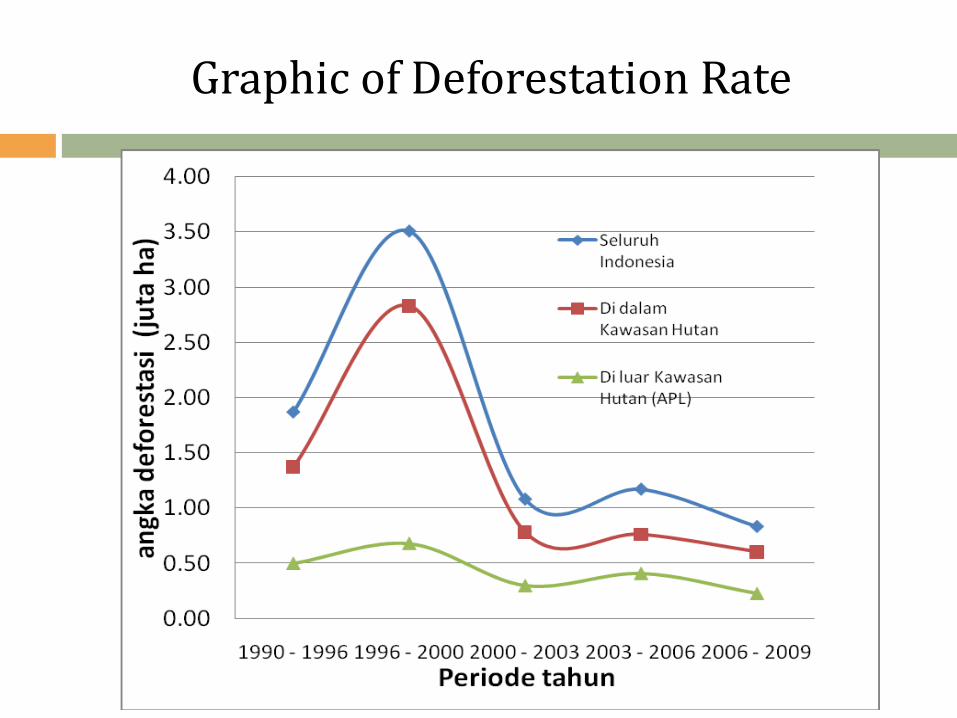
Graphic of Deforestation Rate
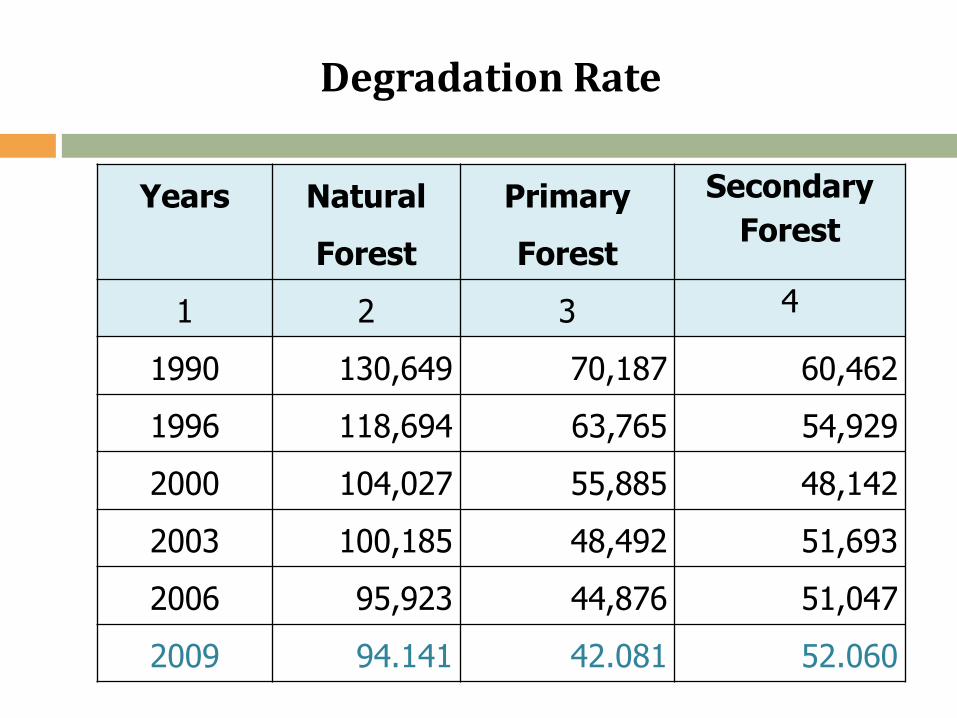
Degradation Rate
Years Natural
Forest
Primary
Forest
Secondary
Forest
1 2 3 4
1990 130,649 70,187 60,462
1996 118,694 63,765 54,929
2000 104,027 55,885 48,142
2003 100,185 48,492 51,693
2006 95,923 44,876 51,047
2009 94.141 42.081 52.060
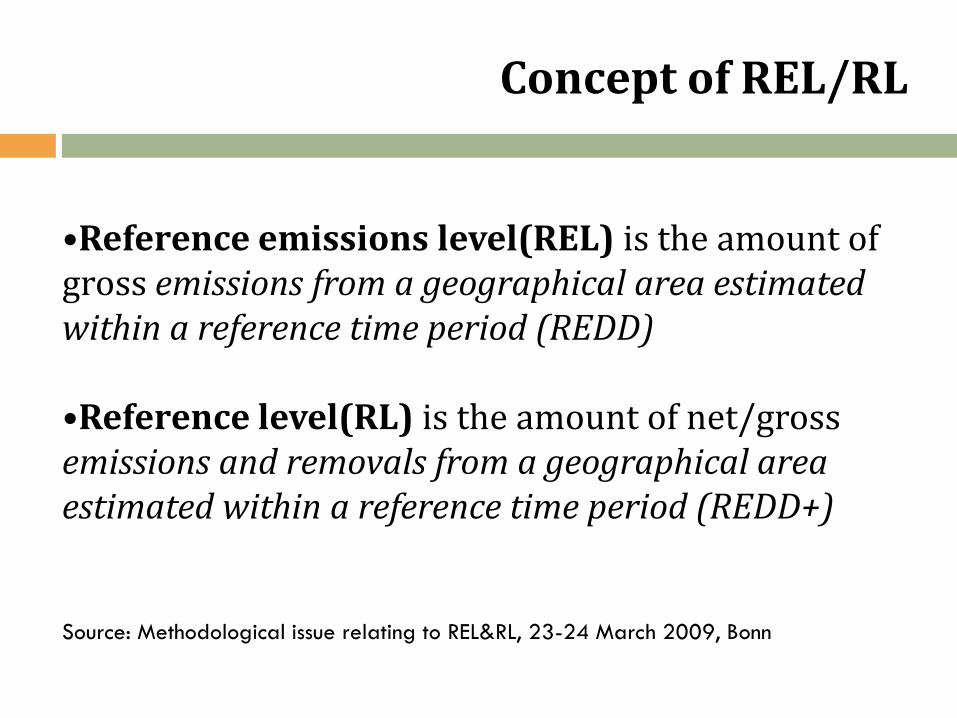
Concept of REL/RL
•Reference emissions level(REL) is the amount of gross emissions from a geographical area estimated within a reference time period (REDD)
•Reference level(RL) is the amount of net/gross emissions and removals from a geographical area estimated within a reference time period (REDD+)
Source: Methodological issue relating to REL&RL, 23-24 March 2009, Bonn
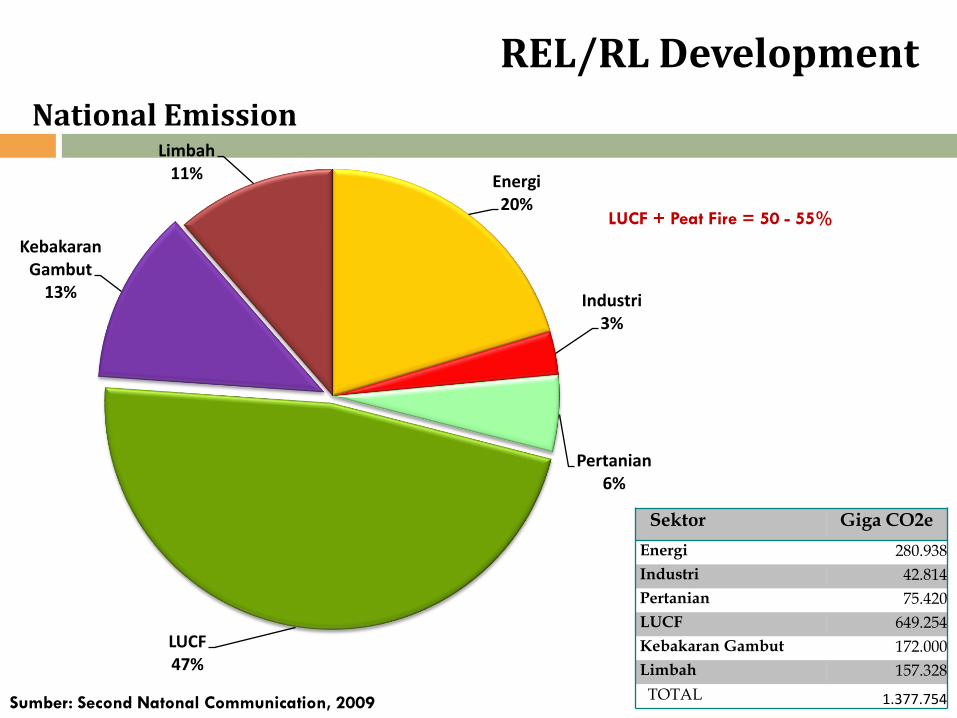
REL/RL Development
Energi20%
Industri3%
Pertanian6%
LUCF47%
Kebakaran Gambut
13%
Limbah11%
Sektor Giga CO2e
Energi 280.938
Industri 42.814
Pertanian 75.420
LUCF 649.254
Kebakaran Gambut 172.000
Limbah 157.328
TOTAL 1.377.754Sumber: Second Natonal Communication, 2009
LUCF + Peat Fire = 50 - 55%
National Emission

National Emission Scenario
0
0.5
1
1.5
2
2.5
3
2000 2005 2020
Kehutanan dan Lahan Gambut
Limbah
Pertanian
Industri
Energi dan Transportasi
= 14/26 x 2,95
= 1,5 Gt CO2e
Reduction Emission Target = 26%
Forest Land Convertion + Peat Fire =
50 - 55% (~14%)
Modified from SNC, 2009

REL National Consultation
1.560.000.000 ton CO2
e
53.000.000 ton CO2 e
51.000.000 ton CO2 e
81.000.000 ton CO2 e
490.000.000 ton CO2 e
277.000.000 ton CO2 e
Sumber peta: Dirjen Planologi Kemenhut, 2009
Sumber data REL: Draft Stranas REDD Balitbang Kemenhut, 2010
Example : Central Kalimantan
•REL is developed at national level and distributed proportionally by historical rate of deforestation 1990-2009•Provincial Quota is reconciled with Provincial Development Planning and Provincial Spatial PlanningResults:
Results:1.Carbon Source
2.Carbon Sink
Total of provincial emission based on carbon source and sink
NATIONAL
NASIONAL REDD+
STRATEGY
610.000.000 ton CO2 e
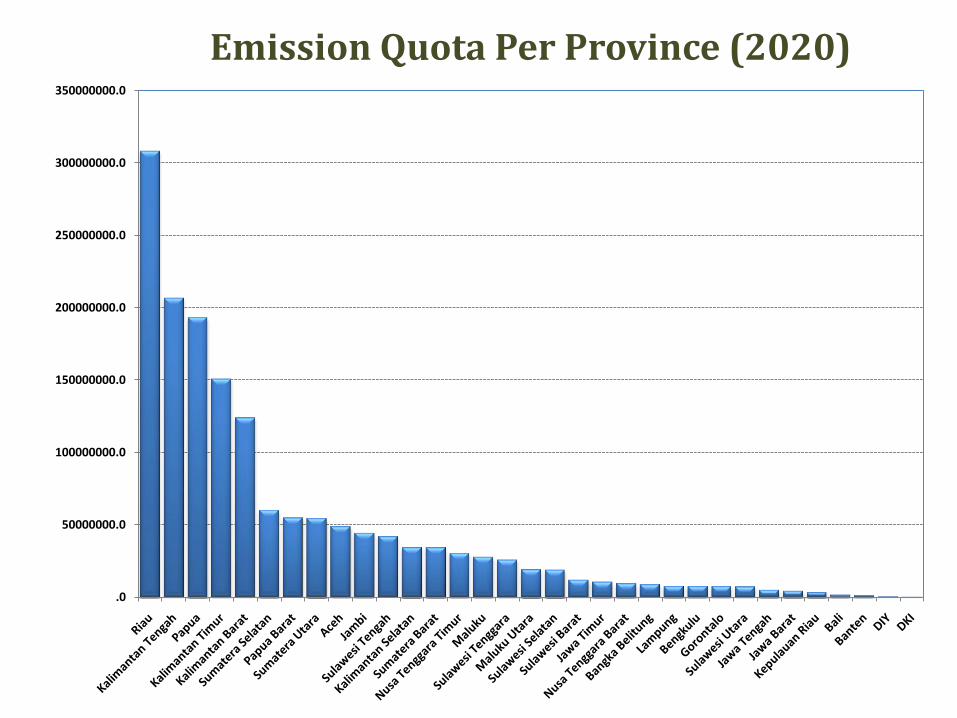
Emission Quota Per Province (2020)
.0
50000000.0
100000000.0
150000000.0
200000000.0
250000000.0
300000000.0
350000000.0

Availability of National REL Data
Activity data :
Land cover change: Landsat 5 TM, Landsat 7 ETM+ (1990, 1996, 2000, 2003, 2006, 2009/2010 and 2011 (process))
Emission/Removal Factor :
National Forest Inventory (NFI) Sample Plots • 1990-1996 (2.735 cluster plots)• 1996-2000 (1.145 cluster plots)• 2000-2006 ( 485 cluster plots)• 2006-2010 (2.997 cluster plots) Redesign NFI• 2012-2014 599 cluster plots/year
Provincial Development Planning and Provincial Spatial Planning Data
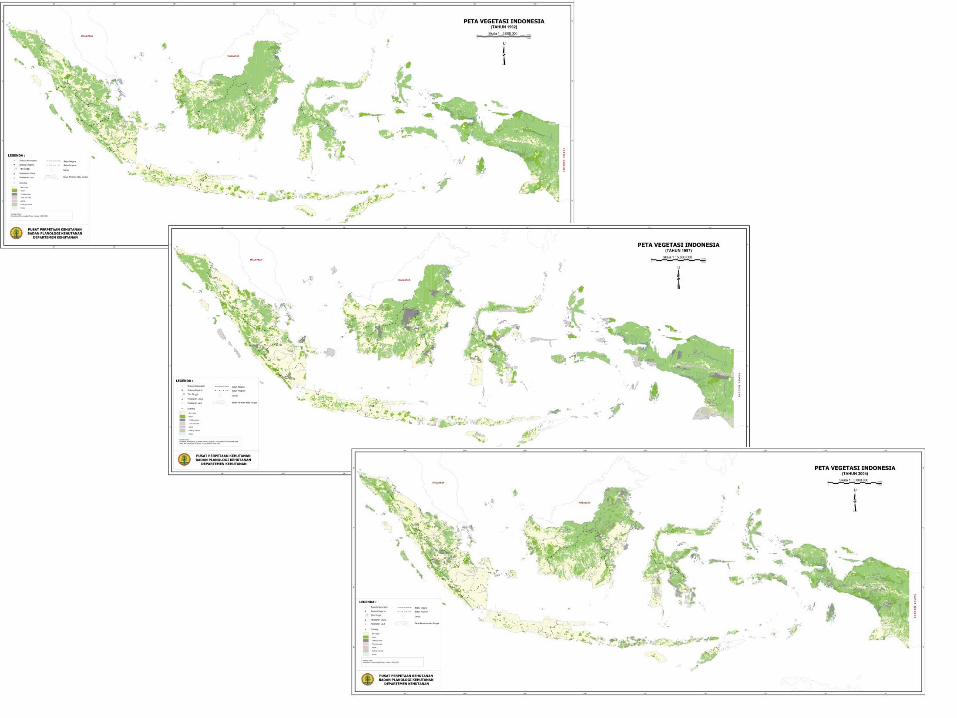

Land Cover, 2009/2010
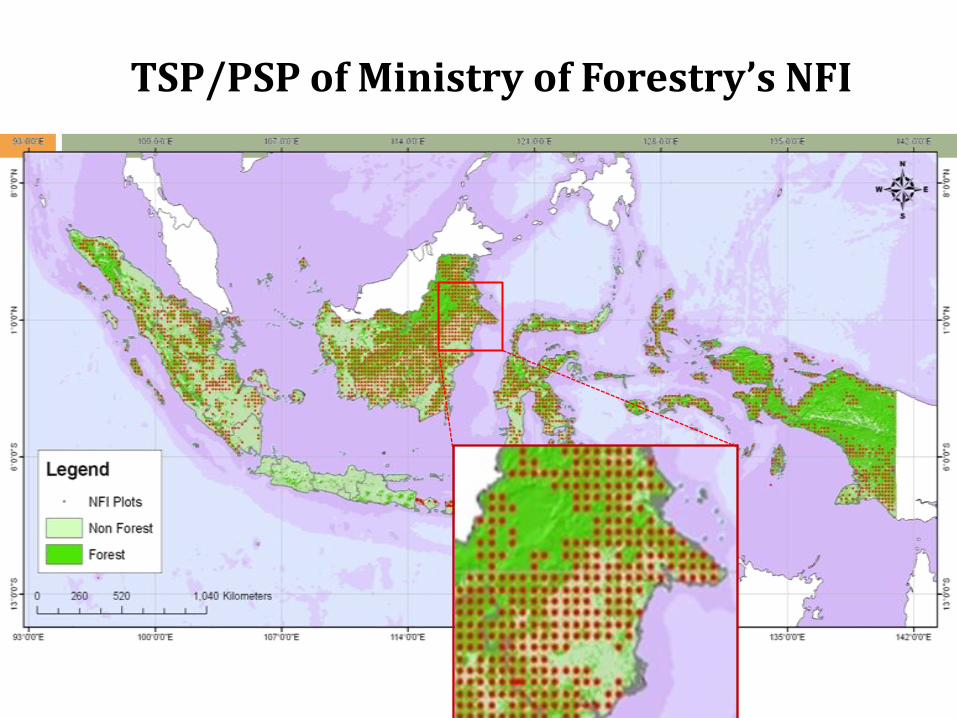
TSP/PSP of Ministry of Forestry’s NFI
Carbon Estimation
Current efforts :
•Existing Data and Information(Internal Data of Ministry of Forestry)
•Accountability and Local Level Initiave for Reducing Emission from Deforestation and Degradation (ALLREDDIProject)-(DG of Planning-ICRAF)
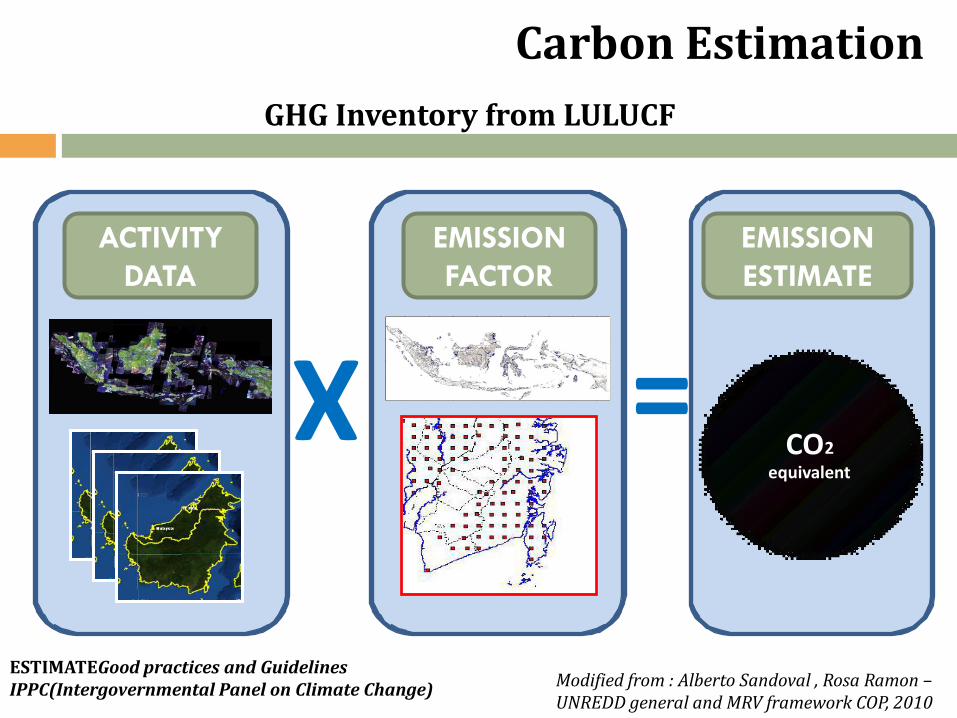
Carbon Estimation
= XCO2
equivalent
ACTIVITY
DATA
EMISSION
FACTOR
EMISSION
ESTIMATE
Modified from : Alberto Sandoval , Rosa Ramon –UNREDD general and MRV framework COP, 2010
ESTIMATEGood practices and Guidelines IPPC(Intergovernmental Panel on Climate Change)
GHG Inventory from LULUCF
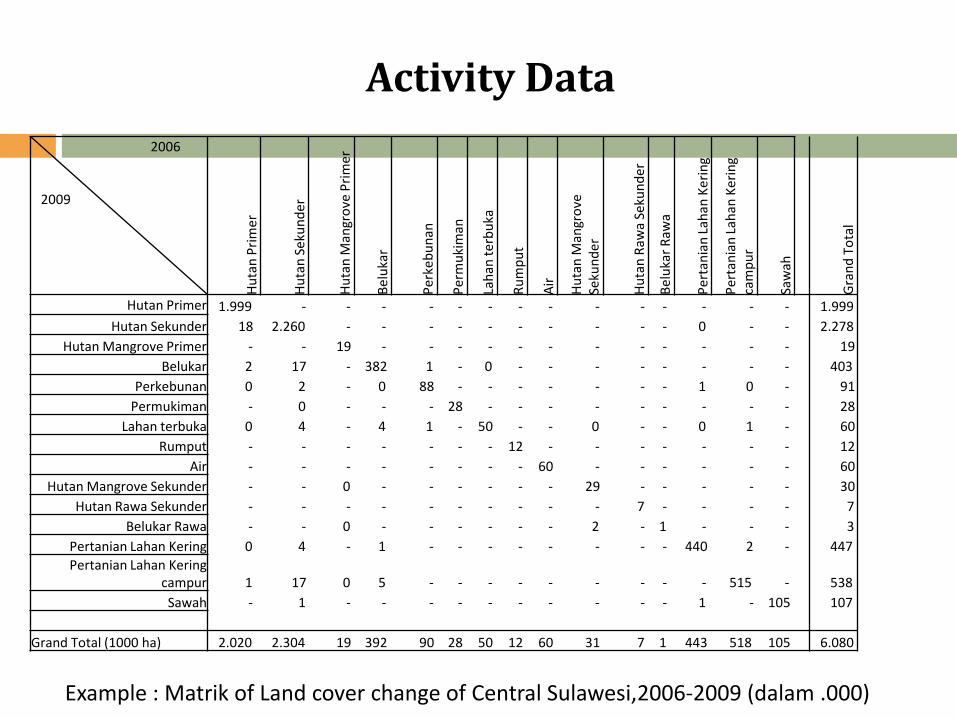
Activity Data
2006
2009
Hu
tan
Pri
mer
Hu
tan
Sek
un
der
Hu
tan
Man
gro
ve P
rim
er
Bel
uka
r
Per
keb
un
an
Per
mu
kim
an
Lah
an t
erb
uka
Ru
mp
ut
Air
Hu
tan
Man
gro
ve
Seku
nd
er
Hu
tan
Raw
a Se
kun
der
Bel
uka
r R
awa
Per
tan
ian
Lah
an K
eri
ng
Per
tan
ian
Lah
an K
eri
ng
cam
pu
r
Saw
ah
Gra
nd
To
tal
Hutan Primer 1.999 - - - - - - - - - - - - - - 1.999
Hutan Sekunder 18 2.260 - - - - - - - - - - 0 - - 2.278
Hutan Mangrove Primer - - 19 - - - - - - - - - - - - 19
Belukar 2 17 - 382 1 - 0 - - - - - - - - 403
Perkebunan 0 2 - 0 88 - - - - - - - 1 0 - 91
Permukiman - 0 - - - 28 - - - - - - - - - 28
Lahan terbuka 0 4 - 4 1 - 50 - - 0 - - 0 1 - 60
Rumput - - - - - - - 12 - - - - - - - 12
Air - - - - - - - - 60 - - - - - - 60
Hutan Mangrove Sekunder - - 0 - - - - - - 29 - - - - - 30
Hutan Rawa Sekunder - - - - - - - - - - 7 - - - - 7
Belukar Rawa - - 0 - - - - - - 2 - 1 - - - 3
Pertanian Lahan Kering 0 4 - 1 - - - - - - - - 440 2 - 447
Pertanian Lahan Kering campur 1 17 0 5 - - - - - - - - - 515 - 538
Sawah - 1 - - - - - - - - - - 1 - 105 107
Grand Total (1000 ha) 2.020 2.304 19 392 90 28 50 12 60 31 7 1 443 518 105 6.080
Example : Matrik of Land cover change of Central Sulawesi,2006-2009 (dalam .000)
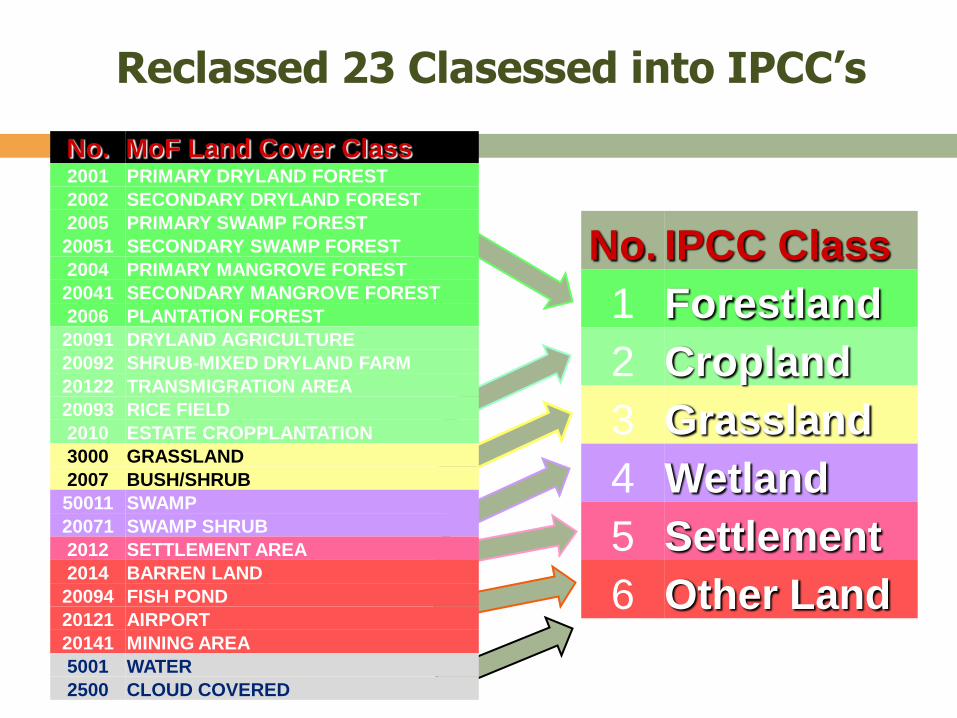
Reclassed 23 Clasessed into IPCC’s
No. MoF Land Cover Class2001 PRIMARY DRYLAND FOREST
2002 SECONDARY DRYLAND FOREST
2005 PRIMARY SWAMP FOREST
20051 SECONDARY SWAMP FOREST
2004 PRIMARY MANGROVE FOREST
20041 SECONDARY MANGROVE FOREST
2006 PLANTATION FOREST
20091 DRYLAND AGRICULTURE
20092 SHRUB-MIXED DRYLAND FARM
20122 TRANSMIGRATION AREA
20093 RICE FIELD
2010 ESTATE CROPPLANTATION
3000 GRASSLAND
2007 BUSH/SHRUB
50011 SWAMP
20071 SWAMP SHRUB
2012 SETTLEMENT AREA
2014 BARREN LAND
20094 FISH POND
20121 AIRPORT
20141 MINING AREA
5001 WATER
2500 CLOUD COVERED
No. IPCC Class
1 Forestland
2 Cropland
3 Grassland
4 Wetland
5 Settlement
6 Other Land
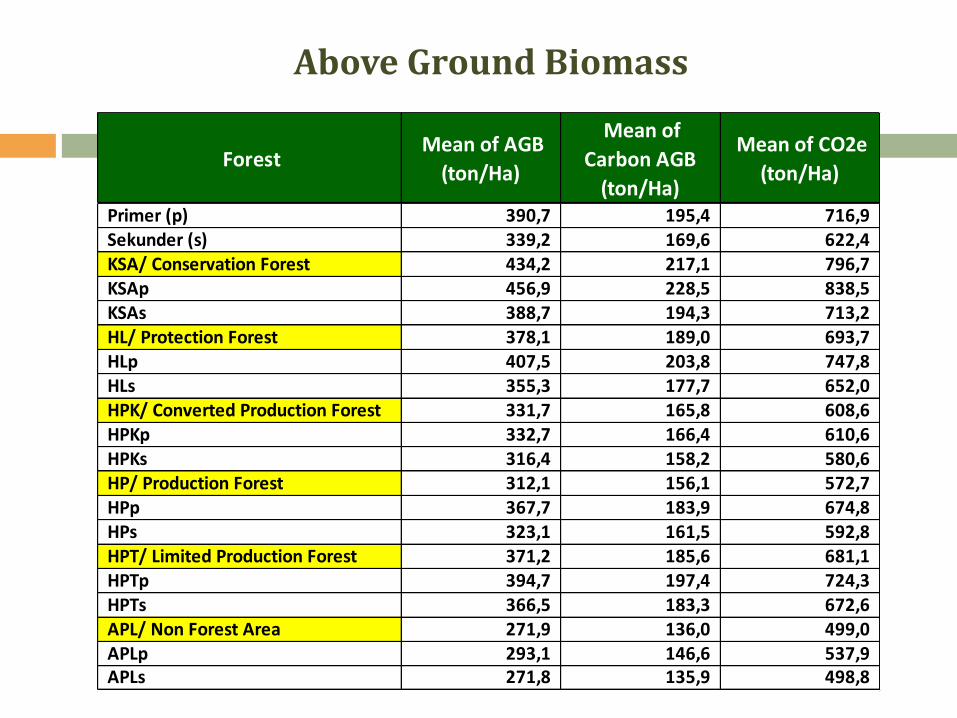
Above Ground Biomass
Forest Mean of AGB
(ton/Ha)
Mean of
Carbon AGB
(ton/Ha)
Mean of CO2e
(ton/Ha)
Primer (p) 390,7 195,4 716,9 Sekunder (s) 339,2 169,6 622,4 KSA/ Conservation Forest 434,2 217,1 796,7 KSAp 456,9 228,5 838,5 KSAs 388,7 194,3 713,2 HL/ Protection Forest 378,1 189,0 693,7 HLp 407,5 203,8 747,8 HLs 355,3 177,7 652,0 HPK/ Converted Production Forest 331,7 165,8 608,6 HPKp 332,7 166,4 610,6 HPKs 316,4 158,2 580,6 HP/ Production Forest 312,1 156,1 572,7 HPp 367,7 183,9 674,8 HPs 323,1 161,5 592,8 HPT/ Limited Production Forest 371,2 185,6 681,1 HPTp 394,7 197,4 724,3 HPTs 366,5 183,3 672,6 APL/ Non Forest Area 271,9 136,0 499,0 APLp 293,1 146,6 537,9 APLs 271,8 135,9 498,8
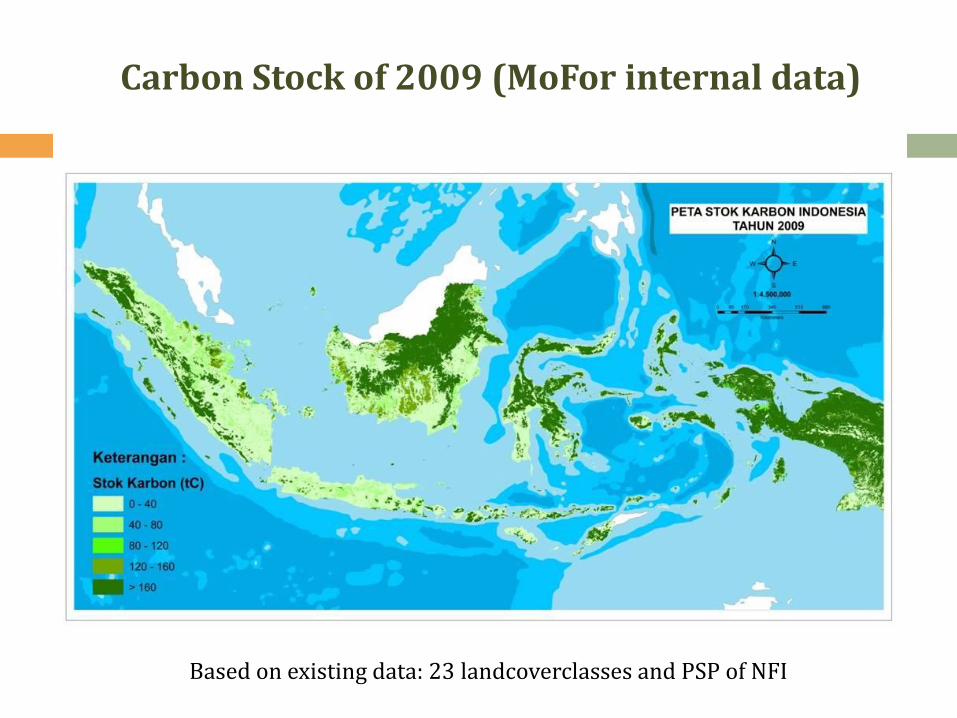
Carbon Stock of 2009 (MoFor internal data)
Based on existing data: 23 landcoverclasses and PSP of NFI

Carbon Stock of 2005 (ALREDDI Project)
Based on 28 carbon stock classes and various sources of EF

Near future development (INCAS)
Indonesia’s National Carbon Accounting System (INCAS)
INCAS will provide a comprehensive account of carbon pools and GHG emissions resulting from deforestation, degradation and other land use changes occurring throughout the Indonesian archipelago, not just within the forest land area.
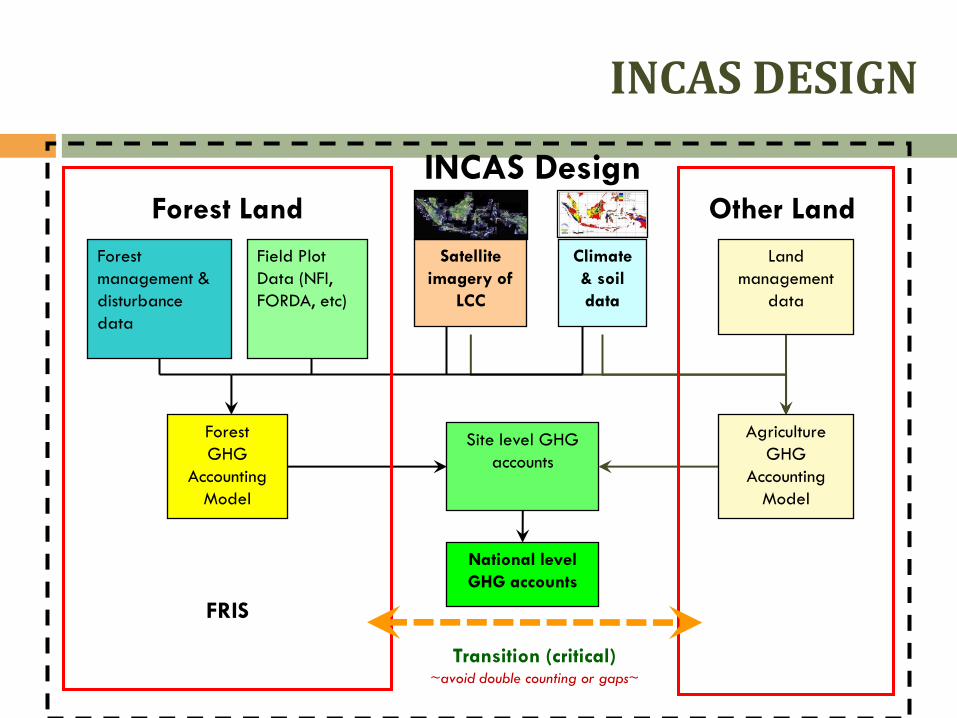
INCAS Design
Site level GHG
accounts
National level
GHG accounts
Land
management
data
Agriculture
GHG
Accounting
Model
Other Land
Forest
management &
disturbance
data
Forest
GHG
Accounting
Model
Field Plot
Data (NFI,
FORDA, etc)
Forest Land
FRIS
Transition (critical)~avoid double counting or gaps~
Satellite
imagery of
LCC
Climate
& soil
data
INCAS DESIGN

System Image of 1999 to 2003 composite for Sumatra and Kalimantan

Best imagery from Google –persistent cloud cover
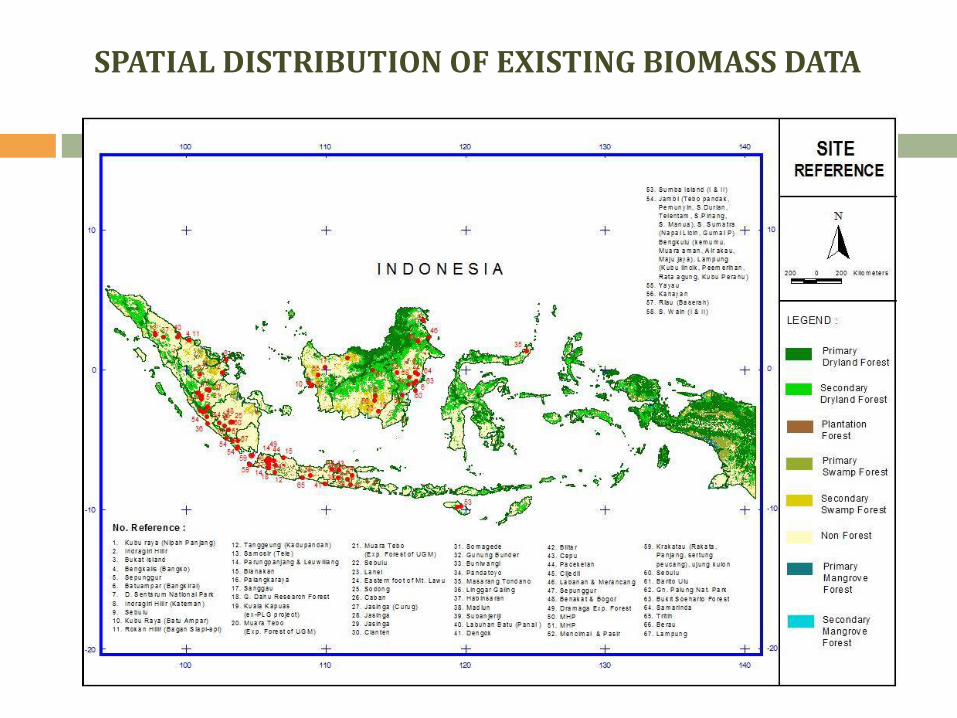
SPATIAL DISTRIBUTION OF EXISTING BIOMASS DATA

RESEARCH WITH OTHER REMOTE SENSING SOURCES (ALOS PALSAR) GEO FCT NATIONAL DEMONSTRATORS
ALOS PALSAR 2007 LULC classification
Source : Wageningen University

THANK YOU