reliving the 50s: the big push, poverty traps, and …...sachs says that the takeoff will naturally...
TRANSCRIPT
1
Reliving the 50s: the Big Push, Poverty Traps, and Takeoffs in Economic Development1
William Easterly
NYU
Keywords: Poverty trap, economic development, economic growth, foreign aid
October 2006
Abstract: The classic narrative of economic development -- poor countries are caught in poverty traps, out of which they need a Big Push involving increased investment, leading to a takeoff in per capita income -- has been very influential in foreign aid debates since the 1950s. This was the original justification for foreign aid. The narrative lost credibility for a while but has made a big comeback in the new millennium. Once again it is invoked as a rationale for large foreign aid programs. This paper applies very simple tests to the various elements of the narrative. Evidence to support the narrative is scarce. Poverty traps in the sense of zero growth for low income countries are rejected by the data in the whole period 1950-2001 and for most sub-periods. The poorest quintile also does not have significant negative growth of the relative income ratio to the world’s richest country over 1950-2001, nor is relative growth for the lowest quintile significantly different than other quintiles. The claim that “well-governed poor nations” are caught in poverty traps is rejected by simple regressions that control for both initial income and quality of government (instrumenting for the latter). The idea of the takeoff also does not garner much support in the data. Takeoffs are rare in the data, most plausibly limited to the Asian success stories. Even then, the takeoffs are not associated with aid, investment, or education spending as the standard narrative would imply.
1 I am grateful from comments from participants in seminars at the World Bank, the Central Bank of Chile, Northwestern University, the CESIfo Venice Summer Workshop on Political Economy and Development, and the IFPRI/Cornell Conference on Threshold Effects and Non-Linearities in Growth and Development, and from the editor, 3 anonymous referees, Daron Acemoglu, David Canning, Rómulo Chumacero, Michael Clemens, Steven Durlauf, Oded Galor, Ravi Kanbur, Aart Kraay, Michael Kremer, Norman Loayza, Luis Serven, Chih Ming Tan and Xiaobo Zhang. I am very grateful for research assistance and comments from Julia Schwenkenberg.
2
The Big Push has returned to favor in the development policy-making community, after
half a century of exile. Indeed, 2005 was the Year of the Big Push. Part of the motivation is the
international effort to meet the eight Millennium Development Goals (MDGs) for improvements
in social and economic indicators in developing countries by the year 2015, which in turn has led
to increased emphasis on (and quantity of) foreign aid. The UN Millennium Project,
commissioned by Kofi Annan to assess how to meet the Millennium Development Goals set for
2015, issued a large Report in January 2005 that argued that poor countries were in a “poverty
trap.” Escaping the trap requires:
a big push of basic investments between now and 2015 in public administration, human capital (nutrition, health, education), and key infrastructure (roads, electricity, ports, water and sanitation, accessible land for affordable housing, environmental management).2
Jeffrey Sachs’ 2005 book The End of Poverty said:
A combination of investments well attuned to local needs and conditions can enable African economies to break out of the poverty trap. These interventions need to be applied systematically, diligently, and jointly since they strongly reinforce one another. (p. 208) Sachs called upon developing countries to have a “Financial Plan to fund the Investment Plan,
including the calculation of the Millennium Development Goals Financing Gap, the portion of
financial needs the donors will have to fill.” (p. 273). With these plans and adequate foreign aid,
Sachs says that the takeoff will naturally follow: “success in ending the poverty trap will be much
easier than it appears.” (p. 289)3
The United Nations Development Program, in its flagship Human Development Report
2005 overseen by an advisory panel that includes prominent economists, similarly postulated that
“Aid provides governments with a resource for making the multiple investments in health,
education and economic infrastructure needed to break cycles of deprivation.” (p. 7) It said
“without a sustained increase in aid, the MDGs will not be achieved” (p. 76).4
2 UN Millennium Project, Overview Report, 2005, p. 19 3 Another prominent development economist, Paul Collier of Oxford, gave a presentation in December 2004 entitled “African growth: why a big push is needed.” 4 This was written before Kemal Dervis, a well-respected development economist, became head of the United Nations Development Program. However, Dervis (2005, p. 144-146) himself concludes that
3
British Prime Minister Tony Blair likewise called at the World Economic Forum in
Davos in January 2005 for “a big, big push forward” in Africa, featuring a big increase in foreign
aid.5 Prime Minister Blair initiated a Commission for Africa, which released its findings in March
2005. The report, written by a Secretariat headed by prominent economist Nicholas Stern,
summarized its findings as:
The actions proposed by the Commission constitute a coherent package for Africa. The problems they address are interlocking. They are vicious circles which reinforce one another. They must be tackled together. To do that Africa requires a comprehensive ‘big push’ on many fronts at once.6
To clarify further the Blair Commission for Africa defined the Big Push and said how it must be
financed:
an essential part of this big push will be a major increase in investment. In this section we have considered ways in which such a quantum increase in investment could be financed other than by an increase in aid. We have found no credible alternative.7
Hence, the Blair Commission concluded “Africa is very unlikely to achieve the rapid growth in
finance and human development necessary to halt or reverse its relative decline without a strong
expansion in aid.” (p. 293)
The World Bank and IMF issued a joint report on the Millennium Development Goals in
April 2005, likewise calling for “a big push in aid.” Tony Blair had the Big Push in Africa at the
top of the agenda of the G-8 summit meeting in July 2005, and the G-8 agreed to cancel debt and
increase aid. The European Commission (2005) issued an EU Strategy for Africa in October 2005
in which increased aid was “required to give Africa a decisive push,” achieving among other
things a large increase in growth (the takeoff). Jeffrey Sachs closed 2005 with a statement in the
Financial Times (December 27. 2005) that despite the World Bank and IMF endorsement of
higher aid, it is still not enough:
The current poverty reduction strategies submitted to the International Monetary Fund and World Bank by the poor countries do not reflect real needs, because the poorest nations are counseled by those institutions to keep their ambitions low, in line with modest aid flows. The result is a poverty trap…
extremely poor “countries are in a vicious circle from which they cannot escape without outside help,” and that a “big push” of aid will launch a “takeoff.” 5 International Herald Tribune, Friday January 28, 2005, p. 1 6 OUR COMMON INTEREST: REPORT OF THE COMMISSION FOR AFRICA, March 2005, p. 13 7 Commission for Africa, p. 298
4
2006 shows no sign of a slowdown in the enthusiasm for the Big Push. UNCTAD issued its
September 2006 Economic Report on Africa, entitled “Doubling aid: making the Big Push work.”
The United Nations Economic and Social Council, headed by well-respected Colombian
development economist José Antonio Ocampo, wrapped up its latest meeting in July 2006 with a
call for large-scale aid, which “is crucial for breaking the poverty trap of least developed
countries.”8
The positive outcome of escaping a poverty trap is a “takeoff.” Sachs (2005) and the
European Commission (2005) state that it is feasible for aid to cause enough of a growth
acceleration in Africa to meet the Millennium Development Goal of halving the poverty rate in
Africa by 2015. The European Commission then says that this would require African growth over
the next 10 years to be “at least 8 percent per year” (p.4). This “takeoff” is equivalent to about 6
percent per capita growth, from a starting point of stagnation over the last few decades. The
World Bank (2005) and the Commission for Africa (2005) have a similar target of 7 percent GDP
growth – 5 percent per capita growth-- for Africa to halve poverty over the next decade.
It is remarkable how little language has changed over 50 years. The first World Bank
mission ever, to Colombia in 1951, concluded:
Only through a generalized attack through the whole economy on education, health, housing, food and productivity can the vicious circle of poverty.. ill health and low productivity be decisively broken. But once the break is made, the process of economic development can become self-generating... with the knowledge of the underlying facts and economic processes, good planning in setting objectives and allocating resources, and determination in carrying out a program for improvements and reforms, a great deal can be done to improve the economic environment... (quoted in Escobar 1994) (Despite these statements, Colombia had already been growing steadily for half a century at the
time of the World Bank mission. Per capita growth in Colombia over 1900-1950 was 1.6 percent
per annum; since the World Bank mission, per capita growth in Colombia 1951-2001 has been
1.7 percent per annum.)
Even allowing for some rhetorical exaggeration, and some diversity of opinion in the
policy-making community that determines foreign aid, the recent statements in favor of the
traditional narrative are strong. Judging by old and new language, a Big Push involves a
combination of (1) a big increase in foreign aid, (2) a simultaneous increase in investment in
8 http://www.un.org/News/Press/docs/2006/ecosoc6229.doc.htm

5many different sectors, (3) with the consequence that poor countries escape from a “poverty
trap” and have a rapid acceleration of growth (a “takeoff”.)
Does economic development happen mainly through Big Pushes? There are three inter-
related concepts that we can explore empirically: the Big Push, the Poverty Trap, and the Takeoff.
The traditional narrative, which has recently regained favor in the policy-making community,
stresses the key role of foreign aid: the least developed countries are caught in a Poverty Trap,
from which they need a Big Push involving increased aid and investment to emerge, after which
they will have a Takeoff into self-sustained growth. Each of these elements supports the other in
giving aid a central role – the poverty trap means that aid is necessary because otherwise
countries will stay poor forever, and the aid-financed Big Push is how to escape the poverty trap.
If a rapid takeoff is the typical way that poor countries become rich, which would follow from
development happening mainly through Big Pushes, the role of aid is to create or support such
Big Pushes and takeoffs.
It is the classic narrative justifying foreign aid that unifies the three concepts – poverty
trap, Big Push, and takeoff -- which otherwise don’t have to be logically connected. What I want
to investigate in this paper whether there is evidence for the type of poverty traps and takeoffs
that the argument for aid financing implies. This greatly simplifies the hypothesis testing, without
needing (for example) to resolve all of the issues posed by the vast literature on convergence of
per capita income.
The “classic” poverty trap tested here is thus restricted – it is that the poorest countries
are stuck in stagnation -- zero per capita growth, and this stagnation is inevitable in the absence of
aid. I will also test a generalization to a trap of stagnation of the poorest countries’ income
relative to the richest countries. Similarly, the notion of the takeoff is restricted in the aid
narrative: it is a definitive transition within recent decades from a regime of zero growth to one of
stable and high positive growth of per capita income, again related to aid.
The classic narrative covered by this paper is meant to summarize recent development
experiences of actual and potential aid recipients (the poorest countries), and that is this paper’s
focus. In the very long run, it seems obvious that the world as a whole and the rich countries

6themselves were in some kind of “poverty trap,” in which per capita income did not increase for
much of human history. The rich countries would also satisfy some definition of a takeoff – there
were many centuries of stagnation and then a transition to stable per capita income growth (see
discussion below and references in Galor 2005). This rich country experience probably inspired
in part the classic aid narrative. However, as the paper will explore in more detail, the rich
country experience does not necessarily imply the aid narrative – the rich country stagnation was
when all countries and technology were stagnant (at least by comparison with the dynamism of
the modern era), the rich countries emerged out of stagnation without foreign aid, and the
transition from zero to positive growth was slower and more gradual than the abrupt and large
transition that the discussion on aid seems to expect.
The new growth literature has created much recent theory and some empirics of poverty
traps, as I discuss more below, and this literature could have conceivably provided contemporary
support for the classic aid narrative. However, I will show that the notions of poverty traps (and
how to escape them) are very different in this literature from those in the classic aid narrative; this
paper will restrict itself to testing the latter (which I will argue is a misinterpretation of more
widely accepted notions of poverty traps). The greater specificity of the classic aid narrative
makes it easier to test, and it is worth testing given its current popularity in policy debates and
possible relevance to the new growth literature. However, I don’t intend to push the conclusions
beyond a judgment on whether the narrative holds.
Intellectual history
Paul Rosenstein Rodan wrote the founding article of development economics in 1943,
innocuously titled “Problems of Industrialization of Eastern and South-eastern Europe.” He called
for large-scale externally-financed investment in Eastern European industry, which would not
spontaneously emerge from the private sector because of external economies and
complementarities between industries. His idea was widely adopted as applicable to the problems
of all “Third World” economies and came to be known as the “Big Push.”
There are parallels between development economics of the 1940s and 1950s and the ideas
of the Big Push current today. Then, as now, there were economists who advocated a “Big Push”
7
to get countries out of a “poverty trap,” foreign aid to fill the “Financing Gap,” and action on all
fronts through comprehensive “planning”.9 The 1960 counterpart to Sachs’ 2005 The End of
Poverty was Walt Rostow’s best-selling The Stages of Economic Growth, which argued that
countries could emerge out of stagnation into self-sustained growth thanks to an aid-financed
increase in investment. It was Rostow that popularized the term “takeoff.”
Jeffrey Sachs in the The End of Poverty gives a representative statement on the renewed
attraction of the poverty trap story today. He has many ideas on how the poverty trap happens,
which seems to be influencing the above aid policymakers. One that is familiar from both the old
literature on poverty traps is that poor people do not save enough, so that physical capital
accumulation fails to keep up with depreciation and population growth. Another way in which the
poor might not save enough is in the form of human capital.10 Thus, a need is created for an aid-
financed “Big Push” to get out of the low savings trap.
The possibility that saving is low at very low incomes is certainly plausible, and has a
very respectable pedigree going back to the Stone-Geary specification of consumer utility with a
subsistence constraint below which consumption cannot fall. More recent theoretical explorations
of growth models featuring saving with a subsistence constraint can be found in Galor (1996) and
Galor and Moav (2004). Although low saving by the poor could be overcome by well-functioning
credit markets (domestic or international), it is clear that this solution will not work for human
capital where there will inevitably be credit market imperfections (Galor and Zeira 1993, Moav
2001). However, the more recent theoretical models just cited do not necessarily imply a “Big
Push” strategy, as things like rising wages and falling inequality could generate “small pushes”
that allow the gradual escape from this more general type of poverty trap. In this paper, I will test
the classic narrative’s version of the poverty trap and not the more generalized models in the
recent literature.
9 A related classic development model is the “two-gap model”, which stresses the role of aid to “fill the gap” between actual investment and the investment required to reach a target growth rate. Easterly (1999) showed how this model also continues to be influential and rejected its predictions. 10 The UNDP’s Human Development Report 2005 also stresses the low saving and human capital accumulation at low income as part of the reason why low income countries need aid. It also stresses inadequate government revenue to finance infrastructure and public services.

8A second element in the poverty trap is a nonconvexity in the production function.
Sachs suggests there are increasing returns to capital at low initial capital per person. He gives the
example of a road with half of the road paved and half impassable due to missing bridges or
washed out sections. Repairing the impassable sections would double the length of road, but
would much more than double the output from the road. “This is an example of a threshold effect,
in which the capital stock becomes useful only when it meets a minimum standard.” (Sachs
2005,p. 250) The new growth literature has suggested similar nonconvexities for human capital
(e.g. Azariadis and Drazen 1990).
A third possible element in a poverty trap is the behavior of population growth. If
population growth is much higher at low income compared to high per capita income, then any
nascent increase in per capita income will be eaten up by population growth, leading to a return to
stagnant per capita income (Malthus had also emphasized the poor dissipating any nascent
income increase above starvation levels through excessive fertility, although he thought the poor
at the starvation level itself would not have many children). This population poverty trap was
also prominent in the early literature that led to the classic development narrative (e.g. Nelson
1956). The demographic transition from high to low population growth obviously played a role in
the long run take-off of the West, and is stressed by a number of modern growth models (Galor
and Weil 1996, 2000, Moav 2005, Galor 2005). However, how aid would facilitate the
demographic transition has never been obvious (the large literature on aid effectiveness pays
virtually no attention to the effect of aid on fertility), and such a role for aid is not emphasized by
the current discussion of the classic aid narrative (and so this paper will not devote any attention
to this mechanism).
The first two mechanisms, by contrast, were popular in the classic narrative (and its
modern reincarnation) because they seem to create a simple way to break the poverty trap and
achieve the takeoff – give aid. According to Sachs, the role of foreign aid is to increase the capital
stock enough to cross the threshold level (the Big Push): “if the foreign assistance is substantial
enough, and lasts long enough, the capital stock rises sufficiently to lift households above
subsistence… Growth becomes self-sustaining through household savings and public investments

9
supported by taxation of households.” (Sachs 2005, p. 246) The last statement is the “take-off”
hypothesis.11
A possible complicating mechanism for assessing the poverty trap is that poor countries may
be poor because of bad policies and institutions. The classic aid narrative paid little attention to this
possibility. The revival of the narrative today also downplays the bad government explanation for
poverty. The bad government story would have much different (and not so obvious) implications for
aid. As Sachs (2005) says, “If the poor are poor because … their governments are corrupt, how could
global cooperation help?” (p. 226) The UN Millennium Project and Jeffrey Sachs argue , however,
that it is the poverty trap rather than bad government that explains poor growth of low income
countries and the failure to make progress towards the Millennium Development Goals (MDGs).
Sachs says “the claim that Africa’s corruption is the basic source of the problem {the poverty trap}
does not withstand practical experience or serious scrutiny.”12 Likewise the Millennium Project says
“Many reasonably well governed countries are too poor to make the investments to climb the first
steps of the ladder.”13 There is of course a vast literature on empirical determinants of growth and
income, but unlike the much-criticized almost infinitely flexible specification of most cross-country
regressions, this key issue in the aid narrative suggests just testing one specific statement – even well-
governed poor countries are too poor to grow.
It is easy to put these poverty trap ideas in the context of the neoclassical model. In the classic
Solow model in which all countries have the same steady state, all countries converge to a high level
of income. However, if saving is low at low compared to high income, if there are increasing returns
at low income, and/or if population growth becomes very high at low income, then a poverty trap will
occur at low income, driving the equilibrium down to low or zero capital (whether low or zero
depends on the shape of the curves, zero capital is presumably equivalent to subsistence production).
There is a threshold capital stock above which countries could escape from the poverty trap, which
could happen with an aid-financed increase in capital stock (Big Push).
11 One complication that is stressed in modern growth models but not in the modern policy discussion on aid is that aid that raises personal income may increase population growth by more than the necessary increase in saving, theoretically perpetuating the poverty trap. 12 Sachs 2005, p. 191 13 UN Millennium Project 2005, p. 34.
10
This discussion is in terms of the neoclassical model without technological change, and
thus absolute income per raw unit of labor. It is this model that fits most closely both the classical
development narrative and the recent discussion of poverty traps. However, other specifications of
poverty traps are possible in the neoclassical model. With technological change, all countries will
grow at the same steady state rate (the rate at which the technological frontier shifts out). Capital
accumulation now transitionally affects a country’s position relative to the leader country (i.e. the
country that has already attained the steady state level of capital per efficiency unit of labor). If we
redefine the equilibrium capital stock to be per efficiency unit of labor rather than per raw units of
labor, we now have the possibility of relative poverty thresholds rather than absolute ones. If the
capital stock per efficiency unit of labor falls below the relative threshold, then a country will slip
further behind the leader. We can call this latter possibility a relative poverty trap (whereas the former
version of the neoclassical model was an absolute poverty trap).
The new growth literature over the past two decades has revived the appeal of the theory of
poverty traps, detailing many ways in which we could think that countries could be caught in traps.
Azariadis and Stachurski (2005) have a survey of many theoretical models of poverty traps in this
literature. For example, the Lucas (1988) model could predict a poverty trap in which low average
skills in the population could discourage new entrants to the labor force from getting skills,
perpetuating a low skill trap. Murphy, Shleifer, and Vishny (1989) set out a formal model of the
Rosenstein-Rodan technological poverty trap and Big Push. Galor 2005, Moav 2005, Galor and Weil
(2000, 1996) present insightful variations of poverty trap models in which a low return to human
capital perpetuates a poverty trap with low income, high fertility, and low human capital. This latter
literature has pointed out that the human capital poverty trap is potentially even worse than the
physical capital one, as unlike physical capital, households cannot use human capital as collateral
for borrowing. Credit constraints could thus trap the poor in a low human capital equilibrium.
Galor and Zeira (1993) were the first to highlight the important negative effect of inequality with these
credit market imperfections; conversely, falling inequality could lead to the gradual emergence from
the poverty trap.14
14 Galor, Moav, and Vollrath 2003 follow up this line of research in explaining income divergence between rich and poor in the long run.

11The Galor and Weil (2000) and Galor 2005 story has a persuasive description of the
successive movement (the “takeoff”) in rich countries over the last few centuries from (1) a regime of
zero growth in income per capita and very low population growth, then (2) higher growth in both
population and per capita income, then finally (3) low growth in population and high growth in per
capita income. Accelerating growth in productivity (associated with concomitant technological
progress and rising population) makes the first transition possible, and the rising return to human
capital with better technology triggers the second transition. The relationship between population
growth and per capita income is positive in (2) and negative in (3). Note that in countries who have
made the first transition but not the second, the additional resources from foreign aid would raise
population growth and not result in escaping the poverty trap. In general, none of these recent models
of poverty traps have the simple implications for foreign aid and subsequent rapid takeoff featured in
the classic aid narrative (with the possible exception of Murphy, Shleifer, Vishny 1989, which was
motivated as a theoretical exploration of Rosenstein-Rodan’s coordination failure idea).
The takeoff concept has been independently accepted by other scholars who don’t
necessarily believe in poverty traps and Big Pushes, using alternative models. For example, in
addition to the Galor 2005 article discussed in the previous paragraph, Parente and Prescott 2000
have a notion very similar to takeoff in their story of barriers to technology adoption. Likewise
Acemoglu and Zilibotti 1997 have a takeoff story that depends on risk diversification. These
models are inspired more by the long run experience of rich countries gradually moving from
stagnation to modern economic growth than by hopes for large growth payoffs from foreign aid.
The classic aid narrative implies a more abrupt and larger takeoff than that featured in these
articles (or that given by historical experience). Hence, testing of abrupt takeoffs may say little
about the validity of general theoretical models of takeoffs.
Recent empirical work in the new growth literature considers whether poverty traps exist
in general (see surveys in Durlauf, Johnson, and Temple 2005, and Azariadis and Stachurski
2005). They note that the literature has been fairly inconclusive, with some work by Quah (1996a,
1996b, 1997) indicating the existence of “twin peaks” in the distribution of income, which could
be consistent with a poverty trap at low incomes, while Kremer, Onatski, and Stock (2001) argue
that Quah’s results suffer from imprecise parameter estimates and anyway that more recent data

12indicate transition probabilities that imply a single-peaked distribution at high income. Feyrer
(2003) finds stronger evidence for “twin peaks” in productivity, which could support the
technologically driven poverty trap. However, Feyrer notes that the distribution of physical and
human capital is moving towards a single peak, contradicting the poverty trap stories that rely on
saving mechanisms.
Moreover, the twin peaks stories typically have slow dynamics in movement from the
lower peak to the higher, contradicting the notion of the rapid takeoff out of the poverty trap of
the classic narrative. Quah 1996a (p.1052) notes that, a few growth miracles notwithstanding (to
be considered more below), “the passage time from the bottom 5% percentile to the
top…averages in the hundreds of years.” This paper has a much simpler task than the generalized
poverty trap literature, since the classic aid narrative makes strong and specific predictions that
can be verified or falsified with some simple descriptive tests.
The relevant empirical literature on poverty traps also includes the vast body of empirical
work on convergence, which fails to find evidence of absolute convergence but does find
evidence for conditional convergence – the opposite of a poverty trap (e.g. Sala-i-Martin 1996).
Galor 1996 points out that this result has to be interpreted with caution, since conditional
convergence could be consistent with poverty traps (or a “convergence club” at low income) if
the conditioning variables include the mechanisms by which poverty traps arise. However, with
the exception of conditional convergence controlling for saving, human capital, and population
growth, most of the convergence results involve conditioning variables like quality of
government or economic policies that are not part of the poverty trap in the classic aid narrative.
Doppelhofer, Miller, and Sala-i-Martin (2004) find conditional convergence to be a robust feature
of growth regressions, i.e. it holds for a wide variety of conditioning variables.
Hence, the notion of poverty traps and takeoffs in the recent literature is very different
from those in the classic aid narrative. The rest of the paper tests the specific forms of poverty
traps and takeoffs suggested by the classic narrative.
13
Testing the poverty trap
Kraay and Raddatz (2005) have recently tested directly whether the savings and
increasing returns mechanisms hold in the data. They point out that saving would have to follow
an S-curve to generate a poverty trap, first increasing little with income, then increasing steeply,
then flattening out again. They reject the S-curve in the data on saving and per capita income.
They also fail to find evidence of the technological non-convexities that also are necessary to
create the poverty trap. They conclude there is little evidence for a poverty trap based on these
mechanisms.15
A problem with all the theories that stress low physical and human capital as the source
of the poverty trap is that they imply extremely high returns to capital in the poor countries, as
pointed out by many authors (see Easterly and Levine 2001 for a survey). Of course, this is not
necessarily a problem for the aid narrative since it also says that the payoff to aid would be very
high if it funds physical and human capital. However, the returns to capital in poor countries may
be implausibly high, with counterfactual implications. If the share of capital (both human and
physical) is two-thirds in the neoclassical model, then the ratio of the marginal products of capital
in two countries whose income difference is explained entirely by capital is equal to the square
root of the ratio of per capita incomes. When the ratio of the richest to the poorest countries is
about 64 to 1, this implies that the marginal product of capital (human or physical) is eight times
higher in the poorest country than in the richest country. This would imply that physical and
human capital should flow from the richest to the poorest countries, when the stylized facts about
international financial flows and the brain drain point to the reverse.
The only poverty trap story that doesn’t suffer from this problem is the one emphasizing
technological nonconvexities that imply low returns to capital at low income. This has the reverse
implication for aid – it says aid-financed investment would have a low payoff (actually no payoff
in the long run) unless aid is large enough to push the country across the threshold. However, a
15 Graham and Temple 2004 also use a calibrated model of multiple equilibria and find that only a small portion of the income gap between rich and poor can be explained by such a model.
14
Big Push of aid would have a large effect in the long run by leading to a change in long run
equilibrium.
There is little sign of the high returns to human and physical capital in those Big Pushes
that have already happened. Sachs et al. said that large aid increases would finance “…a ‘big
push’ in public investments to produce a rapid “step” increase in Africa’s underlying
productivity, both rural and urban.”16 Over 1970-94, there is good data on public investment for
22 African countries. These countries’ governments spent $342 billion on public investment. The
donors gave these same countries’ governments $187 billion in aid over this period.
Unfortunately, the corresponding “step” increase in productivity, measured as per capita growth
over this period, was zero.
Likewise, there was rapid human capital accumulation in poor countries, to which foreign
aid may have contributed. However, the growth response to rapid human capital accumulation
failed to materialize (Pritchett 2001, 2004). To take Africa again, enrollment ratios increased
dramatically and the growth of human capital was higher than any other region over the last 4
decades, yet once again Africa failed to emerge from poverty. Some regressions show an effect of
initial human capital on subsequent growth, but others argue that this is reverse causality (Bils
and Klenow 2000). This effect would imply a secular upward trend in growth with rising human
capital, which is both problematic in the long run and is not consistent with falling growth despite
rising human capital in developing countries in the last quarter-century (Pritchett 2004, Easterly
2001).
Has aid had the growth effects that the poverty trap model would predict? Decades of
research on aid and growth has failed to generate evidence for this prediction.17 Contrary to the
classic narrative, aid has financed consumption (mainly government consumption) rather than
investment.18 The big stylized facts do not support the prediction that aid has large growth
effects: (1) growth is lower in aid-intensive countries than in similar developing countries that get
16 Sachs et al., 2003. 17 Easterly 2003 summarizes some of this research. 18 Boone 1996 is the definitive study, confirmed by Easterly 1999.

15little aid, (2) aid has risen over time as a percent of income in Africa, but Africa’s growth rate
has fallen over time.
More sophisticated testing that would control for selection effects and reverse causality
fails to find a robust effect of aid on growth. Claims are periodically made for a positive growth
effect of aid, which later robustness checks fail to replicate. The latest round in this long literature
is Rajan and Subramanian 2005, which tests virtually all of the earlier positive claims that aid has
growth effects and finds no supporting evidence. (See also Doucouliagos and Paldam 2006 for
the latest exhaustive survey, which reaches the same conclusion.)
In their survey of the empirical literature, Azariadis and Stachurski (2005) note that
“poverty trap models tend to be lacking in testable quantitative implications.” In contrast, a blunt
force approach to testing the poverty trap in the classic aid narrative could just ask: (1) do the
poorest countries have significantly lower per capita growth than the rest, and (2) is their growth
zero? (A poverty trap in which (1) holds but not (2) would be a relative poverty trap, which the
paper considers below.) Does the stagnation take place especially in the absence of aid? We have
data on per capita income from 1950 to 2001 for 137 countries from a statistical compilation done
by the economist Angus Maddison (I exclude Communist economies and Persian Gulf oil
producers as special cases, leaving 125 observations). We rank countries according to their per
capita income in 1950. Did the poorest countries remain stuck in poverty over the next half
century? The poorest fifth of countries in 1950 increased their income over the next five decades
by a factor of 2.25 times. The other four-fifths of countries increased their incomes by a factor of
2.47 times. The difference in growth rates between the two groups is not statistically significant
(Table 1). We can reject that the growth rate of the poorest countries as a group was zero.

16
Table 1: Testing Absolute Poverty Trap: Per capita growth rates by Quintile of Initial Income in each period
1950-2001
1950-75
1975-2001
1985-2001
Regression 1: Regression of log change in income per capita on dummy for poorest quintile compared to all others Dummy for poorest quintile (difference in per capita growth rate from upper 4 quintiles) -0.002 -0.005 -0.001 -0.014 std error 0.0043 0.0029 0.0042 0.0047 t-stat -0.46 -1.74 -0.24 -3.00Constant (per capita growth of upper 4 quintiles) 0.017 0.025 0.011 0.013 std error 0.0014 0.0017 0.0021 0.0024 t-stat 12.25 15.19 5.17 5.38Observations 6375 3125 3250 2000Countries 125 125 125 125R-squared 0.000 0.000 0.000 0.010
Reject stationary income for poorest fifth Yes Yes Yes YesFail to reject nonstationary income for poorest fifth Yes Yes Yes Yes
Regression 2: Regression of log change in income per on dummies for poorest to richest quintiles (no constant term) Quintile measured at beginning of sample period:
1950-2001
1950-75
1975-2001
1985-2001
Bottom Quintile growth rate 0.016 0.020 0.010 -0.001 std error 0.0033 0.0024 0.0047 0.0045 t-stat 4.82 8.24 2.13 -0.22Second from Bottom Quintile growth rate 0.015 0.024 0.001 0.010 std error 0.0034 0.0040 -0.0067 -0.0069 t-stat 4.40 6.00 -0.15 -1.44Middle Quintile growth rate 0.009 0.015 0.012 0.007 std error 0.0023 0.0024 0.0045 0.0041 t-stat 3.98 6.32 2.64 1.69Second from Top Quintile growth rate 0.023 0.031 0.015 0.015 std error 0.0025 0.0030 0.0038 0.0044 t-stat 9.20 10.2 3.94 3.41Top Quintile growth rate 0.022 0.029 0.016 0.021 std error 0.0019 0.0024 0.0027 0.0022 t-stat 11.72 11.92 5.83 9.62Observations 6375 3125 3250 2000Countries 125 125 125 125R-squared 0.10 0.20 0.04 0.05
Robust heteroskedacity-consistent t statistics (with standard errors clustered by country)Source for per capita income data: Maddison (2003)

17To be sure, there were individual poor countries that failed to grow among the poorest
countries. Chad had zero growth from 1950 to 2001. Zaire/Democratic Republic of the Congo
actually had negative per capita growth over this period. However, this is offset by such success
stories as Botswana, which was the fourth poorest in 1950, but increased its income by a factor of
13 by 2001. Lesotho was the fifth poorest in 1950, but increased its income by a factor of 5 over
the half-century. Other subsequent success stories who were among the poorest in 1950 are China
and India.
Breaking out the growth rates by quintiles gives us further detail as to why the poverty
trap hypothesis is not confirmed. The highest growth rates are with the top two quintiles, which is
in the spirit of the poverty trap. However, we see that the poorest growth performance is not with
the bottom quintile, but actually with the middle quintile. The difference between the bottom two
quintiles and the top two quintiles is not significant, while the difference between the middle
quintile and the top two quintiles is significant. This pattern could accommodate some more
complex story of a poverty trap that would explain why the top two quintiles do best, the middle
does worst, and the bottom two in between. However, the simple version of the low income
poverty trap that has recently regained favor in the aid community is not consistent with this
pattern.
There are further statistical tests we can do to assess the (absolute) poverty trap
hypothesis. If the poverty trap hypothesis holds, then the poorest countries’ log per capita
incomes should be stationary. Income will fluctuate randomly around this level, but will always
tend to return to it. There are two ways we can test the hypothesis of stationarity (assuming zero
trend) in the panel data on log per capita incomes. We can have stationarity as the null hypothesis
and see whether the data reject the null (the Hadri (2000) test), or we can have non-stationarity as
the null hypothesis and see whether the data fail to reject non-stationarity (the Im-Pesaran-Shin
(2002) test). When we do a test for the stationarity of income over the subsequent half century for
the poorest fifth of countries in 1950, we decisively reject the null hypothesis of stationarity.

18
When we take non-stationarity to be the null, the data provide no evidence against that
hypothesis.19
Let us keep looking for confirmation of the two main predictions of the absolute poverty
trap story: (1) that growth of the poorest countries is lower than other countries, and (2) per capita
growth of the poorest countries is zero. The poorest did have lower growth in an earlier period,
1950-75, than the others, although the difference is only significant at the 10 percent level.
Moreover, this was not an absolute poverty trap, as average growth of the poorest during 1950-75
was still a very healthy 1.9 percent per year (roughly the same as the long-run growth rate of the
American economy, for example).There is still no evidence of lower growth for the poorest
countries for 1975-2001. The poorest fifth of countries at the beginning of this period had growth
performance over the subsequent period that was statistically indistinguishable from the other
four-fifths of countries. Only when the starting point is put in 1985 does there finally appear
evidence that the poorest did worse.
The evidence that Jeffrey Sachs adduces for the poverty trap in The End of Poverty is from
this later period. So over 1985 to the present, it is true that the poorest fifth of countries have
significantly lower per capita growth than other countries, about 1.1 percentage points lower over.
However, it doesn’t help the poverty trap story that 11 out of the 28 poorest countries in 1985 had
NOT been in the poorest fifth back in 1950, which contradicts the idea of some immobile poverty trap
that keeps the same countries stuck in the same position.
Breaking the growth rates down by income quintile is again illuminating. For the period
1985-2001, we also fail to reject that the growth rates of the next to last and middle quintiles are
zero. The growth rates of the third and fourth quintiles are higher in magnitude than the bottom
quintile in this period, but the difference is not statistically significant. Again, the story is more
complicated than the classical aid narrative of the least developed countries being stuck in a
poverty trap.
19 Since the test assumed zero trend, the rejection of the null hypothesis does not rule out trend stationarity. Hence, “nonstationarity” here is only by comparision with a income process that is stationary around a constant mean. Nonstationarity could also result from having a random walk with zero drift, as opposed to a positive trend. However, the poverty trap hypothesis predicts reversion to a constant (the subsistence poverty level), and so would be inconsistent with a random walk with zero drift.

19
Perhaps it was because there was aid for the bottom quintile that enabled the poorest
countries to escape the poverty trap for various parts of the period (and the whole period)? Table
2 explores this possibility by dividing the bottom quintile in two between the half with the highest
aid and the other half with the lowest.20 There is no significant difference in growth rates between
the two groups, despite average aid as percent of GDP being two to five times larger in the top
group. The low aid countries in the poorest quintile had no trouble registering positive growth for
the whole period 1950-2001 and in the period 1950-75. As just noted, the bottom quintile (like
the middle and second to bottom quintiles) had worse growth in more recent periods, possibly
consistent with a poverty trap. However, this was the period in which the poorest countries had
much higher aid, which should have made a poverty trap less likely according to the standard
narrative. While possibly reflecting reverse causality from poor growth to higher aid (which was
addressed by the literature on aid and growth mentioned above), the stylized facts are not
consistent with a low income poverty trap due to insufficient aid.
20 This involved some data construction, since the World Development Indicators have complete data on aid for the bottom quintile (the few aid observations missing can usually be interpreted as representing zero aid) but not on GDP. I used the Maddison per capita GDP numbers and population numbers to impute GDP for missing observations in WDI. Since the Maddison numbers are PPP, I used GDP in nominal dollars and PPP for that country in the year for which both were available in WDI closest to the sample period to convert the imputed Maddision number from PPP to nominal dollars.

20
Table 2: Per capita growth rates in bottom quintile of countries in each period depending on whether aid is above or below median
1950-75 1975-2001
1985-2001
1950-2001
Average growth rate in countries with aid/GDP below median 0.017 0.014 -0.001 0.015Standard errors 0.0034 0.0073 0.0059 0.0049 t-statistics (5.02)** (1.93) (-0.17) (3.07)**Difference between average growth rate in countries with aid/GDP above from average growth rate in countries with aid/GDP below median 0.006 -0.010 0.001 0.001Standard errors 0.0047 0.0090 0.0100 0.0083 t-statistic (1.27) (-1.11) (-0.10) (0.12)Observations 625 650 400 1275Countries 25 25 25 25R-squared 0.00 0.01 0.00 0.00Robust t statistics in parentheses, clustered standard errors by country * significant at 5%; ** significant at 1% Average Aid/GDP ratios in two groups (data start in 1960): Aid/GDP average for below median group for bottom quintile 2.1 6.0 9.7 7.5Aid/GDP average for above median group for bottom quintile 11.2 17.2 22.5 21.3Note: average for 1950-2001 does not equal average for 1950-75 and 1975-2001 because the bottom quintile in 1975 includes a different group of countries than in 1950. Averages shown for 1950-2001 refer to those countries in the bottom quintile in 1950. Source for per capita income: Maddison (2003). Source for aid: World Development Indicators, World Bank
I did a similar exercise with the stationarity tests. When I break the sample in half into
those poor countries that had above median foreign aid and below median foreign aid, I find
identical results on non-stationarity 1950-2001 in both halves as with the above tests. Poor
countries without aid had enough positive growth to reject the poverty trap hypothesis. Again, the
evidence for an aid-induced escape from poverty is less than overwhelming.
Research by Ricardo Hausmann, Lant Pritchett, and Dani Rodrik in 2005 studied “growth
accelerations,” episodes over 1950 to 2000 in which per capita growth rose by at least two percentage
points for at least 8 years. (These are not the same as “takeoffs”, to be studied later in this paper,
because these authors show that most growth accelerations are not sustained.) According to the
poverty trap hypothesis, we should not expect to see these growth accelerations for the poorest

21
countries. However, Hausmann and co-authors found the opposite: growth accelerations were more
likely in the poorest quarter of the sample than for any other group. As in my findings above, they
found the poorest countries did better in earlier than in later periods.21 Out of six sustained growth
accelerations from the bottom rung of the sample (the bottom 20 percent of per capita incomes, with
date of acceleration in parentheses) – Uganda (1989), Congo-Brazzaville (1969), Indonesia (1967),
Thailand (1957), China (1978), and Pakistan (1979)– only one of them (Uganda) involved an above-
average amount of aid at the time of the growth acceleration.
Another robustness check on these results is to consider the role of terms of trade changes. An
economy where production is stagnant could still grow through an improvement in the terms of trade
– perhaps there was a poverty trap masked by improving terms of trade? The next exercise is to redo
the regressions of growth on quintile dummies of Table 1, but now controlling for terms of trade
growth in each country and in each year. Terms of trade changes have a significant effect on growth in
the period 1950-2001 and 1950-75, but not in the sub-periods after 1975 and 1985. Controlling for
terms of trade changes does not change the qualitative conclusions derived from Table 1 (results
available in an unpublished appendix on the author’s web site). What’s more, terms of trade growth
was actually negative for the bottom quintile in all the periods in Table 1.22
Relative poverty traps?
The version of the neoclassical model in which all countries grow at the same rate as the
technological frontier allows the possibility of relative poverty traps, as discussed above. Is there
evidence for such traps? Table 3 shows the average annual change in the log of the ratio of countries’
per capita income to US per capita income, again breaking out by initial income quintile. (The US was
the richest country for most of the period (occasionally supplanted by Switzerland), and thus is a
reasonable proxy for the technological frontier. Table 3 is mechanically related to Table 1 in that all
coefficients simply have the US growth rate for the corresponding period subtracted. The standard
errors of all coefficients are the same as the corresponding entries in Table 1, and are not shown. The
21 Hausmann, Pritchett, and Rodrik 2005 22 The terms of trade data are from World Development Indicators, the data begin in 1961 and have spotty coverage, so significantly reduce the sample. Compared to Table 1, the bottom quintile has lower growth rates – but still positive and significant except in the later periods –controlling for terms of trade than without this control. However, this turns out to be not because of terms of trade effects, but because of the different sample (which I checked by running the regressions without the terms of trade control on the terms of trade sample). More terms of trade is available in later periods, so the sample for each sub-period is shifted towards the later dates, when as already noted, growth performance of poor countries is worse.

22results on differences between growth rates of different quintiles are also mechanically the same as
in Table 1. However, I show Table 3 in this form for ease of seeing whether there is evidence of
relative poverty traps, i.e. whether the growth rates for the poorest countries relative to the
technological frontier are differentially likely to be zero or negative.
The results indicate that the poorest quintile show no significant tendency to fall further
behind the leaders for the whole period 1950-2001 or for the sub-period 1950-1975. For the periods
1975-2001 and 1985-2001, the poorest quintile does have significantly negative growth of income
relative to the technological frontier, which could support the idea of a poverty trap. The result for
1975-2001 and that for 1950-2001 may seem inconsistent, until we remember again that the countries
in the poorest quintile in 1975 are not the same as those that were in it in 1950. However, the idea of a
low income relative poverty trap after 1975 is weakened again by similar results in the next to last and
middle quintiles. While the lowest quintile has the lowest relative growth rate in 1985-2001, it is the
bottom to last that has the lowest relative growth in 1975-2001. The most robust evidence for poor
performance in terms of statistical significance is in the middle quintile, which is falling further
behind the leader in every period. This contradicts the simple predictions of the low income poverty
trap model, both in relative and in absolute terms.
If we take a negative coefficient, even if not significantly different than zero, as a sign of a
relative poverty trap, then the bottom quintile would meet this definition – but so would all the other
quintiles (excluding the USA leader)– the only exception is 1950-75, when the top two quintiles were
overtaking the U.S. Rather than a low income relative poverty trap, the general pattern in Table 2
instead is yet another confirmation of the nearly universal finding of the large convergence literature –
there is no tendency towards absolute convergence. The usual interpretation of this in the neoclassical
model is that each country has a separate steady state.

23
Table 3: Testing Relative Poverty Trap: Relative growth rates by Quintile of Initial Income in Each Period
1950-2001
1950-75
1975-2001
1985-2001
Regression 1: Regression of log change in income per capita ratio to US income per capita on dummy for poorest quintile compared to all others Dummy for poorest quintile (difference from upper 4 quintiles) -0.002 -0.005 -0.001 -0.014 t-stat -0.45 -1.74 -0.22 -2.98Constant -0.004 0.004 -0.010 -0.005 t-stat 2.54 2.21 -4.8 -2.18Memo: Growth rate of poorest quintile -0.006 -0.001 -0.011 -0.019 t-stat -1.35 -0.348 -2.42 -4.04Observations 6324 3100 3224 1984Countries 124 124 124 124R-squared 0.00 0.00 0.00 0.01
Regression 2: Regression of log change in income per capita ratio to US income per capita on dummies for poorest to richest quintiles measured in initial year of sample
Quintile measured at beginning of sample period: 1950-2001
1950-75
1975-2001
1985-2001
Bottom -0.005 -0.001 -0.011 -0.020 t-stat -1.60 -0.60 -2.48 -4.86Second from Bottom -0.006 0.003 -0.020 -0.008 t-stat -1.70 -0.64 -4.19 -1.16Middle -0.012 -0.006 -0.009 -0.011 t-stat -5.18 -2.42 -2.11 -2.68Second from Top 0.002 0.010 -0.006 -0.004 t-stat -0.93 3.27 -1.57 -0.86Top 0.001 0.008 -0.005 0.002 t-stat -0.51 3.24 -1.74 -0.92Observations 6324 3100 3224 1984Countries 124 124 124 124R-squared 0.01 0.01 0.04 0.04Heteroskedacticity-Robust t-statistics (using clustered standard errors) Source for per capita income data: Maddison (2003)
To bend over backwards to consider any possible evidence for a poverty trap, it is noticeable
in Table 3 that the signs on relative income growth tend to be negative in the bottom 3 quintiles, while
they are usually positive in the top two quintiles – actually indicating some absolute divergence.
Although these negative and positive magnitudes are not robustly significant for the whole period, the
pattern could be consistent with a poverty trap encompassing the bottom 3 quintiles (and the negatives
are significant in the second half of the period). This is already different than the classic narrative’s

24
idea of a poverty trap for the poorest countries (the middle quintile includes, for example, such
relatively well-developed countries as Egypt, Korea, Malaysia, Morocco, Thailand, and Tunisia in
1975), but the paper will consider it further nevertheless. In particular, the paper will consider next if
the positive association of growth with lower income reflects the lower income itself, or bad
government correlated with low income.
Are well-governed countries in poverty traps?
There is a vast literature on determinants of growth, some of it stressing quality of
government policies and institutions as a determinant of growth. This section doesn’t seek to make a
new contribution to this literature, but only to test another piece of the classic aid narrative. Its
proponents say that “many reasonably well governed countries are too poor to make the investments
to climb the first steps of the ladder.”23 I test only this precise statement, not more general hypotheses
about growth or government, by running a regression of growth on initial income and various
measures of how “well-governed” are countries in the modern data.
I use three widely used measures of government quality: (1) the Polity IV measure of
democracy, averaged over 1960-2002), (2) the Freedom House measure of political liberties (with the
sign reversed, since an increase in this measure means less liberty), averaged over all available years,
which are 1972-2002, and (3) Economic Freedom in the World from the Fraser Institute, averaged
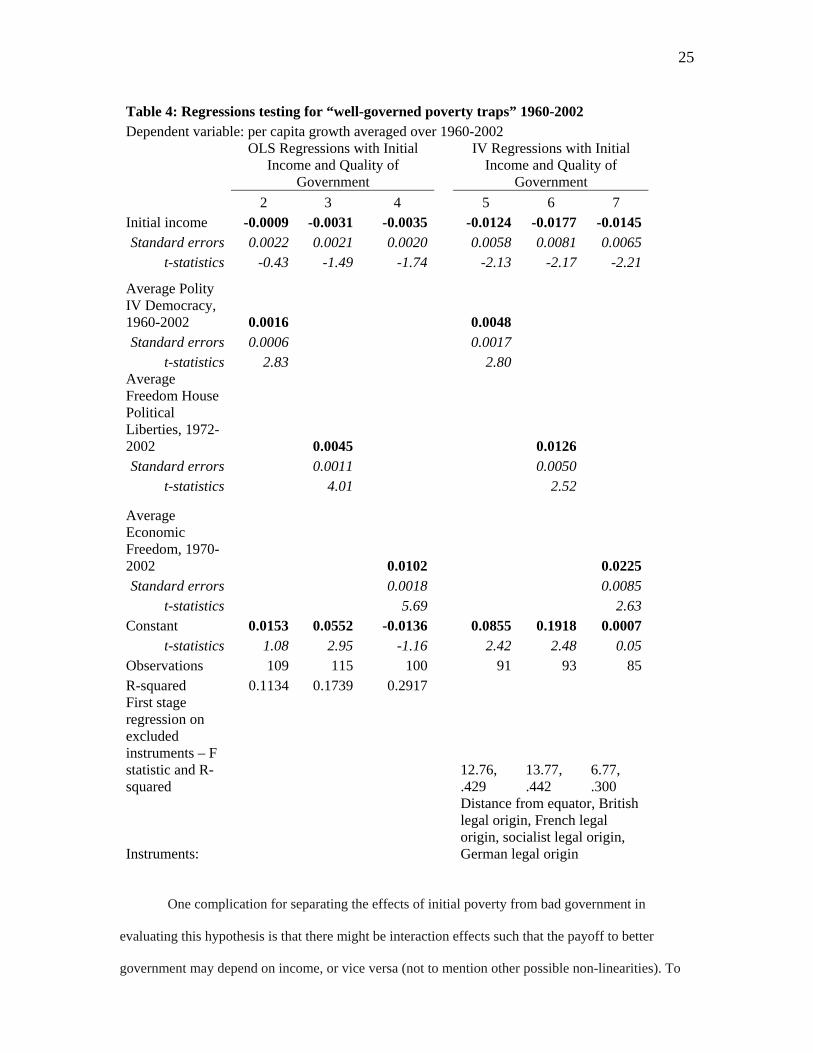
over all available years, which are 1970-2002. Table 4 shows that all measures of government quality
are strongly significant predictors of growth 1960-2002, and actually make initial income negative in
the regressions (significantly so in the IV regressions). This result is not consistent with the prediction
that well-governed poor states will have low growth rates. The result is consistent with the large
literature (mentioned earlier) which finds conditional convergence.
23 UN Millennium Project 2005, p. 34.
25
Table 4: Regressions testing for “well-governed poverty traps” 1960-2002 Dependent variable: per capita growth averaged over 1960-2002
OLS Regressions with Initial Income and Quality of
Government
IV Regressions with Initial Income and Quality of
Government 2 3 4 5 6 7 Initial income -0.0009 -0.0031 -0.0035 -0.0124 -0.0177 -0.0145 Standard errors 0.0022 0.0021 0.0020 0.0058 0.0081 0.0065
t-statistics -0.43 -1.49 -1.74 -2.13 -2.17 -2.21
Average Polity IV Democracy, 1960-2002 0.0016 0.0048 Standard errors 0.0006 0.0017
t-statistics 2.83 2.80 Average Freedom House Political Liberties, 1972-2002 0.0045 0.0126 Standard errors 0.0011 0.0050
t-statistics 4.01 2.52
Average Economic Freedom, 1970-2002 0.0102 0.0225 Standard errors 0.0018 0.0085
t-statistics 5.69 2.63 Constant 0.0153 0.0552 -0.0136 0.0855 0.1918 0.0007
t-statistics 1.08 2.95 -1.16 2.42 2.48 0.05 Observations 109 115 100 91 93 85 R-squared 0.1134 0.1739 0.2917 First stage regression on excluded instruments – F statistic and R-squared
12.76, .429
13.77, .442
6.77, .300
Instruments:
Distance from equator, British legal origin, French legal origin, socialist legal origin, German legal origin
One complication for separating the effects of initial poverty from bad government in
evaluating this hypothesis is that there might be interaction effects such that the payoff to better
government may depend on income, or vice versa (not to mention other possible non-linearities). To

26consider such a possibility, I do some simple non-parametric tests. I divide the sample into upper
and lower halves of good government (according to the various measures) and upper and lower halves
of initial income, and then consider average per capita growth in the four groups: low income and
poor government, low income and good government, high income and poor government, and high
income and good government. Figure 1 illustrates the results.
Low
High
Low
High
0
0.005
0.01
0.015
0.02
0.025
Per capita growth
Initial income
Economic freedom
Figure 1: Economic growth, Economic Freedom, and Initial Income, 1960-2002
Economic growth increases with more economic freedom over 1960-2002 at both low and
high income (the differences are statistically significant at the 5% level). Growth increases with more
income at low economic freedom (but the difference is not statistically significant even at the 10%
level), but decreases slightly at high economic freedom.
I repeated the exercise with the Polity IV measure of democracy. The results for 1960-2002
are different than with economic freedom: growth increases with either high income or high
democracy compared to the growth rate at low democracy and low income. There is still no evidence
in this latter result for the cell with high democracy and high income to have higher growth than the
off-diagonal cell with only high democracy but low income, as the well-governed poverty trap idea
would predict.

27For another non-parametric test, I go back to the 1985-2001 period, where there was
evidence of differential and zero growth in the poorest countries. Let us test in this sample a dummy
for bad government against the initial poverty dummy as a story for poor economic growth. The
earliest rating we have on corruption is from 1984, from the International Country Risk Guide. We
have a measure of democracy in 1984 from Polity IV. Let’s take countries that have the worst ratings
on both corruption and democracy in 1984, and call these countries “bad governments.” While poor
countries did worse, it’s also true that the 24 countries with the worst governments (in the bottom
quartile of both measures) in 1984 had significantly lower growth 1985 to the present: 1.3 percentage
points slower than the rest. There is some overlap between these two stories, as poor countries are
much more likely to have bad government. So are there enough well-governed poor countries with
low or zero growth to confirm the poverty trap? When we control for both initial poverty and initial
bad government, it is bad government that is significant while initial poverty is not. We cannot
statistically discern any effect of initial poverty on subsequent growth once we control for bad
government. This is still true if we limit the definition of bad government to corruption alone. (The
use of initial bad government somewhat mitigates, but is far short of eliminating, the endogeneity of
bad government – however the linear regressions did address endogeneity concerns.) The recent
stagnation of the poorest countries appears to have more to do with bad government than with a
poverty trap, contrary to the “well-governed poverty trap” hypothesis.
In sum, the non-parametric tests give somewhat mixed results, and we must be careful about
whether the “initial income” and “bad government” effects are really separable. Moreover, there could
be plenty of other initial conditions that could cause a country to be in the more general kind of
poverty trap discussed in the current literature – such as high initial land inequality (Galor, Moav, and
Vollrath 2003) – but this is a different story than the classic aid narrative (and the precise hypothesis
that this section tests). The conventional IV linear regression results from Table 4 say good
government robustly predicts higher growth, while higher income predicts lower growth. This does
not necessarily support an exclusive focus on good government as the key to growth and development,
but it does contradicts the specific hypothesis that “reasonably well governed countries” are stuck in a
trap just because they are poor.

28Testing for takeoffs The other staple of the classic narrative is that the Big Push will enable countries to break
out of the stagnant poverty trap into self-sustained growth. As the Big Push increases the capital
stock, consumers will rise above subsistence enabling them to save more. The increasing returns
to capital will be realized, allowing future investment to have attractive returns. This means aid
will only be needed temporarily, as it can be discontinued once self-sustained growth takes hold.
Rostow (1960) popularized the term “takeoff” for this transition; he identified specific dates that
takeoffs had begun in various countries. A similar concept recurs in the latest generation of Big
Push ideas. Rostow suggested aid could be discontinued after 10-15 years in 1960; Sachs today
talks about aid being discontinued in 2025. The prediction about growth is that a poor country
with a successful Big Push will move from a regime of zero per capita growth to a regime of
stable positive per capita growth.
There are many conceivable definitions of takeoffs. The one I am examining is only the
one from the classic aid narrative: a country that permanently shifts from per capita growth
around zero to stable positive per capita growth. I will first use some arbitrary mechanical rules to
detect takeoffs, and then I will use a more formal statistical procedure.
I arbitrarily take per capita growth that lies in the interval [-0.5%,0.5%] to be “zero
growth”, and define as stable positive per capita growth any subsequent growth that stays above
1.5 percent per year, measured over suitably long periods. The takeoff definition excludes cases
in which high positive per capita growth is preceded by negative growth (below -0.5 percent),
because part of the growth will simply be recovery to a previous level. To capture the idea of a
sudden takeoff, I also require that the shift be in adjacent periods. This is obviously sensitive to
the length of the period and the breakpoints for the periods. I try to define long enough periods to
allow for some time for takeoff to happen, and the breakpoints are given exogenously by the
years when the Angus Maddison (2003) dataset reports observations for a large number of
countries. After 1950, Maddison reports annual data through 2001. For rich countries, I used 1960
instead of 1950 as the last breakpoint because many European countries and Japan had artificially
low postwar output in 1950.

29Table 5 shows that only one of today’s rich countries meet this definition of “take-
off”. This is the famous Japan take-off during the Meiji era. As already noted, there was
undoubtedly a takeoff in the very long run in rich countries, in that they had stagnation for
centuries, and now have had positive per capita growth for many decades. However, the
acceleration of growth was much more gradual than what today’s notions of a takeoff seem to
expect for the poorest countries. For example, the examples given in the introduction are aiming
at a growth acceleration of as much as 5-6 percentage points for Africa. Even allowing for some
rhetorical exaggeration, an environment in which such statements could be made at all seems to
be one that expects abrupt, rapid takeoffs.
Historically, in all rich countries besides Japan, we have gradual acceleration of growth
rather than this kind of abrupt takeoff. Growth slowly accelerated from a median value of 0.2
percent in 1600-1820 to 0.8 percent in 1820-1870, 1.3 percent in 1870-1913, 1.6 percent in 1913-
1960, to 2.8 percent in 1960-2001. This is not very consistent with a Big Push notion of a sudden
switch from stagnation to vigorous growth. The medians could smooth out variations in
individual countries, but examining the latter does not find much in the way of dramatic shifts
either. The closest approximations would seem to be in the late industrializers Ireland, Greece,
Portugal, and Spain. The latter four did have a dramatic acceleration of growth after 1960.
However, the growth in these four countries was not zero prior to the growth shift, as required by
the takeoff hypothesis. Even in Japan, the takeoff featured a smooth acceleration of growth rather
than a one time movement from zero growth to constant positive growth.
Is the definition of “zero growth” prior to the takeoff too stringent? A 0.5 percent per
capita growth rate cumulates to a 28 percent increase in income over 50 years and 65 percent
change over 100 years. It seems hard to argue that requiring annual per capita growth be below
this threshold to be counted as zero growth is overly stringent. Likewise, the requirement that
growth surpass 1.5 percent to be counted as a takeoff seems like a modest requirement. The
median growth rate of rich countries 1820 to 2001 is 1.6 percent, with very tight clustering of
growth rates around this median. This seems like as good a definition as any of a minimum
“normal” growth rate for a country that has “taken off.” Moreover, the movement from 0.5 to 1.5

30Table 5: Take-offs in rich countries (per capita growth from Maddison 2003)
1600-1700 1700-1820 1820-1870 1870-1913 1913-1960 1960-2001
1820-2001
Australia 3.7% 0.9% 1.1% 1.8% 2.1%Austria 0.2% 0.2% 0.8% 1.4% 1.3% 2.8% 1.6%Belgium 0.2% 0.1% 1.4% 1.0% 1.1% 2.7% 1.5%Canada 0.6% 1.3% 2.2% 1.4% 2.3% 1.6%Denmark 0.2% 0.2% 0.9% 1.6% 1.7% 2.4% 1.8%Finland 0.2% 0.2% 0.8% 1.4% 2.3% 2.9% 1.6%France 0.1% 0.2% 1.0% 1.4% 1.6% 2.5% 1.6%Germany 0.1% 0.1% 1.1% 1.6% 1.6% 2.2% 1.6%Greece 0.1% 0.2% 0.6% 1.4% 1.4% 3.4% 1.8%Ireland 0.2% 0.2% 1.4% 1.0% 1.0% 4.1% 1.6%Italy 0.0% 0.0% 0.6% 1.2% 1.8% 2.9% 1.9%Japan 0.1% 0.1% 0.2% 1.5% 2.2% 4.0% 1.4%Netherlands 0.4% -0.1% 0.8% 0.9% 1.5% 2.4% 1.7%New Zealand 1.2% 1.4% 1.2% Norway 0.2% 0.2% 0.5% 1.3% 2.3% 3.0% 1.5%Portugal 0.1% 0.1% 0.1% 0.6% 1.8% 3.8% 1.5%Spain 0.0% 0.1% 0.4% 1.2% 0.9% 4.0% 1.6%Sweden 0.2% 0.2% 0.7% 1.4% 2.2% 2.1% 1.7%United Kingdom 0.2% 0.3% 1.3% 1.0% 1.2% 2.1% 1.4%United States 0.7% 1.3% 1.8% 1.5% 2.3% 1.7%median growth of rich countries 0.2% 0.2% 0.8% 1.3% 1.6% 2.7% 1.6%
is requiring a permanent change in growth of only 1 percentage point, which seems modest
compared to the expectations of enthusiasts for the “Big Push.”
Unfortunately, the patterns of growth in developing countries in the long run are even
less supportive of the “take-off” concept. As Pritchett (2000) pointed out, the shape of various
developing countries log per capita income paths vary as “hills, plateaus, mountains, and plains”
in which there are unpredictable sequences of zero, positive, and negative growth. Easterly,
Kremer, Pritchett, and Summers (1993) pointed out the instability of growth, with a very low
correlation between who is growing in one period (measured as a decade, 15 years, 20 years, etc.)
and who is growing in the following period. If takeoffs dominated the data then we would expect
a stronger cross-period correlation as most countries would be in stable zero growth or positive
growth regimes, with only a few switchovers for those who began takeoffs in between the two
periods.

31 Table 6 shows data since 1820 for all developing regions from Maddison (2003). Since
developing countries were not so directly affected by World War II, I use 1950 as a breakpoint
(the breakpoints are again determined when data is available in Maddison for years prior to
1950). I take advantage of the longer post-war period to split it into two periods divided by 1975.
It seems desirable to look at finer recent intervals for developing countries because the takeoffs
would presumably be more recent. I first examine data on developing country regions:
Table 6: Looking for take-offs in developing country regions (per capita growth rates from Maddison 2003)
Region 1820-1870 1870-1913 1913-1950
1950-1975
1975-2001
Africa 0.3% 0.6% 0.9% 1.8% 0.2%Caribbean countries (24) -0.3% 1.8% 1.4% 3.2% 1.0%East Asian countries (16 ) -0.1% 0.5% -0.1% 3.5% 3.4%East European Countries (7) 0.6% 1.4% 0.6% 3.7% 0.4%Latin America 0.0% 1.8% 1.4% 2.5% 0.8%West Asian countries (15) 0.4% 0.9% 1.3% 4.4% 0.2%
Only the East Asia region meets the definition of takeoff proposed above, since all the other
regions had growth dip below 1.5 percent in the period 1975-2001. Apparently growth was not so
“self-sustaining.” Latin America and the Caribbean also had already had an earlier proto-takeoff
period in 1870-1913, but failed to sustain it.
Looking at individual countries, Maddison has 44 developing countries with data
available at least as early as 1913. Table 7 shows that five out of the 44 meet the definition of
takeoff, using the same periodization as above. The takeoffs (indicated with *, with periods of
takeoff shown in bold) are all well-known examples of success. The other 39 countries fail to
meet the criteria of takeoff of going from zero growth (between -0.5 percent and 0.5 percent) to
sustained positive growth (above 1.5 percent). The others did not meet the definition either
because growth did not stay above 1.5 percent after “take-off” (the most common reason), or
because growth was above 0.5 percent prior to the takeoff. Alas any mechanical rule will
inevitably be arbitrary, but the virtue of a mechanical rule is that one is not subjectively altering
the thresholds to search for pre-conceived takeoffs.

32
I settled on this rule a priori and did not experiment with alternative rules. I will
however do one robustness check – suppose that we allow pre-takeoff growth to be between -1
and +1 percent, and still I require post-takeoff growth to permanently increase by 1 percentage
point (so now it must be above 2 percent). This adds 4 new takeoffs which will meet many
observers’ priors as having had a takeoff – China, Indonesia, Taiwan, and Vietnam (shown with
** in the table). However, three of the five original takeoffs no longer qualify – Hong Kong,
India, and Singapore all have intermediate way-stations of 1.5 percent growth, showing gradual
acceleration of growth rather than takeoff according to the new criteria. So according to the new
rules, there are six takeoffs in the data out of 44 countries.
The other striking thing about these takeoffs is that they are all happening in a
geographically concentrated region, amongst countries that have traditional ties with each other.
This seems to make them less than fully independent observations, and raises the question of
what could account for the spatial concentration.
In sum, the episode analysis here examined the experience of 127 countries and found 9
takeoffs (according to two different definitions that are not consistent). To put it another way, the
contemporary and historical exercises for poor and rich countries together included 71 countries
that passed from an income of below $2000 (an arbitrary breakpoint for low income) to an
income above $2000 over some period. Excluding one takeoff that is still below $2000 as of 2001
(India), 8 out of 71 countries emerging out of low income status did so by means of a takeoff
according to one definition or the other. This is not a very strong case for the hypothesis that
development usually happens through abrupt and sustained takeoffs.24
24 Pritchett (2000) did not explicitly set out to test for takeoffs, but he did look for structural breaks in growth rates in a way similar to what I am doing. Using PWT 5.6 data for 111 countries, he found 7 cases he called “Denver” (where the plains meet the Rocky Mountains), which are closely analogous to “takeoffs”. His methodology was to look for cases where growth was below 1.5 percent prior to a structural break and then above 1.5 percent after the break. The 7 cases were India, Sri Lanka, Indonesia, Chile, Uruguay, Ghana, and Mauritius. The different sample period and methodology explain different country selections, but the general result that few countries fit the pattern of “take-offs” is robust across my study and his.

33
Table 7: Per capita growth and Takeoffs in historical data among developing countries
1820-1870
1870-1913
1913-1950
1950-1975
1975-2001 takeoff
Albania 1.4% 0.6% 3.3% 0.8% Algeria 1.0% 1.1% 0.4% 2.5% 0.4% Argentina 2.5% 0.7% 2.0% 0.0% Brazil 0.2% 0.3% 2.0% 3.7% 1.1% Bulgaria 1.4% 0.2% 5.0% -0.1% Burma 0.0% 0.7% -1.5% 2.1% 2.9% Chile 2.4% 1.0% 0.5% 3.2% China -0.2% 0.1% -0.6% 2.8% 5.4% ** Colombia 1.8% 1.5% 2.1% 1.3% Czechoslovakia 0.6% 1.4% 1.4% 3.0% 0.7% Egypt 0.6% 0.8% 0.0% 1.8% 2.9% Ghana 1.3% 1.0% 0.4% 0.2% Hong Kong 0.2% 1.5% 1.5% 4.6% 4.3% * Hungary 1.5% 0.5% 3.4% 1.0% India 0.0% 0.5% -0.2% 1.5% 3.0% * Indonesia 0.1% 0.8% -0.2% 2.3% 3.0% ** Iran 0.4% 0.8% 1.5% 4.9% -0.7% Iraq 0.4% 0.8% 0.8% 4.6% -4.6% Jamaica -0.5% 0.3% 2.1% 4.3% -0.2% Jordan 0.4% 0.8% 1.4% 1.8% 1.7% Lebanon 0.5% 1.1% 1.6% 1.4% 0.0% Malaysia 0.2% 0.7% 1.5% 2.1% 4.1% Mexico -0.2% 2.2% 0.8% 3.1% 1.2% Morocco 0.5% 0.5% 1.9% 0.9% 1.6% Nepal 0.0% 0.7% -0.2% 1.0% 1.8% North Korea 0.0% 0.7% -0.2% 5.2% -3.5% Peru 1.8% 2.1% 2.5% -0.6% Philippines 0.2% 0.7% 0.0% 2.6% 0.7% Poland 1.4% 0.9% 3.5% 1.0% Romania 1.5% -1.0% 4.6% -0.7% Singapore 0.2% 1.5% 1.5% 4.3% 4.6% * South Africa 1.5% 1.5% 1.2% 2.1% -0.1% South Korea 0.0% 0.7% -0.2% 5.7% 5.9% * Sri Lanka 1.1% 0.9% 0.0% 0.8% 3.2% Syria 0.5% 1.1% 1.6% 3.4% 1.2% Taiwan 0.2% 0.7% 0.6% 5.8% 5.4% ** Thailand 0.2% 0.4% -0.1% 3.5% 4.5% * Tunisia 0.8% 0.8% 0.6% 3.1% 2.5% Turkey 0.5% 0.9% 0.8% 3.5% 1.7% Uruguay 1.0% 0.9% 0.6% 1.3% USSR 0.6% 1.1% 1.7% 3.1% -1.1% Venezuela 1.5% 5.2% 1.4% -0.8%

34
Vietnam -0.1% 0.8% -0.3% 0.3% 3.7% ** Yugoslavia 1.3% 1.0% 4.5% -0.4%
Notes to table: data are all from Maddison 2003. All growth rates are for dates shown except for 1870-1913 for Chile, Colombia, and Peru, where the growth rates shown are for 1900-1913 – the earliest data available from Maddison
How do these takeoffs relate to foreign aid? I examine the 8 takeoffs that happened
around 1950-75 according to either definition (to be generous to the takeoff hypothesis, despite
the inconsistency of the two definitions), and collect aid statistics for 1960-75. Aid data on the
1950s is not generally available. I was aware that there had been large US aid programs in the
1950s in South Korea and Taiwan, so further exploration tracked down a source of US aid to
these two countries from 1953 on, which is reflected in the numbers in Table 8.25 Table 8 shows
that the median aid to GDP ratio in the whole developing country sample for this period is 2.8
percent of GDP. Three of the eight takeoffs are above this: Indonesia, South Korea, and Taiwan.
Hence, we could describe these three cases as fitting the pattern of an aid-financed takeoff, with
Korea as the strongest case.26 Of course, this does not necessarily give evidence that aid is
associated with takeoffs, as there were many other countries that got high aid and did NOT have a
takeoff. A probit regression for the probability of takeoff as a function of aid to GNI over 1960-
75 has an insignificant negative coefficient on aid. Moreover, as the paper previously pointed out,
aid has been much higher than this for many countries since 1975 without apparently generating a
takeoff. The lack of systematic association between aid and takeoffs suggests that the high aid
could have coincided by chance with the takeoffs in Indonesia, Korea, and Taiwan.
25 Jacoby 1966 26However, Fox 1999 reviews the case study evidence on foreign aid and Korea, and questions the role of aid in Korea’s rapid growth (which began after US aid declined). Fox summarizes the studies as follows “foreign aid contributed only slightly to the Korean miracle and that rapid growth was due primarily to a combination of domestic factors and a favorable international environment.”

35
Table 8: Takeoffs and aid, 1960-75
Country Name
Foreign aid as a percent of Gross National Income, 1960-75 except where noted
China 0.00Hong Kong 0.11India 1.82Indonesia 3.93Korea, Rep./1 8.39Singapore 0.46Taiwan, China/1 3.75Thailand 0.90Median for whole sample 2.78Source: World Bank World Development Indicators /1 Data refer to average 1953-75
The other sign of a takeoff is supposed to be a large increase in investment as a share of
GDP (part of the definition of the Big Push). I examine only the role of investment in takeoffs,
and not other factors, because of its central role in not only the Big Push but also the poverty
trap– aid was supposed to relieve the poor’s saving constraint that prevented a high enough
investment rate to generate positive per capita growth. Unfortunately, we do not have data giving
investment before 1950, so this prediction is impossible to test directly. I am limited to examining
the contemporary take-off investment in the period 1950-75, as shown in table 9, compared to the
rest of the cross-country sample. I list all countries that met either (inconsistent) criteria for
takeoff. Investment to GDP ratios are undistinguished in China, India, Indonesia, South Korea,
and Taiwan in 1950-75. They are exceptional in Singapore and Hong Kong, and to a lesser degree
in Thailand. If we do a probit regression for who has a takeoff (according to either criteria or
both), investment in 1950-75 is not a significant predictor of these takeoffs. Moreover, Singapore,
Hong Kong, and Thailand received trivial amounts of foreign aid according to Table 10, so even
by themselves do not fit the aid-financed Big Push narrative. In short, there is no case that fits all
parts of the story: high aid, high investment, takeoff.
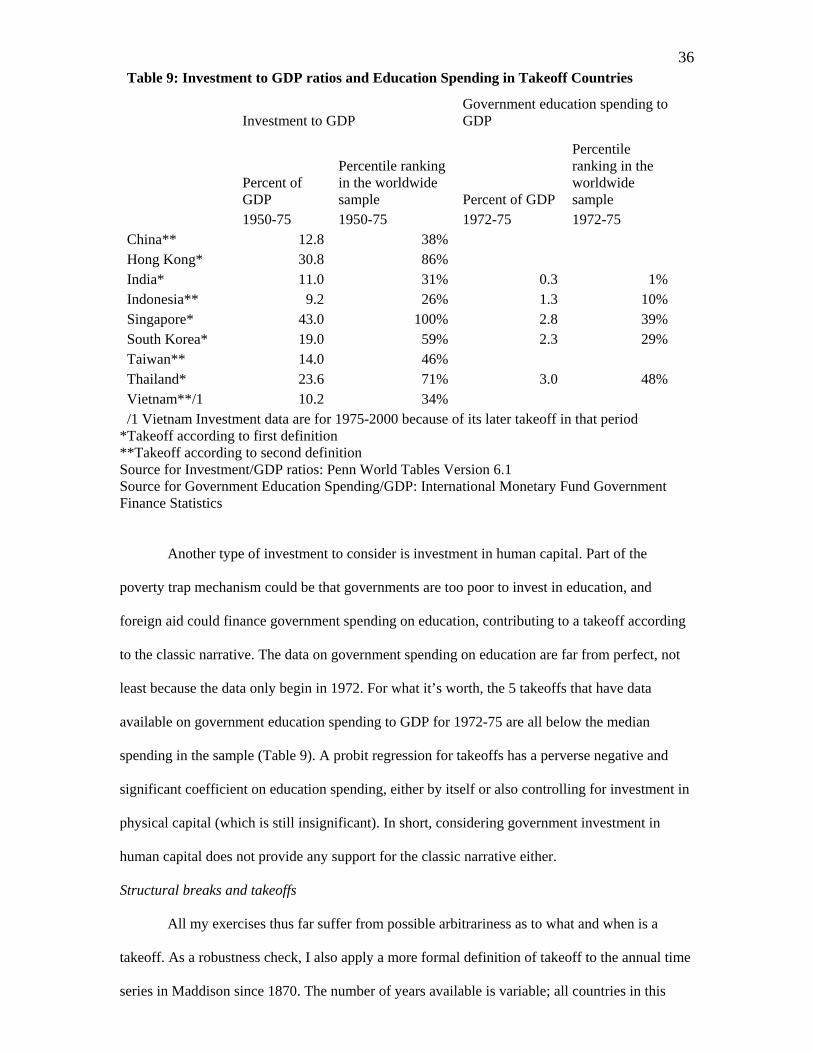
36Table 9: Investment to GDP ratios and Education Spending in Takeoff Countries
Investment to GDP Government education spending to GDP
Percent of GDP
Percentile ranking in the worldwide sample Percent of GDP
Percentile ranking in the worldwide sample
1950-75 1950-75 1972-75 1972-75 China** 12.8 38% Hong Kong* 30.8 86% India* 11.0 31% 0.3 1%Indonesia** 9.2 26% 1.3 10%Singapore* 43.0 100% 2.8 39%South Korea* 19.0 59% 2.3 29%Taiwan** 14.0 46% Thailand* 23.6 71% 3.0 48%Vietnam**/1 10.2 34% /1 Vietnam Investment data are for 1975-2000 because of its later takeoff in that period
*Takeoff according to first definition **Takeoff according to second definition Source for Investment/GDP ratios: Penn World Tables Version 6.1 Source for Government Education Spending/GDP: International Monetary Fund Government Finance Statistics
Another type of investment to consider is investment in human capital. Part of the
poverty trap mechanism could be that governments are too poor to invest in education, and
foreign aid could finance government spending on education, contributing to a takeoff according
to the classic narrative. The data on government spending on education are far from perfect, not
least because the data only begin in 1972. For what it’s worth, the 5 takeoffs that have data
available on government education spending to GDP for 1972-75 are all below the median
spending in the sample (Table 9). A probit regression for takeoffs has a perverse negative and
significant coefficient on education spending, either by itself or also controlling for investment in
physical capital (which is still insignificant). In short, considering government investment in
human capital does not provide any support for the classic narrative either.
Structural breaks and takeoffs
All my exercises thus far suffer from possible arbitrariness as to what and when is a
takeoff. As a robustness check, I also apply a more formal definition of takeoff to the annual time
series in Maddison since 1870. The number of years available is variable; all countries in this

37
sample have observations at least for 1950-2001, and a smaller sample have annual data for
longer periods. The sample with pre-1950 observations is smaller than in my previous use of this
data, because many countries have benchmark observations such as 1870, 1913, and 1950, but
don’t have annual data in between. On the other hand, I am now including countries that only
have data since 1950, which I did not include in the episode analysis above, so this makes the
sample bigger. The net effect is that I have a slightly bigger sample of 139 countries.
I use the Bai and Perron (1996, 2003) method of looking for structural breaks in time
series, in this case the log of per capita income.27 This method endogenously determines the
number of structural breaks in the trend of log income, and the dates of those breaks. The dates of
the breaks are chosen to maximize the fit to the data, and the number of breaks is chosen when
the improvement in fit from adding another break is sufficiently strong. For the minimum length
of a regime segment as a fraction of the sample period, the paper uses .25 for countries with only
post World War II data and .2 for longer time series (imposing a maximum of 2 breaks in the
former and 3 breaks in the latter). Experimenting with a larger number of maximum breaks did
not give different results. The procedure also calculates the statistical significance of the trend in
each sub-period.
My definition of a takeoff using this procedure is straightforward: any country that has a
continuous sequence of regimes of zero growth followed by a continuous sequence of regimes of
positive growth is called a takeoff. The results for 139 countries are available on the author’s web
site. Although the takeoff hypothesis suggests only one break, the procedure found 2 or more
breaks in 109 countries; none of the 30 countries with one break met the takeoff definition. I first
define zero and positive growth by estimated magnitudes as before: zero means lying in the
interval [-0.5 %, 0.5%] while positive means lying above 1.5%. With this definition, there is only
one takeoff in the data --it is Costa Rica (1945). Of the previous takeoffs, China, Hong Kong,
Indonesia, Singapore, and Thailand did not have a continuous historical annual series when the
takeoffs previously shown took place. India, Japan, South Korea, and Taiwan do have a
27 This method is applicable to processes that show trend stationarity. The first section of the paper rejected stationarity with a constant mean for low income countries, but as made clear in an earlier footnote, the results were consistent with possible trend stationarity.

38continuous historical series, but the growth in the earliest periods before the endogenous
breaks is too high for the zero growth definition.
I next try an alternative definition of zero and positive growth based on statistical
significance. I define zero growth simply as growth that is not significantly different than zero,
while positive growth is growth that is significantly above zero. With this statistical significance
definition, Costa Rica again shows up as a takeoff, and Bolivia, Brazil, and Cape Verde are
added, as shown in Table 10:
Table 10: Takeoffs using Bai-Perron structural breaks method
Country Bolivia Brazil Cape Verde Costa Rica
number of observations 57 132 52 82 number of breaks 2 3 2 3 date of first break 1957 1915 1962 1945 date of second break 1980 1941 1978 1964 date of third break 1970 1980 Per capita growth rate regime 1 -0.0005 0.0011 0.0142 0.0021 Per capita growth rate regime 2 0.0204 0.0154 -0.0053 0.0248 Per capita growth rate regime 3 0.0097 0.0292 0.0304 0.0288 Per capita growth rate regime 4 0.0104 0.0203 takeoff year 1957 1915 1978 1945 significantly different than zero at 5 percent levels shown in bold insignificant shown in italics Source for per capita growth: Maddison 2003
Bolivia, Brazil, and Cape Verde all failed to pass the previous criteria because either they had
growth above 0.5 percent prior to takeoff or growth below 1.5 percent after takeoff. The emphasis
on statistical significance rather than magnitude here gives different results. Costa Rica is the
only consistent case that satisfies both takeoff definitions in the Bai-Perron methodology.
This confusing picture of different takeoff countries for different methods shows mainly
that the takeoff is so elusive in the data that it is hard to find countries that robustly show takeoffs
according to what seem like simple, common-sense criteria. (Different data needs for different
methods and uneven data availability also complicate the picture.) What IS robust across all

39methods for defining takeoffs is that the abrupt large takeoffs associated with the classic aid
narrative are uncommon in the data.
Conclusions
The classic aid narrative -- poor countries caught in poverty traps, out of which they need
a Big Push involving increased aid and investment, leading to a takeoff in per capita income -- has
been very influential in recent debates on foreign aid. This was the original justification for
foreign aid. The narrative became less popular during the market-oriented 80s and 90s, but has
made a big comeback in the new millennium. Once again it is invoked as a rationale for large
foreign aid programs.
This paper applied very simple tests to the various elements of the narrative. Evidence to
support the narrative is scarce. Poverty traps in the sense of zero growth for low income countries
are rejected by the data in most time periods. There is evidence of divergence between rich and
poor nations in the 1960-2002, but this does not imply zero growth for the poor countries, and the
poor countries’ lower growth is more associated with “bad government” than initial income.
The idea of the (abrupt) takeoff does not garner much support in the data. Takeoffs are
rare in the data, most plausibly limited to the Asian success stories. Even then, the takeoffs do not
seem strongly associated with aid or investment in the way the standard Big Push narrative would
imply.
Coordination failures and poverty traps are fascinating objects for theoretical and
empirical exploration. However, the simplified description of poverty traps, Big Pushes, and
takeoffs – arguably a misinterpretation of both the recent theoretical literature and the historical
experience of rich countries -- as a justification for foreign aid receives scarce support in the
actual experiences of economic development.

40Bibliography
Acemoglu, Daron, Simon Johnson and James Robinson Reversal of Fortune: Geography and
Institutions in the Making of the Modern World Income Distribution, November 2002, Quarterly Journal of Economics, volume 117, pp. 1231-1294.
Acemoglu, Daron, Simon Johnson, and James A. Robinson, Institutions as the Fundamental
Cause of Long-Run Growth, 2005, Philippe Aghion and Steven Durlauf, editors, Handbook of Economic Growth, North-Holland.
Acemoglu Daron and Fabrizio Zilibotti, Was Prometheus Unbound by Chance? Risk,
Diversification and Growth, August 1997, Journal of Political Economy, volume 105, pp. 709-751.
Azariadis, Costas, and John Stachurski, (2005), “Poverty Traps”, Handbook of Economic
Growth, Aghion and Durlauf eds., North Holland. Azariadis, Costas and Allan Drazen (1990), Threshold Externalities in Economic Development,
Quarterly Journal of Economics, May 1990, v. 105, iss. 2, pp. 501-26 Bai, Jushan and Pierre Perron (1996): "Estimating and Testing Linear Models with Multiple
Structural Changes," Econometrica, 1998, vol 66, 47-78 Bai, J. and P. Perron (2003): "Computation and Analysis of Multiple Structural Change Models,"
Journal of Applied Econometrics, 18, 1-22. Bernard, A. and S. Durlauf, (1996), “Interpreting Tests of the Convergence Hypothesis,” Journal
of Econometrics, 71, 1-2, 161-73. Bils, Mark, and Peter J. Klenow. 2000. “Does Schooling Cause Growth?” American Economic
Review, 90(5), 1160-1183. Collier, Paul. 2004. “African Growth: Why a Big Push is Needed,” Oxford University, Centre for
the Study of African Economies, Oxford (presented at African Economics Research Commission Conference, December 2004).
Dervis, Kemal (2005), with Ceren Ozer, A Better Globalization: Legitimacy, Governance, and
Reform. Center for Global Development: Washington DC. Doppelhofer, G., R. Miller, and X. Sala-i-Martin, (2004), “Determinants of Long-Term Growth:
A Bayesian Averaging of Classical Estimates (BACE) Approach,” American Economic Review, 94, 4, 813-835.
Doucouliagos, Hristos and Martin Paldam (2006), The aid effectiveness literature: The sad result
of 40 years of research, Deakin University and University of Aarhus, mimeo. Durlauf, Steven. Groups, Social Influences and Inequality: A Memberships Theory Perspective
on Poverty Traps, University of Wisconsin mimeo, August 2002 Durlauf, S. and P. Johnson, (1995), “Multiple Regimes and Cross Country Growth Behaviour,”
Journal of Applied Econometrics, 10, 4, 365-84.
41Durlauf, Steven N., Paul A. Johnson and Jonathan R. W. Temple, Growth Econometrics, in P.
Aghion and S. Durlauf, eds. Handbook of Economic Growth, Volume 1A, Amsterdam: North Holland.
Easterly, William. “Can Foreign Aid Buy Growth?”, Journal of Economic Perspectives, Summer
2003 Easterly, W. and R. Levine, “Tropics, germs, and crops: the role of endowments in economic
development” Journal of Monetary Economics, 50:1, January 2003. Easterly, William. “The Lost Decades: Explaining Developing Countries’ Stagnation in spite of
policy reform 1980-1998” Journal of Economic Growth, Volume 6, Issue 2, June 2001, 135-157.
Easterly, William. “The Ghost of Financing Gap: Testing the Growth Model of the International
Financial Institutions”, Journal of Development Economics, (60)2 December 1999, 423-438
Easterly, William & Kremer, Michael & Pritchett, Lant & Summers, Lawrence H., 1993. "Good
policy or good luck?: Country growth performance and temporary shocks," Journal of Monetary Economics, vol. 32(3), pages 459-483.
Escobar, Arturo. Encountering Development: The Making and Unmaking of the Third World,
Princeton University Press, 1994 ENGERMAN, Stanley L., Elisa V. MARISCAL, and Kenneth L. SOKOLOFF. 2002. “The
Evolution of Schooling Institutions in the Americas, 1800-1925.” working paper, University of California, Los Angeles.
European Commission, 2005, EU Strategy for Africa: Towards a Euro-African pact to accelerate
Africa’s development, COMMUNICATION FROM THE COMMISSION TO THE COUNCIL, THE EUROPEAN PARLIAMENT AND THE EUROPEAN ECONOMIC AND SOCIAL COMMITTEE, Brussels, 12.10.2005
Feyrer, J., (2003), “Convergence By Parts,” mimeo, Dartmouth College. Fox, James S. Applying the Comprehensive Development Framework to USAID Experiences.
OED Working Paper Series No. 15 The World Bank, Summer 2000 Galor, O. (2005). ‘From stagnation to growth: unified growth theory’, in P. Aghion and S.
Durlauf, eds. Handbook of Economic Growth, Volume 1A, Amsterdam: North Holland. Galor, O. (1996). ‘Convergence? Inferences from theoretical models’, Economic Journal, vol.
106, pp. 1056–69. Galor, O., and O. Moav (2004), From Physical to Human Capital Accumulation: Inequality and
the Process of Development, Review of Economic Studies, October 2004, v. 71, iss. 4, pp. 1001-26
Galor, O., and O. Moav (2006), “Das Human Kapital: A Theory of the Demise of the Class
Structure”, Review of Economic Studies, January 2006, v. 73, iss. 1, pp. 85-117 Galor, O. and Weil, D. (1996). ‘The gender gap, fertility and growth’, American Economic
Review, vol. 86, pp. 931–53.

42Galor, O. and Weil, D. (2000). ‘Population, technology, and growth: from Malthusian
stagnation to demographic transition and beyond’, American Economic Review, vol. 90, pp. 806–28.
Galor, O., O. Moav and D. Vollrath (2003), “Land Inequality and the Origin of Divergence and
Overtaking in the Growth Process: Theory and Evidence,” Brown University. Galor, O., and J. Zeira (1993), “Income Distribution and Macroeconomics”, Review of Economic
Studies 60: 35-52. Glaeser, Edward, Rafael LaPorta, Florencio Lopes-de-Silanes, and Andrei Shleifer (2004) "Do
Institutions Cause Growth?", Journal of Economic Growth 9(3): 271-303. Graham, Bryan S. and Jonathan Temple, 2004. “Rich Nations, Poor Nations: How much can
multiple equilibria explain?,” mimeo, Harvard University. HADRI, KADDOUR Testing for stationarity in heterogeneous panel data. Econometrics Journal
(2000), volume 3, pp. 148–161 Hausmann, Ricardo, Lant Pritchett, and Dani Rodrik, 2006, GROWTH ACCELERATIONS,
Journal of Economic Growth. Jacoby, Neil H. U.S. AID to Taiwan - A study of foreign Aid, Self-Help, and Development,
Frederick A. Praeger, Inc Publishers: New York, 1966 Im, Kyung So, M. Hashem Pesaran, and Yongcheol Shin, 2002, Testing for Unit Roots in
Heterogeneous Panels, Cambridge University mimeo. IMF and World Bank, Global Monitoring Report 2005: Millennium Development Goals: from
Consensus to Momentum, Washington DC: Washington, 2005. Kraay, Aart and Claudio Raddatz, Poverty Traps, Aid, and Growth, World Bank mimeo, January
2005 Kremer, M., A. Onatski, and J. Stock, (2001), “Searching for Prosperity,” Carnegie-Rochester Conference Series on Public Policy, 55, 275-303. Maddison, Angus. The World Economy: Historical Statistics. OECD. 2003 Moav, Omer (2002), Income Distribution and Macroeconomics: The Persistence of Inequality in
a Convex Technology Framework, Economics Letters, April 2002, v. 75, iss. 2, pp. 187-92
Moav, Omer (2005), Cheap Children and the Persistence of Poverty, Economic Journal,
January 2005, v. 115, iss. 500, pp. 88-110 OUR COMMON INTEREST: REPORT OF THE COMMISSION FOR AFRICA, March 2005
(Blair Commission) Nelson, R. R. (1956): “A theory of the low level equilibrium trap”, American Economic Review,
46, 894–908. Pritchett, Lant, 2000. "Understanding Patterns of Economic Growth: Searching for Hills among
Plateaus, Mountains, and Plains," World Bank Economic Review, vol. 14(2), pages 221-50.

43 Pritchett, Lant, 1997. "Divergence, Big Time," Journal of Economic Perspectives,
American Economic Association, vol. 11(3), pages 3-17. Pritchett, Lant. “Does learning to add up add up? The returns to schooling in aggregate
data,” draft for Handbook of Education Economics, BREAD Working Paper 53, 2004, http://www.cid.harvard.edu/bread/papers/working/053.pdf
Pritchett, Lant (2001). “Where Has All the Education Gone?” World Bank Economic
Review. Quah, D., (1996a), “Twin Peaks: Growth and Convergence in Models of Distribution Dynamics,”
Economic Journal, 106, 437, 1045-55. Quah, D., (1996b), “Empirics for Economic Growth and Convergence,” European Economic
Review, 40, 6, 1353-75. Quah, D., (1997), “Empirics for Growth and Distribution: Stratification, Polarization, and
Convergence Clubs,” Journal of Economic Growth, 2, 1, 27-59. Raghuram G. Rajan and Arvind Subramanian, Aid and Growth: What Does the Cross-Country
Evidence Really Show? IMF Working Paper, June 2005. Rodrik, Dani INSTITUTIONS FOR HIGH-QUALITY GROWTH: WHAT THEY ARE AND
HOW TO ACQUIRE THEM, Harvard University mimeo, October 1999 Rodrik, Dani, Arvind Subramanian, and Francesco Trebbi (2004). “Institutions Rule: The
Primacy of Institutions over Geography and Integration in Economic Development”. Journal of Economic Growth 9(2):131-165.
Rosenstein-Rodan, P. (1943): “The problem of industrialization of eastern and south-eastern
Europe,” Economic Journal, 53, 202–211 Rostow, W. W. (1990): The Stages of Economic Growth: A Noncommunist Manifesto, 3rd
edition, Cambridge University Press, Cambridge. (first published 1960). Sachs, Jeffrey D. The End of Poverty: Economic Possibilities for Our Time, The Penguin Press:
New York, 2005 Sachs, Jeffrey D., John W. McArthur, Guido Schmidt-Traub, Margaret Kruk, Chandrika Bahadur,
Michael Faye, and Gordon McCord, Ending Africa’s Poverty Trap, Paper presented at Brookings Panel on Economic Activity, 2003.
Sala-i-Martin, X., (1996), “The Classical Approach to Convergence Analysis,” Economic
Journal, 106, 1019-1036. Sokoloff, Kenneth L. and Stanley L. Engerman (2000), Institutions, Factor Endowments, and
Paths of Development in the New World, Journal of Economic Perspectives v14, n3, 217-32.
Stock, James H. and Motohiro Yogo, TESTING FOR WEAK INSTRUMENTS IN LINEAR IV REGRESSION, NBER Technical Working Paper 284, October 2002 (Revised 2004).
UN Millennium Project Report, Investing in Development: A Practical Plan to Achieve the
Millennium Development Goals: Main Report, United Nations: New York, 2005.

44UN Millennium Project, Investing in Development: A Practical Plan to Achieve the
Millennium Development Goals, Overview Report, UN: New York, 2005 World Bank (2005), MEETING THE CHALLENGE OF AFRICA’S DEVELOPMENT: A
WORLD BANK GROUP ACTION PLAN, AFRICA REGION, The World Bank: Washington DC, September 7, 2005
United Nations Development Report (2005), Human Development Report 2005, United Nations:
New York (September). .