religare corporate presentation · capital markets large retail broking ... distinguished board and...
TRANSCRIPT

Religare Enterprises Limited Corporate Overview
November 2016

Leading financial services platform
Religare Enterprises Limited (REL) through its
subsidiaries has established itself in some of the
most promising verticals within Financial Services,
viz. Lending, Health Insurance and Capital Markets
Nationwide distribution footprint
Subsidiaries service over 1.14 mn. clients from
over 1,450 locations with more than 7,200
employees
Professional management team
Stable team with average senior management
tenure of ~7 years and experience of ~18 years
Key Financials (as at/quarter ended 31-Mar-2016)
Net worth: ₹3,863 cr. (USD 584 mn.)
Total assets: ₹27,429 cr. (USD 4.15bn.)
Total revenues: ₹4,503 cr. (USD 689 mn.)
Pre-exceptional PAT: ₹225 cr. (USD 34.5 mn.)
Market information
Listed on NSE and BSE: market capitalization of
₹4,935 cr. (~USD 740 mn.) as of 30-Sep-2016
Religare Overview Religare is focused on the most promising opportunities in the financial services space in India
1
Business Lines Religare Snapshot
Lending
Leading SME-focused NBFC with deep domain knowledge
SMEs are constrained by lack of funding; the gap presents a lucrative opportunity for specialist financiers
Tapping the growing opportunity in lending for affordable housing
Capital Markets
Large retail broking platform, open architecture wealth management platform a and mid-market focused
institutional equities and investment banking platform
Immense opportunity from structurally high savings and low penetration of financial assets; equities in particular to benefit
Health Insurance
One of five standalone health insurers in India
Low insurance density; health insurance in particular growing rapidly due to rising cost of healthcare and disproportionate share of
out-of-pocket expenditure

Distinguished Board and robust governance structure The Board is comprised of highly accomplished individuals from diverse backgrounds
2
Mr. Harpal Singh
Director
Mr. Monish K Dutt
Nominee Director of IFC
Mr. Virendra Kumar Madan
Director
Mr. Ravi Mehrotra Director
Mr. Padam Bahl Independent
Director
Mr. Deepak Sabnani
Independent Director
Mr. R. K. Shetty
Independent Director
REL’s Board of Directors
Mr. Sunil Godhwani Whole-time Director
Mr. Malvinder Mohan Singh
Non-Executive Chairman
Mr. Shivinder Mohan Singh
Non-Exec Vice-Chairman
Mr. A C Mahajan Independent Director Former CMD – Canara Bank, Allahabad Bank
Mr. Tejpreet Chopra Independent Director
Former CEO – GE in India, Sri Lanka, Bangladesh
Ms. Sangeeta Talwar Independent Director Former MD – NDDB
Dairy Services Pvt. Ltd.
Mr. Rashi Dhir Independent
Director

Professional management with vast experience and long tenure Companies managed by independent management teams under Group Executive oversight
Key Leadership
Nalin Nayyar, Interim CEO – Religare Enterprises Over 23 years of experience. With the Religare Group for six years. Previously, handled various roles in fin. services industry across U.S., Europe and Asia at Citigroup and Lehman Brothers
Len
din
g
Kavi Arora, MD & CEO – Religare Finvest More than 23 years of diverse experience in the financial services space. Previously, associated with reputed companies such as ABN AMRO Bank, CitiFinancial and GE Capital
Anuj Gulati, MD & CEO– Religare Health Insurance Over 20 years of experience. Previously, he was the Director for Services and Business Development at ICICI Lombard General Insurance and started his career with Procter & Gamble Ltd. H
ealt
h In
sura
nce
R
eta
il B
roki
ng Nitin Jain, MD & CEO– Religare Securities
Over 20 years of multi-faceted experience and associated with Religare Group for 10 years. Prior to current role, was President and COO at Religare
Health Insurance responsible for driving sales, distribution, business development and marketing
We
alth
M
anag
em
en
t Sriram Iyer, CEO – Religare Wealth Management Over 22 years of experience in the financial services industry with stints at GE and ABN AMRO. Held senior leadership positions and managed large and diverse teams across various functions
Cap
ital
Mar
kets
Gautam Trivedi, CEO – India, Religare Capital Markets Over 23 years of experience in the financial services industry. Previously, Gautam worked at Goldman Sachs for 7 years as MD and Head of Equity Sales & Distribution in India
Anil Saxena, Group Chief Finance Officer – Religare Enterprises Over 24 years of experience in the financial services industry. Responsible for the overall supervision of the finance function and execution of all strategic matters of the group
Maninder Singh, Chief Business Officer – Religare Enterprises Associated with Ranbaxy Laboratories for 28 years; rose to become Global Financial Controller. Managed Treasury, Risk, Taxes, Fin. Accounting, M&A and Investor Relations
Gro
up
Exe
cuti
ve
3

4
Robust platform in place to capture opportunities in financial services Multi-product manufacturing capabilities and distribution network
All data as at/for the quarter ended 31-Mar-2016
Lending
SME-focused Lending • Balance sheet size of ₹21,049 cr. (USD 3.18 bn.)
• High quality portfolio: net NPA of 2.31% (90-day basis)
• Capital adequacy (CRAR) of 16.7%
Affordable Housing Finance
• Loan book of ₹829 cr. (USD 126 mn.)
Capital Markets
Retail Broking Distribution across more than 440 cities, 1,320
locations and catering to over 1.14 mn. clients
Wealth Management Advisory-led open architecture platform
Institutional Equities and Investment Banking India institutional research team covers 155 stocks
Empanelled with more than 450 clients globally
Health Insurance
Health Insurance Leveraging group’s healthcare assets
GWP of ₹503 cr. (USD ~77 mn.); YOY growth of 82%
4,869 hospitals in provider network
Multi-channel distribution including significant online
presence

Religare is poised to capture the buoyancy in Financial Services Financial Services highly correlated to economic growth and will gain from India’s superior growth trajectory
5
Leading financial services
platform with presence
across three verticals
Focus on servicing entire
customer spectrum
Judicious mix of balance
sheet-led and fee-based
businesses
Capital Markets Channelising risk capital to the markets
Retail and Mass Retail Higher savings from rising incomes
HNIs Allocating growing wealth across asset classes
Lending Providing debt capital to power growth of SMEs and affordable housing
Relig
are
Op
era
tin
g B
usin
esses
Targ
et C
usto
mer S
eg
men
ts
Health Insurance Protection for individuals, SMEs
Financial Institutions Capital flows tracking superior returns
SME & Mid-corporates Debt financing, equity raise, M&A, ECM
Financial Services businesses are highly correlated with economic growth; at India’s current stage of development, Financial Services is likely to grow at a multiple of the broader economy, unlocking the structural potential across the spectrum
The Indian economy is the fastest growing large economy; set to sustain world leadership in GDP growth rate

Key Businesses
Overview
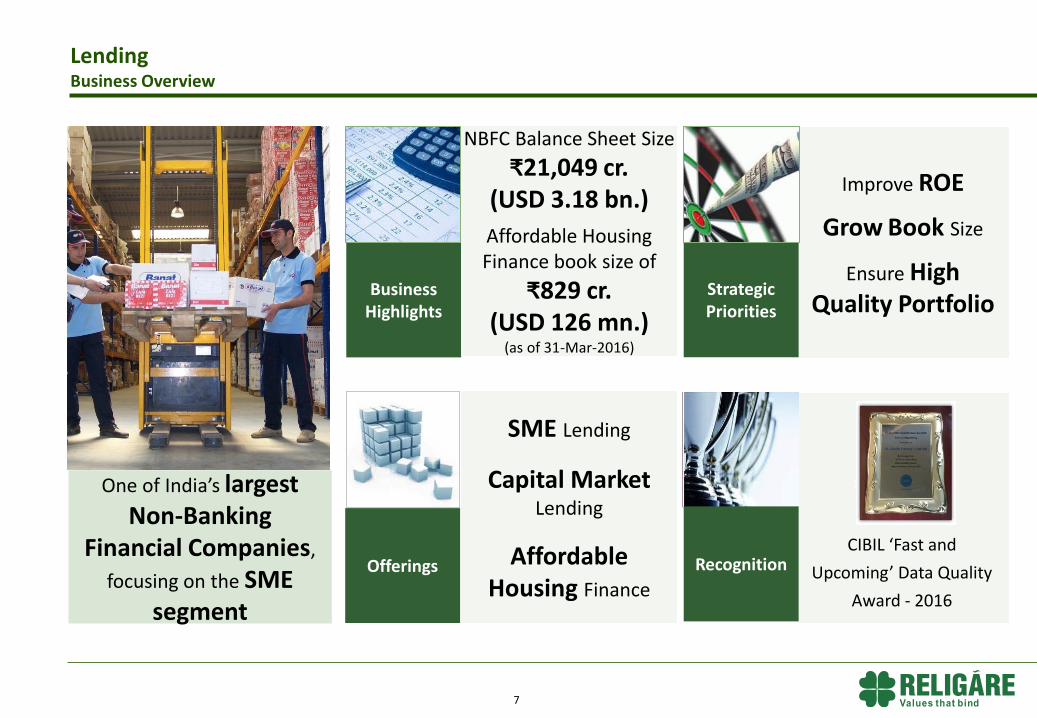
Lending Business Overview
One of India’s largest Non-Banking
Financial Companies,
focusing on the SME segment
Business Highlights
Improve ROE
Grow Book Size
Ensure High Quality Portfolio
Strategic Priorities
8% 62%
Offerings
NBFC Balance Sheet Size
₹21,049 cr. (USD 3.18 bn.)
Affordable Housing Finance book size of
₹829 cr. (USD 126 mn.)
(as of 31-Mar-2016)
SME Lending
Capital Market
Lending
Affordable Housing Finance
7
Recognition CIBIL ‘Fast and
Upcoming’ Data Quality
Award - 2016
8
Non-Performing Assets§
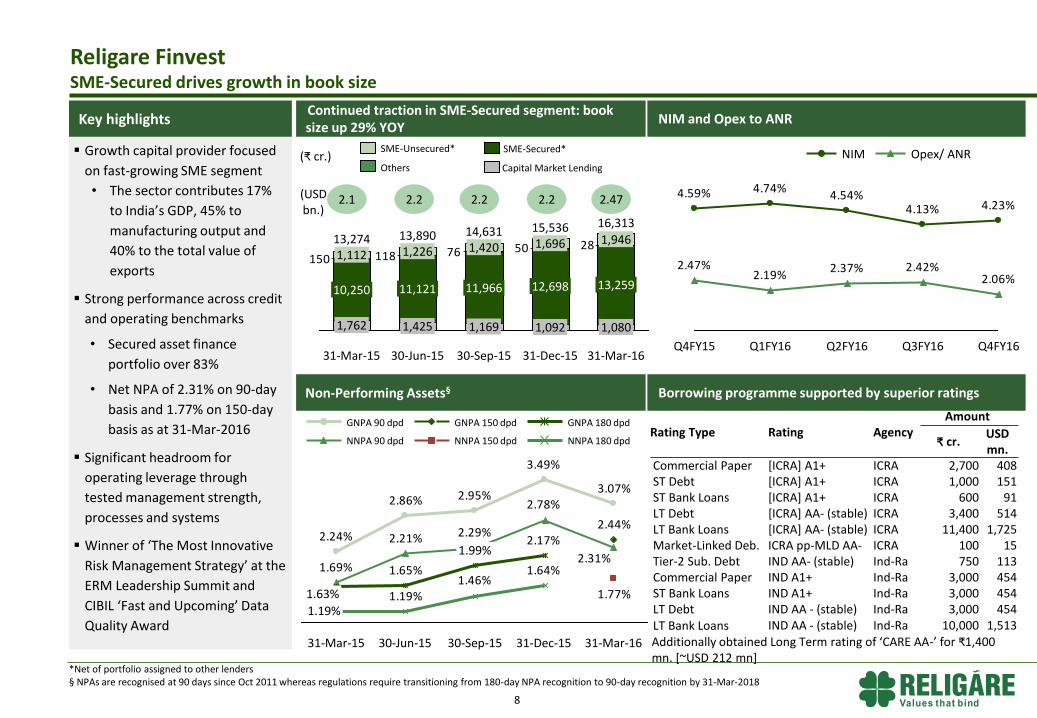
Growth capital provider focused
on fast-growing SME segment
• The sector contributes 17%
to India’s GDP, 45% to
manufacturing output and
40% to the total value of
exports
Strong performance across credit
and operating benchmarks
• Secured asset finance
portfolio over 83%
• Net NPA of 2.31% on 90-day
basis and 1.77% on 150-day
basis as at 31-Mar-2016
Significant headroom for
operating leverage through
tested management strength,
processes and systems
Winner of ‘The Most Innovative
Risk Management Strategy’ at the
ERM Leadership Summit and
CIBIL ‘Fast and Upcoming’ Data
Quality Award
Key highlights Continued traction in SME-Secured segment: book size up 29% YOY
12.6
64.6
20.9
13.5
66.1
22.3 23.5
66.2
15.0
23.2
58.7
14.4
21.6
51.8
17.6
Religare Finvest SME-Secured drives growth in book size
(₹ cr.)
*Net of portfolio assigned to other lenders § NPAs are recognised at 90 days since Oct 2011 whereas regulations require transitioning from 180-day NPA recognition to 90-day recognition by 31-Mar-2018
285076118150
31-Mar-16
16,313
1,080
13,259
1,946
31-Dec-15
15,536
1,092
12,698
1,696
30-Sep-15
14,631
1,169
11,966
1,420
30-Jun-15
13,890
1,425
11,121
1,226
31-Mar-15
13,274
1,762
10,250
1,112
Capital Market Lending
SME-Secured*
Others
SME-Unsecured*
3.07%
3.49%
2.95%2.86%
2.24%
2.31%
2.78%
2.29%2.21%
1.69%
2.44%
1.77%
2.17%
1.65% 1.64%1.46%
1.19%
31-Dec-15 30-Sep-15
1.99%
30-Jun-15 31-Mar-15
1.19%
1.63%
31-Mar-16
NNPA 90 dpd
GNPA 90 dpd
NNPA 180 dpd
GNPA 180 dpd
NNPA 150 dpd
GNPA 150 dpd
Borrowing programme supported by superior ratings
NIM and Opex to ANR
4.23%4.13%4.54%
4.74%4.59%
2.06%2.42%2.37%
2.19%2.47%
Q4FY16 Q3FY16 Q2FY16 Q1FY16 Q4FY15
Opex/ ANR NIM
Additionally obtained Long Term rating of ‘CARE AA-’ for ₹1,400 mn. [~USD 212 mn]
Rating Type Rating Agency Amount
₹ cr. USD mn.
Commercial Paper [ICRA] A1+ ICRA 2,700 408 ST Debt [ICRA] A1+ ICRA 1,000 151 ST Bank Loans [ICRA] A1+ ICRA 600 91 LT Debt [ICRA] AA- (stable) ICRA 3,400 514 LT Bank Loans [ICRA] AA- (stable) ICRA 11,400 1,725 Market-Linked Deb. ICRA pp-MLD AA- ICRA 100 15 Tier-2 Sub. Debt IND AA- (stable) Ind-Ra 750 113 Commercial Paper IND A1+ Ind-Ra 3,000 454 ST Bank Loans IND A1+ Ind-Ra 3,000 454 LT Debt IND AA - (stable) Ind-Ra 3,000 454 LT Bank Loans IND AA - (stable) Ind-Ra 10,000 1,513
2.2 2.1 2.2 2.2 2.47 (USD bn.)

9
Traction in disbursements, book size increased 96% YOY
12.6
64.6
20.9
Religare Housing Development Finance Corporation Targeting the growing opportunity of lending for affordable housing
829
662558
481423
31-Mar-16 30-Jun-15 30-Sep-15 31-Dec-15 31-Mar-15
Net Interest Margin and Non-Performing Assets
2.1%
1.7%1.7%1.9%
1.5%
1.1%1.3%
1.2%
8.1%8.1%8.6%9.2% 8.3%
Q2FY16 Q3FY16
1.0%
Q4FY16
0.7%
Q1FY16 Q4FY15
Significant shortfall of housing units in India; urban housing
shortage of 18.78 mn. units with majority among the low income
group and the economically weaker sections
Housing for All scheme by the Government aims to provide
affordable housing to urban poor; 20 mn. houses to be built in
urban areas by 2022 through financial assistance from the Central
Government
RHDFC focuses on finance needs of first time home buyers for self
use in the affordable housing segment
• Current loan book size of ₹829 cr.
Portfolio of products offered include
• Loans for home purchase
• Construction finance loans to affordable housing developers
• Loan against residential property for business purpose
RHDFC has created a distinct underwriting framework to evaluate
ability and intent of the borrower; additional parameters assessed
include qualitative checks
Key Highlights
(₹ cr.)
67 (USD mn.)
76 84 94 126
NNPA GNPA NIM

10
Health Insurance Business Overview
Positioned to capture
significant Group Synergies
Retail & Group Health Plans
Retail & Group Accident Plans
International Travel Plan
GWP of
₹503 cr. (USD 77 mn.) in
FY16
4,869 hospitals in
provider network
(as of 31-Mar-2016)
Grow GWP with
efficient use of
Capital
‘FICCI Healthcare
Excellence Award –
2015’
Recognition
Business Highlights
Strategic Priorities
Offerings

11
Performance of standalone health insurers
Religare Health Insurance Robust distribution aiding in rapidly achieving scale
Key Highlights
Fourth standalone health insurer to be set up in India
Equity participation of 5% each by Union Bank of India and
Corporation Bank
Pan-India coverage through 56 offices
Multi-channel distribution strategy through Agency, Brokers,
Corporate Agents, Online and Bancassurance
Gross Written Premium (GWP) of ₹503 cr. (USD 77 mn.) in FY16;
increase of 82% over the previous year
Bouquet of 12 products covering health, personal accident,
critical illness and travel
Gross written premium
Consistently expanding the Hospital Network
103124 107 112
161
Q2FY16 Q3FY16 Q4FY16 Q4FY15 Q1FY16
GWP
4,409 4,532 4,630 4,768 4,869
Q4FY16 Q1FY16 Q4FY15 Q2FY16 Q3FY16
No. of network hospitals PSU Private SAHI
No. of companies 4 17 5
No. of years in existence 41 14 7
GWP* – FY15 (₹ cr.) 13,501 6,154 2,928
GWP* – FY16 (₹ cr.) 16,308 6,908 4,154
YOY Growth 21% 12% 42%
GWP* – FY15 (USD mn.) 2,211 1,008 480
GWP* – FY16 (USD mn.) 2,497 1,058 636
(₹ cr.)
16.4 16.6 19.6 17.1 23.8 (USD
mn.)
*Health & Personal Accident only; Source: Industry Reports

12
Capital Markets Business Overview
A formidable capital markets platform with
extensive distribution capabilities
1.14 mn. Retail
Broking clients
Wealth Mgmt. AUM ₹4,055 cr. (USD
613 mn.) 155 stocks under
Research coverage
(q.e. 31-Mar-2016)
Retail Broking
Wealth Mgmt
Institutional Equities and
Investment Banking
Generate Superior
ROE
Attain Sustainable Profitability
Business Highlights
Strategic Priorities
Offerings Recognition
“Leveraging Digital and Technology for Business Growth”
Award at the Skoch BSE Award For
Aspiring India 2015
13
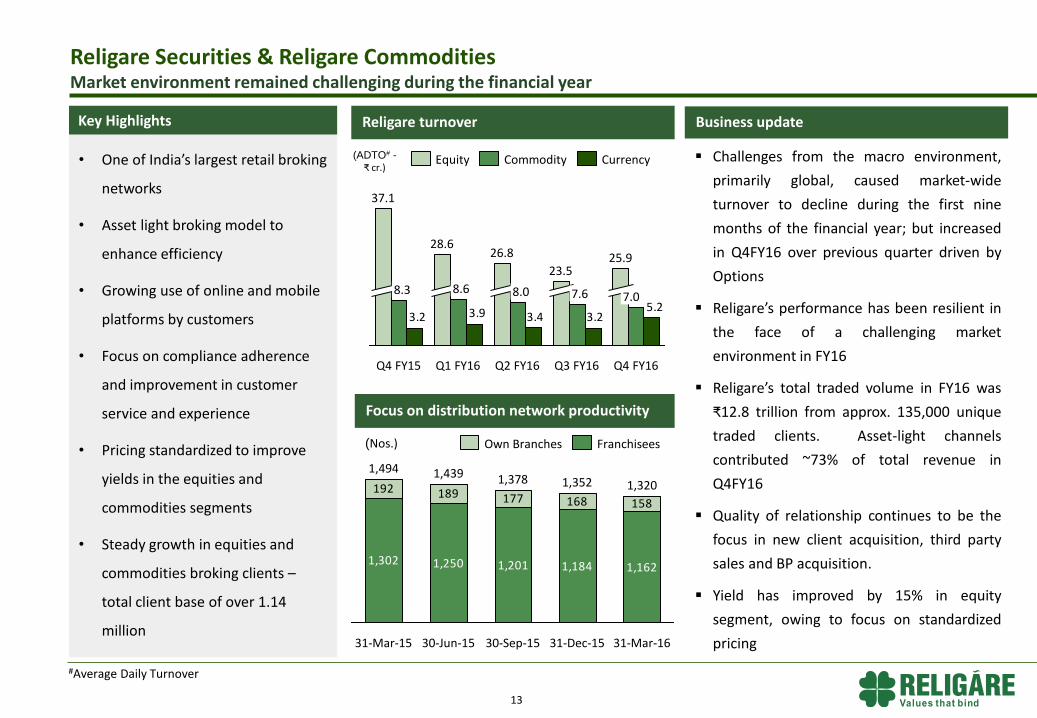
• One of India’s largest retail broking
networks
• Asset light broking model to
enhance efficiency
• Growing use of online and mobile
platforms by customers
• Focus on compliance adherence
and improvement in customer
service and experience
• Pricing standardized to improve
yields in the equities and
commodities segments
• Steady growth in equities and
commodities broking clients –
total client base of over 1.14
million
Key Highlights Religare turnover
Religare Securities & Religare Commodities Market environment remained challenging during the financial year
333
935
292
995
313
1,015
260
940
270
950
(ADTO# - ₹ cr.)
Focus on distribution network productivity
(Nos.)
Business update
#Average Daily Turnover
1,302 1,250 1,201 1,184 1,162
192 189 177 168 158
31-Mar-16
1,320
31-Dec-15
1,352
30-Sep-15
1,378
30-Jun-15
1,439
31-Mar-15
1,494
Franchisees Own Branches
Challenges from the macro environment,
primarily global, caused market-wide
turnover to decline during the first nine
months of the financial year; but increased
in Q4FY16 over previous quarter driven by
Options
Religare’s performance has been resilient in
the face of a challenging market
environment in FY16
Religare’s total traded volume in FY16 was
₹12.8 trillion from approx. 135,000 unique
traded clients. Asset-light channels
contributed ~73% of total revenue in
Q4FY16
Quality of relationship continues to be the
focus in new client acquisition, third party
sales and BP acquisition.
Yield has improved by 15% in equity
segment, owing to focus on standardized
pricing
5.23.23.43.93.2
Q4 FY16
7.0
25.9
Q3 FY16
7.6
23.5
Q2 FY16
8.0
26.8
Q1 FY16
8.6
28.6
Q4 FY15
8.3
37.1
Currency Equity Commodity

14
Key value proposition of
‘Simplified Wealth Solutions’ for
the customers
Seen as trusted advisors to
clients, enabled by our tripod
delivery model
Active advisory calls helping
clients position portfolios to gain
from high-impact events
Expanding product solutions to
enhance ability to win clients
across the group
Size and scale aligned to market
Focus on Relationship Manager
productivity
Key Highlights Client Base
Relationship Manager productivity Business update
4,492
4,972
4,687 4,662 4,631
₹ cr.
AUM
Religare Wealth Management Differentiating through a focused idea-driven approach
Inflows into Equity PMS schemes has become
one of the key contributors to the business,
with significant traction also having been built
up in Structured Products and Real Estate
backed high-yielding NCDs
Incrementally equity MF sales have declined
given the mood in the market. All the same,
trail income contribution to revenue has
improved significantly as an outcome of the
focus on building an annuity book
(₹ cr.)
3,945 4,029 4,008 4,0554,400
31-Mar-15 31-Mar-16 31-Dec-15 30-Sep-15 30-Jun-15
Total AUM
703 (USD mn.) 620 609 606 613
16.0 (USD mn.)
13.5 12.2 13.2 12.7
848781
86100
31-Mar-16 31-Dec-15 30-Sep-15 30-Jun-15 31-Mar-15
4,5144,4774,5074,5234,549
30-Sep-15 31-Mar-16 31-Dec-15 30-Jun-15 31-Mar-15
No. of Clients

Jan 2016 ₹120 cr.
Mar 2016 ₹118 cr.
Jan 2016 ₹250 cr.
Religare Capital Markets Poised to capitalise on multi-decade growth story in India
• Mid-market focused institutional equities and
investment banking platform
• Investment Banking platform offers life-cycle
investment banking services i.e. growth capital raise to
IPO to QIP to Block placements
• Closed calendar year 2015 as the No. 2 QIP manager in
India for transactions of more than USD 10 mn.
(excluding transactions for BFSI companies)
• Equity transactions of size aggregating to ₹940 cr. (USD
144 mn.) successfully executed during FY16
• Syndicated multiple debt issues aggregating to ₹440 cr.
(USD 67 mn.) during FY16
• 20 analysts in India’s Institutional Research team cover
155 stocks
• Equities businesses serve 452 clients globally with
differentiated research
Key Highlights
15
Select deals completed during FY2016
Block
Sole Placement Agent
Debt Syndication
Arranger
Aug 2015 ₹235 cr.
Open Offer
Lead Manager
Block
Sole Placement Agent
Crompton Greaves
Differentiating through original, on-the-ground research

Financial Services Opportunity in India

17
SMEs constitute a large contributor to national output and exports
SME Lending
Share of SMEs in India’s manufacturing
output
40%
Share of SMEs in India’s total exports
Source: CRISIL
Credit flow to the sector has improved in recent years as the potential of the sector is better understood
45%
6,8405,2804,860
3,6602,5802,160
1,260
2013 2009 2012 2011 2007 2008 2010
+33%
24.0% 16.5% Share of SMEs in banks’ industry and services portfolio
Outstanding SME credit as % of total outstanding bank credit
The SME sector is one of the largest generators of employment in India, employing 73 million people. The sector has been observed to outpace GDP growth in years of high growth.
However, providing credit to the sector commensurate with its contribution to national output is too daunting a task for banks
Bank credit to SMEs (₹ billion)
SMEs are the backbone of India’s economy but are constrained by lack of funding; specialist NBFCs with deep understanding of the workings of SMEs are crucial for bridging the gap
Gap in funding for SMEs presents a lucrative opportunity for specialist financiers

Health Insurance is on a high growth trajectory
18
532
33027824714589665428
DE KR BR IN ZA RU JP US
1,259
CN UK
xx% GWP as % of GDP Total premium (USD bn.)
1% 15% 4% 12% 7% 3% 12% 11% 8% 4%
Out-of-Pocket as % of Total Healthcare Expenditure
59%
35%35%31%
11%9%
CN IN RU BR US UK
Healthcare spend as a % of GDP
Source: Reserve Bank of India, World Bank, Economist Intelligence Unit, India Brand Equity Foundation, Karvy, Industry reports, Swiss Re, IRDAI SG=Singapore, MY=Malaysia, KR=S. Korea, JP= Japan, TH=Thailand, IN=India, ID=Indonesia, CN=China, RU=Russia, ZA=South Africa, DE=Germany, UK=United Kingdom, US= United States
Non-life insurance penetration in India is a mere 0.7% and Health Insurance is growing rapidly as healthcare costs are spiraling and share of out-of-pocket expense is among the highest
Health Insurance
17.90%
9.40%9.30%
6.30%5.40%
4.00%
RU CN IN US BR UK
248204
176153132
1128466513222
27%
FY08 FY07 FY06 FY09 FY16 FY15 FY14 FY13 FY12 FY11 FY10
Health Insurance GWP (₹ bn.)

Source: Reserve Bank of India, World Bank, Economist Intelligence Unit, India Brand Equity Foundation, Karvy, Industry reports Market Capitalization for US is of NYSE and for China of Shanghai Stock Exchange; Cash Trading velocity is defined as annual cash turnover divided by market capitalisation; Data for 31-Dec-2013 for all countries except India which is for 31-Mar-2014 SG=Singapore, MY=Malaysia, KR=S. Korea, JP= Japan, TH=Thailand, IN=India, ID=Indonesia, CN=China;
Surge in wealth and reallocation across asset classes to revive interest in Equities
19
274061
929395
160
252
MY SG CN ID IN TH JP KR
Market cap*/GDP (%)
32.254.6
25.3
45.5
24.3
63.7
0.90.49.13.5
5.2
43.2
18.9
228.4
109.9
2013
11.4
2018E
Provident Fund
Others
Mutual Funds
Small Savings/Cash
Insurance
Bank Deposits/ Bonds
Equity Distribution of individual wealth in India invested in financial assets (₹ trillion)
Capital Markets
38% xx% Cash Trading Velocity
Wealth Management
10%
39%17%26%
35%73%
59%
26%
15%
US Asia-Pacific India
51–65
Over 65
Under 50
177
94
2020E 2015E
+89% Total wealth of Ultra High Net Worth Individuals in India (₹ trillion)
Distribution of Ultra High Net Worth Individuals by Age Group
+162%
30%
104% 143% 106% 45% 33% 304%
Equity-related businesses to benefit from tailwinds as India is under-penetrated c.f. regional peers and a
correction to under-ownership of equities is imminent
Total wealth of UHNIs set to grow nearly 90% in 5 years; younger UHNI age profile provides opportunity to
innovate and make intense use of technology

REL and Key Subsidiaries Financials

21
REL’s financial performance is at an inflection point Businesses set to deliver substantial improvement in performance as consolidation phase complete
• Reduced REL-level debt by monetizing investments
• Restructured Lending Business balance sheet
• Matched liability profile with assets
• Held asset base constant between FY12 and FY14 putting prudence ahead of growth
• Consolidated retail broking presence to rein in fixed costs
• Rationalized own branches from peak of ~400 to under 200 now
• Focus on asset-light channels; now generating ~73% of revenues
• Rationalized size and scope of investment banking business
• Focused as a mid-market investment bank, with near operating breakeven in FY16
Multiple actions taken to consolidate operations over the past four years
Consolidated financial performance on an improving trajectory
4,5034,1873,472
FY16 FY15 FY14
REL Consolidated Revenue
FY16
535
FY15
485
FY14
263
REL Consolidated pre-exceptional PBT after MI
11
FY16
225
FY15
154
FY14
REL Consolidated pre-exceptional PAT
(₹ cr.)
576 686 689 44 79 82 2 25 34 USD mn.
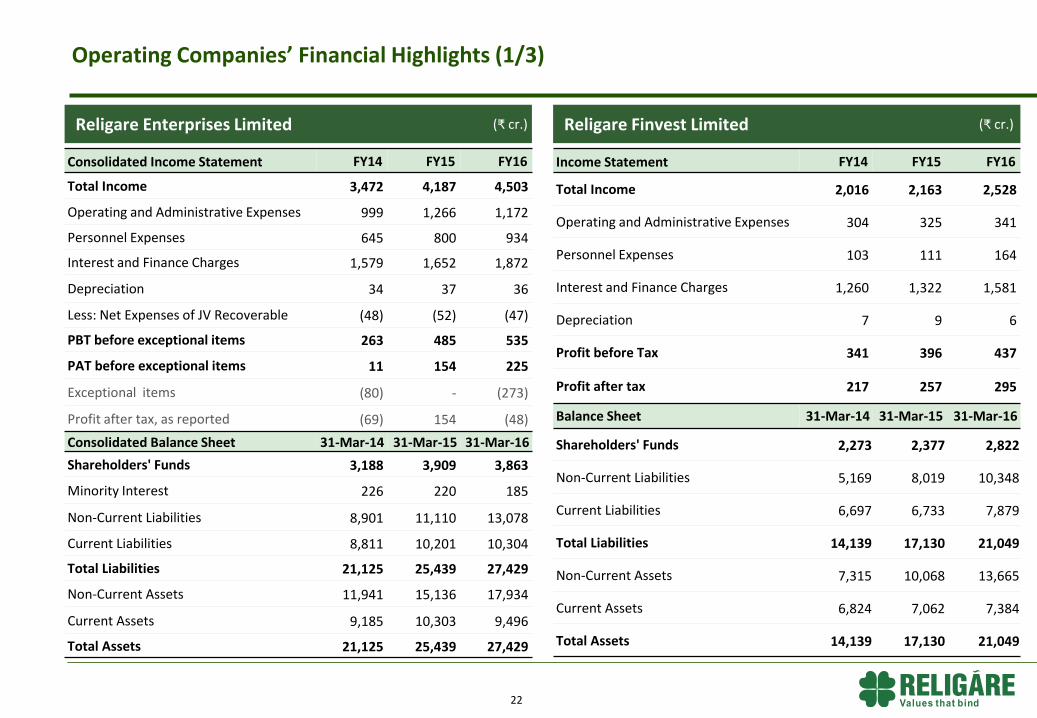
Operating Companies’ Financial Highlights (1/3)
22
Income Statement FY14 FY15 FY16
Total Income 2,016 2,163 2,528
Operating and Administrative Expenses 304 325 341
Personnel Expenses 103 111 164
Interest and Finance Charges 1,260 1,322 1,581
Depreciation 7 9 6
Profit before Tax 341 396 437
Profit after tax 217 257 295
Balance Sheet 31-Mar-14 31-Mar-15 31-Mar-16
Shareholders' Funds 2,273 2,377 2,822
Non-Current Liabilities 5,169 8,019 10,348
Current Liabilities 6,697 6,733 7,879
Total Liabilities 14,139 17,130 21,049
Non-Current Assets 7,315 10,068 13,665
Current Assets 6,824 7,062 7,384
Total Assets 14,139 17,130 21,049
Religare Finvest Limited (₹ cr.) Religare Enterprises Limited (₹ cr.)
Consolidated Income Statement FY14 FY15 FY16
Total Income 3,472 4,187 4,503
Operating and Administrative Expenses 999 1,266 1,172
Personnel Expenses 645 800 934
Interest and Finance Charges 1,579 1,652 1,872
Depreciation 34 37 36
Less: Net Expenses of JV Recoverable (48) (52) (47)
PBT before exceptional items 263 485 535
PAT before exceptional items 11 154 225
Exceptional items (80) - (273)
Profit after tax, as reported (69) 154 (48)
Consolidated Balance Sheet 31-Mar-14 31-Mar-15 31-Mar-16
Shareholders' Funds 3,188 3,909 3,863
Minority Interest 226 220 185
Non-Current Liabilities 8,901 11,110 13,078
Current Liabilities 8,811 10,201 10,304
Total Liabilities 21,125 25,439 27,429
Non-Current Assets 11,941 15,136 17,934
Current Assets 9,185 10,303 9,496
Total Assets 21,125 25,439 27,429

Operating Companies’ Financial Highlights (2/3)
23
(₹ cr.) (₹ cr.)
Income Statement FY14 FY15 FY16
Net Earned Premium 82 154 288
Net Claims Incurred & Net Commission 78 114 140
Operating and Administrative Expenses 49 84 144
Personnel Expenses 51 76 116
Investment & Other Income 16 21 34
Profit before Tax (80) (99) (79)
Profit after tax & Minority Interest (72) (89) (71)
Balance Sheet 31-Mar-14 31-Mar-15 31-Mar-16
Shareholders' Funds 124 125 171
Non-Current Liabilities 0.4 0.2 1.6
Current Liabilities 137 275 401
Total Liabilities 261 400 574
Non-Current Assets 169 282 433
Current Assets 92.2 118 141
Total Assets 261 400 574
Religare Health Insurance Co. Limited*
*Financial statement represents 100% of the entity. Minority Interest is reduced from PAT.
Income Statement FY14 FY15 FY16
Total Income 36 57 106
Operating and Administrative Expenses 3 8 17
Personnel Expenses 5 8 17
Interest and Finance Charges 9 18 43
Depreciation - - -
Profit before Tax 19 23 29
Profit after tax and Minority Interest 8 13 17
Balance Sheet 31-Mar-14 31-Mar-15 31-Mar-16
Shareholders' Funds 140 155 173
Non-Current Liabilities 62 324 580
Current Liabilities 41 36 169
Total Liabilities 243 515 922
Non-Current Assets 176 357 746
Current Assets 67 158 176
Total Assets 243 515 922
Religare Housing Development Finance Corp. Ltd.* (₹ cr.) (₹ cr.)
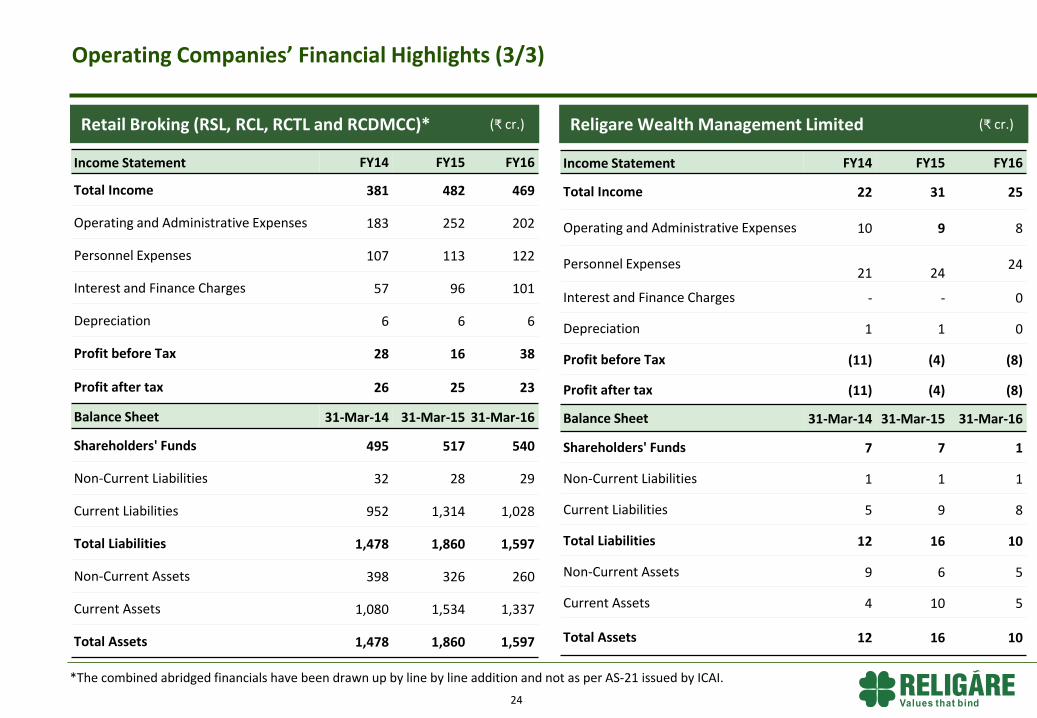
Operating Companies’ Financial Highlights (3/3)
24
Income Statement FY14 FY15 FY16
Total Income 381 482 469
Operating and Administrative Expenses 183 252 202
Personnel Expenses 107 113 122
Interest and Finance Charges 57 96 101
Depreciation 6 6 6
Profit before Tax 28 16 38
Profit after tax 26 25 23
Balance Sheet 31-Mar-14 31-Mar-15 31-Mar-16
Shareholders' Funds 495 517 540
Non-Current Liabilities 32 28 29
Current Liabilities 952 1,314 1,028
Total Liabilities 1,478 1,860 1,597
Non-Current Assets 398 326 260
Current Assets 1,080 1,534 1,337
Total Assets 1,478 1,860 1,597
Income Statement FY14 FY15 FY16
Total Income 22 31 25
Operating and Administrative Expenses 10 9 8
Personnel Expenses
21
24 24
Interest and Finance Charges - - 0
Depreciation 1 1 0
Profit before Tax (11) (4) (8)
Profit after tax (11) (4) (8)
Balance Sheet 31-Mar-14 31-Mar-15 31-Mar-16
Shareholders' Funds 7 7 1
Non-Current Liabilities 1 1 1
Current Liabilities 5 9 8
Total Liabilities 12 16 10
Non-Current Assets 9 6 5
Current Assets 4 10 5
Total Assets 12 16 10
*The combined abridged financials have been drawn up by line by line addition and not as per AS-21 issued by ICAI.
Retail Broking (RSL, RCL, RCTL and RCDMCC)* (₹ cr.) Religare Wealth Management Limited (₹ cr.)

Notes
Notes
Religare Enterprises Limited
A - 3,4,5, GYS Global, Sector - 125, Noida, U.P. – 201301, India