religare corporate presentation corp_presentation_aug2017.pdf · distinguished board and robust...
TRANSCRIPT

Religare Enterprises Limited Corporate Overview
August 2017

Leading financial services platform
Religare Enterprises Limited (REL) through its
subsidiaries has an established presence in
three verticals within Financial Services, viz.
Lending, Health Insurance and Retail Broking
Nationwide distribution footprint
Subsidiaries service over 1.1 mn. clients from
over 1,250 locations with more than 8,400
employees
Professional management team
Stable team with average senior management
tenure of ~7 years and experience of ~18 years
Key Financials (as at/year ended 31-Mar-2017)
Net worth: ₹2,752 cr. (USD 424 mn.)
Total assets: ₹21,038 cr. (USD 3.24 bn.)
Total revenues: ₹3,841 cr. (USD 573 mn.)
Pre-exceptional PBT: ₹306 cr. (USD 46 mn.)
Religare Overview Religare is present in three verticals within the financial services space in India
1
Business Lines Religare Snapshot
Lending
Leading SME-focused NBFC with deep domain knowledge
SMEs are constrained by lack of funding; the gap presents a lucrative opportunity for specialist financiers
Tapping the growing opportunity in lending for affordable housing
Retail Broking
Large retail broking and distribution platform
Immense opportunity from structurally high savings and low penetration of financial assets; equities in particular to benefit
Health Insurance*
One of six standalone health insurers in India
Low insurance density; health insurance in particular growing rapidly due to rising cost of healthcare and disproportionate share of
out-of-pocket expenditure
All data as at/for the year ended 31-Mar-2017 *REL has entered into a definitive agreement with a consortium of investors led by Private Equity Firm True North to buy out its entire stake in the Health Insurance business

Distinguished Board and robust governance structure The Board is comprised of highly accomplished individuals from diverse backgrounds
2
Mr. Harpal Singh Director
Mr. Virendra Kumar Madan Director
Mr. Padam Bahl Independent Director
Mr. Deepak Sabnani Independent Director
Mr. R. K. Shetty
Independent Director
REL’s Board of Directors
Mr. Sunil Godhwani Whole-time Director
Mr. Shivinder Mohan Singh Non-Executive Vice-Chairman
Mr. Tejpreet Chopra Independent Director
Former CEO – GE India, Sri Lanka, Bangladesh
Mr. Rashi Dhir Independent Director
Mr. A C Mahajan Independent Director Former CMD – Canara Bank, Allahabad Bank
Mr. Malvinder Mohan Singh Non-Executive Chairman
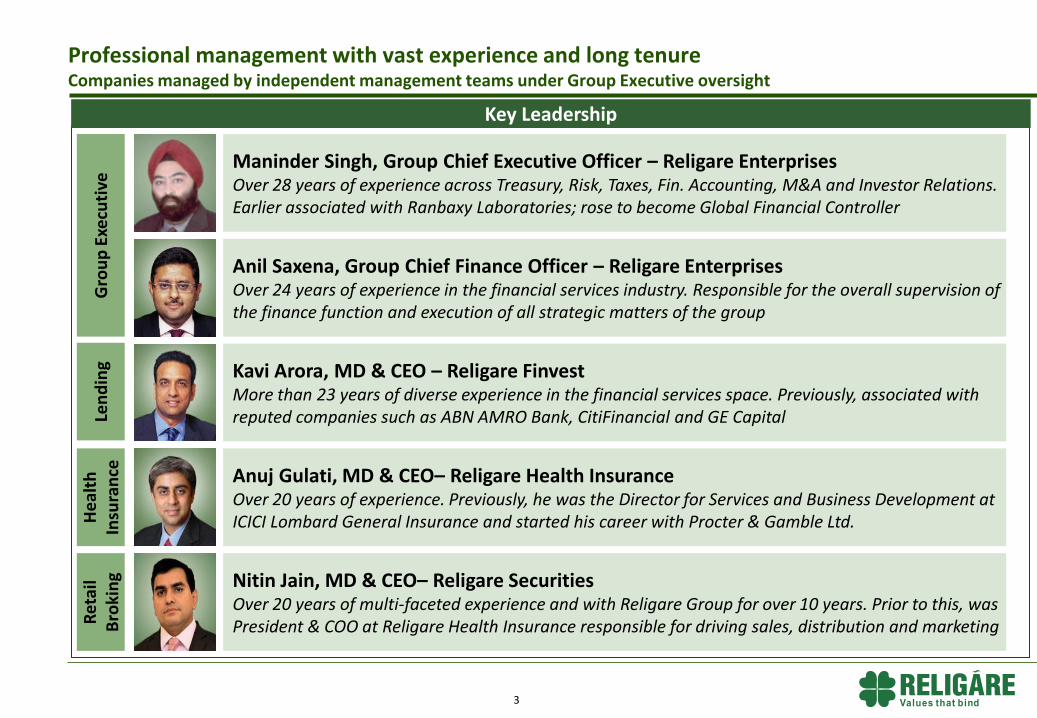
Professional management with vast experience and long tenure Companies managed by independent management teams under Group Executive oversight
Key Leadership
3
Maninder Singh, Group Chief Executive Officer – Religare Enterprises Over 28 years of experience across Treasury, Risk, Taxes, Fin. Accounting, M&A and Investor Relations. Earlier associated with Ranbaxy Laboratories; rose to become Global Financial Controller
Gro
up
Exe
cuti
ve
He
alth
In
sura
nce
Le
nd
ing
Ret
ail
Bro
kin
g
Anil Saxena, Group Chief Finance Officer – Religare Enterprises Over 24 years of experience in the financial services industry. Responsible for the overall supervision of the finance function and execution of all strategic matters of the group
Kavi Arora, MD & CEO – Religare Finvest More than 23 years of diverse experience in the financial services space. Previously, associated with reputed companies such as ABN AMRO Bank, CitiFinancial and GE Capital
Anuj Gulati, MD & CEO– Religare Health Insurance Over 20 years of experience. Previously, he was the Director for Services and Business Development at ICICI Lombard General Insurance and started his career with Procter & Gamble Ltd.
Nitin Jain, MD & CEO– Religare Securities Over 20 years of multi-faceted experience and with Religare Group for over 10 years. Prior to this, was President & COO at Religare Health Insurance responsible for driving sales, distribution and marketing

4
Robust platform in place Multi-product manufacturing capabilities and distribution network
All data as at/for the year ended 31-Mar-2017
Lending
SME-focused Lending • Balance sheet size of ₹17,158 cr. (USD 2.65 bn.)
• Net Worth of ₹3,041 cr. (USD 469 mn.)
• Capital adequacy (CRAR) of 21.2%
Affordable Housing Finance • Loan book of ₹1,016 cr. (USD 156 mn.)
• Net Worth of ₹190 cr. (USD 29 mn.)
Retail Broking
Retail Broking Distribution across more than 415 cities, 1,200
locations
Catering to over 1.03 mn. clients
Partnership with 12 banks offering online share
trading facility
Health Insurance
Health Insurance Leveraging group’s healthcare assets
GWP of ₹726 cr. (USD ~108 mn.); YOY growth of
44%
5,089 hospitals in provider network
Multi-channel distribution including significant
online presence

The Financial Services industry is experiencing rapid growth Financial Services highly correlated to economic growth and will gain from India’s superior growth trajectory
5
Leading financial services
platform with presence
across three verticals
Judicious mix of balance
sheet-led and fee-based
businesses
Capital Markets Channelising risk capital to the markets
Retail and Mass Retail Higher savings from rising incomes
Lending Providing debt capital to power growth of SMEs and affordable housing
Relig
are
Op
era
tin
g B
usin
esses
Targ
et C
usto
mer S
eg
men
ts
Health Insurance Protection for individuals, SMEs
SME & Mid-corporates Debt financing, equity raise, M&A, ECM
Financial Services businesses are highly correlated with economic growth; at India’s current stage of development, Financial Services is likely to grow at a multiple of the broader economy, unlocking the structural potential across the spectrum
The Indian economy is the fastest growing large economy; set to sustain world leadership in GDP growth rate

Key Businesses
Overview

7
Growth capital provider focused on fast-growing SME segment
• The sector contributes 17% to India’s GDP, 45% to manufacturing
output and 40% to the total value of exports
Strong operating benchmarks
• Well-diversified portfolio covering customers from over 80+ different
industries
• Secured with asset coverage of around 2x
• Nearly 30,000 active accounts
Offerings tailor-made for the SME sector:
SME-Secured: Loans against residential or commercial property for
business expansion and purchase of plant and machinery
SME-Unsecured: Caters to working capital and other financial
requirements of small and medium enterprises, self-employed
businessmen and professionals
Winner of CIBIL ‘Commercial Bureau’ Data Quality Award at the
TransUnion CIBIL Credit Information Conference held in March 2017
Certified as a ‘Great Place to Work’ by the Great Place to Work Institute
Key highlights
Religare Finvest Conserving capital in a challenging credit environment
*Net of portfolio assigned to other lenders RWN = Rating Watch Negative
Len
din
g H
ealt
h I
nsu
ran
ce
Ret
ail B
roki
ng
Additional Long Term rating of ‘CARE A’ (on watching with developing implication for ₹332.05 cr. [~USD 52 mn]
Book size
(₹ cr.)
(USD bn.) 2.12 2.47 1.87
Credit Ratings
Rating Type Rating Agency Amount
₹ cr. USD mn. Commercial Paper [ICRA] A1 ICRA 2,000 310 ST Debt [ICRA] A1 ICRA 1,000 155 ST Bank Loans [ICRA] A1 ICRA 600 93
LT Debt [ICRA] A+ (on watch with developing implications)
ICRA 3,400 528
LT Bank Loans [ICRA] A+ (on watch with developing implications)
ICRA 11,400 1,769
Market-Linked Deb.
[ICRA] pp-MLD A+ (on watch with developing implications)
ICRA 100 16
Tier-2 Sub. Debt IND A (RWN) Ind-Ra 750 116 Commercial Paper IND A1 (RWN) Ind-Ra 3,000 465 ST Bank Loans IND A1 (RWN) Ind-Ra 3,000 465 LT Debt IND A (RWN) Ind-Ra 3,000 465 LT Bank Loans IND A (RWN) Ind-Ra 14,275 2,215
Capital Market Lending SME-Secured*
SME-CE/CV Finance*
SME-Unsecured*
1,762 1,080 584
10,250 13,259 10,463
150 28
5 1,112
1,946
1,075
31-Mar-15 31-Mar-16 31-Mar-17
12,128 16,313
13,274
8
Book size
12.6
64.6
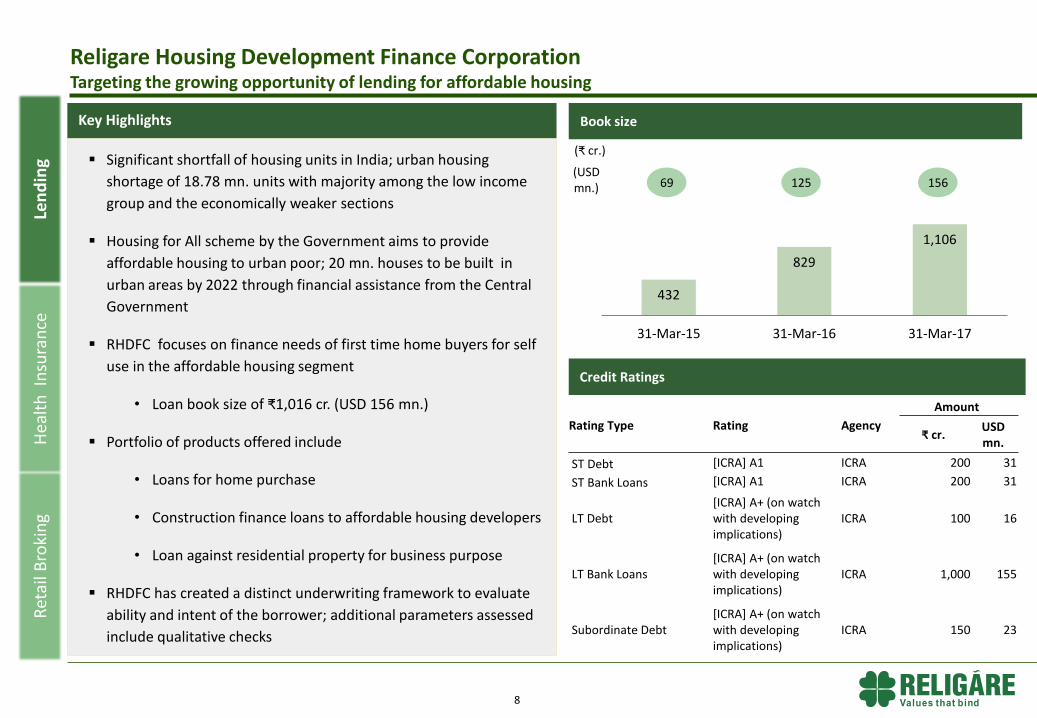
Religare Housing Development Finance Corporation Targeting the growing opportunity of lending for affordable housing
Significant shortfall of housing units in India; urban housing
shortage of 18.78 mn. units with majority among the low income
group and the economically weaker sections
Housing for All scheme by the Government aims to provide
affordable housing to urban poor; 20 mn. houses to be built in
urban areas by 2022 through financial assistance from the Central
Government
RHDFC focuses on finance needs of first time home buyers for self
use in the affordable housing segment
• Loan book size of ₹1,016 cr. (USD 156 mn.)
Portfolio of products offered include
• Loans for home purchase
• Construction finance loans to affordable housing developers
• Loan against residential property for business purpose
RHDFC has created a distinct underwriting framework to evaluate
ability and intent of the borrower; additional parameters assessed
include qualitative checks
Key Highlights
(₹ cr.)
(USD mn.) 69 125 156
Len
din
g H
ealt
h I
nsu
ran
ce
Ret
ail B
roki
ng
432
829
1,106
31-Mar-15 31-Mar-16 31-Mar-17
Credit Ratings
Rating Type Rating Agency
Amount
₹ cr. USD mn.
ST Debt [ICRA] A1 ICRA 200 31
ST Bank Loans [ICRA] A1 ICRA 200 31
LT Debt [ICRA] A+ (on watch with developing implications)
ICRA 100 16
LT Bank Loans [ICRA] A+ (on watch with developing implications)
ICRA 1,000 155
Subordinate Debt [ICRA] A+ (on watch with developing implications)
ICRA 150 23

9
Performance of standalone health insurers
Religare Health Insurance Robust distribution aiding in rapidly achieving scale
Key Highlights
Fourth standalone health insurer to be set up in India
Equity participation of ~5% each by Union Bank of India and
Corporation Bank
Pan-India coverage through 61 offices
Multi-channel distribution strategy through Agency, Brokers,
Corporate Agents, Online and Bancassurance
Gross Written Premium (GWP) of ₹726 cr. (USD 108 mn.) in
FY17; increase of 44% over the previous year
Bouquet of 13 products covering health, personal accident,
critical illness and travel
Gross written premium
Consistently expanding the Hospital Network
GWP
No. of network hospitals PSU Private SAHI
No. of companies 4 18 6
No. of years in existence 42 15 8
GWP* – FY16 (₹ cr.) 16,308 6,908 4,154
GWP* – FY17 (₹ cr.) 20,457 8,324 5,593
YOY Growth 25% 20% 35%
GWP* – FY16 (USD mn.) 2,497 1,058 636
GWP* – FY17 (USD mn.) 3,049 1,240 833
(₹ cr.)
(USD
mn.)
*Health & Personal Accident only; Source: Industry Reports
Len
din
g H
eal
th I
nsu
ran
ce
Ret
ail B
roki
ng
4,409
4,869
5,081
31-Mar-15 31-Mar-16 31-Mar-17
276
503
726
FY15 FY16 FY17
45 77 108
10
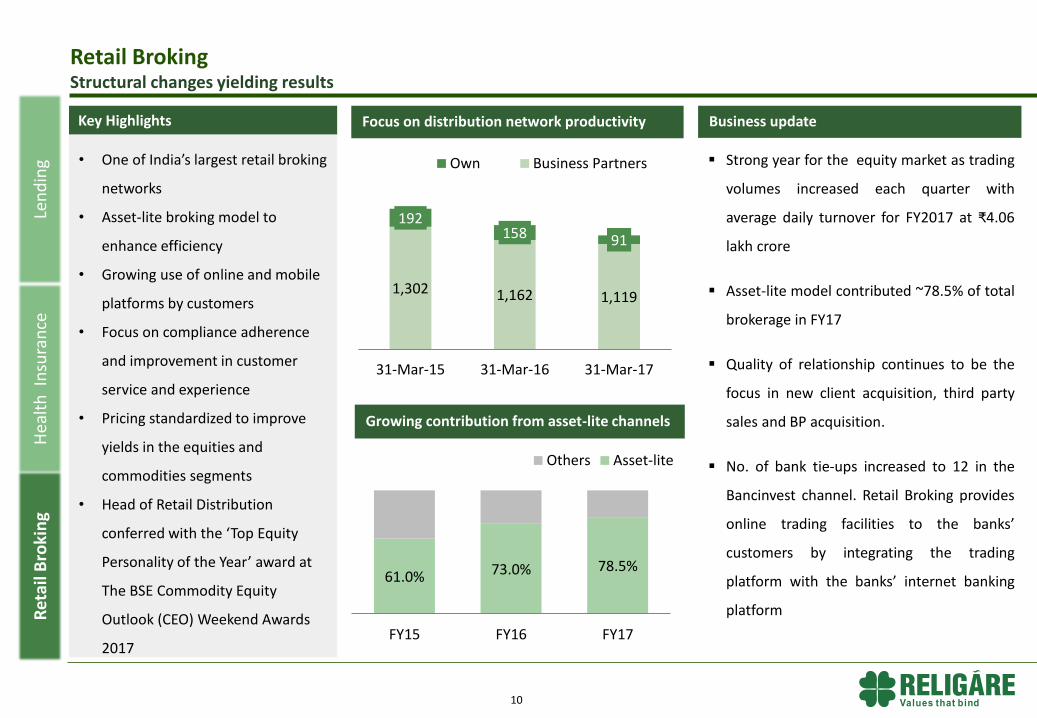
• One of India’s largest retail broking
networks
• Asset-lite broking model to
enhance efficiency
• Growing use of online and mobile
platforms by customers
• Focus on compliance adherence
and improvement in customer
service and experience
• Pricing standardized to improve
yields in the equities and
commodities segments
• Head of Retail Distribution
conferred with the ‘Top Equity
Personality of the Year’ award at
The BSE Commodity Equity
Outlook (CEO) Weekend Awards
2017
Key Highlights Focus on distribution network productivity
Retail Broking Structural changes yielding results
1,015
Growing contribution from asset-lite channels
Business update
Strong year for the equity market as trading
volumes increased each quarter with
average daily turnover for FY2017 at ₹4.06
lakh crore
Asset-lite model contributed ~78.5% of total
brokerage in FY17
Quality of relationship continues to be the
focus in new client acquisition, third party
sales and BP acquisition.
No. of bank tie-ups increased to 12 in the
Bancinvest channel. Retail Broking provides
online trading facilities to the banks’
customers by integrating the trading
platform with the banks’ internet banking
platform
Len
din
g H
ealt
h I
nsu
ran
ce
Ret
ail B
roki
ng
61.0% 73.0% 78.5%
FY15 FY16 FY17
Others Asset-lite
1,302 1,162 1,119
192 158 91
31-Mar-15 31-Mar-16 31-Mar-17
Own Business Partners

Financial Services Opportunity in India
12
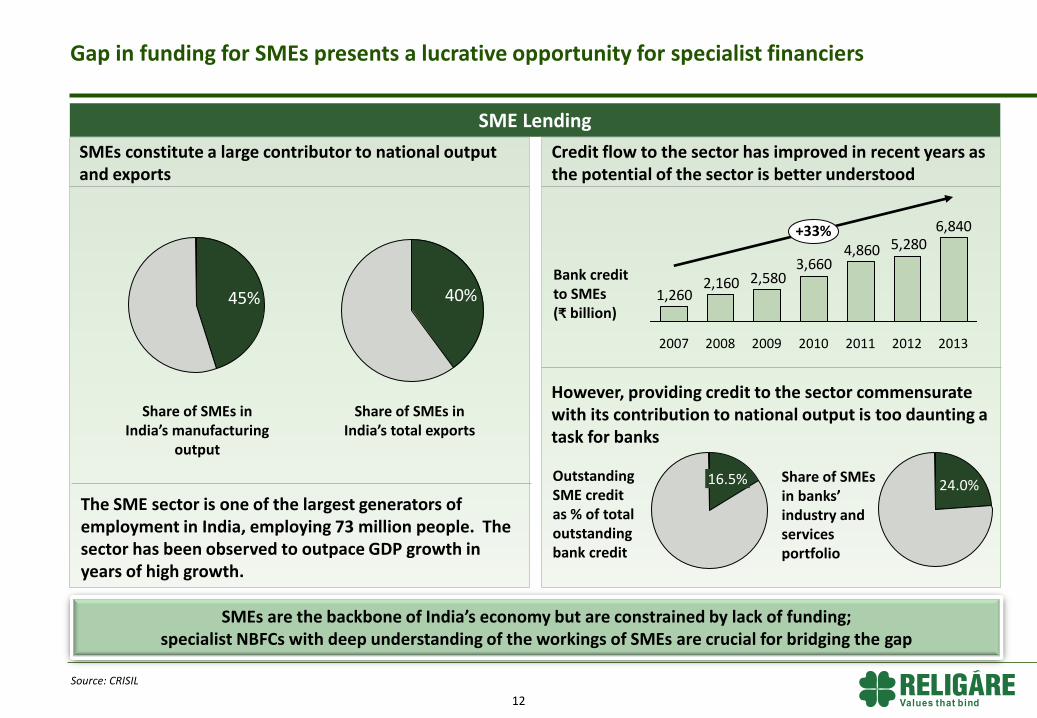
SMEs constitute a large contributor to national output and exports
SME Lending
Share of SMEs in India’s manufacturing
output
40%
Share of SMEs in India’s total exports
Source: CRISIL
Credit flow to the sector has improved in recent years as the potential of the sector is better understood
45%
6,8405,2804,860
3,6602,5802,160
1,260
2013 2009 2012 2011 2007 2008 2010
+33%
24.0% 16.5% Share of SMEs in banks’ industry and services portfolio
Outstanding SME credit as % of total outstanding bank credit
The SME sector is one of the largest generators of employment in India, employing 73 million people. The sector has been observed to outpace GDP growth in years of high growth.
However, providing credit to the sector commensurate with its contribution to national output is too daunting a task for banks
Bank credit to SMEs (₹ billion)
SMEs are the backbone of India’s economy but are constrained by lack of funding; specialist NBFCs with deep understanding of the workings of SMEs are crucial for bridging the gap
Gap in funding for SMEs presents a lucrative opportunity for specialist financiers

Health Insurance is on a high growth trajectory
13
532
33027824714589665428
DE KR BR IN ZA RU JP US
1,259
CN UK
xx% GWP as % of GDP Total premium (USD bn.)
1% 15% 4% 12% 7% 3% 12% 11% 8% 4%
Out-of-Pocket as % of Total Healthcare Expenditure
59%
35%35%31%
11%9%
CN IN RU BR US UK
Healthcare spend as a % of GDP
Source: Reserve Bank of India, World Bank, Economist Intelligence Unit, India Brand Equity Foundation, Karvy, Industry reports, Swiss Re, IRDAI SG=Singapore, MY=Malaysia, KR=S. Korea, JP= Japan, TH=Thailand, IN=India, ID=Indonesia, CN=China, RU=Russia, ZA=South Africa, DE=Germany, UK=United Kingdom, US= United States
Non-life insurance penetration in India is a mere 0.7% and Health Insurance is growing rapidly as healthcare costs are spiraling and share of out-of-pocket expense is among the highest
Health Insurance
17.90%
9.40%9.30%
6.30%5.40%
4.00%
RU CN IN US BR UK
248204
176153132
1128466513222
27%
FY08 FY07 FY06 FY09 FY16 FY15 FY14 FY13 FY12 FY11 FY10
Health Insurance GWP (₹ bn.)

Source: Reserve Bank of India, World Bank, Economist Intelligence Unit, India Brand Equity Foundation, Karvy, Industry reports Market Capitalization for US is of NYSE and for China of Shanghai Stock Exchange; Cash Trading velocity is defined as annual cash turnover divided by market capitalisation; Data for 31-Dec-2013 for all countries except India which is for 31-Mar-2014 SG=Singapore, MY=Malaysia, KR=S. Korea, JP= Japan, TH=Thailand, IN=India, ID=Indonesia, CN=China;
Reallocation across asset classes to revive interest in Equities
14
274061
929395
160
252
CN ID IN TH JP KR MY SG
Market cap*/GDP (%)
54.6
45.5
0.90.43.5
32.2
43.225.3
63.7
2018E
228.4
9.1 11.4
2013
109.9
5.2
18.9
24.3
Others
Mutual Funds
Provident Fund
Small Savings/Cash
Insurance
Bank Deposits/ Bonds
Equity
Distribution of individual wealth in India invested in financial assets (₹ trillion)
Capital Markets
38% xx% Cash Trading Velocity
+162%
30%
104% 143% 106% 45% 33% 304%
Equity-related businesses to benefit from tailwinds as India is under-penetrated c.f. regional peers and a correction to under-ownership of equities is imminent

Religare Enterprises Limited
A-3,4,5, GYS Global, Sector 125, Noida, U.P. – 201301, India