reliability analysis of fire water systems on offshore
TRANSCRIPT

June 2009Bo Henry Lindqvist, MATHGunder Audun Dragsten, Scandpower ASIngar Fossan, Scandpower AS
Master of Science in Physics and MathematicsSubmission date:Supervisor:Co-supervisor:
Norwegian University of Science and TechnologyDepartment of Mathematical Sciences
Reliability Analysis of Fire WaterSystems on Offshore Installations
Morten Nilstad Pettersen

Problem DescriptionThe Petroleum Safety Authority Norway states that it is now allowed to take account for the effectof fire water systems when determining the design heat load for process piping and equipment.The requirement is to present a proper documentation on the effect and the reliability of the firewater system.
The purpose of this thesis is to develop methodology for performing reliability analyses of suchsystems, and to demonstrate the methodology in a case study using software for analysis of faulttrees.
Assignment given: 15. January 2009Supervisor: Bo Henry Lindqvist, MATH

i
PREFACE
This thesis is developed during the spring 2009 and completes the five year Master’s Degree Program in Applied Physics and Mathematics at the Norwegian University of Science and Technology (NTNU). My specialization has been within reliability analysis. The work with the master thesis was a cooperation project between Scandpower Risk Management and the Department of Mathematical Sciences with Professor Bo Henry Lindqvist as the professional supervisor and Senior Consultant Gunder Audun Dragsten as the external supervisor. I would like to thank supervisors Gunder Audun Dragsten and Bo Henry Lindqvist for formidable help and valuable discussions during the work with the thesis. In addition, I would like to thank several persons who contributed to the work with the thesis. These are, among others, Ingar Fossan, Jens Egil Førrisdahl, Gaute Aanestad, Nina Fjærestad, Grete Molland, Olav Tu Husveg, Gry Annette Nilsen Haga and Mary Ann Lundteigen.
Morten Nilstad Pettersen
June 2009, Trondheim

ii
iii
SUMMARY
The background for this thesis is a change in the guidelines provided by the Norwegian petroleum industry regarding design of active and passive fire protection at offshore platforms. Now, it is possible to take into account that deluge systems have a cooling effect for process piping/equipment in the event of a fire. A deluge system is similar to a sprinkler system, except that the nozzles are open and dry upstream because a valve separates the water filled ring main from the nozzles. This allows high velocity suppression of fire water. By including the effect of deluge, passive fire protection may be designed taking into account that the deluge will reduce the heat load during a fire. In order to consider the cooling effect of deluge, proper documentation of the effect of deluge as well as on the reliability of the fire water supply system must be presented. This thesis intends to develop guidelines for how to document the reliability of such systems. A case study of the fire water system at an offshore platform (made anonymous and called Alfa) is performed to demonstrate the reliability analysis method. The analysis of the Alfa platform reveals an availability of the deluge system of 98.92 %. OLF 070 states that the fire water supply system shall be in compliance with a SIL 2 demand. Hence, the probability of failure on demand shall fulfill 0.001 PFD 0.01. The analysis results show that the PFD is on the upper limit of this demand. However, it is expected that the real PFD is higher than this estimate because failures of blocking of nozzles are not considered due to lack of data sources. The analysis of the Alfa platform involves a fault tree analysis with both qualitative and quantitative interpretation. The quantitative approach consists of minimal cut set analysis, importance analysis and sensitivity analysis. The analysis shows that the fire water systems unavailability is most dependent on the reliability of the deluge valves. The deluge valves constitute 95.5 % of the total unavailability. A study to improve the reliability of the valves may be appropriate to improve the system reliability. In addition, it is shown that by designing fire areas that depends on one deluge valves instead of two decreases the system unavailability to about 50 % of the original unavailability. A data dossier is developed for the quantitative analysis of the Alfa fire water system. The work revealed lack of reliable generic data sources as well as reliable test data. The main challenges was to estimate reliability parameters for the deluge valves, the logic nodes, hydraulic systems in addition to blocking of nozzles due to corrosion and marine fouling. According to the operator, there are problems with the interpretation of test data due to problems with test routines. Since it is important that the fire water system is available on demand at all times, it is necessary to perform active maintenance immediately if a failure occurs. Hence, it happens that operators repair the failures and do not register this as a failure in the maintenance database. This implies that the number of failures in the test data is below the real values. The demand for reliable data sources on fire water systems is expected to increase due to the new regulations. This report suggests that a follow-up project should focus on developing a fire water system data dossier that can be used in similar reliability analyses. The ambition should be to quality assure the available data and to use the test data from companies operating on the Norwegian Continental Shelf to develop estimates to the components mentioned above where there are no available estimates.

iv
v
Contents
PREFACE I
SUMMARY III
LIST OF ABBREVIATIONS VIII
1. INTRODUCTION 1
1.1 Problem Description 1
1.2 Relevant Work 2
1.3 Report Outline 2
1.4 Anonymous Data 2
2. BACKGROUND 3
2.1 Risk Analysis in the Offshore Industry 3
2.1.1 Total Risk Analysis (TRA) 3
2.1.2 Design Accidental Load in Risk Analysis 4
2.2 Fire Fighting Systems 4
2.2.1 Active Fire Fighting 5
2.2.2 Passive Fire Fighting 5
2.3 Effect of Deluge 5
2.4 Design of Fire Protection Systems 6
2.5 Piper A – Example of Loss of Fire Protection Barriers 6
3. MATERIALS AND METHODS 9
3.1 Case Study 9
3.2 Hazard Identification 9
3.3 Fault Tree Analysis 9
3.3.1 Minimal Cut and Path Sets 10
3.4 Common Cause Failure Models 10
3.4.1 Configuration Factor 12
3.5 Failure Rates 13
3.5.1 Test Interval 14
3.6 RiskSpectrum Fault Tree Analysis 15
3.6.1 Periodically Tested Component 15
3.6.2 Mean Unavailability of CCF Events and Basic Events Assigned with CCF 16
3.6.3 Minimal Cut Set Analysis 17
3.6.4 Probability Calculation of Top Event 17
3.6.5 Importance Analysis 18
3.6.6 Sensitivity Analysis 20
4. DELUGE SYSTEMS 21
4.1 General Deluge System Description 21
4.2 Deluge System Boundary 22
4.3 Regulations and Demands for Deluge Systems 23
4.3.1 Fire Water Supply 23
4.3.2 Deluge System 24
4.3.3 Survivability Requirements 25
4.3.4 The Operator’s Technical Requirements for Deluge Systems 25
4.3.5 Performance Documentation and Safety Integrity Level 26
vi
5. SYSTEM DESIGN AND RELIABILITY 29
5.1 Combined Sea Water and Fire Water Systems 29
5.2 F&G Detectors 29
5.3 Deluge System Logic 31
5.4 Fire Water Pump Packages 32
5.5 Diesel Engine 32
5.6 Fire Water Pumps 34
5.7 Water Intake and Pipelines 35
5.7.1 Corrosion 37
5.7.2 Marine Fouling 37
5.7.3 Particles 38
5.7.4 Measures against Marine Fouling 38
5.7.5 Material Selection 38
5.8 Deluge Valves 41
5.9 Deluge Nozzles 42
5.10 Test Routines for Deluge Systems 43
5.10.1 Start Procedure of Fire Water Pumps 43
5.10.2 Capacity Test of Fire Water Pumps 44
5.10.3 Test of Start Sequence for Fire Water Pumps 44
5.10.4 Deluge Valves 44
5.10.5 Deluge Nozzles 44
5.10.6 Summary of Test Routines 45
5.10.7 Experiences of Test Routines 45
5.11 Reliability Test Data 46
6. CASE STUDY – ALFA 47
6.1 System Description 47
6.1.1 Pump Packages 49
6.1.2 Pump Arrangement 50
6.1.3 Diesel Engine System 51
6.1.4 Firewater Jockey Pump 52
6.1.5 Firewater Ring Main 53
6.1.6 Deluge Valve Skid 53
6.1.7 Deluge Nozzles 54
6.1.8 Water Filled Jacket Legs 54
6.1.9 Construction Materials 55
6.2 Procedures 55
6.2.1 Start of Fire Water Pumps 55
6.2.2 System Test Procedures 56
6.2.3 Chemical Injection 56
6.2.4 System Maintenance 56
6.3 Fault Tree Modeling 56
6.3.1 System Boundaries 56
6.3.2 Fault Tree 57
6.4 Quantitative Analysis 61
6.4.1 Case Description 61
6.4.2 Reliability Input Data 61
6.4.3 Summary of Top Event Unavailability 62
6.4.4 Minimal Cut Set Analysis 62
6.4.5 Importance Analysis 63
6.4.6 Sensitivity Analysis 64
vii
6.4.7 Group Contribution to Unavailability 65
6.4.8 Sensitivity Analysis of Group Contribution 66
6.4.9 Sensitivity Analysis of Parameters 67
6.5 Summary of the Case Study Analysis 67
7. DISCUSSION 69
7.1 Results and Recommendations 69
7.2 Future Work 72
BIBLIOGRAPHY 74
APPENDIX 77
A. DATA DOSSIER 77
A.1 Data Sources 77
A.1.1 OREDA 78
A.1.2 PDS Data Handbook 79
A.1.3 OLF 070 79
A.1.4 Test Data for the Alfa Platform 80
A.2 Obtained Reliability Data Input for Quantitative Analysis 80
A.3 Diesel Engine excl. Starter System 81
A.4 Diesel Engine Starter System 82
A.5 Dump Drain Valve 83
A.6 Air Release Valve 84
A.7 Booster Pump 85
A.8 Sea Water Lift Pump 86
A.9 Main Hydraulic Pump 87
A.10 Hydraulic Motor 88
A.11 Hydraulic Oil Heat Exchanger 89
A.12 Deluge Valve including Solenoid 90
A.13 Deluge System Logic 91
A.14 Blockage of Nozzles 92
A.15 Blockage of Water Intake 93
B. FAULT TREE 95
B.1 Main Fault Tree 95
B.2 Deluge Valves Fails to Open 96
B.3 Nozzle Blockage or Reduced/Fail Flow 97
B.4 Pump System A Fails 98
B.5 Pump System B Fails 99
B.6 Pump System C Fails 100
B.7 Pump System D Fails 101
C. RISK SPECTRUM ANALYSIS RESULTS TABLES 103
C.1 Minimal Cut Set Analysis 103
C.2 Importance Analysis 104
C.3 Sensitivity Analysis of Parameters 106
viii
LIST OF ABBREVIATIONS
AFFF Aqueous Film Forming Foams ALARP As Low As Reasonably Practicable BARG Gauge Pressure CCF Common Cause Failures CCR Central Control Room DAL Designing Accidental Load DD Dangerous Detected DU Dangerous Undetected F&G Fire and Gas FAR Fatal Accidental Rate FC Fractional Contribution FTA Fault Tree Analysis FV Fussell-Vesely FW Fire Water GRP Glass Reinforced Plastic HAZID Hazard Identification HSE Health and Safety Executive IEC International Electro-technical Commission ISO International Organization for Standardization OLF The Norwegian Oil Industry Association KooN K out of N MCS Minimal Cut Set MTTR Mean Time to Repair NFPA National Fire Protection Association NORSOK Norwegian Offshore Standardization Organization NONC None-Critical NPD Norwegian Petroleum Directorate NTNU Norwegian University of Science and Technology OREDA Offshore Reliability Data QRA Quantified Risk Analysis P&ID Piping and Instrumentation Drawing PDS Reliability of Data for Safety Instrumented Systems PFD Probability of Failure on Demand PSA Petroleum Safety Authority Norway RDF Risk Decrease Factor RIF Risk Increase Factor RNNS Risk Level on the Norwegian Continental Shelf SIL Safety Integrity Level SIS Safety Instrumented Systems SINTEF NBL Norwegian Fire Research Laboratory UPS Uninterruptible Power Supply
1
1. INTRODUCTION
The petroleum industry forms the cornerstone of the Norwegian economy. In 2006, the value of the production within the oil and gas industry in Norway amounted to NOK 565 billion with around 32 000 employees (1). The petroleum industry consists of installations with high installation and operating costs. Due to high production capacity and high oil prices, the earnings from petroleum production are enormous. It is evident that the regularity of production needs to remain at a high level. Shut down or loss of installations due to loss of safety functions does not only lead to a high risk for the personnel involved, but does also means high costs for the companies involved and the Norwegian society. Hence, safety and regularity is one of the major focus areas for the companies operating within the petroleum industry. An offshore installation is a floating process facility with a large amount of highly flammable hydrocarbons present during operation. One of the worst case scenarios for the safety of an oil platform is escalating fire due to ignition of hydrocarbons. An ignition of hydrocarbons may lead to loss of human lives and installation. Thus, development of barriers against fires and explosions requires expensive investments.
1.1 Problem Description
A change in NORSOK1 standard S-001(2) in February 2008 is of importance for the risk analysis regarding fire safety for petroleum installations. Previously, it was not allowed to take into account the cooling effect of deluge systems for process piping/equipment when determining the design heat load the equipment may withstand. A deluge system is similar to a sprinkler system. However, the nozzles are open and dry upstream because a valve separates the water filled ring main from the nozzles. Hence, it is possible with high velocity suppression of fire water. The deluge systems are located in high hazards areas. After the change of S-001 in 2008, it is allowed to take the effect of the deluge system into account in risk analyses. However, it is only allowed to do this for process piping/equipment and not for main structural systems and fire partitions. Further, proper documentation of the effect of the deluge system in addition to the reliability of the firewater supply system must be attached in a risk analysis. Since this is a new regulation, there has been sparse focus on performing such extensive documentation of the reliability of deluge systems. However, both petroleum companies and consultancy companies are now interested in obtaining documentation of the deluge systems, both reliability and the effect of deluge, to be able to take such systems into account when determining heat loads. The aim of this work is to provide such proper documentation of the deluge systems. It is supposed that proper documentation, as S-001 states, means complete system descriptions, component and system reliability/vulnerability in addition to the effect of the deluge systems to different fire scenarios and the cooling effect on equipment.
1 NORSOK Standards are developed supported by the Norwegian Oil Industry Association (OLF), The Federation of Norwegian Industry, Norwegian Shipowners’ Association and The Petroleum Safety Authority Norway. The standards intend to adapt oil company routines to the regulations of the authorities.
2
This report will be limited to system description and reliability/vulnerability study of deluge systems. Analyses of the effect of deluge for process equipment will not be discussed.
1.2 Relevant Work
There are several different reports and documents that describe reliability issues of parts of the deluge systems, such as corrosion problems (3)(4), fire water pumps (5) etc. However, these studies perform analyses at a more general level than wanted for this study. It is not, as far as the research has shown, earlier developed a frameset for how to perform reliability analyses of deluge systems.
1.3 Report Outline
This report is made up by several different parts. The main parts are
• Section 2: Background The background for the problem is discussed with focus on risk analysis, fire fighting systems and an example of the importance of fire fighting systems.
• Section 3: Materials and Methods The qualitative and quantitative methods that are used in the analysis is explained in this chapter. The main focus is on the quantitative methods in RiskSpectrum, the reliability software used in the analysis.
• Section 4: Deluge Systems There are several requirements and regulations regarding deluge systems that the offshore companies need to fulfill. The regulations are discussed in this chapter.
• Section 5: System Design and Reliability This chapter explains how deluge systems look like and presents various designs and identifies possible hazards. In addition, the chapter presents test routines for such systems.
• Section 6: Case Study – Alfa This chapter provides a reliability analysis of an example installation with system description, fault tree modeling, and quantitative analysis.
• Section 7: Discussion The results of the thesis are discussed and further work is proposed.
• Appendix A, B and C The appendix contains the data dossier for the quantitative analysis, the fault trees and different table outputs from RiskSpectrum.
1.4 Anonymous Data
On request from the operator that has contributed with data in this analysis, both operator and platforms are made anonymous. The test case platform referred to in this report is defined as Alfa. In addition, some references to internal documents of the operator of Alfa are referred to as Alfa Operator in the reference list.
3
2. BACKGROUND
Norwegian authorities intend to maintain a low risk level for companies operating on the Norwegian Continental Shelf to minimize the risk for major accidents. However, it is impossible to enforce this without defined requirements. Hence, the authorities have developed different quantified risk measures to ensure high safety for all companies. This enforces the companies to prove with quantitative analyses that their safety systems are as required.
2.1 Risk Analysis in the Offshore Industry
The first conceptual Quantified Risk Analysis (QRA) was developed in the offshore industry in the late 1970’s (6). During the early stages of the offshore industry, risk assessment was not a prioritized research field. However, after severe accidents such as Alexander L. Kielland2 and Piper Alpha (Read more in Section 2.5), the Norwegian government started to issue guidelines for the petroleum companies operating on the Norwegian Continental Shelf. One year after the Alexander Kielland accident, the Norwegian Petroleum Directorate (NPD) stated new regulations for the offshore industry. NPD stated a risk acceptance
criterion of a maximum accident ratio per platform of 1 · 10�� per year for major accidents. This gave Norway a pioneer position within offshore safety. For many years, Norway was the only country with statutory QRA. In 1990, based on experiences from the Piper Alpha accident, UK authorities declared that QRA demands should be implemented for the petroleum industry based on the Norwegian model. Later, the regulations and directives have been modified several times and the guidelines are given in NORSOK Z-013 (7). Today, United Kingdom, Canada, Australia and Norway are the only countries with legislation calling for QRA studies in the design and operation phase for the offshore industry.
2.1.1 Total Risk Analysis (TRA)
A Total Risk Analysis is a QRA performed for an entire installation. The main purpose of a TRA is to examine if the safety of the installation is sufficient with respect to predetermined safety levels. One typical measure of risk at an installation is fatality rate (FAR) values. This refers to the expected number of fatalities for 100 million exposed hours of the personnel. Another measure is frequency of accidents. The authorities have defined maximum values for both FAR-values and frequency of accidents. A Total Risk Analysis will reveal if the safety is within the predefined guidelines and restrictions. When developing a TRA, all equipment and accident scenarios at the installation are examined. That means ship collisions, fires, gas leaks, escape routes, explosions, etc. For example, different fire scenarios are modeled with respect to design, equipment etc. to discover what the effect of the fire will be. For an offshore platform, a TRA will typically is made by 1000 work hours (6).
2 Alexander L. Kielland, a semi-submersible flotel, capsized on 27 March 1980 at the Ekofisk field. 123 persons
died and 89 survived in the worst accident on the Norwegian Continental Shelf (6).
4
2.1.2 Design Accidental Load in Risk Analysis
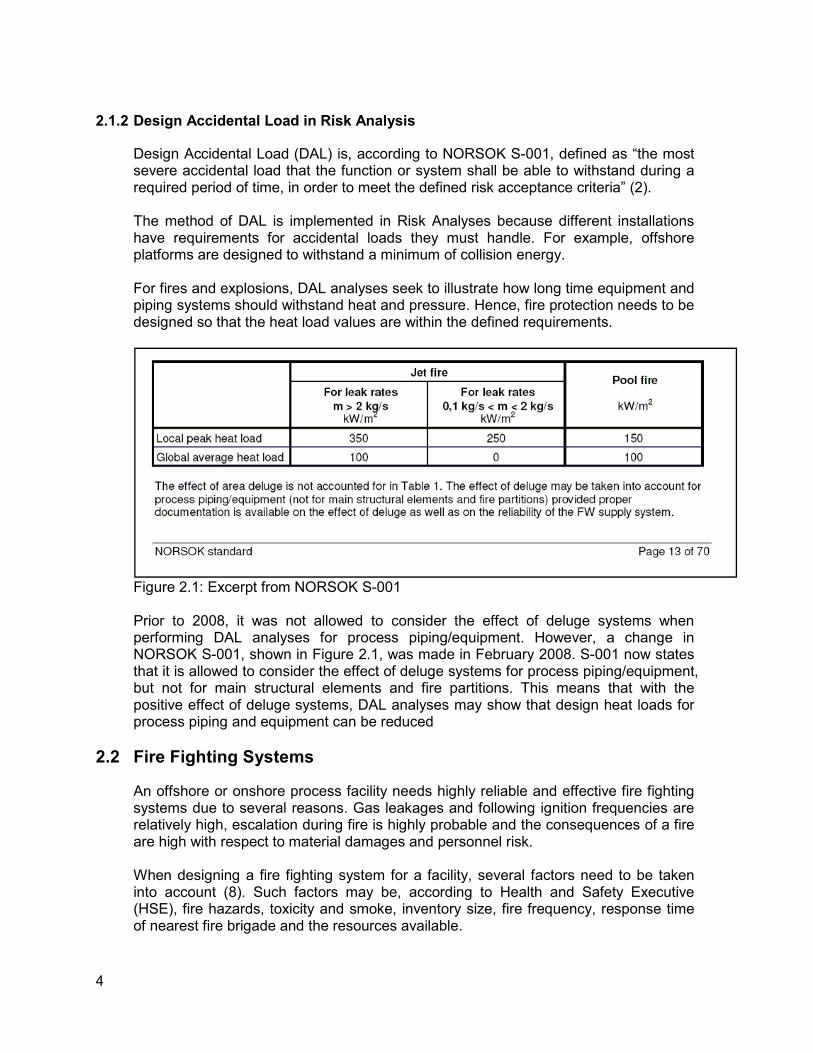
Design Accidental Load (DAL) is, according to NORSOK S-001, defined as “the most severe accidental load that the function or system shall be able to withstand during a required period of time, in order to meet the defined risk acceptance criteria” (2). The method of DAL is implemented in Risk Analyses because different installations have requirements for accidental loads they must handle. For example, offshore platforms are designed to withstand a minimum of collision energy. For fires and explosions, DAL analyses seek to illustrate how long time equipment and piping systems should withstand heat and pressure. Hence, fire protection needs to be designed so that the heat load values are within the defined requirements.
Figure 2.1: Excerpt from NORSOK S-001 Prior to 2008, it was not allowed to consider the effect of deluge systems when performing DAL analyses for process piping/equipment. However, a change in NORSOK S-001, shown in Figure 2.1, was made in February 2008. S-001 now states that it is allowed to consider the effect of deluge systems for process piping/equipment, but not for main structural elements and fire partitions. This means that with the positive effect of deluge systems, DAL analyses may show that design heat loads for process piping and equipment can be reduced
2.2 Fire Fighting Systems
An offshore or onshore process facility needs highly reliable and effective fire fighting systems due to several reasons. Gas leakages and following ignition frequencies are relatively high, escalation during fire is highly probable and the consequences of a fire are high with respect to material damages and personnel risk. When designing a fire fighting system for a facility, several factors need to be taken into account (8). Such factors may be, according to Health and Safety Executive (HSE), fire hazards, toxicity and smoke, inventory size, fire frequency, response time of nearest fire brigade and the resources available.
5
Fire fighting systems are divided into two function groups, active fire fighting and passive fire fighting.
2.2.1 Active Fire Fighting
The purpose of active fire fighting is to extinguish developed fires, control fire and to provide exposure protection to prevent domino effects (8). There are several various systems. Examples of such systems are foam pourers, water monitors, sprinkler systems, deluge systems and gas flooding systems. One process facility may have several fire fighting systems, depending on the possible fire scenarios. An active fire fighting system needs to be reliable and there are several standards defined for the offshore industry for the design if such systems. Since the consequences of a fire or an explosion is significant, these systems need be designed with as high reliability as possible.
2.2.2 Passive Fire Fighting
Passive fire fighting is always used in addition to active fire fighting. The main purpose of such systems is to decrease the probabillity for gas leakages, ignition and to slow down the fire escalation. Passive fire fighting may be coating of equipment with fire resistant material, partitioning of the process facility in fire compartments, fire walls etc. Passive fire fighting systems are never used without active fire protection, but are designed to resist fires for only relatively short heat exposure (1-2 hours) (8).
2.3 Effect of Deluge
Release of deluge is assumed to reduce the heat load from a fire. The effect of deluge has been tested with medium to full-scale experiments by SINTEF National Fire Research Laboratory (9). The experiments show that release of deluge reduces the global average heat load. This means that for example pipe systems are exposed to less heat with deluge than without deluge. However, the tests show that deluge systems do not reduce the heat load from jet fires (referred to as “local peak heat load” in NORSOK S-001). With jet fires, the water from the deluge system is blown away.
Several papers focus on the mitigation of gas explosions using water deluge (10)(11). A gas cloud that is showered with water has a lower probability for ignition than with deluge systems not present. Hence, deluge systems do not only reduce the global heat load with an already existing fire, but reduces the probability for fire or explosion if released on a gas cloud.
6
2.4 Design of Fire Protection Systems
The design of fire protection is a process where several aspects need to be considered. First of all, it shall be the priority to minimize possible leakages from piping systems. Most fires on petroleum installations occur because of leakages of hydrocarbons. Hence, it is obvious that efforts are made to keep the leakage frequency as low as possible. A report on leakage frequency (12) shows that most gas leakages on the Norwegian Continental Shelf occur due to operator errors, quality degradation and isolations errors. Hence, lower leakage frequency may be obtained by reducing those failures. Further, fire protection design is an exercise in the trade-off between active and passive fire protection in relation to reliability and cost. An engineer may evaluate that the cooling effect of deluge means that the expensive passive fire protection (as anti-fire material coating) may be reduced. Because of this it is of great importance to perform an extensive consequence analysis. Deluge systems may fail to deliver sufficient fire water coverage. Hence, an analysis must be performed, for example by the method of event trees, to evaluate what is the consequence in case of incomplete deluge coverage. If the consequence of failure of the deluge system is loss of installation, it is evident that the reliability of the deluge system must be high in order to use deluge systems to obtain sufficient heat load capacity. In addition, extensive use of passive fire protection may itself lead to a higher leak frequency and thus more initiated fires according to experts. This relates to the fact that anti fire material coating may lead to more corrosion because it may be water between the coating and the pipeline. This may lead to pipe rupture and hence leakage of hydrocarbons. Hence, designing a fire protection system is a complex engineering field where several aspects need to be taken into consideration.
2.5 Piper A – Example of Loss of Fire Protection Barriers
The Piper A accident is a catastrophic example of what can happen if the fire-water barrier is not working as expected. The following brief summary is based on Vinnem’s description of the accident (6). On 6th of July 1988, a gas leak occurred by repeated attempts to start a compressor. It should not have been started at all because it was out for maintenance. The gas leaked out of a blind flange3 because the downstream piping was isolated. After a few seconds, the gas was ignited from an unknown ignition source. Hence, it was a failure of the ignition control barrier. The result was an explosion that led to an escalating oil fire. Because of ongoing diving near the water intakes of fire water system, the fire water pumps were set in manual mode. Hence, none of the pumps started after the gas was ignited and further escalation was impossible to stop. After about 20 minutes, a gas riser rupture made the fire escalation increase rapidly.
3 A blind flange is a flange that closes the end of a pipe
7
The personnel expected, based on evacuation routines, to be evacuated by helicopters. However, due to heavy smoke and fire, this was impossible. Piper A is later referred to as the world’s worst offshore accident. 166 of the Piper A personnel died in the accident. There were 63 survivors in total, most of them rescued by jumping in the sea and waiting for nearby vessels. Piper A has led to great changes in how safety on offshore installations is considered. The accident could have been avoided with successful barriers such as improved design, fire fighting systems, ignition control and better evacuation routines. The experiences from Piper A are a tragic example of the importance of a highly reliable fire fighting barriers.

8
9
3. MATERIALS AND METHODS
This section intends to explain the methods that are used in this project. These methods do especially concern the quantitative methods for the fault tree analysis performed.
3.1 Case Study
This report seeks to define both a frameset for doing reliability studies of deluge systems and performing an example of such an analysis. Thus, the work includes a case study. The Alfa platform has been chosen to be the case study. The platform was chosen because it has a standalone fire water system (not combined with normal sea water) and it has been operated for about 20 years. However, the fire water system is still representative for new installations.
3.2 Hazard Identification
In order to perform a quantitative analysis, it is necessary to develop a qualitative analysis of the system. This implies to develop a description of the system to be analyzed. Further, it is important to perform a Hazard Identification (HAZID) of the system to be able to develop a fault tree. The HAZID should be performed together with the operator and the vendors of the different systems at the platform.
According to Vinnem (6), the purpose of the HAZID is to explore the total system and identify all possible hazards. Such analyses give the engineers a basis for further analysis and quantification. The results of the HAZID for Alfa are presented together with the fault tree in Section 6.3.
3.3 Fault Tree Analysis
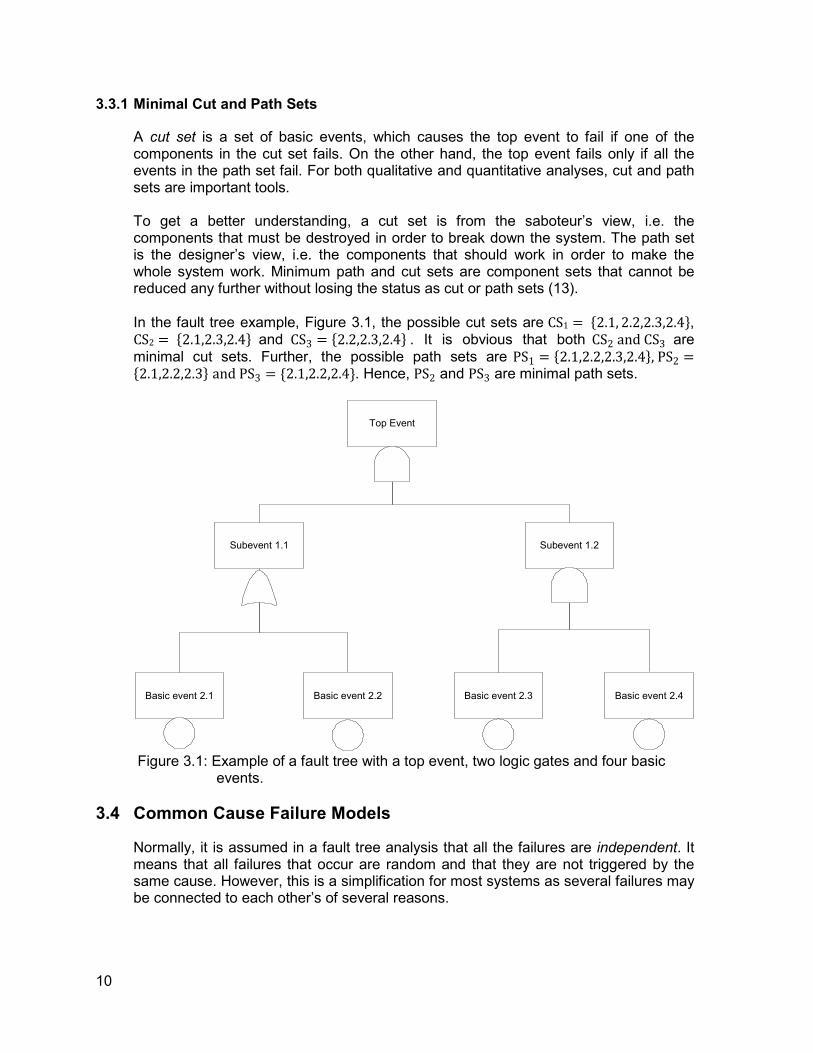
Fault tree analysis (FTA) is a qualitative analysis method with the possibilities for a quantitative approach. A FTA is based on a desired fault event, a top event. In case of deluge systems, a top event may be “fail to deliver fire water on demand”. There should be only one top event. Thus, several fault trees must be made if different top events will be analyzed. Figure 3.1 is an example of a simple fault tree. A FTA analysis is a top-down approach and is split down to basic events through logic gates. The method is based on the assumption that an event occurs if one or all of the underlying events occur. For each of the basic events, a reliability model must be assessed in a quantitative analysis. The possible logic gates used in this analysis is OR and AND-gates. An OR-gate implies that only one of the underlying events has to occur to cause a failure of the event. With an AND-gate, all the underlying events must occur to lead to a failure. The analysis of the reliability of a deluge system assumed that the system is a safety standby system. It means that it only have to operate on demand, and not continuously as other systems.
10
3.3.1 Minimal Cut and Path Sets
A cut set is a set of basic events, which causes the top event to fail if one of the components in the cut set fails. On the other hand, the top event fails only if all the events in the path set fail. For both qualitative and quantitative analyses, cut and path sets are important tools. To get a better understanding, a cut set is from the saboteur’s view, i.e. the components that must be destroyed in order to break down the system. The path set is the designer’s view, i.e. the components that should work in order to make the whole system work. Minimum path and cut sets are component sets that cannot be reduced any further without losing the status as cut or path sets (13). In the fault tree example, Figure 3.1, the possible cut sets are CS1 � �2.1, 2.2,2.3,2.4�, CS2 � �2.1,2.3,2.4� and CS3 � �2.2,2.3,2.4� . It is obvious that both CS2 and CS3 are minimal cut sets. Further, the possible path sets are PS1 � �2.1,2.2,2.3,2.4�, PS2 ��2.1,2.2,2.3� and PS3 � �2.1,2.2,2.4�. Hence, PS2 and PS3 are minimal path sets.
Figure 3.1: Example of a fault tree with a top event, two logic gates and four basic
events.
3.4 Common Cause Failure Models
Normally, it is assumed in a fault tree analysis that all the failures are independent. It means that all failures that occur are random and that they are not triggered by the same cause. However, this is a simplification for most systems as several failures may be connected to each other’s of several reasons.
Top Event
Subevent 1.1 Subevent 1.2
Basic event 2.1 Basic event 2.2 Basic event 2.3 Basic event 2.4
11
Fire water systems include several components that are redundant. Redundancy is introduced to increase the reliability because these are systems in parallel, which means that failure of one component does not affect the system reliability. However, it is important to realize that redundant systems may have common cause failures (CCF). According to the PDS handbook (14), one should distinguish between independent and dependent failures. Independent failures are known as random failures to the hardware due to natural reasons. On the other hand, dependent failures may occur of several reasons. These are systematic failures caused by for example design failures, external forces, human interaction. Such failures may cause all similar redundant components to fail, but not necessarily simultaneously in time. The standard Beta-factor model (15) states that the probability for a CCF between components is ��common cause failure( � ). Hence, the probability for an independent failure of a component assigned in a common cause failure group is ��independent failure of component( � �1 , )( - ��independent failure without CCF( . Figure 3.2 illustrates the structure of a common cause failure model in a reliability block diagram. A simple calculation (16) example illustrates the behavior of common cause failures. If there are three redundant components in parallel, each with probability of failure �01234312315 � 1 - 10�6, the probability that all components fail simultaneously
will be �787539 :;0<=>3 � �1 - 10�6(6 � 1 - 10�?. However, if we assume that there is a
common cause failure fraction of ) � 0.05, then there may be a common cause failure
with probability�@@A � 1 - 10�6 - 5 - 10�B � 5 - 10�C. Hence, the probability of a system failure is caused by the common cause failure is a factor 50 000 times the probability of an independent system failure. This illustrates the importance of including common cause failures in a fault tree model.
Common cause failure modeling shall always be included when building a fault tree with components that are related according to design, location, maintenance routines etc. It is almost impossible to design a system without any sort of common cause failures. However, it is always the intention to get the common cause failure Beta-factor as low as reasonably possible since the impact of the Beta-factor is large as the example above illustrates. However, as the following section will show, the standard Beta-factor does only comply with 1oo2 voting logics. Figure 3.3 illustrates how a fault tree for a component assigned with a CCF group is looks like. The component fails either if there is an independent failure or if a common cause failure causes all the components in the CCF groups to fail.
12
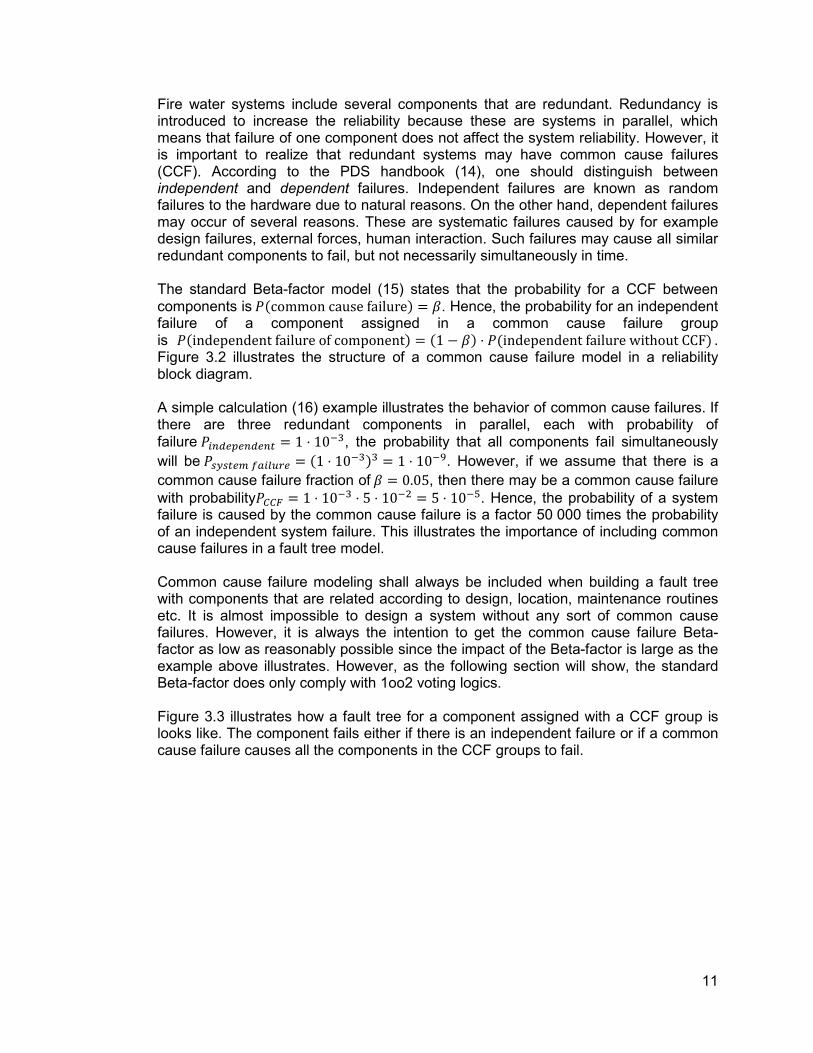
Figure 3.2: Illustration of common cause failures with a reliability block diagram
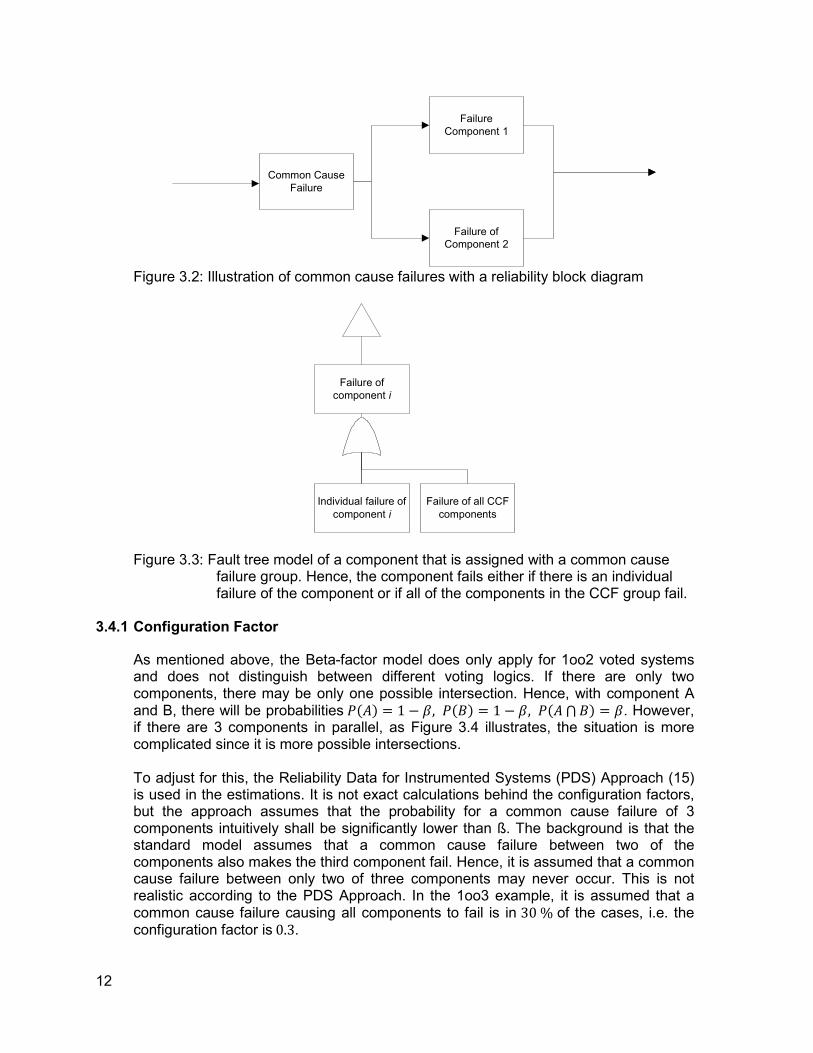
Figure 3.3: Fault tree model of a component that is assigned with a common cause failure group. Hence, the component fails either if there is an individual failure of the component or if all of the components in the CCF group fail.
3.4.1 Configuration Factor
As mentioned above, the Beta-factor model does only apply for 1oo2 voted systems and does not distinguish between different voting logics. If there are only two components, there may be only one possible intersection. Hence, with component A and B, there will be probabilities ��D( � 1 , ), ��E( � 1 , ), ��D F E( � ). However, if there are 3 components in parallel, as Figure 3.4 illustrates, the situation is more complicated since it is more possible intersections. To adjust for this, the Reliability Data for Instrumented Systems (PDS) Approach (15) is used in the estimations. It is not exact calculations behind the configuration factors, but the approach assumes that the probability for a common cause failure of 3 components intuitively shall be significantly lower than ß. The background is that the standard model assumes that a common cause failure between two of the components also makes the third component fail. Hence, it is assumed that a common cause failure between only two of three components may never occur. This is not realistic according to the PDS Approach. In the 1oo3 example, it is assumed that a common cause failure causing all components to fail is in 30 % of the cases, i.e. the configuration factor is 0.3.
Common Cause
Failure
Failure
Component 1
Failure of
Component 2
Failure of
component i
Individual failure of
component i
Failure of all CCF
components
13
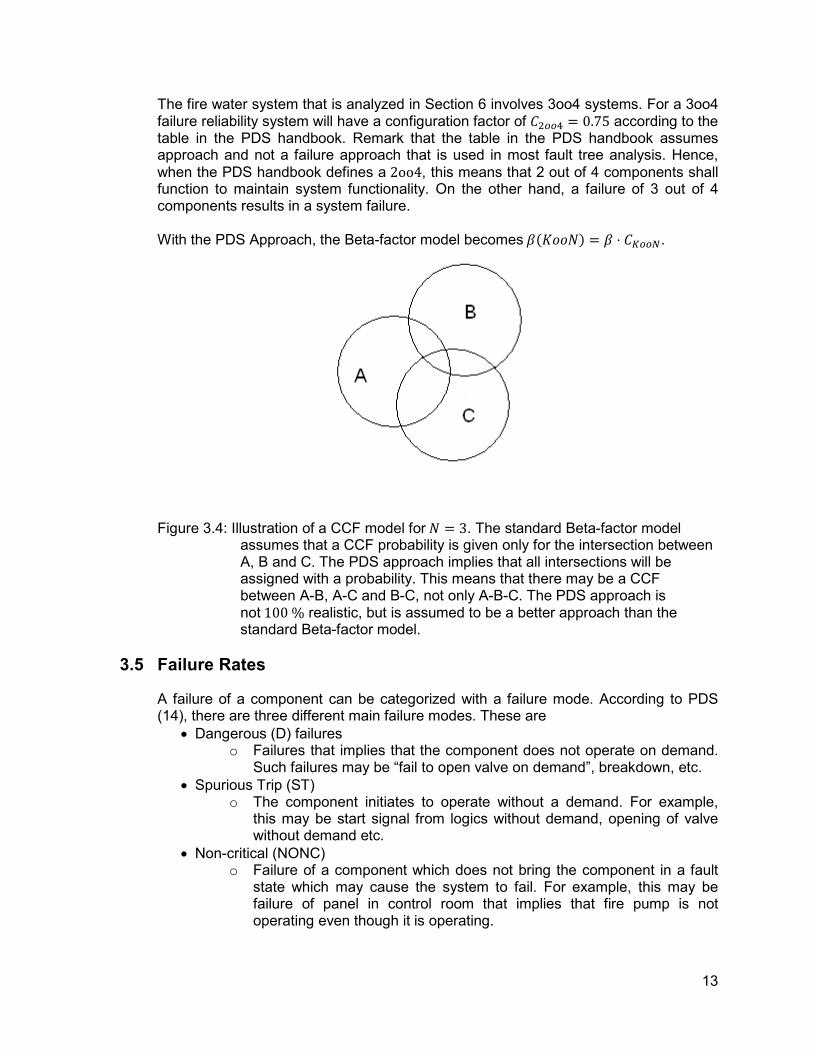
The fire water system that is analyzed in Section 6 involves 3oo4 systems. For a 3oo4 failure reliability system will have a configuration factor of GBHH� � 0.75 according to the table in the PDS handbook. Remark that the table in the PDS handbook assumes approach and not a failure approach that is used in most fault tree analysis. Hence, when the PDS handbook defines a 2oo4, this means that 2 out of 4 components shall function to maintain system functionality. On the other hand, a failure of 3 out of 4 components results in a system failure. With the PDS Approach, the Beta-factor model becomes )�JKKL( � ) - GMHHN.
Figure 3.4: Illustration of a CCF model for L � 3. The standard Beta-factor model
assumes that a CCF probability is given only for the intersection between A, B and C. The PDS approach implies that all intersections will be assigned with a probability. This means that there may be a CCF between A-B, A-C and B-C, not only A-B-C. The PDS approach is not 100 % realistic, but is assumed to be a better approach than the standard Beta-factor model.
3.5 Failure Rates
A failure of a component can be categorized with a failure mode. According to PDS (14), there are three different main failure modes. These are
• Dangerous (D) failures o Failures that implies that the component does not operate on demand.
Such failures may be “fail to open valve on demand”, breakdown, etc.
• Spurious Trip (ST) o The component initiates to operate without a demand. For example,
this may be start signal from logics without demand, opening of valve without demand etc.
• Non-critical (NONC) o Failure of a component which does not bring the component in a fault
state which may cause the system to fail. For example, this may be failure of panel in control room that implies that fire pump is not operating even though it is operating.
14
In this analysis, it is the intention to examine when the fire water system does not operate on demand. Hence, only the dangerous failures are interesting. However, it is only the intention to analyze the failures that are only detected during a demand for operation. The failures that are detected immediately as they occur are not interesting as they do not contribute significantly to the system unavailability unless the repair time is long. Hence, the dangerous failures are divided in two categories
• Dangerous undetected (DU) o Dangerous failures that are only detected when there is a demand for
the system. Hence, such failures may be discovered through a function test.
• Dangerous detected (DD) o Dangerous failures that are detected immediately when they occur by
self-testing or monitoring. The dangerous failure rate of a component can be defined as OP � OPQ R OPP. As this analyze seeks to obtain OPQ , it is necessary to obtain the fraction of dangerous detected failures.
3.5.1 Test Interval
Since a dangerous undetected failure may only be discovered during a test, the test interval is important for the failure rate of the component. Evidently, a failure of a component may occur somewhere between the tests and cause an unavailability. Consequently, the obtained probability of failure on demand for a component will be approximately �ST U OPQ - V/2 Here, V is the component’s defined test interval. When assuming a contribution from common cause factors and assuming the PDS approach, this yields the estimate �ST U GMHHN - ) - OPQ - V/2 Since water systems are safety standby systems, periodically testing is obvious to obtain an acceptable reliability. The equation above for the PFD of components proves that the time interval between tests is a design consideration. To optimize the failure rate of a component, engineers shall take into account several factors, as component materials, maintenance program and test interval. It is important to take into consideration that too frequent testing may cause wear-out and hence an increased failure rate (17). In addition, it is important to be aware that the system may be out for service if a test is ongoing. If a test takes a long time to implement, this may be a significant contribution to the system unavailability. Further, testing for fatigue failures are not appropriate if the fatigue failures occurs due to frequent testing.
15
3.6 RiskSpectrum Fault Tree Analysis
RiskSpectrum Probabilistic Safety Assessment (PSA) Professional (18) is a combined fault and event tree analysis software. It is provided with a powerful analysis algorithm for large fault trees (6). It was originally designed for the nuclear industry, and it is still the preferred software for safety assessment within the nuclear sector. In addition, it is possible to introduce uncertainty for the probabilities of basic events, in terms of distribution of the reliability parameters. Each basic event is defined with a reliability model with different reliability parameters to be able to perform a quantitative analysis (19). There are several types of reliability models possible for each basic event. Among these are “Monitored, repairable component”, “Periodically tested component”, “Probability/Constant unavailability”, “Component with fixed mission time”, “Constant frequency” and “Non-repairable component”. It is assumed in this analysis that most components fit in the category “Periodically tested components”, which in fact is the most complex of the reliability models. Most of the models are sub models of this model. Hence, only this model will be explained further.
3.6.1 Periodically Tested Component
As mentioned above, it is assumed that most components are periodically tested and repairable. In RiskSpectrum, the analyst has to implement the following parameters. Parameters in reliability model: O, XY, XZ O refers to the dangerous undetected failure rate, which is the frequency of failure of the component per hour. XY is the test interval (hours), which is assumed to be constant. XZ is equivalent to the mean time to repair (MTTR) in hours. It is assumed that the repair starts immediate after a failure has occurred and that the repair is perfect. A perfect repair means that the component is assumed to be as good as new after the repair. According to RiskSpectrum Theory Manual (19), it is assumed an exponential distribution for the failure process. Hence, it is assumed that the failure rate is constant. A constant failure rate is reasonable to assume for components that are in the mid-life phase, i.e. after the burn-in period and before the wear-out period (20). This means that the cumulative distribution function for failure follows [�\( � 1 , ]�^-5 An exponential distribution implies that the item is as good as new as long as it is functioning (13). Hence, this means that the item should not be replaced unless a failure has occurred. The exponential distribution is assumed to fit well to the components that are studied. However, as this distribution does not model fatigue failures, better accuracy would be achieved with other models, such as lognormal or Weibull distributions. Since the reliability model includes both a test interval and a repair time, there are four different contributions to the total unavailability. These are
[�\( � 1 , ]�^-5 for \ _ XY (1)
16
[�\( � [�XY( � 1 , ]�^-`a for \ � bXY (2)
[�\( � [�XY( - 1 R c1 , [�XY(d - c1 , ]�^�5�`a(d for XY_ \ _ �XY R XZ(
(3)
[�X( � 1 , ]�^�5�`a( for �XY R XZ( _ \ _ 2XY (4)
Equation 1 refers to the unavailability until the first test and equals the normal cumulative distribution for an exponential distribution. The second equation equals the probability that a repair is needed after the test is performed at time b - XY. Equation 3 equals the expected unavailability during the repair interval. The first part of Equation 3 equals the contribution from an eventual failure at time XY. The other part is the probability that a failure occurs during the repair interval if the test revealed no failure at time XY. The last equation 4 refers to the unavailability between the tests. The unavailability of a basic event is time dependent. However, in the long run, it is assumed a mean unavailability. It is desired to estimate the mean unavailability for a basic event based on the unavailability equations 1-4. Equation 5 is the general formula for mean unavailability and Equation 6 and 7 calculates the specific mean unavailability for a repairable tested component. Remark that the two modules Equation 6 refer to the contribution to unavailability from the time until the test and for the test interval given no failure at TI. [mean � 1 , 1XY - e 1 , [�\( f\ `a
g (5)
[mean � 1 , 1XY e ]�^-5 f\`a
g R XZ - OXY e ]�^-5 f\`ag
(6)
[mean � 1 , 1O - XY c1 , ]�^-`ad R XZXY - c1 , ]�^-`ad
(7)
The top event unavailability is calculated, as is described in Section 3.6.4, based on the mean unavailability of the basic events.
3.6.2 Mean Unavailability of CCF Events and Basic Events Assigned with CCF
The mean unavailability of a CCF event follows the PDS Approach (15) explained in Section 3.4. For basic events assigned with a Beta-factor, the resulting individual mean unavailability for the component is [Beta‐adjusted mean�Basic event( � �1 , �GMHHN - )(( - [mean
Where [mean is calculated as in Section 3.6.1 and GMHHN - ) is the common cause failure contribution. For the CCF, i.e. simultaneous failure of all components in a CCF group, the mean unavailability is [@@A � GMHHN - ) - [mean
17
3.6.3 Minimal Cut Set Analysis
The minimal cut set analysis is essential in RiskSpectrum as it forms the basis for calculating the top event mean unavailability. RiskSpectrum is well known for its fast algorithm for estimating all minimum cut sets in a fault tree (19). The algorithm is following a top-down approach and is described in short steps:
1. Create a cut set with the top event as the only element a. If the corresponding logic gate is AND, all inputs are added to the cut
set b. If the corresponding logic gate is OR, one new cut set is made for each
input 2. Continue the iterations down through the fault tree until all cut set elements are
basic events Hence, an AND-gate increases the cut-sets and an OR-gate increases the number of cut sets. However, these cut sets are not minimal. The algorithm has a check after the cut sets are estimated whether they are minimal or duplicate. The minimal check is a loop that first removes an event from the set and then checks if the top event occurs or not. If it occurs, then it is not minimal and the first event is removed. This is repeated until the top event does not occur.
3.6.4 Probability Calculation of Top Event
The algorithm for estimating the unavailability of the top event follows the following steps:
• Calculate the mean unavailability for each basic event by method explained in Section 3.6.1. If the basic event is assigned in a common cause failure group, the method explained in Section 3.6.2 is used in addition.
• Calculate mean unavailability for each CCF event according to Section 3.6.2. The CCF events are the events in Figure 3.3 denoted “Failure of all CCF components”.
• Calculate unavailability for each minimal cut sets by the formula ��l0( � ��Emn( - ��EmB( - … - ��Em0(
• The top event unavailability is calculated with a second order approximation as explained in the subsection below. The calculations are based on the unavailability of the minimal cut sets.
The two first steps are performed by RiskSpectrum before the MCS analysis starts.
3.6.4.1 Calculation of Top Event Unavailability with Second Order Approximation
The estimation of the MCS unavailability refers to that all components in a minimal cut set shall fail in order to cause a system failure, i.e. each minimal cut sets forms a series structure (16). However, the calculation of the top event unavailability needs more explanation. The second order approximation of the top event unavailability follows the inclusion-exclusion principle. The first order approximation is simply the sum of the probabilities for the minimal cut sets (19), hence
18
[Top Event � r ��l0(1
0sn
However, as there may be one component that is present in several cut sets, the second order of the inclusion-exclusion principle states that the top event is estimated as
[Top Event � r � tu l01
0snv
1
0sn
For two cut sets A and B, this means that [Top Event � ��D( R ��E( , ��DFE(
This is assumed to reveal a better estimate of the unavailability than the normal first order approximation, which is often referred to as the “rare event approximation” (19). The normal first order method assumes that simultaneous occurrence of multiple cut sets are rare, i.e. one component occurs in several cut sets. The second order approximation is used in this analysis in order to minimize the uncertainty.
3.6.5 Importance Analysis
The importance analysis is performed by RiskSpectrum with possibility of analysis of basic events, groups of events and CCF groups. The importance measures that are used in this analysis are Fractional Contribution (FC), Fussell-Vesely (FV), Risk Decrease Factor (RDF) and Risk Increase Factor (RIF). Remark that all the importance and sensitivity measures are connected and reveals almost the same conclusions.
3.6.5.1 Fussell-Vesely (FV) Importance
The FV importance calculations are based on the minimal cut sets obtained by the minimal cut set analysis. The Fussell-Vesely estimate is defined as (19)
Y0Aw � [TOP�MCS including 0([TOP
Hence, the denominator is the nominal top event unavailability and the numerator is the top event unavailability based on the minimal cut sets where component i is present. Consequently, a high FV importance factor implies that the top event unavailability is highly dependent on the reliability of component i.
19
3.6.5.2 Risk Decrease Factor (RDF)
The Risk Decrease Factor is also known as risk reduction worth. A high value of this importance factor implies that a reduction of the unavailability of the component may reduce the top event unavailability significantly. According to (19), it is for component i defined as
Y0{ � [TOP[TOP�[0 � 0(
The nominator here is the nominal top event unavailability and the denominator is defined as the top event unavailability when assuming that component i (or all components in component group i) are perfect reliable, i.e. the [0 � 0. Hence, this estimate equals to the decrease in risk when assuming that the component (or component group) is perfect reliable. This is expressed in terms of ratio of the nominal top event unavailability.
3.6.5.3 Risk Increase Factor (RIF)
The Risk Increase Factor is also known as risk achievement worth. A high value of this factor implies that better reliability can be achieved by introducing redundancy with respect to component (or component group) i. According to (19), RIF equals
Y0a � [`|}�[0 � 1([`|}
The denominator equals the nominal top event unavailability and the numerator refers to the top event unavailability with component (or component group) i assumed to be failed. Hence, this equals to the increase in risk if the component (or component group) is assumed to fail. It is expressed in terms of ratio of the nominal top event unavailability.
3.6.5.4 Fractional Contribution (FC)
The Fractional Contribution (FC) refers to the fraction of the nominal top event unavailability component (or component group) i constitutes. It is linked with RDF and defined as
Y0A � 1 , 1Y0{
3.6.5.5 Importance Analysis for Parameters
The importance analysis for parameters is based on the same procedures as for basic events. According to (19), the procedure is as follows
• For the parameter of interest ~, define the new value as the best possible. In all cases (Test interval, repair times and failure rate) it is obvious that this equals ~new � 0.
• Perform calculations of the new top event result assuming that the parameter in question is ~new � 0 . The new top event result is defined as [top, new �[top�~new � 0(
20
Hence the Risk Reduction Factor is defined as
Y0{ � [top[top, new�~new � 0(
Further, the Fractional Contribution is
Y0A � 1 , 1Y0{
The Risk Increase Factor is then
Y0a � [top, new�~new � ∞([top
Where [top, new�~new � ∞( refers to the top unavailability assuming that the parameter
is worst possible. For probability parameters, this equals to ~new � 1. 3.6.6 Sensitivity Analysis
The principle behind the sensitivity analysis is simple. For a basic event, the calculated unavailability, [mean, is divided (and multiplied) by a sensitivity factor of 10. For a group of components, this is performed for all components in the group. Thus, the new top event unavailability is calculated. A sensitivity measure is then defined as
� � [TOP, Upper[TOP, Lower Hence, a high sensitivity measure S implies that the system is sensitive to the reliability of the component or the component group.
21
4. DELUGE SYSTEMS
A deluge system is a high velocity suppression fire preventer. The deluge system is similar to a sprinkler system. However, the nozzles of a deluge system are dry upstream and connected to the fire water ring main with a deluge valve that is opened on demand. On the other hand, sprinkler nozzles are pressurized and locked with a bulb. If sufficient heat reaches the bulb, it shattered and the room is sprayed with water. Thus, deluge systems may provide higher pressure and more water flow. In addition, the probability for spurious release of deluge systems are lower than for sprinkler systems since a deluge valve is more reliable than the heat bulb in the sprinkler system. This is important because a spurious release of salt water on process equipment is highly unwanted because this may lead to corrosion and marine fouling. Corrosion and marine fouling are explained in more detail in Section 5.7.1 and 5.7.2. The deluge systems are normally placed in high hazards areas as they provide reliable high pressurized water supply (21). The deluge system is used both to fight fires and to reduce the probability for gas explosions. If a gas leakage has occurred, the deluge system will be activated to prevent an ignition as mentioned in Section 2.3. To be able to avoid ignition of a gas leakage, the deluge system must be released shortly after the leakage has occurred. In addition, the deluge shall be able to cover the gas cloud and the droplet size shall be within the effective range and the water amount must be sufficient (22). However, it is also possible that release of the deluge system increases the explosion probability. This may happen if the effect of added turbulence exceeds the effect of reduction of flame speed or if the area is poorly ventilated. In addition, deluge systems are regarded to be the best active fire fighting systems for controlling fires as they are fast, reliable and direct high speed water flow to the fire. On the other hand, the effect of the deluge systems is highly dependent on important factors such as detection time, water coverage, water pressure and response time of the fire water system.
4.1 General Deluge System Description
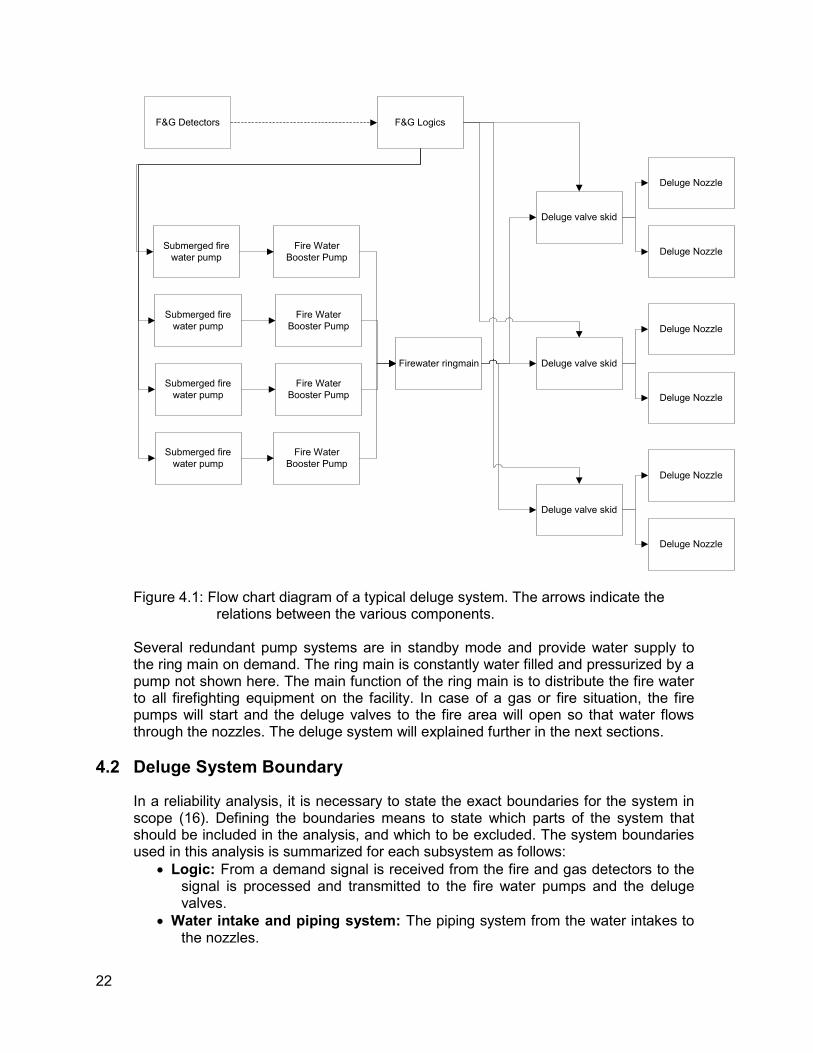
A flow process chart of a general deluge system is shown below. This figure displays the main functions within a fire water supply and deluge system.
22
Figure 4.1: Flow chart diagram of a typical deluge system. The arrows indicate the
relations between the various components. Several redundant pump systems are in standby mode and provide water supply to the ring main on demand. The ring main is constantly water filled and pressurized by a pump not shown here. The main function of the ring main is to distribute the fire water to all firefighting equipment on the facility. In case of a gas or fire situation, the fire pumps will start and the deluge valves to the fire area will open so that water flows through the nozzles. The deluge system will explained further in the next sections.
4.2 Deluge System Boundary
In a reliability analysis, it is necessary to state the exact boundaries for the system in scope (16). Defining the boundaries means to state which parts of the system that should be included in the analysis, and which to be excluded. The system boundaries used in this analysis is summarized for each subsystem as follows:
• Logic: From a demand signal is received from the fire and gas detectors to the signal is processed and transmitted to the fire water pumps and the deluge valves.
• Water intake and piping system: The piping system from the water intakes to the nozzles.
F&G LogicsF&G Detectors
Submerged fire
water pump
Fire Water
Booster Pump
Submerged fire
water pump
Fire Water
Booster Pump
Submerged fire
water pump
Fire Water
Booster Pump
Submerged fire
water pump
Fire Water
Booster Pump
Firewater ringmain
Deluge valve skid
Deluge Nozzle
Deluge Nozzle
Deluge valve skid
Deluge Nozzle
Deluge Nozzle
Deluge valve skid
Deluge Nozzle
Deluge Nozzle
23
• Pumps and generators: Pumps, diesel engines and generators with diesel and power supply.
• Aqueous Film Forming Foams (AFFF) is not included in a reliability analysis of fire water systems since it is assumed not to be critical for the active fire fighting which forms the scope of this analysis.
• Sprinkler systems, Hydrants and Monitors are not covered in the analysis.
4.3 Regulations and Demands for Deluge Systems
To fulfill the demands for active fire fighting systems, the regulations from Petroleum Safety Authority (PSA), guidelines from NORSOK S-001 and ISO 13702 need to be considered. The regulations and guidelines are discussed in the following subsections.
4.3.1 Fire Water Supply
The Petroleum Safety Authority in Norway states that all permanently manned facilities shall have fire water supply with sufficient capacity available at all times (23). The term “available at all times” are essential for this analysis since it may be considered as a reliability demand. Further, PSA states that the fire water system shall have the possibility of automatic start in case of pressure drop in fire water ring main or confirmed fire detection. In addition, it shall be possible to start the fire pumps manually from the central control room (CCR) or locally. The term “sufficient capacity” stated by PSA means that the pump systems shall be designed with a capacity for fire water distribution to the largest fire area on the facility in addition to the largest of the adjacent areas. However, this is only the design capacity demand and not the delivery demand during an actual demand for fire water. Further, the ISO 13702 standard Chapter 11 and Appendix B.8 (24) in addition to NORSOK S-001 Chapters 20 (2) shall be followed to fulfill PSA requirements. NORSOK S-001 states that the fixed fire fighting systems shall be installed in high risk areas, i.e. protecting equipment with significant quantities of hydrocarbons (2). Further, the fire water capacity shall include supply to two fire water hydrants. The fire water ring main shall be designed so that it is dimensioned for the demand to the largest fire area and the largest adjacent area. However, if one segment of the ring is closed (for example caused by rupture etc) the capacity shall equal the fire water demand for the largest fire area. The ring main must be filled and pressurized during standby mode and the ring main shall have connections for external water supply. There should be an aim to minimize the pressure surges on the fire water system by introducing vacuum breakers, air relief valves etc. To avoid marine fouling, it is required to have an inhibitor system. This may be performed by injection of hypochlorite. In addition, a frost protection system shall be installed.
24
Further, S-001 refers to OLF 075 (25), which states that carbon- and galvanized steel shall be avoided as those materials may lead to severe corrosion. OLF 075 includes a material selection recommendation for titanium, super duplex (25Cr), CuNi 90/10 alloys, vulcanized elastopipe and GRP. S-001 states that the pump arrangement shall be at least 4 - 50%, where 100 % refers to the largest fire area. A 3 - 100 % pump system may also be acceptable. Further, it shall be possible to start and operate the fire water pumps with no other systems on the platform operable. The fire water pump mover and the pump system shall comply with NFPA 20(26). NFPA 20 is a standard for fire water pumps for all types of fire fighting systems. S-001 presents some variations from NFPA 20 to adapt the requirements to the offshore industry. The diesel engine shall have two independent starting systems and a logic system shall provide repetitive start attempts. The diesel engine, and the pumps, shall start on single gas or fire detection, “low pressure”-signal from at least two pressure transmitters in the ring main or by manual start from the CCR or the pump room. On the other hand, manual stop shall only be possible locally in the diesel engine room to avoid spurious stops. The diesel engine shall be provided with diesel from a day tank with capacity for 18 hrs full power operation. Further, each pump system must be installed with a test drain valve for testing if the pump may pump up to 150% of the design flow rate without pumping the water to the ring main.
4.3.2 Deluge System
PSA (23) states that the deluge system shall provide effective firefighting of defined scenarios and hence reduce the risk for escalations of fires to the greatest extent. The deluge distribution system and the nozzles shall be designed according to NORSOK S-001 (2) and ISO 13702 (24). NORSOK S-001 refers to NFPA 13, NFPA 15 and NFPA 16 as guidelines for deluge system design (27)(28)(29). The intention with deluge systems is to provide sufficient water supply both with respect to volume and pressure for fire and explosion scenarios. The demand for the deluge system is that water at design pressure shall reach the most distant nozzles no later than 30 s after release signal. The capacity of the fire water shall be 10 (l/min)/m2 for process and equipment areas and 20 (l/min)/m2 for the wellhead. It is described above that the fire water pumps are started automatically on single fire or gas detection. Upon confirmed fire detection, the deluge valves shall be opened. For areas where fire water is assumed to be effective for explosion mitigation, deluge valves shall be opened by confirmed gas detection. In addition, it shall be possible to open the deluge valves manually, from CCR and from stations along the escape routes.
25
The deluge valves must be designed to maintain the downstream pressure constant and they shall not be sensitive for pressure surges from the ring main. Further, the deluge valves shall be equipped with a dump drain for full scale test without distribution of any salt water to the nozzles, because release of salt water on the process equipment is unwanted. This dump drain valve shall be located downstream the deluge valve. In addition, deluge valves shall have a manual bypass to make it possible for flow measurements through the valve. Further, the bypass shall make it possible to lead water to the fire area manually even if the deluge valve is out for maintenance. The signal from the F&G logic shall be de-energized to ensure that the deluge valve fails in last position in case of loss of signal from the logics. As for the fire water supply systems, the material selection proposals from OLF 075 are to be followed.
4.3.3 Survivability Requirements
As discussed in Section 4.3.1, PSA states that the fire water supply shall be available at all times. NORSOK S-001 discusses some aspects to ensure high survivability of the fire water system (2). It is important to keep in mind that the fire water system itself may be exposed to an eventual escalating fire or other scenarios. Hence, the deluge system shall be designed to withstand different possible scenarios. It is important that the ring main is routed outside high hazard areas. In addition, it shall be considered how the routing design is with respect to fires, explosions and dropped objects. The pumps and drivers have to be placed in low hazards areas. Further, the different pump packages shall be placed on different locations on the platform to reduce the CCF. In Section 4.3.1, it was mentioned that a 4 - 50 % pump system was preferred. The four systems shall be independent. However, several pump systems may be located in the same room as long as the largest fire area is covered even if a pump room is lost. Hence, 2 rooms, each with 2 pump systems, are sufficient. Further, the pump systems shall have multiple connections to the ring main in case of loss of a connection or section of the ring main. In addition, a deluge valve skid shall have the possibility to be supplied with fire water from two different sections of the ring main. The deluge valve skids shall be placed outside the fire area they protect in order to reduce the risk for the deluge valve itself.
4.3.4 The Operator’s Technical Requirements for Deluge Systems
The operator of the case study platform has provided its governing document (30) within active fire fighting. The document presents additional requirements for deluge systems compared to the requirements of PSA. It states that the active fire fighting functions shall be available as long as the platform is in touch with hydrocarbons. In addition, testing of the fire fighting systems shall be possible without interrupting the operation.
26
The operator has defined unavailability criteria for the different subsystems of the active fire fighting functions. When performing function tests, deviations from acceptable behavior is registered if, according to (30), the fraction of Safety Critical Errors exceeds
• Pumps fail to start: 0.5 %
• Pump capacity reduced more than 10 %: 1.0 %
• Deluge valve fails to open: 1.0 %
• Deluge nozzles clogged: 3.0 % If the summary of a platform’s tests over time reveal an unacceptable behavior according to the defined criteria, changes in test routines, replacement of components or extensive maintenance are some of the measures that may be performed. Sufficiently high reliability shall be achieved by introducing redundancy, monitoring, and fail-to-safe components. The design shall be such that the probability of failure on demand as well as the probability for spurious release of fire water shall be as low as reasonably practicable.
4.3.5 Performance Documentation and Safety Integrity Level
PSA management regulations state that every company shall provide performance documentation for all safety barriers on an installation. This documentation shall involve analysis of capacity, reliability, availability, efficiency, ability to withstand loads, integrity and robustness for the safety barriers (31). The documentation shall be according to the international standards IEC 615084 and IEC 615115. OLF 070 (32) is developed by the Norwegian oil industry with the purpose of adapting the application of the two standards to the offshore industry. The adaption is developed because the international standards are general and difficult to interpret. OLF 070 presents “Safety Integrity Levels” (SIL) for different safety systems and guidelines for how to achieve the SIL levels. SIL is the reliability level that is required for a Safety Instrumented Function (SIF). SIF are safety functions that are standby during normal operation and operated automatically on demand. These SIL levels acts as the minimum requirements of PSA and the companies shall document that their systems satisfy these levels. It shall be stressed that SIL levels are only one small part in order to fulfill PSA’s management requirements and to ensure compliance with IEC 61508 and 61511. OLF 070 assumes that the safety function “release of fire water/deluge” shall be in compliance with SIL 2 (32). According to IEC 61508 this means that the probability of failure on demand shall be 0.001 �ST _ 0.01. A PFD below 0.001 means that a SIL 3 level is achieved and a PFD above 0.01 implies a SIL 1 level.
4 IEC 61508 is an international standard for functional safety of electronic, electrical, programmable safety
related systems. 5 IEC 61511 presents how engineering for safety instrumented systems shall be with respect to design, operation
and maintenance. For example does this standard presents SIL for various SIS.
27
4.3.5.1 OLF 070 Calculation of SIL 2 Level for “Firewater Supply”
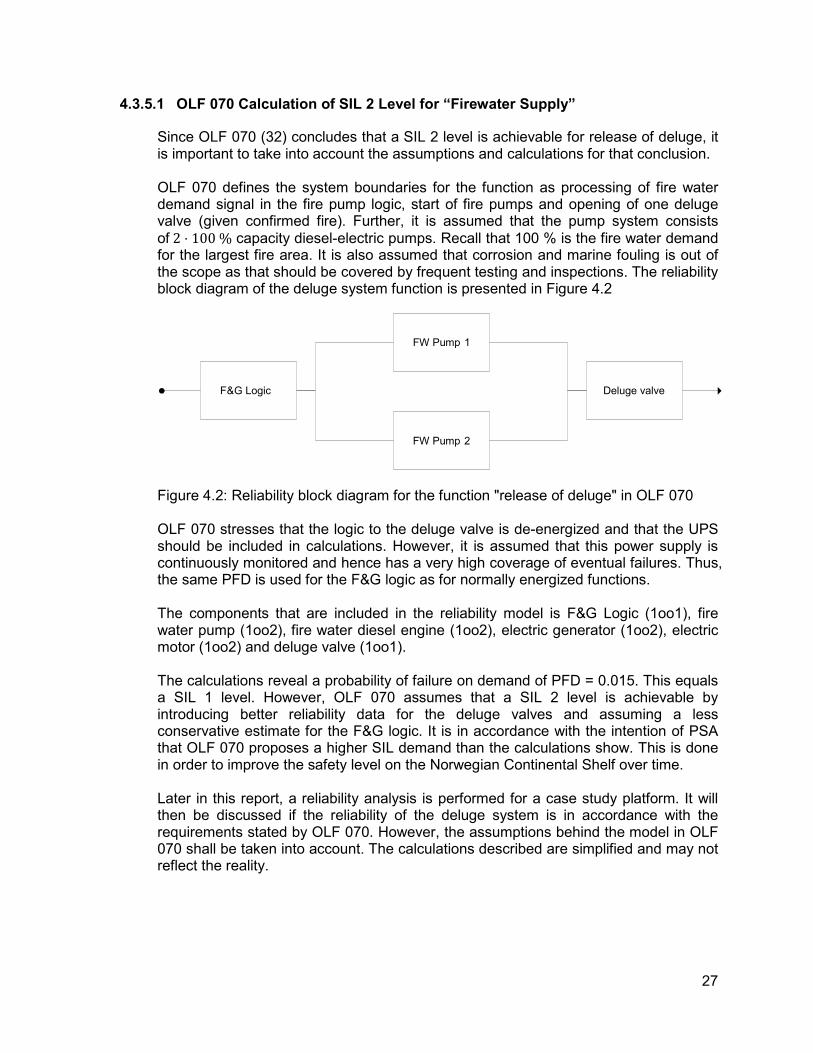
Since OLF 070 (32) concludes that a SIL 2 level is achievable for release of deluge, it is important to take into account the assumptions and calculations for that conclusion. OLF 070 defines the system boundaries for the function as processing of fire water demand signal in the fire pump logic, start of fire pumps and opening of one deluge valve (given confirmed fire). Further, it is assumed that the pump system consists of 2 - 100 % capacity diesel-electric pumps. Recall that 100 % is the fire water demand for the largest fire area. It is also assumed that corrosion and marine fouling is out of the scope as that should be covered by frequent testing and inspections. The reliability block diagram of the deluge system function is presented in Figure 4.2
Figure 4.2: Reliability block diagram for the function "release of deluge" in OLF 070 OLF 070 stresses that the logic to the deluge valve is de-energized and that the UPS should be included in calculations. However, it is assumed that this power supply is continuously monitored and hence has a very high coverage of eventual failures. Thus, the same PFD is used for the F&G logic as for normally energized functions. The components that are included in the reliability model is F&G Logic (1oo1), fire water pump (1oo2), fire water diesel engine (1oo2), electric generator (1oo2), electric motor (1oo2) and deluge valve (1oo1). The calculations reveal a probability of failure on demand of PFD = 0.015. This equals a SIL 1 level. However, OLF 070 assumes that a SIL 2 level is achievable by introducing better reliability data for the deluge valves and assuming a less conservative estimate for the F&G logic. It is in accordance with the intention of PSA that OLF 070 proposes a higher SIL demand than the calculations show. This is done in order to improve the safety level on the Norwegian Continental Shelf over time. Later in this report, a reliability analysis is performed for a case study platform. It will then be discussed if the reliability of the deluge system is in accordance with the requirements stated by OLF 070. However, the assumptions behind the model in OLF 070 shall be taken into account. The calculations described are simplified and may not reflect the reality.
F& G Logic
FW Pump 1
FW Pump 2
Deluge valve

28
29
5. SYSTEM DESIGN AND RELIABILITY
The following subchapters present the possible design variations for deluge systems. In addition, it is discussed for each subsystem what that is important to take into consideration when performing a reliability analysis. Finally, the test routines for a typical deluge system are presented. The routines are important as the reliability of standby safety systems is highly dependent of test routines. In addition, an inspection of routines is important for indentifying which test data it is possible to collect.
5.1 Combined Sea Water and Fire Water Systems
Some of the platforms on the Norwegian Continental Shelf have combined sea water and fire water systems. The sea water system is operating constantly with delivery of cooling water to different platform functions. A combined system uses the same pumps for both the sea water and the fire water system. That means that a valve is routing the sea water over to the fire water ring main on demand of fire water.
According to the operator, there are several major problems with combined systems. Because they are always operating, there are several problems with marine fouling and corrosion leading to blocked nozzles. Marine fouling and corrosion are explained in Section 5.7.1 and 5.7.2. In addition, testing of the system is difficult because the platform production must be shut down. This is because the sea water to the cooling systems will be routed to the fire water system. Further, the valve that switches the water from the sea water ring to the fire water ring main has proved to be critical and leading to increased unavailability. The main reason for why some platforms have combined systems despite the many problem issues is that combined systems reduce the installation costs significantly. However, as the maintenance costs are higher and the regularity of production is lower than for standalone systems, it is assumed that standalone systems are cheaper in the long run. The reliability of combined systems will not be discussed any further in this thesis.
5.2 F&G Detectors
Reliability of fire & gas detector systems is outside the scope of this analysis. The background is that reliability of such systems is considered to be a large and already explored research field. Hence, it is considered to be more appropriate to focus on the deluge systems alone. However, to get an understanding of the context, a short description of the detector system is appropriate.
30
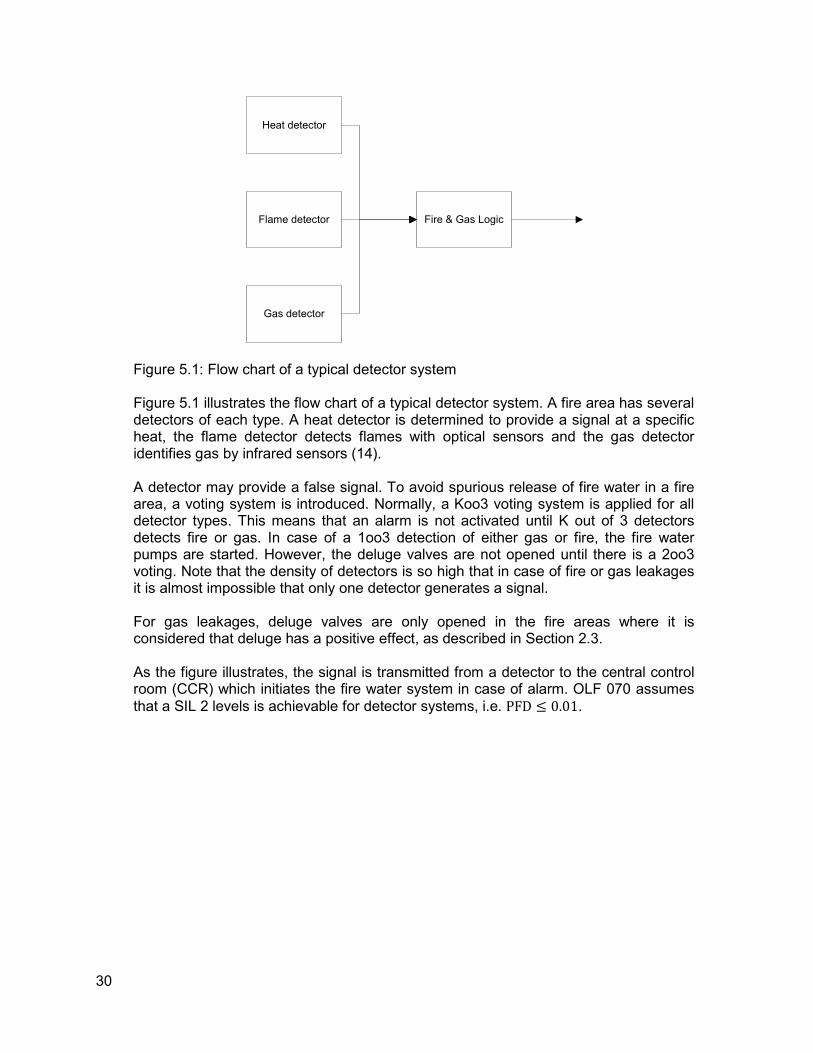
Figure 5.1: Flow chart of a typical detector system Figure 5.1 illustrates the flow chart of a typical detector system. A fire area has several detectors of each type. A heat detector is determined to provide a signal at a specific heat, the flame detector detects flames with optical sensors and the gas detector identifies gas by infrared sensors (14). A detector may provide a false signal. To avoid spurious release of fire water in a fire area, a voting system is introduced. Normally, a Koo3 voting system is applied for all detector types. This means that an alarm is not activated until K out of 3 detectors detects fire or gas. In case of a 1oo3 detection of either gas or fire, the fire water pumps are started. However, the deluge valves are not opened until there is a 2oo3 voting. Note that the density of detectors is so high that in case of fire or gas leakages it is almost impossible that only one detector generates a signal. For gas leakages, deluge valves are only opened in the fire areas where it is considered that deluge has a positive effect, as described in Section 2.3. As the figure illustrates, the signal is transmitted from a detector to the central control room (CCR) which initiates the fire water system in case of alarm. OLF 070 assumes that a SIL 2 levels is achievable for detector systems, i.e. PFD 0.01.
Heat detector
Flame detector
Gas detector
Fire & Gas Logic
31
5.3 Deluge System Logic
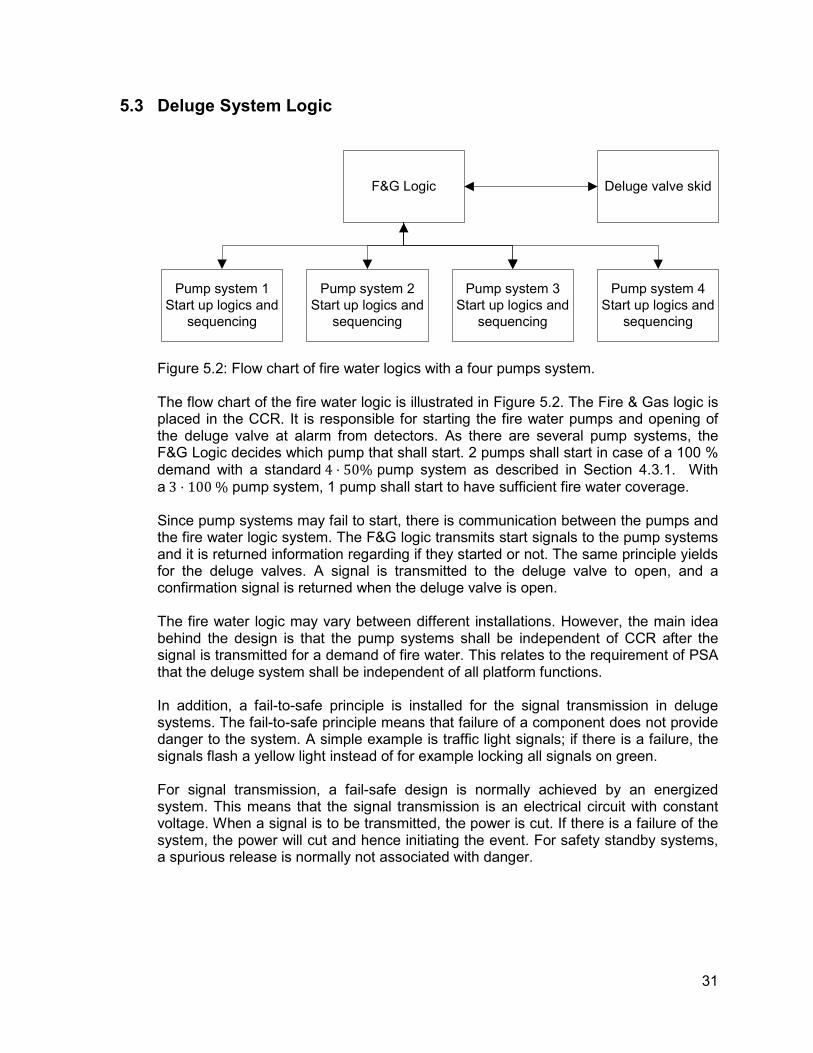
Figure 5.2: Flow chart of fire water logics with a four pumps system. The flow chart of the fire water logic is illustrated in Figure 5.2. The Fire & Gas logic is placed in the CCR. It is responsible for starting the fire water pumps and opening of the deluge valve at alarm from detectors. As there are several pump systems, the F&G Logic decides which pump that shall start. 2 pumps shall start in case of a 100 % demand with a standard 4 - 50% pump system as described in Section 4.3.1. With a 3 - 100 % pump system, 1 pump shall start to have sufficient fire water coverage. Since pump systems may fail to start, there is communication between the pumps and the fire water logic system. The F&G logic transmits start signals to the pump systems and it is returned information regarding if they started or not. The same principle yields for the deluge valves. A signal is transmitted to the deluge valve to open, and a confirmation signal is returned when the deluge valve is open. The fire water logic may vary between different installations. However, the main idea behind the design is that the pump systems shall be independent of CCR after the signal is transmitted for a demand of fire water. This relates to the requirement of PSA that the deluge system shall be independent of all platform functions. In addition, a fail-to-safe principle is installed for the signal transmission in deluge systems. The fail-to-safe principle means that failure of a component does not provide danger to the system. A simple example is traffic light signals; if there is a failure, the signals flash a yellow light instead of for example locking all signals on green. For signal transmission, a fail-safe design is normally achieved by an energized system. This means that the signal transmission is an electrical circuit with constant voltage. When a signal is to be transmitted, the power is cut. If there is a failure of the system, the power will cut and hence initiating the event. For safety standby systems, a spurious release is normally not associated with danger.
F&G Logic Deluge valve skid
Pump system 2
Start up logics and
sequencing
Pump system 1
Start up logics and
sequencing
Pump system 3
Start up logics and
sequencing
Pump system 4
Start up logics and
sequencing
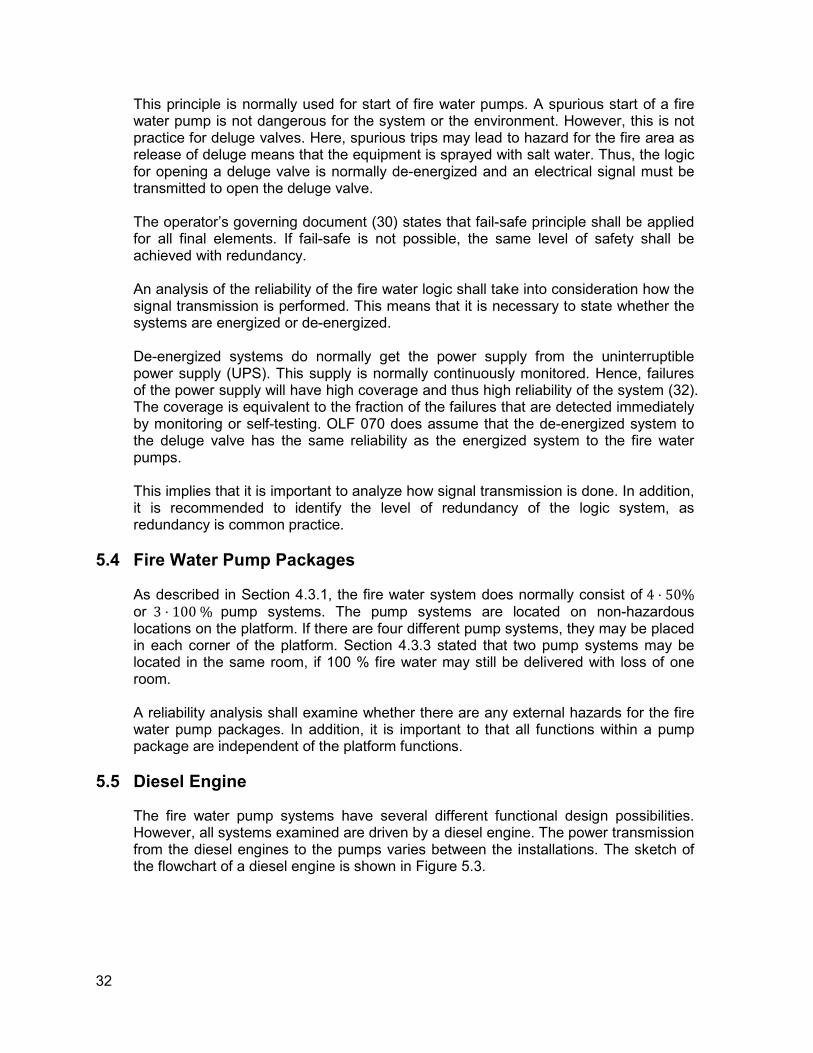
32
This principle is normally used for start of fire water pumps. A spurious start of a fire water pump is not dangerous for the system or the environment. However, this is not practice for deluge valves. Here, spurious trips may lead to hazard for the fire area as release of deluge means that the equipment is sprayed with salt water. Thus, the logic for opening a deluge valve is normally de-energized and an electrical signal must be transmitted to open the deluge valve. The operator’s governing document (30) states that fail-safe principle shall be applied for all final elements. If fail-safe is not possible, the same level of safety shall be achieved with redundancy. An analysis of the reliability of the fire water logic shall take into consideration how the signal transmission is performed. This means that it is necessary to state whether the systems are energized or de-energized. De-energized systems do normally get the power supply from the uninterruptible power supply (UPS). This supply is normally continuously monitored. Hence, failures of the power supply will have high coverage and thus high reliability of the system (32). The coverage is equivalent to the fraction of the failures that are detected immediately by monitoring or self-testing. OLF 070 does assume that the de-energized system to the deluge valve has the same reliability as the energized system to the fire water pumps. This implies that it is important to analyze how signal transmission is done. In addition, it is recommended to identify the level of redundancy of the logic system, as redundancy is common practice.
5.4 Fire Water Pump Packages
As described in Section 4.3.1, the fire water system does normally consist of 4 - 50% or 3 - 100 % pump systems. The pump systems are located on non-hazardous locations on the platform. If there are four different pump systems, they may be placed in each corner of the platform. Section 4.3.3 stated that two pump systems may be located in the same room, if 100 % fire water may still be delivered with loss of one room. A reliability analysis shall examine whether there are any external hazards for the fire water pump packages. In addition, it is important to that all functions within a pump package are independent of the platform functions.
5.5 Diesel Engine
The fire water pump systems have several different functional design possibilities. However, all systems examined are driven by a diesel engine. The power transmission from the diesel engines to the pumps varies between the installations. The sketch of the flowchart of a diesel engine is shown in Figure 5.3.
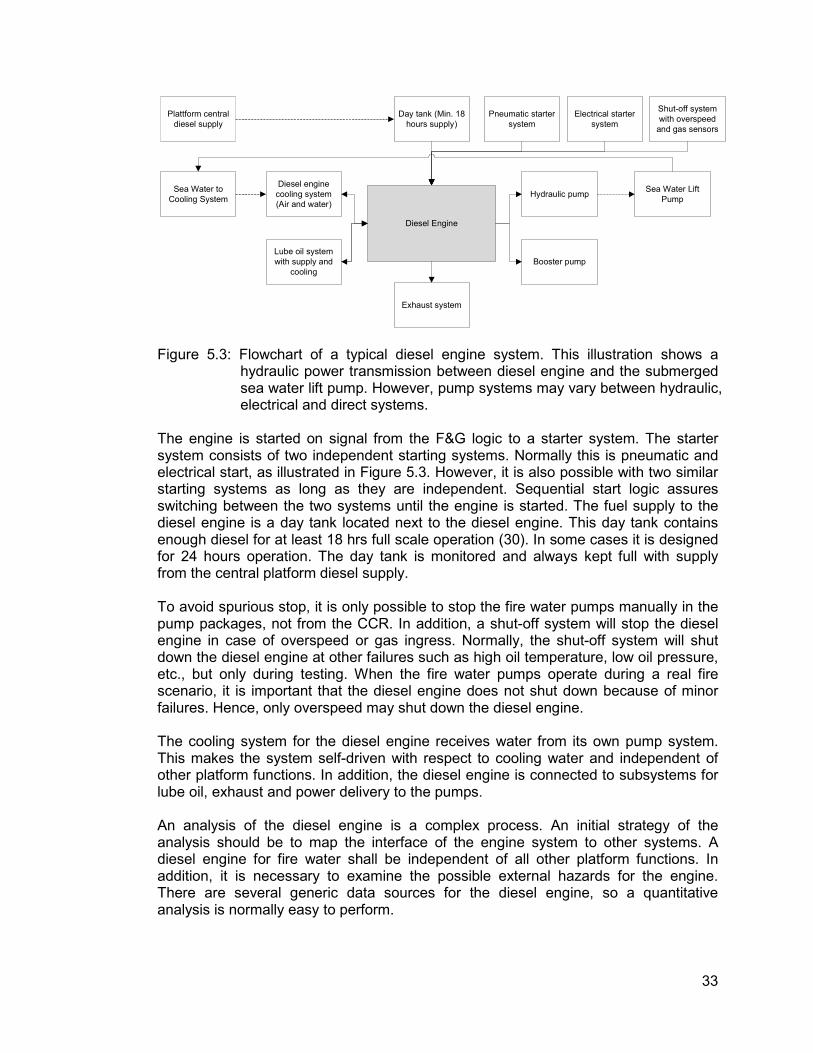
33
Figure 5.3: Flowchart of a typical diesel engine system. This illustration shows a
hydraulic power transmission between diesel engine and the submerged sea water lift pump. However, pump systems may vary between hydraulic, electrical and direct systems.
The engine is started on signal from the F&G logic to a starter system. The starter system consists of two independent starting systems. Normally this is pneumatic and electrical start, as illustrated in Figure 5.3. However, it is also possible with two similar starting systems as long as they are independent. Sequential start logic assures switching between the two systems until the engine is started. The fuel supply to the diesel engine is a day tank located next to the diesel engine. This day tank contains enough diesel for at least 18 hrs full scale operation (30). In some cases it is designed for 24 hours operation. The day tank is monitored and always kept full with supply from the central platform diesel supply. To avoid spurious stop, it is only possible to stop the fire water pumps manually in the pump packages, not from the CCR. In addition, a shut-off system will stop the diesel engine in case of overspeed or gas ingress. Normally, the shut-off system will shut down the diesel engine at other failures such as high oil temperature, low oil pressure, etc., but only during testing. When the fire water pumps operate during a real fire scenario, it is important that the diesel engine does not shut down because of minor failures. Hence, only overspeed may shut down the diesel engine.
The cooling system for the diesel engine receives water from its own pump system. This makes the system self-driven with respect to cooling water and independent of other platform functions. In addition, the diesel engine is connected to subsystems for lube oil, exhaust and power delivery to the pumps. An analysis of the diesel engine is a complex process. An initial strategy of the analysis should be to map the interface of the engine system to other systems. A diesel engine for fire water shall be independent of all other platform functions. In addition, it is necessary to examine the possible external hazards for the engine. There are several generic data sources for the diesel engine, so a quantitative analysis is normally easy to perform.
Plattform central
diesel supply
Day tank (Min. 18
hours supply)
Diesel Engine
Hydraulic pump
Booster pump
Diesel engine
cooling system
(Air and water)
Sea Water Lift
Pump
Sea Water to
Cooling System
Exhaust system
Lube oil system
with supply and
cooling
Pneumatic starter
system
Shut-off system
with overspeed
and gas sensors
Electrical starter
system
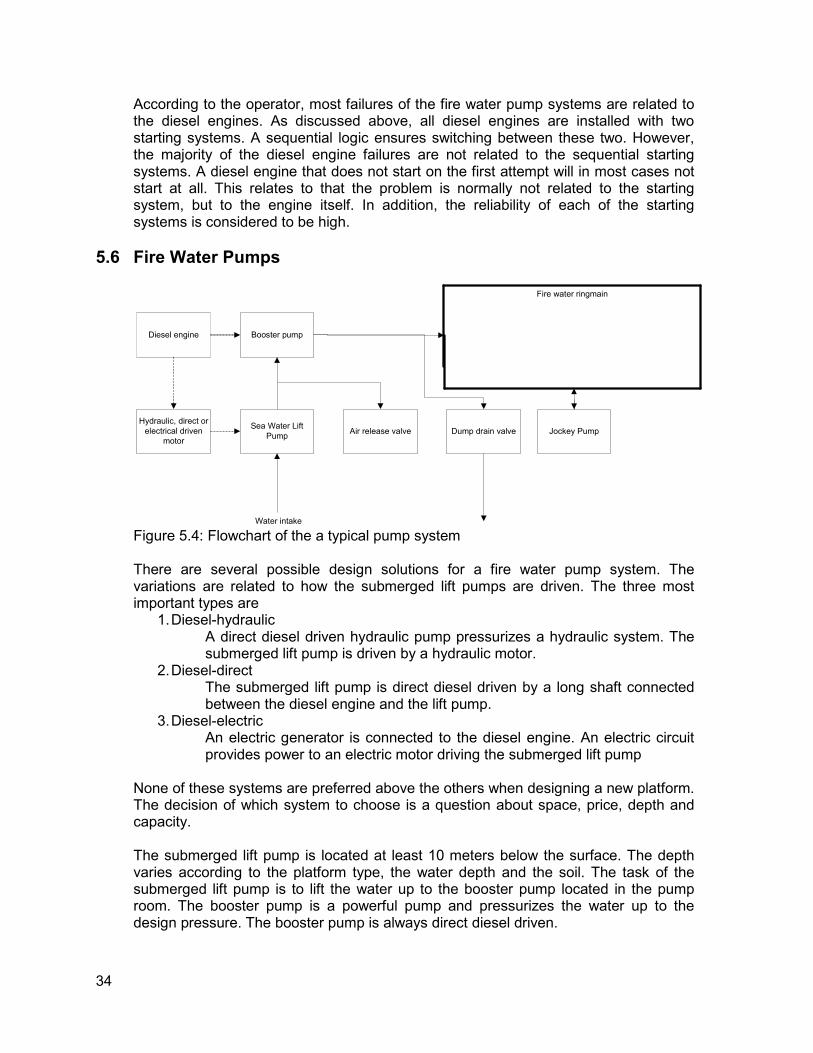
34
According to the operator, most failures of the fire water pump systems are related to the diesel engines. As discussed above, all diesel engines are installed with two starting systems. A sequential logic ensures switching between these two. However, the majority of the diesel engine failures are not related to the sequential starting systems. A diesel engine that does not start on the first attempt will in most cases not start at all. This relates to that the problem is normally not related to the starting system, but to the engine itself. In addition, the reliability of each of the starting systems is considered to be high.
5.6 Fire Water Pumps
Figure 5.4: Flowchart of the a typical pump system There are several possible design solutions for a fire water pump system. The variations are related to how the submerged lift pumps are driven. The three most important types are
1. Diesel-hydraulic A direct diesel driven hydraulic pump pressurizes a hydraulic system. The submerged lift pump is driven by a hydraulic motor.
2. Diesel-direct The submerged lift pump is direct diesel driven by a long shaft connected between the diesel engine and the lift pump.
3. Diesel-electric An electric generator is connected to the diesel engine. An electric circuit provides power to an electric motor driving the submerged lift pump
None of these systems are preferred above the others when designing a new platform. The decision of which system to choose is a question about space, price, depth and capacity. The submerged lift pump is located at least 10 meters below the surface. The depth varies according to the platform type, the water depth and the soil. The task of the submerged lift pump is to lift the water up to the booster pump located in the pump room. The booster pump is a powerful pump and pressurizes the water up to the design pressure. The booster pump is always direct diesel driven.
Sea Water Lift
Pump
Booster pump
Jockey Pump
Fire water ringmain
Water intake
Diesel engine
Hydraulic, direct or
electrical driven
motorAir release valve Dump drain valve
35
A jockey pump is connected to the ring main to maintain the pressure at a given level. A check valve connects the jockey pump to the ring main, assuring the water to flow in only one direction. The jockey pump is not connected to the fire water diesel engine, but to another power source on the platform. When performing a reliability analysis of the fire water system, it is not common to include the jockey pump as it is not necessary for release of fire water. The air release valve is installed to avoid water hammering in the system at start up. Before the pumps are started, the caissons are only filled with water up to the sea level. The caisson between the sea level and the booster pump is filled with air. When the pumps starts, the valve opens for about 10 seconds to bleed out the air. It is assumed that the system may run even if the valve does not open. However, if the valve opens, but does not close after 10 seconds, water flows out of the valve. This causes the system to deliver water below the specified capacity. Hence, a reliability analysis should include this valve. The dump drain valve is installed between the pump system and the ring main. The drain valve is a connection from the pump systems and a drain piping system to the sea. The valve is mainly used for testing purposes. The pump system is tested weekly, and it is then tested if water flows out of the dump drain valve and to the sea. In addition, most fire water systems are using this valve to make the start easier for the pumps. The background is that the pump uses less effort to pump water to through the drain valve than in to the ring main. Hence, the dump drain valve is opened for about 10 seconds every time the fire water pumps start. A failure of opening this valve does not imply direct failure of the pump system. However, if the valve does not close, no water will be distributed from the actual pump to the ring main. Operators have stated that there have been problems with the dump valve, but most of the problems have been related to opening and not closing. A reliability analysis should include this valve as it is assumed to be critical.
5.7 Water Intake and Pipelines
The last years, it has been a serious debate regarding the maintenance of the pipelines. In 2000, the Norwegian Petroleum Directorate distributed a letter to all the petroleum companies operating on the Norwegian Continental Shelf with a concern about serious problems with fire water systems (3). The letter contained a solicitation to the companies to provide a status declaration of the fire water systems. On the basis of feedback from the petroleum companies, the NPD developed new guidelines for test, maintenance and design of fire water systems. The focus areas in the guidelines (25) are corrosion, marine organisms and blockages as that had been a major problem for all companies. The “Water intake and pipeline system” covers the water intake and all the pipelines from the water intake to the nozzles. The purpose of the firewater ring main is to transport the fire water from the pumps to the different fire areas. The ring main shall always be filled with water of acceptable quality (30). In addition, the firewater ring main sectioning valves shall be easily accessible, car sealed with plastic strips and open at all times during normal operation.
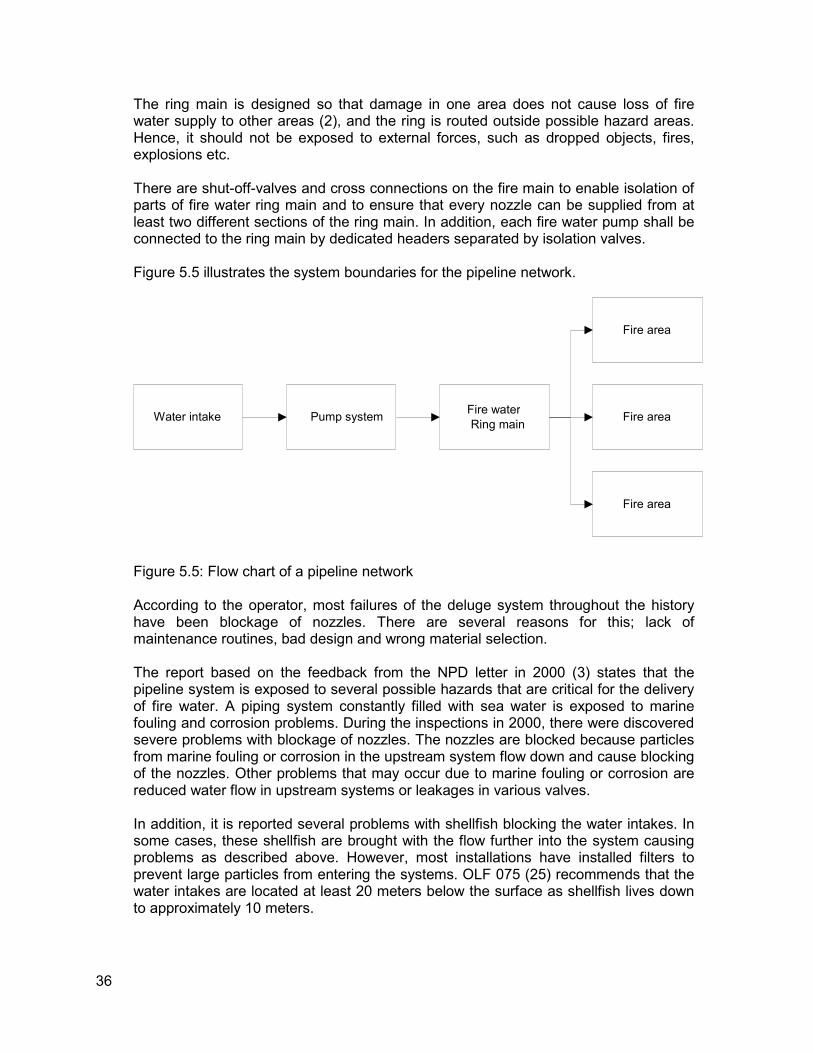
36
The ring main is designed so that damage in one area does not cause loss of fire water supply to other areas (2), and the ring is routed outside possible hazard areas. Hence, it should not be exposed to external forces, such as dropped objects, fires, explosions etc. There are shut-off-valves and cross connections on the fire main to enable isolation of parts of fire water ring main and to ensure that every nozzle can be supplied from at least two different sections of the ring main. In addition, each fire water pump shall be connected to the ring main by dedicated headers separated by isolation valves. Figure 5.5 illustrates the system boundaries for the pipeline network.
Figure 5.5: Flow chart of a pipeline network According to the operator, most failures of the deluge system throughout the history have been blockage of nozzles. There are several reasons for this; lack of maintenance routines, bad design and wrong material selection. The report based on the feedback from the NPD letter in 2000 (3) states that the pipeline system is exposed to several possible hazards that are critical for the delivery of fire water. A piping system constantly filled with sea water is exposed to marine fouling and corrosion problems. During the inspections in 2000, there were discovered severe problems with blockage of nozzles. The nozzles are blocked because particles from marine fouling or corrosion in the upstream system flow down and cause blocking of the nozzles. Other problems that may occur due to marine fouling or corrosion are reduced water flow in upstream systems or leakages in various valves. In addition, it is reported several problems with shellfish blocking the water intakes. In some cases, these shellfish are brought with the flow further into the system causing problems as described above. However, most installations have installed filters to prevent large particles from entering the systems. OLF 075 (25) recommends that the water intakes are located at least 20 meters below the surface as shellfish lives down to approximately 10 meters.
Water intakeFire water
Ring main
Fire area
Fire area
Fire area
Pump system
37
To minimize the problems of corrosion and marine fouling, material selection and supply of chemical fluids are of great importance. The guidelines that were introduced in 2002 have improved the situation and reduced both corrosion and marine fouling. According to the operator, it is assumed that marine fouling now is a greater problem than corrosion.
5.7.1 Corrosion
ISO 8044-1986 (33) defines corrosion as “Physicochemical interaction between a metal and its environment which results in changes in the properties of the metal and which may often lead to impairment of the function of the metal, the environment, or the technical system of which these form a part”. Hence, it means that electrons in the specific metal react with oxygen and water. For iron, this process is called rusting. There are several types of corrosion. Some of these are
• Normal corrosion Smooth corrosion coating of a surface. This is typical for carbon steel with or without surface coating. With normal corrosion, particles will frequently drift with the water flow and cause blocking of nozzles. In addition, the particles may attach to valves causing reduced flow or leakage.
• Pitting corrosion Pitting corrosion is located to very small areas and is typical to austenitic steel materials and duplex steel types. Because of the size, this corrosion type is difficult to discover.
• Crevice corrosion The materials that may develop pitting corrosion may also develop crevice corrosion. Crevice corrosion occurs normally in crevices of the pipeline, i.e. where the metal is in less contact with the water flow. Flanges are typical areas that are exposed to crevice corrosion. The result of crevice corrosion is a reduction of the material strength.
• Other types Deposit corrosion, galvanic corrosion, environmentally assisted cracking, erosion and intergranular attack are other regular types of corrosion that may occur in water filled piping systems (4).
5.7.2 Marine Fouling
Marine fouling results from animals and plants growth on equipment in connection with water. The fouling is frequently discovered in wide pipelines (five or more inches) and in areas with high temperature (34). Further, constant flow of a piping system will reduce the occurrence of marine fouling. However, fire water piping systems are normally not flowing, so heavy fouling may occur. Since fire water systems have a sudden rush of water flow, this may break loose particles from eventual fouling and transport the particles further into the system. The result may be blockage of nozzles and in extreme cases various valves. The nozzles are the items most exposed to blockage of particles because they have the smallest diameter of the equipment in a fire water system.
38
For operating platforms, there are several problems with mussels blocking the water intakes (3). However, mussels live naturally only down to about 10 meters. Therefore, it is reported that water intakes below about 20 m is less exposed to mussels than higher water intakes. The mussels manage to attach to most surfaces so the material selection does not influence the occurrence of mussels.
5.7.3 Particles
According to the operator, it has been a problem with particles in the deluge system that originates from neither corrosion nor marine fouling. Actually, these are particles that originate from the construction of the pipe systems or from maintenance projects. This may be tools, sponges, welding particles etc. The commissioning should reveal such particles, but this is not always the case. Often, such particles are not discovered before several full scale tests are performed. This is also discussed in (3).
5.7.4 Measures against Marine Fouling
There are several possible measures against marine fouling. Most fire water systems have supply of chemicals to avoid marine growth. This may for instance be chlorinated sea water that is supplied via the jockey pump (34). In addition, design optimization, and temperature regulation are other important measures against marine fouling.
5.7.5 Material Selection
Material selection for minimizing corrosion and marine fouling is well documented in the literature (3)(4)(25). Based on test data from operating platforms, the reports have summarized the appropriateness of various materials. The deluge systems at the Norwegian Continental Shelf are installed with several different materials. In addition, it is not unusual that one deluge system consists of various materials. For operating platforms, the material types found in the deluge systems can be partitioned in three time stages (3).
• In the 1970’s, the materials in the deluge systems were normally carbon steel or galvanized steel. The carbon steel was designed with a life span of 20 year, but the expected life time is later extended.
• The 80’s was a transition period with broad use of carbon steel and galvanized steel, but more corrosion resistant materials started to be installed. This was, among others, CuNi alloys, 6Mo steel and titan.
• The 90’s is characterized by extensive use of “stainless” steel and titan. However, some systems are constructed with carbonized steel and galvanized carbon steel.
The following subsections provide short descriptions of the different possible material selections and their corresponding behavior in relation to corrosion.
39
5.7.5.1 Titanium
Titanium has proved an excellent resistance against corrosion in contact with sea water. Further, the relative strength to weight ratio is considered to be high. Hence, titanium is now regarded as the best material for offshore deluge systems. However, the disadvantage of this material is a high cost. Hence, titanium is normally only used in critical components (4). A test of titanium deluge pipelines at the Norwegian Fire Research Laboratory shows that the material is resistant against jet fires in dry conditions, but also in the phase when the water starts flowing (3).
5.7.5.2 Super Duplex “Stainless” Steel (25Cr)
Super duplex steel (25Cr) is characterized by great strength and high resistance against most types of corrosion (3)(4). As long as the water temperature does not exceed 20°C, super duplex steel is considered to be an appropriate material. However, 25Cr is also considered to be an expensive material.
5.7.5.3 Cu-Ni Alloy (CuNi 90/10)
A Cu-Ni alloy is characterized by great resistance against most types of corrosion (3). In addition, the alloy has a preventive effect against marine fouling because the material contains copper. However, Cu-Ni alloy has a weakness with respect to pressure, crevice corrosion and erosion problems. Installations with Cu-Ni alloy have reported positive experiences in relation to corrosion.
5.7.5.4 Vulcanized Heat-Resistant Rubber Pipe System
This is a material that fulfills the demand from NPD and is tested against jet fires with a positive result. The pipe system may be bent around corners and it is common that titanium is used in the seams. According to (3), this material seems to be well applicable for ring main and distribution in the deluge system.
5.7.5.5 Glass Reinforced Plastic (GRP)
Described by (4), GRP seem to be a suitable material for deluge systems with respect to cost and weight. As GRP has superior corrosion resistance it leads to improved system availability. However, there are some concerns regarding the vulnerability of GRP in case of fire or explosions and occurrence of marine fouling. The background is that GRP is a weak material in relation to external stress.
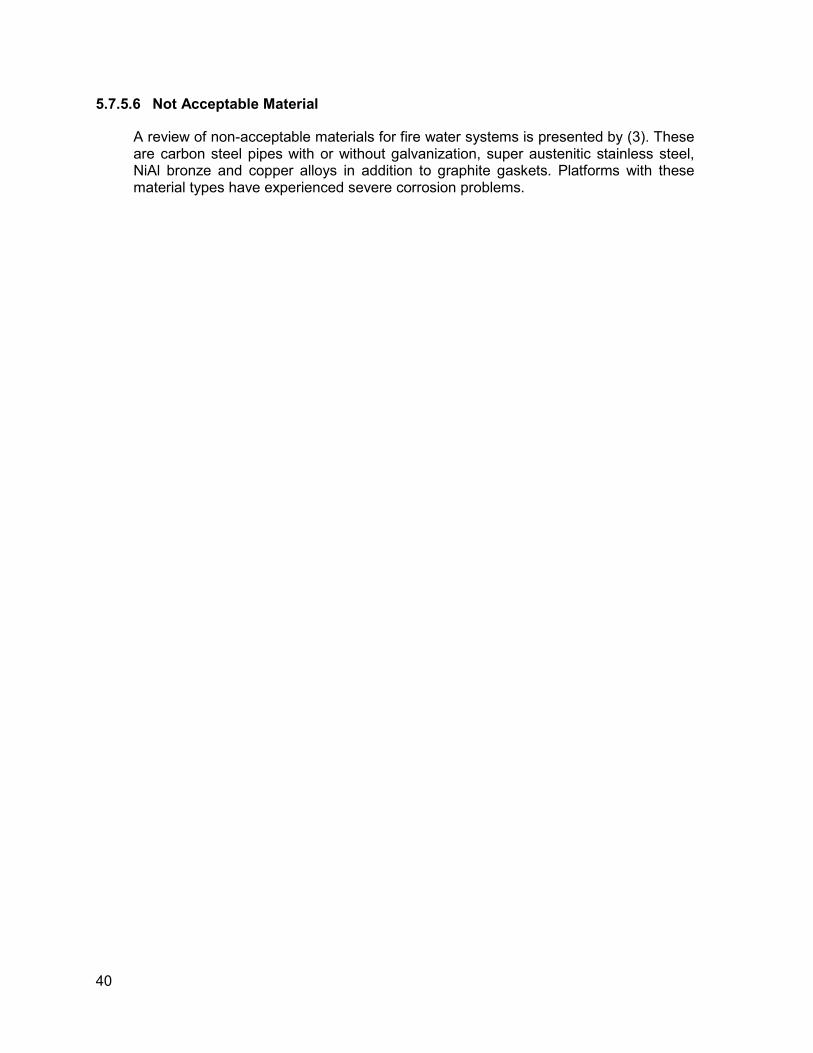
40
5.7.5.6 Not Acceptable Material
A review of non-acceptable materials for fire water systems is presented by (3). These are carbon steel pipes with or without galvanization, super austenitic stainless steel, NiAl bronze and copper alloys in addition to graphite gaskets. Platforms with these material types have experienced severe corrosion problems.
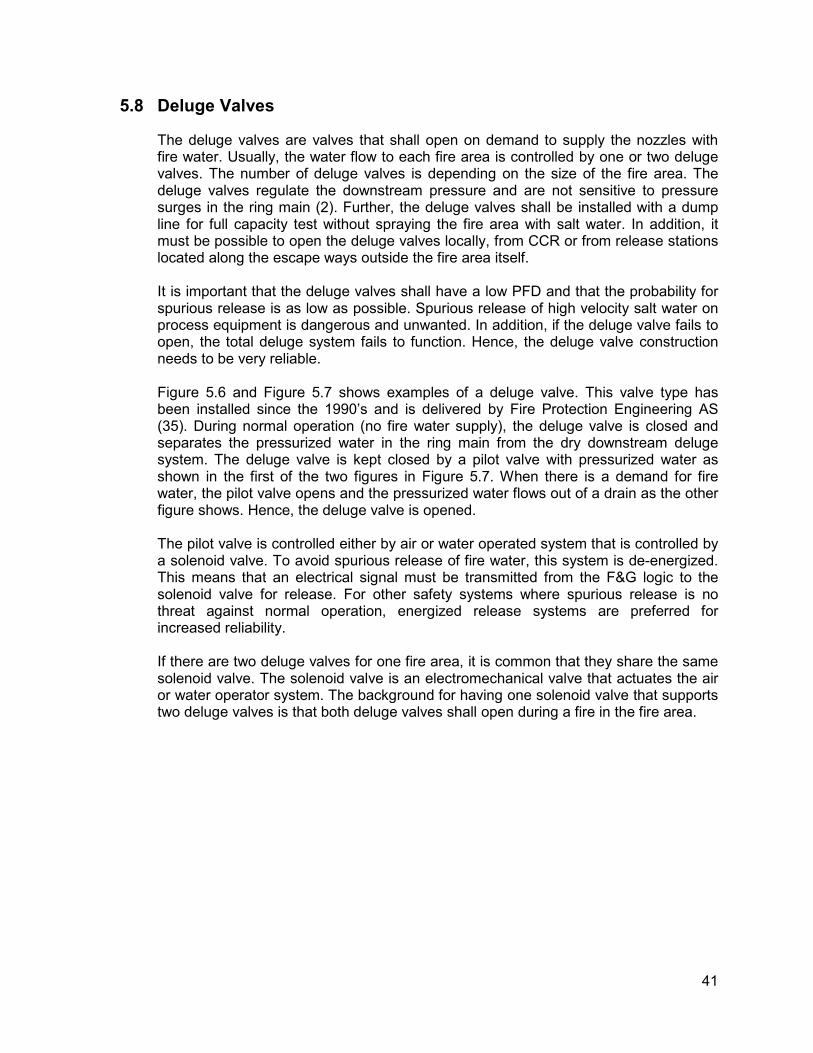
41
5.8 Deluge Valves
The deluge valves are valves that shall open on demand to supply the nozzles with fire water. Usually, the water flow to each fire area is controlled by one or two deluge valves. The number of deluge valves is depending on the size of the fire area. The deluge valves regulate the downstream pressure and are not sensitive to pressure surges in the ring main (2). Further, the deluge valves shall be installed with a dump line for full capacity test without spraying the fire area with salt water. In addition, it must be possible to open the deluge valves locally, from CCR or from release stations located along the escape ways outside the fire area itself. It is important that the deluge valves shall have a low PFD and that the probability for spurious release is as low as possible. Spurious release of high velocity salt water on process equipment is dangerous and unwanted. In addition, if the deluge valve fails to open, the total deluge system fails to function. Hence, the deluge valve construction needs to be very reliable. Figure 5.6 and Figure 5.7 shows examples of a deluge valve. This valve type has been installed since the 1990’s and is delivered by Fire Protection Engineering AS (35). During normal operation (no fire water supply), the deluge valve is closed and separates the pressurized water in the ring main from the dry downstream deluge system. The deluge valve is kept closed by a pilot valve with pressurized water as shown in the first of the two figures in Figure 5.7. When there is a demand for fire water, the pilot valve opens and the pressurized water flows out of a drain as the other figure shows. Hence, the deluge valve is opened. The pilot valve is controlled either by air or water operated system that is controlled by a solenoid valve. To avoid spurious release of fire water, this system is de-energized. This means that an electrical signal must be transmitted from the F&G logic to the solenoid valve for release. For other safety systems where spurious release is no threat against normal operation, energized release systems are preferred for increased reliability. If there are two deluge valves for one fire area, it is common that they share the same solenoid valve. The solenoid valve is an electromechanical valve that actuates the air or water operator system. The background for having one solenoid valve that supports two deluge valves is that both deluge valves shall open during a fire in the fire area.
42
Figure 5.6: Example of an inbal deluge valve. (Photo: www.fpe.no)
Figure 5.7: Illustration of pilot valve system. The left figure shows a closed deluge
valve and the right an open deluge valve. The valve is controlled by a pilot valve. (Photo: www.fpe.no)
5.9 Deluge Nozzles
The deluge nozzles are mechanical items without moving parts. The nozzles are dry upstream and one fire area contains many nozzles, 20 – 350 depending on the area size and geometry. OLF 075 recommends a diameter of at least 8 mm to reduce the probability for blockage (25).
The deluge nozzles are constructed to deliver the designated water flow. The supply of fire water shall be, as described in Section 4.3.2, 10 �/���b - �B( for process areas and equipment surfaces. For wellhead the demand is 20 �/ ���b - �B(. To ensure that everything is covered with fire water, the water flows out of the nozzles with a cone shape.
43
Since the nozzles are without any moving parts, they fail because of a third party failure. As described in Section 5.7, corrosion and marine fouling products may drift with the water flow and cause the nozzles to block. Since blockage does not occur during normal standby mode, full scale tests must be performed to reveal eventual blockage. The operator’s governing document (30) states that the deluge system in a fire area fails to function if more than 3 % of the nozzles are blocked.
5.10 Test Routines for Deluge Systems
Because the fire water system is a safety standby system, frequent testing is necessary to discover hidden failures. By introducing frequent testing, it is possible to increase the reliability of the system. A test may reveal faults at early stages before they become critical. It is evident that shorter test intervals imply higher availability. This is proved with the approximation for probability of failure on demand for a component �ST U OPQ - V/2 Where OPQ equals the failure rate for dangerous undetected failures and V is test interval. Hence, reducing the test interval gives a reduction of the PFD. For a deluge system, there are several reasons to perform frequent testing. Corrosion and marine fouling may lead to blocked nozzles and valves over time, and this is only discovered through testing. In addition, since the pumps and engines are in stand-by mode during normal operation, only testing can reveal if they start on demand. The deluge system components are being degraded over time, so testing is necessary.
The following sections describe the test routines for deluge systems operated by the same operator as the case study platform. Test routines for other companies operating on the Norwegian Continental Shelf are not examined further. However, reports discussing these tests (3)(4) show that the routines are almost similar for the different companies. NORSOK S-001 (2) states that pumps shall be designed for full capacity operation in 18 hours. According to the operator, a full operation test of the pump systems is only performed during commissioning6. This must be taken into consideration in a reliability analysis since normal tests may not be able to reveal failures that appear after long operation time. For all tests, the results shall be registered in the operator’s maintenance software. The test routines are summarized in Section 5.10.6 and the experiences provided by the operator are summarized in Section 5.10.7.
5.10.1 Start Procedure of Fire Water Pumps
The start-up of the firewater pumps is tested with a recommended test interval of 1 week and a maximum allowed interval of 2 weeks (36).
6 Commissioning is the facility testing after the design and building process is finished and before production can
be started.
44
A failure to start a fire water pump system has several various failure modes. These are
• The diesel engine does not start on first attempt
• Water does not flow out of drain pipe
• Not sufficient supply of fuel
• Start panel is partly or totally inaccessible
• System is mechanically blocked During the test, the pumps are operating for 30 minutes, i.e. until the oil temperature has reached normal operation level. The operators shall verify that water is flowing out of the dump drain.
5.10.2 Capacity Test of Fire Water Pumps
To test if the fire water pumps deliver a sufficient amount of water, i.e. above 90 % of the design demand of the pump, a test is performed with a recommended (and maximum) test interval of 12 months (37). The test is performed by separating the pump from the fire water system. Further, the drain dump valve is opened so that the fire water is drained to the sea. The pump is started and the pressure of the output water is measured. The pump is operated for about 30 minutes, or until normal oil temperature is reached.
5.10.3 Test of Start Sequence for Fire Water Pumps
A fire water pump system has, as described in Section 5.5, a prescribed start sequence. This start sequence logic starts a pump if another pump tried to start, but failed. This sequence continues until a sufficient number of pumps have started. The test interval for this test is 1 month and the maximum test interval is 24 months as described in the test procedures (38). The test is performed by simulating a fire water demand. Then it is observed that the specific pump starts and that water flows through the drain. Further, increased demand or failure of a pump is simulated. It is then observed if the next pump starts. The test is continued until all pumps are started.
5.10.4 Deluge Valves
A test of the deluge valves is performed with a test interval of 6 months and a maximum test interval of 12 months (39). The failure mode for failure of a deluge valve is that it does not open on demand. To ensure that the fire area is not flushed with water, a dump drain valve is opened downstream the deluge valve. The operators shall verify that the pressure in the deluge valve is correct and that there is no leakage when closing the valve (39).
5.10.5 Deluge Nozzles
The test routine report (40) states that component failure of nozzles is defined as blockage of nozzle or that flow from a nozzle is not cone shaped.

45
The test interval for a random nozzle shall be 2 years. Since it is impossible to test all nozzles simultaneously, the requirement is that all nozzles shall be tested within 2 years. The full scale test routine includes the following steps (40)
• Manual start-up of fire water system from the area to be tested, i.e. one specific fire area
• The engineers shall measure the time until the water reaches the last nozzle and perform measures of flow and pressure.
• Visual inspection of all nozzles to verify that they are not blocked or damaged. The visual inspection is performed while the deluge system is operating at full capacity in the specified fire area.
• Flush the pipe system downstream the deluge valve with freshwater to avoid salt deposits and corrosion.
• Check some random nozzles for deposits after the test is finished.
5.10.6 Summary of Test Routines
The test routines in Section 5.10.1 to 5.10.5 are summarized in Table 5.1. Note that TI denotes the test interval in hours.
Test Recommended TI Maximum TI
Start test of pumps 168 336
Test of start sequence 720 17520 Test of deluge valve 4380 8760
Capacity test of pumps 8760 8760 Full scale nozzle test 17520 17520
Table 5.1: Summary of test routines for the operator of the case test platform. The other companies operating on the Norwegian Continental Shelf have almost similar test routines.
5.10.7 Experiences of Test Routines
The operator has provided some information regarding the company’s test routines. This is important information when discussing test data and reliability. NFPA 16 (29) states that a full scale test shall be performed yearly. However, this is based on the assumption of a ring main constructed of carbon steel. This is no longer common practice as this material is related to corrosion problems (3). Hence, normal practice is to have test intervals according to material selection and reliability status of the system. If the full scale tests reveals no failures, the test interval may be increased, and vice versa. The background for this practice is that full scale tests are hazardous for the equipment. After OLF 075 (25) was distributed in 2002, there has been a focus on fresh water flushing of the ring main and video inspections. This has significantly reduced the problem with corrosion and marine fouling leading to blockage of nozzles.
46
Some platforms are performing full scale tests on reference fire areas. This means that the tests are performed in a fire area that is not harmed by salt water flushing. This is to avoid unwanted flushing of sea water in process areas. However, this may cause a skewed image of the reliability of the system since the actual fire areas are not tested. Another common way to avoid sea water flushing of process area has been to ship out a tank with fresh water. This tank is connected with external pumps to the fire water system at the platform. Hence, a full scale test is performed with fresh water from an external source. However, this may lead to false conclusions regarding the reliability. This is because the test does not involve the whole fire water system.
5.11 Reliability Test Data
The operator’s maintenance software is where all maintenance data shall be registered. For every test described in Section 5.10.1 to 5.10.5, it is registered whether a failure is found or not. If a failure is discovered during a test, a work order is placed in the database to schedule a repair. It is evident that all maintenance orders for a fire water system are urgent because the fire water system is critical to the platform. A fire water system that fails to be in standby mode implies that the production must be shut down. According to the operator, it is a problem with under-reporting in the maintenance data program. It happens that engineers repair the failures when they occur and forget to register them in the system. This occurs frequently when the problems are so small that work orders are not necessary. Blockage of nozzles is a failure that involves a high degree of uncertainty in the data system. The operator has stated a failure tolerance of 3 %. The engineer that inspects the nozzles during a full scale test may fail to identify all the failures because visual detection is difficult during full release of deluge. In addition, a blockage of a nozzle is easy to repair and may not always be registered properly. There are experienced problems with registration of failures to start the diesel engines. Sometimes, the engine does not start on the first attempt, but maybe the second time the start button is pushed. This is often not registered as a failure to start. However, if it had been a real alarm with demand for deluge, this would have caused severe problems. In addition, if one of the two starting systems does not work during a weekly start test, it is not described as a failure as long as one of them is working properly. The same problem as discussed above is experienced with the deluge valve solenoids. Sometimes it is released on a second try from the operator without registering this as a failure. This is equivalent when starting a car during cold weather on a second try. However, for a fire water system, it is necessary that the system starts at the first attempt, when assuming that the first attempt involves the sequential start.
47
6. CASE STUDY – ALFA
As described in Section 3.1, a reliability analysis is performed for an example platform to illustrate how a reliability analysis may be performed. Alfa7 is an offshore installation at the Norwegian Continental Shelf producing both oil and gas. The platform started operating in 1993. The Alfa platform is a floater platform with accommodation, drilling and processing installations on a steel jacket.
6.1 System Description
The firewater and foam system at Alfa is constructed according to the NORSOK guidelines (2) and is described in the engineering manual (41) of 1993. The active fire fighting system consists of several different subsystems; deluge system, sprinkler system, manual firefighting equipment and AFFF system. The fire water system at Alfa is independent of the sea water cooling system at the platform. An illustration of the deluge system at Alfa is shown in Figure 6.1. According to requirements, the system is designed to be independent of all other systems at the platform. Hence, the fire water system shall work properly even if no other systems at the platform are operating. Inspection of P&ID’s8 and the engineering manual has confirmed that there are no interfaces with other systems. The deluge system at Alfa consists of two 100 % fire water pump packages with a diesel-hydraulic power system. These pump packages supply fire water to the fire water ring main which transports the water to hose reels, sprinkler and deluge skids. 100 % capacity is defined as the NORSOK demand, which is firewater to the largest fire area. The fire water capacity at Alfa fulfills
Design flow rate 2780 �6/� Pressure at main deck 13.5 barg Seawater supply temperature Min 5°C
Max 12 °C
The system and the illustration below will be explained further in the following subsections.
7 The real name of the platform is made anonymous as discussed in Section 1.4.
8 P&ID is a piping and instrumentation diagram that illustrates the process flow and the equipment installed.
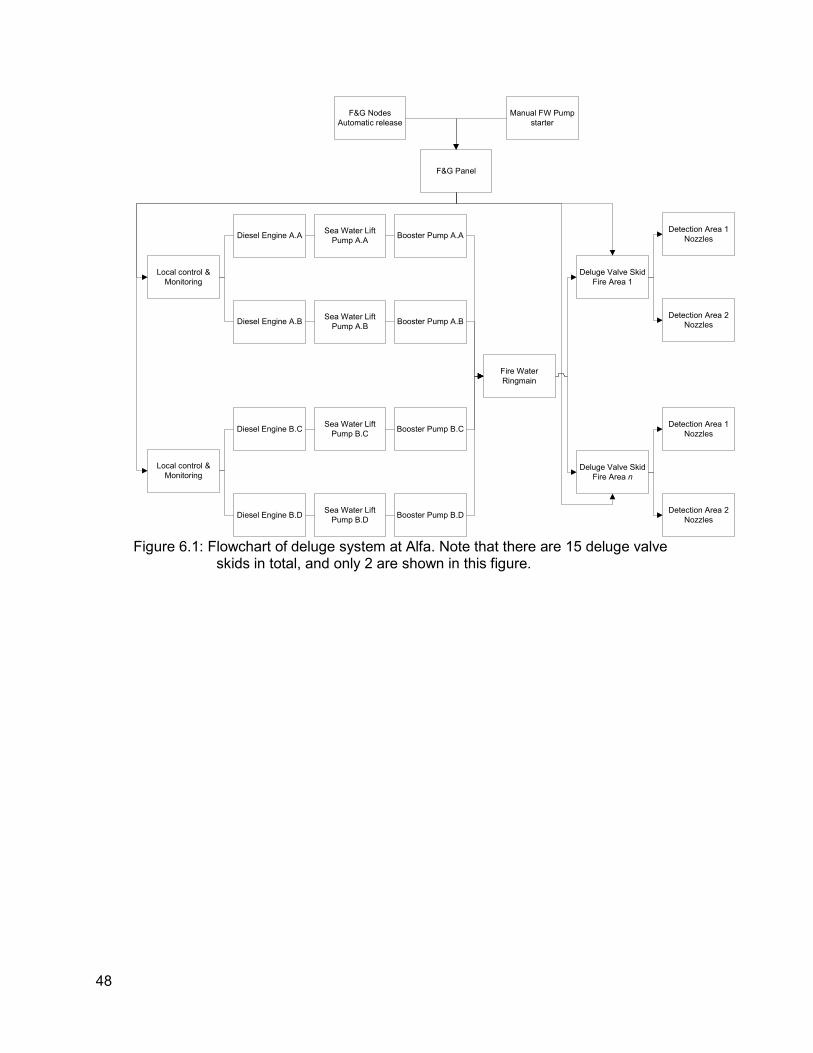
48
Figure 6.1: Flowchart of deluge system at Alfa. Note that there are 15 deluge valve
skids in total, and only 2 are shown in this figure.
F&G Panel
Local control &
Monitoring
Diesel Engine A.A
Diesel Engine A.B
Sea Water Lift
Pump A.A
Sea Water Lift
Pump A.B
Fire Water
Ringmain
Local control &
Monitoring
Diesel Engine B.C
Diesel Engine B.D
Sea Water Lift
Pump B.C
Sea Water Lift
Pump B.D
Deluge Valve Skid
Fire Area 1
Detection Area 1
Nozzles
Detection Area 2Nozzles
Deluge Valve Skid
Fire Area n
Detection Area 1
Nozzles
Detection Area 2
Nozzles
F&G Nodes
Automatic release
Manual FW Pump
starter
Booster Pump A.A
Booster Pump A.B
Booster Pump B.C
Booster Pump B.D
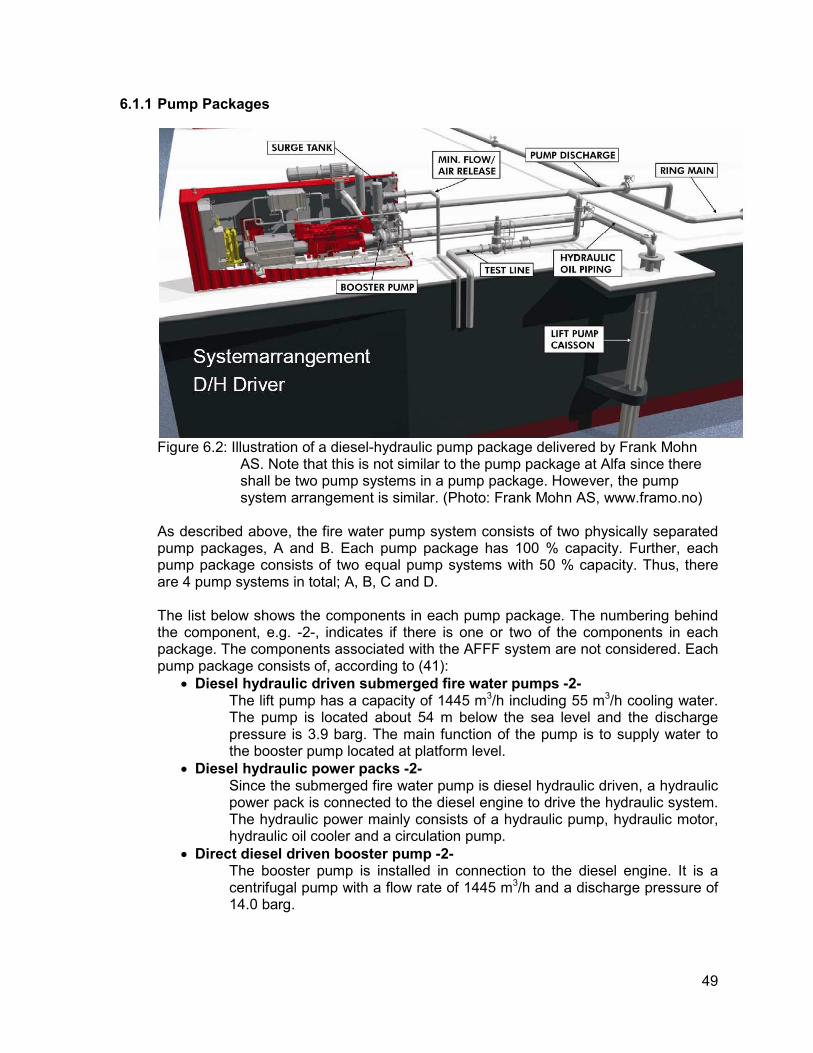
49
6.1.1 Pump Packages
Figure 6.2: Illustration of a diesel-hydraulic pump package delivered by Frank Mohn
AS. Note that this is not similar to the pump package at Alfa since there shall be two pump systems in a pump package. However, the pump system arrangement is similar. (Photo: Frank Mohn AS, www.framo.no)
As described above, the fire water pump system consists of two physically separated pump packages, A and B. Each pump package has 100 % capacity. Further, each pump package consists of two equal pump systems with 50 % capacity. Thus, there are 4 pump systems in total; A, B, C and D. The list below shows the components in each pump package. The numbering behind the component, e.g. -2-, indicates if there is one or two of the components in each package. The components associated with the AFFF system are not considered. Each pump package consists of, according to (41):
• Diesel hydraulic driven submerged fire water pumps -2- The lift pump has a capacity of 1445 m3/h including 55 m3/h cooling water. The pump is located about 54 m below the sea level and the discharge pressure is 3.9 barg. The main function of the pump is to supply water to the booster pump located at platform level.
• Diesel hydraulic power packs -2- Since the submerged fire water pump is diesel hydraulic driven, a hydraulic power pack is connected to the diesel engine to drive the hydraulic system. The hydraulic power mainly consists of a hydraulic pump, hydraulic motor, hydraulic oil cooler and a circulation pump.
• Direct diesel driven booster pump -2- The booster pump is installed in connection to the diesel engine. It is a centrifugal pump with a flow rate of 1445 m3/h and a discharge pressure of 14.0 barg.
50
• Diesel engine -2- Each package has two 1160 kW diesel engines running with 1800 RPM. The engines are fitted with overspeed monitoring and two redundant starting systems. In addition, each engine has a separate lube oil-, exhaust-, fuel oil- and cooling system.
• Diesel engine start air vessels -2- The pneumatic start system consists of air start motor connected to start air vessels. The start air vessels are monitored and pressurized by the engine start air compressor.
• Engine start air compressor -1- Each package is installed with one air compressor that pressurize the two start air vessels
• Diesel day tanks -2- Each diesel engine is connected to a day tank filled with diesel. The day tanks contain enough diesel for 24 hours operation at full load. In addition, the day tanks are constant monitored and refilled with diesel from the central diesel distribution system at the platform. Hence, the day tanks are always full.
• Hydraulic oil tank -2- The oil tank has a holding capacity of 425 l with an operating temperature of 40 °C and a total volume of 600 l.
• Hydraulic circulation pump -2- The pump is driven by a hydraulic circulation motor of 3.6 kW and the hydraulic circulation pump has a capacity of 19 l/min at 60 bar.
• Fire water pump control panels -2- The control panels receive signals from CCR to start a diesel engine. The local control panels ensure that the start sequence is correct.
• Fin/Fan coolers -2- This is an air cooling system for the diesel engine and the pump package room.
In addition to the engine start air compressor, a switchboard and a teleperm controller are common for the two pump systems installed in one package.
6.1.2 Pump Arrangement
Figure 6.3 shows a flow chart of one of the four pump systems at Alfa. The arrows illustrate the water flow. Mainly, the water is pumped from 54 m below the sea level by the submerged lift pump. Further, the water flows through the booster pump and to the ring main. During testing it is dumped to the sea below the platform. In addition, 55 m3/h of water is distributed to the diesel engine and hydraulic cooling system.
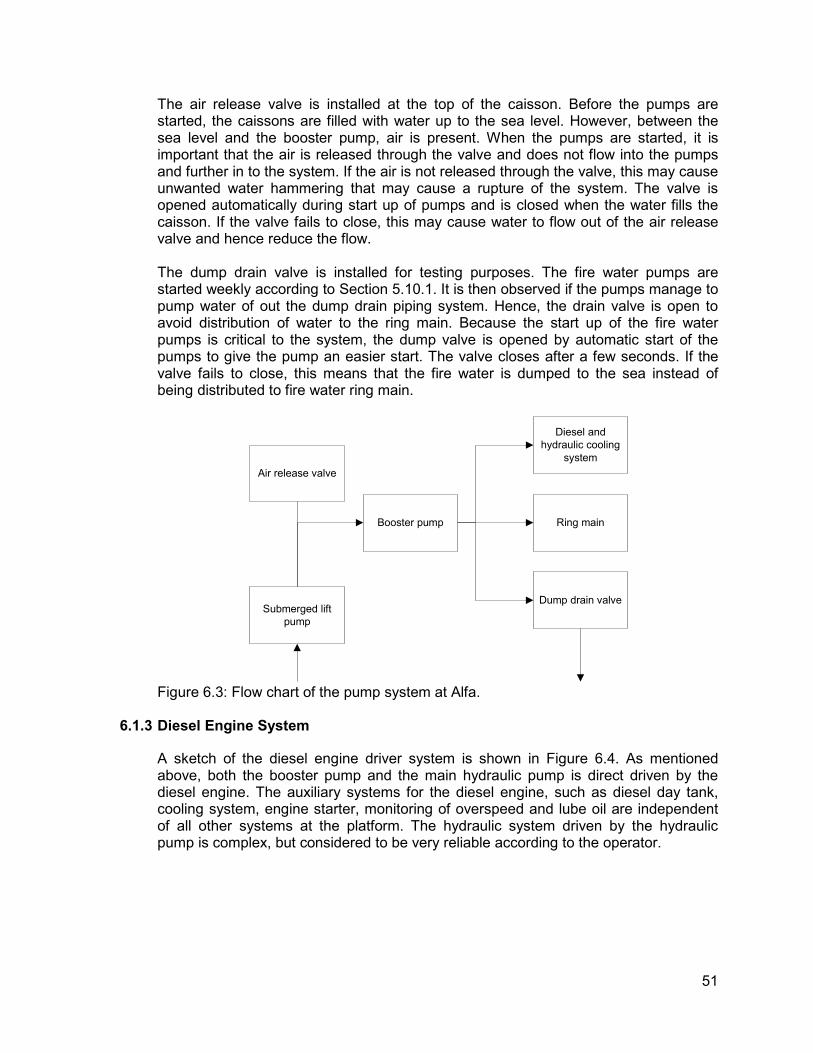
51
The air release valve is installed at the top of the caisson. Before the pumps are started, the caissons are filled with water up to the sea level. However, between the sea level and the booster pump, air is present. When the pumps are started, it is important that the air is released through the valve and does not flow into the pumps and further in to the system. If the air is not released through the valve, this may cause unwanted water hammering that may cause a rupture of the system. The valve is opened automatically during start up of pumps and is closed when the water fills the caisson. If the valve fails to close, this may cause water to flow out of the air release valve and hence reduce the flow. The dump drain valve is installed for testing purposes. The fire water pumps are started weekly according to Section 5.10.1. It is then observed if the pumps manage to pump water of out the dump drain piping system. Hence, the drain valve is open to avoid distribution of water to the ring main. Because the start up of the fire water pumps is critical to the system, the dump valve is opened by automatic start of the pumps to give the pump an easier start. The valve closes after a few seconds. If the valve fails to close, this means that the fire water is dumped to the sea instead of being distributed to fire water ring main.
Figure 6.3: Flow chart of the pump system at Alfa.
6.1.3 Diesel Engine System
A sketch of the diesel engine driver system is shown in Figure 6.4. As mentioned above, both the booster pump and the main hydraulic pump is direct driven by the diesel engine. The auxiliary systems for the diesel engine, such as diesel day tank, cooling system, engine starter, monitoring of overspeed and lube oil are independent of all other systems at the platform. The hydraulic system driven by the hydraulic pump is complex, but considered to be very reliable according to the operator.
Submerged lift
pump
Air release valve
Booster pump Ring main
Dump drain valve
Diesel and
hydraulic cooling
system
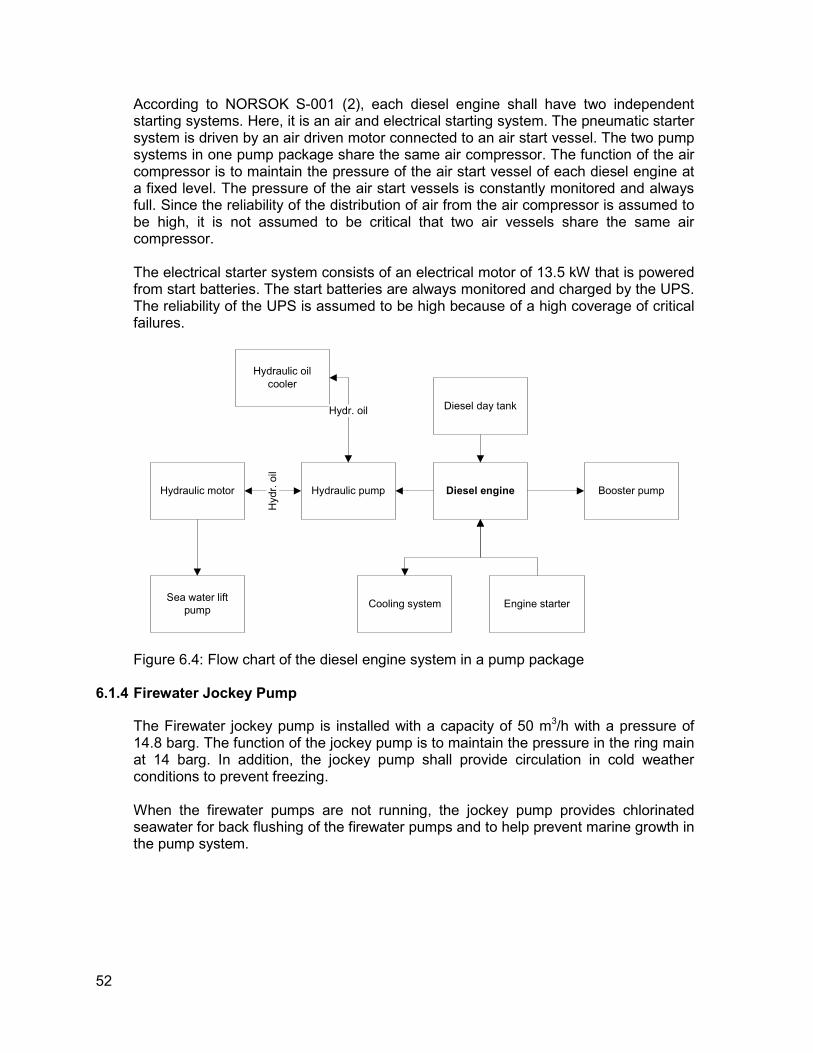
52
According to NORSOK S-001 (2), each diesel engine shall have two independent starting systems. Here, it is an air and electrical starting system. The pneumatic starter system is driven by an air driven motor connected to an air start vessel. The two pump systems in one pump package share the same air compressor. The function of the air compressor is to maintain the pressure of the air start vessel of each diesel engine at a fixed level. The pressure of the air start vessels is constantly monitored and always full. Since the reliability of the distribution of air from the air compressor is assumed to be high, it is not assumed to be critical that two air vessels share the same air compressor. The electrical starter system consists of an electrical motor of 13.5 kW that is powered from start batteries. The start batteries are always monitored and charged by the UPS. The reliability of the UPS is assumed to be high because of a high coverage of critical failures.
Figure 6.4: Flow chart of the diesel engine system in a pump package 6.1.4 Firewater Jockey Pump
The Firewater jockey pump is installed with a capacity of 50 m3/h with a pressure of 14.8 barg. The function of the jockey pump is to maintain the pressure in the ring main at 14 barg. In addition, the jockey pump shall provide circulation in cold weather conditions to prevent freezing. When the firewater pumps are not running, the jockey pump provides chlorinated seawater for back flushing of the firewater pumps and to help prevent marine growth in the pump system.
Diesel engine Booster pumpHydraulic pumpHydraulic motor
Sea water lift
pump
Diesel day tank
Cooling system Engine starter
Hydraulic oil
cooler
Hyd
r. o
il
Hydr. oil
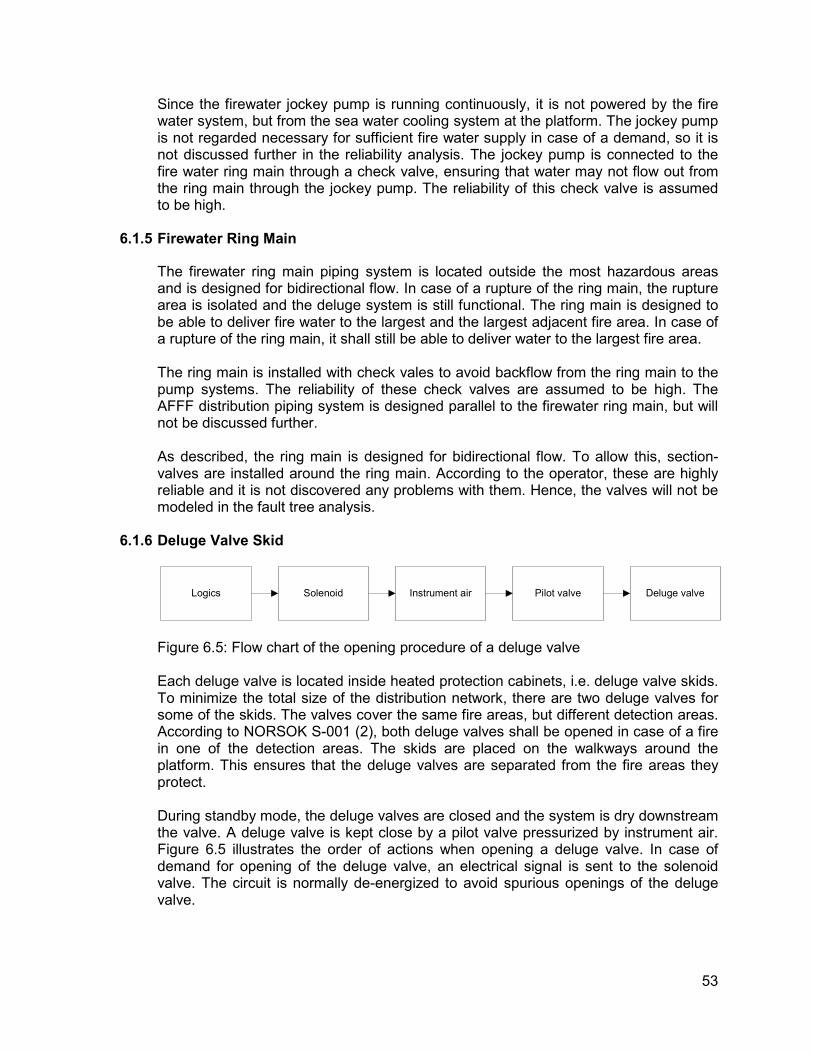
53
Since the firewater jockey pump is running continuously, it is not powered by the fire water system, but from the sea water cooling system at the platform. The jockey pump is not regarded necessary for sufficient fire water supply in case of a demand, so it is not discussed further in the reliability analysis. The jockey pump is connected to the fire water ring main through a check valve, ensuring that water may not flow out from the ring main through the jockey pump. The reliability of this check valve is assumed to be high.
6.1.5 Firewater Ring Main
The firewater ring main piping system is located outside the most hazardous areas and is designed for bidirectional flow. In case of a rupture of the ring main, the rupture area is isolated and the deluge system is still functional. The ring main is designed to be able to deliver fire water to the largest and the largest adjacent fire area. In case of a rupture of the ring main, it shall still be able to deliver water to the largest fire area. The ring main is installed with check vales to avoid backflow from the ring main to the pump systems. The reliability of these check valves are assumed to be high. The AFFF distribution piping system is designed parallel to the firewater ring main, but will not be discussed further. As described, the ring main is designed for bidirectional flow. To allow this, section-valves are installed around the ring main. According to the operator, these are highly reliable and it is not discovered any problems with them. Hence, the valves will not be modeled in the fault tree analysis.
6.1.6 Deluge Valve Skid
Figure 6.5: Flow chart of the opening procedure of a deluge valve Each deluge valve is located inside heated protection cabinets, i.e. deluge valve skids. To minimize the total size of the distribution network, there are two deluge valves for some of the skids. The valves cover the same fire areas, but different detection areas. According to NORSOK S-001 (2), both deluge valves shall be opened in case of a fire in one of the detection areas. The skids are placed on the walkways around the platform. This ensures that the deluge valves are separated from the fire areas they protect. During standby mode, the deluge valves are closed and the system is dry downstream the valve. A deluge valve is kept close by a pilot valve pressurized by instrument air. Figure 6.5 illustrates the order of actions when opening a deluge valve. In case of demand for opening of the deluge valve, an electrical signal is sent to the solenoid valve. The circuit is normally de-energized to avoid spurious openings of the deluge valve.
Logics Solenoid Instrument air Pilot valve Deluge valve
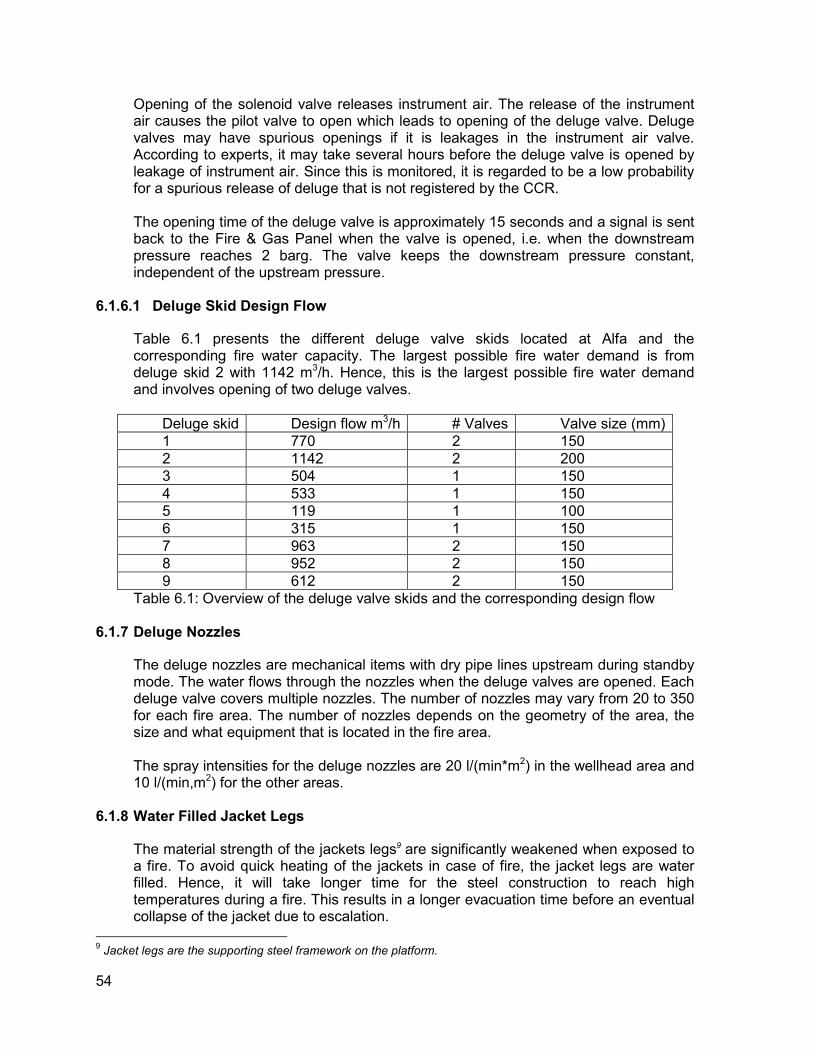
54
Opening of the solenoid valve releases instrument air. The release of the instrument air causes the pilot valve to open which leads to opening of the deluge valve. Deluge valves may have spurious openings if it is leakages in the instrument air valve. According to experts, it may take several hours before the deluge valve is opened by leakage of instrument air. Since this is monitored, it is regarded to be a low probability for a spurious release of deluge that is not registered by the CCR. The opening time of the deluge valve is approximately 15 seconds and a signal is sent back to the Fire & Gas Panel when the valve is opened, i.e. when the downstream pressure reaches 2 barg. The valve keeps the downstream pressure constant, independent of the upstream pressure.
6.1.6.1 Deluge Skid Design Flow
Table 6.1 presents the different deluge valve skids located at Alfa and the corresponding fire water capacity. The largest possible fire water demand is from deluge skid 2 with 1142 m3/h. Hence, this is the largest possible fire water demand and involves opening of two deluge valves.
Deluge skid Design flow m3/h # Valves Valve size (mm) 1 770 2 150
2 1142 2 200 3 504 1 150
4 533 1 150 5 119 1 100
6 315 1 150
7 963 2 150 8 952 2 150
9 612 2 150 Table 6.1: Overview of the deluge valve skids and the corresponding design flow
6.1.7 Deluge Nozzles
The deluge nozzles are mechanical items with dry pipe lines upstream during standby mode. The water flows through the nozzles when the deluge valves are opened. Each deluge valve covers multiple nozzles. The number of nozzles may vary from 20 to 350 for each fire area. The number of nozzles depends on the geometry of the area, the size and what equipment that is located in the fire area. The spray intensities for the deluge nozzles are 20 l/(min*m2) in the wellhead area and 10 l/(min,m2) for the other areas.
6.1.8 Water Filled Jacket Legs
The material strength of the jackets legs9 are significantly weakened when exposed to a fire. To avoid quick heating of the jackets in case of fire, the jacket legs are water filled. Hence, it will take longer time for the steel construction to reach high temperatures during a fire. This results in a longer evacuation time before an eventual collapse of the jacket due to escalation.
9 Jacket legs are the supporting steel framework on the platform.

55
The jacket legs may be refilled during a fire, but only manually through the fire water system. Hence, this system is not directly connected to the fire water system. To prevent marine fouling, biocide is added to the filling connection. Since the water filled jacket is not directly a part of the deluge system, it is not discussed further.
6.1.9 Construction Materials
According to the engineering manual (41), the firewater distribution system at Alfa is constructed with austenitic stainless steel (6Mo). For the fire water pump cooling system, a Cu/Ni 90/10 alloy is used. The 6Mo and Cu/Ni 90/10 materials are separated by a rubber lined carbon steel to avoid galvanic corrosion. The test lines from the deluge skids are made of GRE material and the jacket leg fillings system is carbon steel. The jacket legs have this material to avoid galvanic corrosion between the jacket legs and the fire water system because the jacket legs itself is made of carbon steel. It is not examined if the material is replaced after the platform was built. However, it is worth mentioning that the austenitic stainless steel used is assumed not to be acceptable according to Section 5.7.5.6. Hence, this may imply that there are problems with corrosion in the fire water system at Alfa.
6.2 Procedures
The system engineering manual (41) describes procedures for both start-up of the firewater pump systems in addition to testing and maintenance routines. These procedures are summarized in the following sections.
6.2.1 Start of Fire Water Pumps
There are several possible events that initiate the start up process of the fire water pumps. These are, according to (41):
• Low pressure signal from fire water ring main pressure transmitters
• High pressure signal from pressure transmitters on deluge skids
• Coincident fire or gas detection within a fire area (1oo3 detectors)
• Local and remote manual electric deluge release switches
• Manual Call Point Button
• Pushbutton for manual start on Local Control Panel within Firewater Pump Room
• Manual start signal from the Fire Pump Matrix Panel in CCR The deluge valves are released by confirmed fire or gas, where confirmed equals 2oo3 voting of the detectors. Release of deluge over gas is only standard for 4 of the 9 fire areas. For the other fire areas, it is not assumed that release of deluge may reduce the explosion pressure.
56
If there is a demand for firewater, then there is a set of rules for how the start up process will develop. Initially, each of the four pumps is defined with a priority number from 1 to 4. Then, in case of a demand for an automatic start of a fire pump, “priority 1” pump will start up. If 4 seconds have passed and “priority 1” pump failed to start, “priority 2” pump will start up. If the “priority 1” pump started, but didn’t manage to raise the ring main pressure to 12.0 barg after 20 seconds, then the “priority 2” pump starts. If the pressure in the ring main is below 12.0 barg after 40 seconds, then “priority 3” pump will start. In addition, it will also start if the “priority 2” pump fails to start within 4 seconds. If the pressure in the ring main is below 12.0 barg after 60 seconds, then “priority 4” will start. In addition, it will also start if the “priority 3” pump fails to start within 4 seconds. Each pump will have 12 start attempts, each of 15 seconds duration. The start attempts switch between electrical and air start, with electrical start on the first attempt. After about 11 seconds, the water is flowing through the check valve if the pump is functioning.
6.2.2 System Test Procedures
The tests performed at Alfa are according to the operator’s recommended test procedures and intervals discussed in Section 5.10. The test dump lines from the pumps and the deluge valve skids are directed down below the platform due to the large flow rates during operation.
6.2.3 Chemical Injection
The water filled jacket legs are connected to biocide filling to prevent marine fouling within the jacket legs. Corrosion inhibitors, that prevent corrosion, may also be connected to the filling. It is unclear whether this is common practice. The jockey pump supplies chlorinated sea water to the fire water ring main to prevent marine fouling.
6.2.4 System Maintenance
One pump system (50%) may be down for maintenance if at least 2 of the 3 remaining pump systems are available in auto remote start mode.
6.3 Fault Tree Modeling
A fault tree model is developed with the methods explained in Section 3.3. The following sections present the fault tree and describe the underlying assumptions. The quantitative analysis results is presented and discussed in Section 6.4.
6.3.1 System Boundaries
The function “release of fire water/deluge” is analyzed with the following assumptions
• A demand signal for fire water in the largest fire area is transmitted from F&G nodes
• 2 fire water pumps shall start and deliver fire water at full capacity, i.e. 100 %.
57
• Two deluge valves in one deluge valve skid shall open.
• Water shall flow out of the most distant nozzles in the fire area within 30 seconds and cover the fire area with the design pressure
• The fire water pumps shall be able to operate for 18 hours.
6.3.2 Fault Tree
The following subsections present the fault tree developed for the analysis. Further, the different possible hazards and failure modes will be discussed. The fault tree is split up in different sub fault trees due to space limitations. The main idea behind the development of the fault tree was to split down the system to components or subsystems that it is possible to obtain failure rates for. The fault trees are included in Appendix B. Remark that the symbol below a basic event that is two triangles implies that the component is assigned in a CCF group as explained in Section 3.4.
6.3.2.1 Top Event
The top event in the fault tree analysis of the fire water system at Alfa is defined as a failure to deliver fire water according to PSA requirements. This means that the water is not distributed with sufficient pressure to the most distant nozzles within 30 seconds after a confirmed fire or gas signal is received in the F&G logic from the detectors. In the quantitative analysis, the probability that this event occurs corresponds to the SIL demand stated by OLF 070 (32) which is discussed in Section 4.3.5.
6.3.2.2 Main Fault Tree
The main fault tree is presented in Appendix B.1. It states that a failure of the top event occurs if any of the following events occur:
• There is a failure of at least 3 of 4 pump systems
• The deluge valves fail to open
• There is a blockage of nozzles that causes reduced or lack of flow
• There is a failure of the logics, i.e. processing and transmission of F&G demand signal
Because it is assumed that each pump system delivers 50 % of the largest fire area capacity, at least 2 pumps must function properly to provide sufficient fire water coverage. Hence, failure of at least 3 pumps implies that less than 100 % fire water is distributed to the fire water system.
The basic event described as “Failure of logics” refer to a failure of the processing of a demand signal from the F&G detectors. The intention of the logic unit is to initiate an automatic start of the fire water pumps and transmit signals to the correct deluge valves that they shall open. As explained in the data dossier in Section 5.3, it is assumed high reliability of the logic unit because of high coverage of dangerous failures. Hence, it is assumed that the de-energized logic function has the same reliability as energized functions. This is the same assumptions as in OLF 070 (32).
58
6.3.2.3 Deluge Valves Fail to Open
As described in Section 6.1.6.1, the largest fire area consists of 2 deluge valves. In addition, as mentioned in Section 4.3.2, all deluge valves covering a fire area shall open to ensure sufficient fire water coverage. Hence, it is assumed that both deluge valves shall open on demand. The branch of the fault tree related to the deluge valves are shown in Appendix B.2. The deluge valves are in the fault tree differentiated to the solenoid valve and the deluge valve. The background is that most platforms have one solenoid valve that is shared by two deluge valves. On the other hand, some has one solenoid valve for each deluge valve. Alfa has one solenoid for each deluge valve. However, both are included to emphasize the importance of these items. Further, if input data are available for both solenoids and deluge valves, it is advised to include both in the quantitative analysis. The operator has stated that the problems with the deluge valves are usually related to the solenoids, i.e. that they did not open on demand.
6.3.2.4 Nozzle Blockage or Reduced/Fail Flow
The fault tree branch according to nozzle blockage is shown in Appendix B.3. Nozzle blockage may occur due to corrosion or marine fouling in any part of the system because the particles will be distributed with the flow and end up blocking the nozzles. Hence, a nozzle blockage is assumed to occurred if any of the following events occur
• The water flow is not cone shaped. This may occur if the nozzle itself is damaged.
• There is corrosion or marine fouling downstream the deluge valve
• If the particles origin from the upstream system, i.e. if any of the following events occur
o There is marine fouling or corrosion in the ring main o There is marine fouling or corrosion in the deluge valve o There is marine fouling or corrosion in the pump systems
It is evident that a quantitative analysis of this branch is difficult or even impossible. The tests that are performed will only reveal if a nozzle is blocked or not, and not where the particles origins from. To test any of the basic events described here, video inspection routines are necessary. However, a quantitative reliability model for the top event in this branch should be able to develop. Full scale tests performed according to Section 5.10.5 may reveal the rate of blocking of nozzles. Based on experiences from the operator, it is assumed that most particles that block the nozzles origin from marine fouling or corrosion in the ring main.
6.3.2.5 Failure of Pump System A
The obtained fault tree for pump system A in pump package A is presented in Appendix B.4. A pump system consists of many components. However, not all components are considered to be essential for a reliability analysis. The components included in the model are chosen after discussions with operators and other professionals. It has been an assessment in relation to detail level and the different components’ qualitative importance to the system unavailability.
59
A failure of a pump system is regarded to have three failure modes, which are
• The pump system does not start on demand
• The pump does not deliver a sufficient amount of water
• The pump breaks down within 18 hrs of operation With the system description of the pump packages and pump systems in Section 6.1 in mind, a fault tree is obtained. It is assumed that a failure of a pump system occurs if any of the following events occur
• Failure of the submerged lift pump system
• Failure of the booster pump
• Failure of the hydraulic system
• Failure of the diesel engine
• Failure to close the dump drain valve after start of pumps
• Failure to close the air release valve after start of pumps Submerged Lift Pump System The submerged lift pump is assumed to fail if any of the following events occur
• Water intake is blocked by particles
• Failure of the submerged lift pump
• Failure of the hydraulic motor The water intake at Alfa is located 54 meters below the sea surface. According to Section 5.7, there shall in general not be a problem with blockage of the water intake since the water intake is localized below 20 meters. However, the potential failure is included in the fault tree so to be aware of the possible problem, but will not be considered in the quantitative analysis. The potential failure modes of the submerged centrifugal lift pump are “fails to start”, “breaks down before 18 hours of operation” or “low output”. As described in the system description of Alfa, the submerged lift pump is directly driven by a hydraulic motor. This hydraulic motor is driven by the hydraulic system. Engineers have stated that the reliability of the hydraulic system of the diesel-hydraulic pump systems is generally high. A hydraulic motor is considered to be more reliable than an electric or diesel-driven motor since it is a rather simple unit. A hydraulic motor may be compared, with respect to reliability, with a pump because it is a unit that transfers hydraulic pressure to torque. Hence, the motor performs the opposite function of a pump. Failure of Booster Pumps A failure of the booster pump is considered to be a basic event because it is not convenient to break down the system further. As for the submerged lift pump, the failure modes are “fail to start”, breakdown and low output. The booster pump is directly driven by the diesel engine, and the operator has stated that most problems with the pump are related to that the diesel engine breaks down or does not start on demand.
60
Failure of the Hydraulic System The hydraulic system that connects the diesel engine with the submerged sea water lift pump consists of several components. Not all the components are assumed to be of importance with respect to the system reliability. In this analysis, it is assumed that only the main hydraulic pump, the hydraulic heat exchanger and the hydraulic motor (This unit is included in the “Submerged lift pump system failure”) are of importance. Components such as auxiliary pumps, circulation pump, hydraulic oil heater and hydraulic oil filter are not included and assumed to be reliable. In addition, it is assumed that the system may be able to operate for a period even if one of these auxiliary functions fails. The operator has stated that problems with the pump systems are in general not due to problems with the hydraulic system. The quantification shows that failure rates for hydraulic systems are difficult to obtain due to lack of generic and test data sources. Failure of Diesel Engine System It is assumed that failures of the diesel engine occur because of either failures of the starting system or the diesel engine itself. The diesel engine is differentiated with respect to the starting system to illustrate the two independent starting systems. The starting system fails only if both the air start system and the electrical start system fail on demand. As mentioned before, the two starting systems are independent. Further, the start logic assures a sequential start procedure with the electrical system as the first system to start. The operator has stated that most problems with the pump systems are related to the diesel engine.
Failure to Close the Dump Drain Valve after Start of Pumps The dump drain valve is considered to be critical for the fire water system according to Section 5.4. As described in Section 6.1.2, the dump drain valve shall close about 10 seconds after start up of the pumps. If the valve does not close, it is assumed that the water is dumped and not distributed to the fire water ring main. It is not assumed to be critical if the dump drain valve does not open on start up of fire water pumps because the pumps are designed to start anyways.
Failure to Close the Air Release Valve after Start of Pumps The idea behind including the air release valve is similar to the dump drain valve. It is not considered to be critical if the air release valve does not open during pump start, even though this may cause water hammering in the system. However, as described in 6.1.2, it is assumed to be critical if the air release valve does not close after about 10 seconds after pump start. If that happens, it is assumed that the flow is reduced because water is flowing out of the air release valve. Hence, the failure mode “fail to close” is the critical for the air release valve.
61
6.3.2.6 Failure of Pump System B, C and D
The fault trees of pump system B, C and D are shown in Appendix B.5, B.6 and B.7. The fault trees are similar to pump system A’s fault tree. Hence, they will not be discussed further.
6.4 Quantitative Analysis
The quantitative analysis is performed with RiskSpectrum (18). The quantitative methods and the software RiskSpectrum are described in Section 3.6. The challenge with the quantification is to establish accurate reliability input data for each of the basic events in the fault tree presented in Section 6.3.
6.4.1 Case Description
As presented in Section 6.3.2.1, the top event refers to insufficient fire water coverage of a fire area. The corresponding scenario for the quantification is:
• A fire has occurred in the largest fire area and a signal for confirmed fire (or gas) is transmitted to the F&G logic. Hence, two deluge valves shall open on demand.
• There is a demand for 100 % fire water capacity within 30 seconds to the farthest nozzles. Hence, 2 pumps shall be able to operate at full capacity.
• There shall be sufficient water flow for 18 hours. Sufficient water flow means 20 (l/min)/m2
6.4.2 Reliability Input Data
The data dossier developed for this analysis is presented in Appendix A. That section does also give a short presentation of the various data sources used. The intention was to establish failure rates, test intervals, beta-factors and repair times for all components with influence on the reliability. However, it has been a difficult task since many of the reliability input data are difficult to obtain. The following subsections present the components that are not quantified.
6.4.2.1 Deluge Solenoid
Since the operator has experienced trouble with the deluge solenoids, it was the intention to acquire failure rates for both the deluge valves and the solenoids. However, as the test data from the operator included only tests of the deluge valve as a system including both valve and solenoid, this was regarded to be impossible. Hence, the obtained reliability data for the deluge valves includes the solenoid.
6.4.2.2 Nozzle Blockage Reliability
Reliability data inputs are not estimated for the following basic events
• Water flow is not cone shaped
• Corrosion or marine fouling downstream deluge valve
• Marine fouling or corrosion in pump systems
• Marine fouling or corrosion in ring main
• Water intake A blocked by particles
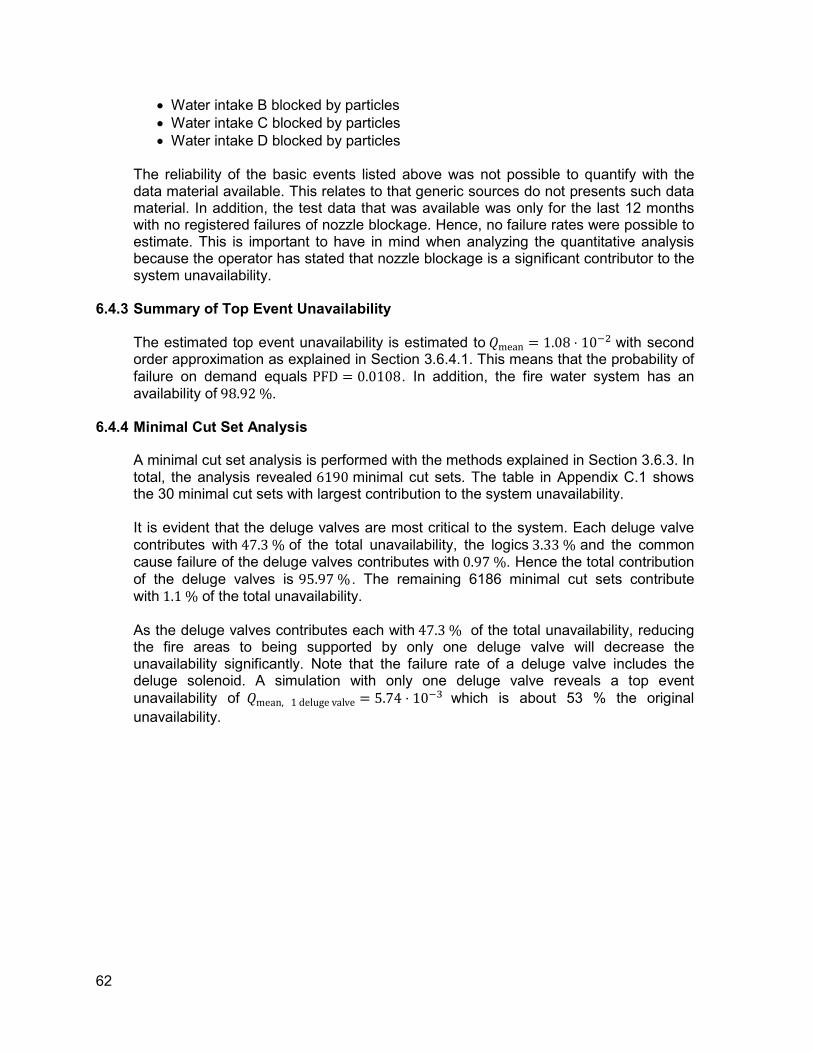
62
• Water intake B blocked by particles
• Water intake C blocked by particles
• Water intake D blocked by particles The reliability of the basic events listed above was not possible to quantify with the data material available. This relates to that generic sources do not presents such data material. In addition, the test data that was available was only for the last 12 months with no registered failures of nozzle blockage. Hence, no failure rates were possible to estimate. This is important to have in mind when analyzing the quantitative analysis because the operator has stated that nozzle blockage is a significant contributor to the system unavailability.
6.4.3 Summary of Top Event Unavailability
The estimated top event unavailability is estimated to [mean � 1.08 - 10�B with second order approximation as explained in Section 3.6.4.1. This means that the probability of failure on demand equals PFD � 0.0108. In addition, the fire water system has an availability of 98.92 %.
6.4.4 Minimal Cut Set Analysis
A minimal cut set analysis is performed with the methods explained in Section 3.6.3. In total, the analysis revealed 6190 minimal cut sets. The table in Appendix C.1 shows the 30 minimal cut sets with largest contribution to the system unavailability. It is evident that the deluge valves are most critical to the system. Each deluge valve contributes with 47.3 % of the total unavailability, the logics 3.33 % and the common cause failure of the deluge valves contributes with 0.97 %. Hence the total contribution of the deluge valves is 95.97 % . The remaining 6186 minimal cut sets contribute with 1.1 % of the total unavailability. As the deluge valves contributes each with 47.3 % of the total unavailability, reducing the fire areas to being supported by only one deluge valve will decrease the unavailability significantly. Note that the failure rate of a deluge valve includes the deluge solenoid. A simulation with only one deluge valve reveals a top event unavailability of [mean, 1 deluge valve � 5.74 - 10�6 which is about 53 % the original
unavailability.
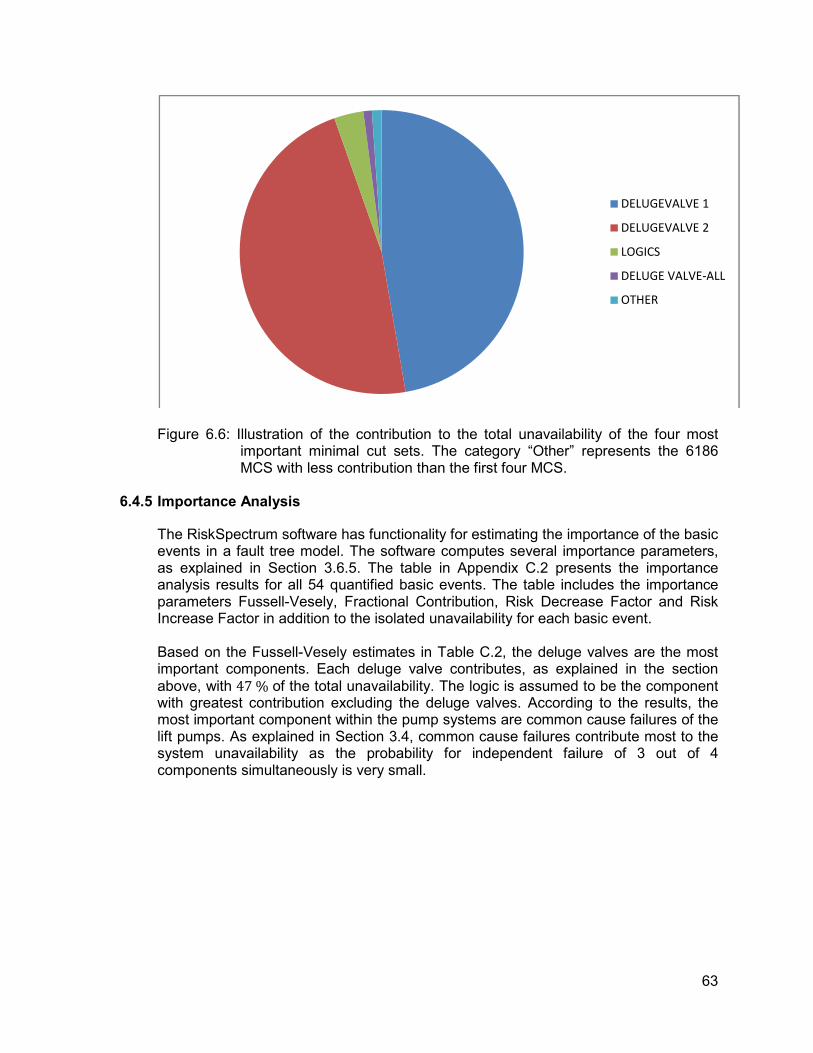
63
Figure 6.6: Illustration of the contribution to the total unavailability of the four most
important minimal cut sets. The category “Other” represents the 6186 MCS with less contribution than the first four MCS.
6.4.5 Importance Analysis
The RiskSpectrum software has functionality for estimating the importance of the basic events in a fault tree model. The software computes several importance parameters, as explained in Section 3.6.5. The table in Appendix C.2 presents the importance analysis results for all 54 quantified basic events. The table includes the importance parameters Fussell-Vesely, Fractional Contribution, Risk Decrease Factor and Risk Increase Factor in addition to the isolated unavailability for each basic event.
Based on the Fussell-Vesely estimates in Table C.2, the deluge valves are the most important components. Each deluge valve contributes, as explained in the section above, with 47 % of the total unavailability. The logic is assumed to be the component with greatest contribution excluding the deluge valves. According to the results, the most important component within the pump systems are common cause failures of the lift pumps. As explained in Section 3.4, common cause failures contribute most to the system unavailability as the probability for independent failure of 3 out of 4 components simultaneously is very small.
DELUGEVALVE 1
DELUGEVALVE 2
LOGICS
DELUGE VALVE-ALL
OTHER
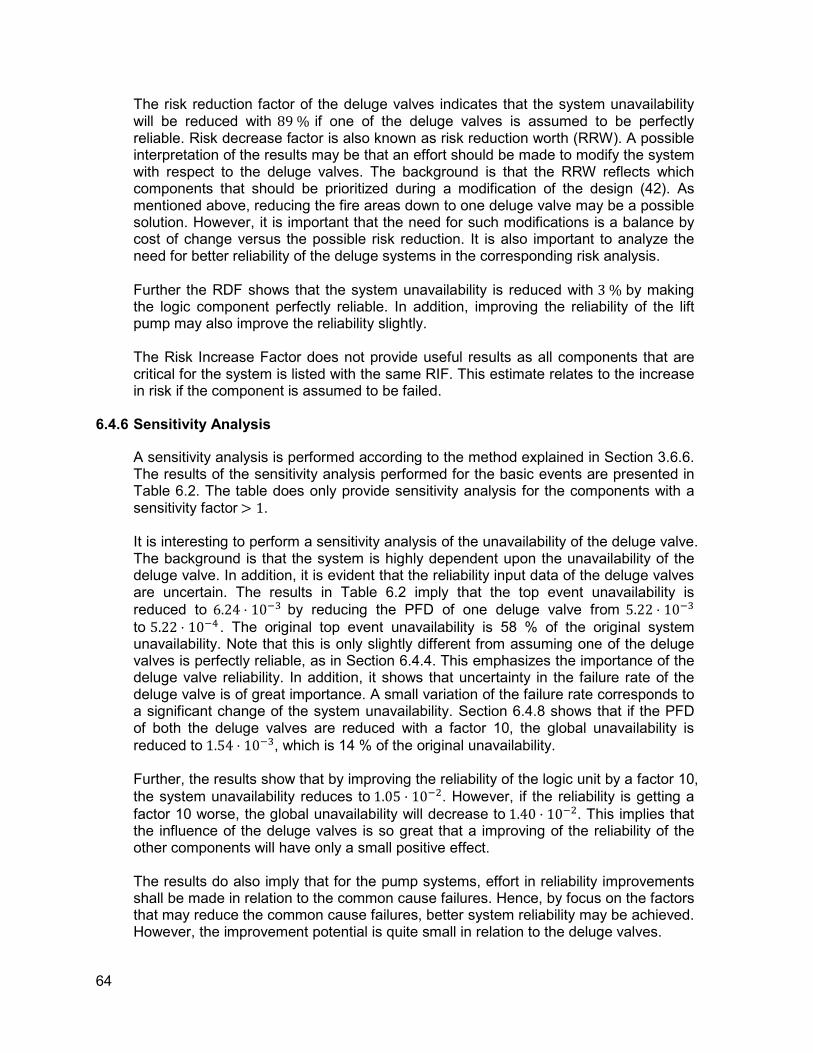
64
The risk reduction factor of the deluge valves indicates that the system unavailability will be reduced with 89 % if one of the deluge valves is assumed to be perfectly reliable. Risk decrease factor is also known as risk reduction worth (RRW). A possible interpretation of the results may be that an effort should be made to modify the system with respect to the deluge valves. The background is that the RRW reflects which components that should be prioritized during a modification of the design (42). As mentioned above, reducing the fire areas down to one deluge valve may be a possible solution. However, it is important that the need for such modifications is a balance by cost of change versus the possible risk reduction. It is also important to analyze the need for better reliability of the deluge systems in the corresponding risk analysis. Further the RDF shows that the system unavailability is reduced with 3 % by making the logic component perfectly reliable. In addition, improving the reliability of the lift pump may also improve the reliability slightly. The Risk Increase Factor does not provide useful results as all components that are critical for the system is listed with the same RIF. This estimate relates to the increase in risk if the component is assumed to be failed.
6.4.6 Sensitivity Analysis
A sensitivity analysis is performed according to the method explained in Section 3.6.6. The results of the sensitivity analysis performed for the basic events are presented in Table 6.2. The table does only provide sensitivity analysis for the components with a sensitivity factor � 1. It is interesting to perform a sensitivity analysis of the unavailability of the deluge valve. The background is that the system is highly dependent upon the unavailability of the deluge valve. In addition, it is evident that the reliability input data of the deluge valves are uncertain. The results in Table 6.2 imply that the top event unavailability is reduced to 6.24 - 10�6 by reducing the PFD of one deluge valve from 5.22 - 10�6
to 5.22 - 10�� . The original top event unavailability is 58 % of the original system unavailability. Note that this is only slightly different from assuming one of the deluge valves is perfectly reliable, as in Section 6.4.4. This emphasizes the importance of the deluge valve reliability. In addition, it shows that uncertainty in the failure rate of the deluge valve is of great importance. A small variation of the failure rate corresponds to a significant change of the system unavailability. Section 6.4.8 shows that if the PFD of both the deluge valves are reduced with a factor 10, the global unavailability is reduced to 1.54 - 10�6, which is 14 % of the original unavailability. Further, the results show that by improving the reliability of the logic unit by a factor 10, the system unavailability reduces to 1.05 - 10�B. However, if the reliability is getting a
factor 10 worse, the global unavailability will decrease to 1.40 - 10�B. This implies that the influence of the deluge valves is so great that a improving of the reliability of the other components will have only a small positive effect. The results do also imply that for the pump systems, effort in reliability improvements shall be made in relation to the common cause failures. Hence, by focus on the factors that may reduce the common cause failures, better system reliability may be achieved. However, the improvement potential is quite small in relation to the deluge valves.
65
No. ID Normal value Sens. Sens. High Sens. Low
1 DELUGEVALVE 1 5,12E-03 9,06E+00 5,66E-02 6,24E-03
2 DELUGEVALVE 2 5,12E-03 9,06E+00 5,66E-02 6,24E-03
3 LOGICS 3,60E-04 1,34E+00 1,40E-02 1,05E-02
4 DELUGE VALVE-ALL 1,04E-04 1,10E+00 1,18E-02 1,07E-02
5 LIFTPUMP-ALL 9,42E-05 1,09E+00 1,17E-02 1,07E-02
6 DIESELENGINE-ALL 4,49E-05 1,04E+00 1,12E-02 1,08E-02
7 BOOSTERPUMP-ALL 8,54E-06 1,01E+00 1,09E-02 1,08E-02
Table 6.2: Results of sensitivity analysis for basic events. Only basic events with a sensitivity constant � 1, according to Section 3.6.6, are displayed.
6.4.7 Group Contribution to Unavailability
To establish a better understanding of which parts of the fire water system that contributes to the unavailability, the components are grouped as follows:
• Deluge valve o 2 deluge valves
• Diesel engine o 4 Diesel engines o 4 Electrical starters o 4 Air starters
• Hydraulic system o 4 Hydraulic pumps o 4 Hydraulic motors o 4 Hydraulic heat exchangers
• Logics
• Particles o Nozzle blockage o 4 Water intake blockage
• Pumps o 4 booster pumps o 4 lift pumps
• Pump package valves o 4 Air release valves o 4 dump drain valves
Table 6.3 shows the results of the importance analysis at subsystem level. The Fractional Contribution states that the deluge valves are the largest contributor to the system unavailability. This corresponds to the results of Section 6.4.4 and 6.4.5. The results are illustrated in a pie diagram in Figure 6.7. This shows how dominant the deluge valves are with respect to unavailability contribution. Experiences from the operator show that most failures, excluded blockage of nozzles, were related to the diesel engines. However, these results imply that this is not the case as the diesel engines only account for 0.412 % of the unavailability.
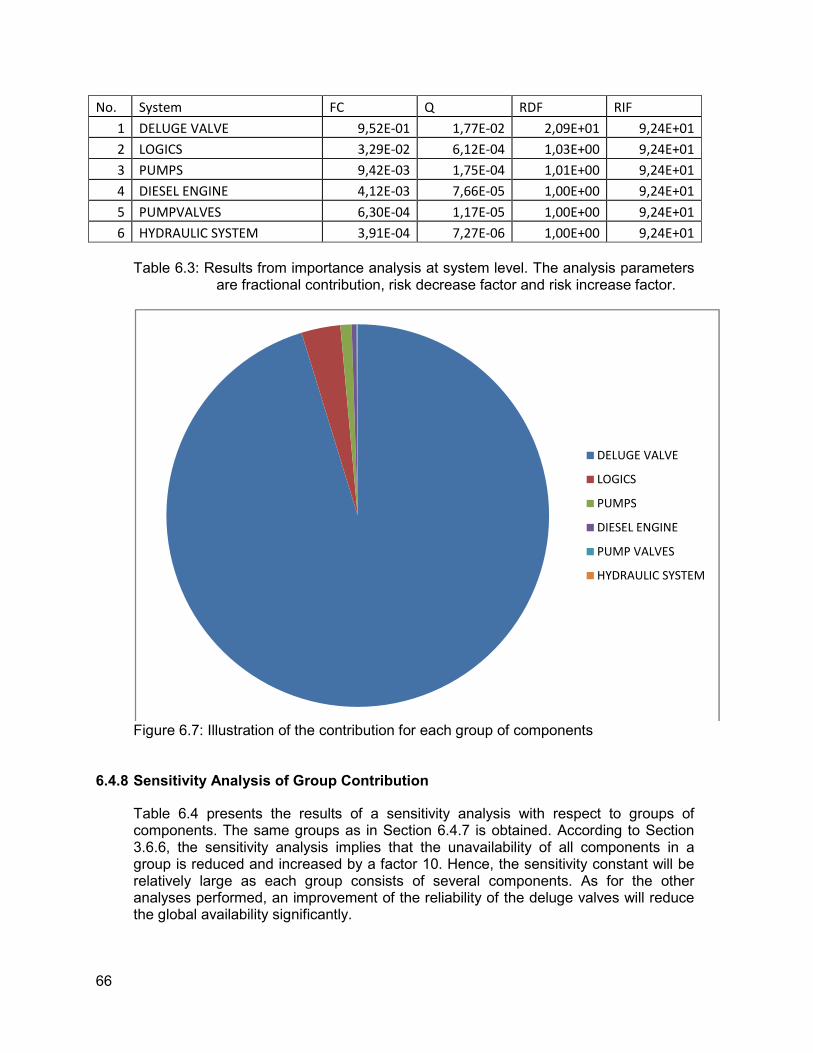
66
No. System FC Q RDF RIF
1 DELUGE VALVE 9,52E-01 1,77E-02 2,09E+01 9,24E+01
2 LOGICS 3,29E-02 6,12E-04 1,03E+00 9,24E+01
3 PUMPS 9,42E-03 1,75E-04 1,01E+00 9,24E+01
4 DIESEL ENGINE 4,12E-03 7,66E-05 1,00E+00 9,24E+01
5 PUMPVALVES 6,30E-04 1,17E-05 1,00E+00 9,24E+01
6 HYDRAULIC SYSTEM 3,91E-04 7,27E-06 1,00E+00 9,24E+01
Table 6.3: Results from importance analysis at system level. The analysis parameters
are fractional contribution, risk decrease factor and risk increase factor.
Figure 6.7: Illustration of the contribution for each group of components
6.4.8 Sensitivity Analysis of Group Contribution
Table 6.4 presents the results of a sensitivity analysis with respect to groups of components. The same groups as in Section 6.4.7 is obtained. According to Section 3.6.6, the sensitivity analysis implies that the unavailability of all components in a group is reduced and increased by a factor 10. Hence, the sensitivity constant will be relatively large as each group consists of several components. As for the other analyses performed, an improvement of the reliability of the deluge valves will reduce the global availability significantly.
DELUGE VALVE
LOGICS
PUMPS
DIESEL ENGINE
PUMP VALVES
HYDRAULIC SYSTEM
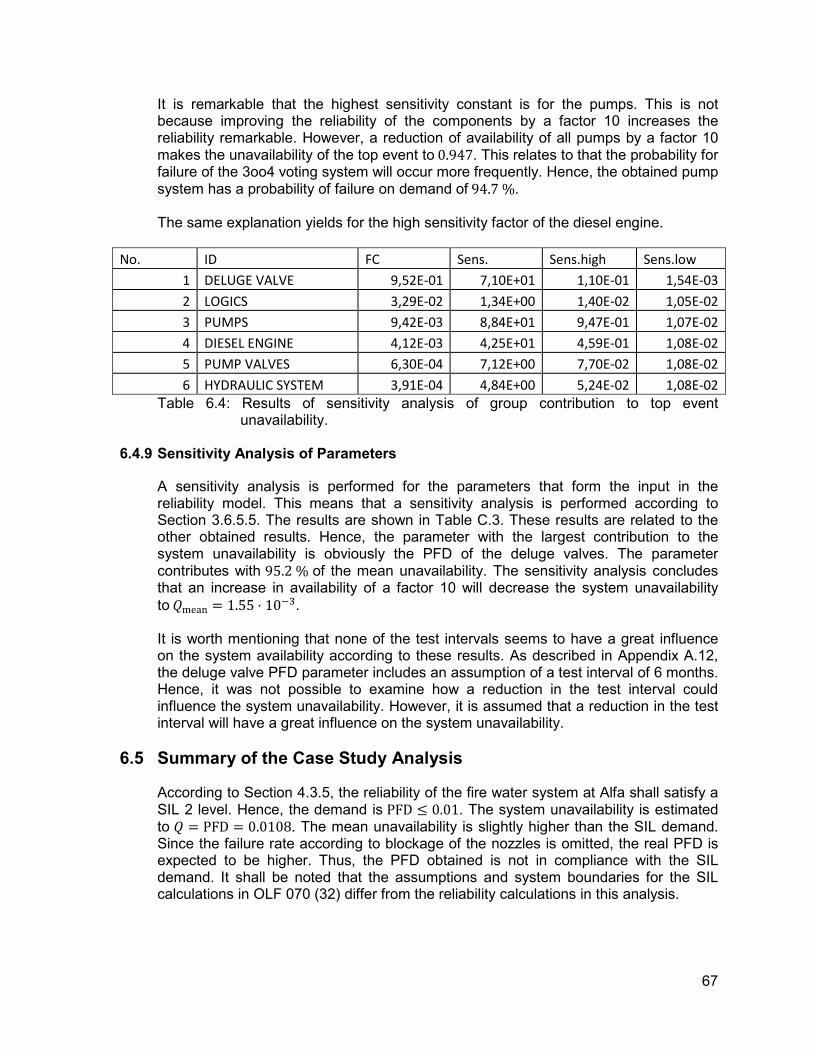
67
It is remarkable that the highest sensitivity constant is for the pumps. This is not because improving the reliability of the components by a factor 10 increases the reliability remarkable. However, a reduction of availability of all pumps by a factor 10 makes the unavailability of the top event to 0.947. This relates to that the probability for failure of the 3oo4 voting system will occur more frequently. Hence, the obtained pump system has a probability of failure on demand of 94.7 %. The same explanation yields for the high sensitivity factor of the diesel engine.
No. ID FC Sens. Sens.high Sens.low
1 DELUGE VALVE 9,52E-01 7,10E+01 1,10E-01 1,54E-03
2 LOGICS 3,29E-02 1,34E+00 1,40E-02 1,05E-02
3 PUMPS 9,42E-03 8,84E+01 9,47E-01 1,07E-02
4 DIESEL ENGINE 4,12E-03 4,25E+01 4,59E-01 1,08E-02
5 PUMP VALVES 6,30E-04 7,12E+00 7,70E-02 1,08E-02
6 HYDRAULIC SYSTEM 3,91E-04 4,84E+00 5,24E-02 1,08E-02
Table 6.4: Results of sensitivity analysis of group contribution to top event unavailability.
6.4.9 Sensitivity Analysis of Parameters
A sensitivity analysis is performed for the parameters that form the input in the reliability model. This means that a sensitivity analysis is performed according to Section 3.6.5.5. The results are shown in Table C.3. These results are related to the other obtained results. Hence, the parameter with the largest contribution to the system unavailability is obviously the PFD of the deluge valves. The parameter contributes with 95.2 % of the mean unavailability. The sensitivity analysis concludes that an increase in availability of a factor 10 will decrease the system unavailability to [mean � 1.55 - 10�6. It is worth mentioning that none of the test intervals seems to have a great influence on the system availability according to these results. As described in Appendix A.12, the deluge valve PFD parameter includes an assumption of a test interval of 6 months. Hence, it was not possible to examine how a reduction in the test interval could influence the system unavailability. However, it is assumed that a reduction in the test interval will have a great influence on the system unavailability.
6.5 Summary of the Case Study Analysis
According to Section 4.3.5, the reliability of the fire water system at Alfa shall satisfy a SIL 2 level. Hence, the demand is PFD 0.01. The system unavailability is estimated to [ � PFD � 0.0108. The mean unavailability is slightly higher than the SIL demand. Since the failure rate according to blockage of the nozzles is omitted, the real PFD is expected to be higher. Thus, the PFD obtained is not in compliance with the SIL demand. It shall be noted that the assumptions and system boundaries for the SIL calculations in OLF 070 (32) differ from the reliability calculations in this analysis.
68
The analysis shows that the deluge valve skid contributes most to the system unavailability. It is showed in Section 6.4.4 that the deluge valve skid, including two deluge valves and two solenoids, contributes 95.97 % of Q. Hence, to improve the reliability of the system, the focus should be on the deluge valves. Improved reliability may be achieved by more frequent testing, better reliability of components or by introduction of redundancy. The availability of reliable data sources shall be taken into consideration when evaluating the results. The information provided by the operator implies that the analysis is not complete with the data input that was available. Discussions with the operator have shown that the most frequent problem in general is blocking of nozzles by marine fouling and corrosion. However, it was not possible to obtain an estimate for this problem. Hence, the resulting analysis that excludes blocking of nozzles is interpreted as a too optimistic result.
69
7. DISCUSSION
The work with this report has showed that developing proper documentation for the reliability of a platform’s deluge system is a complex and time consuming task. Fire fighting systems are technically complicated systems that are difficult to analyze. In addition, extensive reliability modeling of such systems is performed to a small extent before. Hence, reliability data, system documentations and experiences are difficult to obtain. To improve the knowledge within reliability of fire water systems, this thesis should be followed up according to some aspects discussed in Section 7.2.
7.1 Results and Recommendations
According to the change in the NORSOK S-001 in 2008 (2), it is now possible to take credit for deluge systems when designing fire protection. However, proper documentation of the reliability of the systems shall be provided. Further, it is critical that the risk analyst performs an extensive consequence analysis regarding the fire protection design. As it is discussed in Section 2.4, the actual reliability level of the deluge system is of great importance. If a fire area is dependent of deluge to withstand the global heat load, an event tree shall be developed to examine the consequences of an eventual deluge system failure. If, for example, the assumed reliability is 98 % for the deluge system, it shall be documented what the consequence is for the remaining 2 % unavailability according to the total risk for the installation. This illustrates the importance of high reliability of deluge systems when including the effect. As discussed, PSA states that fire water supply shall be available “at all times”. However, a more tangible reliability measure is needed. The only reliability demand available for deluge systems are the SIL 2 demand stated by OLF 070 (32). Hence, the release of deluge shall satisfy a PFD 0.01. However, it is stressed from PSA that the SIL 2 demand is only a small part of the reliability documentation. The case study in this task has proved that the SIL 2 demand may be achievable provided a low failure rate due to blockage of nozzles. The analysis of the fire water system at Alfa shows that the estimated availability is 98.92 %. This implies that the calculated probability of failure on demand is PFD �0.0108. This is at the upper limit of the SIL 2 demand stated by OLF 070. However, it is assumed that the real PFD is slightly higher because blocking of nozzles is not considered in the quantitative analysis. Discussions with the operator have concluded that blockage of nozzles is a significant contributor to the system unavailability.
70
The OLF 070 assumptions and system boundaries for calculation of the SIL 2 demand should be questioned. It is assumed that opening of one deluge valve is sufficient for fire water coverage. In addition, nozzle blockage is assumed to be covered of extensive maintenance and hence omitted. However, this analysis has showed that this is a simplification that may provide too optimistic results. Nozzle blockage has, according to the operator, proved to be of great importance and is the most common failure for the deluge systems. Further, release of one deluge valve is a simplification since several platforms have fire areas that are covered by more than one deluge valve. In addition, PSA states that the fire water shall be delivered within 30 seconds and shall operate for up to 18 hours. However, OLF 070 does only assume that the pumps shall start on demand and that water shall flow through the nozzles. Hence, it may be questioned if the calculations provided by OLF 070 reflect the real situation. The challenge of developing proper documentation on the reliability of the deluge systems is the lack of high quality reliability data. This corresponds to both generic data sources and test data. The development of the data dossier for the Alfa platform showed that the generic data sources available is poorly adapted to fire water systems. Previously, there has been less demand for reliability data on fire water system components. However, as it now is allowed to take credit for deluge systems, it is assumed that analysts will request such data more frequently. There were several components that were difficult to model because of lack of data sources. These were deluge valves, hydraulic systems, logics and blockage of nozzles. The analysis of the fire water system at Alfa implied that deluge valves are of great importance for the system reliability. 95.5 % of the system unavailability is explained by the deluge valves. The only generic data source that was found for deluge valves origins from OLF 070 and is associated with great uncertainty according to SINTEF. The estimate from OLF 070 was higher than the failure rate obtained from the operator’s test data. However, also the estimate from the test data is assumed to be uncertain because of the test and registration routines. A request for better generic data sources of deluge valves is sent to OREDA and they will consider it by the next revision. It was also the intention to split the deluge valves into deluge valve and solenoid valves. This was not possible with the data material available. The analysis of Alfa has shown that hydraulic systems are complex to model. A hydraulic system is known to be reliable. However, the main generic data sources contain no reliability data regarding hydraulic components. Components that are assumed to be vital to a hydraulic system are for instance hydraulic pumps, hydraulic motors and hydraulic heat exchangers. For this analysis, assumptions were made that these components could be modeled as subcomponents of other systems. Evidently, these are assumptions with a high degree of uncertainty.
According to the operator, blockage of nozzles is one of the major problems with deluge systems. The guidelines in OLF 075 that were presented in 2002 improved the problems with marine fouling and corrosion. After 2002, there are discovered significant improvements according to corrosion problems. This relates to improved knowledge regarding material selections and better testing routines. On the other hand, marine fouling is still a problem and with blockage of nozzles as severe consequences. However, the problems vary between the different platforms according to system design, materials, water depth, climate, chemical injections and testing routines.
71
It was not possible to obtain failure rates for blocking of nozzles in the Alfa analysis. There are no generic data sources, as far as the research has shown, that provide this. It was possible to obtain test results for 13 tests performed the last 24 months for the Alfa platform. However, since no failures were found during these tests, no failure rate could be estimated. Even though the results of the analysis at Alfa are too optimistic since blockage of nozzles is omitted, these results improve the knowledge about the system performance. The system is highly dependent on the reliability of the deluge valves. Further, the sensitivity analysis implies that the system unavailability is halved if the fire areas are reduced to be covered by one deluge valve. The operator has informed that there have been several problems with the deluge solenoid valves. Hence, an improvement of the reliability of the solenoid valves by improved design, preventive maintenance or better testing routines may reduce the failure rate. It is evident that the test intervals are of great importance for reliability safety standby systems, as discussed in Section 3.5.1. It is described in the literature (17) how the test intervals can be used for optimization of the unavailability of the system. By reducing the test intervals, the PFD can be reduced according to PFD U OPQ - V/2 at component level with V as the test interval. For Alfa, it seems reasonable that the reliability may be improved by an increase of the test intervals for the deluge valves. However, design of test intervals shall take several factors into considerations. It is important that the tests do not provoke component fatigue. In addition, if the test intervals shall be reduced for deluge valves, it is important that the contribution of unavailability during the tests for the system unavailability is examined. The fire water system logic contributed most to the total unavailability excluding the deluge valve. However, the reliability modeling of the logic system is performed with the intention that it consists of a single energized safety system. As discussed in Section 5.3, it is assumed that the logic system to the deluge valves is de-energized to avoid spurious release. As in OLF 070, it is assumed that the coverage of eventual failures of the UPS is so high that it is reasonable to compare the reliability to an energized system. This simplification should be discussed in future analyses. In addition, it is not examined eventual redundancy in the logic system that may reduce the unavailability.
The analysis has also revealed that a detailed inspection of the system descriptions for a fire water system is required. In addition, an inspection of the procedures by start up of the pumps is necessary to perform. It is most important to identify eventual interfaces with the other system functions at the platform. NORSOK S-001 (2) states that the fire water system shall be independent of other platform functions. However, it is not obvious that this demand is fulfilled; hence an extensive analysis is necessary. Further, it is necessary to identify all the components that may cause a hazard to the system. This analysis did for example reveal that the air release valve and dump drain valve may cause insufficient fire water coverage if they fail to close after start of fire water pumps. This is, as far as the research has showed, not covered by other reliability analyses of deluge systems.
72
Discussions with operators have revealed that improvements of test routines may result in better reliability data. For example, it was mentioned that small failures or deviations may have been corrected immediately without registration in the maintenance software. However, from an analyst point of view, it is important that all deviations are registered to obtain a complete overview of the maintenance needs. This thesis has revealed several problem issues regarding the development of reliability analyses for deluge systems. However, it has not been possible to point out solutions for all the problem areas, and follow-up studies should be performed to increase the knowledge. The next subsection presents some possible topics of follow-up projects.
7.2 Future Work
An effort should be made to develop a general data dossier that covers various fire water system designs. As discussed above, several of the failure rates in the analysis of the deluge system at Alfa are assumptions associated with a high degree of uncertainty. According to the discussion above, some interesting problem issues are presented here. A general data dossier for fire water systems would be very useful as the request for generic data sources are expected to increase with the change in NORSOK S-001. OREDA and PDS do not provide data for some of the most critical fire water system components. The data dossier should be focused on the fact that there are no standard fire water pump packages. As discussed, the systems may vary between diesel-direct, diesel-electric and diesel-hydraulic. Today, it is not possible to separate between the different fire water pump systems in OREDA. To generate a data dossier that differentiate between different solutions and clarifies the system interfaces better is highly demanded by analysts. In addition, the focus should be on components unique for deluge systems such as deluge valves, deluge nozzles, booster pumps etc. According to the operator, the blocking of nozzles is a major problem for the deluge systems. However, neither generic data sources nor test data sources provide these data. An extensive analysis should be made to provide such data. This is necessary to achieve high credibility of reliability reports. It should be possible to obtain estimates for blockage of nozzles if test data for a long period of time is examined, for example from the regime shift in 2000 until 2009. However, it is important to differentiate between the different platforms as local conditions are of great importance for the occurrence of corrosion and marine fouling. The reliability analysis results for Alfa show that the deluge valves contribute most to the system unavailability. Section 5.8 states that two deluge valves may share one deluge solenoid, but this was not the case at Alfa. In addition, the operator has stated that most problems with the deluge valves are related to the solenoids. However, it was not possible to separate the deluge valves and the solenoids in this analysis due to the available data sources. A model that separates the deluge valves and the solenoids may provide useful information to the oil companies regarding the use of separate versus shared solenoids for the deluge valves.
73
The thesis revealed that reliability modeling of hydraulic systems is difficult due to lack of data sources. Such systems are known to be reliable, but it is desired to be able to quantify this better. A follow-up project may perform a research and try to obtain such generic data sources. Such generic data sources may be found from vendors or by estimating the parameters from test data sources. It was initially an intention to assign the various failure rates with distribution models. The background for this is that some failure rates are more uncertain than others. RiskSpectrum has the possibility to perform such analyses. The advantage by performing an uncertainty analysis is the possibility to quantify the uncertainty of the top event unavailability. However, it was assumed that this was too time consuming to include in the thesis because several of the data sources did not provide this. Inclusion of the uncertainty of reliability parameters will improve the interpretation of results. In addition, this will increase the credibility of the analysis results.
74
BIBLIOGRAPHY
1. Statistics Norway. Extraction of crude oil and natural gas. Statistics Norway. [Online] [Cited: May 14, 2009.] http://www.ssb.no/english/subjects/10/06/20/oljev_en/. 2. NORSOK. S-001 Technical safety. 2008. 3. Scandpower AS. Vannbaserte brannbekjempelsessystemer - retningslinjer for test, vedlikehold og design. s.l. : Scandpower Risk Management AS, 2001. 4. HSE. A Review of Degradation of Firewater Piping & Nozzle Performance due to Blockage. 2000. 5. Scandpower AS. Reliability Analysis of Firewater and Seawater Pumps on Visund. s.l. : Scandpower Risk Management AS, 2005. 6. Vinnem, Jan Erik. Offshore Risk Assessment. 2nd Edition. s.l. : Stringer, 2007. 7. NORSOK. Z-013: Risk and emergency preparedness analysis. 2001. 8. HSE. Active / passive fire protection. Health and Safety Executive. [Online] [Cited: February 16, 2009.] http://www.hse.gov.uk/comah/sragtech/techmeasfire.htm. 9. Wighus, Ragnar. Brannlaster, store branner, virkning av brannbekjempelse. Presentation at PTIL Conference in Stavanger April 2009. s.l. : SINTEF NBL, 2009. 10. van Wingerden, Kees. Mitigation of Gas Explosions Using Water Deluge. 2000. 11. Foster, K J and Andrews, J D. Techniques for modelling the frequency of explosions on offshore platforms. s.l. : IMechE, 1999. 12. OLF. Report from OLF's Gas Leak Reduction Project. s.l. : OLF, 2004. 13. Rausand, Marvin and Arnljot, Høyland. System Reliability Theory; Models, Statistical Methods and Applications. s.l. : John Wiley & Sons Inc, 2004. ISBN 047147133X. 14. Hauge, Stein, Langseth, Helge and Onshus, Tor. Reliability Data for Safety Instrumented Systems PDS Data Handbook, 2006 Edition. s.l. : SINTEF, 2006. ISBN 82-14-03898-7. 15. Hauge, Stein, et al. Reliability Prediction Method for Safety Instrumented Systems PDS Method Handbook. s.l. : SINTEF, 2006. ISBN 82-14-03899-5. 16. Stamatelatos, Michael and Vesely, William. Fault Tree Handbook with Aerospace Applications. Washington DC : NASA Office of Safety and Mission Assurance, 2002. 17. Karimi, R., et al. Optimization of Test Intervals for Standby Systems in Nuclear Power Plants. 1978. Energy Laboratory Report No. MIT-EL 78-027. 18. Relcon Scandpower AB. RiskSpectrum PSA. 2007. 19. —. RiskSpectrum Analysis Tools: Teory Manual. 2008. 20. Deshpande, Jayant V. and Purohit, Sudha G. Lifte Time Data: Statistical Models and Methods. s.l. : World Scientific Publishing Co. Pte. Ltd, 2005. ISBN 981-256-607-4. 21. APi Group Inc. Deluge Fire Sprinkler System. Fire Protection Group. [Online] [Cited: May 19, 2009.] http://www.apifiregroup.com/firesprinkler/deluge.html. 22. Natvig, Bernt. Probabilistic Risk Assessment with Water Mitigation. Scandpower Risk Management. 2005. 23. PSA. Regulations relating to material and information in the petroleum activities (The information duty regulations). s.l. : Norwegian Petroleum Directorate, 2007. 24. ISO 13702. Petroleum and natural gas industries - Control and mitigation of fires and explosions on offshore production installations - Requirements and guidelines. s.l. : International Organization for Standardization, 1999. ISO 13702. 25. OLF. Anbefalte retningslinjer for vannbaserte brannbekjempelsessystemer. 2002. 26. National Fire Protection Association. NFPA 20: Standard for Installation of Stationary Pumps for Fire Protection. 1999. 27. —. NFPA 13: Standard for the Installation of Sprinkler Systems. 1999. 28. —. NFPA 15: Standard for Water Spray Fixed Systems for Fire Protection. 1996.
75
29. —. NFPA 16: Standard for the Installation of Deluge Foam-Water Sprinkler Systems. 1999. 30. Alfa Operator. Governing Document for Active Fire Fighting. 1 2004. 31. PSA. Guidelines to regulations relating to management in the petroleum activities. Petroleum Safety Authority Norway. [Online] [Cited: May 19, 2009.] http://www.ptil.no/management/category406.html. 32. OLF. Application of IEC 61508 and IEC 61511 in the Norwegian Petroleum Industry. 2004. OLF-070. 33. ISO 8044. Corrosion of metals and alloys - Terms and definitions. s.l. : International Organization for Standardization, 1989. ISO 8044. 34. U.S Naval Institute. Marine Fouling and Its Prevention. s.l. : George Banta Publishing Co. 35. FPE.no. Deluge Systems. Fire Protection and Engineering AS. [Online] [Cited: May 4, 2009.] http://www.fpe.no/fpe/public/openIndex/view/list_.html?ARTICLE_ID=1153222827041. 36. Alfa Operator. Start brannvannspumpe. 37. —. Kapasitetstest brannvannspumpe. 38. —. Test av startsekvens for brannpumper. 39. —. Standardrutine Deluge Ventil. 40. —. Standardrutine Dyser, Deluge (Overrislingsdyser). 41. —. Engineering Manual System: Firewater & AFFF System. 1993. 42. Vesely, W.E, et al. Measures of Risk Importance And Their Applications. s.l. : U.S Nuclear Regulatory Research, 1983. NUREG/CR-3385. 43. OREDA-02. Offshore Reliability Data. s.l. : Prepared by Sintef and distributed by DNV, 2002.

76
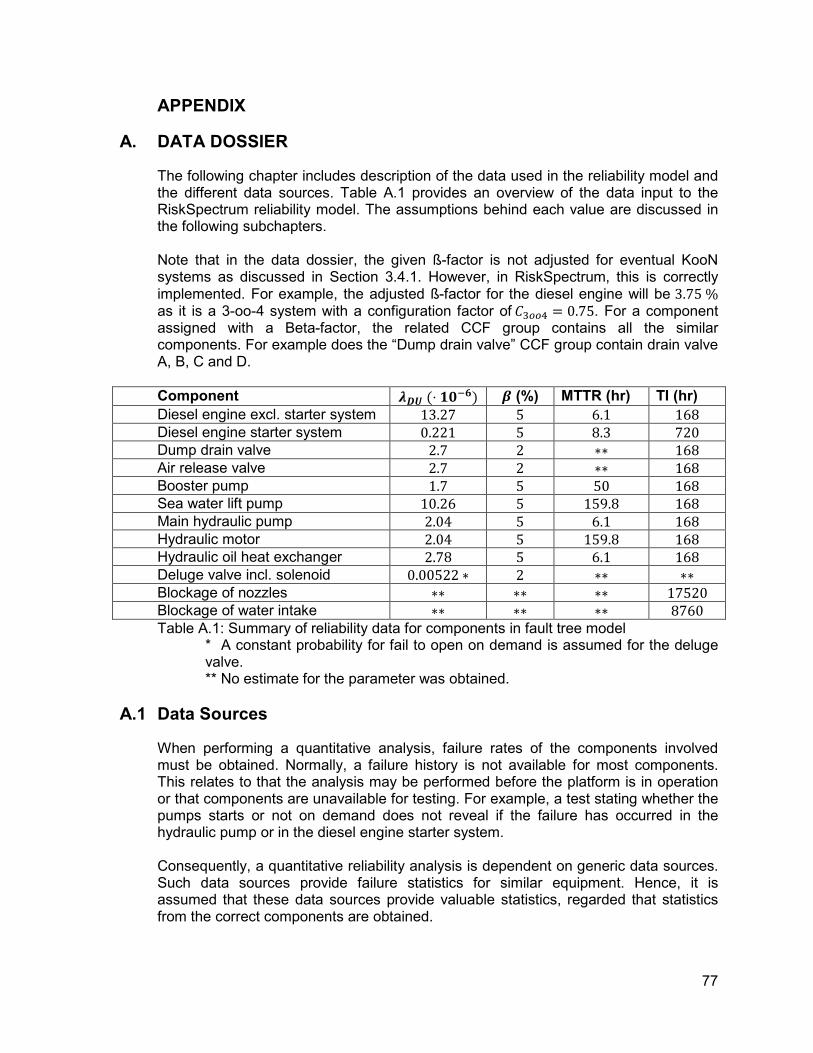
77
APPENDIX
A. DATA DOSSIER
The following chapter includes description of the data used in the reliability model and the different data sources. Table A.1 provides an overview of the data input to the RiskSpectrum reliability model. The assumptions behind each value are discussed in the following subchapters. Note that in the data dossier, the given ß-factor is not adjusted for eventual KooN systems as discussed in Section 3.4.1. However, in RiskSpectrum, this is correctly implemented. For example, the adjusted ß-factor for the diesel engine will be 3.75 % as it is a 3-oo-4 system with a configuration factor of G6HH� � 0.75. For a component assigned with a Beta-factor, the related CCF group contains all the similar components. For example does the “Dump drain valve” CCF group contain drain valve A, B, C and D.
Component ��� �- ����( � (%) MTTR (hr) TI (hr)
Diesel engine excl. starter system 13.27 5 6.1 168
Diesel engine starter system 0.221 5 8.3 720 Dump drain valve 2.7 2 �� 168
Air release valve 2.7 2 �� 168
Booster pump 1.7 5 50 168 Sea water lift pump 10.26 5 159.8 168
Main hydraulic pump 2.04 5 6.1 168
Hydraulic motor 2.04 5 159.8 168 Hydraulic oil heat exchanger 2.78 5 6.1 168
Deluge valve incl. solenoid 0.00522 � 2 �� ��
Blockage of nozzles �� �� �� 17520 Blockage of water intake �� �� �� 8760
Table A.1: Summary of reliability data for components in fault tree model * A constant probability for fail to open on demand is assumed for the deluge valve. ** No estimate for the parameter was obtained.
A.1 Data Sources
When performing a quantitative analysis, failure rates of the components involved must be obtained. Normally, a failure history is not available for most components. This relates to that the analysis may be performed before the platform is in operation or that components are unavailable for testing. For example, a test stating whether the pumps starts or not on demand does not reveal if the failure has occurred in the hydraulic pump or in the diesel engine starter system. Consequently, a quantitative reliability analysis is dependent on generic data sources. Such data sources provide failure statistics for similar equipment. Hence, it is assumed that these data sources provide valuable statistics, regarded that statistics from the correct components are obtained.
78
Efforts have been made in this analysis to include several data sources. Hence, it has been important to gather information about the similarity and the differences for the data sources. The failure rates that are to be used in the analysis are of type OPQ. According to Section 3.5, this includes dangerous undetected failures, i.e. failures that may only be discovered during tests. Different data sources may have different types of failure rate and failure modes, so it is important to examine the properties to make the data input consistent. The following subsections will describe the different data sources used in this analysis.
A.1.1 OREDA
The Offshore Reliability Data project, OREDA, initiated in 1981 as an initiative from SINTEF and the Norwegian Petroleum Directorate. The objective was to collect reliability data for offshore safety equipment. Later, the scope was extended and OREDA does now cover reliability data for a wide range of components for topside and subsea equipment in addition to some onshore petroleum processing equipment. The edition used in this analysis was prepared in 2002 and the data is collected from eight petroleum companies from six countries. These are BP, ENI, ExxonMobil, ConocoPhillips, Shell, StatoilHydro, TOTAL and Gassco (43). OREDA is a complex data source with several statistics for each component. Before it is possible to use results from OREDA, it is necessary to do the following analysis:
• Inspect the system boundaries for the component in OREDA. The failure intensity may include or exclude some subsystems of the component.
• Choose the correct failure modes
• Inspect the systems and identify eventual common cause failure components.
A.1.1.1 Reliability Parameters
OREDA separates the failure types between critical, degraded, incipient and unknown. Further, it separates failure into failure modes. Hence, it is possible to obtain the failure rate for breakdown, fail to start on demand, etc. Thus, OP may be obtained as the critical failures for the actual failure mode. However, OREDA does not separate between detected and undetected failures. In reality, it is always a fractional coverage for which failures that are detected immediately by monitoring and those failures that are not found until function testing. In this analysis, it is assumed that the coverage is 0 % for OREDA data. Hence, all critical failures are assumed to be OPQ. OREDA does also provide MTTR in hours. Remark that this time does only include the active repair time. Hence, waiting time for technical staff, spare parts, etc is excluded in the estimate. Thus, the down time will be less than the actual estimate with OREDA data. But repair of fire fighting systems are always prioritized because standby safety systems shall have high availability.
79
A.1.2 PDS Data Handbook
The PDS Data Handbook is developed by SINTEF and contains reliability data for Safety Instrumented Systems (SIS) (PDS is an acronym in Norwegian for: “Pålitelighet av datamaskinbaserte sikkerhetssystemer”) (14). SIS includes sensors, valves, electronics and subsea equipment. It is developed in cooperation with the largest oil companies, in addition to vendors of different control and safety systems and engineering consult companies, 25 firms in total. The latest edition is prepared in 2006 and is an update of the edition from 2004. The reliability parameters in the PDS Data Handbook are calculated from the PDS Forum members’ failure statistics.
A.1.2.1 Reliability Parameters
The PDS handbook provides reliability data input for different types of failures. As described in Section A.1, this analysis seeks the failure rates OPQ. This is possible to obtain directly from PDS. PDS define the critical failure rate as O@>050�;< � OP R O�` where D is dangerous failures and ST is spurious trips. To make it possible to obtain the OPQ , PDS provides a coverage factor GP . This defines the fraction of the dangerous failures that are detected by monitoring. In addition, it is possible to differentiate the failure rate into different failure modes. These are the same failure modes as provided by OREDA. The PDS handbook does also provide Beta-factors and presents the PDS Beta-factor model used in this analysis. This is )�lKKL( � ) - G�HHN and is discussed in more detail in Section 3.4.
A.1.3 OLF 070
OLF 070 (32) is a document provided by the Norwegian Oil Industry Association (OLF) with the purpose of adapting the applications of the IEC 61508 and IEC 61511 for use in the Norwegian petroleum industry. IEC 61508 is a document regarding design and operation of instrumented safety systems, while IEC 61511 performs a risk based approach to SIL calculations for instrumented safety systems. OLF 070 covers several instrumented safety systems. Examples of such systems covered are detection systems, ignition sources control, start and stop of fire pumps, emergency power, active fire fighting etc.
A.1.3.1 Reliability Parameters
The reliability data in OLF 070 is in general collected from OREDA and PDS. Hence, it is considered to be more accurate to gather the failure data from the first hand sources, i.e. OREDA or PDS. In addition, OLF 070 makes several assumptions that shall be discussed before collecting data from OLF 070.
80
A.1.4 Test Data for the Alfa Platform
The intention of this project was to include test data from the operator in the calculations. However, as explained in Section 5.11, the test data is sparse related to most components. However, the operator has provided test data for several platforms with respect to start of fire water pumps and test of deluge valves. The data is collected from the maintenance database software and includes test data from 2007 and 2008. However, the data from the first half of 2007 includes fewer platforms than the rest of the data. Hence, only data from the second half of 2007 in addition to 2008 is included in the analysis. Since “start of fire water pumps” tests do not cover breakdown or low output of the pumps, according to the fault tree case explained in Section 6.4.1, only the test data from “deluge valve” tests are used. The test data includes deluge valve tests from the platforms during the second half of 2007 and the entire 2008. In total, 1723 tests were performed (Opening of deluge valves). 9 failures of opening the deluge valves were found. According to the operator, both these values may be lower than the actual value. Not all tests performed or failures found may have been registered in the maintenance software. In addition, it is uncertain whether the failure data covers one or two deluge valves. Some fire areas are covered by two deluge valves, and it is unclear how failure of such deluge valve skids are registered in the database. However, it is assumed that the obtained probability covers one deluge valve. Hence, the calculated probability that the deluge valve does not open on demand, PFD � ?
n�B6 � 0.00522 are associated with uncertainties. However, it is assumed that
this is a better estimate than failure rates obtained from generic resources
A.2 Obtained Reliability Data Input for Quantitative Analysis
The following subsections describes and presents the data input used in the quantitative analysis along with a description of both the data source and the component.
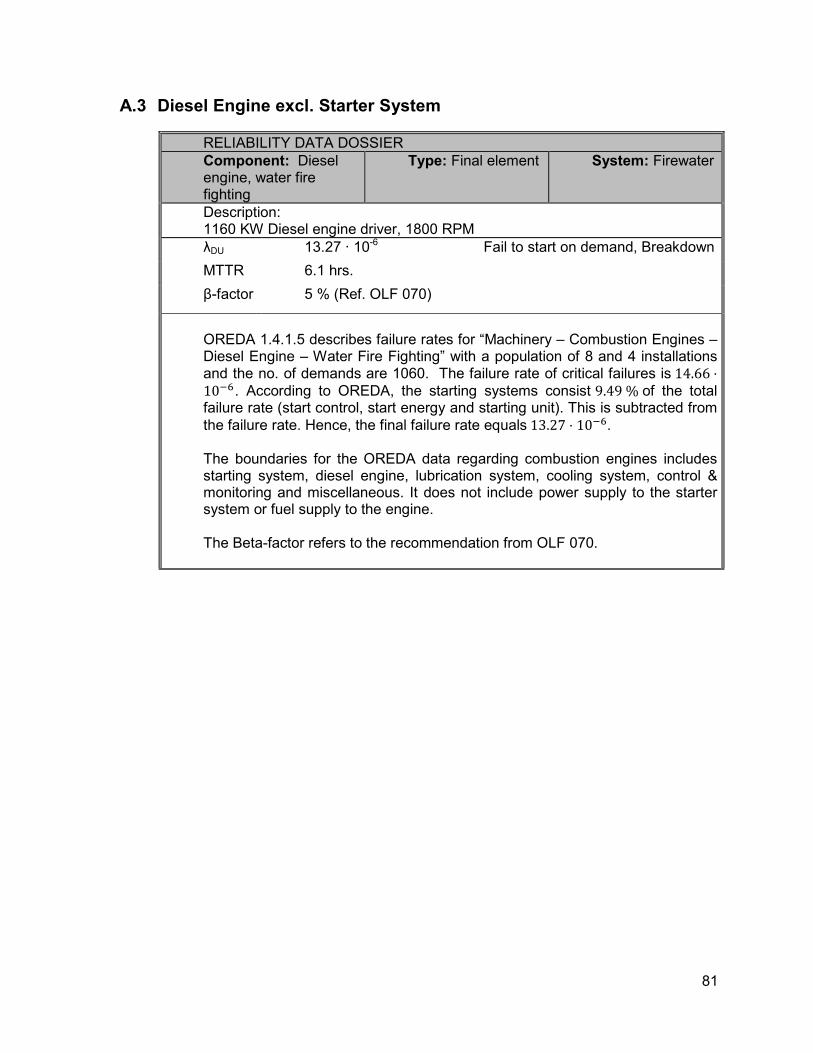
81
A.3 Diesel Engine excl. Starter System
RELIABILITY DATA DOSSIER
Component: Diesel engine, water fire fighting
Type: Final element System: Firewater
Description: 1160 KW Diesel engine driver, 1800 RPM
λDU 13.27 · 10-6 Fail to start on demand, Breakdown
MTTR 6.1 hrs.
β-factor 5 % (Ref. OLF 070)
OREDA 1.4.1.5 describes failure rates for “Machinery – Combustion Engines – Diesel Engine – Water Fire Fighting” with a population of 8 and 4 installations and the no. of demands are 1060. The failure rate of critical failures is 14.66 -10��. According to OREDA, the starting systems consist 9.49 % of the total failure rate (start control, start energy and starting unit). This is subtracted from the failure rate. Hence, the final failure rate equals 13.27 - 10��. The boundaries for the OREDA data regarding combustion engines includes starting system, diesel engine, lubrication system, cooling system, control & monitoring and miscellaneous. It does not include power supply to the starter system or fuel supply to the engine. The Beta-factor refers to the recommendation from OLF 070.
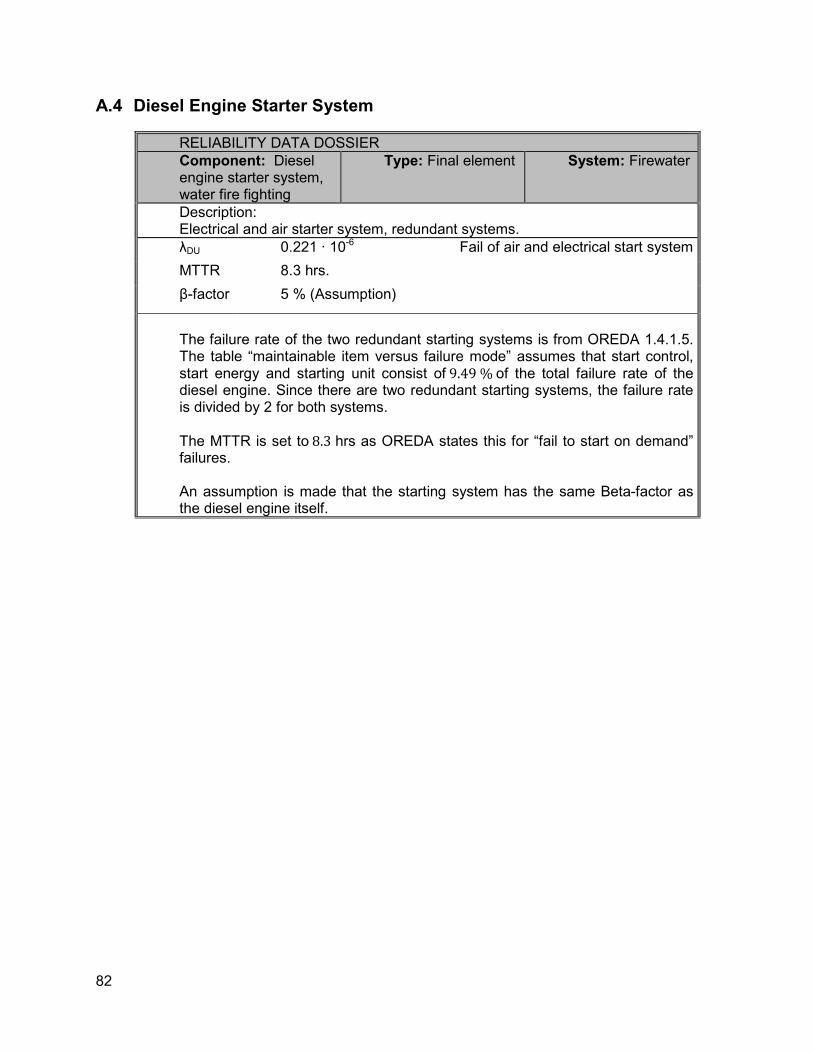
82
A.4 Diesel Engine Starter System
RELIABILITY DATA DOSSIER
Component: Diesel engine starter system, water fire fighting
Type: Final element System: Firewater
Description: Electrical and air starter system, redundant systems.
λDU 0.221 · 10-6 Fail of air and electrical start system
MTTR 8.3 hrs.
β-factor 5 % (Assumption)
The failure rate of the two redundant starting systems is from OREDA 1.4.1.5. The table “maintainable item versus failure mode” assumes that start control, start energy and starting unit consist of 9.49 % of the total failure rate of the diesel engine. Since there are two redundant starting systems, the failure rate is divided by 2 for both systems. The MTTR is set to 8.3 hrs as OREDA states this for “fail to start on demand” failures. An assumption is made that the starting system has the same Beta-factor as the diesel engine itself.
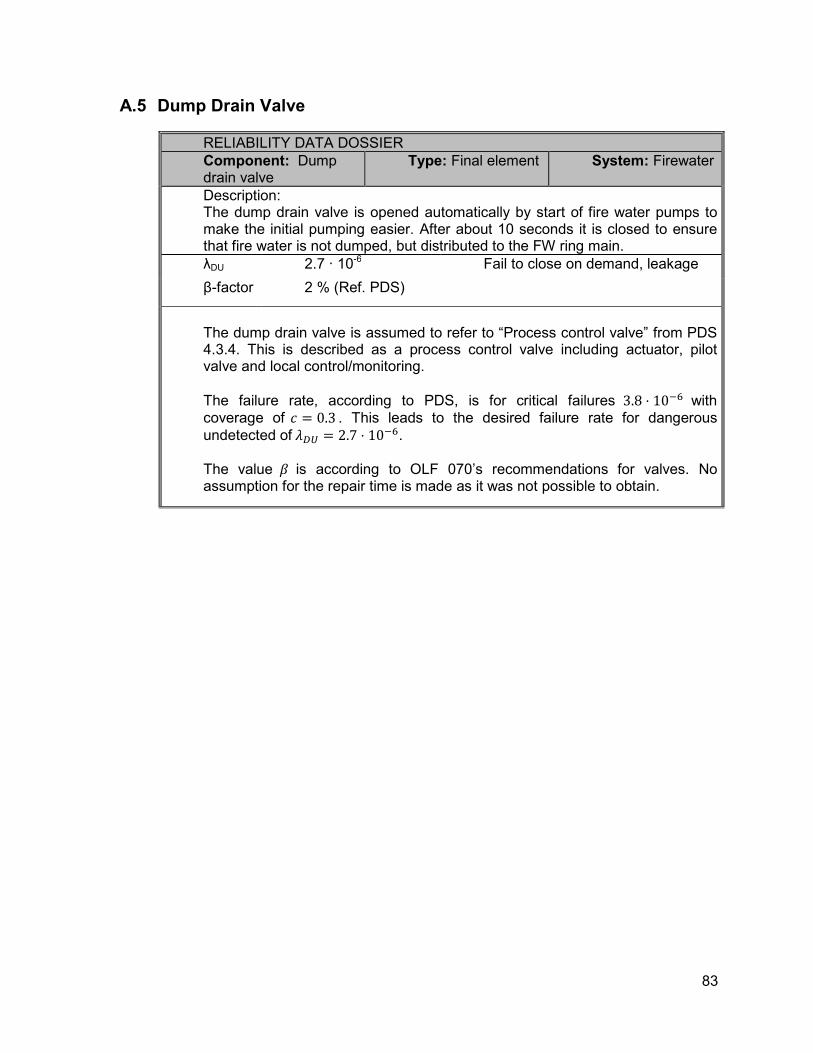
83
A.5 Dump Drain Valve
RELIABILITY DATA DOSSIER
Component: Dump drain valve
Type: Final element System: Firewater
Description: The dump drain valve is opened automatically by start of fire water pumps to make the initial pumping easier. After about 10 seconds it is closed to ensure that fire water is not dumped, but distributed to the FW ring main.
λDU 2.7 · 10-6 Fail to close on demand, leakage
β-factor 2 % (Ref. PDS)
The dump drain valve is assumed to refer to “Process control valve” from PDS 4.3.4. This is described as a process control valve including actuator, pilot valve and local control/monitoring. The failure rate, according to PDS, is for critical failures 3.8 - 10�� with coverage of � � 0.3 . This leads to the desired failure rate for dangerous undetected of OPQ � 2.7 - 10��. The value ) is according to OLF 070’s recommendations for valves. No assumption for the repair time is made as it was not possible to obtain.
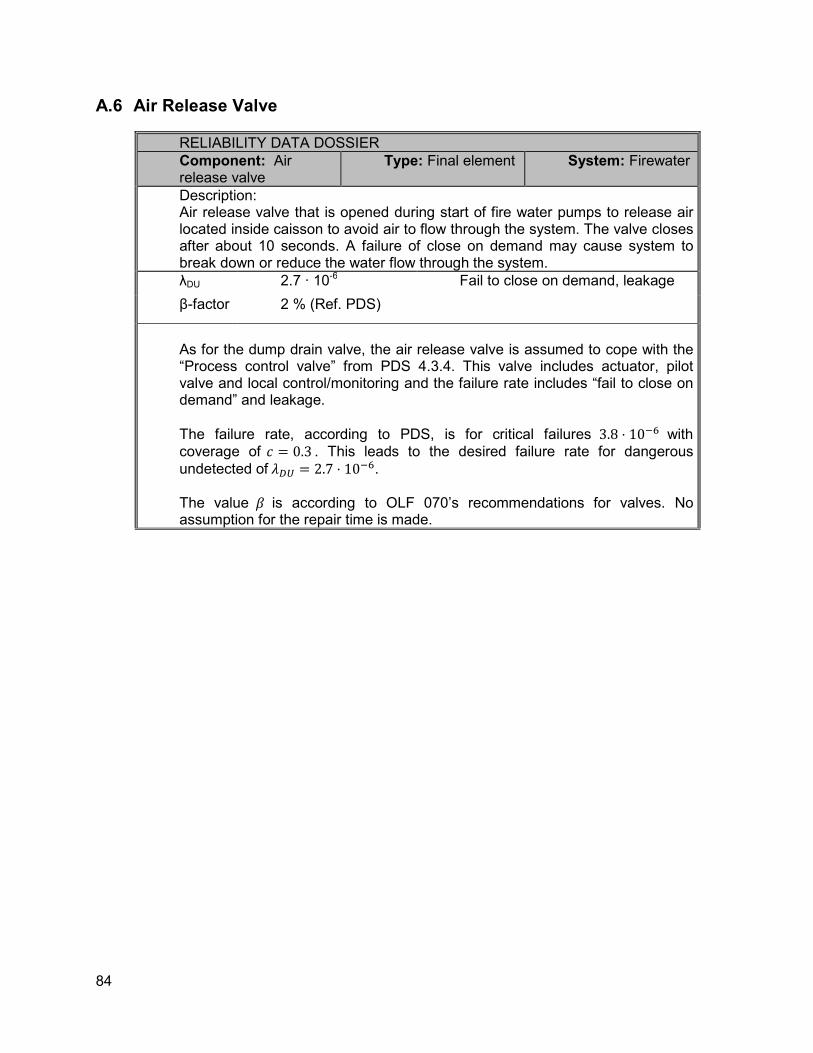
84
A.6 Air Release Valve
RELIABILITY DATA DOSSIER
Component: Air release valve
Type: Final element System: Firewater
Description: Air release valve that is opened during start of fire water pumps to release air located inside caisson to avoid air to flow through the system. The valve closes after about 10 seconds. A failure of close on demand may cause system to break down or reduce the water flow through the system.
λDU 2.7 · 10-6 Fail to close on demand, leakage
β-factor 2 % (Ref. PDS)
As for the dump drain valve, the air release valve is assumed to cope with the “Process control valve” from PDS 4.3.4. This valve includes actuator, pilot valve and local control/monitoring and the failure rate includes “fail to close on demand” and leakage.
The failure rate, according to PDS, is for critical failures 3.8 - 10�� with coverage of � � 0.3 . This leads to the desired failure rate for dangerous undetected of OPQ � 2.7 - 10��. The value ) is according to OLF 070’s recommendations for valves. No assumption for the repair time is made.
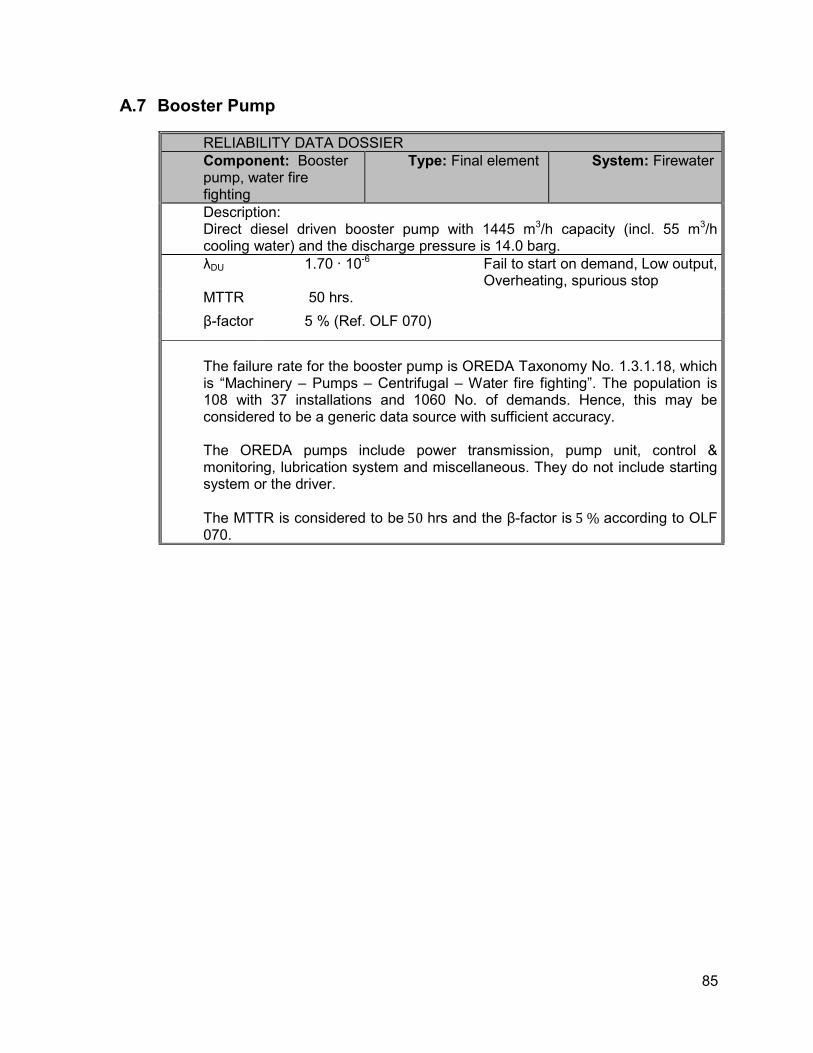
85
A.7 Booster Pump
RELIABILITY DATA DOSSIER
Component: Booster pump, water fire fighting
Type: Final element System: Firewater
Description: Direct diesel driven booster pump with 1445 m3/h capacity (incl. 55 m3/h cooling water) and the discharge pressure is 14.0 barg.
λDU 1.70 · 10-6 Fail to start on demand, Low output, Overheating, spurious stop
MTTR 50 hrs.
β-factor 5 % (Ref. OLF 070)
The failure rate for the booster pump is OREDA Taxonomy No. 1.3.1.18, which is “Machinery – Pumps – Centrifugal – Water fire fighting”. The population is 108 with 37 installations and 1060 No. of demands. Hence, this may be considered to be a generic data source with sufficient accuracy. The OREDA pumps include power transmission, pump unit, control & monitoring, lubrication system and miscellaneous. They do not include starting system or the driver. The MTTR is considered to be 50 hrs and the β-factor is 5 % according to OLF 070.
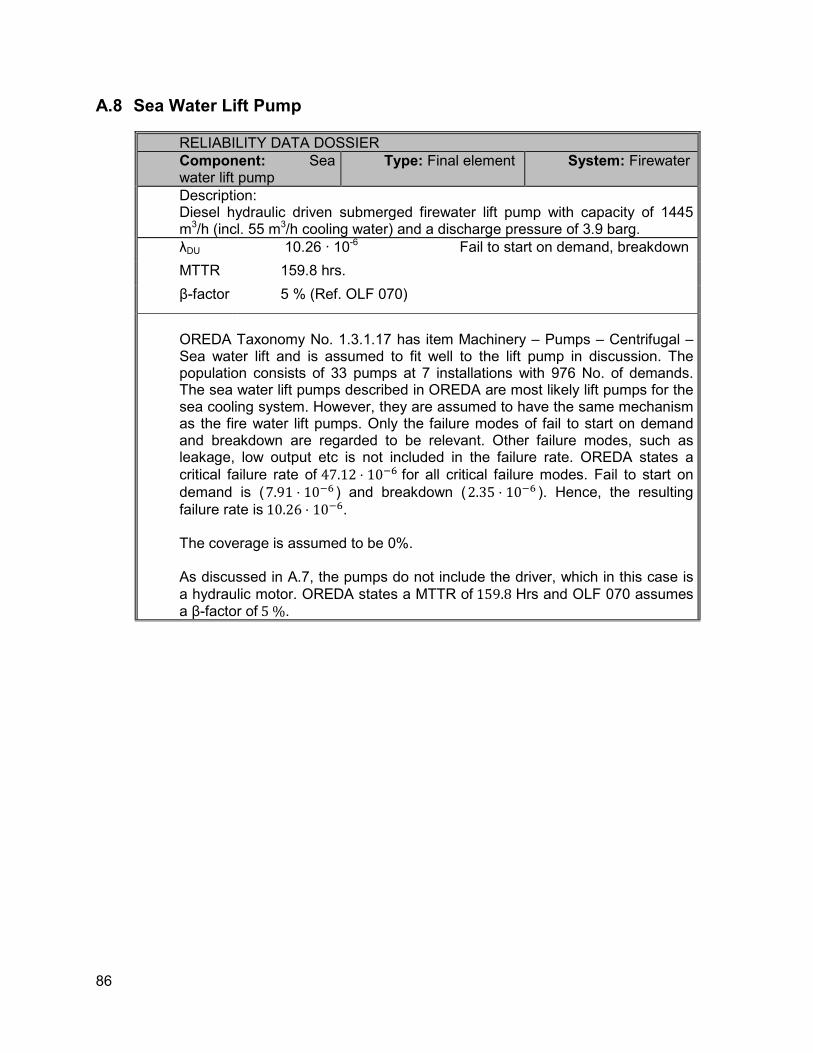
86
A.8 Sea Water Lift Pump
RELIABILITY DATA DOSSIER
Component: Sea water lift pump
Type: Final element System: Firewater
Description: Diesel hydraulic driven submerged firewater lift pump with capacity of 1445 m3/h (incl. 55 m3/h cooling water) and a discharge pressure of 3.9 barg.
λDU 10.26 · 10-6 Fail to start on demand, breakdown
MTTR 159.8 hrs.
β-factor 5 % (Ref. OLF 070)
OREDA Taxonomy No. 1.3.1.17 has item Machinery – Pumps – Centrifugal – Sea water lift and is assumed to fit well to the lift pump in discussion. The population consists of 33 pumps at 7 installations with 976 No. of demands. The sea water lift pumps described in OREDA are most likely lift pumps for the sea cooling system. However, they are assumed to have the same mechanism as the fire water lift pumps. Only the failure modes of fail to start on demand and breakdown are regarded to be relevant. Other failure modes, such as leakage, low output etc is not included in the failure rate. OREDA states a critical failure rate of 47.12 - 10�� for all critical failure modes. Fail to start on
demand is (7.91 - 10�� ) and breakdown (2.35 - 10�� ). Hence, the resulting failure rate is 10.26 - 10��.
The coverage is assumed to be 0%. As discussed in A.7, the pumps do not include the driver, which in this case is a hydraulic motor. OREDA states a MTTR of 159.8 Hrs and OLF 070 assumes a β-factor of 5 %.
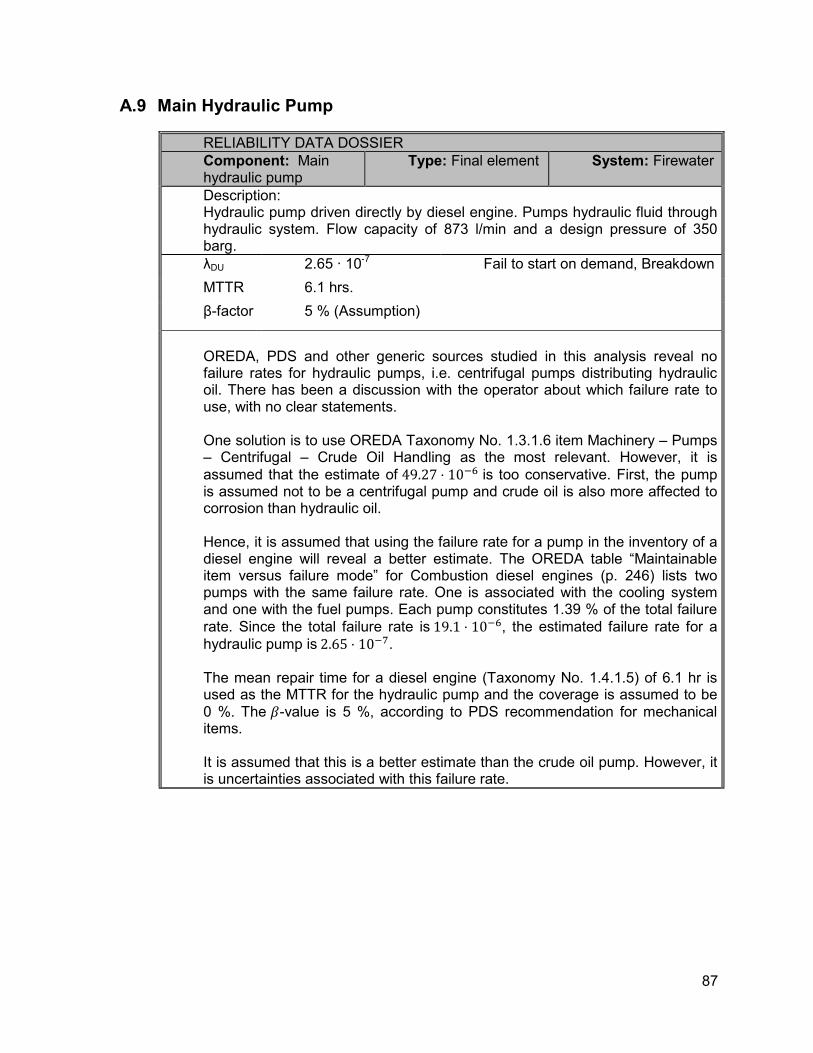
87
A.9 Main Hydraulic Pump
RELIABILITY DATA DOSSIER
Component: Main hydraulic pump
Type: Final element System: Firewater
Description: Hydraulic pump driven directly by diesel engine. Pumps hydraulic fluid through hydraulic system. Flow capacity of 873 l/min and a design pressure of 350 barg.
λDU 2.65 · 10-7 Fail to start on demand, Breakdown
MTTR 6.1 hrs.
β-factor 5 % (Assumption)
OREDA, PDS and other generic sources studied in this analysis reveal no failure rates for hydraulic pumps, i.e. centrifugal pumps distributing hydraulic oil. There has been a discussion with the operator about which failure rate to use, with no clear statements. One solution is to use OREDA Taxonomy No. 1.3.1.6 item Machinery – Pumps – Centrifugal – Crude Oil Handling as the most relevant. However, it is assumed that the estimate of 49.27 - 10�� is too conservative. First, the pump is assumed not to be a centrifugal pump and crude oil is also more affected to corrosion than hydraulic oil. Hence, it is assumed that using the failure rate for a pump in the inventory of a diesel engine will reveal a better estimate. The OREDA table “Maintainable item versus failure mode” for Combustion diesel engines (p. 246) lists two pumps with the same failure rate. One is associated with the cooling system and one with the fuel pumps. Each pump constitutes 1.39 % of the total failure rate. Since the total failure rate is 19.1 - 10��, the estimated failure rate for a hydraulic pump is 2.65 - 10��. The mean repair time for a diesel engine (Taxonomy No. 1.4.1.5) of 6.1 hr is used as the MTTR for the hydraulic pump and the coverage is assumed to be 0 %. The )-value is 5 %, according to PDS recommendation for mechanical items.
It is assumed that this is a better estimate than the crude oil pump. However, it is uncertainties associated with this failure rate.
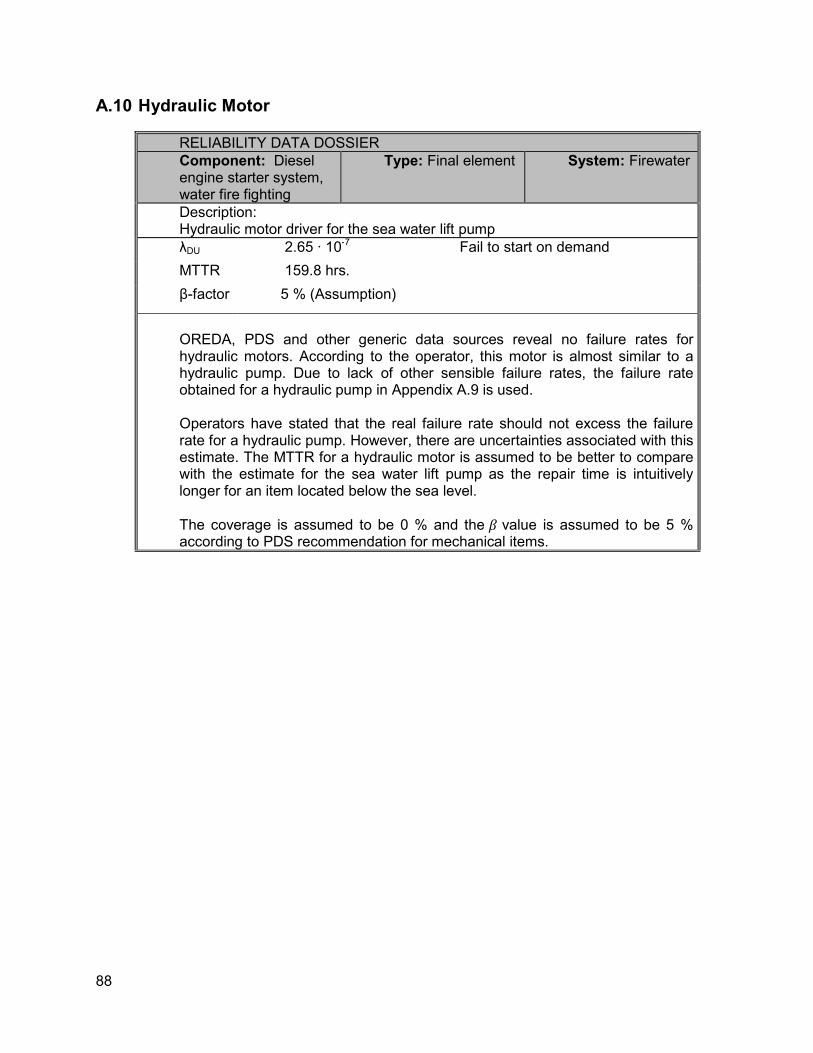
88
A.10 Hydraulic Motor
RELIABILITY DATA DOSSIER
Component: Diesel engine starter system, water fire fighting
Type: Final element System: Firewater
Description: Hydraulic motor driver for the sea water lift pump
λDU 2.65 · 10-7 Fail to start on demand
MTTR 159.8 hrs.
β-factor 5 % (Assumption)
OREDA, PDS and other generic data sources reveal no failure rates for hydraulic motors. According to the operator, this motor is almost similar to a hydraulic pump. Due to lack of other sensible failure rates, the failure rate obtained for a hydraulic pump in Appendix A.9 is used. Operators have stated that the real failure rate should not excess the failure rate for a hydraulic pump. However, there are uncertainties associated with this estimate. The MTTR for a hydraulic motor is assumed to be better to compare with the estimate for the sea water lift pump as the repair time is intuitively longer for an item located below the sea level. The coverage is assumed to be 0 % and the ) value is assumed to be 5 % according to PDS recommendation for mechanical items.
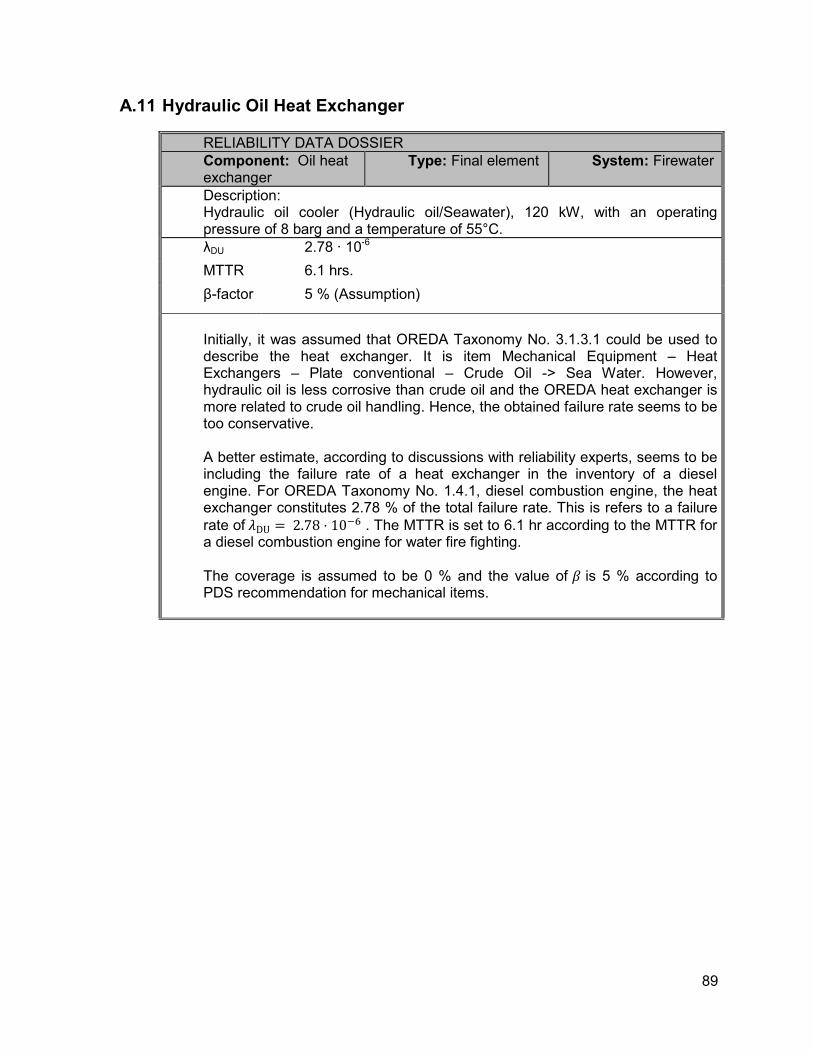
89
A.11 Hydraulic Oil Heat Exchanger
RELIABILITY DATA DOSSIER
Component: Oil heat exchanger
Type: Final element System: Firewater
Description: Hydraulic oil cooler (Hydraulic oil/Seawater), 120 kW, with an operating pressure of 8 barg and a temperature of 55°C.
λDU 2.78 · 10-6
MTTR 6.1 hrs.
β-factor 5 % (Assumption)
Initially, it was assumed that OREDA Taxonomy No. 3.1.3.1 could be used to describe the heat exchanger. It is item Mechanical Equipment – Heat Exchangers – Plate conventional – Crude Oil -> Sea Water. However, hydraulic oil is less corrosive than crude oil and the OREDA heat exchanger is more related to crude oil handling. Hence, the obtained failure rate seems to be too conservative. A better estimate, according to discussions with reliability experts, seems to be including the failure rate of a heat exchanger in the inventory of a diesel engine. For OREDA Taxonomy No. 1.4.1, diesel combustion engine, the heat exchanger constitutes 2.78 % of the total failure rate. This is refers to a failure
rate of ODU � 2.78 - 10�� . The MTTR is set to 6.1 hr according to the MTTR for a diesel combustion engine for water fire fighting. The coverage is assumed to be 0 % and the value of ) is 5 % according to PDS recommendation for mechanical items.
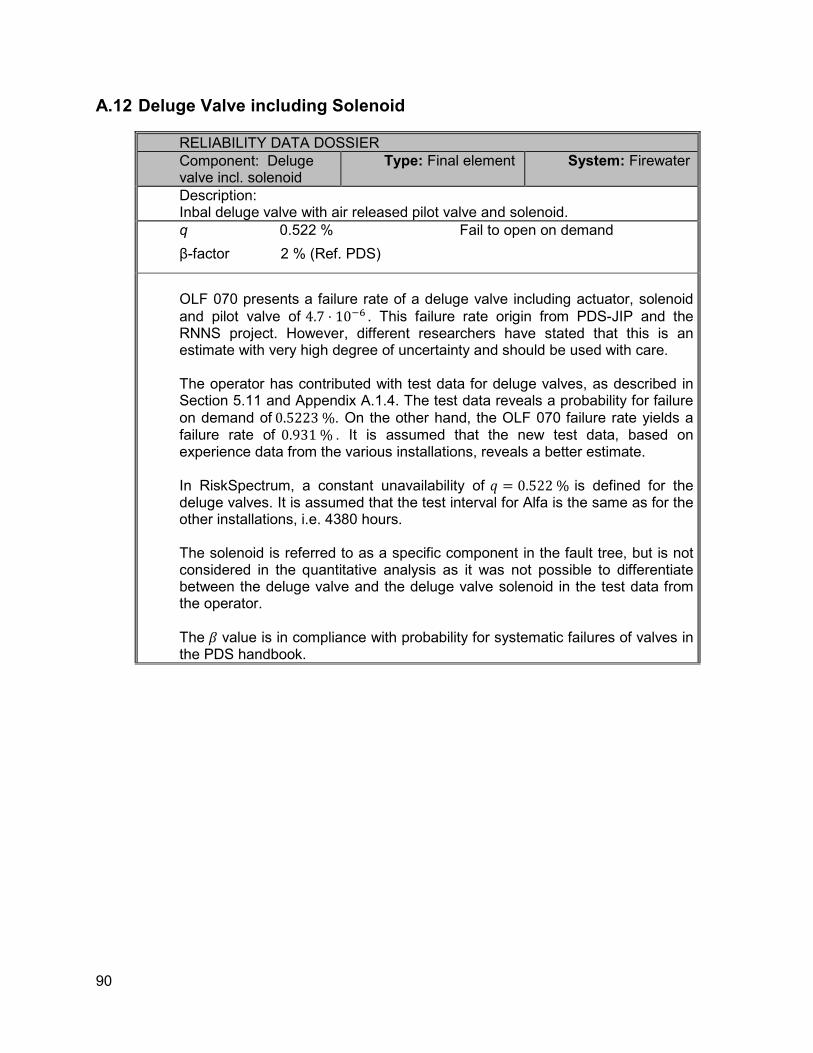
90
A.12 Deluge Valve including Solenoid
RELIABILITY DATA DOSSIER
Component: Deluge valve incl. solenoid
Type: Final element System: Firewater
Description: Inbal deluge valve with air released pilot valve and solenoid.
q 0.522 % Fail to open on demand
β-factor 2 % (Ref. PDS)
OLF 070 presents a failure rate of a deluge valve including actuator, solenoid and pilot valve of 4.7 - 10�� . This failure rate origin from PDS-JIP and the RNNS project. However, different researchers have stated that this is an estimate with very high degree of uncertainty and should be used with care. The operator has contributed with test data for deluge valves, as described in Section 5.11 and Appendix A.1.4. The test data reveals a probability for failure on demand of 0.5223 %. On the other hand, the OLF 070 failure rate yields a failure rate of 0.931 % . It is assumed that the new test data, based on experience data from the various installations, reveals a better estimate. In RiskSpectrum, a constant unavailability of � � 0.522 % is defined for the deluge valves. It is assumed that the test interval for Alfa is the same as for the other installations, i.e. 4380 hours. The solenoid is referred to as a specific component in the fault tree, but is not considered in the quantitative analysis as it was not possible to differentiate between the deluge valve and the deluge valve solenoid in the test data from the operator.
The ) value is in compliance with probability for systematic failures of valves in the PDS handbook.
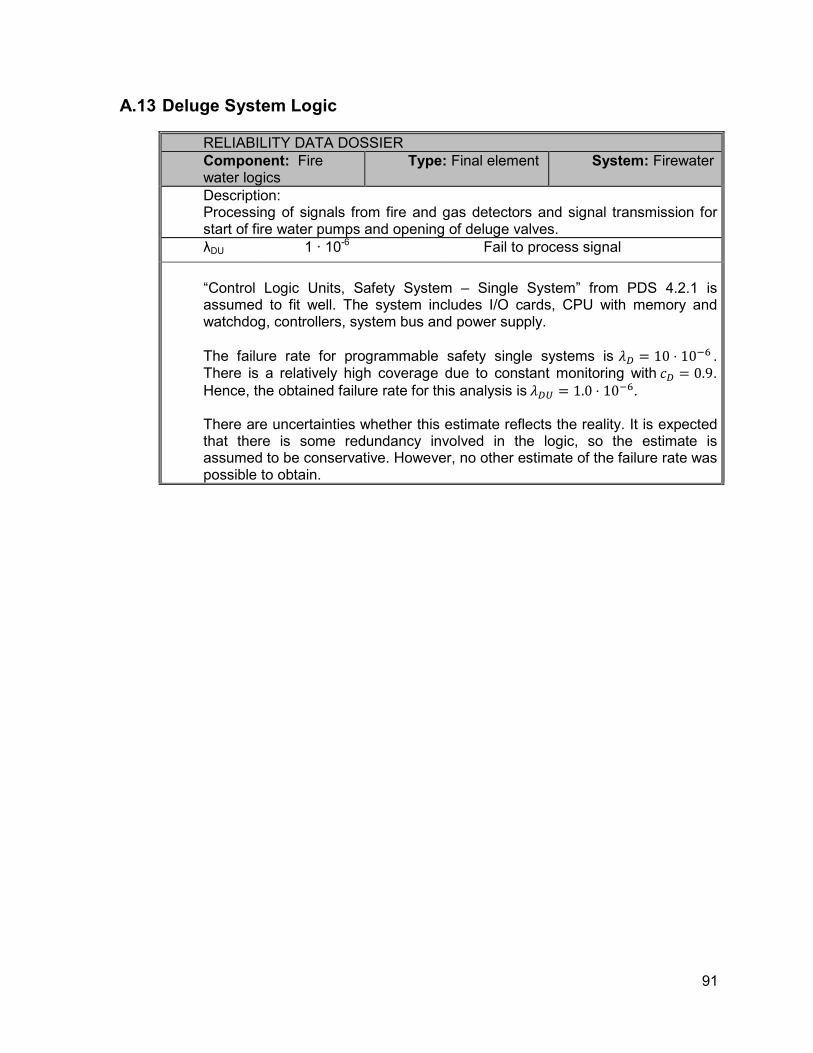
91
A.13 Deluge System Logic
RELIABILITY DATA DOSSIER
Component: Fire water logics
Type: Final element System: Firewater
Description: Processing of signals from fire and gas detectors and signal transmission for start of fire water pumps and opening of deluge valves.
λDU 1 · 10-6 Fail to process signal
“Control Logic Units, Safety System – Single System” from PDS 4.2.1 is assumed to fit well. The system includes I/O cards, CPU with memory and watchdog, controllers, system bus and power supply.
The failure rate for programmable safety single systems is OP � 10 - 10�� . There is a relatively high coverage due to constant monitoring with �P � 0.9.
Hence, the obtained failure rate for this analysis is OPQ � 1.0 - 10��. There are uncertainties whether this estimate reflects the reality. It is expected that there is some redundancy involved in the logic, so the estimate is assumed to be conservative. However, no other estimate of the failure rate was possible to obtain.
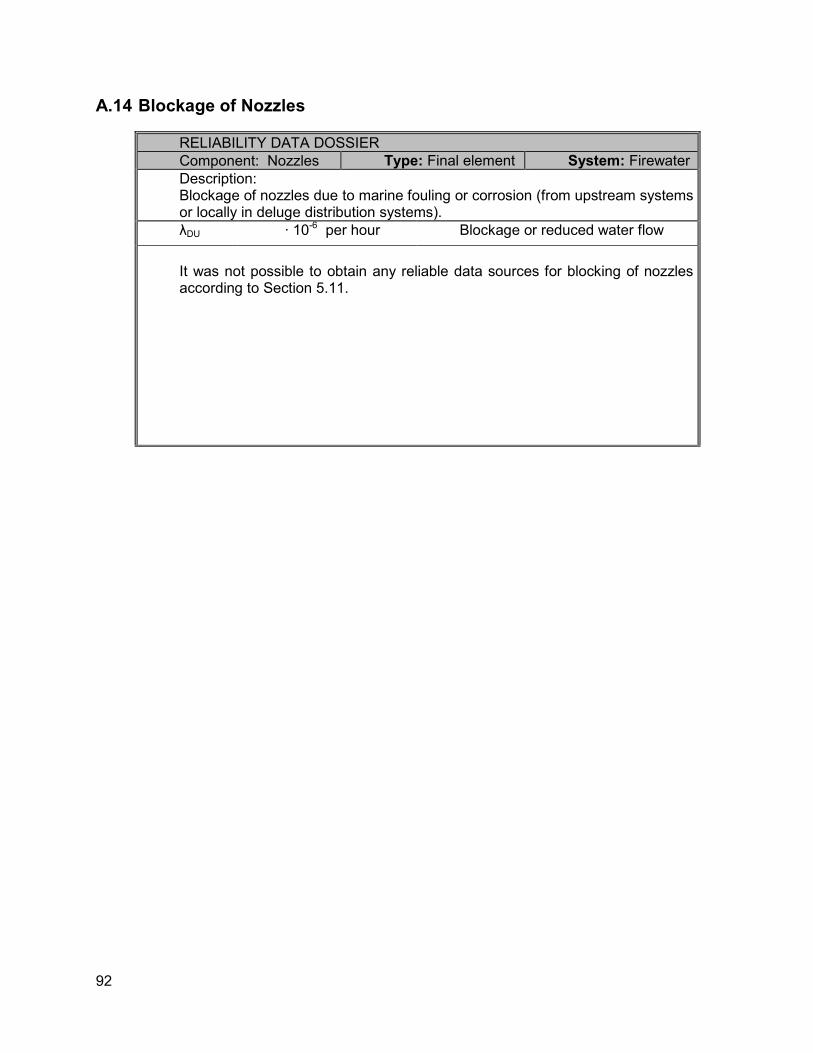
92
A.14 Blockage of Nozzles
RELIABILITY DATA DOSSIER
Component: Nozzles Type: Final element System: Firewater
Description: Blockage of nozzles due to marine fouling or corrosion (from upstream systems or locally in deluge distribution systems).
λDU · 10-6 per hour Blockage or reduced water flow
It was not possible to obtain any reliable data sources for blocking of nozzles according to Section 5.11.
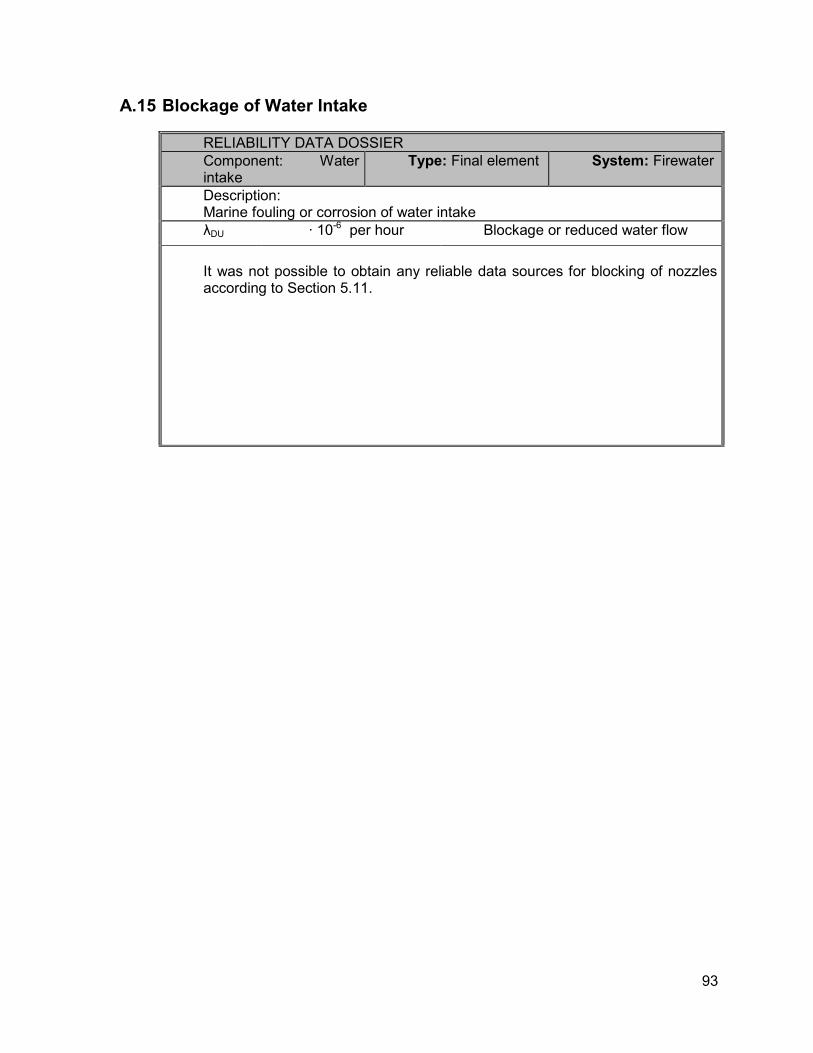
93
A.15 Blockage of Water Intake
RELIABILITY DATA DOSSIER
Component: Water intake
Type: Final element System: Firewater
Description: Marine fouling or corrosion of water intake
λDU · 10-6 per hour Blockage or reduced water flow
It was not possible to obtain any reliable data sources for blocking of nozzles according to Section 5.11.

94
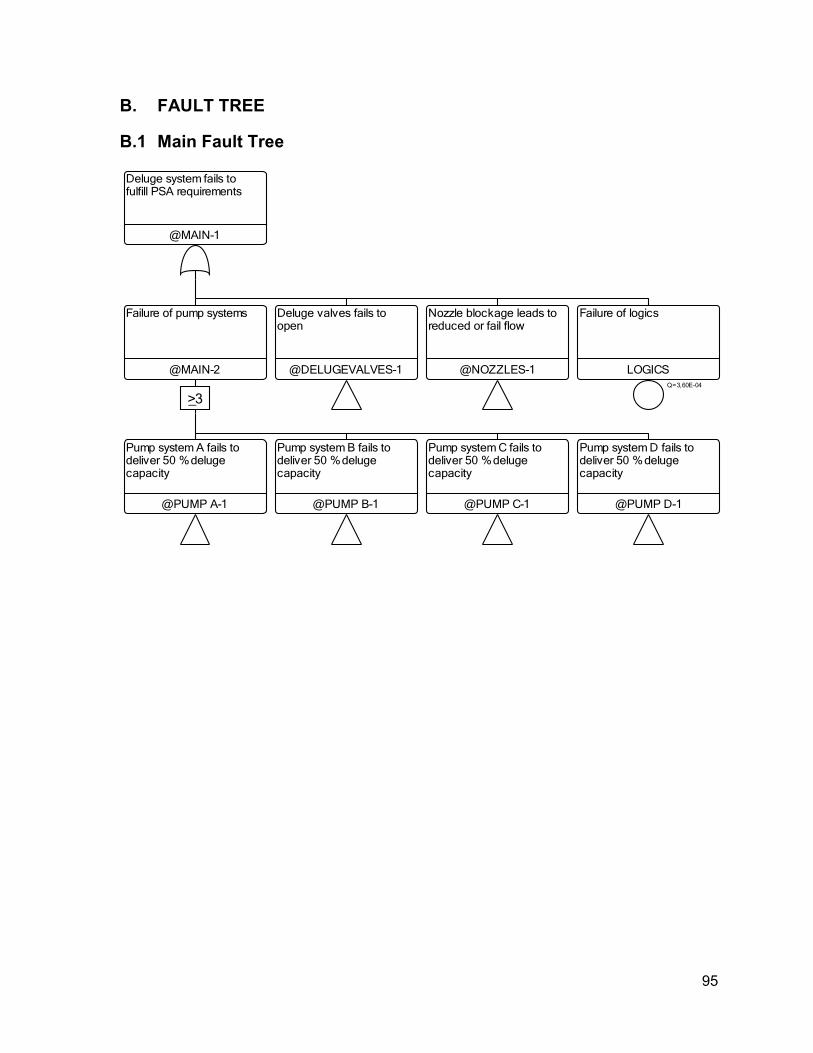
95
B. FAULT TREE
B.1 Main Fault Tree
Deluge system fails to fulfill PSA requirements
@MAIN-1
Failure of pump systems
@MAIN-2
>3_
Pump system A fails to deliver 50 % deluge capacity
@PUMP A-1
Pump system B fails to deliver 50 % deluge capacity
@PUMP B-1
Pump system C fails to deliver 50 % deluge capacity
@PUMP C-1
Pump system D fails to deliver 50 % deluge capacity
@PUMP D-1
Deluge valves fails to open
@DELUGEVALVES-1
Nozzle blockage leads to reduced or fail flow
@NOZZLES-1
Failure of logics
LOGICSQ=3,60E-04
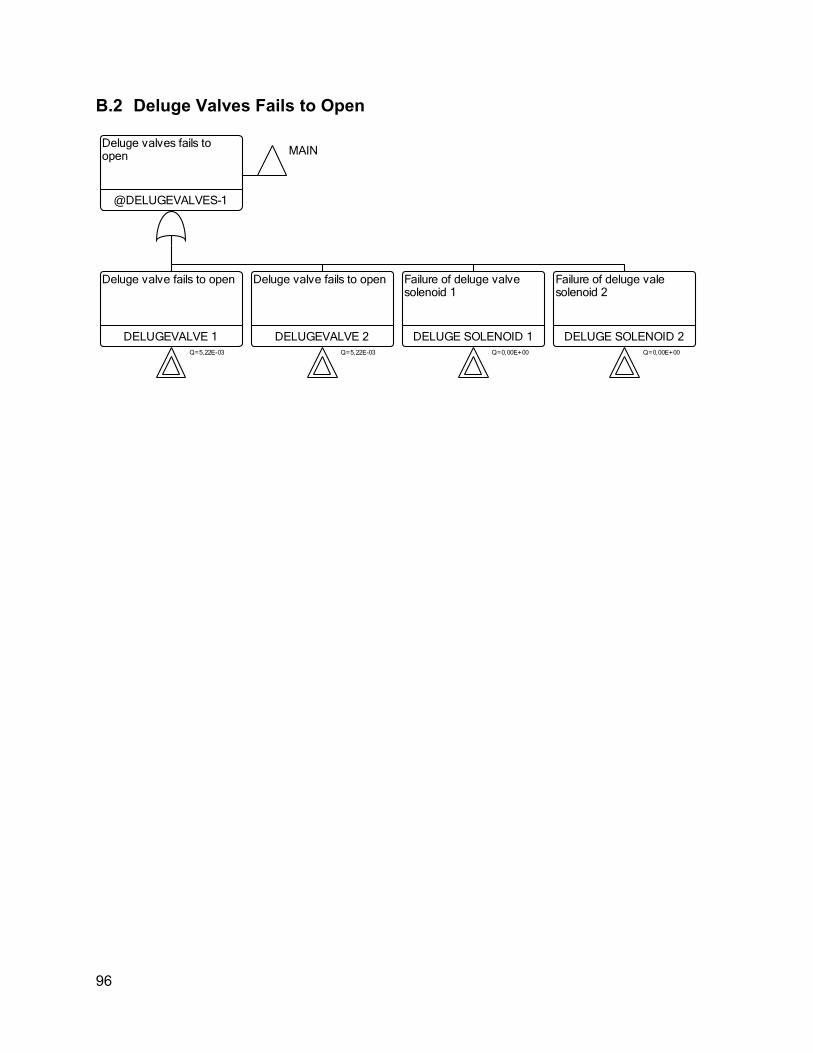
96
B.2 Deluge Valves Fails to Open
MAINDeluge valves fails to open
@DELUGEVALVES-1
Deluge valve fails to open
DELUGEVALVE 1Q=5,22E-03
Deluge valve fails to open
DELUGEVALVE 2Q=5,22E-03
Failure of deluge valve solenoid 1
DELUGE SOLENOID 1Q=0,00E+00
Failure of deluge vale solenoid 2
DELUGE SOLENOID 2Q=0,00E+00
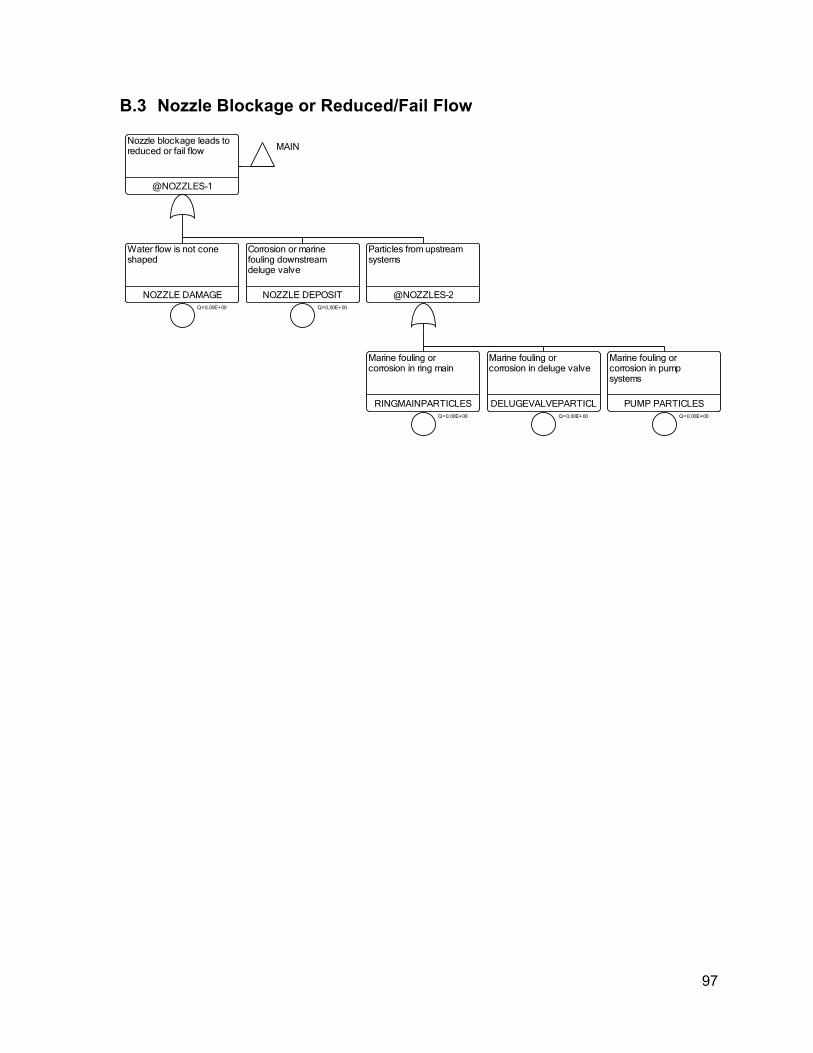
97
B.3 Nozzle Blockage or Reduced/Fail Flow
MAINNozzle blockage leads to reduced or fail flow
@NOZZLES-1
Water flow is not cone shaped
NOZZLE DAMAGEQ=0,00E+00
Corrosion or marine fouling downstream deluge valve
NOZZLE DEPOSITQ=0,00E+00
Particles from upstream systems
@NOZZLES-2
Marine fouling or corrosion in ring main
RINGMAINPARTICLESQ=0,00E+00
Marine fouling or corrosion in deluge valve
DELUGEVALVEPARTICLQ=0,00E+00
Marine fouling or corrosion in pump systems
PUMP PARTICLESQ=0,00E+00
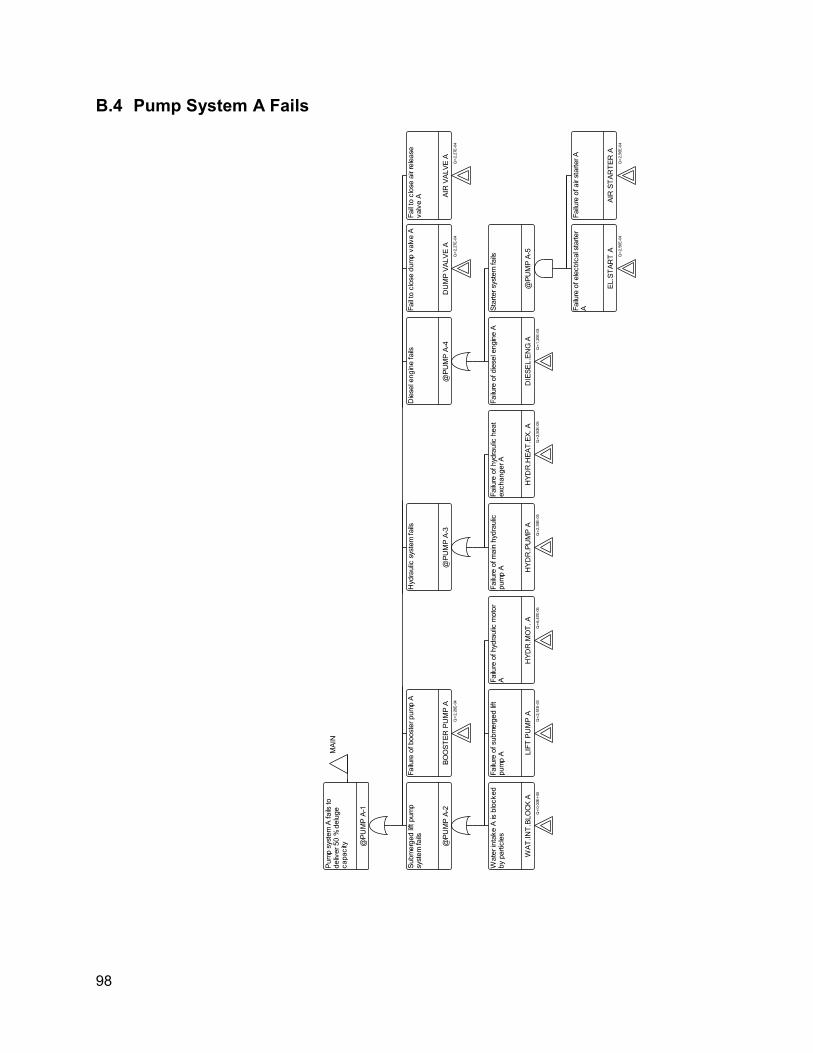
98
B.4 Pump System A Fails
MAIN
Pump system A fails to
deliver 50 % deluge
capacity @
PUMP A-1
Submerged lift pump
system fails
@PUMP A-2
Water intake A is blocked
by particles
WAT.INT.BLOCK A
Q=0,00E+00
Failure of submerged lift
pump A
LIFT PUMP A
Q=2,51E-03
Failure of hydraulic motor
A
HYDR.MOT. A
Q=6,47E-05
Failure of booster pump A
BOOSTER PUMP A
Q=2,28E-04
Hydraulic system fails
@PUMP A-3
Failure of main hydraulic
pump A HYDR.PUMP A
Q=2,39E-05
Failure of hydraulic heat
exchanger A
HYDR.HEAT.EX. A
Q=2,50E-05
Diesel engine fails
@PUMP A-4
Failure of diesel engine A
DIESEL.ENG A
Q=1,20E-03
Starter system fails
@PUMP A-5
Failure of electrical starter
A
EL.START A
Q=2,56E-04
Failure of air starter A
AIR STARTER A
Q=2,56E-04
Fail to close dump valve A
DUMP VALVE A
Q=2,27E-04
Fail to close air release
valve A AIR VALVE A
Q=2,27E-04
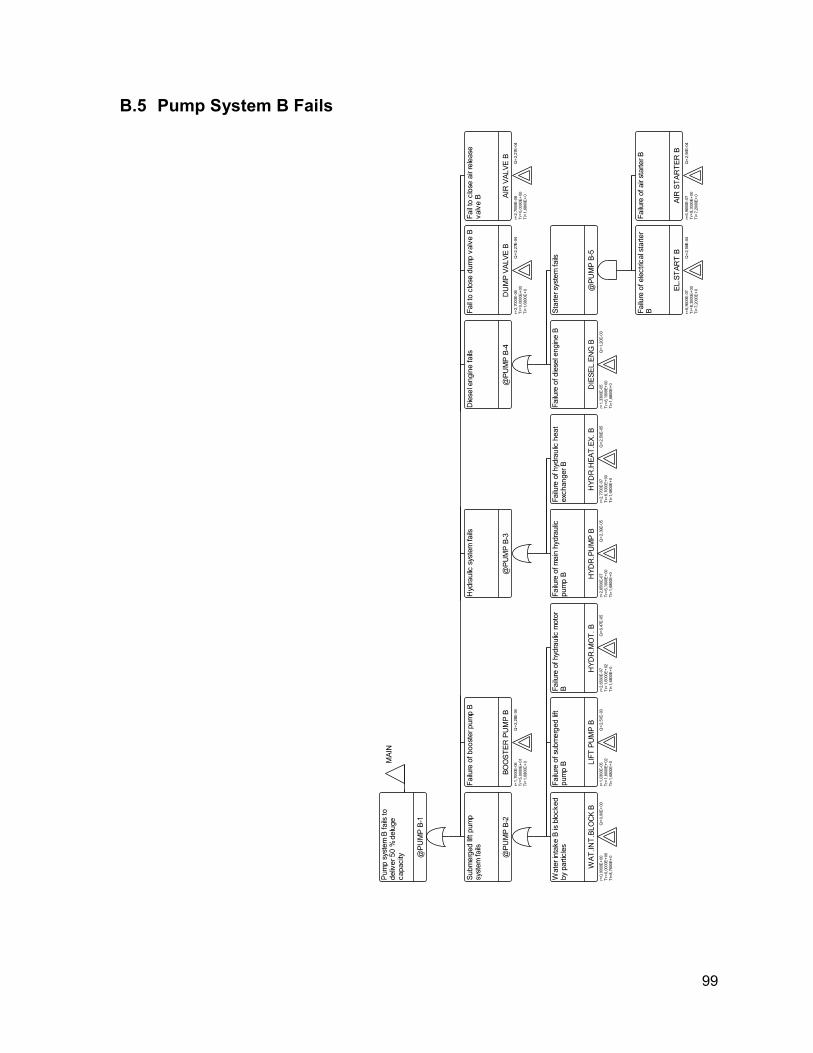
99
B.5 Pump System B Fails
MAIN
Pump system B fails to
deliver 50 % deluge
capacity @
PUMP B-1
Submerged lift pump
system fails
@PUMP B-2
Water intake B is blocked
by particles
WAT.INT.BLOCK B
r=0,0000E
+00
Tr=0,0000E
+00
Ti=8,7600E+0
Q=0,00E
+00
Failure of submerged lift
pump B
LIFT PUMP B
r=1,0300E
-05
Tr=1,6000E+02
Ti=1,6800E+0
Q=2,51E
-03
Failure of hydraulic motor
B
HYDR.MOT. B
r=2,6500E-07
Tr=1,6000E+02
Ti=1,6800E+0
Q=6,47E-05
Failure of booster pump B
BOOSTER PUMP B
r=1,7000E
-06
Tr=5,0000E+01
Ti=1,6800E+0
Q=2,28E
-04
Hydraulic system fails
@PUMP B-3
Failure of main hydraulic
pump B HYDR.PUMP B
r=2,6500E-07
Tr=6,1000E+00
Ti=1,6800E+0
Q=2,39E-05
Failure of hydraulic heat
exchanger B
HYDR.HEAT.EX. B
r=2,7700E-07
Tr=6,1000E+00
Ti=1,6800E
+0
Q=2,50E-05
Diesel engine fails
@PUMP B-4
Failure of diesel engine B
DIESEL.ENG B
r=1,3300E-05
Tr=6,1000E+00
Ti=1,6800E
+0
Q=1,20E-03
Starter system fails
@PUMP B-5
Failure of electrical starter
B
EL.START B
r=6,9600E
-07
Tr=8,3000E
+00
Ti=7,2000E+0
Q=2,56E
-04
Failure of air starter B
AIR STARTER B
r=6,9600E
-07
Tr=8,3000E+00
Ti=7,2000E+0
Q=2,56E
-04
Fail to close dump valve B
DUMP VALVE B
r=2,7000E
-06
Tr=0,0000E
+00
Ti=1,6800E+0
Q=2,27E
-04
Fail to close air release
valve B AIR VALVE B
r=2,7000E
-06
Tr=0,0000E+00
Ti=1,6800E+0
Q=2,27E
-04
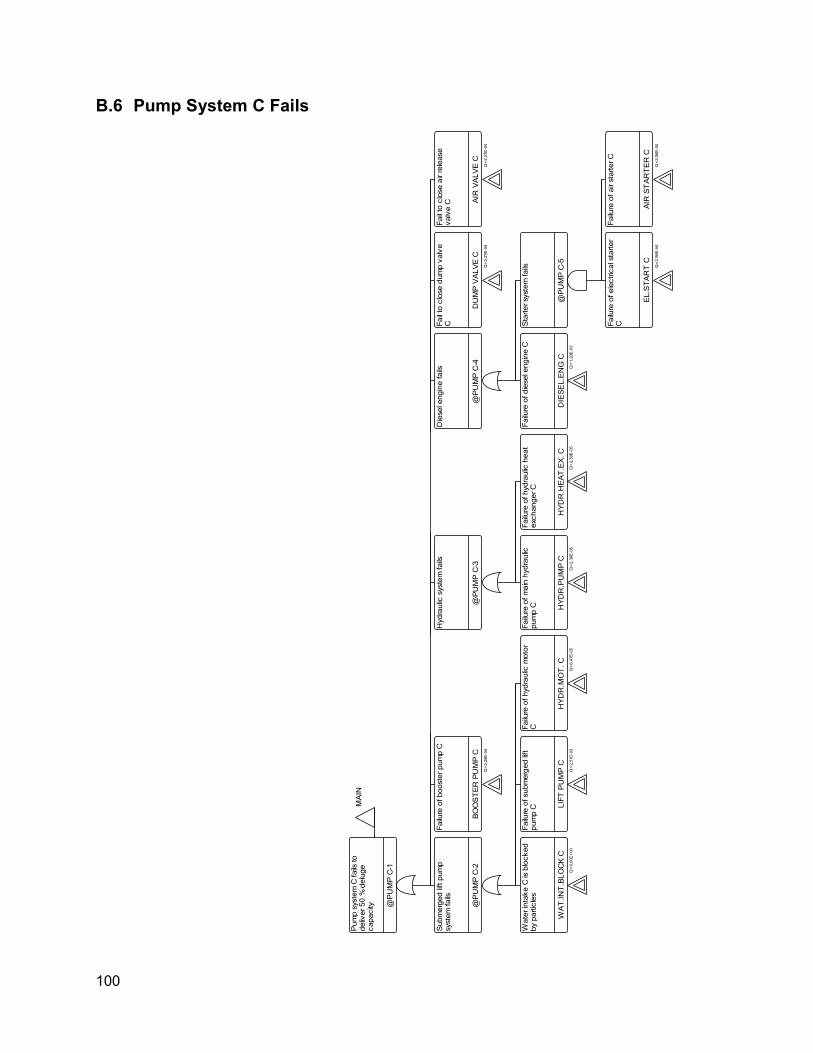
100
B.6 Pump System C Fails
MAIN
Pump system C fails to
deliver 50 % deluge
capacity @PUMP C-1
Submerged lift pump
system fails
@PUMP C-2
Water intake C is blocked
by particles
WAT.INT.BLOCK C
Q=0,00E+00
Failure of submerged lift
pump C LIFT PUMP C
Q=2,51E-03
Failure of hydraulic motor
C
HYDR.M
OT. C
Q=6,47E-05
Failure of booster pump C
BOOSTER PUMP C
Q=2,28E-04
Hydraulic system fails
@PUMP C-3
Failure of main hydraulic
pump C HYDR.PUMP C
Q=2,39E-05
Failure of hydraulic heat
exchanger C
HYDR.HEAT.EX. C
Q=2,50E-05
Diesel engine fails
@PUMP C-4
Failure of diesel engine C
DIESEL.ENG C
Q=1,20E-03
Starter system fails
@PUMP C-5
Failure of electrical starter
C
EL.START C
Q=2,56E-04
Failure of air starter C
AIR STARTER C
Q=2,56E-04
Fail to close dump valve
C
DUMP VALVE C
Q=2,27E-04
Fail to close air release
valve C
AIR VALVE C
Q=2,27E-04
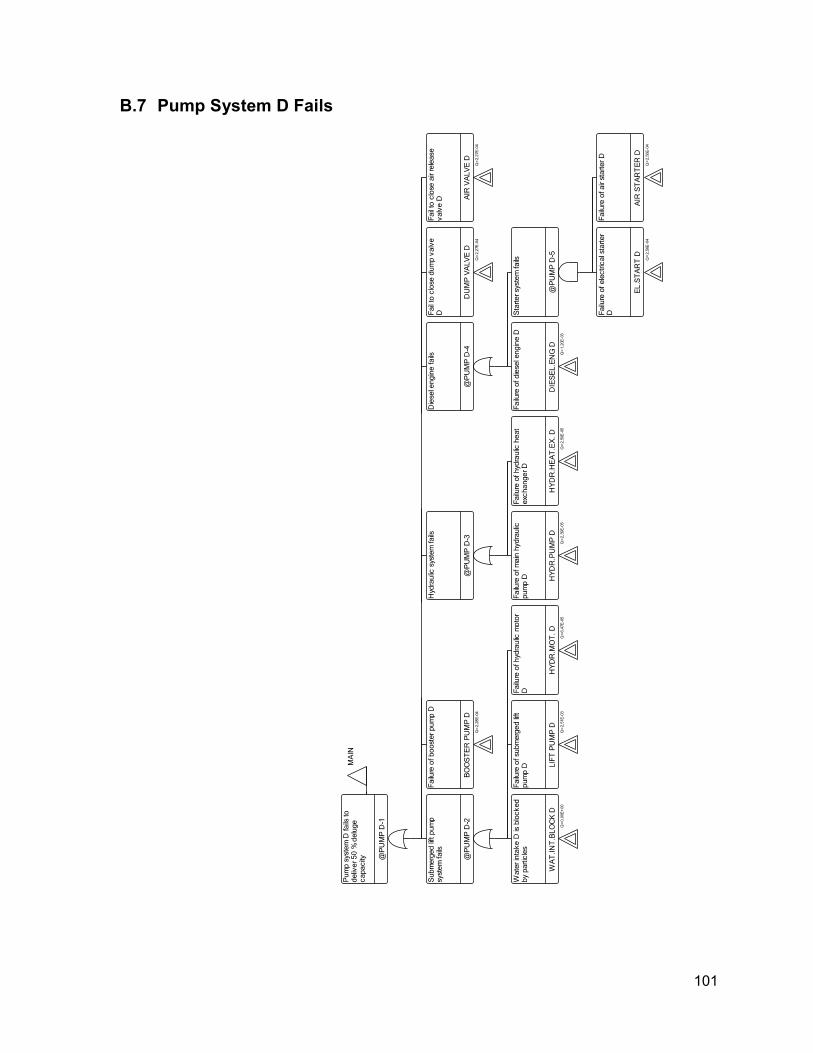
101
B.7 Pump System D Fails
MAIN
Pump system D fails to
deliver 50 % deluge
capacity @
PUMP D-1
Submerged lift pump
system fails
@PUMP D-2
Water intake D is blocked
by particles
WAT.INT.BLOCK D
Q=0,00E+00
Failure of submerged lift
pump D LIFT PUMP D
Q=2,51E-03
Failure of hydraulic motor
D
HYDR.MOT. D
Q=6,47E-05
Failure of booster pump D
BOOSTER PUMP D
Q=2,28E-04
Hydraulic system fails
@PUMP D-3
Failure of main hydraulic
pump D HYDR.PUMP D
Q=2,39E-05
Failure of hydraulic heat
exchanger D
HYDR.HEAT.EX. D
Q=2,50E-05
Diesel engine fails
@PUMP D-4
Failure of diesel engine D
DIESEL.ENG D
Q=1,20E
-03
Starter system fails
@PUMP D-5
Failure of electrical starter
D
EL.START DQ=2,56E
-04
Failure of air starter D
AIR STARTER D
Q=2,56E-04
Fail to close dump valve
D
DUMP VALVE D
Q=2,27E
-04
Fail to close air release
valve D AIR VALVE D
Q=2,27E-04

102
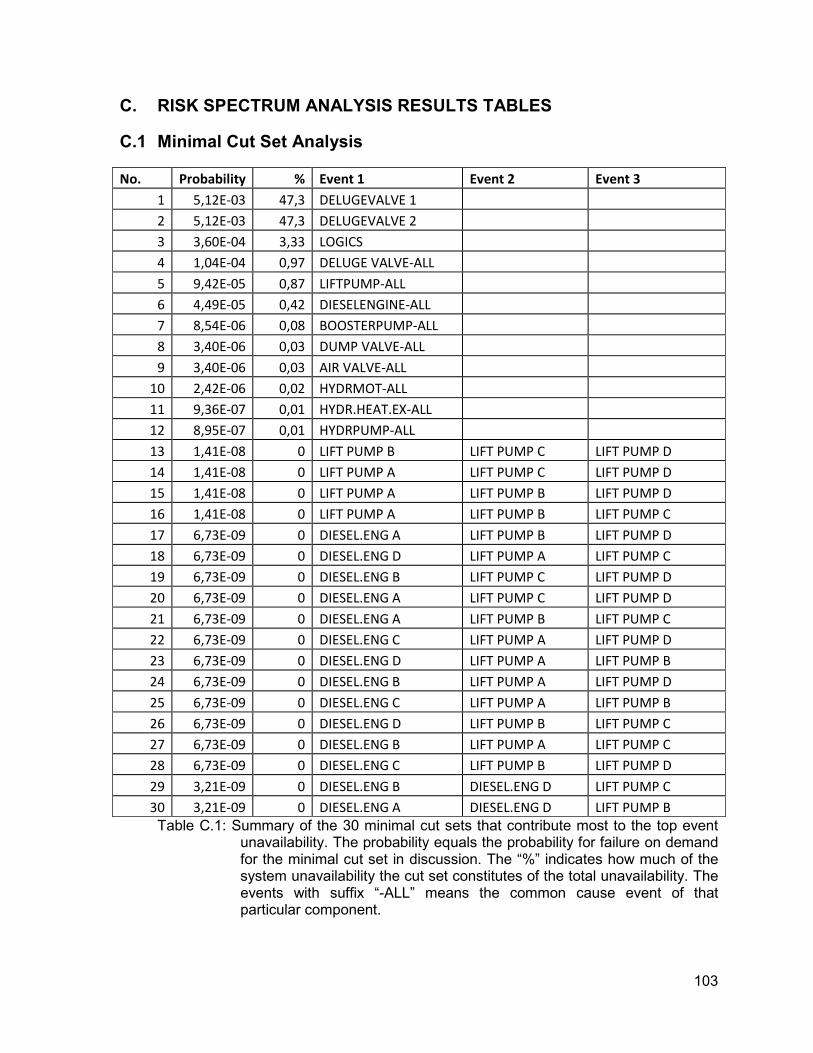
103
C. RISK SPECTRUM ANALYSIS RESULTS TABLES
C.1 Minimal Cut Set Analysis
No. Probability % Event 1 Event 2 Event 3
1 5,12E-03 47,3 DELUGEVALVE 1
2 5,12E-03 47,3 DELUGEVALVE 2
3 3,60E-04 3,33 LOGICS
4 1,04E-04 0,97 DELUGE VALVE-ALL
5 9,42E-05 0,87 LIFTPUMP-ALL
6 4,49E-05 0,42 DIESELENGINE-ALL
7 8,54E-06 0,08 BOOSTERPUMP-ALL
8 3,40E-06 0,03 DUMP VALVE-ALL
9 3,40E-06 0,03 AIR VALVE-ALL
10 2,42E-06 0,02 HYDRMOT-ALL
11 9,36E-07 0,01 HYDR.HEAT.EX-ALL
12 8,95E-07 0,01 HYDRPUMP-ALL
13 1,41E-08 0 LIFT PUMP B LIFT PUMP C LIFT PUMP D
14 1,41E-08 0 LIFT PUMP A LIFT PUMP C LIFT PUMP D
15 1,41E-08 0 LIFT PUMP A LIFT PUMP B LIFT PUMP D
16 1,41E-08 0 LIFT PUMP A LIFT PUMP B LIFT PUMP C
17 6,73E-09 0 DIESEL.ENG A LIFT PUMP B LIFT PUMP D
18 6,73E-09 0 DIESEL.ENG D LIFT PUMP A LIFT PUMP C
19 6,73E-09 0 DIESEL.ENG B LIFT PUMP C LIFT PUMP D
20 6,73E-09 0 DIESEL.ENG A LIFT PUMP C LIFT PUMP D
21 6,73E-09 0 DIESEL.ENG A LIFT PUMP B LIFT PUMP C
22 6,73E-09 0 DIESEL.ENG C LIFT PUMP A LIFT PUMP D
23 6,73E-09 0 DIESEL.ENG D LIFT PUMP A LIFT PUMP B
24 6,73E-09 0 DIESEL.ENG B LIFT PUMP A LIFT PUMP D
25 6,73E-09 0 DIESEL.ENG C LIFT PUMP A LIFT PUMP B
26 6,73E-09 0 DIESEL.ENG D LIFT PUMP B LIFT PUMP C
27 6,73E-09 0 DIESEL.ENG B LIFT PUMP A LIFT PUMP C
28 6,73E-09 0 DIESEL.ENG C LIFT PUMP B LIFT PUMP D
29 3,21E-09 0 DIESEL.ENG B DIESEL.ENG D LIFT PUMP C
30 3,21E-09 0 DIESEL.ENG A DIESEL.ENG D LIFT PUMP B
Table C.1: Summary of the 30 minimal cut sets that contribute most to the top event unavailability. The probability equals the probability for failure on demand for the minimal cut set in discussion. The “%” indicates how much of the system unavailability the cut set constitutes of the total unavailability. The events with suffix “-ALL” means the common cause event of that particular component.
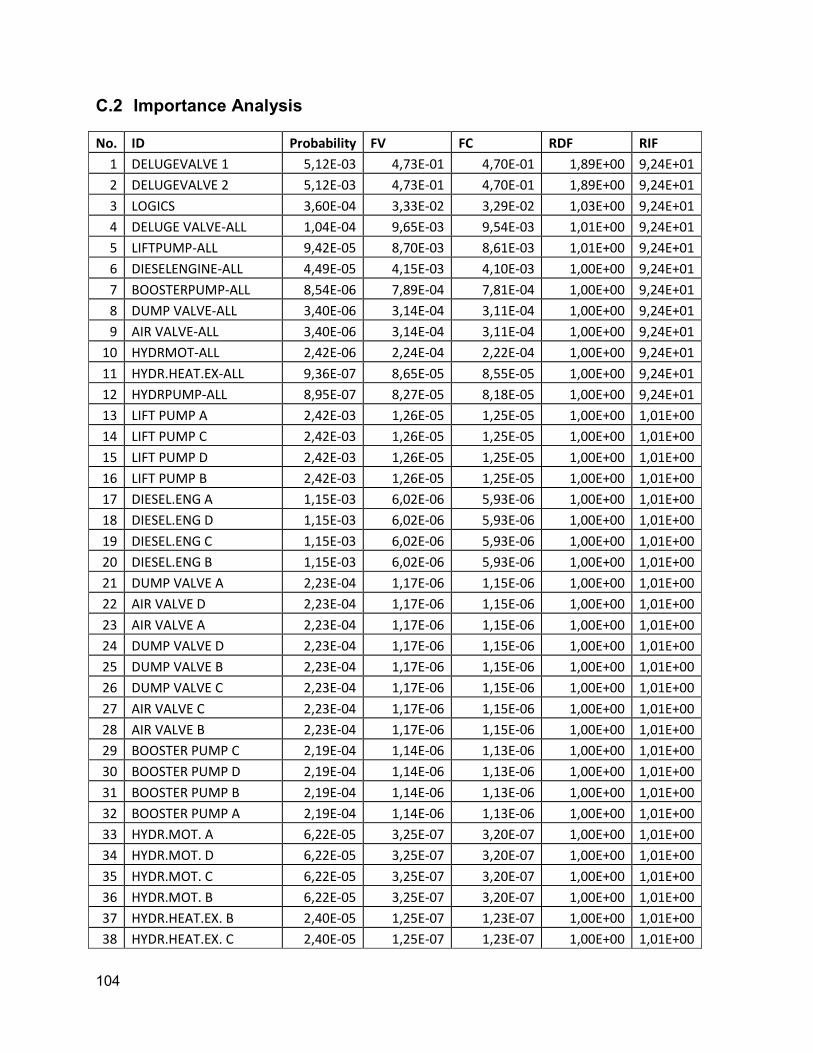
104
C.2 Importance Analysis
No. ID Probability FV FC RDF RIF
1 DELUGEVALVE 1 5,12E-03 4,73E-01 4,70E-01 1,89E+00 9,24E+01
2 DELUGEVALVE 2 5,12E-03 4,73E-01 4,70E-01 1,89E+00 9,24E+01
3 LOGICS 3,60E-04 3,33E-02 3,29E-02 1,03E+00 9,24E+01
4 DELUGE VALVE-ALL 1,04E-04 9,65E-03 9,54E-03 1,01E+00 9,24E+01
5 LIFTPUMP-ALL 9,42E-05 8,70E-03 8,61E-03 1,01E+00 9,24E+01
6 DIESELENGINE-ALL 4,49E-05 4,15E-03 4,10E-03 1,00E+00 9,24E+01
7 BOOSTERPUMP-ALL 8,54E-06 7,89E-04 7,81E-04 1,00E+00 9,24E+01
8 DUMP VALVE-ALL 3,40E-06 3,14E-04 3,11E-04 1,00E+00 9,24E+01
9 AIR VALVE-ALL 3,40E-06 3,14E-04 3,11E-04 1,00E+00 9,24E+01
10 HYDRMOT-ALL 2,42E-06 2,24E-04 2,22E-04 1,00E+00 9,24E+01
11 HYDR.HEAT.EX-ALL 9,36E-07 8,65E-05 8,55E-05 1,00E+00 9,24E+01
12 HYDRPUMP-ALL 8,95E-07 8,27E-05 8,18E-05 1,00E+00 9,24E+01
13 LIFT PUMP A 2,42E-03 1,26E-05 1,25E-05 1,00E+00 1,01E+00
14 LIFT PUMP C 2,42E-03 1,26E-05 1,25E-05 1,00E+00 1,01E+00
15 LIFT PUMP D 2,42E-03 1,26E-05 1,25E-05 1,00E+00 1,01E+00
16 LIFT PUMP B 2,42E-03 1,26E-05 1,25E-05 1,00E+00 1,01E+00
17 DIESEL.ENG A 1,15E-03 6,02E-06 5,93E-06 1,00E+00 1,01E+00
18 DIESEL.ENG D 1,15E-03 6,02E-06 5,93E-06 1,00E+00 1,01E+00
19 DIESEL.ENG C 1,15E-03 6,02E-06 5,93E-06 1,00E+00 1,01E+00
20 DIESEL.ENG B 1,15E-03 6,02E-06 5,93E-06 1,00E+00 1,01E+00
21 DUMP VALVE A 2,23E-04 1,17E-06 1,15E-06 1,00E+00 1,01E+00
22 AIR VALVE D 2,23E-04 1,17E-06 1,15E-06 1,00E+00 1,01E+00
23 AIR VALVE A 2,23E-04 1,17E-06 1,15E-06 1,00E+00 1,01E+00
24 DUMP VALVE D 2,23E-04 1,17E-06 1,15E-06 1,00E+00 1,01E+00
25 DUMP VALVE B 2,23E-04 1,17E-06 1,15E-06 1,00E+00 1,01E+00
26 DUMP VALVE C 2,23E-04 1,17E-06 1,15E-06 1,00E+00 1,01E+00
27 AIR VALVE C 2,23E-04 1,17E-06 1,15E-06 1,00E+00 1,01E+00
28 AIR VALVE B 2,23E-04 1,17E-06 1,15E-06 1,00E+00 1,01E+00
29 BOOSTER PUMP C 2,19E-04 1,14E-06 1,13E-06 1,00E+00 1,01E+00
30 BOOSTER PUMP D 2,19E-04 1,14E-06 1,13E-06 1,00E+00 1,01E+00
31 BOOSTER PUMP B 2,19E-04 1,14E-06 1,13E-06 1,00E+00 1,01E+00
32 BOOSTER PUMP A 2,19E-04 1,14E-06 1,13E-06 1,00E+00 1,01E+00
33 HYDR.MOT. A 6,22E-05 3,25E-07 3,20E-07 1,00E+00 1,01E+00
34 HYDR.MOT. D 6,22E-05 3,25E-07 3,20E-07 1,00E+00 1,01E+00
35 HYDR.MOT. C 6,22E-05 3,25E-07 3,20E-07 1,00E+00 1,01E+00
36 HYDR.MOT. B 6,22E-05 3,25E-07 3,20E-07 1,00E+00 1,01E+00
37 HYDR.HEAT.EX. B 2,40E-05 1,25E-07 1,23E-07 1,00E+00 1,01E+00
38 HYDR.HEAT.EX. C 2,40E-05 1,25E-07 1,23E-07 1,00E+00 1,01E+00
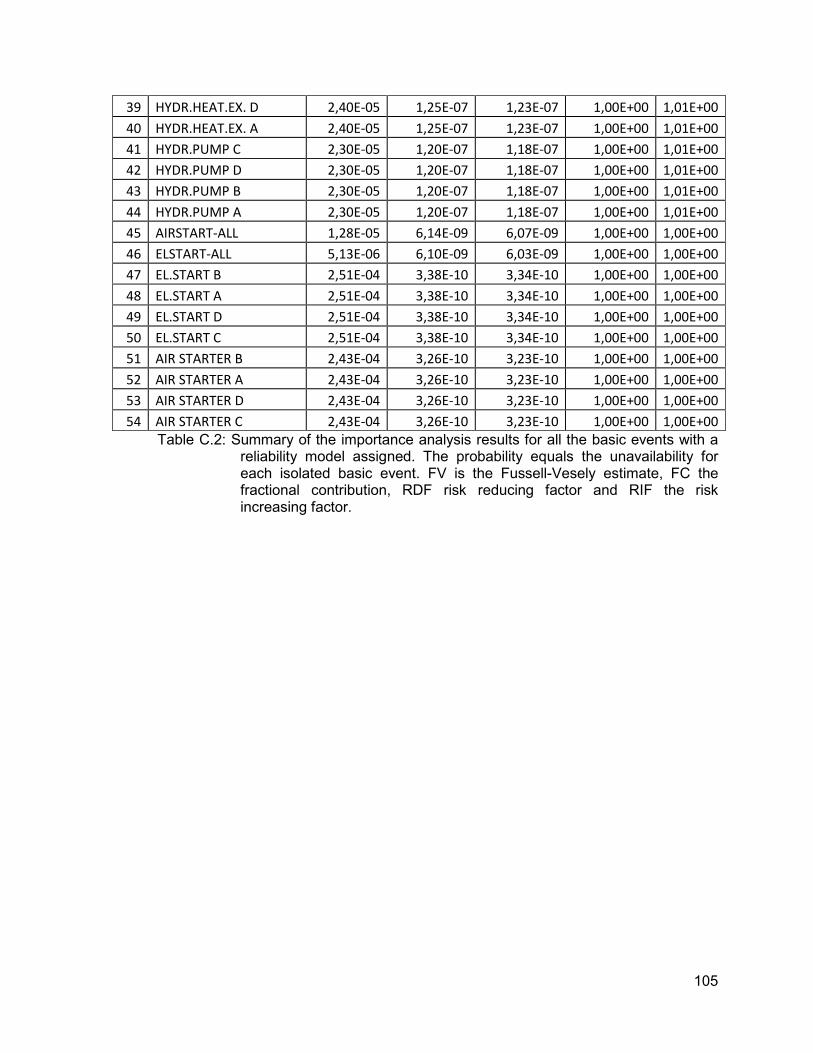
105
39 HYDR.HEAT.EX. D 2,40E-05 1,25E-07 1,23E-07 1,00E+00 1,01E+00
40 HYDR.HEAT.EX. A 2,40E-05 1,25E-07 1,23E-07 1,00E+00 1,01E+00
41 HYDR.PUMP C 2,30E-05 1,20E-07 1,18E-07 1,00E+00 1,01E+00
42 HYDR.PUMP D 2,30E-05 1,20E-07 1,18E-07 1,00E+00 1,01E+00
43 HYDR.PUMP B 2,30E-05 1,20E-07 1,18E-07 1,00E+00 1,01E+00
44 HYDR.PUMP A 2,30E-05 1,20E-07 1,18E-07 1,00E+00 1,01E+00
45 AIRSTART-ALL 1,28E-05 6,14E-09 6,07E-09 1,00E+00 1,00E+00
46 ELSTART-ALL 5,13E-06 6,10E-09 6,03E-09 1,00E+00 1,00E+00
47 EL.START B 2,51E-04 3,38E-10 3,34E-10 1,00E+00 1,00E+00
48 EL.START A 2,51E-04 3,38E-10 3,34E-10 1,00E+00 1,00E+00
49 EL.START D 2,51E-04 3,38E-10 3,34E-10 1,00E+00 1,00E+00
50 EL.START C 2,51E-04 3,38E-10 3,34E-10 1,00E+00 1,00E+00
51 AIR STARTER B 2,43E-04 3,26E-10 3,23E-10 1,00E+00 1,00E+00
52 AIR STARTER A 2,43E-04 3,26E-10 3,23E-10 1,00E+00 1,00E+00
53 AIR STARTER D 2,43E-04 3,26E-10 3,23E-10 1,00E+00 1,00E+00
54 AIR STARTER C 2,43E-04 3,26E-10 3,23E-10 1,00E+00 1,00E+00
Table C.2: Summary of the importance analysis results for all the basic events with a reliability model assigned. The probability equals the unavailability for each isolated basic event. FV is the Fussell-Vesely estimate, FC the fractional contribution, RDF risk reducing factor and RIF the risk increasing factor.
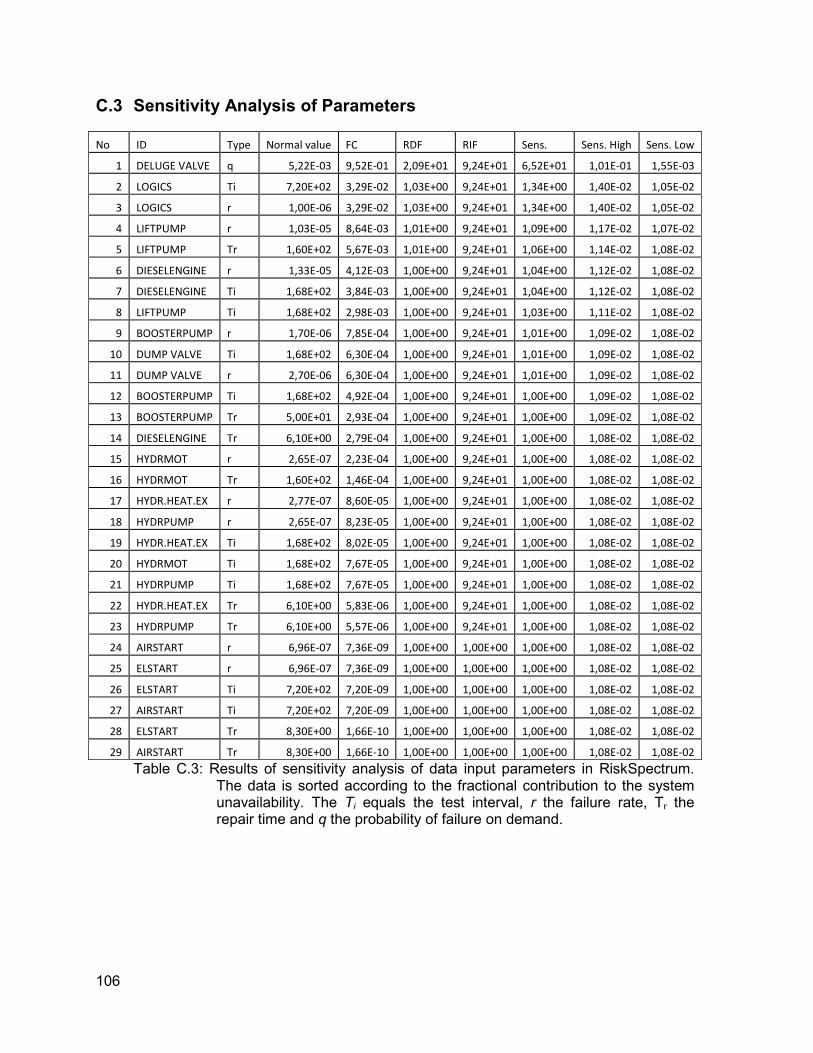
106
C.3 Sensitivity Analysis of Parameters
No ID Type Normal value FC RDF RIF Sens. Sens. High Sens. Low
1 DELUGE VALVE q 5,22E-03 9,52E-01 2,09E+01 9,24E+01 6,52E+01 1,01E-01 1,55E-03
2 LOGICS Ti 7,20E+02 3,29E-02 1,03E+00 9,24E+01 1,34E+00 1,40E-02 1,05E-02
3 LOGICS r 1,00E-06 3,29E-02 1,03E+00 9,24E+01 1,34E+00 1,40E-02 1,05E-02
4 LIFTPUMP r 1,03E-05 8,64E-03 1,01E+00 9,24E+01 1,09E+00 1,17E-02 1,07E-02
5 LIFTPUMP Tr 1,60E+02 5,67E-03 1,01E+00 9,24E+01 1,06E+00 1,14E-02 1,08E-02
6 DIESELENGINE r 1,33E-05 4,12E-03 1,00E+00 9,24E+01 1,04E+00 1,12E-02 1,08E-02
7 DIESELENGINE Ti 1,68E+02 3,84E-03 1,00E+00 9,24E+01 1,04E+00 1,12E-02 1,08E-02
8 LIFTPUMP Ti 1,68E+02 2,98E-03 1,00E+00 9,24E+01 1,03E+00 1,11E-02 1,08E-02
9 BOOSTERPUMP r 1,70E-06 7,85E-04 1,00E+00 9,24E+01 1,01E+00 1,09E-02 1,08E-02
10 DUMP VALVE Ti 1,68E+02 6,30E-04 1,00E+00 9,24E+01 1,01E+00 1,09E-02 1,08E-02
11 DUMP VALVE r 2,70E-06 6,30E-04 1,00E+00 9,24E+01 1,01E+00 1,09E-02 1,08E-02
12 BOOSTERPUMP Ti 1,68E+02 4,92E-04 1,00E+00 9,24E+01 1,00E+00 1,09E-02 1,08E-02
13 BOOSTERPUMP Tr 5,00E+01 2,93E-04 1,00E+00 9,24E+01 1,00E+00 1,09E-02 1,08E-02
14 DIESELENGINE Tr 6,10E+00 2,79E-04 1,00E+00 9,24E+01 1,00E+00 1,08E-02 1,08E-02
15 HYDRMOT r 2,65E-07 2,23E-04 1,00E+00 9,24E+01 1,00E+00 1,08E-02 1,08E-02
16 HYDRMOT Tr 1,60E+02 1,46E-04 1,00E+00 9,24E+01 1,00E+00 1,08E-02 1,08E-02
17 HYDR.HEAT.EX r 2,77E-07 8,60E-05 1,00E+00 9,24E+01 1,00E+00 1,08E-02 1,08E-02
18 HYDRPUMP r 2,65E-07 8,23E-05 1,00E+00 9,24E+01 1,00E+00 1,08E-02 1,08E-02
19 HYDR.HEAT.EX Ti 1,68E+02 8,02E-05 1,00E+00 9,24E+01 1,00E+00 1,08E-02 1,08E-02
20 HYDRMOT Ti 1,68E+02 7,67E-05 1,00E+00 9,24E+01 1,00E+00 1,08E-02 1,08E-02
21 HYDRPUMP Ti 1,68E+02 7,67E-05 1,00E+00 9,24E+01 1,00E+00 1,08E-02 1,08E-02
22 HYDR.HEAT.EX Tr 6,10E+00 5,83E-06 1,00E+00 9,24E+01 1,00E+00 1,08E-02 1,08E-02
23 HYDRPUMP Tr 6,10E+00 5,57E-06 1,00E+00 9,24E+01 1,00E+00 1,08E-02 1,08E-02
24 AIRSTART r 6,96E-07 7,36E-09 1,00E+00 1,00E+00 1,00E+00 1,08E-02 1,08E-02
25 ELSTART r 6,96E-07 7,36E-09 1,00E+00 1,00E+00 1,00E+00 1,08E-02 1,08E-02
26 ELSTART Ti 7,20E+02 7,20E-09 1,00E+00 1,00E+00 1,00E+00 1,08E-02 1,08E-02
27 AIRSTART Ti 7,20E+02 7,20E-09 1,00E+00 1,00E+00 1,00E+00 1,08E-02 1,08E-02
28 ELSTART Tr 8,30E+00 1,66E-10 1,00E+00 1,00E+00 1,00E+00 1,08E-02 1,08E-02
29 AIRSTART Tr 8,30E+00 1,66E-10 1,00E+00 1,00E+00 1,00E+00 1,08E-02 1,08E-02
Table C.3: Results of sensitivity analysis of data input parameters in RiskSpectrum. The data is sorted according to the fractional contribution to the system unavailability. The Ti equals the test interval, r the failure rate, Tr the repair time and q the probability of failure on demand.