released assessment questions, 2015 - eqao oqre · released assessment questions, 20 ... otalpay2...
TRANSCRIPT
Released Assessment Questions, 20 15 Grade 9 Assessment of Mathematics • Applied: ⚪
For use with Assistive Technology: ⚪
Listen as your teacher reads the instructions. Some key points are listed below. Make sure you have the Formula Sheet for reference.
The diagrams in this booklet are not all drawn to scale.
Answering Multiple-Choice Questions: ⚪
Answer all multiple-choice questions. If you fill in more than one answer to a question, or leave a question blank, the question will be scored zero. Incorrect answers will also be scored zero.
Answering Open-Response Questions: ⚪
Do all of your work for each question in the space provided for the question only. Write your solutions, including all calculations, clearly and completely.
Attention: ⚪
The format of this document differs from that of the actual assessment booklets, as the questions are sorted by strand.
There are more multiple-choice and open-response questions in this document than in a regular booklet.
You are now ready to start.
Education Quality and Accountability Office, 2 Carlton Street, Suite 1200, Toronto ON. M5B 2M9 • Telephone: 1-888-327-7377 • Web site: www.eqao.com. © 2015 Queen’s Printer for Ontario.

Multiple-Choice, question 1 to 18: Question 1: Which of the following ratios is equivalent to: 2 to 5?
A: 5 to 2: ⚪
B: 2 to 7: ⚪
C: 14 to 35: ⚪
D: 22 to 25: ⚪
Question 2: The ratio of boys to girls in Mandy’s mathematics class is 3 to 12.
This ratio is the same in Mandy’s science class, in which there are 20 girls. How many boys are there in Mandy’s science class?
A: 5: ⚪
B: 8: ⚪
C: 11: ⚪
D: 15: ⚪
Question 3: Jake and Minh buy food for a fundraiser. ⚪
• One case of 24 hamburgers costs 37 dollars. ⚪
• One case of 12 drinks costs 9 dollars. ⚪
How much will the food for 72 meals cost if each meal is made up of 1 hamburger and 1 drink?
A: 2 hundred 76 dollars: ⚪
B: 1 hundred 65 dollars: ⚪
C: 1 hundred 38 dollars: ⚪
D: 92 dollars: ⚪

Question 4: A school orders 120 calculators. The school receives a shipment containing 80% of the order, and 1 out of every 3 of these calculators is black.
How many black calculators has the school received in this shipment?
A: 32: ⚪
B: 40: ⚪
C: 50: ⚪
D: 96: ⚪
Question 5: What is the value of negative 5 minus negative 3?
A: negative 8: ⚪
B: negative 2: ⚪
C: 2: ⚪
D: 8: ⚪

Question 6: A line, square and cube are pictured below. ⚪
Line:
The two line segments are the same length and are each labelled p. The total length of this long line is missing and shown with another line. ⚪
Square:
Cube:
Which of the following statements describes one of the above? ⚪
A: The length of the line is p to the power of
2. ⚪
B: The area of the square is p to the power of
2. ⚪
C: The volume of the cube is 3p. ⚪
D: The perimeter of the square is 2p. ⚪
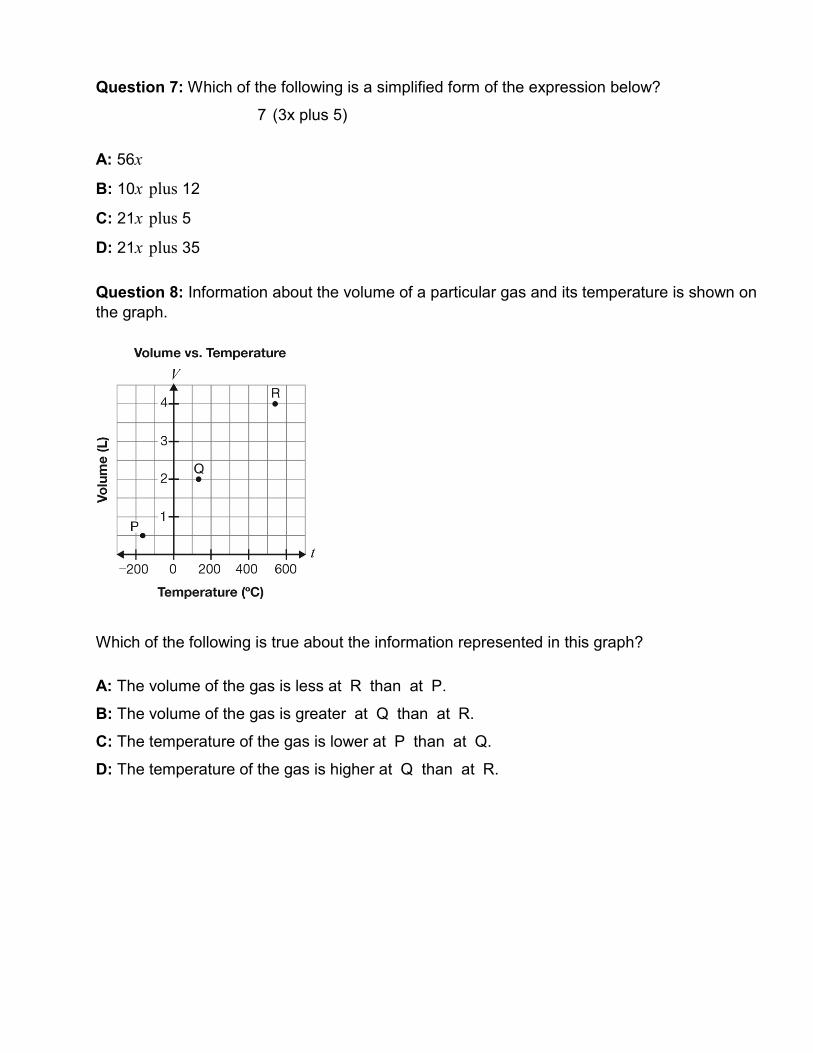
Question 7: Which of the following is a simplified form of the expression below? 7: ⚪ (bracket 3x plus 5) bracket: ⚪
A: 56x: ⚪
B: 10x, ⚪ plus 12: ⚪
C: 21x, ⚪ plus 5: ⚪
D: 21x, ⚪ plus 35: ⚪
Question 8: Information about the volume of a particular gas and its temperature is shown on the graph.
The horizontal axis, labelled Temperature in degrees Celsius, t, starts at negative 200 and goes up to 600. Every other grid line is labelled in increments of 200. The vertical axis, labelled Volume in Litres, capital V, starts at 0 and goes up to 4. Every other gridline is labelled in increments of 1. Three points are shown on the graph. Here are the coordinates for each point. ⚪ Capital P: (negative 175, ⚪ 0 decimal 5): ⚪ Capital Q: (125, ⚪ 2): ⚪ Capital R: (525, ⚪ 4): ⚪
Which of the following is true about the information represented in this graph?
A: The volume of the gas is less at capital R than at capital P. ⚪
B: The volume of the gas is greater at capital Q than at capital R. ⚪
C: The temperature of the gas is lower at capital P than at capital Q. ⚪
D: The temperature of the gas is higher at capital Q than at capital R. ⚪

Question 9: Each week, a salesperson is paid a base salary of 2 hundred 50 dollars plus 100 dollars for each car sold.
Which of the following shows information that is all correct about the salesperson’s total pay for a week?
A:
Number of cars sold, 1: ⚪ Total pay, 2 hundred 50 dollars: ⚪ Number of cars sold, 4: ⚪ Total pay, 6 hundred 50 dollars: ⚪ Number of cars sold, 5: ⚪ Total pay, 7 hundred 50 dollars: ⚪
B:
Number of cars sold, 1: ⚪ Total pay, 2 hundred 50 dollars: ⚪ Number of cars sold, 4: ⚪ Total pay, 1000 dollars: ⚪ Number of cars sold, 5: ⚪ Total pay, 1 thousand 2 hundred 50 dollars: ⚪
C:
Number of cars sold, 1: ⚪ Total pay, 3 hundred 50 dollars: ⚪ Number of cars sold, 4: ⚪ Total pay; 1 thousand 400 dollars: ⚪ Number of cars sold, 5: ⚪ Total pay, 1 thousand 7 hundred 50 dollars: ⚪
D:
Number of cars sold, 1: ⚪ Total pay, 3 hundred 50 dollars: ⚪ Number of cars sold, 4: ⚪ Total pay, 6 hundred 50 dollars: ⚪ Number of cars sold, 5: ⚪ Total pay, 750 dollars: ⚪

Question 10: Rita measures the height of the water in a swimming pool as it is pumped out at a constant rate.
Which graph best represents the height of the water?
A:
And the vertical axis is labelled Height of water, capital H. No scale is shown on either axis. The origin, labelled 0, is on the bottom left corner of the graph. A, line starts halfway up the capital H axis, and goes horizontally to the right. ⚪
B:
And the vertical axis is labelled Height of water, capital H. No scale is shown on either axis. The origin, labelled 0, is on the bottom left corner of the graph. A, curve starts at the top of the capital H axis and curves down to the right slowly at first, then curves so it is almost vertical at the end as it reaches the end of the t-axis. ⚪
C:
A n d t h e v e r t i c a l a x i s i s l a b e l l e d H e i g h t o f w a t e r , c a p i t a l H . N o s c a l e i s s h o w n o n e i t h e r a x i s . T h e o r i g i n , l a b e l l e d 0 , i s o n t h e b o t t o m l e f t c o r n e r o f t h e g r a p h . A l i n e s t a r t s t h r e e q u a r t e r s u p t h e c a p i t a l H a x i s a n d g o e s d o w n , d i a g o n a l l y , t o t h e r i g h t . ⚪
D:
And the vertical axis is labelled Height of water, capital H. No scale is shown on either axis. The origin, labelled 0, is on the bottom left corner of the graph. A, curve starts at the top of the capital H axis and curves down to the right quickly at first and then curves so it is almost horizontal at the end as it reaches the end of the t-axis. ⚪

Question 11: Use first differences to determine which table of values shows data from a linear relationship.
A:
n, 1: ⚪ capital C, 1: ⚪ n, 2: ⚪ capital C, 3: ⚪ n, 3: ⚪ capital C, 6: ⚪ n, 4: ⚪ capital C, 10: ⚪
B:
n, 1: capital C, negative 1: ⚪ n, 2: capital C, negative 2: ⚪ n, 3: capital C, negative 1: ⚪ n, 4: capital C, negative 2: ⚪
C:
n, 0: capital C, 0: ⚪ n, 1: capital C, 1: ⚪ n, 2: capital C, 4: ⚪ n, 3: capital C, 9: ⚪
D:
n, 0: capital C, 0: ⚪ n, 1: capital C, 3: ⚪ n, 2: capital C, 6: ⚪ n, 3: capital C, 9: ⚪
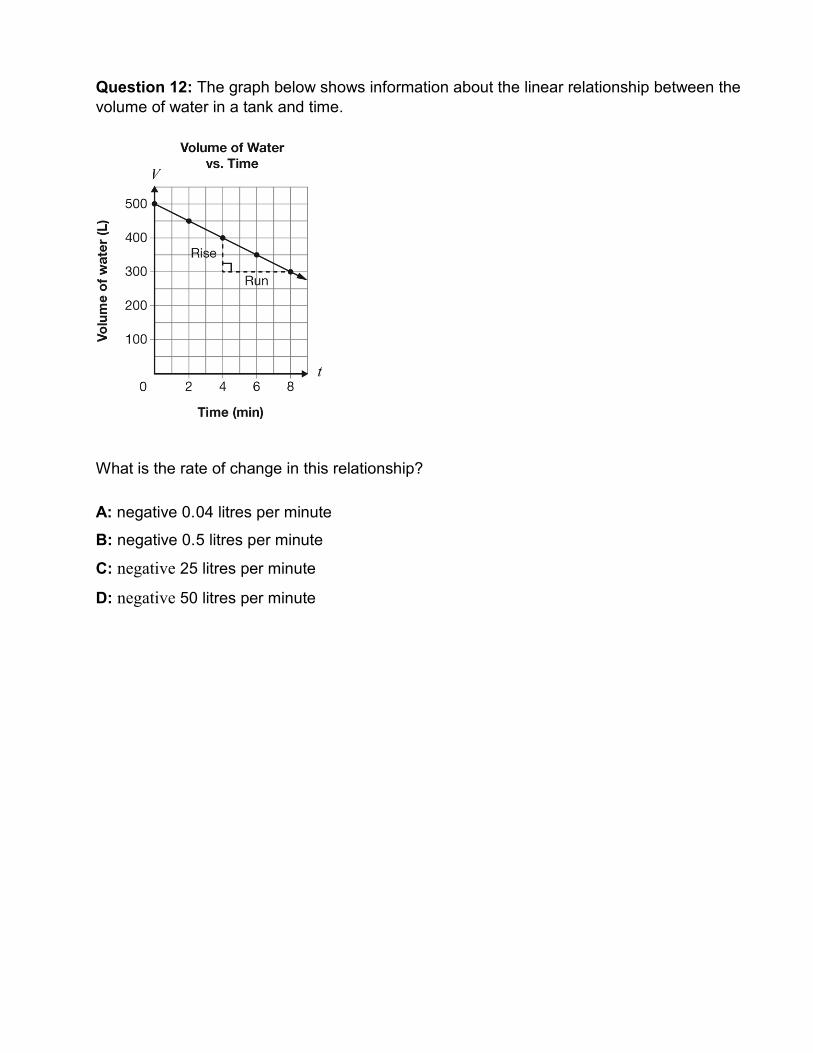
Question 12: The graph below shows information about the linear relationship between the volume of water in a tank and time.
The horizontal axis, labelled Time in minutes, t, starts at 0 and goes up to 8. Every other grid line is labelled in increments of 2. The vertical axis, labelled Volume of water in Litres, capital V, starts at 0 and goes up to 500. Every other grid line is labelled in increments of 100. Five points are plotted. A line is drawn through all of these points. The coordinates of these five points are: 0, ⚪ 500 : ⚪ 2, ⚪ 450 : ⚪ 4, ⚪ 400 : ⚪ 6, ⚪ 350: ⚪ 8, ⚪ 300: ⚪ A vertical dotted line labelled rise is drawn from the point (4, ⚪ 400), which is on the line, down to the point (4, ⚪ 300). From the point (4, ⚪ 300), a horizontal dotted line labelled run is drawn to the point (8, ⚪ 300) which is on the line. A right triangle is drawn at the point (4, ⚪ 300) where these two dotted lines meet.
What is the rate of change in this relationship?
A: negative 0. Decimal 0 4 litres per minute: ⚪
B: negative 0. Decimal 5 litres per minute: ⚪
C: negative 25 litres per minute: ⚪
D: negative 50 litres per minute: ⚪

Question 13: The relationship between the distance below the surface and time for two scuba divers is shown by the graphs below. ⚪
The horizontal axis, labelled Time (in minutes), t, starts at 0, and goes up to 5. Every other grid line is labelled in increments of 1. The vertical axis, labelled Distance below the surface in metres, capital D, starts at 0, and goes up to 40. Every other grid line is labelled in increments of 8. A line is shown on the graph. Here are the coordinates of two points on the line: 0, 0: ⚪ 5, 40: ⚪
Time is shown. The horizontal axis, labelled Time in minutes, t, starts at 0, and goes up to 10. Every other grid line is labelled in increments of 2. The vertical axis, labelled Distance below the surface (in metres), capital D, starts at 0, and goes up to 100. Every other grid line is labelled in increments of 20. A line is shown on the graph. Here are the coordinates of two points on the line: 0, 0: ⚪ 10, 100: ⚪
How much faster is diver B diving than diver A?
A: 0 metres per minute. ⚪
B: 2 metres per minute. ⚪
C: 10 metres per minute. ⚪
D: 12 metres per minute. ⚪

Question 14: The equation C = 45 plus 3d represents the relationship between total cost, C, in dollars, and the number of days, d.
Which of the following is true about this relationship?
A: The total cost is 48 dollars per day. ⚪
B: The total cost is 45 dollars for 3 days. ⚪
C: The total cost is made up of a 45-dollar fixed fee and 3 dollars per day. ⚪
D: The total cost is made up of a 3-dollar fixed fee and 45 dollars per day. ⚪
Question 15: The total cost of a cellphone plan, capital C, in dollars, is determined by the equation: ⚪
Capital C = 10 plus 0. Decimal 1 5n: ⚪
where n is the number of text messages sent.
If 25 text messages are sent, what is the total cost?
A: 13 dollars and 75 cents: ⚪
B: 35 dollars and 15 cents: ⚪
C: 100 dollars: ⚪
D: 2 hundred 53 dollars and 75 cents: ⚪
Question 16: Amanda has a snow-shovelling business. Advertising costs her 5 dollars in total. She charges 15 dollars per driveway.
Which equation represents the relationship between her profit, capital P, and the number of driveways that she shovels, n?
A: capital P = 10n: ⚪
B: capital P = 20n: ⚪
C: capital P = 15n minus 5: ⚪
D: capital P = 5n minus 15: ⚪
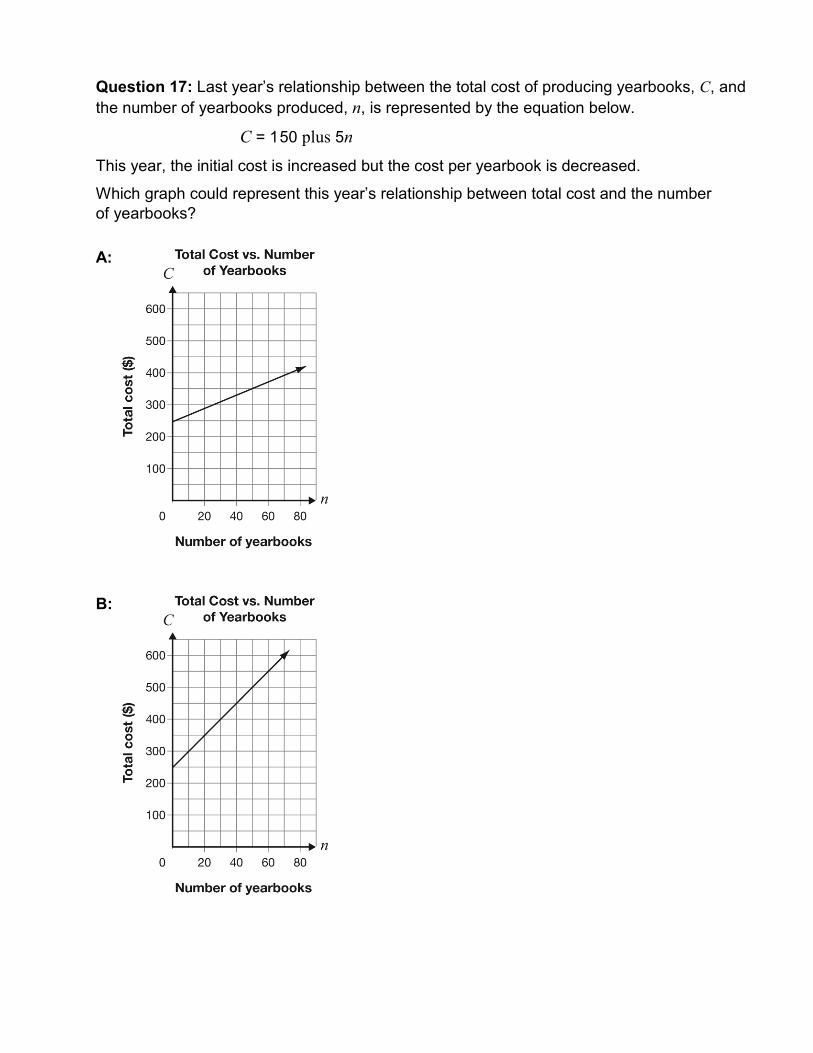
Question 17: Last year’s relationship between the total cost of producing yearbooks, capital C, and the number of yearbooks produced, n, is represented by the equation below.
Capital C = 1 hundred 50 plus 5n: ⚪
This year, the initial cost is increased but the cost per yearbook is decreased.
Which graph could represent this year’s relationship between total cost and the number of yearbooks?
A:
Number of Yearbooks. The horizontal axis, labelled Number of yearbooks, n, starts at 0, and goes to 80. Every other grid line is labelled in increments of 20. The vertical axis, labelled Total cost in dollars, capital C, starts at 0, and goes up to 600. Every other grid line is labelled in increments of 100. A different line is drawn on each graph. Only the coordinates of two points on each line will be given with each answer choice. ⚪ 0, 250: ⚪and: 50, 350: ⚪
B:
Number of Yearbooks. The horizontal axis, labelled Number of yearbooks, n, starts at 0, and goes to 80. Every other grid line is labelled in increments of 20. The vertical axis, labelled Total cost in dollars, capital C, starts at 0, and goes up to 600. Every other grid line is labelled in increments of 100. A different line is drawn on each graph. Only the coordinates of two points on each line will be given with each answer choice. ⚪ 0, 250: and: 50, 500: ⚪

C:
The horizontal axis, labelled Number of yearbooks, n, starts at 0, and goes to 80. Every other grid line is labelled in increments of 20. The vertical axis, labelled Total cost in dollars, capital C, starts at 0, and goes up to 600. Every other grid line is labelled in increments of 100. A different line is drawn on each graph. Only the coordinates of two points on each line will be given with each answer choice. ⚪ 0, 150: ⚪ and: ⚪ 60, 300 ⚪
D:
The horizontal axis, labelled Number of yearbooks, n, starts at 0, and goes to 80. Every other grid line is labelled in increments of 20. The vertical axis, labelled Total cost in dollars, capital C, starts at 0, and goes up to 600. Every other grid line is labelled in increments of 100. A different line is drawn on each graph. Only the coordinates of two points on each line will be given with each answer choice. ⚪ 0, 100: ⚪ and: ⚪ 50, 450: ⚪

Question 18: An amusement park has two options for rides.
• All-Day Pass: The total cost is 36 dollars for unlimited rides. ⚪
• Pay-as-You-Go: Information about the linear relationship between the total cost and the number of rides is shown on the graph. ⚪
The horizontal axis, labelled Number of rides, n, starts at 0 and goes up to 10. Every other grid line is labelled in increments of 2. The vertical axis, labelled Total Cost in dollars, capitial C, starts at 0 and goes up to 40. Every other grid line is labelled in increments of 8. Five points are plotted. Here are the coordinates of each point: ⚪ (0, 8): ⚪ (1, 12): ⚪ (2, 16): ⚪ (3, 20): ⚪ (4, 24): ⚪
Which of the following is a correct comparison of these two options?
A: Pay-as-You-Go is cheaper for 8 rides. ⚪
B: The All-Day Pass is always more expensive. ⚪
C: The All-Day Pass is cheaper if the number of rides taken is less than 6. ⚪
D: Pay-as-You-Go is more expensive if the number of rides taken is more than 7. ⚪
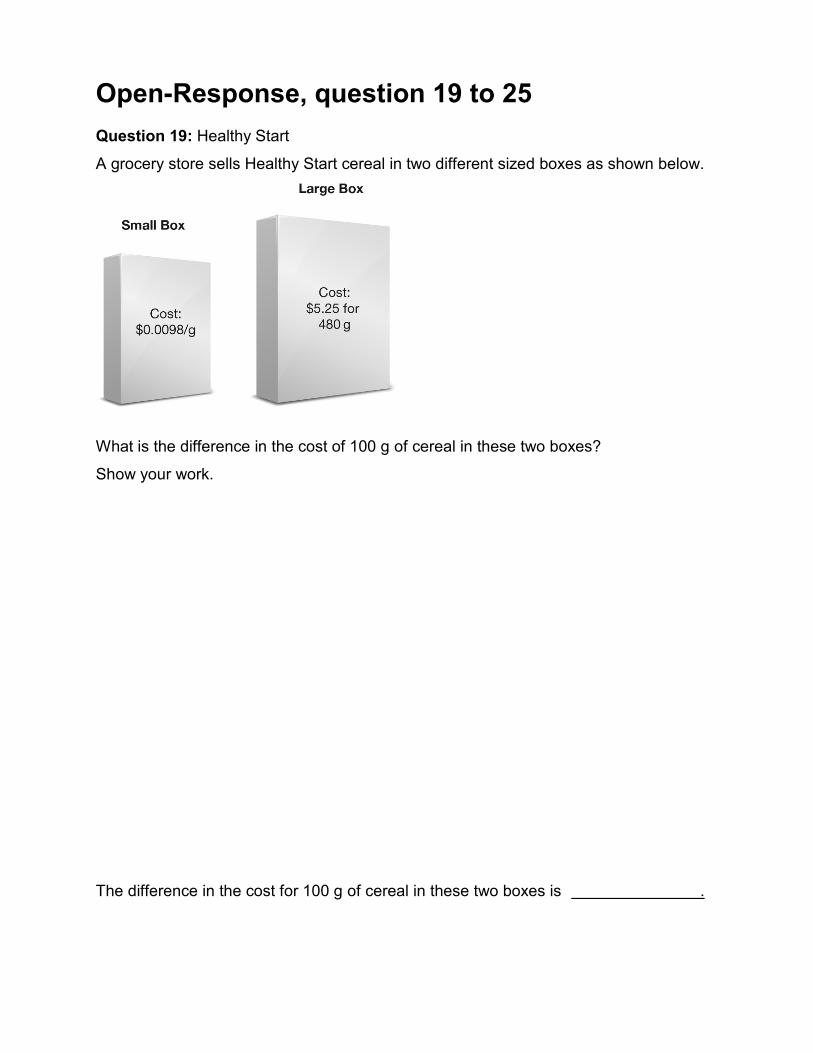
Open-Response, question 19 to 25: Question 19: Healthy Start A grocery store sells Healthy Start cereal in two different sized boxes as shown below.
Each box shows a cost for the cereal inside of it. ⚪ The cost on the Small Box is zero decimal zero zero nine eight cents per gram. The cost on the Large Box is five dollars and twenty five cents for 480 grams.
What is the difference in the cost of 100 grams of cereal in these two boxes?
Show your work.
The difference in the cost for 100 grams of cereal in these two boxes is, ⚪ [bl ank space] . ⚪

Question 20: Banking on a Car: ⚪
Juan borrows money from his mom to buy a used car.
His mom uses the equation shown below to determine the number of monthly payments Juan will make to pay her back.
1. decimal 1 3 T , = 75n plus d: ⚪
In the equation, ⚪
• T, represents the total cost of the car before tax, in dollars, ⚪
• n, represents the number of monthly payments and: ⚪
• d, represents the amount of his down payment, in dollars. ⚪
How many monthly payments will Juan have to make to pay his mom back fully for a car that costs 2000 dollars before tax with a down payment of 5 hundred 35 dollars?
Show your work. ⚪
The number of monthly payments is [blank space] ⚪
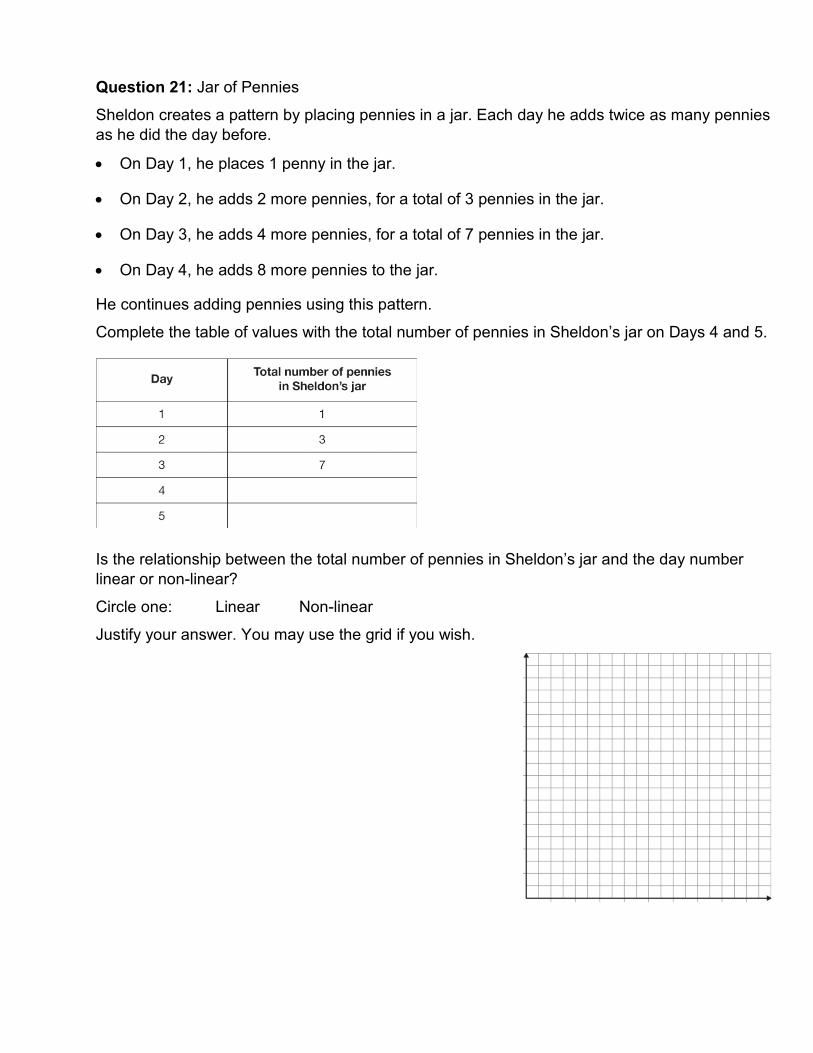
Question 21: Jar of Pennies: ⚪
Sheldon creates a pattern by placing pennies in a jar. Each day he adds twice as many pennies as he did the day before.
• On Day 1, he places 1 penny in the jar. ⚪
• On Day 2, he adds 2 more pennies, for a total of 3 pennies in the jar. ⚪
• On Day 3, he adds 4 more pennies, for a total of 7 pennies in the jar. ⚪
• On Day 4, he adds 8 more pennies to the jar. ⚪
He continues adding pennies using this pattern.
Complete the table of values with the total number of pennies in Sheldon’s jar on Days 4 and 5.
Day and Total number of pennies in Sheldon’s jar. ⚪ Day: 1, ⚪ Total number of pennies in Sheldon’s jar, 1: ⚪ Day: 2, ⚪ Total number of pennies in Sheldon’s jar, 3: ⚪ Day: 3, Total number of pennies in Sheldon’s jar, 7: ⚪ Day: 4, ⚪ Total number of pennies in Sheldon’s jar, [blank space]: ⚪ Day: 5, ⚪ Total number of pennies in Sheldon’s jar, [blank space]: ⚪
Is the relationship between the total number of pennies in Sheldon’s jar and the day number linear or non-linear?
Circle one: ⚪ Linear, ⚪ Non-linear
Justify your answer. You may use the grid if you wish.
The vertical and horizontal axes are drawn on the grid. The axes meet in the bottom left corner of the grid.
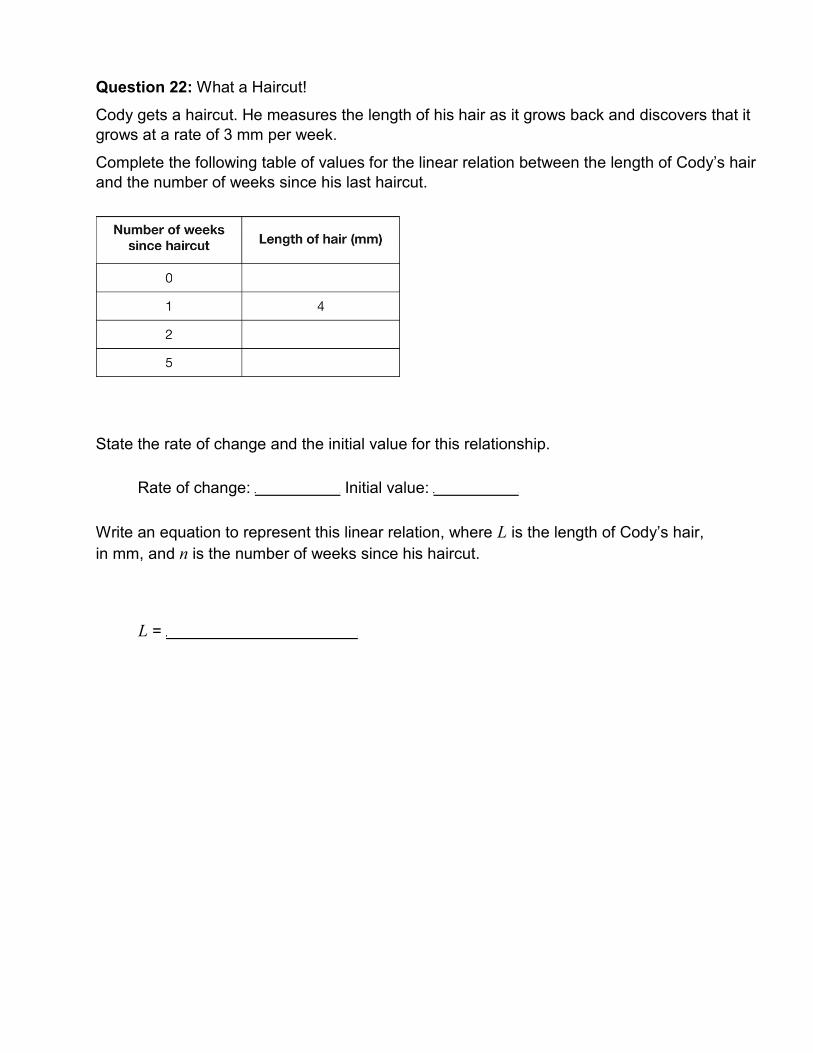
Question 22: What a Haircut! ⚪
Cody gets a haircut. He measures the length of his hair as it grows back and discovers that it grows at a rate of 3 millimetres per week.
Complete the following table of values for the linear relation between the length of Cody’s hair and the number of weeks since his last haircut. ⚪
Number of weeks since haircut, 0: Length of hair, blank: ⚪ Number of weeks since haircut, 1: ⚪ Length of hair, 4 millimetres: ⚪ Number of weeks since haircut, 2: ⚪ Length of hair, blank: ⚪ Number of weeks since haircut, 5: ⚪ Length of hair, blank: ⚪
State the rate of change and the initial value for this relationship. ⚪
Rate of change: [blank space] ⚪ Initial value: [blank space] ⚪
Write an equation to represent this linear relation, where capital L is the length of Cody’s hair, in millimetres, and n is the number of weeks since his haircut.
Capital L = [blank space] ⚪
Question 23: Cellphone Plans: ⚪
A company offers two different cellphone plans.
• Plan A: 17 dollars per month for the cellphone, plus 25 cents per minute for additional talk time
• Plan B: 20 dollars per month for the cellphone, plus 15 cents per minute for additional talk time
• Both plans include 200 minutes of talk time for free.
Determine the difference in total cost between the two cellphone plans for 237 minutes of talk time in one month.
Show your work.
The difference in total cost for 237 minutes of talk time is [blank space] ⚪

Question 24: Picture of a Prism: ⚪
Determine the volume of the rectangular prism pictured below.
Show your work. ⚪
The front face has a height labelled h, and a length labelled 12 centimetres. A diagonal line is drawn on this face from one corner to the opposite corner and it is labelled 15 centimetres. The width of the rectangular based prism is labelled 4 centimetres. ⚪ Hint: Use the Pythagorean Theorem as part of your solution process. ⚪
The volume of the rectangular prism is [blank space] ⚪

Question 25: Delightful Deck: ⚪
Ursula is building a deck. A view of the surface of the deck from above is pictured below.
The two shapes share a side and do not overlap. The bottom shape is a right triangle which is sitting on its base and its height is on the right. ⚪ A right angle is labelled between these sides on the bottom right corner of the triangle. The bottom left corner of the triangle between the base and the hypotenuse is labelled y. ⚪ The shape on top of the right triangle is a Parallelogram. The bottom side of the parallelogram is the hypotenuse of the triangle. The right side of the parallelogram is made by extending the height of the triangle upwards. The angle in the top right corner of the parallelogram is labelled 65 degrees and the angle in the top left corner of the parallelogram is labelled x. ⚪
Complete the chart with the values of x and y. Justify your answers using geometric properties.
Value and Justification using geometric properties: ⚪ Value: x = [blank space], ⚪ Justification using geometric properties, [blank space]: ⚪ Value: y = [blank space], ⚪ Justification using geometric properties, [blank space]: ⚪

Multiple-Choice, question 26 to 31: Question 26: Which rectangle below has the smallest perimeter?
A:
B:
C:
D:

Question 27: Jensen is seeding his lawn. The shape of his lawn is shown in the diagram below.
The rectangle has a base that is labelled 54 metres and a width that is labelled 30 metres. The triangle is joined to the rectangle so that the side of the triangle that is its height, is the width of the rectangle. This side of the triangle is equal in length to the base of the triangle. A right angle is labelled between these two equal sides. ⚪
Each bag of grass seed covers 3 hundred 10 metres squared.
What is the minimum number of bags of seed that Jensen will need to seed his entire lawn?
A: 5: ⚪
B: 6: ⚪
C: 7: ⚪
D: 8: ⚪
Question 28: Tennis balls have a radius of 3. decimal 5 centimetres.
Which of the following is closest to the volume of 2 tennis balls?
A: 88 centimetres cubed: ⚪
B: 1 hundred 80 centimetres cubed: ⚪
C: 3 hundred 59 centimetres cubed: ⚪
D: 1078 centimetres cubed: ⚪
Question 29: The Snack Company sells popcorn in 2 different-sized boxes. Each box is in the shape of a rectangular prism.
• Box A has dimensions 10 centimetres by 20 centimetres by 24 centimetres.
• Box B has dimensions 12 centimetres by 22 centimetres by 20 centimetres.
The price of the popcorn per centimetres cubed is the same for both boxes, and the price of each box is determined by the total volume of popcorn it can hold.
If Box A’s price is 6 dollars and 24 cents, what is the price of Box B?
A: 5 dollars and 67 cents: ⚪
B: 6 dollars and 24 cents: ⚪
C: 6 dollars and 86 cents: ⚪
D: 9 dollars and 62 cents: ⚪
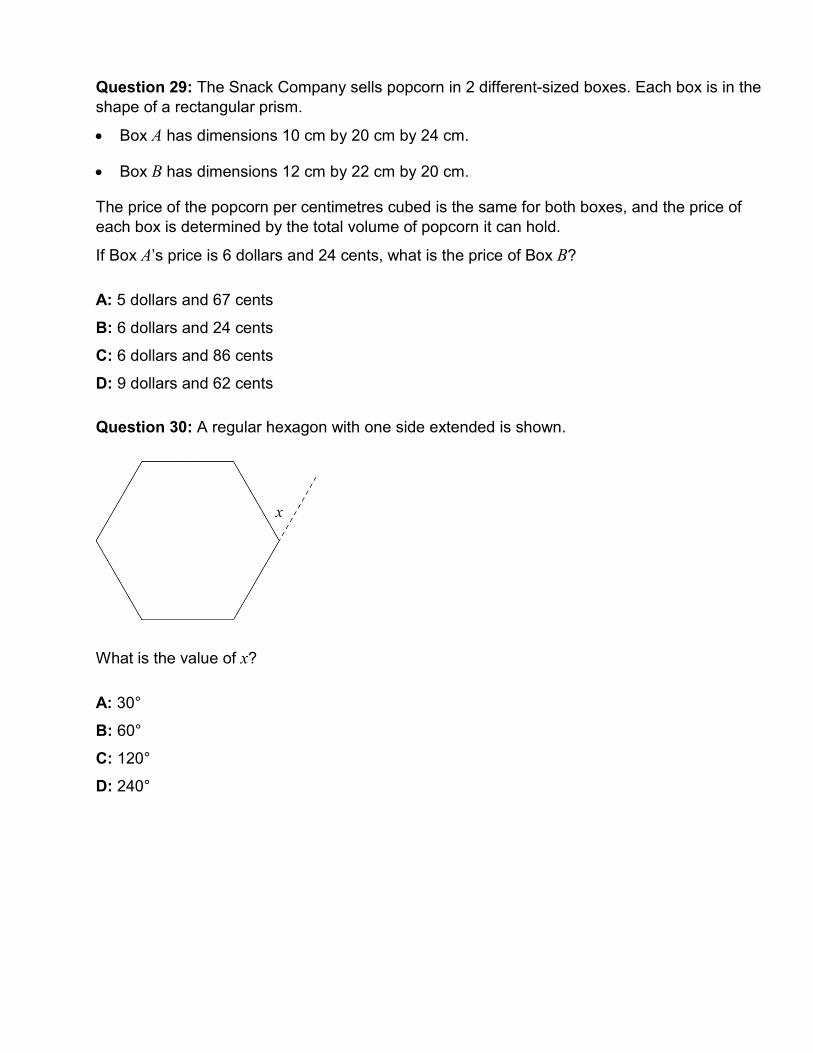
Question 30: A regular hexagon with one side extended is shown.
The side of the hexagon below its right most point is extended up and to the right. The angle between this extended side and the side of the hexagon that is above this right most point is labelled x.
What is the value of x?
A: 30°: ⚪
B: 60°: ⚪
C: 120°: ⚪
D: 240°: ⚪
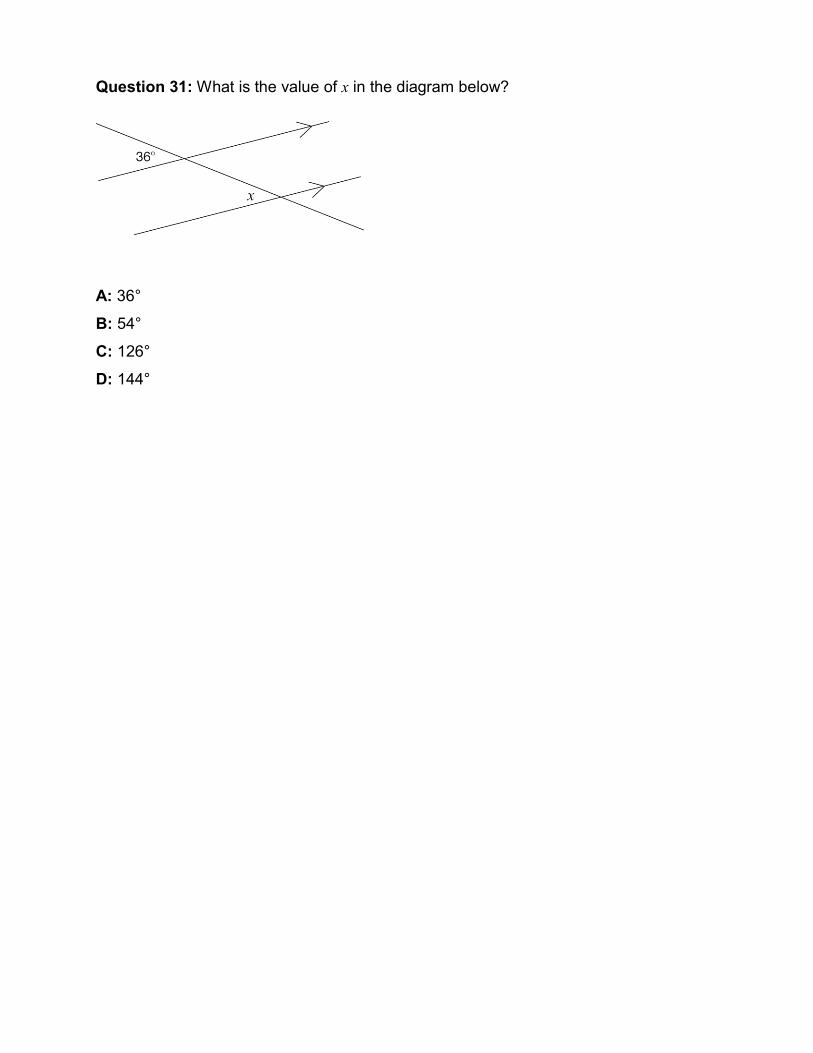
Question 31: What is the value of x in the diagram below?
A third line is drawn, which starts at the top left of the diagram, crosses the parallel lines and ends at the bottom right of the diagram. The angle above the top parallel line and to the left of the third line is labelled 36 degrees. The angle above the bottom parallel line and the left of the third line is labelled x. ⚪
A: 36°: ⚪
B: 54°: ⚪
C: 126°: ⚪
D: 144°: ⚪