release of h2 and organic compounds from metallic and … · 4.2 release of organic compounds from...
TRANSCRIPT

SVENSK KÄRNBRÄNSLEHANTERING AB
SWEDISH NUCLEAR FUEL
AND WASTE MANAGEMENT CO
Box 250, SE-101 24 Stockholm
Phone +46 8 459 84 00
skb.se
SVENSK KÄRNBRÄNSLEHANTERING
Release of H2 and organic compounds from metallic and polymeric materials used to construct stationary borehole equipment
Alexandra Chukharkina
Anders Blom
Karsten Pedersen
Report
R-16-01March 2016

Release of H2 and organic compounds from metallic and polymeric materials used to construct stationary borehole equipment
Alexandra Chukharkina, Anders Blom, Karsten PedersenMicrobial Analytics Sweden AB
ISSN 1402-3091SKB R-16-01ID 1527671
March 2016
Keywords: Bacteria, Borehole equipment, Corrosion, Extraction, Groundwater, H2, KBP4000, Leaching, Metallic materials, Organic materials, Sulphide.
This report concerns a study which was conducted for Svensk Kärnbränslehantering AB (SKB). The conclusions and viewpoints presented in the report are those of the authors. SKB may draw modified conclusions, based on additional literature sources and/or expert opinions.
A pdf version of this document can be downloaded from www.skb.se.
© 2016 Svensk Kärnbränslehantering AB

SKB R-16-01 3
Abstract
High sulphide concentrations have been found in groundwater from boreholes with stationary equip-ment. The only possible process that produces sulphide in groundwater is the reduction of sulphate by species of sulphate reducing bacteria (SRB) using available sources of electron donors and carbon sources. Materials used in borehole equipment may provide electron donors to SRB, in the form of H2 or organic compounds, for sulphide production. To understand if material in stationary borehole equipment releases such compounds to the groundwater, extraction and leaching experiments were performed. The metallic materials used in borehole equipment are steel and aluminium. These metals were exposed to sterilized filtered groundwater in closed vessels under O2-free conditions during several months, at 30 °C and 70 °C and gas analyses were carried out. Five kinds of polymeric materials in borehole equipment were selected and extracted with hexane to get a comprehensive knowledge about compounds that can be released to groundwater. Thereafter leaching experiments were performed in sterile-filtered groundwater under O2-free conditions during 6 months. Solid-phase extraction (SPE) from the groundwater followed by compound analysis using gas chroma-tography with mass spectroscopic detection of released compounds was carried out. Both steel and aluminium released H2, and higher release rates were observed for aluminium samples compared to steel samples. Release of H2 varied from sample to sample and was higher at 70 °C compared to 30 °C. Local corrosion of one aluminium rod sample released very larger amounts of H2 over a rela-tively short time. An array of organic compounds was found in the hexane extracts of the polymeric material. Several of these compounds were also found in the SPE extracts of groundwater leachates and the amounts of the compounds increased with leaching time. It was difficult to create sterile conditions without damaging the materials to be tested especially in the case of organic components being immersed in groundwater for a long time. There was a presence of microorganisms in sample vessels containing polymeric materials after 6 months of leaching in groundwater. The occurrence of microorganisms was accompanied with a decrease in amounts of organic compounds released in water, which suggests that microbiological activity interfered with the experiments. Despite the diffi-culties to keep microorganisms out of the sample vessels, the goal to determine the range of organic compounds that leach from polymeric materials in stationary borehole equipment was satisfactory achieved. The results obtained after the first year of experiments show that the selected methodology was appropriate for reaching the objective of the project which was to determine if any material used to construct borehole equipment can provide enough electron donors to explain the observed sulphide production by SRB. The answer is yes and the objectives of next part of the project will focus on rates and modelling of sulphide production caused by released compounds from stationary borehole equipment.

4 SKB R-16-01
Sammanfattning
Höga sulfidhalter har hittats i grundvatten provtaget i borrhål med fast installerad utrustning. Den enda kända process som bildar sulfid i grundvatten är reduktion av sulfat genom inverkan av olika stammar av SRB (sulfatreducerande bakterier). Denna process kräver tillgång till elektrondonatorer och kolkällor. Komponenter i fast installerad borrhålsutrustning kan bidra med elektrondonation till SRB i form av vätgas eller olika organiska föreningar. För att öka förståelsen för hur material använda i borrhålsutrustning tillför ämnen till grundvatten har extraktioner och lakningsförsök utförts.
De metalliska material som använts i borrhålen är stål och aluminium. Provbitar av dessa material placerades i sterilfiltrerat grundvatten under syrefri atmosfär i slutna kärl under flera månaders tid. Försöket utfördes vid 30 °C och 70 °C och gasfasen i kärlen analyserades vid flera tillfällen. Fem sorters organiska polymermaterial som använts i borrhålen valdes ut och extraherades med hexan för att ge en översikt över total mängd substanser lakningsbara ur materialen. Dessa substanser bedömdes vara potentiellt lakningsbara även till grundvattnet. Lakningsexperiment utfördes sedan under 6 månader i sterilfiltrerat grundvatten och med syrefri miljö. Upparbetning med SPE (Solid Phase Extraction) av grundvattnet följt av analys av extraktet med hjälp av gaskromatografi kopplat till masspektrometri användes för att bestämma lakningsbara substanser.
Både stål och aluminium gav analyserbara halter av vätgas, aluminium gav högre halter än stål under kortare tid. Mängden bildad vätgas varierade från prov till prov men var generellt högre vid 70 °C än vid 30 °C. I ett fall upptäcktes att lokal korrosion på ett aluminiumprov kunde kopplas till en snabb och kraftig ökning av mängden bildad vätgas.
I hexanextrakten från de polymera materialen återfanns ett flertal olika organiska ämnen. Flera av dessa kunde också återfinnas i SPE-extrakt från grundvatten som varit i kontakt med materialen och mängderna ökade över tid. Det uppstod svårigheter med att effektivt sterilisera de polymera materialen då metoder som potentiellt skulle kunna skada materialen undveks. Mikroorganismer detekterades i provkärl innehållande polymera material efter 6 månaders lakningstid i grundvatten. När mikro-organismer detekterades sammanföll detta med att mängden extraherbara organiska ämnen i vattnet avtog. Detta indikerar att mikrobiell aktivitet interfererade med försöket. Trots svårigheterna att undvika påverkan av mikroorganismer kan målet att bevisa lakbarhet av organiska substanser från polymera material till grundvatten anses uppfyllt. Resultaten som erhölls efter det första årets försök visar på metodernas lämplighet för att undersöka om materialen använda i borrhålsutrustningen kan bidra som elektrondonatorer till observerad sulfidproduktion från SRB. Detta är fallet och kommande delar av projektet kommer att fokusera på hastigheten med vilken sulfid bildas och modellering av hur lakningsbara komponenter påverkar processen.

SKB R-16-01 5
Contents
1 Introduction 7
2 Material and Methods 92.1 Release of H2 from metallic materials 9
2.1.1 Sources of metallic materials from stationary borehole equipment 92.1.2 Preparation of experiments with metallic materials 92.1.3 Analysis of H2 and dissolved metals 122.1.4 Calculations of released gas 12
2.2 Release of organic compounds from polymeric materials 132.2.1 Sources of polymeric materials from stationary borehole equipment 132.2.2 Preparation of experiments with polymeric materials 132.2.3 Extraction of leachates from groundwater and component analysis 15
2.3 Total number of cells 16
3 Results 173.1 Release of H2 from metallic materials 17
3.1.1 Release of H2 from stainless steel rods 173.1.2 Release of H2 from aluminium rods 19
3.2 Release of organic compounds from polymeric materials 223.2.1 Polyamide tubes 223.2.2 PVC tape 233.2.3 High density polyethylene dummy material 233.2.4 Polyurethane packer Slitan 90A-05 253.2.5 Polyurethane packer Slitan 80A-71 26
4 Discussion 294.1 H2 release from metallic materials 29
4.1.1 Choice of method 294.1.2 Sources of H2 in the vessels 294.1.3 Modelling sulphide production from the observed H2 release 304.1.4 Release of iron and aluminium 31
4.2 Release of organic compounds from polymeric materials 314.2.1 Choice of approach to component analysis 314.2.2 Release of organic compounds 34
5 Conclusions 37
References 39
Appendix A 41

6 SKB R-16-01
Abbreviations used in the report
Abbreviation Meaning
SRB Sulphate reducing bacteriaGC Gas chromatographySPE Solid phase extractionHPLC-DAD High-performance liquid chromatography with diode-array detectionGC-MS Gas chromatography-mass spectrometrySF-groundwater sterile-filtered groundwaterPDHID Pulsed discharge helium ionization detectorTCD Thermal conductivity detector ICP-OES Inductively Coupled Plasma Optical Emission SpectrometryICP-MS Inductively Coupled Plasma Mass SpectrometryPA Polyamide PVC Polyvinyl chloride PEHD High density polyethylene PU PolyurethaneAGW Analytical grade water HRP Hydrophilic reversed phaseTNC Total number of cells AODC Acridine orange direct count DEHP Di-ethylhexyl phthalate DIDP Di-iso-decyl phthalateDINP Di-iso-nonyl phthalateMIC Microbially induced corrosion

SKB R-16-01 7
1 Introduction
While the presence, numbers and diversity of sulphate reducing bacteria (SRB) in deep groundwater have been well documented, their activity is less well studied. There are Scandinavian cases when sulphide concentrations in groundwater exceed the safety case value of 5 µM sulphide used for Forsmark, Sweden (see SKB 2011, Section 12.6.2) almost 1000 times. Extreme values of 3 mM sulphide was observed in drillholes at Äspö Hard Rock laboratory (HRL) (Rosdahl et al. 2011) and the underlying reasons for this accumulation are not yet fully understood (Drake et al. 2014). Hence, a remaining key issue for the safety case is to identify the factors controlling the rate of sulphide production in the geosphere, including man-made artefacts. Availability of electron donors, such as the H2 and CH4 from deep geological sources, and electron acceptors such as sulphate and ferric iron is hypothesized to be one of several controlling factors. The extremely high sulphide concentrations have been observed in borehole sections left unattended for a while, i.e. when no samples have been withdrawn for several months or years (Rosdahl et al. 2011). Chemical reduction of sulphate to hydrogen sulphide at temperatures and pressures prevailing in deep groundwater environment is shown to be extremely slow (Cross et al. 2004), and the only possible explanation to sulphide production is sulphate reduction by strains of SRB. The SRB use the S atom in the sulphate molecule as an electron-acceptor and the reduced product is hydrogen sulphide. For this microbial process, an electron donor is needed, for example, organic compounds or H2. One possible source of these compounds can be the materials used to construct borehole equipment. The outcome of previous investigations was ambiguous with no clear indication of the origin of the electron donors needed for microbial sulphide production from sulphate (Drake et al. 2014, Rosdahl et al. 2011). A systematic study in the laboratory was, therefore, requested to investigate the possibility that materials in sta-tionary borehole equipment can trigger sulphide production by supplying SRB with electron donors.
The metallic parts of stationary borehole instrumentation are stainless steel and aluminium (see Rosdahl et al. 2011, Table 3-1) that may corrode in O2-free groundwater under the evolution of H2 according to (Equations 1-1 and 1-2).
2Al0 + 6H2O → 2Al3+ + 3H2 + 6OH− (Equation 1-1)
2Fe0 + 6H2O → 2Fe3+ + 3H2 + 6OH− (Equation 1-2)
Installation parts in boreholes made of these metals can consequently release H2 to the groundwater, especially if galvanic cells are present. H2 is a preferred energy source for many microorganisms such as SRB and methanogens, so it is consumed rapidly if these microorganisms are active. It was shown previously that H2 was rapidly consumed by SRB in deep groundwater at concentrations above 1 µM (Pedersen 2012). H2 from corroding metallic borehole equipment may consequently act as an electron donor to sulphate reduction according to (Equation 1-3).
SO42– + 4H2 → S2– + 4H2O (Equation 1-3)
It is known that polymeric materials contain compounds that can be released into water. Additives such as plasticizers, stabilizing agents and if present, dyes or flame retardants are not covalently bonded into the main frame of the polymer. They can be described as dissolved in a very viscous liquid and can be released from the surface of the polymeric material into surrounding water. The kinetics of such release are dependent on several factors including salinity and temperature of the water. Since products used in the instrumentation of boreholes usually are identified as brand names without information on exact composition there is a lack of knowledge on the extent of compounds that can be released into the borehole water and function as electron and carbon donors to SRB.
The general objective of the study was to determine if any material used to construct borehole equipment can provide enough electron donors to explain the observed sulphide production by SRB. According to the project plan, the laboratory study should be divided in two parts, where the first part investigates release of organic compounds and H2 from borehole equipment under sterile condi-tions. The second part will involve the presence of the bacteria. This report describes the first part.

8 SKB R-16-01
The performed work investigated:
• If metallic parts of stationary borehole equipment release H2 when placed in sterile-filtered groundwater.
• If organic compounds are released to sterile-filtered groundwater from polymeric parts of stationary borehole equipment and the composition and structure of released compounds.
H2 release was investigated using butyl rubber stoppered glass tubes for incubation. Analysis was per-formed using gas chromatography (GC). The procedure adopted a methodology developed for analysis of H2 release from copper under O2-free conditions (Bengtsson et al. 2013, Johansson et al. 2015).
Analysis of organic components was performed in two steps. Firstly, extraction was done using vigorous conditions to an organic solvent indicating all possible extractable compounds. The poly-meric materials were consequently extracted using heat and a non-polar solvent to determine poten-tial additives that could be released to water. If possible the extracted compounds were identified. Secondly, a leaching was performed using sterile groundwater to assess release of compounds from polymeric materials at conditions prevailing in boreholes equipped with stationary instrumentation. The water solutions were analysed for organic compounds using a work-up procedure based on solid phase extraction (SPE) to concentrate the compounds followed by analysis with gas chromatography-mass spectrometry (GC-MS).

SKB R-16-01 9
2 Material and Methods
Detailed descriptions of typical stationary borehole instrumentation can be found in Chapter 3 of the SKB report P-10-18 (Rosdahl et al. 2011). All polymeric and metallic materials were provided by Geosigma AB.
2.1 Release of H2 from metallic materials2.1.1 Sources of metallic materials from stationary borehole equipmentTwo metallic materials used in borehole equipment were investigated. Aluminium rods with 16 mm diameter are used as anchor rods for the packers. For the tests only the mid parts of the rods were used since the attached threaded connectors in the ends of the rods were reported to be made of stainless steel. Stainless steel (316L) rods with 16 mm diameter are alternatively used as anchor rod for packers. The metallic rods had several different suppliers and specific identification information was not provided by Geosigma.
2.1.2 Preparation of experiments with metallic materialsThe preparation procedures adopted a methodology developed for analysis of H2 release from copper under O2-free conditions (Bengtsson et al. 2013, Johansson et al. 2015).
Preparation of the sterile-filtered groundwaterTo mimic the conditions on location in the drilled holes it was necessary to use water of similar ionic strength, alkalinity, pH and content of dissolved organic carbon. At the beginning of the project it was briefly suggested that the water should be made up artificially from high-purity chemicals and laboratory grade water. However, this idea was abandoned in favour of using sterile-filtered (SF) groundwater collected from boreholes in Forsmark known to experience problems with elevated sul-phide concentrations. By using natural groundwater all dissolved components, including the minor ones, would be present in correct ratios. It was decided to sterile-filter instead of heat-treating the water (autoclaving) since changes in temperature might cause precipitation in high-ionic strength groundwater.
The water was collected on-site from the borehole KFM03A:4 in Forsmark in sterile polycarbonate containers and immediately sent refrigerated to Microbial Analytics Sweden AB in Mölnlycke. The chemical composition of the groundwater is presented in Table A-1. The sampled section was between 633.5 and 650 m borehole length ant at a depth of –631 m above sea level (masl). This section was analysed for microorganisms in 2004 and SRB were found (Pedersen and Kalmus 2004).
The SF-groundwater (0.2 µm pore size) was prepared using a screw-on sterile filter unit (Sarstedt Filtropur BT50 83.1823.101) connected to a sterile Duran 1000 ml glass bottle. The unit was con-nected to a water aspirator and the water was suction-filtrated into the sterile bottle.
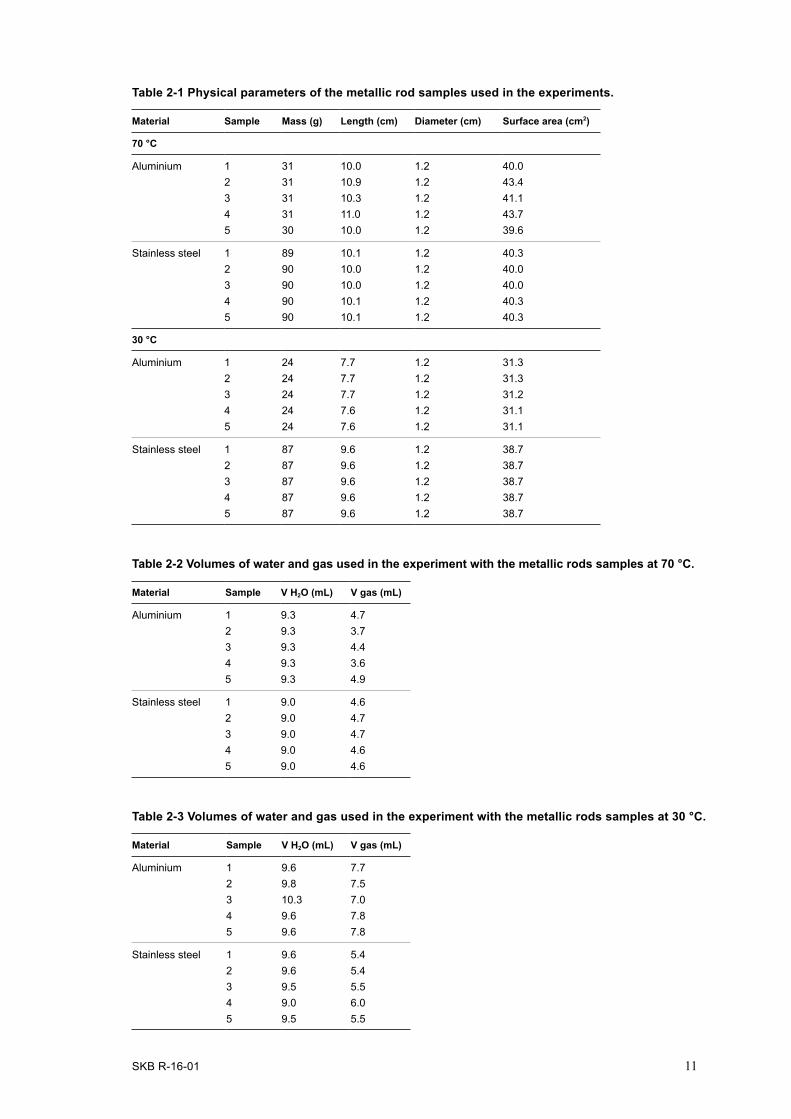
Preparation of the metallic rod samplesThe supplied steel and aluminium rods were too large in diameter to fit the 26 mL gas tight, anaerobic borosilicate experimental tubes (Product #2048-18150, Bellco Glass Inc., NJ, USA) with matching impermeable butyl rubber stoppers (Product #2048-117800) used for the experiments. They were, therefor, machined to a diameter of 12 mm and a length of approximately 100 mm and the surface was polished. This treatment removed surface oxides and after machining, the samples were kept dry to avoid formation of new oxides. Five replicates of aluminium and stainless steel rods, respectively, were prepared (Figure 2-1). Parameters of the rod samples are presented in Table 2-1. Five blank samples without metallic rods were prepared as well using the same water, vessels and stoppers as was used for metallic rods. Blank samples were treated in exactly the same way as samples contain-ing metal parts.

10 SKB R-16-01
Before placing the metallic rods in the sterile glass vessels the samples were sterilized by immersion in 95 % ethanol (Solveco art.nr 1394, Rosersberg, Sweden). The preparation was done inside an anaerobic glovebox (COY Laboratory Products, Grass Lake, MI, USA) and the metallic rods as well as the glass vessels and the rubber stoppers were kept in this environment for days to minimize the amount of O2 possibly trapped on surfaces. Inside the box the metallic rods were removed from the ethanol bath with plastic tweezers, briefly dried and carefully placed inside the glass vessels. The vessels were closed with Bellco butyl rubber stoppers and removed from the anaerobic glovebox. Outside the box the stopper was secured in place with a crimped-on aluminium ring (Cromacol 20-ACB, Thermo Scientific, Langerwehe, Germany). The closed vessels were evacuated and refilled with pure N2 (Alphagaz1 N2, klass 2, Air Liquide) to a total pressure of 1.30 bar using a gas bench.
The SF-groundwater was poured into a sterile glass Erlenmayer flask and closed with a sterilized lid fitted with PEEK tubes, one of them extending into the fluid. Pure 0.2 µm filtrated N2 was added to this tube to purge the water from dissolved O2 and to fill the flask volume above the fluid surface with an inert atmosphere. Purging was performed for half an hour and then the flask was sealed, creating an overpressure inside. After that the glass vessels with metallic rods were filled with O2-free SF-groundwater to a level leaving the metal rod completely submerged. The exact volumes of water at the first test (70 °C) were 9.3 mL and 9.0 mL for aluminium and steel samples, respectively (Table 2-2). The exact volumes of water at the second test (30 °C) are shown in Table 2-3. After filling, the vessels were evacuated and refilled with N2 to a total pressure of 2 bars in the gas bench.
Experimental conditionsThe experiments were performed in two rounds at two different temperatures. The first round was incubated at 70 °C and the second round was incubated at 30 °C. All vessels were analyzed for content of O2 and H2 at the start of the experiments. Thereafter, they were enclosed in bubble plastic wrap and placed in an anaerobic jar that was evacuated and refilled with pure N2 to a total pressure of 1.2 bar yielding an O2-free atmosphere. The samples were stored at elevated temperature in a heated cabinet (Binder FD53, Skafte Medlab, Onsala, Sweden) at 70 °C during the first test and at 30 °C during the second test.
Figure 2‑1. Metallic rods contained in glass vessel with O2-free sterile filtered groundwater. Left, stainless steel; right, aluminium.
SKB R-16-01 11
Table 2-1 Physical parameters of the metallic rod samples used in the experiments.
Material Sample Mass (g) Length (cm) Diameter (cm) Surface area (cm2)
70 °C
Aluminium 1 31 10.0 1.2 40.02 31 10.9 1.2 43.43 31 10.3 1.2 41.14 31 11.0 1.2 43.75 30 10.0 1.2 39.6
Stainless steel 1 89 10.1 1.2 40.32 90 10.0 1.2 40.03 90 10.0 1.2 40.04 90 10.1 1.2 40.35 90 10.1 1.2 40.3
30 °C
Aluminium 1 24 7.7 1.2 31.32 24 7.7 1.2 31.33 24 7.7 1.2 31.24 24 7.6 1.2 31.15 24 7.6 1.2 31.1
Stainless steel 1 87 9.6 1.2 38.72 87 9.6 1.2 38.73 87 9.6 1.2 38.74 87 9.6 1.2 38.75 87 9.6 1.2 38.7
Table 2-2 Volumes of water and gas used in the experiment with the metallic rods samples at 70 °C.
Material Sample V H2O (mL) V gas (mL)
Aluminium 1 9.3 4.72 9.3 3.73 9.3 4.44 9.3 3.65 9.3 4.9
Stainless steel 1 9.0 4.62 9.0 4.73 9.0 4.74 9.0 4.65 9.0 4.6
Table 2-3 Volumes of water and gas used in the experiment with the metallic rods samples at 30 °C.
Material Sample V H2O (mL) V gas (mL)
Aluminium 1 9.6 7.72 9.8 7.53 10.3 7.04 9.6 7.85 9.6 7.8
Stainless steel 1 9.6 5.42 9.6 5.43 9.5 5.54 9.0 6.05 9.5 5.5

12 SKB R-16-01
2.1.3 Analysis of H2 and dissolved metalsAnalysis of H2 and O2 was performed using two different gas chromatograph systems. One system was based on a Bruker 450 gas chromatograph (Bruker Daltonics, Fremont, California) equipped with an PDHID detector (Valco Instruments Company, Inc. (VICI) Houston, TX 77055, USA), a carrier gas purifier system using a heated getter and a parallel two-column setup of CP7355 PoraBOND Q (50 m × 0.53 mm, ID) and a CP7536 MOLSIEVE 5A PLOT (25 m × 0.32 mm, ID). H2 was also analysed on DANI Master GC using MXT-Molsieve 5A Plot 30 m x 0.53 mm × 50 µm and OPT 270M – MICRO thermal conductivity detector (TCD) system, using He as carrier gas. All chromatographs were calibrated using certified gas mixes that mimic the gas composition of the analysed samples.
At each gas sampling occasion one vessel each containing aluminium and stainless steel rods, respectively, were opened and the water was transferred to a clean centrifuge tube (Sarstedt, 15 ml, sterile with mounted lid). At selected sampling occasions a blank sample was collected at the same time. The water samples were preserved by addition of nitric acid (Nitric acid 67 %, NORMATOM for trace metal analysis, Prolabo, VWR) to a final content of 1 % and stored dark at room temperature until analysis. The water samples were analysed by ALS Scandinavia using ICP-OES and ICP-MS according to SOP’s based on EPA 200.7 and 200.8 respectively. The analysis was accredited accord-ing to ISO 17025 by SWEDAC.
2.1.4 Calculations of released gasGas chromatographs were calibrated with varying volumes of H2 and O2 and the output from the GC consequently were volumes of the respective analyzed gas per injected volume of sample. This report shows gas data as mbar of the analyzed H2 as in the vial gas phase and as nmol per metal surface. The combined gas law was used for calculating these values where
P × V = n × R × TP = Pressure (Pa)V = Volume (m3)n = Amount of gas (mol) R = gas constant = 8.31 (J mol–1 K–1)T = Temperature (K)
The amounts of analyzed gases per volume of sample (nmol mL–1) at ambient room pressure and temperature were calculated where
n/V1 = P1 / (R × T) = (V1/V2×P2) / (R × T) = mol m–3 mol m–3 = 1000 nmol mL–1
n = Amount of gas in sample (mol) V1 = analyzed amount of H2 in sample (m3)V2 = volume injected sample (m3)P1 = Analyzed sample pressure (Pa)P2 = Pressure in analysis room (Pa)R = gas constant (J mol–1 K–1)T = Temperature in analysis room (K)
Second, the total amounts of the analyzed gases in the vial (nmol per vial) were calculated where nmol in vial = nmol mL–1 × V3 × P3 V3 = Volume gas in vial (m3)P3 = Pressure in vial after sampling (Pa)

SKB R-16-01 13
Finally, the partial pressures (mbar) of the analyzed gases in the vial were calculated using Dalton’s law of partial pressures where
P4/P3 = V1/V2
P4 = V1/V2 × P3
P4 = Partial pressure of analyzed gas in vial (Pa)Recalculating Pa to mbarP4/100 = P5
P5 = Partial pressure of analyzed gas in vial (mbar)
As the metallic rods were shaped as cylinders, the surfaces were calculated according to the following equation:
S = 2 × π × R (R + l)/100S = Surface (cm2)R = Radius of the rod (mm)l = Length of the rod (mm)
The amounts of analyzed gases per rod surface (nmol cm–2) at ambient room pressure and temperature were calculated as follows:
n1 = P4×V3 / R × T n1 = amount of H2 in vial (mol)A = n1/S × 109
A = nmol of H2 per cm2
2.2 Release of organic compounds from polymeric materials2.2.1 Sources of polymeric materials from stationary borehole equipmentFour different polymeric materials used to construct five different parts of the borehole equipment were selected for this study:
• Polyamide (PA) tubes are used for water sampling, circulation and inflation of the packers. This tubing is produced by Munkplast AB without any specified identification.
• Black polyvinyl chloride (PVC) tape, Nitto 225; normally used for insulation of electrical conduits, but here used in the borehole installations for general attachment purposes and fixation of tubing.
• High density polyethylene (PEHD) constitute the polymeric dummy used to reduce the internal volume of borehole sections, a white polyethylene HD-1000 produced by PEGES, article nr. GS2147.
• Polyurethane is used in two parts of the equipment. - Rubber gasket for packers made of yellow tinted polyurethane, produced by UW Elast with
identification name Slitan 80A-71.- Rubber gasket for packers made of slightly yellowish polyurethane, produced by UW Elast
with identification Slitan 90A-05.
2.2.2 Preparation of experiments with polymeric materialsInformation about leachable compounds from polymeric materials is usually not obtainable from the producers, unless the product is intended for medical use or food production and storage. For the materials used in stationary borehole equipment, specifications of composition were not available and in some cases (e.g. the PVC tape) the final product consists of multiple polymeric materials such as resins as well as glue. To narrow down the spectra of possible leachable compounds the tests were started with a fingerprinting of compounds that could be extracted from the polymeric materials using the strong organic solvent hexane.

14 SKB R-16-01
Extraction with hexane and component analysisThe polymeric materials were cut into small pieces with scissors and a knife, apart from the PE dummy that was ground to achieve small flakes. The materials were extracted using a Soxhlet setup using 80 mL hexane (VWR Prolabo Pestinorm for GC-MS analysis). Hexane was refluxed for four hours with a cycle time of approximately 15 minutes. The obtained extracts were analysed on GC-MS (Varian CP 3800 GC and Varian Saturn 2000 MS, Varian Inc. Palo Alto, California USA) using EI-ionization and splitless injection. The analytical column used was an OPTIMA MN-5 phase 30 m × 0.25 × 0.25 (Macherey-Nagel GmbH & Co, Düren, Germany) and the temperature was pro-grammed from 35 to 300 °C using a constant He carrier gas flow of 1 ml/min. Spectra were obtained in the range 35−400 amu and were background corrected before identification using a NIST/EPA/NIH Mass Spectral Library (NIST 98) and NIST Mass Spectral Search Program version 1.6. The whole process was controlled using Star Chromatography Software version 6 for GC-MS (Varian AB). Samples were injected using a Combi PAL autosampler (CTC Analytics AG, Zwingen, Switzerland) and the injected volume was 1 µl.
Figure 2‑2. Finley disintegrated polymeric materials used to construct five different parts of the borehole equipment that were selected for this study. PU, polyurethane; PVC, polyvinylchloride; PEHD, High density polyethylene; PA, polyamide.
PA PEHD
PVC PU: Slitan 90A05 PU: Slitan 80A-71
Table 2-4 Masses of the samples of polymeric material used in the leaching experiment.
Sample Subsample Analysis day Mass (g)
PA 1 28 6.12 98 6.13 182 6.1
PVC 1 28 5.02 98 5.03 182 5.0
PEHD 1 28 2.52 98 2.53 182 2.5
PU: Slitan 90A-05 1 28 10.02 98 10.03 182 10.0
PU: Slitan 80A-71 1 28 10.02 98 10.03 182 9.5

SKB R-16-01 15
Leaching with groundwater For the leaching experiments into water the polymeric materials were sterilized by rinsing in 70 % ethanol (Solveco, Rosersberg, Sweden). After that the materials were weighted and added to a 300 mL sterile serum bottle that was closed by a sterile rubber lid and a threaded aluminium ring. The closed bottles were evacuated using a gas bench to remove O2 inside the bottles and they were refilled with pure N2. Control bottles containing SF-groundwater without polymeric material were prepared in the same manner and subsequently treated in exactly the same way as the polymeric material samples. The parameters of the final samples are presented in Table 2-4. SF-water was prepared and added from a sterile Erlenmayer flask in the same way as was done for the metallic materials. The serum flasks were filled with 150 ml O2-free SF-groundwater. After filling the vessels were evacuated and refilled with N2 to a total pressure of 1.3 bar in the gas bench.
Great care was taken throughout the experiment to avoid contact between the rubber lid of the flasks and the SF-groundwater inside. The flasks were stored standing at room temperature in a dark room. They were swirled from time to time since some of the polymeric materials were floating causing a limited contact with the water.
2.2.3 Extraction of leachates from groundwater and component analysisWhen sampling the water for released organic compounds an approach using SPE was chosen to improve detection limits. Two different SPE-cartridges were used for extraction: HR-P, a wide range more polar polymer and C18-hydra, a non-polar phase (Macherey-Nagel GmbH & Co, Düren, Germany). SPE cartridges were activated by rinsing with 5 ml methanol (Labsolute for HPLC, TH Geyer, Germany) followed by 5 ml distilled water to remove the methanol. Samples with a volume of 50 ml were collected anaerobically from the serum flasks using a 60 ml syringe (HSW, Norm-Ject without rubber seal) and a syringe pushed through the rubber stopper. The total volume of the sample was forced through the cartridge using a combination of applied pressure on the syringe and sucction on the collecting side generated with the help of a hand pump or water aspiration. The flow rate was
Figure 2‑3. Release experiments with polymeric materials used to construct stationary borehole equipment in groundwater. Upper left, high density polyethylene; lower left, polyuretan Slitan 80A-71; upper right polyamide tubing; lower right, PVC tape.

16 SKB R-16-01
kept at around one drop per second. To dry the packing material air was forced through the cartridge using the same 60 ml-syringe used for collecting the sample. Between 4 and 5 syringe volumes of air were used causing a spray of water out of the SPE-cartridge. After drying the cartridge was eluted with 2 ml of hexane or methanol down into a GC-vial, in the case of C18 hydra and HRP cartridges respectively. For elution all-glass syringes (HSW, Germany) were used to minimize leaching from the syringe to the solvent. Blank samples of analytical grade water (AGW) were extracted and eluted in exactly the same way. Vials were kept refrigerated until analysis. Samples of pure solvent (hexane and methanol respectively) were also analyzed to trace possible contaminations and the sequence of analysis on the GC-MS was chosen keeping expected levels of analytes in mind. In general, the sequence went from lower to higher concentrations with multiple blank runs on pure solvent through-out the sequence. Repeated analysis of the pure SF-water extraction on SPE was used to monitor the GC-MS system integrity through the analytical run that usually was in the magnitude of 18–24 hours for each sampling occasion. Collected spectra from the chromatograms were compared with a NIST library for identification. In some cases no good library match could be obtained and in those cases a qualitative judgement made on the basis of the most characteristic ions, the qualifier ions, was made indicating the general compound class or similarities between different unidentified peaks. Qualifier ions usually originate from functional groups in the organics structure.
The obtained results for the blank samples were subtracted from the results from the samples with polymeric materials. In practice results of blank extractions were in the form of new peaks in the chromatogram not overlapping with analytes of interest so these peaks could be completely omitted without working out concentration ratios. One of these peaks was chosen as internal standard to correct for varying volumes of elution solvent. Since the origin presumably was the packing material this approach could not take into account varying volumes of sample water, but accuracy achieved from the scale on the syringes was judged as sufficient.
2.3 Total number of cellsThe total number of cells (TNC) mL–1 was determined using the acridine orange direct count (AODC) method as devised by Hobbie et al. (1977) and modified by Pedersen and Ekendahl (1990). A detailed description of this method with advantages and disadvantages is given in Pedersen et al. (2014).

SKB R-16-01 17
3 Results
3.1 Release of H2 from metallic materials3.1.1 Release of H2 from stainless steel rodsExposure at 70 °CThe stainless steel rods from the borehole equipment were examined for the extent of H2 release during immersion in SF-groundwater. The experiments at 70 °C were carried out for 154 days. Gas analyses were performed after 0, 17, 35, 67, 99 and 154 days of the experiment. After each analysis one rod was removed for water analysis, causing the gas series to be truncated. The H2 release from the steel rods is presented as increase in partial pressure of H2 in the gas phase of the vessels in comparison with control samples (Figure 3-1). Steel rods that was exposed to SF-groundwater at 70 °C showed a notable release of H2. The partial pressure of H2 increased rapidly in the gas phase of all vessels during the first one to two months of the experiment. Sample vessel S4 showed lower partial pressures than the other 4 sample vessels, but the tendency was similar as for other samples. Sample S5 showed the highest partial pressure of H2 on day 67 (7 mbar) which had decreased by day 99 to approximately 5 mbar where it is stabilised for the remaining time of the experiment. The results are recalculated to released H2 per cm2 of steel rod surface in Figure 3-2.
Exposure at 30 °CThe experiments at 30 °C were carried out for 140 days. Gas analyses were performed after 0, 8, 22, 43, 71, 113 and 140 days of the experiment. Exposure of the steel samples at 30 °C showed an increase in the partial pressure of H2 in the gas phase (Figure 3-3). Similar with the experiment at 70 °C, the gas release was more intensive during the first 30–40 days but the values varied from sample vessel to sample vessel. The rates of the observed H2
release were lower at 30 °C in com parison with the 70 °C, experiment. Figure 3-4 shows the result obtained for the steel rods per cm2 metal surface.
Metal analysis of water samples from vessels with steel rodsAll water samples were analyzed for metal content after incubation at 17, 35, 67, 99 and 154 days in 70 °C. Control samples at 30 °C were analyzed after 17, 67 and 154 days and showed no presence of Fe. The water from the rod sample vessels incubated at 30 °C was analyzed for metal content after 22, 43, 71, 113 and 140 days. Control samples at 30 °C were analyzed after 22, 71 and 149 days and showed no presence of Fe. The full results for 70 °C and 30 °C samples can be found in Table A-2 and Table A-3. The results showed that amounts of Fe in the water samples from vessels with the steel rods were of the same magnitude at 30 °C as at 70 °C (Figure 3-5).
Figure 3‑1. H2 release from the steel rods immersed in sterile filtered groundwater to the gas phase of the vessels at 70 °C. S1 to S5 represent discrete steel samples according to Table 2-1. K1 to K5 represent control vessels without steel rods.
0 20 40 60 80 100 120 140 160 180
Time (Days)
0
2
4
6
8
10
H2 (
mba
r)
S1 S2 S3 S4 S5 K1 K2 K3 K4 K5

18 SKB R-16-01
Figure 3‑3. H2 release from the steel rods immersed in sterile filtered groundwater to the gas phase of the vessels at 30 °C. S1* to S5* represent discrete steel samples according to Table 2-1. K1* to K5* represent control vessels without steel rods.
0 20 40 60 80 100 120 140 160 180
Time (Days)
0
2
4
6
8
10
H2 (
mba
r)
S1* S2* S3* S4* S5* K1* K2* K3* K4* K5*
Figure 3‑4. H2 release from the steel rods immersed in sterile filtered groundwater at 30 °C per cm2 of rod surface. S1* to S5* represent discrete steel samples according to Table 2-1.
Figure 3‑2. H2 release from the steel rods immersed in sterile filtered groundwater at 70 °C per cm2 of rod surface. S1 to S5 represent discrete steel samples according to Table 2-1.
0 20 40 60 80 100 120 140 160 180Time (Days)
0
10
20
30
40
50H
2 (nm
ol/c
m2 )
S1 S2 S3 S4 S5
0 20 40 60 80 100 120 140 160 180Time (Days)
0
10
20
30
40
50
H2 (
nmol
/cm
2 )
S1* S2* S3* S4* S5*

SKB R-16-01 19
3.1.2 Release of H2 from aluminium rodsExposure at 70 °CAll samples showed markedly higher H2 release compared to the experiments with steel rods (Figure 3-6). The partial pressure of H2 varied a lot between samples. The partial pressure of H2
increased dramatically from day 17 to day 35 in sample vessel A4 to 1 bar and the total pressure reached 2.5 bar. To avoid an explosion of the tube du to this overpressure that rapidly approached the safety pressure limit of 3 bars, the vessel was vented with a needle and the pressure decreased to 1.15 bar. After depressurization the partial pressure of H2 was decreased to 0.4 bar which still was much higher than observed in any of the other four vessels with aluminium rods. Sample vessel A5 showed a noticeable increase of H2 partial pressure by day 67 (187 mbar), after that it continued to decrease. The results are recalculated to released H2 per cm2 of aluminium rod surface as shown in Figure 3-7. After sampling of water for metal analysis, the A4 aluminium rod was removed from the tube and corrosion damage was observed that had developed during the experiment (Figure 3-8).
Figure 3‑5. Amounts of iron (Fe) in water samples from vessels with the steel rods incubated at 30 ° or 70 °C.
0 20 40 60 80 100 120 140 160 180Time (Days)
0
200
400
600
800
1000
H2 (
mba
r)
A1 A2 A3 A4 A5 K1 K2 K3 K4 K5
Figure 3‑6. H2 release from the aluminium rods immersed in sterile filtered groundwater to the gas phase of the vessels at 70 °C. A1 to A5 represent discrete aluminium samples according to Table 2-1. K1 to K5 represent control vessels without aluminium rods.
17 22 35 43 67 71 99 113 140 154
Time (Days)
2.0
2.5
3.0
3.5
4.0
4.5
5.0
5.5
Fe (m
g/L)
70oC 30oC

20 SKB R-16-01
Exposure at 30 °C Aluminium rods in SF-groundwater exposed at 30 °C showed a significant release of H2, although much lower than at 70 °C. The generated partial pressures were in general higher in aluminium vessels than what was observed in the steel vessels and the partial pressures varied more between the samples. The release of H2 was intensive in the first 20 days of the experiment after which the release rate decreased but it did not level out as observed for the steel vessels. Sample vessel A3 and particularly sample vessel A5 showed a clear increasing trend in partial pressure of H2 throughout the experimental time. The highest value was observed in sample A5 at day 140 (9 mbar). The results are recalculated to released H2 per cm2 of aluminium rod surface as shown in Figure 3-10. The sample A4 showed the lowest values during the experiment and showed no H2 at all by day 113. When the tube was opened at day 113, a distinct smell of H2S was noticed. The water from the sample tube was analysed for TNC and microorganisms were observed.
Figure 3‑7. H2 release from the aluminium rods immersed in sterile filtered groundwater at 70 °C per cm2 of rod surface. A1 to A5 represent discrete aluminium samples according to Table 2-1.
Figure 3‑8. A corrosion damage on the A4 aluminium rod.
0 20 40 60 80 100 120 140 160 180
Time (Days)
0
500
1000
1500
2000
2500
3000
3500
4000H
2 (nm
ol/c
m2 )
A1 A2 A3 A4 A5

SKB R-16-01 21
Water analysis of samples with aluminium rodsAll water samples were analysed for metal content according to the same schedule as for the water from steel vessels: after 17, 35, 67, 99 and 154 days from the start of the experiment for vessels incu-bated at 70 °C and by 22, 43, 71, 113 and 140 days for vessels incubated at 30 °C. The full results for 70 °C and 30 °C samples can be found in Table A-2 and Table A-3. The results showed that the amount of aluminium in water samples from the aluminium rod vessels generally were higher in vessels exposed to 70 °C compared to vessels exposed to 30 ° but the data were very scattered (Figure 3-11). Control samples showed no presence of Al.
In some cases, e.g. samples of water from steel and aluminium vessels by day 43, showed remark-ably low amounts of metals in the water. That observation does not have an appropriate explanation from a chemical point of view and could possibly originate from analytical error, though contact with the laboratory did not support this assumption.
Figure 3‑9. H2 release from the aluminium rods immersed in sterile filtered groundwater to the gas phase of the vessels at 30 °C. A1* to A5* represent discrete aluminium samples according to Table 2-1. K1* to K5* represent control vessels without aluminium rods.
Figure 3‑10. H2 release from the steel rods immersed in sterile filtered groundwater at 30 °C per cm2 of rod surface. A1* to A5* represent discrete aluminium samples according to Table 2-1.
0 20 40 60 80 100 120 140 160 180
Time (Days)
-2
0
2
4
6
8
10
12
14
16
18
20
H2 (
mba
r)
A1* A2* A3* A4* A5* K1* K2* K3* K4* K5*
0 20 40 60 80 100 120 140 160 180
Time (Days)
0
20
40
60
80
100
120
140
160
180
200
H2 (
nmol
/cm
2 )
A1* A2* A3* A4* A5*

22 SKB R-16-01
3.2 Release of organic compounds from polymeric materialsAll results are non-quantitative since calibration could not be made for individual, unknown com-pounds. Instead the normalized and blank corrected area for the peak of interest at the sample occasion after 28 days was chosen as base for relative calculation. This area was assigned to be 100 relative units and used as starting value for calculation of the further results. Since the compounds were expected to be absent in water at the starting time at day 0, origo was included in the graph bars as well, in order to give a theoretical indication of the release rate during the first 28 days. All peak areas were within the linear range on the instrument and since peak area is directly proportional to amount of each compound, this relative approach is valid for comparison over time.
3.2.1 Polyamide tubesComponent analysis of hexane extractHexane extraction of the polyamide tubes released a small number of compounds, mostly aliphatic hydrocarbons. Two other compounds were identified: N-butylbenzenesulfonamide and azacyclotridecan-2-one (Table 3-1). The peaks for these two compounds had higher intensity than those from the aliphatic hydrocarbons.
Table 3-1. Results for component analysis of the polyamide tubes extracted with hexane.
tR (retention time) Compounds CAS
20.45 N-butylbenzenesulfonamide 3622-84-220.64 Azacyclotridecan-2-one 947-04-60–29 aliphatic hydrocarbons –
Component analysis of groundwater leachate Both compounds found with hexane extraction were also found in water after the groundwater leaching. The leaching experiment lasted for 182 days and three extractions were made, at days 28, 98 and 182. Concentration of N-butylbenzenesulfonamide in the water increased three times by day 98 compared to day 28 after which the concentration decreased by 25 % (Figure 3-12). Concentration of azacyclotridecan-2-one increased almost 4.5 times by day 98 compared to day 28 after which the concentration remained roughly the same until day 182. At the last component analy-sis occasion, day 182, particles were observed in the water sample and the sample was analysed for TNC and 1.1 × 10⁵ cells/mL were detected.
17 22 35 43 67 71 99 113 140 154
Time (Days)
0.00.20.40.60.81.01.21.41.61.82.02.22.42.62.83.0
Al (
mg/
L) 70oC
30oC
Figure 3‑11. Amounts of aluminium (Al) in water samples from vessels with the steel rods incubated at 30 °C or 70 °C.

SKB R-16-01 23
3.2.2 PVC tapeComponent analysis of hexane extractThe results from the component analysis of PVC tape are shown in Table 3-2.
Component analysis of groundwater leachateTwo compounds, toluene and di-ethylhexyl phthalate (DEHP), were found in the groundwater after leaching and these compounds had the highest intensity of all peaks. Therefore, they were chosen as compounds of interest to illustrate leaching results. Relative amounts of toluene and DEHP in water after three extraction occasions are shown in Figure 3-13. The amount of toluene decreased after 98 days compared to 28 days, the decrease was about 28 % from the initial value obtained at the first extraction. The relative amount of toluene increased slightly again after 182, but it did not reach the initial value. Concentration of DEHP dropped considerably during the same time, the amount of DEHP after 98 days was 27 % of the amount observed at day 28. DEHP was not found in the water sample at the third extraction at day 182. During sampling it was observed that the water was cloudy and contained visible particles that did not exist in the samples at start of the experiment. TNC analysis of the sample was performed and 0.84 × 10⁵ cells/mL were detected.
3.2.3 High density polyethylene dummy materialComponent analysis of hexane extractComponent analysis of the PEHD dummy showed mostly presence of aliphatic hydrocarbons, alcohols and some esters (Table 3-3). In addition, N-butylbenzenesulfonamide was detected in the hexane extract.
Component analysis of groundwater leachateThe amount of N-butylbenzenesulfonamide remained the same for 98 days and was doubled by day 182 (Figure 3-14). Some more compounds were found at the third leaching occasion, but were absent at two first leaching occasions. Therefore, it was not possible to show the leaching progress in their cases. The water sample from 182 days was tested for TNC and 2.1 × 10⁵ cells/mL were detected.
Figure 3‑12. Relative amounts of organic compounds leached from the polyamide tube in groundwater over leaching time.
28 98 182
Time (days)
0
50
100
150
200
250
300
350
400
450
500
Rel
ativ
e un
its
N-Butylbenzenesulfonamide Azacyclotridecan-2-one

24 SKB R-16-01
28 98 182
Time (days)
0
20
40
60
80
100
120
Rel
ativ
e un
its
Toluene DEHP
Figure 3‑13. Relative amounts of organic compounds leached from the PVC tape in water over leaching time.
Table 3-3 Results for component analysis of the PEHD dummy.
tR (retention time) Compounds CAS
0–18.5 Aliphatic hydrocarbons –18.63 Dodecanoic acid ester20.44 N-butylbenzenesulfonamide 3622-84-2
Table 3-2. Results for component analysis of the PVC tape.
tR (retention time) Compounds CAS
5.60 Toluene 108-88-37.50 o-Xylene 95-47-67.94 Aromatic hydrocarbon –9.46 Propylbutylether 3073-92-5
10.30 Hexanol 111-27-310.94 Benzole derivative –14.95 Alcohol –17.37 Butylated hydroxytoluene 128-37-018.50 Tetraethylbutylphenol –18.99 Phthalate –19.31 Dimethylphthalate 131-11-319.67 Octylbenzoate 94-50-819.82 Phenylethylphenol 4237-44-920.03 Phenol derivative –23.51 2-Benzoylacetophenone 120-46-724.99 Dibutylphthalate 84-74-226.95 Phthalate –27.27 DEHP 117-81-728.8 DIDP 26761-40-028.8 DINP 68515-48-0
Compounds in cursive type has less of 80 % library matching in the NIST library.

SKB R-16-01 25
3.2.4 Polyurethane packer Slitan 90A-05Component analysis of hexane extract Results of the component analysis for this sample revealed various esters, alcohols, amines, aromatic compounds and three organic compounds which could not be identified by the NIST library (Table 3-4). These three compounds were obviously the main compounds extractable from this type of plastic, as the intensities of their peaks were much higher than for any other compound found in this sample. These compounds were regarded to belong to the same group, because they have the same qualifier ions (71 and 73), but different retention times. In the present work they were defined as compounds 1a, 1b and 1c.
Table 3-4. Results for component analysis of the PU Slitan 90A-05.
tR (retention time) Compounds CAS
10.29 Butanedioic acid dimethylester 106-65-0 10.39 Bicycloaldehyde –13.34 Fenoxyethanol 122-99-613.58 Hexanedioic acid dimethylester15.29 Benzenediisocyanate –17.38 Butylated hydroxytoluene 204-881-418.37 Branched unsaturated alcohol –18.62 Dodecanoic acid ester –23.39 Bicyclic benzene ring –23.51 Unknown compound: compound 1a –26.69 Hexanoic acid ester –26.92 Bensenamine dimer, chlorinated –27.51 Unknown compound: compound 1b –28.17 Triphenylphosphinesulphide 3878-45-3
Compounds in italic has less than 80 % library matching in the NIST library.
Figure 3‑14. Relative amounts of organic compounds leached from the PEHD dummy material in ground-water over leaching time.
28 98 182
Time (days)
0
20
40
60
80
100
120
140
160
180
200
220
Rel
ativ
e un
its
N-Butylbenzenesulfonamide

26 SKB R-16-01
Component analysis of groundwater leachateThe unknown compounds with qualifier ions 71 and 73 found with hexane extraction were found in groundwater leached samples at all leaching occasions (Figure 3-15). The relative amount of all three compounds in water increased by day 28 and decreased by day 182. In the water sample day 182 large particles were observed and two different types of bacteria were observed in the microscope. A TNC of 0.71 × 10⁵ cells/mL was detected.
3.2.5 Polyurethane packer Slitan 80A-71Component analysis of hexane extract Component analysis of PU packer Slitan 80A-71 showed the presence of many aromatic compounds and alcohols (Table 3-5). Two of the compounds, at retention times 26.9 and 28.6 min., could not be identified by the NIST library, but had high intensity of the peaks in the chromatogram. These organic compounds were assumed to belong to the same group, because they have the same qualifier ion m/z 173, though they were slightly different in other ions. They were defined as compound 4a and 4b respectively, in the present work.
Table 3-5. Results for component analysis of the PU Slitan 80A-71.
tR (retention time) Compounds CAS
13.52 Benzothiazol derivative13.73 Phenoxypropanol15.87 Benzaldehyde derivative16.31 Benzofuran17.37 Butylated hydroxytoluene18.97 Phthalate27.15 Unknown compound: compound 4a28.85 Unknown compound: compound 4b
Compounds in cursive type has less of 80 % library matching in the NIST library.
Figure 3‑15. Relative amounts of organic compounds leached from the PU packer material Slitan 90A-05 in water over leaching time.
28 98 182
Time (days)
0
20
40
60
80
100
120
140
160
180
200
220
240
260
280
300
Rel
ativ
e un
its
compound 1a
compound 1b
compound 1c

SKB R-16-01 27
Component analysis of groundwater leachateThe unknown compounds with qualifier ions 173 were also found in groundwater leachates. In the water samples two other compounds were found at all leaching occasions, having retention times 14.8 and 17.7 min. These compounds had high intensities of their peaks as well and were also chosen as compounds of interest, being defined as compound 2 and 3 respectively. Compound 2 had qualifier ions 55, 112 and 142 and compound 3 had the main qualifier ion 201. Analysis of the leaching data showed that relative amount of all the compounds increased by day 98 compared to day 28. The relative amounts of compounds 3, 4a and 4b augmented two – three times, whereas the amount of compound 2 increased dramatically from 100 to 641 relative units. The amounts of the compounds decreased by day 182. Large particles were observed in the water sample. The TNC analysis detected 0.44 × 10⁵ cells/mL.
28 98 182
Time (days)
0
100
200
300
400
500
600
700
Rel
ativ
e un
its
compound 2
compound 3
compound 4a
compound 4b
Figure 3‑16. Relative amounts of organic compounds leached from the PU packer material Slitan 80A-71 in water over leaching time.

SKB R-16-01 29
4 Discussion
The general purpose of this study was to determine if any material used to construct stationary borehole equipment can provide enough electron donors to explain the observed sulphide production by SRB. The project plan outlined a laboratory study in two parts, where the first part investigates release of H2 and organic compounds from borehole equipment material under sterile conditions. The second part will involve the presence of the bacteria. Here, the release H2 from metallic parts of stationary borehole equipment immersed in sterilized filtered groundwater was analysed. The release of organic compounds from polymeric parts of stationary borehole equipment to SF groundwater was also investigated.
4.1 H2 release from metallic materials4.1.1 Choice of methodThe experiments with iron and aluminium materials adopted an approach previously developed for copper (Bengtsson et al. 2013). In difference to the component analysis of organic leachates, the identity of the analyte, i.e. H2 was known so it was possible to calibrate the gas chromatograph using reference gases to obtain quantitative results. The experiments were set up under sterile conditions to exclude the influence of the microorganisms which could possibly influence the results by con-sumption of H2. In this first part of the project, data on baseline release of H2 was sought. However, it was difficult to obtain sterile conditions due to the complicated nature of the borehole materials provided for the experiment. The ground water was filter sterilized and all glassware and organic materials (except PVC tape and PEHD) were disinfected with 70 % ethanol before the cutting. It was not possible to perform a more vigorous sterilisation treatment, e.g. by heat in an autoclave because that could change the nature of the materials and thereby the outcome of the experiments. Incubation at 70 °C probably was enough to inactivate most microbial life over time. Thermophiles can of course live at this temperature, but they need energy and carbon to continuously repair heat damaged cell constituents which was not available in the vessels. The 30 °C applied in the second experiment would not be enough to kill microorganisms possibly surviving the ethanol treatment and final results revealed microbial growth in several of these samples. Still, the sterilisation procedures used were efficient enough to reduce microbial activity to a level that did not bias the results to an unacceptable degree. The fact that the groundwater was sterile-filtered and the materials disinfected with ethanol reduced microbial activity of microorganisms at least during the earlier stages of the tests. The results of these tests at 30 °C should, consequently, be interpreted keeping in mind that there probably was an increasing microbiological activity over time.
4.1.2 Sources of H2 in the vesselsStainless steelThere are two possible mechanisms than can explain the observed H2. It is well known that H2 can be dissolved in metals as observed for copper (Johansson et al. 2015) and other metals (Carter and Cornish 2001). The tests of H2 release from steel showed an initial evolution of H2 in vessels incubated at 30 °C and 70 °C that levelled out at 4 and 6 mbar, respectively, after approximately 2 months. These results are similar to what were observed for incubation of copper at 70 °C (Johansson et al. 2015). The decrease in the H2 release rate over time have two possible explanations. If H2 is released from the metal matrix it is a fixed source of H2 that eventually will approach zero. The butyl rubber stoppers are not totally impermeable to H2 diffusion and with increasing partial pressure of H2 the mass transfer of H2 via the stopper by diffusion will increase until a steady state between release of H2 and out-diffusion is reached. The approximate transfer of H2 through the stopper was previously calculated to 8 nmol/day (Bengtsson et al. 2013). H2 will then slowly, over more than a year or two, approach zero in the vessels. The second possible mechanism is H2 release due to anaerobic corrosion of the steel. However, because it is stainless steel, such an extensive corrosion process is unlikely under sterile, O2-free conditions, but all metals except gold, platinum and palladium will eventually corrode at rates set by the hydrochemical conditions. If corrosion did occur in the vessels, a steady-

30 SKB R-16-01
state may, just as observed for degassing of the metal, be reached at some point in the partial pressure of H2, partly due to H2 entry into the iron (Reardon 1995). The situation in the vessels may change when microorganisms are added in the second part of the project because of the risk for microbially induced corrosion (MIC) where SRB produce sulphide with H2 as electron donor (Cord-Ruwisch and Widdel 1986, Enning and Garrelfs 2014).
AluminiumOne of the 70 °C vessels with an aluminium rod (A4, Figure 3-6) had a very large build-up in pressure of which most was explained by an increase in the partial pressure of H2. The H2 likely originated from a local corrosion attack of the rod (Figure 3-8). The temperature was chosen to speed up H2 releasing processes but the temperature of 70 °C was much higher than what is found in ground-water. Obviously, a lower temperature will be more relevant for deep groundwater situations. The experiment shows that aluminium in contact with warm saline groundwater produces much larger amounts of H2 compared to what was observed for stainless steel at the same temperature.
The test with aluminium was repeated at the lower temperature of 30 °C to keep reactions closer to a rate relevant for aluminium in stationary borehole equipment. The decrease in H2 release at 30 °C compared to 70 °C was very large. At the lower temperature the partial pressures of H2 were in the same magnitude as those observed with steel rods. However, in difference was the release continuous over the experimental time for tubes not infested by SRB (see next paragraph). That would indicate a corrosion process to dominate the H2 release. Observations from the field attest that aluminium rods and tubes may corrode severely in saline groundwater (Rosdahl et al. 2011).
Some of the vessels with aluminium rods showed a loss of H2 during the experimental time, both at high and low temperature. In the case of sample A4* at 30 °C with an almost total loss of H2 a simple test of microbiological sulphate-reducing activity revealed that the sample was indeed not sterile. There was an odour of hydrogen sulphide which can only be explained by activity of SRB. It is important to note that this sulphide producing activity took place in an environment free from other sources of organic material than what was naturally present in the groundwater, i.e. 1 mg/L of dis-solved organic carbon (Table A-1).
4.1.3 Modelling sulphide production from the observed H2 releaseThe steel sample S5 and the aluminium samples A4 and A5 can be used as proxies for H2 release over a time period of 154 days.
Sample S5 produced 20 nmoles H2/cm2 and sample A5 produced 80 nmoles H2/cm2 over 154 days which can be extrapolated to 64 and 228 nmoles H2/cm2 per year. A typical rod in stationary borehole equipment is 16 mm. A rod with 1 m length then expose 100 cm2 surface to groundwater and would produce 6.4 and 23 µmoles H2 per year. A typical borehole diameter is 76 mm which calculates to approximately 2.4 L groundwater per 1 m borehole length. The observed H2 release rates then would be 3 and 10 µM per year. The reduction of 1 sulphate to hydrogen sulphide requires 4 H2 according to the following reaction:
4H2 + SO42− + 2H+ → H2S + 4H2O
Using the S5 and A5 release rates of H2 from a steel and an aluminium rod consequently would sus-tain the production of 0.75 and 2.5 µM sulphide per year in a borehole. Such rates may not explain the observed extreme sulphide values in the mM range found in some boreholes as discussed in the introduction but could possibly explain the 16 µM (0.515 mg/L) found in the source groundwater for these experiments (Table A-1). However, if the 40 first days of aluminium sample A4 is calculated in a similar manner, there would be 3.7 mM H2 and 0.9 mM sulphide after one year. That production rate could explain the 3 mM sulphide observed in KAS09 that indeed had a severely corroded aluminium rod installed (Rosdahl et al. 2011).

SKB R-16-01 31
4.1.4 Release of iron and aluminiumThe analysis results of dissolved metals were inconclusive. They were not explained by the content of these metals in the used groundwater (Table A-1). Correlation between amounts of H2 and metals were not found. The most likely reason for this is that contamination levels of the metals far exceeded amounts released by the corrosion processes generating H2. Iron and especially aluminium are tech-nical metals frequently encountered on surfaces. The glass vessels were not specifically acid-rinsed to minimize leachability of metals from the glass itself and the vessels were randomly collected from storage without traceability of earlier usage. Depending on earlier usage the glass surface might have been more or less depleted of metals because of repeated washings, pH of solutions previously stored in the vessel or exposure to contaminated dust. The metal rods were polished and traces of metal dust could have been present on the surfaces. Analysis on ICP does not specify if the source of measured metal is ions in solution or colloidal metal atoms. It is possible that the amount of metal dust on the rods varied between samples. To test the acid used for preservation samples of ultrapure water with added acid was also tested but the results from these samples were below detection limits (Table A-2 and Table A-3). The varying concentrations of metals were not explained by possible small variations in the exact volume of acid added to the samples.
4.2 Release of organic compounds from polymeric materials4.2.1 Choice of approach to component analysisGeneral principlesWhen investigating the release of organic components from polymeric materials several approaches are possible. The major limitation is lack of knowledge on the specific compounds present in the polymeric materials. Additives are normally considered as secret information since they strongly influence the properties of the final product. Also, the focus from the manufacturer usually is to obtain consistent physical properties between batches and the exact amount of individual additives might be adjusted in accordance with this goal. Without information on the specific compounds used it is impossible to theoretically create an optimized method for component analysis and it is also not possible to calibrate the analysis for quantitative results. Quantification is only possible if the pure substance can be obtained for the preparation of reference standard solutions.
To achieve the information needed on additives in the polymers an approach using extraction with hexane as solvent was used. The procedure chosen was based on the principles used in an earlier reference method for phthalate plasticisers in PVC, ISO 15777:2009 (For the original intended use this standard has been replaced, but not due to limitations in analytical performance. The method is labour-intense and not easy to adopt for automated laboratories.). The reason for using this method was previous experience about the extraction efficiency for some of the compounds expected to be present in the polymeric materials. The procedure is based on Soxhlet extraction in refluxing solvent and can be described as repeated liquid-solid extractions where the solvent is regenerated by distillation between each cycle. The advantage of the method is that also compounds not very easily soluble in the solvent are extracted because equilibria is established between the solid material and solvent free of analyte in each cycle. Even with an unfavourable equilibrium some of the analyte will dissolve in each cycle and since the refluxing regeneration is an ongoing process the number of individual cycles can be kept very large without using excessive amounts of solvent. The dissolved analytes are concentrated in the bottom of the boiler flask during each cycle. Drawbacks with the method is that it is time-consuming if the number of extraction cycles is large and that the number of cycles needed for almost quantitative extraction is unknown and varies between analytes. The material itself might pose a problem if the migration rate of the additives within the material is slow, the additives are only extracted from the surface of the polymeric materials and are replaced through inner migration in the material. This migration rate might be increased by adding heat and in the Soxhlet setup actual extraction takes place at temperatures some ten degrees below the solvents boiling point due to the condensation. While warmer than room temperature this is far below the melting point of the analysed polymeric materials. The advantage of this is that the polymeric base material keeps its physical properties and without dissolving to produce a slurry.

32 SKB R-16-01
To facilitate the extraction it is necessary to finely divide the material to smaller parts by cutting or grinding to maximize the surface and minimize the distances necessary for migration inside the material to reach the surface. Despite lack of knowledge on the extraction efficiency for individual analytes it was presumed that four hours of extraction with at least four cycles each hour would positively extract a majority of dissolvable compounds from the finely divided polymeric materials (confer Figure 2-2). It is normal to observe some re-precipitation of compounds poorly soluble in the solvent in the receiving flask as concentrations increase, therefore the extraction of these compounds cannot be considered quantitative despite the fact that they were released from the material. Still, for fingerprinting, enough of these compounds will remain in solution to be detectable in the subsequent component analysis on GC-MS. For the reason of simplicity in the analysis on GC-MS, hexane was chosen as solvent despite an apparent unfavourable polarity for the usually more polar additives present in the polymeric materials. The Soxhlet extraction is effective with non-matching polarities to the cost of an increased number of necessary extraction cycles. When analyzing on GC-MS hexane is an optimal solvent due to a low vapour volume compared to more polar solvents and it also exhibits a good wetting of the column material. For our study it is also favourable that the same solvent, hexane, was used for extracting the SPE cartridges used for groundwater leachate analysis, causing chromatography conditions to remain constant. The results from the screening of extractable com-pounds is not quantitative due to lack of calibration on reference standards and also due to limited knowledge on extraction efficiency for the compounds not originally included in the method. For phthalates the extraction efficiency is > 90 % according to the validation of the ISO-method. For fingerprinting of the identity of released compounds the selected methodology is fully sufficient.
Extraction from waterWhen analysing the groundwater leachates for dissolved organic compounds a different approach has to be used. Liquid-liquid extraction is a common practice. The water is mixed with a solvent, for instance hexane, shaken and then left still for the liquid to separate and form two layers. The drawbacks are that the solvent cannot be water-miscible and that the phase ration is difficult to optimize. If a similar approach as in Soxhlet extraction should be used, then the extraction has to be performed using multiple aliquots of solvent. Since the solvent isn’t regenerated during the process the final volume of solvent will be large. The low miscibility also puts stress on vigorous shaking to maximize contact and extraction yield. In each extraction some water will equilibrate into the solvent, despite immiscibility, and if in the final step a large volume of solvent from combined extractions has to be concentrated by evaporation the final liquid will contain large amounts of water if the solvents boiling point is below that of water. Water has to be removed before injection into the GC-MS due to the large vapour volume and drying agents will have to be added for this reason. Such drying also affects recovery of analytes if they are lost to the solid drying agent. Evaporation to concentrate the solvent is necessary to yield a more concentrated sample. The evaporation step however poses a risk for losing some of the easily evaporated analytes and should be performed carefully. If smaller aliquots of solvent are used in the first extraction step the separation between the liquid layers becomes more difficult and extraction efficiency declines as well.
In this study the compounds released from the polymeric materials to the water were expected to be at least moderately polar, leaving few possibilities to decrease number of extractions and volume of solvent. Still it was deemed necessary to have a concentration ration of at least twenty to be able to effectively analyse the water phase. The solution was to use SPE instead of liquid-liquid extraction. The SPE cartridge is packed with a supporting material and on the surface of this material an immobilized film of an organic substance is deposited yielding what is effectively considered to be a liquid organic phase stationary bonded to the supporting material. The polarity of this liquid layer can be manipulated by adding functional groups and it is possible to use a composition that, if it was used for normal liquid-liquid extraction, would have a too large water-solubility to effectively form separate layers. In addition, the interaction with more hydrophobic layers and the sample water is improved both by the physical action of forcing the water through the packing as well as by improved wetting caused by exposed polar silanol groups on the packing material itself. The deposited organic film usually doesn’t cover the surface completely, some of the packing material remains exposed. If the flow through the cartridge is sufficiently low to enable equilibria and the film on the packing material doesn’t become saturated with dissolved organic molecules the extraction efficiency can be very high. This is especially the case if the polarity has been tweaked to match the

SKB R-16-01 33
analytes well. When the water sample has been forced through the cartridge using suction or pressure the ideal situation is that all analytes of interest have been removed from the water and remain dis-solved in the surface layer on the packing particles. In this situation it is possible to dry the cartridge using a flow of air through the packing, removing the water but leaving the analytes dissolved in the surface film. After drying, the analytes are eluted using a few mL of pure solvent that is pressed slowly through the cartridge. Since the film on the particles is so thin the ratio of solvent volume to film volume is high and the analytes are eluted efficiently from the cartridge. When using 50 mL of water sample and finally eluting into 2 mL of solvent, a concentration ratio of one to twenty-five was obtained.
The major drawback in the SPE analysis of the groundwater samples is that it not can be made quantitatively without access to the pure compounds for preparation of calibration standards. Also, the extraction efficiency for individual compounds is uncertain without optimizing experiments. The efficiency is however expected to be sufficient for a wide range of analytes and the cartridges themselves possess little variation between individual units according to manufacturers’ validations. When using the same procedure and the same batch of cartridges it is therefore assumed that the results, despite being non-calibrated, are comparable in a relative manner indicating increases and decreases in concentration and even being quantitative in the ratio of this change without exact information of the actual concentration in concentration units. The largest uncertainty is connected with the volume of solvent used for elution and the volume transferred to the injector of the GC system. These effects are normally taken care of using an internal standard, a substance added to the sample in a known amount and that is not present naturally in the sample itself. By relating all results as a ratio compared with the result for this substance a normalization removing the effect of small variations in sample volume is performed. In the case of this study an alternative to adding such an internal standard to the water sample was used. The packing material of the SPE cartridges contained a minor contamination that was consistent between the cartridges. In practice this con-taminant could be considered equivalent to an internal standard extracted from the water with the exception that differences in sample volume of the water could not be corrected. Since the sample volume could be measured with a relatively much higher precision than the elution and injection volumes, respectively, the variation in sample volume was considered negligible. All other variations were effectively corrected by normalizing the areas for the detected compounds by division by the area measured for this internal standard.
Results reprocessing in the GC-MS component analysisSince GC-MS is a very sensitive analytical method it is normal that blank analysis on pure solvents generates chromatograms with peaks. Even the highest quality of solvents does contain trace impuri-ties. It is not uncommon that the compounds detected as impurities in the solvent also are present in the samples, but at a higher concentration. If the impurity is a substance used in calibration to generate quantitative results, it is affected by presence in the solvent since the same solvent is used for dilution of the reference standards. Because of this it is not possible to quantitate the solvent impurity in concentration units and later on correct for this value. The correction has to be made on the uncalibrated raw data. The approach used is to analyse a blank sample containing only pure solvent and the internal standard on the GC-MS system. The area of the impurity is normalized against the area of the internal standard and this quota is noted as a correction factor. When analysing samples, the same quota of analyte to internal standard is calculated and after that step the correction factor is subtracted from the result. The same procedure is used for the calibration standards, if present. It is very important to correct only after normalization against the internal standard since a straightforward correction based on raw intensities in counts per second doesn’t take into account small variations in injected volume on the GC-MS. In the method used for analysis in this project an added internal standard was substituted with an impurity generated by the SPE-cartridge and as a consequence the blank sample had to be prepared including the extraction step. Instead of using pure solvent, a sample of ultrapure water was extracted and eluted in the same way as the samples and this result was used as blank to be subtracted from the results obtained from the real samples. The benefit of this approach is that also other possible impurities originating from the SPE-cartridge could be detected and accounted for. Ideally the only difference between the blank and the real samples should be the presence of the analysed material, everything else should be kept as matching as possible.

34 SKB R-16-01
In the GC-MS, sample analysis proceeds by injection of about 1 µL of sample into a hot injection port where the sample is vaporized, the individual components in the mixture are separated when travelling through an analytical capillary column in a stream of inert carrier gas and when the analyte reaches the mass spectrometer it is ionized by an electron beam and the charged fragments analysed by their mass to charge ratio in the analyser. For a deeper description any regular textbook in analytical chemistry can be used as source of information.
The signal obtained for an analyte relates directly to the concentration of that analyte within a linear range of about five orders of magnitude. Nonlinearity is usually connected with chemical and physi-cal effects before the sample reaches the detector rather than effects in the detector itself. The origin of the signal is pulse-counting of individual ions. When an analyte is ionized and fragmented ions are formed that are accelerated through a magnetic field in the direction of the detector. This field is also used to discriminate the mass to charge ratio on the individual ions leaving only a fixed ratio in a stable path finally reaching the detector. Each such ion hitting the detector surface gives a small electric pulse that is amplified using an electron multiplicator. The detection is based on the number of pulses per time unit and usually expressed as counts per second. More analyte yields more ions and more counts per second in a linear manner within limits possessed by the electron multiplier and the electronics in the signal processing. The lower end usually is the background counts per second that emerges spontaneously in the multiplier even when no ions hit the surface. The upper end is connected with the ability of the multiplier to amplify pulses very close in time. The detector has a very short dead time without sensitivity immediately after receiving an ion on the surface. With gradually higher ion fluxes this dead time becomes more and more significant and can be corrected statistically by the signal processing electronics, but only to a certain point when the detector is described as saturated. Some detectors have the ability to switch to analogue stage at the saturation point continuing measuring the ion flux as current only, not pulse counting, to achieve signals even above the saturation point but this is usually signal of a lower analytical accuracy. Since an analyte doesn’t emerge at the end of the column as a short spike, but over a time of several seconds the pro-cessed signal also has a time factor. Usually the signal is plotted as a peak in a chromatogram with counts per second on the y-axis and time on the x-axis. The area under this curve is proportional to the total amount of analyte. To be sure about the exact shape of the curve several individual measure-ments of signal intensity has to be made throughout the peak. At least twenty points are needed for a good curve fitting and with a peak width of a few seconds data has to be collected on a frequency of around 10 Hz. This puts some limitations on the signal processing electronics as well. The fact that peaks are not in the form of spikes is in a benefit for the upper limit of the measuring range since more ions are needed to reach saturation. On the other hand small signals tend to be smeared out to low broad peaks that cannot be integrated. Detection limits and measurement ranges are therefore a product both of performance of the detector as well as of performance in shaping the peaks through optimized chromatography, the latter being more in the hands of the analyst than depending on the instrument hardware.
4.2.2 Release of organic compoundsThe organic compounds were analysed for leachability since compounds leaching into groundwater from borehole equipment may act as a source of electron donor and carbon for microorganisms. Soft polymeric materials usually contain plasticizers that act as internal solvents, also other stabilizers and monomers from polymerization processes might be present in the polymer without being chemically bonded to the mainframe of the polymer. Chemically these compounds can be described as dissolved in a very viscous fluid and they move throughout the whole polymer at a slow rate. When they reach the surface of the polymer it is possible for them to interact with the fluid surrounding the polymeric material if this polymer is immersed in the fluid. In some case these compounds are of a polar nature and they might have a significant solubility in water. In these case it is possible to leach them into the groundwater phase from the polymer and their solubility in water increases the wettability of the polymer surface, speeding up the kinetics of this possible phase transfer. The leaching in pure solvent was performed on finely divided polymeric parts using hexane and should be interpreted as a worst case scenario. Since pure hexane acts on the polymeric mainframe causing swelling the release rate of the dissolved compounds, regardless of polarity, is strongly increased in organic solvents compared to water.

SKB R-16-01 35
The results from the component analysis of extracts in hexane were used to identify possible leachable compounds to groundwater. Because of the vigorous solvent extraction, the concentration of the compounds became high enough to yield good spectral identifications. In the following analysis of leachates to groundwater exactly the same analytical conditions were used on the GC-MS system as used for the hexane extracts. Because of this retention times remained constant and direct com-parison with the spectra from solvent extraction could be made when evaluating the results from leaching into water. The analysis was performed without calibration and because of this the results are qualitative and not quantitative.
As expected not all components found when extracting the material in pure solvent could be detected in the groundwater leachates. Also the ratios between groundwater leached compounds were different compared to hexane extracted compounds. But all compounds detected in the groundwater could be traced back to the polymer hexane extraction results, indicating that groundwater in contact with these materials may contain significantly higher levels of organic compounds than the groundwater itself.
In some case it was not possible to identify the compound detected in the component analysis. When the matching quality for the compounds in the NIST library was not good enough for a certain assess-ment it was still possible to identify the compound family in some cases (e.g phthalates). This assessment was based on manual evaluation of characteristic fragments in the ionization pattern. There was also a group of compounds that could not be identified at all. For polymeric materials that is not uncommon since the only compounds normally identifiable via library search are free pure com pounds. Monomers and shorter oligomers are not available as pure compounds and therefore they do not occur in the search libraries. Still they can make up a large fraction of the leachable com pounds from polymers, because reaction monomers and oligomers usually contain polar groups that facilitate transfer to the water phase. Especially PU materials are known to contain these unidentifiable compounds. Another source of uncertainty when dealing with oligomers is that they might decompose thermally in the hot vaporizing inlet of the GC yielding reformulated compounds. This decomposition makes it impos-sible to estimate the original length of decomposed oligomers.
As in the case with the metal rods the results should be interpreted keeping in mind that there probably was an increasing microbiological activity over time in the vessels, starting at a low level because of the disinfection actions taken during sample setup. Theoretically this would imply that an increasing level of an organic substance in the water over time indicates leachability but also that the substance is not used by present microorganisms. On the other hand, if the substance shows an increasing con-centration during the early stages of leaching followed by decreasing concentrations later in the test, this could indicate leachability and also the accelerated degradation of the substance caused by the higher microbiological activity at the later sampling. Analysis shows the steady-state concentrations of individual compounds but does not give information about rates of conversion. The latter being more important as assessment for microbiological activity. These considerations will be applied in part 2 of the project where the experiments will be repeated using groundwater with intrinsic microorganisms.
In the case of DEHP in the PVC tape it is known that DEHP leaches into water from the polymer, especially when the water is saline. This effect is the reason for legal limits on the concentration of phthalates such as DEHP in medically used PVC. Normal concentrations of phthalate in soft plasticized PVC tape are in the order of 10–30 percent by weight. In the case of the PVC tape used for these tests it is not unlikely that the decline in concentration of DEHP in the water phase could be caused by lack of supply from the polymer material and a low level of degradation. The results rather point in the direction of a microbiological population settling on an activity matching the release rate of DEHP into the water. This will be further explored in the next part of the project.

SKB R-16-01 37
5 Conclusions
• Metallic parts of the borehole equipment, aluminium and steel, released H2 when immersed in O2-free groundwater. H2 release was larger with aluminium rods than with steel rods and increased with increased temperature.
• Local corrosion of aluminium rods can release very larger amounts of H2 over a relatively short time.
• The polymeric materials of stationary borehole equipment contained many different organic compounds of which several were released to groundwater. The release was generally con-tinuous over time.
• It was difficult to create sterile conditions without damaging the materials to be tested especially in the case of organic components being immersed in groundwater for a long time.
• The observed presence of microorganisms in sample vessels containing polymeric materials after 6 months of leaching in groundwater was accompanied by a decrease in amounts of organic compounds released in water, which suggests that microbiological activity interfered with the experiments.
• Despite the difficulties to keep microorganisms out of the sample vessels, the goal to determine the range of organic compounds that leach from polymeric materials in stationary borehole equip-ment was satisfactory achieved.
• The results obtained at the first year experiment show that the selected methodology was appropriate for reaching the objective of the project which was to determine if any material used to construct borehole equipment can provide enough electron donors to explain the observed sulphide production by SRB. The answer is yes and the objectives of part 2 of the project will focus on rates and mod-elling of sulphide production caused by released compounds from stationary borehole equipment.

SKB R-16-01 39
References
SKB’s (Svensk Kärnbränslehantering AB) publications can be found at www.skb.se/publications.
Bengtsson A, Chukharkina A, Eriksson L, Hallbeck B, Hallbeck L, Johansson J, Johansson L, Pedersen K, 2013. Development of a method for the study of H2 gas emission in sealed compartments containing canister copper immersed in O2-free water. SKB TR-13-13, Svensk Kärnbränslehantering AB.
Carter T J, Cornish L A, 2001. Hydrogen in metals. Engineering Failure Analysis 8, 113–121.
Cord-Ruwisch R, Widdel F, 1986. Corroding iron as a hydrogen source for sulphate reduction in growing cultures of sulphate-reducing bacteria. Applied Microbiology and Biotechnology 25, 169–174.
Cross M M, Manning D A C, Bottrell S H, Worden R H, 2004. Thermochemical sulphate reduction (TSR): experimental determination of reaction kinetics and implications of the observed reaction rates for petroleum reservoirs. Organic Geochemistry 35, 393–404.
Drake H, Hallbeck L, Pedersen K, Rosdahl A, Tullborg E-L, Wallin B, Sandberg B, Blomfeldt T, 2014. Investigation of sulphide production in core-drilled boreholes in Äspö Hard Rock Laboratory. Boreholes KA3110A, KA3385A and KA3105A. SKB TR-13-12, Svensk Kärnbränslehantering AB.
Enning D, Garrelfs J, 2014. Corrosion of iron by sulfate-reducing bacteria: new views of an old problem. Applied and Environmental Microbiology 80, 1226–1236.
Hobbie J E, Daley R J, Jasper S, 1977. Use of nucleopore filters for counting bacteria by fluor-escence microscopy. Applied and Environmental Microbiology 33, 1225–1228.
Johansson J, Blom A, Chukharkina A, Pedersen K, 2015. Study of H2 gas emission in sealed compartments containing copper immersed in O2-free water. SKB TR-15-03, Svensk Kärnbränslehantering AB.
Pedersen K, 2012. Influence of H2 and O2 on sulphate-reducing activity of a subterranean com-munity and the coupled response in redox potential. FEMS Microbiology Ecology 82, 653–665.
Pedersen K, Ekendahl S, 1990. Distribution and activity of bacteria in deep granitic groundwaters of southeastern Sweden. Microbial Ecology 20, 37–52.
Pedersen K, Kalmus A, 2004. Forsmark site investigation. Total numbers and metabolic diversity of microorganisms in borehole KFM03A Results from three investigated borehole sections, 639.0–646.1 m, 939.5–946.6 m and 980.0–1001.2 m. SKB P-04-89, Svensk Kärnbränslehantering AB.
Pedersen K, Bomberg M, Itävaara M, 2014. Summary report. Microbiology of Olkiluoto and ONKALO groundwater. Posiva 2012-42, Posiva Oy, Finland.
Reardon E J, 1995. Anaerobic corrosion of granular iron: measurement and interpretation of hydrogen evolution rates. Environmental Science & Technology 29, 2936–2945.
Rosdahl A, Pedersen K, Hallbeck L, Wallin B, 2011. Investigation of sulphide in core drilled bore-holes KLX06, KAS03 and KAS09 at Laxemar and Äspö. Chemical-, microbiological- and dissolved gas data from groundwater in four borehole sections. SKB P-10-18, Svensk Kärnbränslehantering AB.
SKB, 2011. Long-term safety for the final repository for spent nuclear fuel at Forsmark Main report of the SR-Site project. SKB TR-11-01, Svensk Kärnbränslehantering AB.

SKB R-16-01 41
Appendix A
Table A-1. Characteristics of the ground water from the borehole KFM03A:4, section 633.5–650 m, –631 m.a.s.l.
Analysis Unit Results
pH 7.76Conductivity (25 °C) mSm−1 1593Flushing water % 2.9Sodium fluorescein µg L−1 5.7Bromide (Br−), IC mg L−1 33.3Chloride (Cl−), titration mg L−1 5673Fluoride (F−), potentiometry mg L−1 1.47Sulphide (HS−) mg L−1 0.515Sulphate (SO4
2−), IC mg L−1 187.1Carbonate (HCO3
−), alkalinity mg L−1 21.1Nitrogen (NH4
+) mg L−1 0.229Nitrogen (NO2
−) mg L−1 0.0011Nitrogen (NO3
− + NO2−) mg L−1 0.0011
Nitrogen (NO3−) mg L−1 < 0.0003
Phosphorus (PO43−) mg L−1 0.0008
Total organic carbon mg L−1 0.9Dissolved organic carbon mg L−1 1.0Iron (Fe2+) mg L−1 0.519Aluminium (Al3+) µg L−1 14.9
Table A-2. Results of the ICP-MS analysis of water sample with metallic rods, leaching at 70 °C.
Material Sample Days Fe, mg/L Accuracy ± Al, mg/L Accuracy ±
Steel 1 17 2.49 0.17 0.397 0.071
2 35 4.13 0.28 0.573 0.146
3 67 3.33 0.23 0.505 0.147
4 99 3.60 0.25 0.563 0.129
5 104 3.19 0.22 0.481 0.205
Aluminium 1 17 0.349 0.025 0.635 0.086
2 67 0.424 0.029 0.680 0.094
3 35 0.324 0.025 2.74 0.335
4 99 0.460 0.033 1.60 0.241
5 104 0.329 0.03 0.998 0.142
K (control ground water) 1 17 < 0.1 – < 300 –
2 67 < 0.1 – < 300 –
3 104 < 0.1 – < 300 –
AGW 1 17 < 0.02 – < 60 –
2 99 < 0.02 – < 60 –
3 104 < 0.02 – < 60 –

42 SKB R-16-01
Table A-3. Results of the ICP-MS analysis of water sample with metallic rods, leaching at 30 °C.
Material Sample Days Fe, mg/L Accuracy ± Al, mg/L Accuracy ±
Steel 1 22 2.98 0.20 0.145 0.0852 43 3.61 0.25 < 60 –3 71 3.70 0.25 0.178 0.0564 113 5.26 0.37 0.198 0.1175 140 5.18 0.36 0.351 0.186
Aluminium 1 22 1.15 0.08 0.738 0.1282 43 2.48 0.17 0.188 0.0283 71 2.91 0.20 0.250 0.0364 113 2.16 0.15 0.328 0.0885 140 1.58 0.11 1.53 0.184
K (control ground water) 1 22 < 0.04 – < 60 –2 71 < 0.04 – < 60 –3 140 < 0.04 – < 60 –
AGW 1 22 < 0.02 – < 60 –
The accuracy stated was according to the original reports calculated as a 95 % confidence interval not taking into account any gross errors as mistakes in dilutions and sample treatment. The estima-tion was based on guidelines from Eurachem on the topic uncertainty of measurement.
Table A-4. Partial pressure of analyzed H2 in vial (mbar), experiment at 70 °C.
Day P5 (mbar)
S1 S2 S3 S4 S5
0 0.0 0.0 0.0 0.0 0.017 3.6 3.0 3.5 1.6 3.335 4.5 4.7 2.5 4.867 6.4 3.8 7.099 3.9 4.9154 5.5
A1 A2 A3 A4 A5
0 0.1 0.0 0.0 0.0 0.017 36.0 24.5 6.6 57.0 13.235 32.5 8.3 994.4 23.067 52.7 395.9 186.899 307.3 32.7154 18.0
K1 K2 K3 K4 K5
0 0.0 0.0 0.0 0.0 0.017 0.0 0.0 0.0 0.0 0.035 0.1 0.1 0.0 0.167 0.0 0.0 0.1 0.099 0.1 0.1 0.1154 0.1 0.1 0.1

SKB R-16-01 43
Table A-5. Partial pressure of analyzed H2 in vial (mbar), experiment at 30 °C.
Day P5 (mbar)
S1 S2 S3 S4 S5
0 0.02 0.02 0.01 0.02 0.028 0.53 0.44 0.57 1.22 0.7222 1.12 1.44 2.20 3.79 1.6743 2.39 2.77 3.84 1.9371 3.72 4.41 2.81113 4.68 3.52140 4.31
A1 A2 A3 A4 A5
0 0.02 0.02 0.02 0.00 0.028 1.52 1.92 1.49 1.26 1.2622 2.23 3.57 3.18 1.35 3.0943 3.59 3.72 0.85 3.6471 5.13 2.19 5.81113 0.03 7.33140 9.04
K1 K2 K3 K4 K5
0 0.00 0.02 0.00 0.00 0.008 0.00 0.02 0.02 0.02 0.0222 0.02 0.02 0.04 0.02 0.0443 0.02 0.02 0.03 0.0271 0.02 0.04 0.04 0.04113 0.03 0.03 0.02140 0.04 0.05 0.04
Table A-6. Amount of H2 in vial (nmol), experiment at 70 °C.
Day n1
S1 S2 S3 S4 S5
0 0 0 0 0 517 720 613 707 314 65035 903 956 502 95567 1287 744 138999 765 966154 1088
A1 A2 A3 A4 A5
0 13 0 0 0 017 7305 3941 1239 8903 276935 6593 1558 155 288 485167 9920 61 613 39 18499 47 824 6852154 3794
K1 K2 K3 K4 K5
0 0 0 0 0 017 0 33 33 11 035 37 49 0 5967 0 0 62 099 45 53 52154 51 50 49

44 SKB R-16-01
Table A-7. Amount of H2 in vial (nmol), experiment at 30 °C.
Day n1
S1 S2 S3 S4 S5
0 4 4 3 4 48 116 96 127 299 16222 246 316 493 927 37443 528 623 943 43371 835 1080 631113 1149 791140 970
A1 A2 A3 A4 A5
0 5 5 5 0 58 476 587 425 402 40222 701 1092 909 429 98443 1102 1065 271 116171 1464 698 1847113 9 2340140 2887
K1 K2 K3 K4 K5
0 0 12 0 0 08 0 12 12 12 1222 13 13 26 13 2643 11 11 23 1171 12 24 24 24113 22 23 11140 24 36 23
Table A-8. Amount of H2 per cm2 surface, experiment at 70 °C.
Day A
S1 S2 S3 S4 S5
0 0 0 0 0 017 18 15 18 8 1635 23 24 12 2467 32 18 3499 19 24154 27
A1 A2 A3 A4 A5
0 0 0 0 0 017 183 91 30 204 7035 165 38 3551 12367 241 1409 98999 1094 173154 96

SKB R-16-01 45
Table A-9. Amount of H2 per cm2 surface, experiment at 30 °C.
Day A
S1 S2 S3 S4 S5
0 0 0 0 0 08 3 3 3 8 422 6 8 13 24 1043 14 16 24 1171 22 28 16113 30 21140 25
A1 A2 A3 A4 A5
0 0 0 0 0 08 15 19 14 13 1322 22 35 29 14 3243 35 34 9 3771 47 23 60113 0 75140 93

Arkite
ktkop
ia AB
, Bro
mm
a, 20
16
SVENSK KÄRNBRÄNSLEHANTERING
SKB is tasked with managing Swedish nuclear and radioactive waste in a safe way.
skb.se