release 0.10.0 luke campagnola - read the docs
TRANSCRIPT
pyqtgraph DocumentationRelease 0.10.0
Luke Campagnola
Feb 04, 2018


Contents
1 Introduction 31.1 What is pyqtgraph? . . . . . . . . . . . . . . . . . . . . . . . . . . . . . . . . . . . . . . . . . . . . 31.2 What can it do? . . . . . . . . . . . . . . . . . . . . . . . . . . . . . . . . . . . . . . . . . . . . . . 31.3 Examples . . . . . . . . . . . . . . . . . . . . . . . . . . . . . . . . . . . . . . . . . . . . . . . . . 41.4 How does it compare to. . . . . . . . . . . . . . . . . . . . . . . . . . . . . . . . . . . . . . . . . . . 4
2 Mouse Interaction 52.1 2D Graphics . . . . . . . . . . . . . . . . . . . . . . . . . . . . . . . . . . . . . . . . . . . . . . . 52.2 Context Menu . . . . . . . . . . . . . . . . . . . . . . . . . . . . . . . . . . . . . . . . . . . . . . 52.3 3D Graphics . . . . . . . . . . . . . . . . . . . . . . . . . . . . . . . . . . . . . . . . . . . . . . . 6
3 How to use pyqtgraph 73.1 Command-line use . . . . . . . . . . . . . . . . . . . . . . . . . . . . . . . . . . . . . . . . . . . . 73.2 Displaying windows from within an application . . . . . . . . . . . . . . . . . . . . . . . . . . . . . 83.3 Embedding widgets inside PyQt applications . . . . . . . . . . . . . . . . . . . . . . . . . . . . . . 83.4 PyQt and PySide . . . . . . . . . . . . . . . . . . . . . . . . . . . . . . . . . . . . . . . . . . . . . 83.5 Embedding PyQtGraph as a sub-package of a larger project . . . . . . . . . . . . . . . . . . . . . . 9
4 Installation 11
5 Qt Crash Course 135.1 QWidgets and Layouts . . . . . . . . . . . . . . . . . . . . . . . . . . . . . . . . . . . . . . . . . . 135.2 Naming Conventions . . . . . . . . . . . . . . . . . . . . . . . . . . . . . . . . . . . . . . . . . . . 145.3 Signals, Slots, and Events . . . . . . . . . . . . . . . . . . . . . . . . . . . . . . . . . . . . . . . . 145.4 GraphicsView and GraphicsItems . . . . . . . . . . . . . . . . . . . . . . . . . . . . . . . . . . . . 145.5 Coordinate Systems and Transformations . . . . . . . . . . . . . . . . . . . . . . . . . . . . . . . . 155.6 Mouse and Keyboard Input . . . . . . . . . . . . . . . . . . . . . . . . . . . . . . . . . . . . . . . 155.7 QTimer, Multi-Threading . . . . . . . . . . . . . . . . . . . . . . . . . . . . . . . . . . . . . . . . 155.8 Multi-threading vs Multi-processing in Qt . . . . . . . . . . . . . . . . . . . . . . . . . . . . . . . . 15
6 Plotting in pyqtgraph 176.1 Organization of Plotting Classes . . . . . . . . . . . . . . . . . . . . . . . . . . . . . . . . . . . . . 176.2 Examples . . . . . . . . . . . . . . . . . . . . . . . . . . . . . . . . . . . . . . . . . . . . . . . . . 18
7 Displaying images and video 21
8 3D Graphics 23
i
9 Line, Fill, and Color 259.1 Default Background and Foreground Colors . . . . . . . . . . . . . . . . . . . . . . . . . . . . . . . 25
10 Interactive Data Selection Controls 2710.1 Linear Selection and Marking . . . . . . . . . . . . . . . . . . . . . . . . . . . . . . . . . . . . . . 2710.2 2D Selection and Marking . . . . . . . . . . . . . . . . . . . . . . . . . . . . . . . . . . . . . . . . 27
11 Exporting 2911.1 Exporting from the GUI . . . . . . . . . . . . . . . . . . . . . . . . . . . . . . . . . . . . . . . . . 2911.2 Export Formats . . . . . . . . . . . . . . . . . . . . . . . . . . . . . . . . . . . . . . . . . . . . . . 2911.3 Exporting from the API . . . . . . . . . . . . . . . . . . . . . . . . . . . . . . . . . . . . . . . . . 3011.4 Exporting 3D Graphics . . . . . . . . . . . . . . . . . . . . . . . . . . . . . . . . . . . . . . . . . . 30
12 Rapid GUI prototyping 3112.1 Parameter Trees . . . . . . . . . . . . . . . . . . . . . . . . . . . . . . . . . . . . . . . . . . . . . 3112.2 Visual Programming Flowcharts . . . . . . . . . . . . . . . . . . . . . . . . . . . . . . . . . . . . . 3112.3 Graphical Canvas . . . . . . . . . . . . . . . . . . . . . . . . . . . . . . . . . . . . . . . . . . . . . 3112.4 Dockable Widgets . . . . . . . . . . . . . . . . . . . . . . . . . . . . . . . . . . . . . . . . . . . . 32
13 Parameter Trees 3313.1 ParameterTree API Reference . . . . . . . . . . . . . . . . . . . . . . . . . . . . . . . . . . . . . . 33
14 Visual Programming with Flowcharts 3514.1 flowchart.Flowchart . . . . . . . . . . . . . . . . . . . . . . . . . . . . . . . . . . . . . . . . . . . 3614.2 flowchart.Node . . . . . . . . . . . . . . . . . . . . . . . . . . . . . . . . . . . . . . . . . . . . . . 3614.3 flowchart.Terminal . . . . . . . . . . . . . . . . . . . . . . . . . . . . . . . . . . . . . . . . . . . . 3614.4 Basic Use . . . . . . . . . . . . . . . . . . . . . . . . . . . . . . . . . . . . . . . . . . . . . . . . . 3614.5 Implementing Custom Nodes . . . . . . . . . . . . . . . . . . . . . . . . . . . . . . . . . . . . . . 3714.6 Using Nodes Without Flowcharts . . . . . . . . . . . . . . . . . . . . . . . . . . . . . . . . . . . . 38
15 Internals - Extensions to Qt’s GraphicsView 39
16 API Reference 4116.1 Global Configuration Options . . . . . . . . . . . . . . . . . . . . . . . . . . . . . . . . . . . . . . 4116.2 PyQtGraph’s Helper Functions . . . . . . . . . . . . . . . . . . . . . . . . . . . . . . . . . . . . . . 4216.3 PyQtGraph’s Graphics Items . . . . . . . . . . . . . . . . . . . . . . . . . . . . . . . . . . . . . . . 4316.4 PyQtGraph’s Widgets . . . . . . . . . . . . . . . . . . . . . . . . . . . . . . . . . . . . . . . . . . 4516.5 PyQtGraph’s 3D Graphics System . . . . . . . . . . . . . . . . . . . . . . . . . . . . . . . . . . . . 4816.6 ColorMap . . . . . . . . . . . . . . . . . . . . . . . . . . . . . . . . . . . . . . . . . . . . . . . . . 4916.7 GraphicsScene and Mouse Events . . . . . . . . . . . . . . . . . . . . . . . . . . . . . . . . . . . . 49
17 Indices and tables 51
ii
pyqtgraph Documentation, Release 0.10.0
Contents:
Contents 1

pyqtgraph Documentation, Release 0.10.0
2 Contents

CHAPTER 1
Introduction
1.1 What is pyqtgraph?
PyQtGraph is a graphics and user interface library for Python that provides functionality commonly required in en-gineering and science applications. Its primary goals are 1) to provide fast, interactive graphics for displaying data(plots, video, etc.) and 2) to provide tools to aid in rapid application development (for example, property trees such asused in Qt Designer).
PyQtGraph makes heavy use of the Qt GUI platform (via PyQt or PySide) for its high-performance graphics andnumpy for heavy number crunching. In particular, pyqtgraph uses Qt’s GraphicsView framework which is a highlycapable graphics system on its own; we bring optimized and simplified primitives to this framework to allow datavisualization with minimal effort.
It is known to run on Linux, Windows, and OSX
1.2 What can it do?
Amongst the core features of pyqtgraph are:
• Basic data visualization primitives: Images, line and scatter plots
• Fast enough for realtime update of video/plot data
• Interactive scaling/panning, averaging, FFTs, SVG/PNG export
• Widgets for marking/selecting plot regions
• Widgets for marking/selecting image region-of-interest and automatically slicing multi-dimensional image data
• Framework for building customized image region-of-interest widgets
• Docking system that replaces/complements Qt’s dock system to allow more complex (and more predictable)docking arrangements
• ParameterTree widget for rapid prototyping of dynamic interfaces (Similar to the property trees in Qt Designerand many other applications)
3
pyqtgraph Documentation, Release 0.10.0
1.3 Examples
PyQtGraph includes an extensive set of examples that can be accessed by running:
import pyqtgraph.examplespyqtgraph.examples.run()
Or by running python examples/ from the source root.
This will start a launcher with a list of available examples. Select an item from the list to view its source code anddouble-click an item to run the example.
Note If you have installed pyqtgraph with python setup.py develop then the examples are incorrectly exposedas a top-level module. In this case, use import examples; examples.run().
1.4 How does it compare to. . .
• matplotlib: For plotting, pyqtgraph is not nearly as complete/mature as matplotlib, but runs much faster. Mat-plotlib is more aimed toward making publication-quality graphics, whereas pyqtgraph is intended for use indata acquisition and analysis applications. Matplotlib is more intuitive for matlab programmers; pyqtgraph ismore intuitive for python/qt programmers. Matplotlib (to my knowledge) does not include many of pyqtgraph’sfeatures such as image interaction, volumetric rendering, parameter trees, flowcharts, etc.
• pyqwt5: About as fast as pyqwt5, but not quite as complete for plotting functionality. Image handling inpyqtgraph is much more complete (again, no ROI widgets in qwt). Also, pyqtgraph is written in pure python,so it is more portable than pyqwt, which often lags behind pyqt in development (I originally used pyqwt, butdecided it was too much trouble to rely on it as a dependency in my projects). Like matplotlib, pyqwt (to myknowledge) does not include many of pyqtgraph’s features such as image interaction, volumetric rendering,parameter trees, flowcharts, etc.
(My experience with these libraries is somewhat outdated; please correct me if I am wrong here)
4 Chapter 1. Introduction
CHAPTER 2
Mouse Interaction
Most applications that use pyqtgraph’s data visualization will generate widgets that can be interactively scaled, panned,and otherwise configured using the mouse. This section describes mouse interaction with these widgets.
2.1 2D Graphics
In pyqtgraph, most 2D visualizations follow the following mouse interaction:
• Left button: Interacts with items in the scene (select/move objects, etc). If there are no movable objects underthe mouse cursor, then dragging with the left button will pan the scene instead.
• Right button drag: Scales the scene. Dragging left/right scales horizontally; dragging up/down scales vertically(although some scenes will have their x/y scales locked together). If there are x/y axes fisible in the scene, thenright-dragging over the axis will _only_ affect that axis.
• Right button click: Clicking the right button in most cases will show a context menu with a variety of optionsdepending on the object(s) under the mouse cursor.
• Middle button (or wheel) drag: Dragging the mouse with the wheel pressed down will always pan the scene(this is useful in instances where panning with the left button is prevented by other objects in the scene).
• Wheel spin: Zooms the scene in and out.
For machines where dragging with the right or middle buttons is difficult (usually Mac), another mouse interactionmode exists. In this mode, dragging with the left mouse button draws a box over a region of the scene. After the buttonis released, the scene is scaled and panned to fit the box. This mode can be accessed in the context menu or by calling:
pyqtgraph.setConfigOption('leftButtonPan', False)
2.2 Context Menu
Right-clicking on most scenes will show a context menu with various options for changing the behavior of the scene.Some of the options available in this menu are:
5

pyqtgraph Documentation, Release 0.10.0
• Enable/disable automatic scaling when the data range changes
• Link the axes of multiple views together
• Enable disable mouse interaction per axis
• Explicitly set the visible range values
The exact set of items available in the menu depends on the contents of the scene and the object clicked on.
2.3 3D Graphics
3D visualizations use the following mouse interaction:
• Left button drag: Rotates the scene around a central point
• Middle button drag: Pan the scene by moving the central “look-at” point within the x-y plane
• Middle button drag + CTRL: Pan the scene by moving the central “look-at” point along the z axis
• Wheel spin: zoom in/out
• Wheel + CTRL: change field-of-view angle
And keyboard controls:
• Arrow keys rotate around central point, just like dragging the left mouse button
6 Chapter 2. Mouse Interaction
CHAPTER 3
How to use pyqtgraph
There are a few suggested ways to use pyqtgraph:
• From the interactive shell (python -i, ipython, etc)
• Displaying pop-up windows from an application
• Embedding widgets in a PyQt application
3.1 Command-line use
PyQtGraph makes it very easy to visualize data from the command line. Observe:
import pyqtgraph as pgpg.plot(data) # data can be a list of values or a numpy array
The example above would open a window displaying a line plot of the data given. The call to pg.plot returns ahandle to the plot widget that is created, allowing more data to be added to the same window. Note: interactiveplotting from the python prompt is only available with PyQt; PySide does not run the Qt event loop while the interactiveprompt is running. If you wish to use pyqtgraph interactively with PySide, see the ‘console’ example.
Further examples:
pw = pg.plot(xVals, yVals, pen='r') # plot x vs y in redpw.plot(xVals, yVals2, pen='b')
win = pg.GraphicsWindow() # Automatically generates grids with multiple itemswin.addPlot(data1, row=0, col=0)win.addPlot(data2, row=0, col=1)win.addPlot(data3, row=1, col=0, colspan=2)
pg.show(imageData) # imageData must be a numpy array with 2 to 4 dimensions
We’re only scratching the surface here–these functions accept many different data formats and options for customizingthe appearance of your data.
7

pyqtgraph Documentation, Release 0.10.0
3.2 Displaying windows from within an application
While I consider this approach somewhat lazy, it is often the case that ‘lazy’ is indistinguishable from ‘highly efficient’.The approach here is simply to use the very same functions that would be used on the command line, but from withinan existing application. I often use this when I simply want to get a immediate feedback about the state of data in myapplication without taking the time to build a user interface for it.
3.3 Embedding widgets inside PyQt applications
For the serious application developer, all of the functionality in pyqtgraph is available via widgets that can be embeddedjust like any other Qt widgets. Most importantly, see: PlotWidget, ImageView, GraphicsLayoutWidget,and GraphicsView. PyQtGraph’s widgets can be included in Designer’s ui files via the “Promote To. . . ” function-ality:
1. In Designer, create a QGraphicsView widget (“Graphics View” under the “Display Widgets” category).
2. Right-click on the QGraphicsView and select “Promote To. . . ”.
3. Under “Promoted class name”, enter the class name you wish to use (“PlotWidget”, “GraphicsLayoutWidget”,etc).
4. Under “Header file”, enter “pyqtgraph”.
5. Click “Add”, then click “Promote”.
See the designer documentation for more information on promoting widgets. The “VideoSpeedTest” and “Scatter-PlotSpeedTest” examples both demonstrate the use of .ui files that are compiled to .py modules using pyuic4 orpyside-uic. The “designerExample” example demonstrates dynamically generating python classes from .ui files (nopyuic4 / pyside-uic needed).
3.4 PyQt and PySide
PyQtGraph supports two popular python wrappers for the Qt library: PyQt and PySide. Both packages provide nearlyidentical APIs and functionality, but for various reasons (discussed elsewhere) you may prefer to use one package orthe other. When pyqtgraph is first imported, it automatically determines which library to use by making the fillowingchecks:
1. If PyQt4 is already imported, use that
2. Else, if PySide is already imported, use that
3. Else, attempt to import PyQt4
4. If that import fails, attempt to import PySide.
If you have both libraries installed on your system and you wish to force pyqtgraph to use one or the other, simplymake sure it is imported before pyqtgraph:
import PySide ## this will force pyqtgraph to use PySide instead of PyQt4import pyqtgraph as pg
8 Chapter 3. How to use pyqtgraph

pyqtgraph Documentation, Release 0.10.0
3.5 Embedding PyQtGraph as a sub-package of a larger project
When writing applications or python packages that make use of pyqtgraph, it is most common to install pyqtgraphsystem-wide (or within a virtualenv) and simply call import pyqtgraph from within your application. The main benefitto this is that pyqtgraph is configured independently of your application and thus you (or your users) are free to installnewer versions of pyqtgraph without changing anything in your application. This is standard practice when developingwith python.
However, it is also often the case, especially for scientific applications, that software is written for a very specificpurpose and then archived. If we want to ensure that the software will still work ten years later, then it is preferrableto tie the application to a very specific version of pyqtgraph and avoid importing the system-installed version ofpyqtgraph, which may be much newer (and potentially incompatible). This is especially the case when the applicationrequires site-specific modifications to the pyqtgraph package which may not be present in the main releases.
PyQtGraph facilitates this usage through two mechanisms. First, all internal import statements in pyqtgraph arerelative, which allows the package to be renamed or used as a sub-package without any naming conflicts with otherversions of pyqtgraph on the system (that is, pyqtgraph never refers to itself internally as ‘pyqtgraph’). Second, a gitsubtree repository is available at https://github.com/pyqtgraph/pyqtgraph-core.git that contains only the ‘pyqtgraph/’subtree, allowing the code to be cloned directly as a subtree of the application which uses it.
The basic approach is to clone the repository into the appropriate location in your package. When you import pyqtgraphfrom within your package, be sure to use the full name to avoid importing any system-installed pyqtgraph packages.For example, imagine a simple project has the following structure:
my_project/__init__.pyplotting.py
"""Plotting functions used by this package"""import pyqtgraph as pgdef my_plot_function(*data):
pg.plot(*data)
To embed a specific version of pyqtgraph, we would clone the pyqtgraph-core repository inside the project:
my_project$ git clone https://github.com/pyqtgraph/pyqtgraph-core.git
Then adjust the import statements accordingly:
my_project/__init__.pypyqtgraph/plotting.py
"""Plotting functions used by this package"""import my_project.pyqtgraph as pg # be sure to use the local subpackage
# rather than any globally-installed# versions.
def my_plot_function(*data):pg.plot(*data)
Use git checkout pyqtgraph-core-x.x.x to select a specific version of the repository, or use git pullto pull pyqtgraph updates from upstream (see the git documentation for more information).
For projects that already use git for code control, it is also possible to include pyqtgraph as a git subtree within yourown repository. The major advantage to this approach is that, in addition to being able to pull pyqtgraph updates fromthe upstream repository, it is also possible to commit your local pyqtgraph changes into the project repository and pushthose changes upstream:
3.5. Embedding PyQtGraph as a sub-package of a larger project 9
pyqtgraph Documentation, Release 0.10.0
my_project$ git remote add pyqtgraph-core https://github.com/pyqtgraph/pyqtgraph-core.→˓gitmy_project$ git fetch pyqtgraph-coremy_project$ git merge -s ours --no-commit pyqtgraph-core/coremy_project$ mkdir pyqtgraphmy_project$ git read-tree -u --prefix=pyqtgraph/ pyqtgraph-core/coremy_project$ git commit -m "Added pyqtgraph to project repository"
See the git subtree documentation for more information.
10 Chapter 3. How to use pyqtgraph
CHAPTER 4
Installation
PyQtGraph does not really require any installation scripts. All that is needed is for the pyqtgraph folder to be placedsomeplace importable. Most people will prefer to simply place this folder within a larger project folder. If you wantto make pyqtgraph available system-wide, use one of the methods listed below:
• Debian, Ubuntu, and similar Linux: Download the .deb file linked at the top of the pyqtgraph web page orinstall using apt by putting “deb http://luke.campagnola.me/debian dev/” in your /etc/apt/sources.list file andinstall the python-pyqtgraph package.
• Arch Linux: Looks like someone has posted unofficial packages for Arch (thanks windel). (https://aur.archlinux.org/packages.php?ID=62577)
• Windows: Download and run the .exe installer file linked at the top of the pyqtgraph web page.
• Everybody (including OSX): Download the .tar.gz source package linked at the top of the pyqtgraph web page,extract its contents, and run “python setup.py install” from within the extracted directory.
11
pyqtgraph Documentation, Release 0.10.0
12 Chapter 4. Installation

CHAPTER 5
Qt Crash Course
PyQtGraph makes extensive use of Qt for generating nearly all of its visual output and interfaces. Qt’s documentationis very well written and we encourage all pyqtgraph developers to familiarize themselves with it. The purpose ofthis section is to provide an introduction to programming with Qt (using either PyQt or PySide) for the pyqtgraphdeveloper.
5.1 QWidgets and Layouts
A Qt GUI is almost always composed of a few basic components:
• A window. This is often provided by QMainWindow, but note that all QWidgets can be displayed in theirwindow by simply calling widget.show() if the widget does not have a parent.
• Multiple QWidget instances such as QPushButton, QLabel, QComboBox, etc.
• QLayout instances (optional, but strongly encouraged) which automatically manage the positioning of widgetsto allow the GUI to resize in a usable way.
PyQtGraph fits into this scheme by providing its own QWidget subclasses to be inserted into your GUI.
Example:
from PyQt4 import QtGui # (the example applies equally well to PySide)import pyqtgraph as pg
## Always start by initializing Qt (only once per application)app = QtGui.QApplication([])
## Define a top-level widget to hold everythingw = QtGui.QWidget()
## Create some widgets to be placed insidebtn = QtGui.QPushButton('press me')text = QtGui.QLineEdit('enter text')listw = QtGui.QListWidget()
13
pyqtgraph Documentation, Release 0.10.0
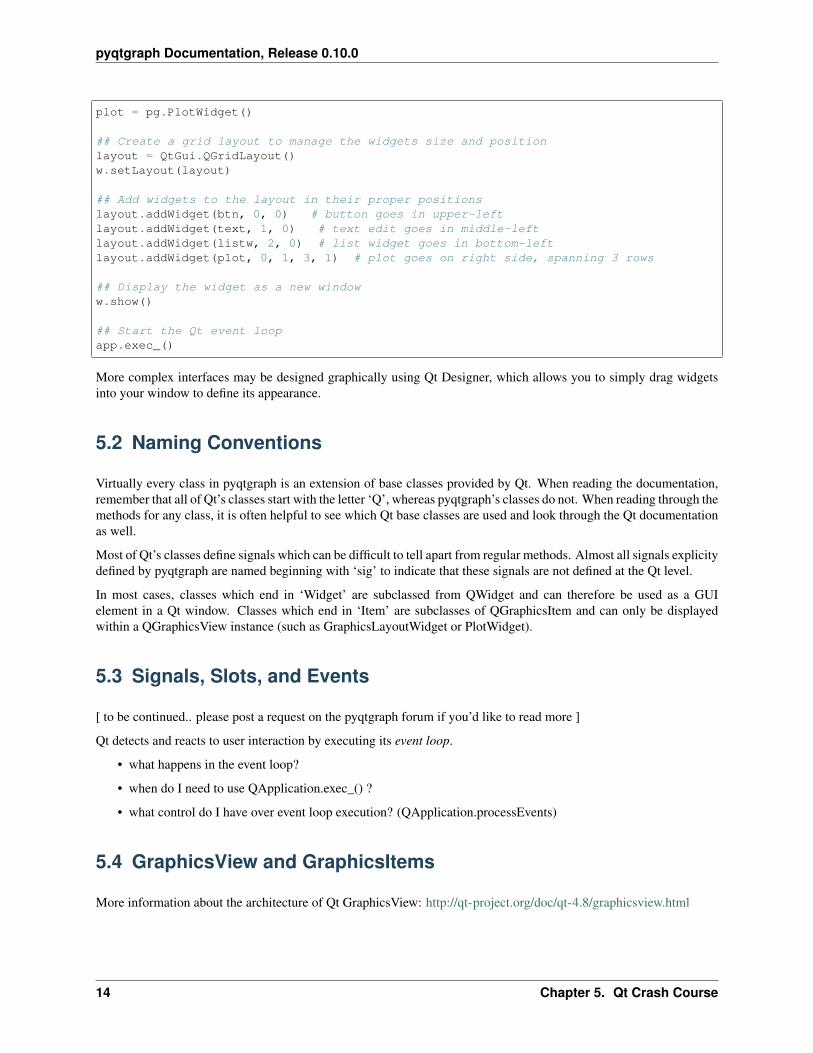
plot = pg.PlotWidget()
## Create a grid layout to manage the widgets size and positionlayout = QtGui.QGridLayout()w.setLayout(layout)
## Add widgets to the layout in their proper positionslayout.addWidget(btn, 0, 0) # button goes in upper-leftlayout.addWidget(text, 1, 0) # text edit goes in middle-leftlayout.addWidget(listw, 2, 0) # list widget goes in bottom-leftlayout.addWidget(plot, 0, 1, 3, 1) # plot goes on right side, spanning 3 rows
## Display the widget as a new windoww.show()
## Start the Qt event loopapp.exec_()
More complex interfaces may be designed graphically using Qt Designer, which allows you to simply drag widgetsinto your window to define its appearance.
5.2 Naming Conventions
Virtually every class in pyqtgraph is an extension of base classes provided by Qt. When reading the documentation,remember that all of Qt’s classes start with the letter ‘Q’, whereas pyqtgraph’s classes do not. When reading through themethods for any class, it is often helpful to see which Qt base classes are used and look through the Qt documentationas well.
Most of Qt’s classes define signals which can be difficult to tell apart from regular methods. Almost all signals explicitydefined by pyqtgraph are named beginning with ‘sig’ to indicate that these signals are not defined at the Qt level.
In most cases, classes which end in ‘Widget’ are subclassed from QWidget and can therefore be used as a GUIelement in a Qt window. Classes which end in ‘Item’ are subclasses of QGraphicsItem and can only be displayedwithin a QGraphicsView instance (such as GraphicsLayoutWidget or PlotWidget).
5.3 Signals, Slots, and Events
[ to be continued.. please post a request on the pyqtgraph forum if you’d like to read more ]
Qt detects and reacts to user interaction by executing its event loop.
• what happens in the event loop?
• when do I need to use QApplication.exec_() ?
• what control do I have over event loop execution? (QApplication.processEvents)
5.4 GraphicsView and GraphicsItems
More information about the architecture of Qt GraphicsView: http://qt-project.org/doc/qt-4.8/graphicsview.html
14 Chapter 5. Qt Crash Course
pyqtgraph Documentation, Release 0.10.0
5.5 Coordinate Systems and Transformations
More information about the coordinate systems in Qt GraphicsView: http://qt-project.org/doc/qt-4.8/graphicsview.html#the-graphics-view-coordinate-system
5.6 Mouse and Keyboard Input
5.7 QTimer, Multi-Threading
5.8 Multi-threading vs Multi-processing in Qt
5.5. Coordinate Systems and Transformations 15

pyqtgraph Documentation, Release 0.10.0
16 Chapter 5. Qt Crash Course
CHAPTER 6
Plotting in pyqtgraph
There are a few basic ways to plot data in pyqtgraph:
pyqtgraph.plot() Create a new plot window showing your dataPlotWidget.plot() Add a new set of data to an existing plot widgetPlotItem.plot() Add a new set of data to an existing plot widgetGraphicsLayout.addPlot() Add a new plot to a grid of plots
All of these will accept the same basic arguments which control how the plot data is interpreted and displayed:
• x - Optional X data; if not specified, then a range of integers will be generated automatically.
• y - Y data.
• pen - The pen to use when drawing plot lines, or None to disable lines.
• symbol - A string describing the shape of symbols to use for each point. Optionally, this may also be a sequenceof strings with a different symbol for each point.
• symbolPen - The pen (or sequence of pens) to use when drawing the symbol outline.
• symbolBrush - The brush (or sequence of brushes) to use when filling the symbol.
• fillLevel - Fills the area under the plot curve to this Y-value.
• brush - The brush to use when filling under the curve.
See the ‘plotting’ example for a demonstration of these arguments.
All of the above functions also return handles to the objects that are created, allowing the plots and data to be furthermodified.
6.1 Organization of Plotting Classes
There are several classes invloved in displaying plot data. Most of these classes are instantiated automatically, but itis useful to understand how they are organized and relate to each other. PyQtGraph is based heavily on Qt’s Graph-
17

pyqtgraph Documentation, Release 0.10.0
icsView framework–if you are not already familiar with this, it’s worth reading about (but not essential). Most im-portantly: 1) Qt GUIs are composed of QWidgets, 2) A special widget called QGraphicsView is used for displayingcomplex graphics, and 3) QGraphicsItems define the objects that are displayed within a QGraphicsView.
• Data Classes (all subclasses of QGraphicsItem)
– PlotCurveItem - Displays a plot line given x,y data
– ScatterPlotItem - Displays points given x,y data
– PlotDataItem - Combines PlotCurveItem and ScatterPlotItem. The plotting functions discussedabove create objects of this type.
• Container Classes (subclasses of QGraphicsItem; contain other QGraphicsItem objects and must be viewed from within a GraphicsView)
– PlotItem - Contains a ViewBox for displaying data as well as AxisItems and labels for display-ing the axes and title. This is a QGraphicsItem subclass and thus may only be used from within aGraphicsView
– GraphicsLayout - QGraphicsItem subclass which displays a grid of items. This is used to displaymultiple PlotItems together.
– ViewBox - A QGraphicsItem subclass for displaying data. The user may scale/pan the contents ofa ViewBox using the mouse. Typically all PlotData/PlotCurve/ScatterPlotItems are displayed fromwithin a ViewBox.
– AxisItem - Displays axis values, ticks, and labels. Most commonly used with PlotItem.
• Container Classes (subclasses of QWidget; may be embedded in PyQt GUIs)
– PlotWidget - A subclass of GraphicsView with a single PlotItem displayed. Most of the methodsprovided by PlotItem are also available through PlotWidget.
– GraphicsLayoutWidget - QWidget subclass displaying a single GraphicsLayoutItem. Most ofthe methods provided by GraphicsLayoutItem are also available through GraphicsLayoutWidget.
6.2 Examples
See the ‘plotting’ and ‘PlotWidget’ examples included with pyqtgraph for more information.
Show x,y data as scatter plot:
18 Chapter 6. Plotting in pyqtgraph
pyqtgraph Documentation, Release 0.10.0
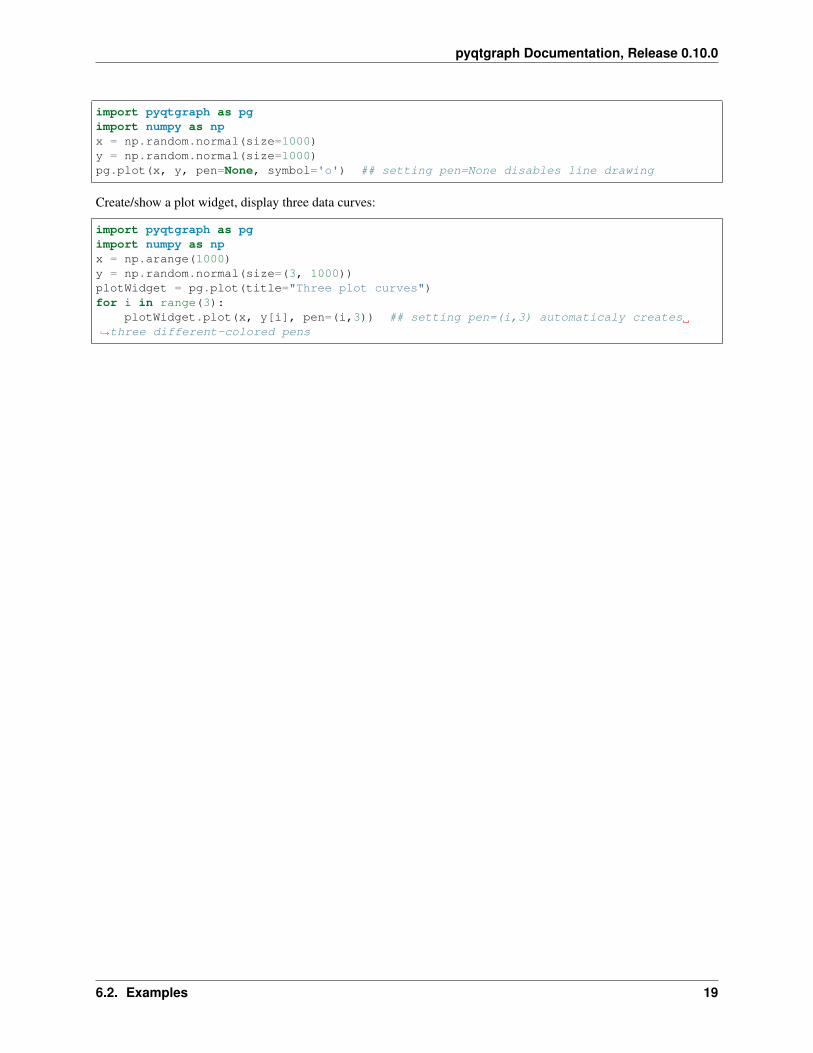
import pyqtgraph as pgimport numpy as npx = np.random.normal(size=1000)y = np.random.normal(size=1000)pg.plot(x, y, pen=None, symbol='o') ## setting pen=None disables line drawing
Create/show a plot widget, display three data curves:
import pyqtgraph as pgimport numpy as npx = np.arange(1000)y = np.random.normal(size=(3, 1000))plotWidget = pg.plot(title="Three plot curves")for i in range(3):
plotWidget.plot(x, y[i], pen=(i,3)) ## setting pen=(i,3) automaticaly creates→˓three different-colored pens
6.2. Examples 19
pyqtgraph Documentation, Release 0.10.0
20 Chapter 6. Plotting in pyqtgraph

CHAPTER 7
Displaying images and video
PyQtGraph displays 2D numpy arrays as images and provides tools for determining how to translate between thenumpy data type and RGB values on the screen. If you want to display data from common image and video fileformats, you will need to load the data first using another library (PIL works well for images and built-in numpyconversion).
The easiest way to display 2D or 3D data is using the pyqtgraph.image() function:
import pyqtgraph as pgpg.image(imageData)
This function will accept any floating-point or integer data types and displays a single ImageView widget containingyour data. This widget includes controls for determining how the image data will be converted to 32-bit RGBa values.Conversion happens in two steps (both are optional):
1. Scale and offset the data (by selecting the dark/light levels on the displayed histogram)
2. Convert the data to color using a lookup table (determined by the colors shown in the gradient editor)
If the data is 3D (time, x, y), then a time axis will be shown with a slider that can set the currently displayed frame. (ifthe axes in your data are ordered differently, use numpy.transpose to rearrange them)
There are a few other methods for displaying images as well:
• The ImageView class can also be instantiated directly and embedded in Qt applications.
• Instances of ImageItem can be used inside a ViewBox or GraphicsView.
• For higher performance, use RawImageWidget.
Any of these classes are acceptable for displaying video by calling setImage() to display a new frame. To increaseperformance, the image processing system uses scipy.weave to produce compiled libraries. If your computer has acompiler available, weave will automatically attempt to build the libraries it needs on demand. If this fails, then theslower pure-python methods will be used instead.
For more information, see the classes listed above and the ‘VideoSpeedTest’, ‘ImageItem’, ‘ImageView’, and ‘His-togramLUT’ Examples.
21
pyqtgraph Documentation, Release 0.10.0
22 Chapter 7. Displaying images and video
CHAPTER 8
3D Graphics
PyQtGraph uses OpenGL to provide a 3D scenegraph system. This system is functional but still early in development.Current capabilities include:
• 3D view widget with zoom/rotate controls (mouse drag and wheel)
• Scenegraph allowing items to be added/removed from scene with per-item transformations and parent/childrelationships.
• Triangular meshes
• Basic mesh computation functions: isosurfaces, per-vertex normals
• Volumetric rendering item
• Grid/axis items
See the API Reference and the Volumetric (GLVolumeItem.py) and Isosurface (GLMeshItem.py) examples for moreinformation.
Basic usage example:
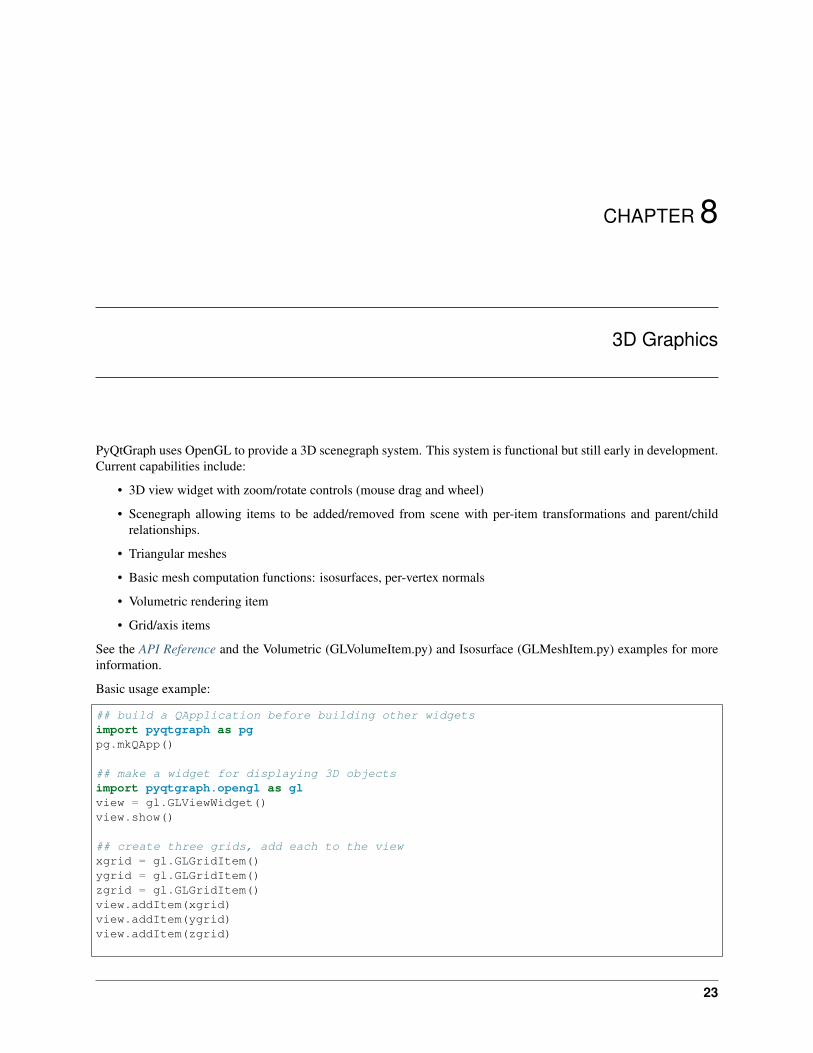
## build a QApplication before building other widgetsimport pyqtgraph as pgpg.mkQApp()
## make a widget for displaying 3D objectsimport pyqtgraph.opengl as glview = gl.GLViewWidget()view.show()
## create three grids, add each to the viewxgrid = gl.GLGridItem()ygrid = gl.GLGridItem()zgrid = gl.GLGridItem()view.addItem(xgrid)view.addItem(ygrid)view.addItem(zgrid)
23

pyqtgraph Documentation, Release 0.10.0
## rotate x and y grids to face the correct directionxgrid.rotate(90, 0, 1, 0)ygrid.rotate(90, 1, 0, 0)
## scale each grid differentlyxgrid.scale(0.2, 0.1, 0.1)ygrid.scale(0.2, 0.1, 0.1)zgrid.scale(0.1, 0.2, 0.1)
24 Chapter 8. 3D Graphics
CHAPTER 9
Line, Fill, and Color
Qt relies on its QColor, QPen and QBrush classes for specifying line and fill styles for all of its drawing. Internally,pyqtgraph uses the same system but also allows many shorthand methods of specifying the same style options.
Many functions and methods in pyqtgraph accept arguments specifying the line style (pen), fill style (brush), or color.For most of these function arguments, the following values may be used:
• single-character string representing color (b, g, r, c, m, y, k, w)
• (r, g, b) or (r, g, b, a) tuple
• single greyscale value (0.0 - 1.0)
• (index, maximum) tuple for automatically iterating through colors (see intColor)
• QColor
• QPen / QBrush where appropriate
Notably, more complex pens and brushes can be easily built using the mkPen() / mkBrush() functions or with Qt’sQPen and QBrush classes:
mkPen('y', width=3, style=QtCore.Qt.DashLine) ## Make a dashed yellow line→˓2px widemkPen(0.5) ## solid grey line 1px widemkPen(color=(200, 200, 255), style=QtCore.Qt.DotLine) ## Dotted pale-blue line
See the Qt documentation for ‘QPen’ and ‘PenStyle’ for more line-style options and ‘QBrush’ for more fill options.Colors can also be built using mkColor(), intColor(), hsvColor(), or Qt’s QColor class.
9.1 Default Background and Foreground Colors
By default, pyqtgraph uses a black background for its plots and grey for axes, text, and plot lines. These defaults canbe changed using pyqtgraph.setConfigOption():
25

pyqtgraph Documentation, Release 0.10.0
import pyqtgraph as pg
## Switch to using white background and black foregroundpg.setConfigOption('background', 'w')pg.setConfigOption('foreground', 'k')
## The following plot has inverted colorspg.plot([1,4,2,3,5])
(Note that this must be set before creating any widgets)
26 Chapter 9. Line, Fill, and Color

CHAPTER 10
Interactive Data Selection Controls
PyQtGraph includes graphics items which allow the user to select and mark regions of data.
10.1 Linear Selection and Marking
Two classes allow marking and selecting 1-dimensional data: LinearRegionItem and InfiniteLine. The firstclass, LinearRegionItem, may be added to any ViewBox or PlotItem to mark either a horizontal or vertical region.The region can be dragged and its bounding edges can be moved independently. The second class, InfiniteLine,is usually used to mark a specific position along the x or y axis. These may be dragged by the user.
10.2 2D Selection and Marking
To select a 2D region from an image, pyqtgraph uses the ROI class or any of its subclasses. By default, ROI simplydisplays a rectangle which can be moved by the user to mark a specific region (most often this will be a region of animage, but this is not required). To allow the ROI to be resized or rotated, there are several methods for adding handles(addScaleHandle, addRotateHandle, etc.) which can be dragged by the user. These handles may be placedat any location relative to the ROI and may scale/rotate the ROI around any arbitrary center point. There are severalROI subclasses with a variety of shapes and modes of interaction.
To automatically extract a region of image data using an ROI and an ImageItem, use ROI.getArrayRegion. ROIclasses use the affineSlice function to perform this extraction.
ROI can also be used as a control for moving/rotating/scaling items in a scene similar to most vetctor graphics editingapplications.
See the ROITypes example for more information.
27

pyqtgraph Documentation, Release 0.10.0
28 Chapter 10. Interactive Data Selection Controls

CHAPTER 11
Exporting
PyQtGraph provides a variety of export formats for all 2D graphics. For 3D graphics, see Exporting 3D Graphicsbelow.
11.1 Exporting from the GUI
Any 2D graphics can be exported by right-clicking on the graphic, then selecting ‘export’ from the context menu. Thiswill display the export dialog in which the user must:
1. Select an item (or the entire scene) to export. Selecting an item will cause the item to be hilighted in the originalgraphic window (but this hilight will not be displayed in the exported file).
2. Select an export format.
3. Change any desired export options.
4. Click the ‘export’ button.
11.2 Export Formats
• Image - PNG is the default format. The exact set of image formats supported will depend on your Qt libraries.However, common formats such as PNG, JPG, and TIFF are almost always available.
• SVG - Graphics exported as SVG are targeted to work as well as possible with both Inkscape and AdobeIllustrator. For high quality SVG export, please use PyQtGraph version 0.9.3 or later. This is the preferredmethod for generating publication graphics from PyQtGraph.
• CSV - Exports plotted data as CSV. This exporter _only_ works if a PlotItem is selected for export.
• Matplotlib - This exporter opens a new window and attempts to re-plot the data using matplotlib (if available).Note that some graphic features are either not implemented for this exporter or not available in matplotlib. Thisexporter _only_ works if a PlotItem is selected for export.
29
pyqtgraph Documentation, Release 0.10.0
• Printer - Exports to the operating system’s printing service. This exporter is provided for completeness, but isnot well supported due to problems with Qt’s printing system.
11.3 Exporting from the API
To export a file programatically, follow this example:
import pyqtgraph as pgimport pyqtgraph.exporters
# generate something to exportplt = pg.plot([1,5,2,4,3])
# create an exporter instance, as an argument give it# the item you wish to exportexporter = pg.exporters.ImageExporter(plt.plotItem)
# set export parameters if neededexporter.parameters()['width'] = 100 # (note this also affects height parameter)
# save to fileexporter.export('fileName.png')
11.4 Exporting 3D Graphics
The exporting functionality described above is not yet available for 3D graphics. However, it is possible to generatean image from a GLViewWidget by using QGLWidget.grabFrameBuffer or QGLWidget.renderPixmap:
glview.grabFrameBuffer().save('fileName.png')
See the Qt documentation for more information.
30 Chapter 11. Exporting

CHAPTER 12
Rapid GUI prototyping
[Just an overview; documentation is not complete yet]
PyQtGraph offers several powerful features which are commonly used in engineering and scientific applications.
12.1 Parameter Trees
The parameter tree system provides a widget displaying a tree of modifiable values similar to those used in mostGUI editor applications. This allows a large number of variables to be controlled by the user with relatively littleprogramming effort. The system also provides separation between the data being controlled and the user interfacecontrolling it (model/view architecture). Parameters may be grouped/nested to any depth and custom parameter typescan be built by subclassing from Parameter and ParameterItem.
See the parametertree documentation for more information.
12.2 Visual Programming Flowcharts
PyQtGraph’s flowcharts provide a visual programming environment similar in concept to LabView–functional mod-ules are added to a flowchart and connected by wires to define a more complex and arbitrarily configurable algorithm.A small number of predefined modules (called Nodes) are included with pyqtgraph, but most flowchart developers willwant to define their own library of Nodes. At their core, the Nodes are little more than 1) a Python function 2) a list ofinput/output terminals, and 3) an optional widget providing a control panel for the Node. Nodes may transmit/receiveany type of Python object via their terminals.
See the flowchart documentation and the flowchart examples for more information.
12.3 Graphical Canvas
The Canvas is a system designed to allow the user to add/remove items to a 2D canvas similar to most vector graphicsapplications. Items can be translated/scaled/rotated and each item may define its own custom control interface.
31

pyqtgraph Documentation, Release 0.10.0
12.4 Dockable Widgets
The dockarea system allows the design of user interfaces which can be rearranged by the user at runtime. Dockscan be moved, resized, stacked, and torn out of the main window. This is similar in principle to the docking systembuilt into Qt, but offers a more deterministic dock placement API (in Qt it is very difficult to programatically generatecomplex dock arrangements). Additionally, Qt’s docks are designed to be used as small panels around the outer edgeof a window. PyQtGraph’s docks were created with the notion that the entire window (or any portion of it) wouldconsist of dockable components.
32 Chapter 12. Rapid GUI prototyping

CHAPTER 13
Parameter Trees
Parameter trees are a system for handling hierarchies of parameters while automatically generating one or more GUIsto display and interact with the parameters. This feature is commonly seen, for example, in user interface designapplications which display a list of editable properties for each widget. Parameters generally have a name, a datatype (int, float, string, color, etc), and a value matching the data type. Parameters may be grouped and nested to formhierarchies and may be subclassed to provide custom behavior and display widgets.
PyQtGraph’s parameter tree system works similarly to the model-view architecture used by some components of Qt:Parameters are purely data-handling classes that exist independent of any graphical interface. A ParameterTree isa widget that automatically generates a graphical interface which represents the state of a haierarchy of Parameterobjects and allows the user to edit the values within that hierarchy. This separation of data (model) and graphicalinterface (view) allows the same data to be represented multiple times and in a variety of different ways.
For more information, see the ‘parametertree’ example included with pyqtgraph and the API reference
13.1 ParameterTree API Reference
Also see the ‘parametertree’ example included with pyqtgraph
Contents:
13.1.1 Parameter
13.1.2 ParameterTree
13.1.3 Built-in Parameter Types
13.1.4 ParameterItem
33

pyqtgraph Documentation, Release 0.10.0
34 Chapter 13. Parameter Trees

CHAPTER 14
Visual Programming with Flowcharts
PyQtGraph’s flowcharts provide a visual programming environment similar in concept to LabView–functional mod-ules are added to a flowchart and connected by wires to define a more complex and arbitrarily configurable algorithm.A small number of predefined modules (called Nodes) are included with pyqtgraph, but most flowchart developers willwant to define their own library of Nodes. At their core, the Nodes are little more than 1) a python function 2) a list ofinput/output terminals, and 3) an optional widget providing a control panel for the Node. Nodes may transmit/receiveany type of Python object via their terminals.
One major limitation of flowcharts is that there is no mechanism for looping within a flowchart. (however individualNodes may contain loops (they may contain any Python code at all), and an entire flowchart may be executed fromwithin a loop).
There are two distinct modes of executing the code in a flowchart:
1. Provide data to the input terminals of the flowchart. This method is slower and will provide a graphical rep-resentation of the data as it passes through the flowchart. This is useful for debugging as it allows the user toinspect the data at each terminal and see where exceptions occurred within the flowchart.
2. Call Flowchart.process(). This method does not update the displayed state of the flowchart and onlyretains the state of each terminal as long as it is needed. Additionally, Nodes which do not contribute to theoutput values of the flowchart (such as plotting nodes) are ignored. This mode allows for faster processing oflarge data sets and avoids memory issues which can occur if too much data is present in the flowchart at once(e.g., when processing image data through several stages).
See the flowchart example for more information.
API Reference:
35

pyqtgraph Documentation, Release 0.10.0
14.1 flowchart.Flowchart
14.2 flowchart.Node
14.3 flowchart.Terminal
14.4 Basic Use
Flowcharts are most useful in situations where you have a processing stage in your application that you would liketo be arbitrarily configurable by the user. Rather than giving a pre-defined algorithm with parameters for the user totweak, you supply a set of pre-defined functions and allow the user to arrange and connect these functions how theylike. A very common example is the use of filter networks in audio / video processing applications.
To begin, you must decide what the input and output variables will be for your flowchart. Create a flowchart with oneterminal defined for each variable:
## This example creates just a single input and a single output.## Flowcharts may define any number of terminals, though.from pyqtgraph.flowchart import Flowchartfc = Flowchart(terminals={
'nameOfInputTerminal': {'io': 'in'},'nameOfOutputTerminal': {'io': 'out'}
})
In the example above, each terminal is defined by a dictionary of options which define the behavior of that terminal(see Terminal.__init__() for more information and options). Note that Terminals are not typed; any pythonobject may be passed from one Terminal to another.
Once the flowchart is created, add its control widget to your application:
ctrl = fc.ctrlWidget()myLayout.addWidget(ctrl) ## read Qt docs on QWidget and layouts for more information
The control widget provides several features:
• Displays a list of all nodes in the flowchart containing the control widget for each node.
• Provides access to the flowchart design window via the ‘flowchart’ button
• Interface for saving / restoring flowcharts to disk.
At this point your user has the ability to generate flowcharts based on the built-in node library. It is recommended toprovide a default set of flowcharts for your users to build from.
All that remains is to process data through the flowchart. As noted above, there are two ways to do this:
1. Set the values of input terminals with Flowchart.setInput(), then read the values of output terminalswith Flowchart.output():
fc.setInput(nameOfInputTerminal=newValue)output = fc.output() # returns {terminalName:value}
This method updates all of the values displayed in the flowchart design window, allowing the user to inspectvalues at all terminals in the flowchart and indicating the location of errors that occurred during processing.
2. Call Flowchart.process():
36 Chapter 14. Visual Programming with Flowcharts

pyqtgraph Documentation, Release 0.10.0
output = fc.process(nameOfInputTerminal=newValue)
This method processes data without updating any of the displayed terminal values. Additionally, all Node.process() methods are called with display=False to request that they not invoke any custom display code.This allows data to be processed both more quickly and with a smaller memory footprint, but errors that occurduring Flowchart.process() will be more difficult for the user to diagnose. It is thus recommended to use thismethod for batch processing through flowcharts that have already been tested and debugged with method 1.
14.5 Implementing Custom Nodes
PyQtGraph includes a small library of built-in flowchart nodes. This library is intended to cover some of the mostcommonly-used functions as well as provide examples for some more exotic Node types. Most applications that usethe flowchart system will find the built-in library insufficient and will thus need to implement custom Node classes.
A node subclass implements at least:
1. A list of input / output terminals and their properties
2. A process() function which takes the names of input terminals as keyword arguments and returns a dict withthe names of output terminals as keys.
Optionally, a Node subclass can implement the ctrlWidget() method, which must return a QWidget (usuallycontaining other widgets) that will be displayed in the flowchart control panel. A minimal Node subclass looks like:
class SpecialFunctionNode(Node):"""SpecialFunction: short description
This description will appear in the flowchart design window when the userselects a node of this type."""nodeName = 'SpecialFunction' # Node type name that will appear to the user.
def __init__(self, name): # all Nodes are provided a unique name when they# are created.
Node.__init__(self, name, terminals={ # Initialize with a dict# describing the I/O terminals# on this Node.
'inputTerminalName': {'io': 'in'},'anotherInputTerminal': {'io': 'in'},'outputTerminalName': {'io': 'out'},})
def process(self, **kwds):# kwds will have one keyword argument per input terminal.
return {'outputTerminalName': result}
def ctrlWidget(self): # this method is optionalreturn someQWidget
Some nodes implement fairly complex control widgets, but most nodes follow a simple form-like pattern: a list ofparameter names and a single value (represented as spin box, check box, etc..) for each parameter. To make this easier,the CtrlNode subclass allows you to instead define a simple data structure that CtrlNode will use to automaticallygenerate the control widget. This is used in many of the built-in library nodes (especially the filters).
There are many other optional parameters for nodes and terminals – whether the user is allowed to add/remove/renameterminals, whether one terminal may be connected to many others or just one, etc. See the documentation on the Node
14.5. Implementing Custom Nodes 37

pyqtgraph Documentation, Release 0.10.0
and Terminal classes for more details.
After implementing a new Node subclass, you will most likely want to register the class so that it appears in the menuof Nodes the user can select from:
import pyqtgraph.flowchart.library as fclibfclib.registerNodeType(SpecialFunctionNode, [('Category', 'Sub-Category')])
The second argument to registerNodeType is a list of tuples, with each tuple describing a menu location in whichSpecialFunctionNode should appear.
See the FlowchartCustomNode example for more information.
14.5.1 Debugging Custom Nodes
When designing flowcharts or custom Nodes, it is important to set the input of the flowchart with data that at leasthas the same types and structure as the data you intend to process (see processing methods #1 above). When you useFlowchart.setInput(), the flowchart displays visual feedback in its design window that can tell you what datais present at any terminal and whether there were errors in processing. Nodes that generated errors are displayed witha red border. If you select a Node, its input and output values will be displayed as well as the exception that occurredwhile the node was processing, if any.
14.6 Using Nodes Without Flowcharts
Flowchart Nodes implement a very useful generalization in data processing by combining a function with a GUI forconfiguring that function. This generalization is useful even outside the context of a flowchart. For example:
## We defined a useful filter Node for use in flowcharts, but would like to## re-use its processing code and GUI without having a flowchart present.filterNode = MyFilterNode("filterNodeName")
## get the Node's control widget and place it inside the main windowfilterCtrl = filterNode.ctrlWidget()someLayout.addWidget(filterCtrl)
## later on, process data through the nodefilteredData = filterNode.process(inputTerminal=rawData)
38 Chapter 14. Visual Programming with Flowcharts
CHAPTER 15
Internals - Extensions to Qt’s GraphicsView
• GraphicsView
• GraphicsScene (mouse events)
• GraphicsObject
• GraphicsWidget
• ViewBox
39

pyqtgraph Documentation, Release 0.10.0
40 Chapter 15. Internals - Extensions to Qt’s GraphicsView
CHAPTER 16
API Reference
Contents:
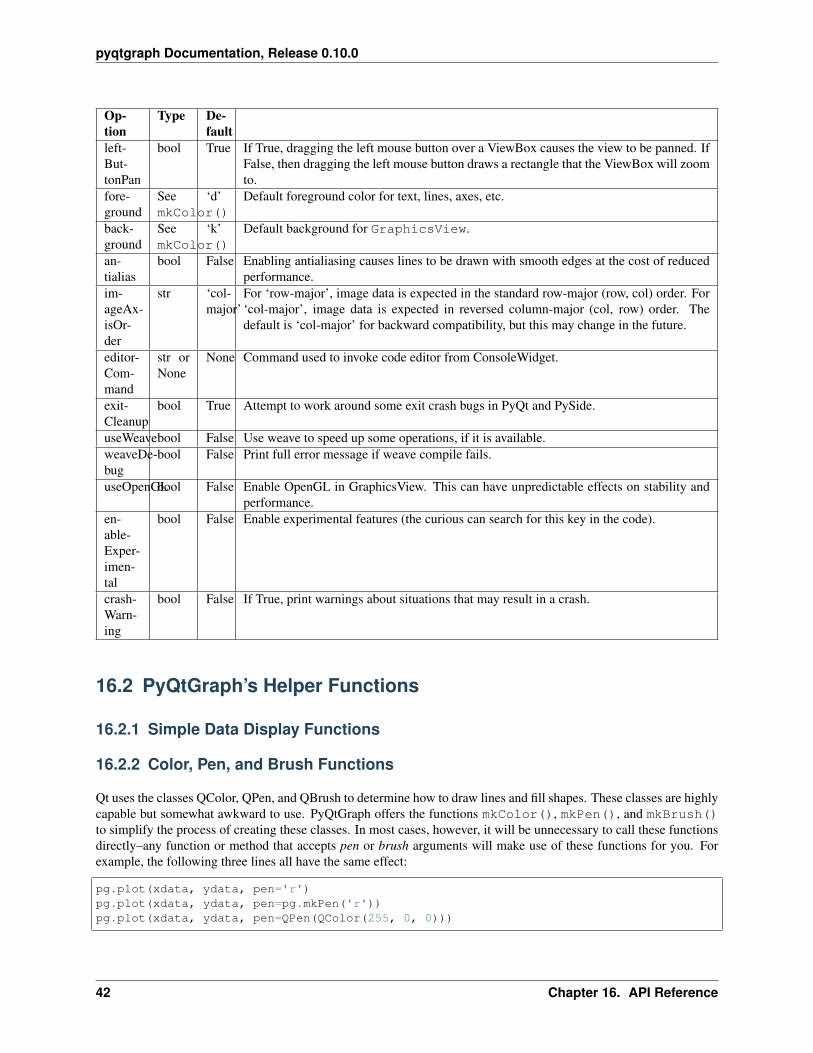
16.1 Global Configuration Options
PyQtGraph has several global configuration options that allow you to change its default behavior. These can beaccessed using the setConfigOptions() and getConfigOption() functions:
41
pyqtgraph Documentation, Release 0.10.0
Op-tion
Type De-fault
left-But-tonPan
bool True If True, dragging the left mouse button over a ViewBox causes the view to be panned. IfFalse, then dragging the left mouse button draws a rectangle that the ViewBox will zoomto.
fore-ground
SeemkColor()
‘d’ Default foreground color for text, lines, axes, etc.
back-ground
SeemkColor()
‘k’ Default background for GraphicsView.
an-tialias
bool False Enabling antialiasing causes lines to be drawn with smooth edges at the cost of reducedperformance.
im-ageAx-isOr-der
str ‘col-major’
For ‘row-major’, image data is expected in the standard row-major (row, col) order. For‘col-major’, image data is expected in reversed column-major (col, row) order. Thedefault is ‘col-major’ for backward compatibility, but this may change in the future.
editor-Com-mand
str orNone
None Command used to invoke code editor from ConsoleWidget.
exit-Cleanup
bool True Attempt to work around some exit crash bugs in PyQt and PySide.
useWeavebool False Use weave to speed up some operations, if it is available.weaveDe-bug
bool False Print full error message if weave compile fails.
useOpenGLbool False Enable OpenGL in GraphicsView. This can have unpredictable effects on stability andperformance.
en-able-Exper-imen-tal
bool False Enable experimental features (the curious can search for this key in the code).
crash-Warn-ing
bool False If True, print warnings about situations that may result in a crash.
16.2 PyQtGraph’s Helper Functions
16.2.1 Simple Data Display Functions
16.2.2 Color, Pen, and Brush Functions
Qt uses the classes QColor, QPen, and QBrush to determine how to draw lines and fill shapes. These classes are highlycapable but somewhat awkward to use. PyQtGraph offers the functions mkColor(), mkPen(), and mkBrush()to simplify the process of creating these classes. In most cases, however, it will be unnecessary to call these functionsdirectly–any function or method that accepts pen or brush arguments will make use of these functions for you. Forexample, the following three lines all have the same effect:
pg.plot(xdata, ydata, pen='r')pg.plot(xdata, ydata, pen=pg.mkPen('r'))pg.plot(xdata, ydata, pen=QPen(QColor(255, 0, 0)))
42 Chapter 16. API Reference

pyqtgraph Documentation, Release 0.10.0
16.2.3 Data Slicing
16.2.4 Coordinate Transformation
16.2.5 SI Unit Conversion Functions
16.2.6 Image Preparation Functions
16.2.7 Mesh Generation Functions
16.2.8 Miscellaneous Functions
16.3 PyQtGraph’s Graphics Items
Since pyqtgraph relies on Qt’s GraphicsView framework, most of its graphics functionality is implemented as QGraph-icsItem subclasses. This has two important consequences: 1) virtually anything you want to draw can be easily ac-complished using the functionality provided by Qt. 2) Many of pyqtgraph’s GraphicsItem classes can be used in anynormal QGraphicsScene.
Contents:
16.3. PyQtGraph’s Graphics Items 43

pyqtgraph Documentation, Release 0.10.0
44 Chapter 16. API Reference
pyqtgraph Documentation, Release 0.10.0
16.3.1 PlotDataItem
16.3.2 PlotItem
16.3.3 ImageItem
16.3.4 GraphItem
16.3.5 ViewBox
16.3.6 LinearRegionItem
16.3.7 InfiniteLine
16.3.8 ROI
16.3.9 GraphicsLayout
16.3.10 PlotCurveItem
16.3.11 ScatterPlotItem
16.3.12 IsocurveItem
16.3.13 AxisItem
16.3.14 TextItem
16.3.15 ErrorBarItem
16.3.16 ArrowItem
16.3.17 FillBetweenItem
16.3.18 CurvePoint
16.3.19 CurveArrow
16.3.20 GridItem
16.3.21 ScaleBar
16.3.22 LabelItem
16.3.23 VTickGroup
16.3.24 LegendItem
16.3.25 GradientEditorItem
16.3.26 TickSliderItem
16.3.27 HistogramLUTItem
16.3.28 GradientLegend
16.3.29 ButtonItem
16.3.30 GraphicsObject
16.3.31 GraphicsWidget
16.3.32 GraphicsItem
16.3.33 UIGraphicsItem
16.3.34 GraphicsWidgetAnchor
16.4 PyQtGraph’s Widgets
PyQtGraph provides several QWidget subclasses which are useful for building user interfaces. These widgets cangenerally be used in any Qt application and provide functionality that is frequently useful in science and engineering
16.4. PyQtGraph’s Widgets 45

pyqtgraph Documentation, Release 0.10.0
applications.
Contents:
46 Chapter 16. API Reference
pyqtgraph Documentation, Release 0.10.0
16.4. PyQtGraph’s Widgets 47
pyqtgraph Documentation, Release 0.10.0
16.4.1 PlotWidget
16.4.2 ImageView
16.4.3 dockarea module
16.4.4 SpinBox
16.4.5 GradientWidget
16.4.6 HistogramLUTWidget
16.4.7 parametertree module
16.4.8 ConsoleWidget
16.4.9 ColorMapWidget
16.4.10 ScatterPlotWidget
16.4.11 GraphicsView
16.4.12 DataTreeWidget
16.4.13 TableWidget
16.4.14 TreeWidget
16.4.15 CheckTable
16.4.16 ColorButton
16.4.17 GraphicsLayoutWidget
16.4.18 ProgressDialog
16.4.19 FileDialog
16.4.20 JoystickButton
16.4.21 MultiPlotWidget
16.4.22 VerticalLabel
16.4.23 RemoteGraphicsView
16.4.24 MatplotlibWidget
16.4.25 FeedbackButton
16.4.26 ComboBox
16.4.27 LayoutWidget
16.4.28 PathButton
16.4.29 ValueLabel
16.4.30 BusyCursor
16.5 PyQtGraph’s 3D Graphics System
The 3D graphics system in pyqtgraph is composed of a view widget and several graphics items (all subclasses ofGLGraphicsItem) which can be added to a view widget.
48 Chapter 16. API Reference

pyqtgraph Documentation, Release 0.10.0
Note 1: pyqtgraph.opengl is based on the deprecated OpenGL fixed-function pipeline. Although it is currently afunctioning system, it is likely to be superceded in the future by VisPy.
Note 2: use of this system requires python-opengl bindings. Linux users should install the python-opengl packagesfrom their distribution. Windows/OSX users can download from http://pyopengl.sourceforge.net.
Contents:
16.5.1 GLViewWidget
16.5.2 GLGridItem
16.5.3 GLSurfacePlotItem
16.5.4 GLVolumeItem
16.5.5 GLImageItem
16.5.6 GLMeshItem
16.5.7 GLLinePlotItem
16.5.8 GLAxisItem
16.5.9 GLGraphicsItem
16.5.10 GLScatterPlotItem
16.5.11 MeshData
16.6 ColorMap
16.7 GraphicsScene and Mouse Events
Contents:
16.7.1 GraphicsScene
16.7.2 HoverEvent
16.7.3 MouseClickEvent
16.7.4 MouseDragEvent
16.6. ColorMap 49

pyqtgraph Documentation, Release 0.10.0
50 Chapter 16. API Reference

CHAPTER 17
Indices and tables
• genindex
• modindex
• search
51