relation discovery from web data for competency management
TRANSCRIPT

Open Research OnlineThe Open University’s repository of research publicationsand other research outputs
Relation Discovery from Web Data for CompetencyManagementJournal ItemHow to cite:
Zhu, J.L.; Goncalves, A; Uren, V.; Motta, E.; Pacheco, R; Eisenstadt, M. and Song, D. (2007). RelationDiscovery from Web Data for Competency Management. Web Intelligence and Agent Systems, 5(4) pp. 405–417.
For guidance on citations see FAQs.
c© [not recorded]
Version: [not recorded]
Link(s) to article on publisher’s website:http://iospress.metapress.com/app/home/contribution.asp?referrer=parent&backto=issue,4,7;journal,1,19;linkingpublicationresults,1:110227,1
Copyright and Moral Rights for the articles on this site are retained by the individual authors and/or other copyrightowners. For more information on Open Research Online’s data policy on reuse of materials please consult the policiespage.
oro.open.ac.uk

Relation Discovery from Web Data for Competency Management
Jianhan Zhu1, Alexandre L. Gonçalves2, Victoria S. Uren1, Enrico Motta1, Roberto Pacheco2,
Marc Eisenstadt1, Dawei Song1
1Knowledge Media Institute and Centre for Research in Computing, The Open University, Milton
Keynes, United Kingdom
{j.zhu, v.s.uren, e.motta, m.eisenstadt, d.song}@open.ac.uk
2Stela Institute, Florianópolis, Brazil
{a.l.goncalves, pacheco}@stela.org.br
Abstract
In current organizations, valuable enterprise knowledge is often buried under rapidly expanding huge amount
of unstructured information in the form of web pages, blogs, and other forms of human text communications. We
present a novel unsupervised machine learning method called CORDER (COmmunity Relation Discovery by
named Entity Recognition) to turn these unstructured data into structured information for knowledge management
in these organizations. CORDER exploits named entity recognition and co-occurrence data to associate
individuals in an organization with their expertise and associates. We discuss the problems associated with
evaluating unsupervised learners and report our initial evaluation experiments in an expert evaluation, a
quantitative benchmarking, and an application of CORDER in a social networking tool called BuddyFinder.
Keywords: relation discovery, clustering, named entity recognition
1. Introduction
At a time in which organizations increasingly regard the knowledge and skills of their employees as
their most valuable resource, competency management, knowing who knows what, has become a critical
activity. Equally important is knowing who knows whom, both outside and inside the organization, so
1

that project teams with the right mix of skills, contacts and experience of working together can be
assembled.
We argue that documents are a primary resource for discovering information about people's skills and
associations. Text based approaches have already been used in some specialist domains, for example to
create a database about the competencies of expert witnesses [8]. We propose to use text documents in a
more general scenario and to concentrate on finding the relations between entities of several kinds rather
than classifying experts against a taxonomy of skills. The documents used may be intended to
summarize competency information, such as the large collection of Brazilian researchers’ curricula vitae
held on the Lattes Platform (http://lattes.cnpq.br/historico.jsp), but they might equally be ordinary
documents, such as web pages and reports which reflect day to day activity within the organization.
We propose tackling competency discovery from documentary resources using an unsupervised
machine learning method which we call CORDER (COmmunity Relation Discovery by named Entity
Recognition). Named Entity Recognition (NER) is used as a preliminary step to identify named entities
(NEs) of interest, such as people’s names, organization names and knowledge areas, thus partially
tackling the problem of unstructured web data identified by some of the earliest writers on web mining
[10]. The output of the CORDER method is a matrix of entities. In a competency management scenario
the target dimension of this matrix is people, for example employees or researchers. The other
dimension is the parameters against which competency is being assessed, which might be subject
domains, contacts, organizations with which a person has collaborated or projects they have worked on.
The values in the matrix are the relation strength calculated by CORDER of the relation between a
person and a given parameter. The output of CORDER can also be seen as an association network,
where nodes are named entities, links between these nodes are relations discovered by CORDER, and
weights on these links are relation strength.
2

CORDER builds on work such as DIPRE [4], Snowball [1] and KNOWITALL [11], but, because it
uses co-occurrence rather than relatively rare patterns for discovering relations, it can discover relations
in collections smaller than the whole Web, making it suitable for corporate intranets. CORDER has
similarities to the relation discovery method by Hasegawa et al. [15] which clusters pairs of NEs
according to the similarity of context words between them. Their method works well on newspaper text,
which usually consists of well-formed sentences. The advantage of the co-occurrence method we use is
that it is general enough to detect relations in inhomogeneous text where relations may not be explicitly
specified by context words. Their method also does not address ranking relations in terms of relevance.
CORDER can serve as the basis for building knowledge management and entity based semantic
search applications, since CORDER can effectively and efficiently turn unstructured information, such
as text documents and web pages, into structured information efficient for querying, search, and
knowledge management. Structured information in the form of relations between named entities can be
used to satisfy users’ information needs that are difficult to be met using unstructured information, e.g.,
finding who is an expert on X? If a user enters X in the system, he/she will get a list of experts based on
the relations discovered by CORDER. However, traditional document based search applications return
documents instead of entities inside them to a search query. In knowledge management applications, the
discovered relations in a network can be visualized and presented to the user. Various social network
analysis methods such as clustering algorithms can be applied to the network to group entities that are
closely related to each other. In semantic search based applications, the user can search concepts instead
of keywords to locate entities embedded in documents directly, thus users’ cognitive overload as the
result of a large amount of unstructured information can be alleviated.
This paper is organized as follows. In Section 2 we describe the CORDER method. In Section 3 we
discuss issues concerning the evaluation of unsupervised machine learning algorithms in general. The
experimental setup for expert and quantitative benchmark based evaluations is described in details in
3

Sections 4. Section 5 and 6 present three evaluation studies, first, expert evaluation of CORDER’s
results and a comparison of CORDER, experts’ opinions, and two quantitative benchmarks, and second,
an user evaluation of an integrated system of CORDER and an online matchmaking tool called
BuddyFinder. Work related to our relation discovery approach is discussed in Section 7. Finally in
Section 8 we conclude and describe some of our on-going work applying and refining the CORDER
method.
2. CORDER
CORDER discovers relations by identifying lexical co-occurrences of NEs in text. This approach is
based on the intuition that if an individual has expertise in an area, his/her name will be often associated
with key terms about that area in text in many documents. Similarly, if two individuals often work
together we expect to see their names associated. In general, we assume that NEs that are closely related
to each other tend to appear together more often and closer.
The process of the CORDER method comprises the steps of:
1. data selection, in which the documents that will represent the organization are identified,
2. named entity recognition, in which the pages are preprocessed for named entities, and
3. relation strength and ranking, in which we propose a novel way to calculate the relation strength
of NEs related to the target by integrating entity co-occurrences, entity distances, entity
frequencies, and document relevance.
We describe these steps below, concentrating on relation strength.
4

2.1 Data Selection
We find documents from an organization’s web site using a web spider. Documents, which contain
noisy data, e.g., out-dated information and irrelevant information, may be removed. Documents which
are linked from the web site may be taken into account if they contain relevant information.
2.2 Named Entity Recognition
A named entity recognizer is used to recognize people, projects, organizations and research areas from
the documents. We use ESpotter [30], an NER system which employs standard NER techniques,
because it provides methods for rapidly adapting its lexicon and patterns to different domains on the
Web. Adaptation is accomplished by using automated Google searches to estimate the number of times a
pattern or lexicon occurs on the Web in general and on documents with a URL associated with the
domain. These are used to estimate the probability of particular patterns on the domain of interest.
Recall and precision can then be controlled by adjusting a threshold parameter to select which patterns
should be used on a given domain. Fine adjustments can be made by the user for individual patterns.
This combination of automatic probability estimation and manual refinement allows ESpotter NER to be
optimized for a particular organization’s documents without a long training process.
Variants of the same NE are prevalent on different documents on a site, e.g., a person’s name can be
referred to in many ways. The proposed method groups similar NEs together in order to find these
variants and align them by taking into account the string similarity of two NEs. String similarity is
defined as the length of the longer NE divided by the Levenshtein distance1 of the two NEs. Two NEs
judged similar by their string similarity StrSim(E1,E2) are more likely to be variants of the same NE if
they appear on the same document or two documents which link to each other (we use the Levenshtein
edit distance but other metrics are also suitable). The two NEs may appear on multiple documents, and
1 Levenshtein distance of two strings is the length of the shortest sequence of edit commands that transform one string to the other.
5
we define the contextual distance ConDis(E1, E2) between two NEs as the minimum number of links,
regardless of link direction, between two documents where these two NEs appear. The contextual
distance is zero if the two NEs both appear on the same document. We define the similarity between two
NEs, E1 and E2, as Sim(E1,E2)= ( 1, 2)
( 1, 2)StrSim E E
a b ConDis E E+ × , where a and b are weights.
2.3 Relation Strength and Ranking
Traditional text window based entity relation discovery methods only count the number of co-
occurrences of two entities but do not take into account the distance between them. We argue that the
distance between two entities will also effect the relation judgment of them especially when the text
window is large. The intuition is that the smaller the distance between two entities, the more likely that
they are related. In addition, the frequency of entities in a text segment and the relevance of a document
in relation judgments also need to be considered. We propose a novel unified approach for incorporating
four components, i.e., entity co-occurrences, entity distances, entity frequencies, and document
relevance, in entity relation discovery.
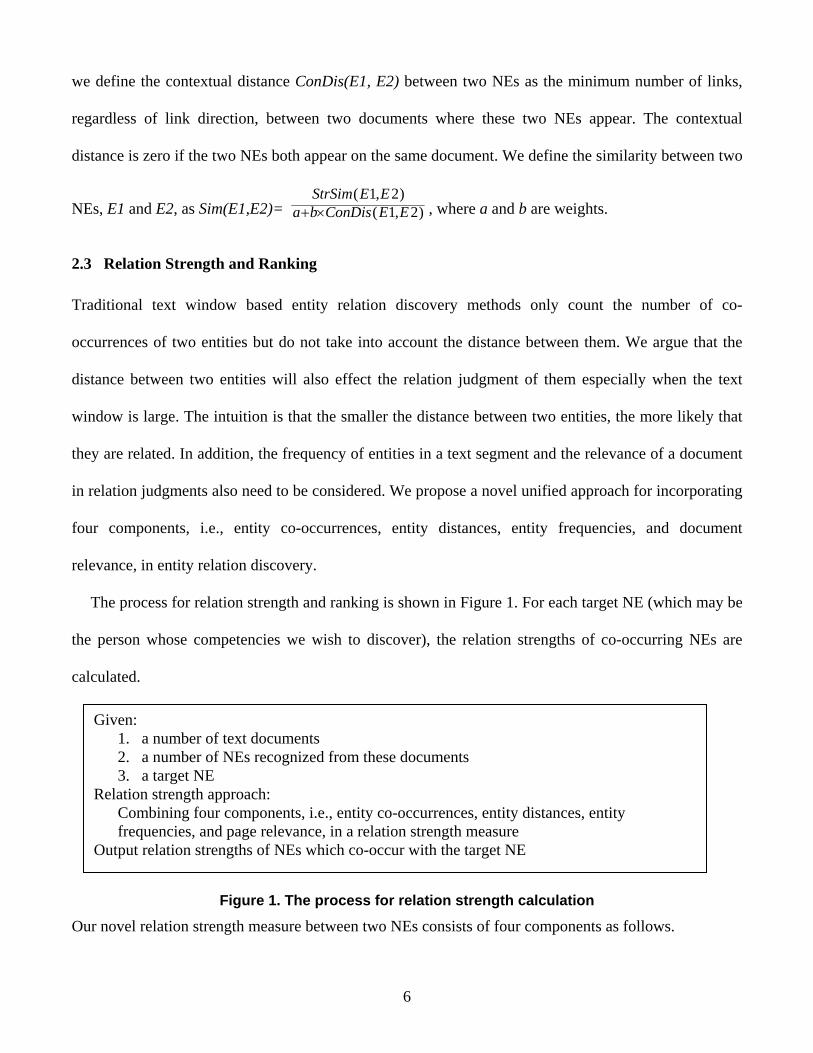
The process for relation strength and ranking is shown in Figure 1. For each target NE (which may be
the person whose competencies we wish to discover), the relation strengths of co-occurring NEs are
calculated.
Given: 1. a number of text documents 2. a number of NEs recognized from these documents 3. a target NE
Relation strength approach: Combining four components, i.e., entity co-occurrences, entity distances, entity frequencies, and page relevance, in a relation strength measure Output relation strengths of NEs which co-occur with the target NE
Figure 1. The process for relation strength calculation
Our novel relation strength measure between two NEs consists of four components as follows.
6

1. Co-occurrence: Two entities are considered to co-occur if they appear in the same text fragment,
which can be a document or a text window. Generally, if an NE is closely related to a target, they tend to
co-occur more often. For two NEs, E1 and E2, we use Resnik’s method [22] to compute a relative
frequency of co-occurrences of E1 and E2 as in Equation 1.
ˆ ( 1, 2)p E E =( 1, 2)Num E E
N (1)
where Num(E1,E2) is the number of documents or text windows in which E1 and E2 co-occur, and N
is the total number of documents or text windows.
2. Distance: Two NEs which are closely related tend to occur close to each other. If two NEs, E1 and
E2, both occur only once in a text fragment, the distance between them is the difference between their
offsets. If E1 occurs once and E2 occurs multiple times in the text fragment, the distance between E1
and E2 is the difference between the offset of E1 and the offset of the closest occurrence of E2. When
both E1 and E2 occur multiple times in the text fragment, we average the distance from each occurrence
of E1 to E2 and define the logarithm distance between E1 and E2 in the i-th text fragment as in Equation
2.
( 1, 2)id E E =(1 log (min( 1 , 2)))2
( 1)
E Ejj
Freq Ei
∑ +
(2)
where Freqi(E1) is the number of occurrences of E1 in the i-th text fragment and min(E1j , E2) is the
distance between the j-th occurrence of E1, E1j, and E2.
3. Entity Frequency: An NE is considered to be more important if it has more occurrences in a text
fragment. Consequently, a numerous NE tends to have strong relations with other NEs which also occur
in that text fragment.
7
4. Document relevance: Given a target, E1, the weight of each text fragment is given indicating its
relevance in associating other NEs in the text fragment with E1, e.g., for a person, a high relevance
weight might be set to his/her homepage and a low relevance weight to his/her blog page.
Relation strength: Given a target, E1, we calculate the relation strength between E1 and another NE,
E2, by taking into account the above four components. The relation strength, R(E1, E2), between E1 and
E2 is defined in Equation 3.
( ( 1)) ( ( 2))ˆ( 1, 2) ( 1, 2)( 1, 2)i
i i i
i
w f Freq E f Freq ER E E p E Ed E E
⎛ ⎞× ×= × ⎜ ⎟
⎝ ⎠∑ (3)
where wi is the weight showing the relevance of the i-th text fragment to E1,
, 2( ( 1)) 1 log ( ( 1)i if Freq E Freq E= + 2( ( 2)) 1 log ( ( 2))i if Freq E Freq E) = + , and ( 1)iFreq E and ( 2)iFreq E are the
numbers of occurrences of E1 and E2 in the i-th text fragment, respectively.
Thus the relation strength between a target and each of its co-occurring NEs is calculated. We rank co-
occurring NEs in terms of their relation strengths with the target. Since these NEs are of different types,
we divide the ranked list into a set of ranked lists for each type, e.g., lists of related people and related
organizations.
We set a threshold, so that only relations with relation strength above the threshold are selected. For
example, we could set the threshold as the value at which two NEs co-occur with only one occurrence
each, within a distance D, in only one text fragment. Generally, higher thresholds give high precision
and low recall, and vice versa.
It is worth noting that, since the relation strength part of the method comprises a combination of
measures for co-occurrence, frequency, distance and document relevance, the current method has
potential for refinement by substituting these components with others that are more sophisticated.
Consider the case of judging the strength of the relation between two organizations E1 and E2. If the
method were to be deployed in a semantic Web environment where the documents were annotated with
8

reference to an ontology, it would be possible to take account of instances below E1 and E2 in the
taxonomic structure such as people employed by the organizations or subsidiary companies.
3. Approaches to Evaluation
The evaluation of the CORDER method presents problems typical of unsupervised machine learning
methods in general when trying to establish if the method has learnt a model that is fit for purpose. The
main approaches to evaluation may be characterized as quantitative, gold standard and task oriented.
Quantitative methods judge whether the model produced is a “good” model based on quantifiable
parameters. For example, a classic method for analyzing hierarchical agglomerative clustering is the
cophenetic correlation coefficient [23], [14]. Square Error Criterion is commonly used to evaluate the
efficiency of numerical data clustering [9]. Another method is Information Gain in which is possible to
assess the quality of the clustering results over categorical data [28]. We are experimenting with this
approach to evaluate a CORDER enhanced semantic clustering method (see Section 8).
Gold standard approaches compare the learned model to an “ideal” produced a priori by domain
experts. These are typical in information retrieval and information extraction, e.g., the MUC (Message
Understanding Conference) and TREC (Text REtrieval Conference) series of competitions [7] [21].
Their primary disadvantage is that standard collections are expensive to produce. Moreover, since they
are based on expert opinion, they are intrinsically subjective. We have participated in the TREC
Enterprise Search Track, where a crawl of the W3C (http://www.w3.org) site is used as test collection.
CORDER will be further evaluated in terms of its effectiveness in discovering significant associations
between entities, e.g., Person-Topic associations, to complete the Expert Search task.
Task oriented evaluations examine algorithms in the context of applications. They are concerned
with whether the learning algorithm has produced a model that functions properly in use. Tonella et al.
9

[26] discussed some of the problems associated with the task oriented approach including its cost and
the need for careful design to minimize subjectivity.
Each approach has deficiencies. Therefore we favor a mixed strategy. Our first evaluation mined
competencies using the website of the Knowledge Media Institute (KMi). This meant we had access to
experts who could provide subjective data on the validity of the model. In the second evaluation, we
compared CORDER’s results with two quantitative benchmarks obtained from the whole Web data and
a co-occurrence model, respectively. We did our third evaluation on an integrated system of CORDER
and an online matchmaking tool called BuddyFinder, where a group of online users’ collective opinions
are used to evaluate CORDER.
4. Experimental Setup for Expert and Quantitative Benchmark based Evaluations
We applied the CORDER method to our department, the Knowledge Media Institute (KMi), website.
We used the Verity Ultraseek search engine (http://www.ultraseek.com/) to get a list of documents
which are linked from the KMi homepage and whose URL hostnames are from a list of URLs of sub-
sites of the KMi website e.g., URLs for the departmental news, PlanetNews, site2. Documents
containing noisy data including obsolete web pages were removed using the patterns in their URLs and
templates in their content. We got 503 documents, of which 122 are official pages from the KMi
website, 202 are from personal homepages, 111 are from the PlanetNews site, and the rest are from other
relevant sources.
We used ESpotter to recognize four types of NEs, i.e., people (PeoNE), organizations (OrgNE),
projects (ProNE), and research areas (ResNE). Built-in lexicon entries and patterns, and lexicon entries
2 http://news.kmi.open.ac.uk
10
from a domain ontology and research areas from the ACM Computing Classification System3 are used
for recognition.
In aligning variants of NEs from these documents, we assume that for two NEs to be similar to each
other, they need to at least have a string similarity of 2.5 and contextual distance of 2. Therefore, we get
a similarity threshold of 0.833 and used the similarity threshold to find clusters of variants. We found 93
clusters for manual alignment. To estimate the precision, , and recall, , of NER, we randomly
selected 15 pages from the 503 pages and asked a human evaluator to annotate NEs of the four types
respectively. Human annotations were used as a gold standard to compare with the NER results
produced by ESpotter, we got and 4
NERP NERR
NERP NERR of 91% and 88% respectively. For the 503 documents, the
numbers of unique PeoNEs, OrgNEs, ProNEs, and ResNEs are 860, 526, 21, and 273, respectively.
The CORDER method was used to discover relations between people working in our department and
NEs of the four types. A relevance weight is set as 1 for documents of general relevance to a target NE
and 2 for documents of special relevance to the target. There are 3655 relations found by CORDER
between the 60 researchers working in KMi and the four types of NEs. Relations found for an expert
were evaluated by the expert him/herself in the following Section 5.
5. Expert and Quantitative Benchmark Based Evaluations
We compared CORDER with a co-occurrence based method and a Google hits based method. Given a
target NE, the co-occurrence based method ranks other NEs by the number of co-occurrences between
3 http://www.acm.org/class/1998/
4 ,ESpotter CorrectNER
ESpotter
NP
N= and ,ESpotter Correct
NERUser
NR
N=
where ,ESpotter CorrectN is the number of correct NEs produced by ESpotter for four types on 15 Web pages,
ESpotterN is the total number of NEs produced by
ESpotter for four types on 15 Web pages, and is the number of NEs annotated by the evaluator for four types on 15 Web pages. UserN
11
the target and each of these NEs in documents or text windows. Given a target NE, the Google hits
based method ranks other NEs by the number of co-occurrences between the target and each of these
NEs on the whole Web. Thus the ranking that CORDER gets from in depth analysis of a representative
subset of pages is compared against a simple analysis of this subset of pages and the whole Web,
respectively.
In our expert evaluation, we created a web based form which allowed each expert to access the model
that one of the three methods above had generated for them5. Twenty people, representing a range of
experience from PhD students to professors, modified their own model to produce rankings and
relevance judgments closer to their own view of their interests and associations. These gave us a post
hoc standard against which to measure the three method’s performance.
We used precision (P) and recall (R) to measure a ranking method’s ability to discover relevant NEs
(Equation 4).
, ,Re,
,Re
User RM levantT User
RM levant
NP
N= , , ,Re
,,Re
User RM levantT User
User levant
NR
N= (4)
where T is the type of NE, the number of NEs judged as relevant by a ranking method is NRM,Relevant,
the number of NEs judged as relevant by the user is NUser,Relevant6, and the number of NEs judged as
relevant by both the user and the ranking method is NUser RM,Relevant.
A ranking method and the user provide two sets of rankings to the list of NUser ,RM,Relevant NEs judged as
relevant by both. To measure how well a method’s ranking matches the user’s ranking, we used
Spearman’s coefficient of rank correlation RA [12] to measure the ranking method’s ability to rank NEs
(Equation 5).
5 The identity of the chosen method (CORDER, Google hits, or co-occurrence method) is hidden away from the user in order to avoid bias. 6 The users can add NEs that they think are relevant to themselves but are missing from the recommendation list.
12

13
2, ,
, 3, ,Re , ,Re
6 ( )1
i User i RMi
T UserUser RM levant User RM levant
r rRA
N N
−= −
−
∑
The total number of NEs of four types for all 20 users judged as relevant by a ranking method is
TotalRM,Relevant, the total number of NEs judged as relevant by 20 users is TotalUser,Relevant, and the total
number of NEs judged by both 20 users and the ranking method as relevant is TotalRM,User,Relevant. We
define the overall precision, PTotal and recall, RTotal in Equation 6.
We can see that CORDER consistently outperformed both the co-occurrence and Google hits based
methods in terms of precision, recall and ranking accuracy on four types of entities for 20 users. The co-
occurrence based method taking into account web pages on the website performed better than the
Google hits based method taking into account the whole Web.
The results in Table 1 show that precision for all the rankings produced by CORDER is above 71%,
indicating that most of the relations found by CORDER are judged by the experts as appropriate. Recall
is above 73% for all the rankings, showing that CORDER can find most of the relations of an expert. RA
ranges between -0.086 and 1.0, and the RA values for 61 out of 80 lists of NEs for users are above 0.60,
suggesting a very high degree of agreement between the rankings produced by CORDER and those
produced by the users themselves.
where ri,User and ri,RM (1 N, ,, ,i User i RMi r r≤ ≤
≠ ≠
User ,RM,Relevant) are the two rankings provided by the user and
the method respectively for the i-th NE in the list. There are no ties in a set of rankings, i.e., for any two
NEs, Ei and Ej (i j), ri,User rj,User and ri,RM ≠ rj,RM. RA=1 when the two sets of rankings are in perfect
agreement and RA = -1 when they are in perfect disagreement.
, ,Re
,Re
RM User levantTotal
RM levant
TotalP
Total= , , ,Re
,Re
RM User levantTotal
User levant
TotalR
Total=
(5)
(6)
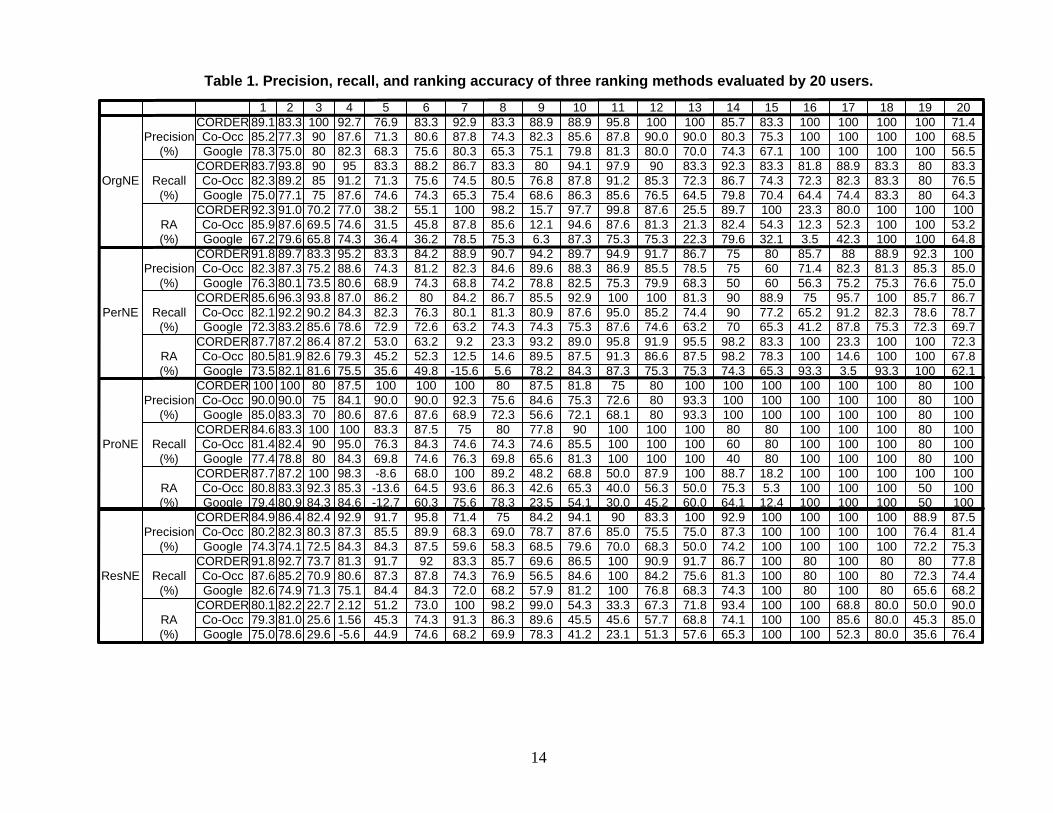
1 4 5 632 7 8 9 10 11 12 13 14 15 16 17 18 19 20
Google 78.3 75.0 80 82.3 68.3 75.6 80.3 65.3 75.1 79.8 81.3 80.0 70.0 74.3 67.1 100 100 100 100 56.5Co-Occ 85.2 77.3 90 87.6 71.3 80.6 87.8 74.3 82.3 85.6 87.8 90.0 90.0 80.3 75.3 100 100 100 100 68.5
Co-Occ 80.8 83.3 92.3 85.3 -13.6 64.5 93.6 86.3 42.6 65.3 40.0 56.3 50.0 75.3 5.3 100 100 100 50 100CORDER 87.7 87.2 100 98.3 -8.6 68.0 100 89.2 48.2 68.8 50.0 87.9 100 88.7 18.2 100 100 100 100 100Google 77.4 78.8 80 84.3 69.8 74.6 76.3 69.8 65.6 81.3 100 100 100 40 80 100 100 100 80 100Co-Occ 81.4 82.4 90 95.0 76.3 84.3 74.6 74.3 74.6 85.5 100 100 100 60 80 100 100 100 80 100
CORDER 84.6 83.3 100 100 83.3 87.5 75 80 77.8 90 100 100 100 80 80 100 100 100 80 100Google 85.0 83.3 70 80.6 87.6 87.6 68.9 72.3 56.6 72.1 68.1 80 93.3 100 100 100 100 100 80 100Co-Occ 90.0 90.0 75 84.1 90.0 90.0 92.3 75.6 84.6 75.3 72.6 80 93.3 100 100 100 100 100 80 100
CORDER 100 100 80 87.5 100 100 100 80 87.5 81.8 75 80 100 100 100 100 100 100 80 100Google 73.5 82.1 81.6 75.5 35.6 49.8 -15.6 5.6 78.2 84.3 87.3 75.3 75.3 74.3 65.3 93.3 3.5 93.3 100 62.1Co-Occ 80.5 81.9 82.6 79.3 45.2 52.3 12.5 14.6 89.5 87.5 91.3 86.6 87.5 98.2 78.3 100 14.6 100 100 67.8
CORDER 87.7 87.2 86.4 87.2 53.0 63.2 9.2 23.3 93.2 89.0 95.8 91.9 95.5 98.2 83.3 100 23.3 100 100 72.3Google 72.3 83.2 85.6 78.6 72.9 72.6 63.2 74.3 74.3 75.3 87.6 74.6 63.2 70 65.3 41.2 87.8 75.3 72.3 69.7Co-Occ 82.1 92.2 90.2 84.3 82.3 76.3 80.1 81.3 80.9 87.6 95.0 85.2 74.4 90 77.2 65.2 91.2 82.3 78.6 78.7
CORDER 85.6 96.3 93.8 87.0 86.2 80 84.2 86.7 85.5 92.9 100 100 81.3 90 88.9 75 95.7 100 85.7 86.7Google 76.3 80.1 73.5 80.6 68.9 74.3 68.8 74.2 78.8 82.5 75.3 79.9 68.3 50 60 56.3 75.2 75.3 76.6 75.0Co-Occ 82.3 87.3 75.2 88.6 74.3 81.2 82.3 84.6 89.6 88.3 86.9 85.5 78.5 75 60 71.4 82.3 81.3 85.3 85.0
CORDER 91.8 89.7 83.3 95.2 83.3 84.2 88.9 90.7 94.2 89.7 94.9 91.7 86.7 75 80 85.7 88 88.9 92.3 100Google 67.2 79.6 65.8 74.3 36.4 36.2 78.5 75.3 6.3 87.3 75.3 75.3 22.3 79.6 32.1 3.5 42.3 100 100 64.8Co-Occ 85.9 87.6 69.5 74.6 31.5 45.8 87.8 85.6 12.1 94.6 87.6 81.3 21.3 82.4 54.3 12.3 52.3 100 100 53.2
CORDER 92.3 91.0 70.2 77.0 38.2 55.1 100 98.2 15.7 97.7 99.8 87.6 25.5 89.7 100 23.3 80.0 100 100 100Google 75.0 77.1 75 87.6 74.6 74.3 65.3 75.4 68.6 86.3 85.6 76.5 64.5 79.8 70.4 64.4 74.4 83.3 80 64.3Co-Occ 82.3 89.2 85 91.2 71.3 75.6 74.5 80.5 76.8 87.8 91.2 85.3 72.3 86.7 74.3 72.3 82.3 83.3 80 76.5
CORDER 83.7 93.8 90 95 83.3 88.2 86.7 83.3 80 94.1 97.9 90 83.3 92.3 83.3 81.8 88.9 83.3 80 83.3
Google 75.0 78.6 29.6 -5.6 44.9 74.6 68.2 69.9 78.3 41.2 23.1 51.3 57.6 65.3 100 100 52.3 80.0 35.6 76.4Co-Occ 79.3 81.0 25.6 1.56 45.3 74.3 91.3 86.3 89.6 45.5 45.6 57.7 68.8 74.1 100 100 85.6 80.0 45.3 85.0
CORDER 80.1 82.2 22.7 2.12 51.2 73.0 100 98.2 99.0 54.3 33.3 67.3 71.8 93.4 100 100 68.8 80.0 50.0 90.0Google 82.6 74.9 71.3 75.1 84.4 84.3 72.0 68.2 57.9 81.2 100 76.8 68.3 74.3 100 80 100 80 65.6 68.2Co-Occ 87.6 85.2 70.9 80.6 87.3 87.8 74.3 76.9 56.5 84.6 100 84.2 75.6 81.3 100 80 100 80 72.3 74.4
CORDER 91.8 92.7 73.7 81.3 91.7 92 83.3 85.7 69.6 86.5 100 90.9 91.7 86.7 100 80 100 80 80 77.8Google 74.3 74.1 72.5 84.3 84.3 87.5 59.6 58.3 68.5 79.6 70.0 68.3 50.0 74.2 100 100 100 100 72.2 75.3Co-Occ 80.2 82.3 80.3 87.3 85.5 89.9 68.3 69.0 78.7 87.6 85.0 75.5 75.0 87.3 100 100 100 100 76.4 81.4
CORDER 84.9 86.4 82.4 92.9 91.7 95.8 71.4 75 84.2 94.1 90 83.3 100 92.9 100 100 100 100 88.9 87.5Google 79.4 80.9 84.3 84.6 -12.7 60.3 75.6 78.3 23.5 54.1 30.0 45.2 60.0 64.1 12.4 100 100 100 50 100
Precision(%)
Recall(%)
RA(%)
Precision(%)
Recall(%)
RA(%)
Precision(%)
Recall(%)
RA(%)
Precision(%)
Recall(%)
RA(%)
OrgNE
PerNE
ProNE
ResNE
CORDER 89.1 83.3 100 92.7 76.9 83.3 92.9 83.3 88.9 88.9 95.8 100 100 85.7 83.3 100 100 100 100 71.4
Table 1. Precision, recall, and ranking accuracy of three ranking methods evaluated by 20 users.
14
For the CORDER method, we got PTotal and RTotal, as 90.5% and 88.2%. For the co-occurrence
based method, we got PTotal and RTotal as 82.4% and 78.5%. For the Google hits based method, we got
PTotal and RTotal as 76.5% and 72.7%. We averaged the ranking accuracies for four ranked lists of the 20
users to get the overall ranking accuracy, RATotal, as 76.9%, for the CORDER method, 65.4% for the
co-occurrence based method, and 53.2% for the Google hits based method. We can see that CORDER
performed considerably better than both the co-occurrence and Google hits based methods.
However, the post hoc standard is imperfect in a number of ways which need to be addressed. The
experts could only judge NEs that were found by the ranking methods. Some experts were inclined
only to look at the top of ranking methods’ rankings, i.e. the most relevant NEs. Some experts reported
that it was hard to rank certain types of NEs, such as people, because their personal view of levels of
importance was hard to quantify. Presenting experts with a randomized list to rank might give better
results, but it would be a harder task. It may be that experts should instead be given a simpler task such
as assigning NEs to groups such as “highly relevant”, “relevant” and “not relevant”.
6. Application of CORDER in BuddyFinder and User Evaluation
The first competence discovery application we are building is the search service for the BuddySpace
jabber environment (http://buddyspace.sourceforge.net/), called BuddyFinder. Finding useful contacts
on instant messaging services is commonly based on registration information provided by the users. This
has a number of weaknesses. In particular, users tend not to be motivated to provide more than a few
keywords and the information can quickly go out of date. The BuddyFinder system asks them to supply
the URL of their homepage; users are more motivated to keep their homepage comprehensive and
current than a profile on their instant messaging system. A user typically uses a keyword based search
query describing a topic to find his/her buddies. The CORDER method uses the keywords in the query
as the target NEs and calculates the strength of the relations between the topic and users within the
15
groups that the searcher belongs to based on data mined from their homepages and closely associated
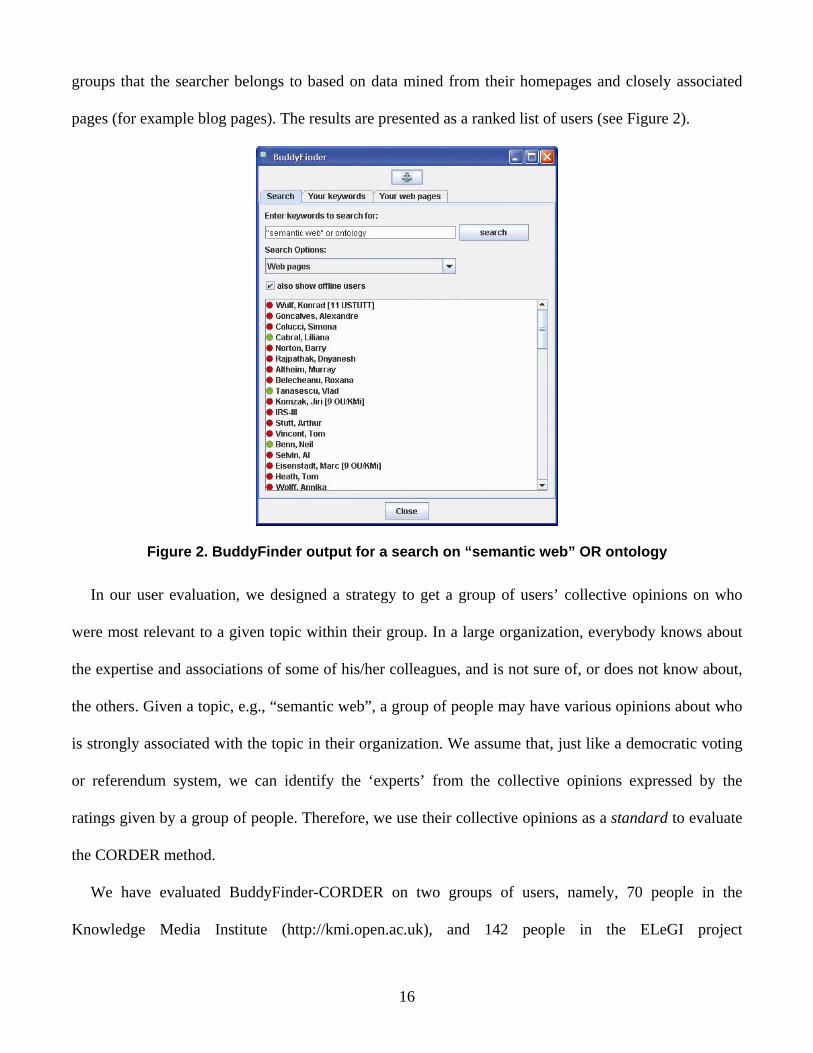
pages (for example blog pages). The results are presented as a ranked list of users (see Figure 2).
Figure 2. BuddyFinder output for a search on “semantic web” OR ontology
In our user evaluation, we designed a strategy to get a group of users’ collective opinions on who
were most relevant to a given topic within their group. In a large organization, everybody knows about
the expertise and associations of some of his/her colleagues, and is not sure of, or does not know about,
the others. Given a topic, e.g., “semantic web”, a group of people may have various opinions about who
is strongly associated with the topic in their organization. We assume that, just like a democratic voting
or referendum system, we can identify the ‘experts’ from the collective opinions expressed by the
ratings given by a group of people. Therefore, we use their collective opinions as a standard to evaluate
the CORDER method.
We have evaluated BuddyFinder-CORDER on two groups of users, namely, 70 people in the
Knowledge Media Institute (http://kmi.open.ac.uk), and 142 people in the ELeGI project
16

(http://www.elegi.org/) [3], a 23-partner European consortium. There are 5 people who are in both
groups, i.e., work in both KMi and the ELeGI project. For the KMi and ELeGI groups, there are in total
1,011 and 1,978 documents from people’s profiles, respectively.
Two members of the KMi and ELeGI groups have selected 17 and 19 queries for user evaluation on
the two groups, respectively, as listed in the left most columns of Table 2 and Table 3. For each query,
we have applied the CORDER method to the dataset. Since users generally only look at the top ranked
buddies to find their answers, we selected up to top 10 ranked buddies (can be less than 10 when there
are less than 10 buddies in the list) returned by CORDER for each query as the relevant buddy set.
Figure 3. A query with a relevant buddy list generated by CORDER in randomized order for user
evaluation.
We created a web based form (Fig. 3) which allows human evaluators to assess the query results. In
order to minimize the influence of the order of the queries and buddies in the relevant buddy set of each
query, every time an evaluator visits the form, the order of both the queries and buddies in the relevant
buddy set of each query are randomly generated. The order in which CORDER has ranked the list of
buddies is hidden from the evaluators. Since each evaluator may not be able to evaluate all the buddies
17
for all the queries, we give them the option to skip a query, or select “don’t know” for a buddy to a
query. To evaluate the statement that a buddy is relevant to a query, they can choose from “strongly
disagree”, “disagree”, “maybe”, “agree”, and “strongly agree”. 23 people from KMi group, representing
a range of experience from PhD students, secretaries, project managers, lecturers, research fellows, and
professors, have evaluated the KMi form. 17 people from ELeGI consortium, representing a range of
experience from PhD students, project members, project leaders, lecturers, research fellows, and
professors, have evaluated the ELeGI form. Each relevant buddy in each query has been evaluated by at
least three people. These gave us a post hoc standard against which to measure CORDER’s
performance.
Evaluators may have different opinions on the association between each buddy in the relevant buddy
set of each query and the query. We assign following rating values to their opinions: -2: “strongly
disagree”, -1: “disagree”, 0: “maybe”, 1: “agree”, 2: “strongly agree”, and “don’t know” is ignored. We
calculate the mean of the opinion values from a group of users as the group’s rating value for a buddy.
In order to remove dubious user ratings, we calculate the standard deviation of the rating values and
remove any user rating value that is two times the standard deviation value away from the mean. After
removing dubious ratings, we calculate the mean of a group of users’ ratings again as the group’s rating
value for the buddy.
Given a query, we can use the group of users’ rating value for each buddy to rank these buddies. Thus
the new ranked list of buddies reflects the group of users’ collective opinion on how the list of buddies
should be ranked. We use the group’s ranked list to evaluate how well CORDER has ranked the buddies
to reflect the group’s views. We have reused the Spearman coefficient (RA) described in Equation 5 to
measure how well CORDER has ranked the buddies to match the group’s opinion.
The ranking coefficient for CORDER on each query in the KMi and ELeGI groups is shown in Table
2 and 3, respectively. “AKT”, “BuddySpace”, “Magpie”, and “ScholOnto” are project names. Generally,
18

people would search for people closely related to research areas and projects. We have also
experimented with a more variety of types of queries to emulate real users’ various needs in their
searches, and show that BuddyFinder can give satisfying answers to various types of queries. In Table 3,
people’s names, e.g., “Marc Eisenstadt”, and academic institution’s names, “University of Graz”, are
used. In this case, we are looking for people who are closely related to a given person, e.g., colleagues,
collaborators, and closely related to an institution, e.g., employees, collaborators.
Table 2. Spearman’s rank correlation for KMi group.
Query/Rank Correlation (RA) CORDER 1. AKT 0.6842 2. Artificial Intelligence 0.9140 3. Buddyspace AND Messaging 0.3654 4. Hypertext 0.6838 5. Information Extraction 0.7047 6. Knowledge Management 0.9200 7. Knowledge Modelling 0.9596 8. Machine Learning 0.5839 9. Magpie 0.9045 10. Natural Language Processing -0.1545 11. Ontologies 0.9466 12. Planning AND Scheduling 0.7657 13. Question Answering 0.6171 14. ScholOnto 0.5723 15. Semantic Web 0.9688 16. Web Services 0.6054 17. Social Software 0.7335 RC variance 0.07682 RC average 0.6927
19

Table 3. Spearman’s rank correlation for ELeGI group
Query/Rank Correlation (RA) CORDER1. Artificial Intelligence 0.7821 2. BuddySpace 0.6000 3.Europe AND Learning 0.5797 4. Hugh Davis 0.5000 5. Human Learning 0.0909 6. Hypermedia 0.5265 7. Hypertext 0.5385 8. Instant Messaging 0.4643 9. Java and C++ 0.5515 10.Knowledge Representation 0.6905 11.Learning AND Grid 0.6835 12. Machine Learning 0.4286 13. Marc Eisenstadt 0.7212 14. Semantic Web 0.2445 15. Social Software 1.0000 16.Software AND Grid 0.2451 17.University of Graz 0.9007 18. University of Southampton 0.8187 19. WSRF -0.6000 RC variance 0.1246 RC average 0.5140
We can see from Table 2 and 3 that CORDER can find truly relevant buddies and rank them in the
correct order in most of the queries. When the ranking correlation of CORDER for a query is low, it is
often the result that there are no clear relevant buddies for the query topic. For example, consider the
query “natural language processing” (NLP) in Table 2. “NLP” is not a major research area in KMi
(hence there are proportionally fewer pages mentioning it) and most evaluators do not have a clear idea
about who are associated with it, this is reflected in the standard deviations of users’ ratings for each
relevant buddy on “NLP”, which are all between 0.683 and 1.328, given that for most of the other
20
queries the standard deviations of users’ ratings are between 0.0 and 0.7. Associations for “NLP” are
also under-represented in documents. We found that there are only two documents matching both
“NLP” query and the buddies ranked as No. 1 and 2 in the collective opinion of evaluators, respectively.
7. Related Work
The concept of relation extraction was introduced as part of the information extraction tasks in the Sixth
Message Understanding Conference (MUC-6) [7]. Some previous work has adopted a supervised
learning approach such as kernel methods [29] and needs richly annotated corpora which are tagged
with relation instances. The limitation with this approach is that it takes a great deal of effort to prepare
annotated corpora large enough to apply supervised learning. Some other previous work has adopted a
weakly supervised learning approach. This approach has the advantage of not needing large tagged
corpora. Brin [4] proposed DIPRE, a bootstrapping method for relation discovery. DIPRE finds patterns
for a particular relation between NEs from a small set of training data, and uses these patterns for
finding the relation between new NEs on test data. Snowball [1] improved on DIPRE by adopting the
constraint of using a named entity tagger. KNOWITALL [11] uses patterns for relation extraction by
taking advantage of the scale and redundancy of the Web. DIPRE and Snowball, however, need a small
set of training data. It is also unclear how training data should be selected and how much data is needed.
DIPRE, Snowball, and KNOWITALL work well on relations embedded in patterns but cannot spot
relations shown in the context of text and layout of web pages. The most similar relation discovery
method to ours is by Hasegawa et al. [15]. They proposed a method which discovers relations among
NEs from large corpora by clustering pairs of NEs according to the similarity of context words
occurring between the NEs. Their method works well on well-formed text which follows a “house-
style”, while our co-occurrence based method is general enough to detect relations in inhomogeneous
text where relations may not be explicitly specified by context words.
21

Our work is closely related to Communities of Practice (CoP). A community of practice refers to a
group of professionals formally or informally sharing knowledge and information for performing some
common tasks or exploring common problems of their professional activities and interests [19]. Existing
research in deriving CoPs has been focused on inferring and visualizing community structure based on
explicit linkage patterns, e.g., hyperlinks, contact lists, sender-receiver of emails, and domain-specific
ontologies. As an example, Flink [20] visualizes the scientific work and social connectivity of semantic
web researchers using semantic data collected from the web through web mining, and existing structured
data such as FOAF (Friend Of A Friend) files. Flink presents clusters of related researchers generated by
a graph clustering algorithm. ONTOCOPI [2] is an ontology base CoP identification system, which
groups similar entities in an ontology network to form CoPs.
Social network discovery has been applied to P2P (Peer to Peer) systems. Peers sharing the same
interests, as defined by their document collections, are clustered and can be ranked by their importance
to a search query. Jin et al. [17] used Latent Semantic Indexing (LSI) to reveal semantic subspaces of
feature spaces from documents stored on peers, and support vector machine (SVM) to classify the peers
into different categories based on the vectors extracted using LSI.
Term relationships have been used to improve document retrieval. Yoshida et al. [27] discovered
semantic relationships between terms based on a thesaurus. Terms relevant to given terms in a search
query are organized in a tree structure as suggestions for supporting users to search a domain they are
not familiar with. We have applied CORDER for query expansion to enhance the traditional vector
space model based information retrieval and our experiments have shown that CORDER based query
expansion has improved the performance of the vector space model [13].
Humans encountering a new concept derive the meaning via an accumulation of experience of the
contexts in which the concept appears. In the Hyperspace Analogue to Language (HAL) model proposed
by Burgess et al. [6], the meaning of a word is captured by examining its co-occurrence patterns with
22

other words in the language use, e.g., a corpus of text. HAL represents words as vector spaces of other
words, which occur with the target words within a certain distance, e.g., a text window. The associations
between concepts can be computed via different means of comparing their underlying vector
representations [5] [24] [25]. As HAL model is based on the co-occurrences as well as distances
between concepts, the CORDER system can be naturally integrated as one of the association derivation
mechanism. We have started integrating HAL model with CORDER, e.g., to tackle users’ vague search
queries [31]. Since HAL model provides more informative view of NEs in terms of a multi-dimensional
vector, we can further improve our relation discovery approach.
8. Conclusions and Continuing Work
8.1 Conclusions
We have shown that the CORDER method can discover competency relationships that are judged to be
appropriate by the people they concern. Our user evaluation and quantitative benchmarking suggest that
CORDER can discover relations with high precision, recall, and ranking accuracy. CORDER provides
better rankings than both co-occurrence based and Google hits based methods. User evaluation of our
first competency application called BuddyFinder has shown that CORDER can recommend people with
the right expertise as specified in a term-based query.
From Equation 3, we can see that CORDER´s computational complexity is O(n^2), where n is the
number of entities. This might be a limitation for large data sets. However, we can run the CORDER
method in a distributed way. When running CORDER in a number of parallel threads, CORDER’s
complexity is reduced to O(n^2/k), where k is the number of threads. Furthermore, CORDER can
incrementally evaluate exiting relations and establish new relations by taking into account new
documents. So CORDER can still scale to a large dataset.
23

When applying CORDER to a large corpus of web documents, the noise in the corpus may affect the
performance of CORDER. Thus, we are working on integrating CORDER with information retrieval
methods in a two-stage language modeling approach, where documents relevant to a query topic are
retrieved first and then we apply CORDER to the relevant document set. The language modeling
approach can also help CORDER scale well to a very large dataset since we only need to run CORDER
on relevant document set, which is typically a subset of the whole dataset.
8.2 Future Work This work has encouraged us to start deploying the CORDER NE based ranking in more knowledge
management scenarios. For example, it could be used on web portals to enhance the presentation of
search results by presenting the documents most central for a topic or the best connected authors first. In
addition, it could be used to mine text data for RDF triples to automatically input into a triple store.
CORDER’s rankings are derived from data mined from a collection of documents. In this way it gives
a wider view of the “world” of a domain than data from a single document. We are experimenting with
using the closest entities suggested by CORDER to improve the vector descriptions of documents for
clustering. Our initial experiments suggest that this approach produces clusters which score as well as
the widely used SOM method [16] on a total information gain measure of cluster quality. The execution
time of the CORDER enhanced clustering method however increases linearly with the size and number
of documents it examines so that it starts to outperform SOM on collections of more than 700 vectors.
We intend to test this clustering approach on the Lattes Platform collection of curricula vitae discussed
in Section 1.
Our future work includes but is not confined to:
• integration of CORDER and the HAL model based information inferencing approach to further
improve our relation discovery approach
24

• evaluation of CORDER in TREC Enterprise Search Track
• Some refinements to CORDER method are:
o the introduction of a “timeline” to monitor changes in competencies or a summary of web
page contents over time [16],
o new ways to deal with noise and variants from the named entity recognizer,
o NLP methods to recognize the kind of relation indicated by co-occurrence,
o sophisticated distance and relation strength metrics which exploit the power of ontologies
(see Section 2 for discussion).
While there is still work to do we are optimistic that the CORDER method is appropriate for use in
competency discovery applications and has potential for application in other search scenarios where the
ranking of entity data is desirable.
9. Acknowledgements
This research was partially supported by the Designing Adaptive Information Extraction from Text for
Knowledge Management (Dot.Kom) project, Framework V, under grant IST-2001-34038 and the
Advanced Knowledge Technologies (AKT) project. AKT is an Interdisciplinary Research Collaboration
(IRC), which is sponsored by the UK Engineering and Physical Sciences Research Council under grant
number GR/N15764/01. The AKT IRC comprises the Universities of Aberdeen, Edinburgh, Sheffield,
Southampton and the Open University. This research was also partially supported by the Brazilian
National Research Council (CNPq) with a doctoral scholarship held by Alexandre L. Gonçalves. We are
grateful to Chris Denham for the implementation of BuddyFinder.
10. References
25
[1] E. Agichtein and L. Gravano, Snowball: Extracting Relations from Large Plain-Text Collections, 5th
ACM International Conference on Digital Libraries, San Antonio, Texas, United States, 2000, 85–94.
[2] H. Alani, S. Dasmahapatra, K. O'Hara and N. Shadbolt, Identifying Communities of Practice through
Ontology Network Analysis, IEEE Intelligent Systems, 18(2) (2003), 18-25.
[3] C. Allison, S.A. Cerri, M. Gaeta, P. Ritrovato and S. Salerno, Human Learning as a Global
Challenge: European Learning Grid Infrastructure, in: Varis, T., Utsumi, T. and Klemm, W. (eds.),
Global Peace Through the Global University System, RCVE, Tampere, 2003, 465-488.
http://www.terena.nl/conferences/tnc2004/core_getfile.php?file_id=576
[4] S. Brin, Extracting Patterns and Relations from World Wide Web, WebDB Workshop at 6th
International Conference on Extending Database Technology, Valencia, Spain, 1998, 172–183.
[5] P.D. Bruza, D. Song and R. McArthur, Abduction in semantic space: Towards a logic of discovery,
Logic Journal of IGPL, 12(2) (2004), March, 97-109.
[6] C. Burgess, K. Livesay and K. Lund, Explorations in context space: words, sentences, discourse,
Discourse Processes, 25(2&3) (1998), 211-257.
[7] DARPA (Defense Advanced Research Projects Agency) Proc. of the Sixth Message Understanding
Conference, Morgan Kaufmann, 1995.
[8] C. Dozier, P. Jackson, X. Guo, M. Chaudhary and Y. Arumainayagam, Creation of an Expert
Witness Database through Text Mining, 9th International Conference on Artificial Intelligence and
Law, Edinburgh, Scotland, UK, 2003, 177-184.
[9] R. Duda and P. Hart, Pattern Classification and Scene Analysis, Wiley, New York, 1973.
[10] O. Etzioni, The World Wide Web: quagmire or gold mine?, Communications of the ACM, 39(11)
(1996), 65-68.
[11] O. Etzioni, M. Cafarella, D. Downey, A. Popescu, T. Shaked, S. Soderland, S. Weld and A. Yates,
Methods for Domain-Independent Information Extraction from the Web: An Experimental
26

Comparison, Nineteenth National Conference on Artificial Intelligence (AAAI2004), San Jose,
California, 2004, 391-398.
[12] J.D. Gibbons, Nonparametric Methods for Quantative Analysis, Holt, Rinehart and Winston, 1976.
[13] A.L. Gonçalves, J. Zhu, D. Song, V.S. Uren and R. Pacheco LRD: Latent Relation Discovery for
Vector Space Expansion and Information Retrieval, Advances in Web-Age Information
Management, 7th International Conference (WAIM 2006), Hong Kong, China, 2006, 122-133.
[14] M. Halkidi, Y. Batistakis and M. Vazirgiannis, On Clustering Validation Techniques, Journal of
Intelligent Information Systems, 17(2/3) (2001), 107-145.
[15] T. Hasegawa, S. Sekine and R. Grishman, Discovering Relations among Named Entities from
Large Corpora, 42nd Annual Meeting of the Association for Computational Linguistics, Barcelona,
Spain, 2004, 415-422.
[16] A. Jatowt and M. Ishizuka Temporal Multi-Page Summarization, Web Intelligence and Agent
Systems, IOS Press, 4 (2) (2006), 163-180.
[17] H. Jin, X. Ning, H. Chen and Z. Yin, Efficient Query Routing for Information Retrieval in Semantic
Overlays, 21st Annual ACM Symposium on Applied Computing (SAC'06), Dijon, France, 2006,
1669-1673.
[18] T. Kohonen, Self-Organizing Maps, Springer Series in Information Sciences, Vol. 30, 1995.
[19] J. Lave and E. Wenger, Situated Learning, Legitimate Peripheral Participation, Cambridge
University Press, 1991.
[20] P. Mika, Flink: Semantic Web Technology for the Extraction and Analysis of Social Networks,
Journal of Web Semantics, 3 (2/3) (2005), 211-223.
[21] National Institute of Standards and Technology (NIST) and U.S. Department of Defense, Text
REtrieval Conference Proceedings, 1992-2006.
27

[22] P. Resnik, Semantic Similarity in a Taxonomy: An Information-Based Measure and its Application
to Problems of Ambiguity in Natural Language, Journal of Artificial Intelligence Research, 11
(1999), 95-130.
[23] R.R. Sokal and F.J. Rohlf, The Comparison of Dendrograms by Objective Methods, TAXON, 11(2)
(1962), 33-40.
[24] D. Song and P.D. Bruza, Towards context-sensitive information inference, Journal of the American
Society for Information Science and Technology (JASIST), 54(4) (2003), 321-334.
[25] D. Song, P.D. Bruza and R.J. Cole, Concept learning and information inferencing on a high-
dimensional semantic space, ACM SIGIR 2004 Workshop on Mathematical/Formal Methods in
Information Retrieval (MF/IR'2004), University of Sheffield, UK, 2004.
[26] P. Tonella, F. Ricca, E. Pianta, C. Girardi, G. Di Lucca, A. R. Fasolino and P. Tramontana,
Evaluation Methods for Web Application Clustering, 5th International Workshop on Web Site
Evolution, Amsterdam, The Netherlands, 2003, 33-40.
[27] T. Yoshida, D. Shinkai and S. Nishida A Document Retrieval Support System with Term
Relationship", Web Intelligence and Agent Systems, IOS Press, 3 (3) (2005), 171-182.
[28] C.-H. Yun, K.-T. Chuang and M.-S. Chen, Adherence Clustering: an Efficient Method for Mining
Market-Basket Clusters, Information Systems, 31(3) (2006), 170-186.
[29] D. Zelenko, C. Aone and A. Richardella, Kernel Methods for Relation Extraction, Conference on
Empirical Methods in Natural Language Processing, University of Pennsylvania, Philadelphia, PA,
USA, 2002, 71–78.
[30] J. Zhu, V.S. Uren and E. Motta, ESpotter: Adaptive Named Entity Recognition for Web Browsing,
Professional Knowledge Management Conference, Springer-Verlag LNAI, Kaiserslautern, Germany,
2005, 518-529.
28

[31] J. Zhu, M. Eisenstadt, D. Song and C. Denham, Exploiting Semantic Association To Answer Vague
Queries, Fourth International Conference on Active Media Technology (AMT 2006), Brisbane,
Australia, 2006, 73-78.
29