relating to panchayati raj institutionssfc.bih.nic.in/documents/reports/sfc extraction for...
TRANSCRIPT
Extract from the
FINAL REPORT (2015-20)
of the 5th
SFC, Bihar
Relating to Panchayati Raj Institutions
JANUARY, 2016
PATNA


Details of Contents relating to PRIs
Ch. Contents Ch. Contents
Ch. 2 Enabling the PRIs to function as
self-governments:
6.5.1 Items of Expenditure
2.1 PRIs as self-governments: 6.6 Review of Expenditure of the PRIs
2.2 Functions 6.6.1 Times Series Analysis of Expenditure
2.3 Functionaries 6.6.2 Business-as-usual
2.4 Capacity Building 6.7 Forecast of Expenditure (2015-20)
2.5 Institutional process & Accountability
of the Panchayats
6.7.1 Business-as-usual
2.6 Implementation of e-Panchayat 6.8 Computation of the Resource Gap
2.7 Key Panchayat agenda 6.8.1 Resource gap based on different
approaches
Ch. 6 PRIs Finances: Review and Forecast
of Revenue and Expenditure
6.9 Bridging the Resource Gap
6.1 Computing Resource Gap 6.9.1 Own Additional Resources
6.1.1 Framework for Projection of Resource
Gap
6.9.2 Central and State Schemes
6.1.2 Methodologies for Computing
Resource Gap
6.9.3 Expenditure Management
6.2 Resources of the PRIs 6.9.4 Borrowing
6.2.1 Powers of the PRIs to realize own
revenue (tax & non - tax)
6.9.5 PPP
6.2.2 Assigned taxes from State Govt 6.10 An interesting case of ZP, Patna
6.2.3 14th
FC Transfers Ch. 9 Recommendations on Devolution and
Grant
6.2.4 Resources for the Agency Functions 9.1 Imperative of full Capacity Building &
Reforms in the LBs
6.2.5 Resources under Capital receipts 9.2 Consolidated Fund of the State
6.3 Review of Resources (2010-15) 9.3 Divisible Pool of taxes etc
6.3.1 Own Revenue Sources 9.4 Resource gap of the LBs
6.3.2 Assigned taxes from State Govt. 9.5 Devolution for 2015-20 & Inter LBs
share with uses
6.3.3 FC Transfers 9.6 Grants for 2015-20 & Inter LBs shares
and purposes of Grants
6.3.4 Resources for the Agency Functions 9.7 Total transfers for the 5th
SFC period
6.3.5 Capital Receipts 9.8 Impact of the Recommendations on the
State Finances
6.4 Forecast of Revenue: (2015-20) 9.9 5th
SFC transfer to be an additional to
the normal budgetary transfer for the
LBs
6.4.1 Business-as-usual 9.10 Utilization of unutilized grants in the
year
6.4.2 Normative approach 9.11 Resource Gap of the LBs after the 5th
SFC transfers
6.4.3 5th
SFC Approach 9.12 Release of funds to the LBs

Ch. Contents Ch. Contents
9.13 Uses of the Transferred (Devolution +
Grants) Funds
9.14 Imperative of Capacity Building,
Sound Finance & Governance and
Accountability
7 5th SFC (2015-20)
Chapter II
Enabling the Panchayati Raj Institutions to function as self-governments
2.1 PRIs as self- governments:
2.1.1 Local Government is a State subject listed
as item 5 in List II of the Seventh Schedule of the
Constitution. The 73rd Amendment has given
Constitutional status to the Panchayats, provided
it a complete framework and also imparted it
certainty. Article-243G (Box-2.1) envisions the
Panchayats as the institutions of self-government
and also the universal platforms for planning and
implementing programmes for economic
development and social justice.
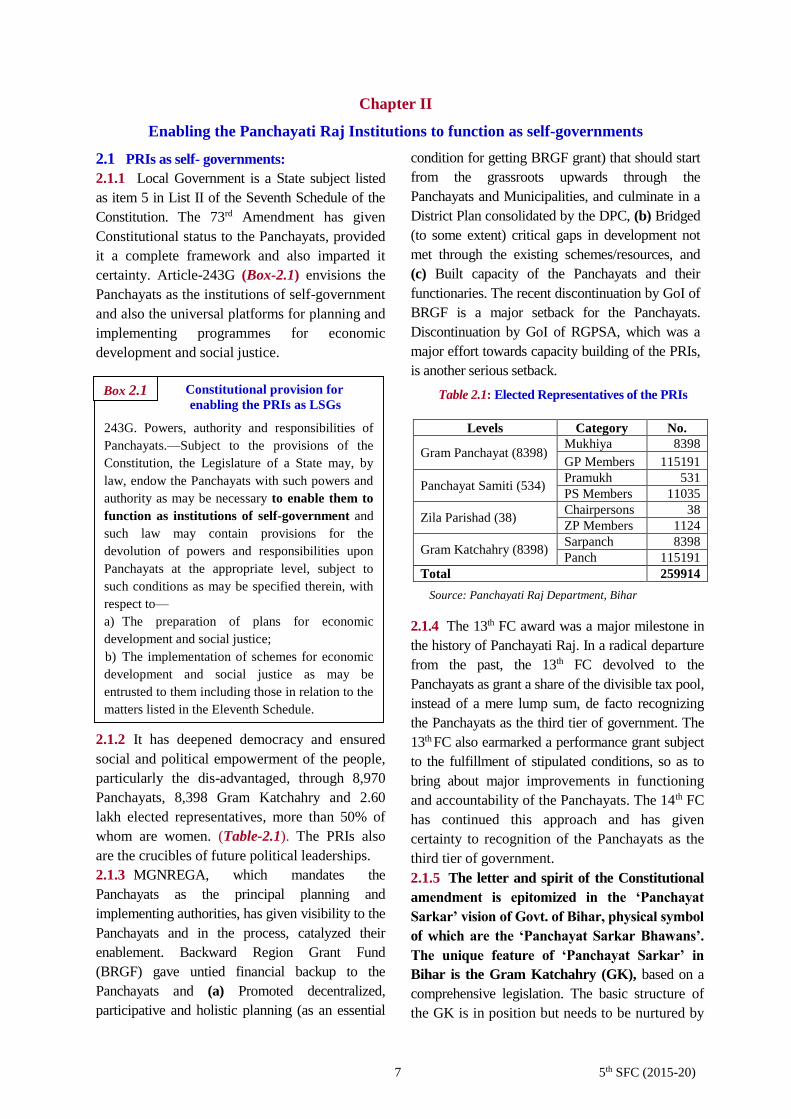
2.1.2 It has deepened democracy and ensured
social and political empowerment of the people,
particularly the dis-advantaged, through 8,970
Panchayats, 8,398 Gram Katchahry and 2.60
lakh elected representatives, more than 50% of
whom are women. (Table-2.1). The PRIs also
are the crucibles of future political leaderships.
2.1.3 MGNREGA, which mandates the
Panchayats as the principal planning and
implementing authorities, has given visibility to the
Panchayats and in the process, catalyzed their
enablement. Backward Region Grant Fund
(BRGF) gave untied financial backup to the
Panchayats and (a) Promoted decentralized,
participative and holistic planning (as an essential
condition for getting BRGF grant) that should start
from the grassroots upwards through the
Panchayats and Municipalities, and culminate in a
District Plan consolidated by the DPC, (b) Bridged
(to some extent) critical gaps in development not
met through the existing schemes/resources, and
(c) Built capacity of the Panchayats and their
functionaries. The recent discontinuation by GoI of
BRGF is a major setback for the Panchayats.
Discontinuation by GoI of RGPSA, which was a
major effort towards capacity building of the PRIs,
is another serious setback.
2.1.4 The 13th FC award was a major milestone in
the history of Panchayati Raj. In a radical departure
from the past, the 13th FC devolved to the
Panchayats as grant a share of the divisible tax pool,
instead of a mere lump sum, de facto recognizing
the Panchayats as the third tier of government. The
13th FC also earmarked a performance grant subject
to the fulfillment of stipulated conditions, so as to
bring about major improvements in functioning
and accountability of the Panchayats. The 14th FC
has continued this approach and has given
certainty to recognition of the Panchayats as the
third tier of government.
2.1.5 The letter and spirit of the Constitutional
amendment is epitomized in the ‘Panchayat
Sarkar’ vision of Govt. of Bihar, physical symbol
of which are the ‘Panchayat Sarkar Bhawans’.
The unique feature of ‘Panchayat Sarkar’ in
Bihar is the Gram Katchahry (GK), based on a
comprehensive legislation. The basic structure of
the GK is in position but needs to be nurtured by
Levels Category No.
Gram Panchayat (8398) Mukhiya 8398
GP Members 115191
Panchayat Samiti (534) Pramukh 531
PS Members 11035
Zila Parishad (38) Chairpersons 38
ZP Members 1124
Gram Katchahry (8398) Sarpanch 8398
Panch 115191
Total 259914
Source: Panchayati Raj Department, Bihar
Constitutional provision for
enabling the PRIs as LSGs
243G. Powers, authority and responsibilities of
Panchayats.—Subject to the provisions of the
Constitution, the Legislature of a State may, by
law, endow the Panchayats with such powers and
authority as may be necessary to enable them to
function as institutions of self-government and
such law may contain provisions for the
devolution of powers and responsibilities upon
Panchayats at the appropriate level, subject to
such conditions as may be specified therein, with
respect to—
a) The preparation of plans for economic
development and social justice;
b) The implementation of schemes for economic
development and social justice as may be
entrusted to them including those in relation to the
matters listed in the Eleventh Schedule.
Box 2.1 Table 2.1: Elected Representatives of the PRIs

8 5th SFC (2015-20)
the judiciary and the district administration.
2.1.6 However, there are many unfinished agenda
such as: (i) the Panchayats quite often are unable to
function efficiently due to insufficient staffing,
office space & infrastructure, (ii) true integrated
decentralized planning is yet to happen (Article-
243ZD), (iii) true devolution of 3Fs is still at
nascence, and (iv) the Gram Sabha, which is the
soul of the Panchayats and in fact the whole
democratic framework, is still to institutionalize.
“Active Gram Sabha: For Empowered people
and Accountable Panchayat” is not a mere
slogan. Empowering and enabling the Gram Sabha
must receive the highest attention if the dreams of
‘Gram Swaraj’ and ‘Power to the People’ are to
be realized.
2.1.7 Evidently, three broad aspects of the
Panchayat Agenda need to be pursued:
Empowerment (effective devolution of functions
and funds), Enablement (capacity building through
skilled manpower, IT facility, Office space etc.)
and Accountability (through effective Gram
Sabhas, Social Audit, Ombudsman etc.).
Accordingly build/strengthen institutions, systems,
processes etc. and make the PRIs vibrant
institutions of ‘Smart’ self-governments (Box-2.2).
2.2 Functions:
2.2.1 Functions of the PRIs under the
Constitution and the State Acts:
A comparison between the functions assigned to
the PRI under the Constitution and the Bihar
Panchayati Raj Act, 2006 (BPRA, 2006)
respectively may be seen at Annexure-2.2. BPRA,
2006 includes all functions listed in the
Constitution. ( Sec 22 for GP, Sec 47 for PS, Sec
73 for ZP and Sec 96 to 122 for GK)
2.2.2 Categories of Functions: The PRIs
evidently need to perform broadly the following
categories of functions as self-government:
Regulatory Functions: Issuing Death & Birth
Certificate, Trade license and other Regulations,
etc. besides judicial functions through the GKs.
Planning and implementing schemes: For
both economic development and social justice.
Providing Core Civic Services: Water
Supply, Sanitation, Drainage, Sewerage, Solid
waste Management, Street lighting, Streets and
Footpaths, Parks, Playgrounds, Burial and
Cremation Grounds, Library, Museum etc.
Agency Functions: Functions assigned under
the Central and State Schemes and policies.
2.2.3 Devolution of functions:
2.2.3.1 MoPR has made suggestions regarding
devolution of functions as in Box-2.3 and the 5th
SFC endorses it.
2.2.3.2 Moreover, issuing trade license and
approving buildings plans should be included in
BPRA, 2006.
2.2.3.3 The Panchayats should monitor
functioning of the institutions like JIVIKA,
ICDS Centres, Health Sub-Centres, Schools and
PDS through (i) monthly report to the respective
Smart Gram Panchayat*
Panchayats should become symbols of
Modernity and Responsive Governance.
Have Panchayat Sarkar Bhawan
Have requisite skilled manpower
Implement all modules of e-Panchayat
Take RTPSA services from Block to GP.
Enhance own revenue at least by 10% per year
Implement PRIASoft accounting software and
regularly submit audited account
Provide essential civic amenities in its
jurisdiction:
(a) Drinking Water, Drainage, Sanitation
(b) Village Street and Lighting (Solar + LED)
Promote skill development, economic activities,
rural market, etc.
Provide Agri-Service Centre, etc.
Prepare spatial plan for the GP area and
implement building byelaws.
Prepare socio-economic development plan for
the GP
Have at least one playground and one library
with IT facility.
Facilitate Digital India (promote e-governance,
e-education, e-health, etc.) *Elements of Smart Village envisaged by Govt. of Andhra
Pradesh are given at Annexure. 2.1
Box 2.2
Action points for devolution
of function to the PRIs
Emphasize governance, regulatory and converg-
ence function of the LBs
Devolve functions as per Activity Mapping.
Refine "Devolution Index” to capture critical
indices and standards.
Implement MoPR advisory dt. 19.1.09 on deline-
ating roles of the LBs in CSSs/ ACAs.
Merge the parastatals in the Standing Committees
of the LBs. Source: MoPR Roadmap
Box 2.3
9 5th SFC (2015-20)
Panchayat and (ii) participation of the GP level
officials concerned in monthly meetings of the
respective Standing Committee. This will also
enable these Committees to perform their
functions.
2.2.3.4 Need for Activity Mapping: Clarity on
the role and responsibilities of the Panchayats of
different tiers is provided by Activity Mapping
which, thus, becomes an important step in
devolution of functions. This is not an one time
exercise and has to be done continuously while
working out locally relevant socio-economic
programmes, restructuring organisations and
framing subject matter laws.
Activity Mapping does not imply that the
subjects are devolved wholesale. The Subjects or
Sectors need to be unbundled and assigned to the
different levels of Governments and the PRIs on
the basis of clear principles of public finance and
public account-ability, and above all, the
governance principles of Subsidiarity, Democratic
Decentralisation and Citizen-Centricity (Box-2.4).
Steps in Activity Mapping and format for the
same are given in Box-2.4 and Annexure-2.3
respectively.
2.2.3.5 Status of Activity Mapping:
The progress so far on Activity Mapping
department wise and subject wise is unsatisfactory.
2.2.3.6 Government Orders (GOs):
While response to questionnaire from the PRD is
awaited, as per the Study Report piloted by the 14th
FC (SR14FC), 20 line departments have issued
GOs.
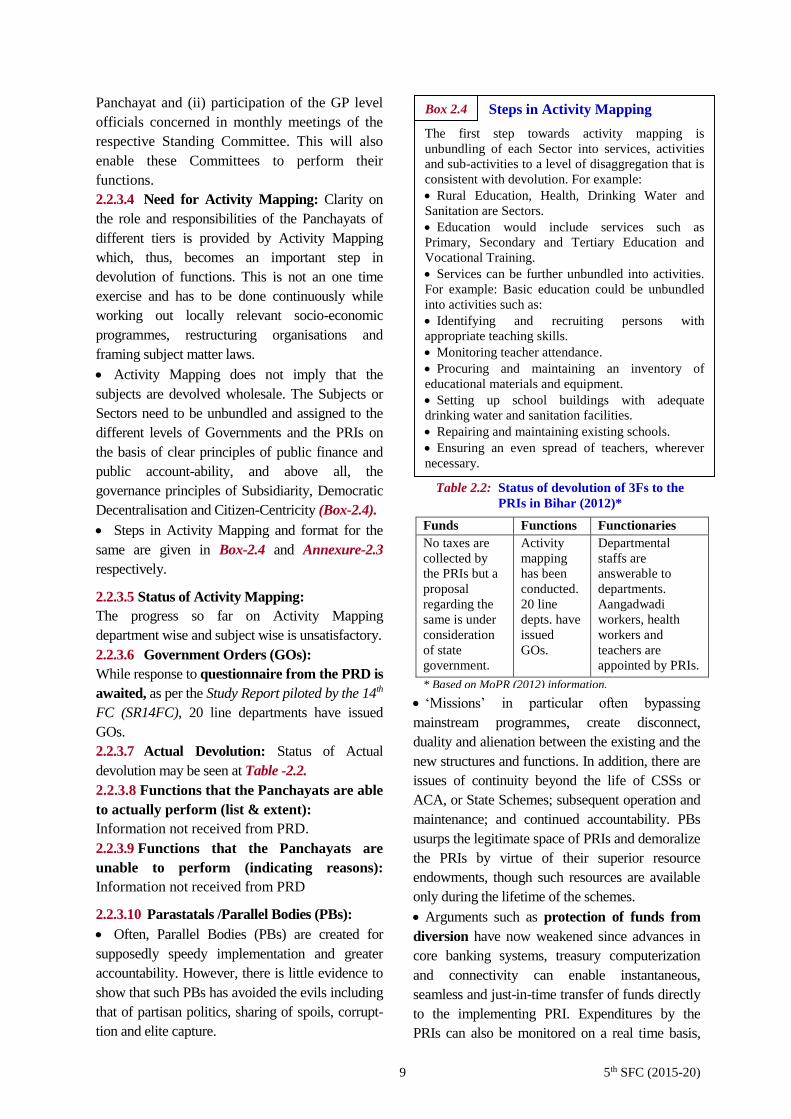
2.2.3.7 Actual Devolution: Status of Actual
devolution may be seen at Table -2.2.
2.2.3.8 Functions that the Panchayats are able
to actually perform (list & extent):
Information not received from PRD.
2.2.3.9 Functions that the Panchayats are
unable to perform (indicating reasons):
Information not received from PRD
2.2.3.10 Parastatals /Parallel Bodies (PBs):
Often, Parallel Bodies (PBs) are created for
supposedly speedy implementation and greater
accountability. However, there is little evidence to
show that such PBs has avoided the evils including
that of partisan politics, sharing of spoils, corrupt-
tion and elite capture.
‘Missions’ in particular often bypassing
mainstream programmes, create disconnect,
duality and alienation between the existing and the
new structures and functions. In addition, there are
issues of continuity beyond the life of CSSs or
ACA, or State Schemes; subsequent operation and
maintenance; and continued accountability. PBs
usurps the legitimate space of PRIs and demoralize
the PRIs by virtue of their superior resource
endowments, though such resources are available
only during the lifetime of the schemes.
Arguments such as protection of funds from
diversion have now weakened since advances in
core banking systems, treasury computerization
and connectivity can enable instantaneous,
seamless and just-in-time transfer of funds directly
to the implementing PRI. Expenditures by the
PRIs can also be monitored on a real time basis,
Table 2.2: Status of devolution of 3Fs to the
PRIs in Bihar (2012)*
Steps in Activity Mapping
The first step towards activity mapping is
unbundling of each Sector into services, activities
and sub-activities to a level of disaggregation that is
consistent with devolution. For example:
Rural Education, Health, Drinking Water and
Sanitation are Sectors.
Education would include services such as
Primary, Secondary and Tertiary Education and
Vocational Training.
Services can be further unbundled into activities.
For example: Basic education could be unbundled
into activities such as:
Identifying and recruiting persons with
appropriate teaching skills.
Monitoring teacher attendance.
Procuring and maintaining an inventory of
educational materials and equipment.
Setting up school buildings with adequate
drinking water and sanitation facilities.
Repairing and maintaining existing schools.
Ensuring an even spread of teachers, wherever
necessary.
Box 2.4
Funds Functions Functionaries
No taxes are
collected by
the PRIs but a
proposal
regarding the
same is under
consideration
of state
government.
Activity
mapping
has been
conducted.
20 line
depts. have
issued
GOs.
Departmental
staffs are
answerable to
departments.
Aangadwadi
workers, health
workers and
teachers are
appointed by PRIs.
* Based on MoPR (2012) information.

10 5th SFC (2015-20)
thus doing away with the need for intermediate
PBs to manually transfer funds and collect, pool
and analyses data on expenditures.
Examples of the PBs are: District Rural
Development Agencies, Forest Development
Agencies, District Watershed Development
Societies, District Health Mission, District
Education Mission, District Horticultural Mission,
District Project Management Units of Externally-
assisted Projects etc. They are considered ‘parallel
bodies’ (PBs) because they have a separate system
of decision making, resource allocation and
execution of projects, which is removed from the
Panchayati Raj set up. User Group-Based
Organizations or Community Based Organizations
(CBOs) for water supply, irrigation etc., are not
per-se PBs; but they become so if there is no
conscious decision to structure then within the PRI
set up.
The PRIs in Bihar also have been weakened
due to such parastatals. Ideally all parastatals
should be structured within the PRI set up. It
would be desirable that at least DRDA is
functionally integrated with the ZP and
accordingly, DDC becomes full time CEO of ZP
and DRDA employees become full time
employees of the ZP.
2.2.4 Status of the Regulatory Functions:
(a) The 5th SFC is still to receive responses to its
Questionnaire from PRD. However, based on field
visits, the position appears to be as in Table 2.3
of State Govt. to provide “Nyaay Pagdi” to the
Sarpanchs is a significant gesture.
The GKs are not functioning properly due
to:
(i) Lack of sensitization in Police & judiciary
towards jurisdiction and powers of GK: Often
cases belonging to jurisdictions of the GK are
usurped by Police on some pretext. A
Committee of District Judge (DJ), District
Magistrate (DM) and Superintendent of Police
(SP) need to review progress & problems of GK
every quarter. Moreover, SDM should review
functioning of the GK along with DSP every
month and report to DJ /DM/SP and PRD.
(ii) Inadequate civil jurisdiction of GK: needs to
be enhanced from Rs. 10,000 to at least Rs. 1.00
lakh and then linked to price index.
(iii) Lack of personnel like Dalpati: to serve
notice, enforce judgment, etc.
(iv) Insufficient infrastructure: for holding GK
sittings in an amiable atmosphere.
(v) Lack of training of Manpower: Intensive
training programmes for Sarpanch, Panch,
Nyaya Mitra and GK Secretary need to be
conducted regularly. DJ, DM and SP should also
participate.
(vi) Lack of awareness among people: about
both the GK and Bihar Land Disputes
Resolution Act, 2009 (BLDRA).
(vii) Lack of Monitoring: PRD need to evolve a
proforma on cases filed and disposed off as also
for probing quality and timeliness of disposal.
Functioning of the GKs must be a review item in
the meeting of DPROs at the State Headquarter.
(b) Gram Katchahry (GK):
The GK at the GP level in Bihar represents a
quasi-judicial forum for resolution of disputes
locally. Provisions regarding its election,
duration, powers, functions etc. have been made
in BPRA, 2006. Civil and Criminal power of
the GK may be seen in Appendix-2.1. Decision
(c) Need for harmony between GK and
BLDRA, 2009 (Bihar Land Disputes Resolution
Act, 2009): Box-2.5 lists amendments proposed
in the two Acts so as to lessen burden of the
Civil Court and take appropriate cases to DCLR,
which will be both time-saving and cost-saving.
This will result in convergence of the BPRA,
2006 and the BLDRA, 2009. These amendments
would also bring the disputes under BPRA, after
appeals are disposed off, before the DCLR,
where time-lines for disposal are fixed and
District Collectors are empowered to supervise.
Table 2.3: Status of Regulatory Functions
Activity Status
Issuing Death &
Birth Certificate
Functioning at GP level.
However, there is lack of
awareness among people.
Trade license and
other Regulations.
No activity at any of the
three levels. It used to happen
earlier.

11 5th SFC (2015-20)
Amendments proposed in BPRA, 2006 & BLDRA, 2009 in the context of GK
i) New section 112 (3) under BPRA, 2006: A case against the order passed by the Full Bench of the Gram
Kutchahry in respect of cases pertaining to section 110 of the Act may be filed within 30 days of the order, in
the Court of the Deputy Collector Land Reforms, under the BLDRA, 2009 and the same shall be treated as a
fresh case filed and shall be disposed off in accordance with the provisions of the BLDRA, 2009.
ii) Section 3 (7) of BPRA, 2006 (in respect of cases pertaining to Section 110 of the BPRA, 2006).
iii) Section 114 (BPRA, 2006): New Explanation – The Court of the Competent Authority shall include the
Court of the Competent Authority under the BLDRA, 2009.
iv) New Section 4(A) under BLDRA, 2009: If it appears to the Competent Authority that a case filed or
pending in the Court of the Competent Authority is fit to be disposed off by the Gram Kutchahry concerned,
the aforesaid Competent Authority shall transfer the case to the Gram Kutchahry, where the same shall be
disposed off in accordance with the provisions of the BPRA, 2006.
v) A new proviso under Section 115 BPRA, 2006: provided that the Competent Authority in a Civil Court
may withdraw a case pending before a bench of the Gram Kutchahry in respect of cases pertaining to Section
106 of the BPRA, 2006 and shall proceed to take further action as per the provisions under Section 115 of
the BPRA, 2006. Provided further that the Competent Authority under the BLDRA, 2009 may withdraw a
case pending before a bench of the Gram Kutchahry in respect of cases pertaining to Section 110 of the
BPRA, 2006, and shall proceed to take further action as per the provisions under Section 115 of the BPRA,
2006.
vi) New Section 4 (1) (K) under BLDRA, 2009: withdrawal of cases under the second proviso to Section the
BPRA, 2006.
vii) A new proviso under Section 118 of BPRA, 2006: provided that the Competent Authority for the
purposes of Section 118 shall be Dy Collector Land Reforms in respect of cases pertaining to Section 110 of
the BPRA, 2006.
viii) A new Proviso under section 119 of the BPRA, 2006: provided that the Competent Authority for the
purposes of Section 119 shall be Dy Collector Land Reforms in respect of cases pertaining to Section 119 of
the BPRA, 2006.
ix) A new explanation of Section 121 of the BPRA, 2006: The Competent Authority under Section all
includes the Competent Authority under the BLDRA, 2009.
x) New proviso of Section 122 of BPRA, 2006: Insertion of words in main text – regarding inspection of
proceedings and records – to "in respect of cases pertaining to Section 106 of the Act". The Collector of the
district, the Additional Collector and the Sub Divisional officer shall have the power to inspect proceedings
and records of the Gram Kutchahry or its Benches, in respect of cases pertaining to Section 110 of the Act.
(d) Mahatma Gandhi Dispute Free Villages
Campaign: launched by the Government of
Maharashtra provides cash awards to the GPs
which attain predetermined targets in terms of
dispute resolution. Details may be seen at
Annexure-2.4. This could be tried in Bihar as
well.
(e) Para Legal Volunteers under Bihar Legal
Service Authority could be used to assist GKs in
their functioning.
(f) Gram Raksha Dal: As per Section 33 of
BPRA 2006, functions of Gram Raksha Dal are:
(a) general watch and ward, (b) meeting emergent
events like fire, flood, breach of embankment,
collapse of bridge, outbreak of epidemic, (c)
encountering burglary or dacoity, (d) such other
duties that may be imposed by the Government
from time to time. Gram Raksha Dal is to be
organised under a Dalpati, appointed for every
GP. All able-bodied persons of a village
between the ages of 18 and 30 years are to be
members of the Dal.
Village volunteers trained for disaster
management could be designated as members of
Gram Raksha Dal to enable them to perform
duty under section 33 of BPRA, 2006.
Box 2.5
12 5th SFC (2015-20)
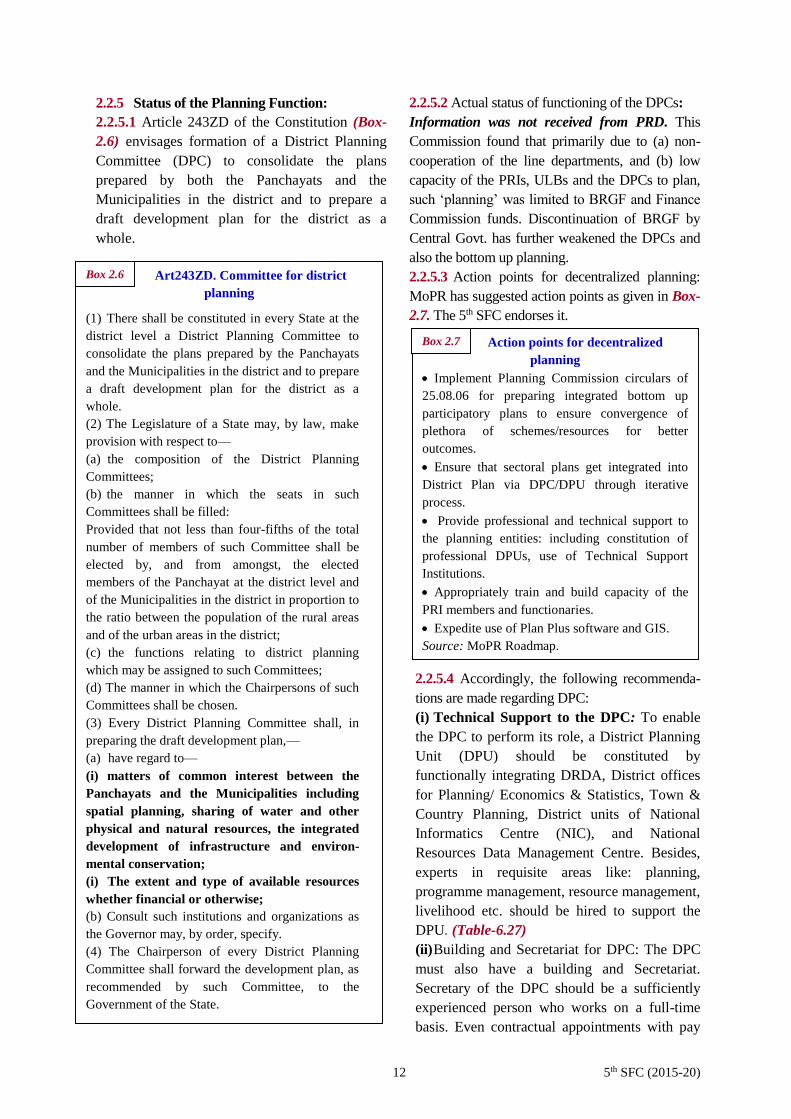
2.2.5 Status of the Planning Function:
2.2.5.1 Article 243ZD of the Constitution (Box-
2.6) envisages formation of a District Planning
Committee (DPC) to consolidate the plans
prepared by both the Panchayats and the
Municipalities in the district and to prepare a
draft development plan for the district as a
whole.
2.2.5.2 Actual status of functioning of the DPCs:
Information was not received from PRD. This
Commission found that primarily due to (a) non-
cooperation of the line departments, and (b) low
capacity of the PRIs, ULBs and the DPCs to plan,
such ‘planning’ was limited to BRGF and Finance
Commission funds. Discontinuation of BRGF by
Central Govt. has further weakened the DPCs and
also the bottom up planning.
2.2.5.3 Action points for decentralized planning:
MoPR has suggested action points as given in Box-
2.7. The 5th SFC endorses it.
2.2.5.4 Accordingly, the following recommenda-
tions are made regarding DPC:
(i) Technical Support to the DPC: To enable
the DPC to perform its role, a District Planning
Unit (DPU) should be constituted by
functionally integrating DRDA, District offices
for Planning/ Economics & Statistics, Town &
Country Planning, District units of National
Informatics Centre (NIC), and National
Resources Data Management Centre. Besides,
experts in requisite areas like: planning,
programme management, resource management,
livelihood etc. should be hired to support the
DPU..(Table-6.27)
(ii) Building and Secretariat for DPC: The DPC
must also have a building and Secretariat.
Secretary of the DPC should be a sufficiently
experienced person who works on a full-time
basis. Even contractual appointments with pay
Art243ZD. Committee for district
planning
(1) There shall be constituted in every State at the
district level a District Planning Committee to
consolidate the plans prepared by the Panchayats
and the Municipalities in the district and to prepare
a draft development plan for the district as a
whole.
(2) The Legislature of a State may, by law, make
provision with respect to—
(a) the composition of the District Planning
Committees;
(b) the manner in which the seats in such
Committees shall be filled:
Provided that not less than four-fifths of the total
number of members of such Committee shall be
elected by, and from amongst, the elected
members of the Panchayat at the district level and
of the Municipalities in the district in proportion to
the ratio between the population of the rural areas
and of the urban areas in the district;
(c) the functions relating to district planning
which may be assigned to such Committees;
(d) The manner in which the Chairpersons of such
Committees shall be chosen.
(3) Every District Planning Committee shall, in
preparing the draft development plan,—
(a) have regard to—
(i) matters of common interest between the
Panchayats and the Municipalities including
spatial planning, sharing of water and other
physical and natural resources, the integrated
development of infrastructure and environ-
mental conservation;
(i) The extent and type of available resources
whether financial or otherwise;
(b) Consult such institutions and organizations as
the Governor may, by order, specify.
(4) The Chairperson of every District Planning
Committee shall forward the development plan, as
recommended by such Committee, to the
Government of the State.
Action points for decentralized
planning
Implement Planning Commission circulars of
25.08.06 for preparing integrated bottom up
participatory plans to ensure convergence of
plethora of schemes/resources for better
outcomes.
Ensure that sectoral plans get integrated into
District Plan via DPC/DPU through iterative
process.
Provide professional and technical support to
the planning entities: including constitution of
professional DPUs, use of Technical Support
Institutions.
Appropriately train and build capacity of the
PRI members and functionaries.
Expedite use of Plan Plus software and GIS.
Source: MoPR Roadmap.
Box 2.7
Box 2.6
13 5th SFC (2015-20)
packages commensurate with the responsibility
of leading the preparation and implementation
of the district plan, for a period of say three to
five years, could be considered. Besides, the
DPCs must have adequate budgetary support for
research, consultancy, preparation of plans, etc.
(iii) Plan Plus and GIS modules of e-
Panchayat must be made operational urgently.
Plan Plus software has been developed to
demystify and simplify the decentralized
planning process. The software is web-based;
compatible for local language adaptation and
captures the entire planning workflow starting
from identification of needs and up to the plan
approval processes. It is generic and can capture
the plans prepared by the line departments at the
state and central levels to generate convergent
unit plans for the Panchayats and the
Municipalities, and consolidate the same into the
District and State Plans. The software enables
convergence of the related schemes and
programmes, brings about total transparency in
the plan preparation and approval processes, and
facilitates online monitoring.
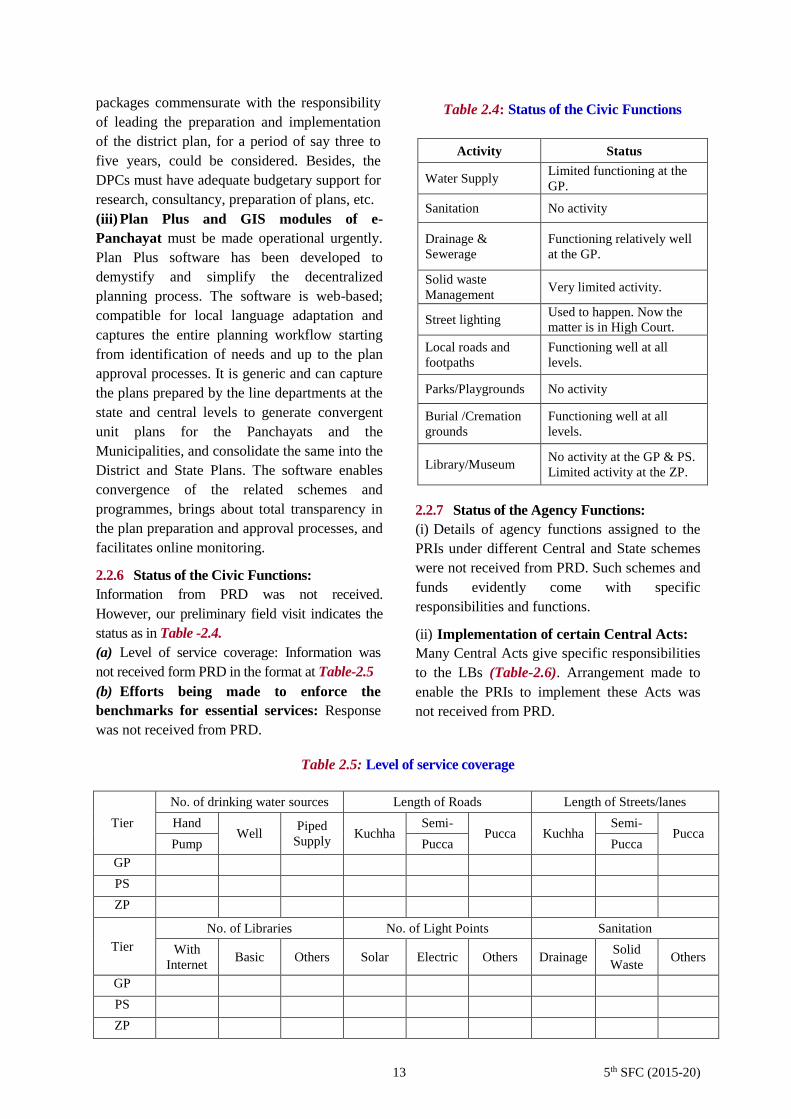
2.2.6 Status of the Civic Functions:
Information from PRD was not received.
However, our preliminary field visit indicates the
status as in Table -2.4.
(a) Level of service coverage: Information was
not received form PRD in the format at Table-2.5
(b) Efforts being made to enforce the
benchmarks for essential services: Response
was not received from PRD.
2.2.7 Status of the Agency Functions:
(i) Details of agency functions assigned to the
PRIs under different Central and State schemes
were not received from PRD. Such schemes and
funds evidently come with specific
responsibilities and functions.
(ii) Implementation of certain Central Acts:
Many Central Acts give specific responsibilities
to the LBs (Table-2.6). Arrangement made to
enable the PRIs to implement these Acts was
not received from PRD.
Activity Status
Water Supply Limited functioning at the
GP.
Sanitation No activity
Drainage &
Sewerage
Functioning relatively well
at the GP.
Solid waste
Management Very limited activity.
Street lighting Used to happen. Now the
matter is in High Court.
Local roads and
footpaths
Functioning well at all
levels.
Parks/Playgrounds No activity
Burial /Cremation
grounds
Functioning well at all
levels.
Library/Museum No activity at the GP & PS.
Limited activity at the ZP.
Table 2.4: Status of the Civic Functions
Tier
No. of drinking water sources Length of Roads Length of Streets/lanes
Hand Well
Piped
Supply Kuchha
Semi- Pucca Kuchha
Semi- Pucca
Pump Pucca Pucca
GP
PS
ZP
Tier
No. of Libraries No. of Light Points Sanitation
With
Internet Basic Others Solar Electric Others Drainage
Solid
Waste Others
GP
PS
ZP
Table 2.5: Level of service coverage

14 5th SFC (2015-20)
2.3 Functionaries:
2.3.1 Model Panchayat Cadre: A Model
Panchayat Cadre structure suggested by MoPR for
all tiers of the PRIs is given in Box-2.8.
Such a structure will (a) ensure availability of
technical personnel at all three tiers, and (b) make
the personnel transferable while providing them
career progression. Resource requirement for
implementing the Model Panchayat Cadre is
given in Table-2.7.
2.3.2 Recommendations for the GP :
(i) Only available staff in GP is a Panchayat
Sachiv, who usually holds charge of 3-5 GPs and
performs many non-GP functions as assigned by
district administration. This is the main reason
behind the present plight of the GPs. While
providing staff as envisaged under Model
Panchayat Cadre (Box-2.8) may take time,
contractual personnel (Vikas Mitra, Tola Sevak,
Indira Awas Sahayak, Panchayat Rozgar Sewak,
Krishi Mitra, etc.) already available within the
GPs, who are without full-time work, could be
placed under the GPs. These GP level staff should
sit in the PSBs, sign attendance and be readily
accessible to people.
(ii) Model staffing of the GPs would be as given in
Table-2.7. It may be noted that MOPR has
recommended one JE for 10 GPs. Since
population per GP for the country is around 3000
and that for Bihar is around 11000, one JE
should be assigned to 5 GPs in Bihar. This will
also enable JE to visit the other four GPs, which
are not his HQ GP, one or two days a week.
(iii) PDO should be the overall supervising officer
of the GP (Box-2.9) who will be assisted by
personnel with different skills as in Table-2.7.
PDO should also have overall charge of (a)
GP level functionaries like Vikas Mitra, Tola
Sevak, etc., and (b) GK staff since two part time
employees of the GK cannot take up issues with
the higher officers. It will further help
coordination between GP and GK.
2.3.3 Recommendations for the GKs: State
govt. has already sanctioned posts of GK
Secretary and Nyay Mitra (Law Graduate) for
the GK. These positions must be filled up
urgently and incumbents given intensive and
regular training.
Table 2.6: Implementation of Central Acts
Act Functions
Biological Diversity Act, 2002
Disaster Management Act, 2005
Forest Rights Act, 2006
Right to Education Act, 2009
National Food Security Act, 2013
Model Panchayat Cadre Structure
suggested by MoPR
Four cadres for functionaries of PRIs at Village,
Block& Dist. Panchayat level are suggested as under:-
Development Cadre comprising of Gram Rozgar
Sewak (GRS)/Sahayak Gram Sachiv (SGS)
Gram Panchayat Sachiv (GPS) Panchayat
Development Officer (PDO)/ Panchayat Coordination
Officer (PCO) Block Panchayat Raj Officer
(BPRO)/Joint Block Development Officer (Jt. BDO)
Block Development Officer (BDO) / Executive
Officer (EO). BDO/EO may be considered for
promotion as Additional Chief Executive Officer – a
state cadre post – on fulfilling the essential and
desirable qualifications for that post. Engineering Cadre consisting of Junior Engineer
(JE)/Technical Assistant (TA) Assistant Engineer
(AE) District Engineer (DE). DE may be
considered for promotion to a state cadre post on
fulfilling the essential and desirable qualifications for
that post. Administrative Cadre comprising of Executive
Assistants(General) (EA (G)–Grade II
Executive Assistant (Grade-I)
Superintendent/Manager Addl. District Panchayat Raj,
Officer (ADPRO) District Panchayat Raj Officer
(DPRO). DPRO may be considered for promotion as
Additional Chief Executive Officer – a state cadre post
– on fulfilling the essential and desirable qualifications. Finance and Accounts Cadre encompasses
Accountant-cum-Cashier/ Executive Assistant
Accounts – (Grade-II) Executive Assistant
(Accounts-Grade-I) (EA (A/c) Accounts Officer (A/c
O) Senior Accounts Officer (Sr. A/c O). Sr. A/c O
may be considered for promotion to the next higher
grade in the state cadre on fulfilling the essential and
desirable qualifications for that post.
Source: MoRP Roadmap
Note: Sahayak Gram Sachiv and GP Sachiv would evidently
be more appropriate under the Administrative cadre.
Box 2.8

15 5th SFC (2015-20)
2.3.4 Recommendations for the PS: Panchayat
Samiti has just one orderly as its own staff. The
BDO office is hardly available to it. Even BPROs
do not work for the PS. The PS accordingly
should have personnel with different skills as
given in Table-2.7.
2.3.5 Recommendations for the ZP: (i) most
positions sanctioned in the ZPs are vacant and
available staff is not skilled for the contemporary
work. Compassionate appointments and non-
transferability of staff, who more often are locals,
promote local nexus. This seriously affects
performance of the ZPs. Staffing of ZP Patna is a
typical case (Table-2.8) and obviously needs
restructuring as per Table-2.7 like any other ZP.
(ii) CEO of the ZP (DDC) is only part time and
not able to devote required time to the ZP.
Accordingly, District Panchayat Raj officer
(DPRO) should be notified as ACEO with the
powers of CEO.
Need for Panchayat Development
Officer (PDO)
The GP is the Government at the grass roots as
envisaged by State Govt. i.e. Panchayat Sarkar. It
has Planning, Developmental, Regulatory and
judicial functions. The GPs need to utilize over
Rs.1.00 crore p.a. under various schemes etc.
Evidently, the Chief Executives of GP should have
both management and leadership qualities.
Accordingly, PDO is proposed who should have
degree in management or economics and have
sound knowledge of IT applications, selected
through open competition. Karnataka, Odisha, etc.
have appointed these PDOs with impressive results.
Sl. Post
Nature of
Post
Unit per GP/PS/ZP Total
No. of
Post
Salary
per
unit
pm
Total
Cost
(p.a.) in
Cr.
GP
(8398)
PS
(534)
ZP
Large
* (17)
Medium
* (12)
Small
* (09)
1 2 3 4 5 6 7 8 9
A Development Cadre
1 PDO1 Regular 1 0 0 0 0 8398 35000 352.72
B Engineering Cadre
2 District
Engineer Regular 0 0 1 1 1 38 50000 2.28
3 Assistant
Engineer Regular 0 1 2 1 1 589 44000 31.10
4 Junior
Engineer Regular 1 for 5 1 4 3 1 2327 30000 83.77
C Administrative Cadre
5 GP Sachiv Regular 1 0 0 0 0 8398 19000 191.47
6 Head Clerk Regular 0 0 1 1 1 38 25000 1.14
7 LDC-cum-Tax
Collector** Regular 1 1 7 5 4 9147 17000 186.60
D Accounts Cadre
8 Accountant Regular 1 1 1 1 1 8970 22000 236.81
E I.T. Cadre
9 I.T. Manager Regular 0 1 1 1 1 572 30000 20.59
10 I.T. Assistant-
cum-DEO2 Regular 1 1 4 3 2 9054 17000 184.70
F Contractual Staff
11 M.T.S3 Contractual /
Outsourced 1 1 (Maximum 3) 9046 11000 119.41
12 Peon-cum-
Mali do 0 0 (Maximum 2) 76 11000 1.00
13 Driver do 0 0 (Maximum 3) 114 11000 1.50
G Total 56767 1413
Note : 1. Panchayat Development Officer, 2. I.T. Assistant-cum-Data Entry Operator, 3. M.T.S. (Sweeper-cum-Peon-cum-Chaukidar)
* Large ZP = More than 15 Blocks, Medium ZP = 10 to 15 Blocks, Small ZP = Less than 10 Blocks ** LDC-cum-Tax Collector will serve both office work and tax collection in field.
Table 2.7: Model Panchayat Cadre for PRIs
Box 2.9
Box 2.9
16 5th SFC (2015-20)
Table 2.10: Performances under NBA/SBM of comparable States & India (12-13 & 13-14) (Rs. in Cr.)
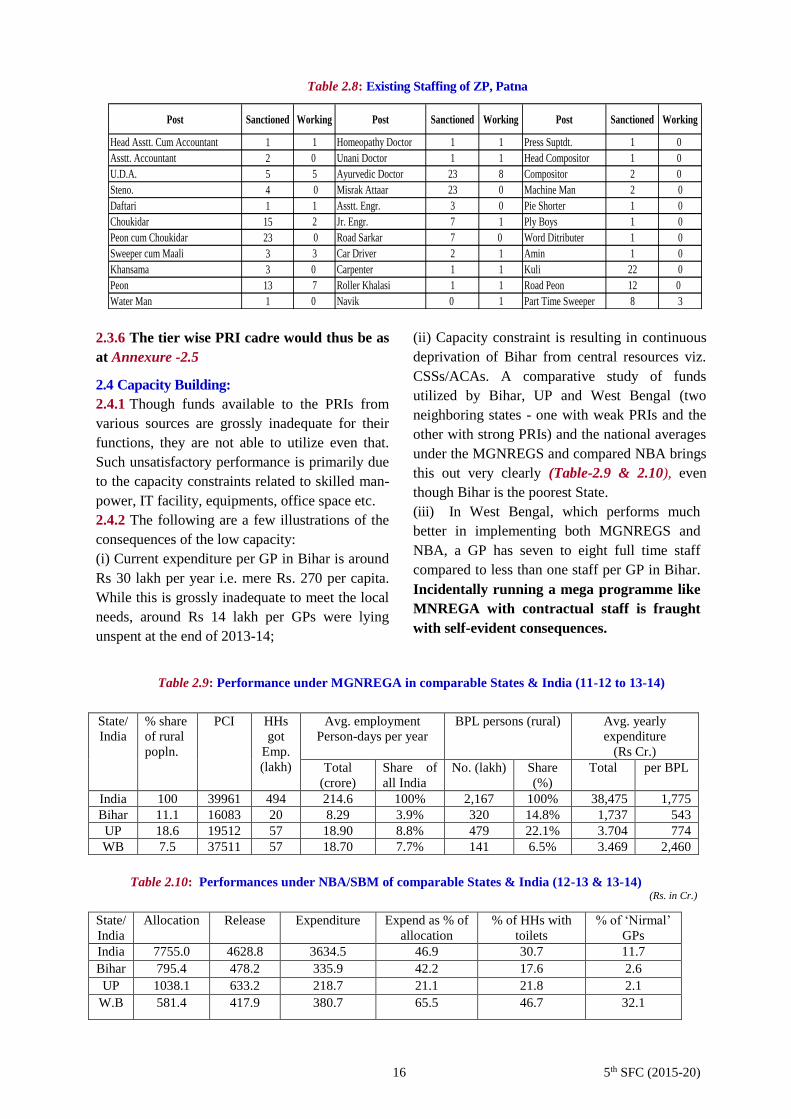
2.3.6 The tier wise PRI cadre would thus be as
at Annexure -2.5 2.4 Capacity Building:
2.4.1 Though funds available to the PRIs from
various sources are grossly inadequate for their
functions, they are not able to utilize even that.
Such unsatisfactory performance is primarily due
to the capacity constraints related to skilled man-
power, IT facility, equipments, office space etc.
2.4.2 The following are a few illustrations of the
consequences of the low capacity:
(i) Current expenditure per GP in Bihar is around
Rs 30 lakh per year i.e. mere Rs. 270 per capita.
While this is grossly inadequate to meet the local
needs, around Rs 14 lakh per GPs were lying
unspent at the end of 2013-14;
(ii) Capacity constraint is resulting in continuous
deprivation of Bihar from central resources viz.
CSSs/ACAs. A comparative study of funds
utilized by Bihar, UP and West Bengal (two
neighboring states - one with weak PRIs and the
other with strong PRIs) and the national averages
under the MGNREGS and compared NBA brings
this out very clearly (Table-2.9 & 2.10), even
though Bihar is the poorest State.
(iii) In West Bengal, which performs much
better in implementing both MGNREGS and
NBA, a GP has seven to eight full time staff
compared to less than one staff per GP in Bihar.
Incidentally running a mega programme like
MNREGA with contractual staff is fraught
with self-evident consequences.
State/
India
% share
of rural
popln.
PCI HHs
got
Emp.
(lakh)
Avg. employment
Person-days per year
BPL persons (rural) Avg. yearly
expenditure
(Rs Cr.)
Total
(crore)
Share of
all India
No. (lakh) Share
(%)
Total per BPL
India 100 39961 494 214.6 100% 2,167 100% 38,475 1,775
Bihar 11.1 16083 20 8.29 3.9% 320 14.8% 1,737 543
UP 18.6 19512 57 18.90 8.8% 479 22.1% 3.704 774
WB 7.5 37511 57 18.70 7.7% 141 6.5% 3.469 2,460
State/
India
Allocation Release Expenditure Expend as % of
allocation
% of HHs with
toilets
% of ‘Nirmal’
GPs
India 7755.0 4628.8 3634.5 46.9 30.7 11.7
Bihar 795.4 478.2 335.9 42.2 17.6 2.6
UP 1038.1 633.2 218.7 21.1 21.8 2.1
W.B 581.4 417.9 380.7 65.5 46.7 32.1
Post Sanctioned Working Post Sanctioned Working Post Sanctioned Working
Head Asstt. Cum Accountant 1 1 Homeopathy Doctor 1 1 Press Suptdt. 1 0
Asstt. Accountant 2 0 Unani Doctor 1 1 Head Compositor 1 0
U.D.A. 5 5 Ayurvedic Doctor 23 8 Compositor 2 0
Steno. 4 0 Misrak Attaar 23 0 Machine Man 2 0
Daftari 1 1 Asstt. Engr. 3 0 Pie Shorter 1 0
Choukidar 15 2 Jr. Engr. 7 1 Ply Boys 1 0
Peon cum Choukidar 23 0 Road Sarkar 7 0 Word Ditributer 1 0
Sweeper cum Maali 3 3 Car Driver 2 1 Amin 1 0
Khansama 3 0 Carpenter 1 1 Kuli 22 0
Peon 13 7 Roller Khalasi 1 1 Road Peon 12 0
Water Man 1 0 Navik 0 1 Part Time Sweeper 8 3
Table 2.8: Existing Staffing of ZP, Patna
Table 2.9: Performance under MGNREGA in comparable States & India (11-12 to 13-14)

17 5th SFC (2015-20)
2.4.3 Bihar with 14.8% share of BPL persons
generated 3.9% of the employment. If Bihar
were to reach even the national level, annual
expenditure would have been Rs 5,680 Cr. to an
average achievement of Rs 1,737 Cr. Bihar is
thus being deprived by at least Rs 3,943 Cr. per
year under MGNREGS alone. This loss
evidently is many times more compared to the
annual cost of strengthening the Panchayats.
If all the CSSs are considered, deprivation of
the state due to capacity constraint would be
of a huge magnitude.
2.4.4 14th FC conditionality for Performance
Grant: The 14th FC has prescribed following
eligibility condition for release of Performance
Grant of Rs. 2101.78 Cr over 5 years to the GPs:
(a) The GP will have to submit audited annual
accounts that relate to a year not earlier than two
years preceding the year in which the GP seeks
to claim the Performance Grant.
(b) The GP will have to show an increase in its
own revenues over the preceding year, as
reflected in the audited accounts.
2.4.5 It is thus an imperative both from the
viewpoints of the Principal of Subsidiarity and
the Constitutional obligation & pragmatism that
State Government takes all measures urgently to
build capacity of the PRIs to the fullest extent.
The first charge on the SFC transfers must,
therefore, be for full capacity building of the
PRIs.
2.4.6 Capacity Building and RGPSA:
(i) Rajiv Gandhi Panchayat Sashaktikaran
Abhiyan (RGPSA) scheme was launched by
GoI with a view to enhancing capacities and
effectiveness of the Panchayats and the Gram
Sabhas. The Perspective plan of RGPSA (13-17)
of Bihar and action plan are detailed in
Annexure-2.6.
(ii) Status of implementation of RGPSA: In
2013, State Govt. approved a Plan for the years
2013-14 to 2016-17 estimated at Rs. 1629 Cr. On
75:25 sharing (GoI: GoB). In 2013-14, Rs. 8.61
Cr. was received from GoI, out of which Rs. 2.30
Cr. was spent. The balance is lying in Bank
Account. In 2014-15, Rs. 54.52 Cr. was released as
Central Assistance, but money could not be drawn.
In brief, RGPSA was poorly implemented.
(iii) RGPSA has since been delisted from the
centrally assisted schemes. But the 5th SFC
recommendations cover all essential components
of RGPSA (Annexure-2.6)
2.4.7 Capacity building through training:
2.4.7.1 Capacity building will require appropriate
training infrastructure and arrangements, which
include (i) Training Institutions, and (ii) Training
Programmes. It may not be possible to immed-
iately establish 38 District Panchayat Resource
Centres (DPRCs) and therefore, the focus should
be to have 9 Divisional level training centers. The
State Panchayat Resource Centre (SPRC) at
Patna can also function as the Divisional level
centre for Patna division. There should be one
Principal and at least three Faculty Members.
Each division should have a pool of Resource
Persons for conducting training at Block
Panchayat Resource Centres (BPRCs). One
dedicated officer under DPRO should identify
trainees and coordinate with the training
institutions as well as monitor the same.
Similarly, there should be one Deputy Director
for Capacity Building at the Panchayat
Directorate.
2.4.7.2 Enabling the Panchayats will also require
putting in place all rules and procedures, manuals
(e.g., Office Management, Financial Management
etc.) and their availability in all the Panchayats. It
may be noted that the next PRIs election are due
in March-June, 2016 and elected functionaries
must receive induction training on a drive basis
within 6 months. The projected cost details of the
Training Programme and Training Institution
may be seen in Table-6.21 in Chapter VI.
2.4.7.3 Action suggested by MoPR in this regard
is given in Box-2.10. This commission endorsed
the same.
2.4.7.4 Capacity building of Elected Women
Representatives (EWR): State Government has
increased reservation for women in the PRIs to
50%. Obviously, many of them are holding for
the first time with little knowledge, orientation
and exposure to their expected functions.
Besides, the EWRs face multiple deprivations on
account of gender, social bias, household
obligation, lower literacy, lack of confidence etc.
Male members of their family often usurp their
functions. For enabling EWRs to discharge their
18 5th SFC (2015-20)
responsibilities effectively, their special needs
must be met as follows:
Adequate training and capacity building of the
EWRs.
Leadership training programmes for the EWRs
Training of other functionaries on gender issues
Peer-to-peer and horizontal learning from
success stories
Sharing good practices and exposure visits
Separate quorum for women’s participation in
Gram/Ward Sabhas.
Linkages with SHGs at all levels of the PRIs.
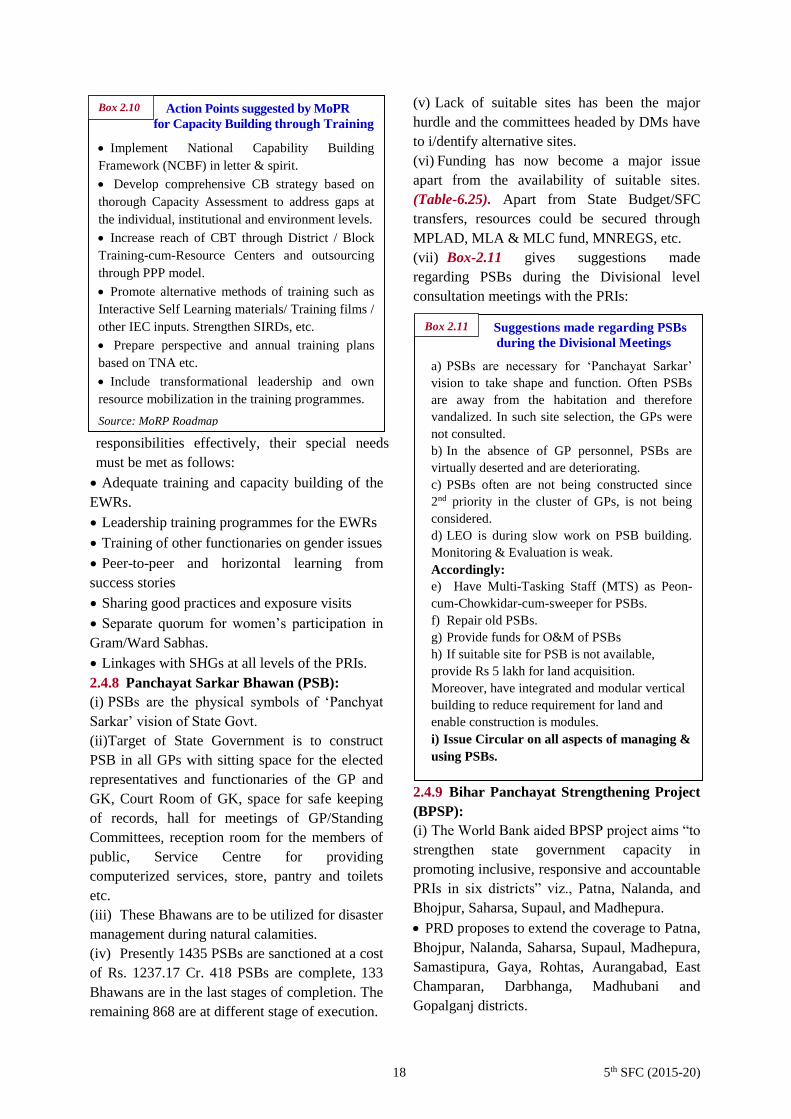
2.4.8 Panchayat Sarkar Bhawan (PSB):
(i) PSBs are the physical symbols of ‘Panchyat
Sarkar’ vision of State Govt.
(ii) Target of State Government is to construct
PSB in all GPs with sitting space for the elected
representatives and functionaries of the GP and
GK, Court Room of GK, space for safe keeping
of records, hall for meetings of GP/Standing
Committees, reception room for the members of
public, Service Centre for providing
computerized services, store, pantry and toilets
etc.
(iii) These Bhawans are to be utilized for disaster
management during natural calamities.
(iv) Presently 1435 PSBs are sanctioned at a cost
of Rs. 1237.17 Cr. 418 PSBs are complete, 133
Bhawans are in the last stages of completion. The
remaining 868 are at different stage of execution.
(v) Lack of suitable sites has been the major
hurdle and the committees headed by DMs have
to i/dentify alternative sites.
(vi) Funding has now become a major issue
apart from the availability of suitable sites.
(Table-6.25). Apart from State Budget/SFC
transfers, resources could be secured through
MPLAD, MLA & MLC fund, MNREGS, etc.
(vii) Box-2.11 gives suggestions made
regarding PSBs during the Divisional level
consultation meetings with the PRIs:
2.4.9 Bihar Panchayat Strengthening Project
(BPSP):
(i) The World Bank aided BPSP project aims “to
strengthen state government capacity in
promoting inclusive, responsive and accountable
PRIs in six districts” viz., Patna, Nalanda, and
Bhojpur, Saharsa, Supaul, and Madhepura.
PRD proposes to extend the coverage to Patna,
Bhojpur, Nalanda, Saharsa, Supaul, Madhepura,
Samastipura, Gaya, Rohtas, Aurangabad, East
Champaran, Darbhanga, Madhubani and
Gopalganj districts.
Action Points suggested by MoPR
for Capacity Building through Training
Implement National Capability Building
Framework (NCBF) in letter & spirit.
Develop comprehensive CB strategy based on
thorough Capacity Assessment to address gaps at
the individual, institutional and environment levels.
Increase reach of CBT through District / Block
Training-cum-Resource Centers and outsourcing
through PPP model.
Promote alternative methods of training such as
Interactive Self Learning materials/ Training films /
other IEC inputs. Strengthen SIRDs, etc.
Prepare perspective and annual training plans
based on TNA etc.
Include transformational leadership and own
resource mobilization in the training programmes.
Source: MoRP Roadmap
Box 2.10
Suggestions made regarding PSBs
during the Divisional Meetings
a) PSBs are necessary for ‘Panchayat Sarkar’
vision to take shape and function. Often PSBs
are away from the habitation and therefore
vandalized. In such site selection, the GPs were
not consulted.
b) In the absence of GP personnel, PSBs are
virtually deserted and are deteriorating.
c) PSBs often are not being constructed since
2nd priority in the cluster of GPs, is not being
considered.
d) LEO is during slow work on PSB building.
Monitoring & Evaluation is weak.
Accordingly:
e) Have Multi-Tasking Staff (MTS) as Peon-
cum-Chowkidar-cum-sweeper for PSBs.
f) Repair old PSBs.
g) Provide funds for O&M of PSBs
h) If suitable site for PSB is not available,
provide Rs 5 lakh for land acquisition.
Moreover, have integrated and modular vertical
building to reduce requirement for land and
enable construction is modules.
i) Issue Circular on all aspects of managing &
using PSBs.
Box 2.11
Box 2.10
19 5th SFC (2015-20)
(ii) It has the following components:
Panchayat Sarkar Bhawan (PSB) - Construct
and make functional PSBs in approx. 300 GPs:
(Cost $50.00 M)
Capacity Building of the PRIs: - Build
Panchayats' core institutional competencies to
empower them to achieve substantive
development outcomes. :(Cost $27.50 M)
Strengthen State Government capacity to
manage a gradual decentralization and
empowerment process: (Cost $2.50 M)
Panchayat Performance Grant: (Cost $20.00 M)
Project Management and Coordination :( Cost
$15.00 M).
(iii) Review comments by the World Bank on
current status are at Annexure-2.7.
Implementation of the BPSP Project is heavily
behind schedule and is in need of restructuring.
Perhaps a full time professional could be
appointed on contract to head the BPSP.
2.4.10 Technical Support for Smart
Panchayats (TSSP):
(i) TSSP is proposed on the pattern of Support
Programme for Urban Reforms (SPUR) for
support to the PRIs and the DPCs. Given the
large no of the PRIs, TSSP should have one
State level Team and 9 Divisional level Teams.
Principal Secretary, PRD is expected to
regularly review performance of the 9 Division
level Teams also. Details of projected cost may
be seen at Table-6.23 in Chapter VI.
(ii) Following Five distinct key outputs are
expected from TSSP: (a) Panchayat Governance,
(b) Panchayat Finance, (c) Panchayat Planning
and Infrastructure, (d) Local Economic
Development, and (e) Social Development,
Poverty Alleviation & Livelihoods.
(iii) Selection of TSSP Personnel would be done
through a reputed HR Agency empanelled by
GOI or UN agencies. The HR agency would be
selected from such panels by a Committee of
Principal Secretary (PRD), Principal Secretary
(UDD) and Secretary of Finance Department.
2.5 Institutional processes and Accounta-
bility of the Panchayats:
2.5.1 Gram Sabha:
(i) There is unanimity that the Gram Sabha is
soul of the Panchayats and in fact the whole
democratic framework and therefore, “Active
Gram Sabha: For Empowered People and
Accountable Panchayats” is a must. The GS is
key to self-governance and to transparent and
accountable functioning of the GP. The GS is
the only forum that can ensure direct,
participative democracy.
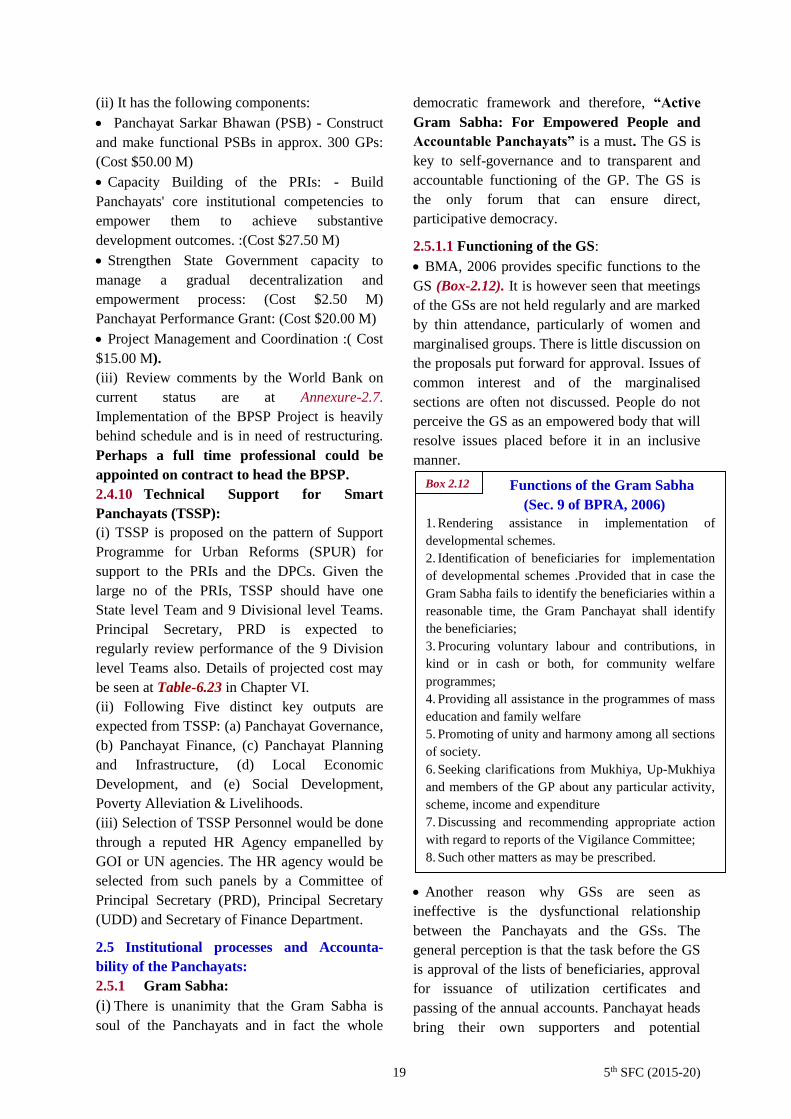
2.5.1.1 Functioning of the GS:
BMA, 2006 provides specific functions to the
GS (Box-2.12). It is however seen that meetings
of the GSs are not held regularly and are marked
by thin attendance, particularly of women and
marginalised groups. There is little discussion on
the proposals put forward for approval. Issues of
common interest and of the marginalised
sections are often not discussed. People do not
perceive the GS as an empowered body that will
resolve issues placed before it in an inclusive
manner.
Another reason why GSs are seen as
ineffective is the dysfunctional relationship
between the Panchayats and the GSs. The
general perception is that the task before the GS
is approval of the lists of beneficiaries, approval
for issuance of utilization certificates and
passing of the annual accounts. Panchayat heads
bring their own supporters and potential
Functions of the Gram Sabha
(Sec. 9 of BPRA, 2006)
1. Rendering assistance in implementation of
developmental schemes.
2. Identification of beneficiaries for implementation
of developmental schemes .Provided that in case the
Gram Sabha fails to identify the beneficiaries within a
reasonable time, the Gram Panchayat shall identify
the beneficiaries;
3. Procuring voluntary labour and contributions, in
kind or in cash or both, for community welfare
programmes;
4. Providing all assistance in the programmes of mass
education and family welfare
5. Promoting of unity and harmony among all sections
of society.
6. Seeking clarifications from Mukhiya, Up-Mukhiya
and members of the GP about any particular activity,
scheme, income and expenditure
7. Discussing and recommending appropriate action
with regard to reports of the Vigilance Committee;
8. Such other matters as may be prescribed.
Box 2.12

20 5th SFC (2015-20)
beneficiaries to attend the meetings so that while
the quorum is completed, other electors keep
away. Hence, a sense of cynicism has
developed about efficiency of the GS meetings.
In fact, ineffective GS is stated to be one of the
primary causes behind rise of Left Wing
Extremism in certain areas.
(ii) GS and Social Audit:
Social audit is a close corollary of energetic GS
functioning. It would inculcate respect for
downward accountability amongst elected
representatives and government officials. If the
GS keeps a close vigil, leakages and inefficien-
cies can be eliminated. The GS can (a) monitor
and discuss attendance of government function-
aries, functioning of schools, dispensaries,
Anganwadi Centres, ration shops and other local
institutions, (b) discuss reports of the Standing
Committees of the GP. (c) go through the list of
beneficiaries under schemes such as Indira
Awaas Yojana (IAY), Antyodaya Anna Yojana
(AAY) and National Old Age Pension Scheme.
(d) Be an effective forum for familiarizing the
electors with the Right to Information (RTI) for
eliciting information not available in normal
course.
(iii) Accordingly, empowering and enabling
the GS must receive the highest attention as
follows:
Redefine powers of the Gram Sabha along the
lines of PESA.
Ensure effective functioning of the GS
through regular and purposeful meetings,
participation of the marginalised groups,
attendance of official functionaries, preparation
of minutes of the meetings and follow-up.
Strengthen social audit and give proactive
information to the Gram Sabha. The GS should
be the forum for accountability not for the GP
alone but for all village level delivery
institutions such as the ICDS Centres, Health
Sub-centres, Elementary Schools, PDS provider
etc. Govt. Orders should mandate functionaries
of these institutions to present reports on
functioning of the respective facilities and
record suggestions of the people. All the CBOs
(para 2.2.3.9) like the watershed association etc.
should also place their report before the GS.
Separate Mahila Sabha at Ward level should be
constituted.
The Sarpanch should present a report in
the GS on the functioning of the GK in the
presence of the Panches.
(iv) PRD could not indicate what needs to be
done to enable the GSs to perform their
functions and cost implication of the same.
2.5.2 Ward Sabha: PRD has proposed
amendment in BPRA, 2006 for empowering the
Ward Sabha since the GPs are too large for
effective participation of the people. PRD could
not furnish status of functioning of the Ward
Sabhas.
2.5.3 Social Audit: PRD could not report on
whether social audit system is in place? If yes,
how effective are these? If not, measures to be
taken?
2.5.4 Standing Committees:
(i) The PRIs are to constitute following Standing
Committees (Table-2.11) though election from
among its members. If such committees are not
constituted and made functional, the PRIs get
identified with the elected chiefs and the major
objective of democratic decentralization is
defeated.
(ii) State Government should notify the
departmental officer, in each of the three tiers, to
be the ex-officio Secretary and Members of the
different Standing Committees. As per BPRA
2006, (i) Panchayat Sachiv is Secretary of the
Planning, Coordination and Finance Standing
Committee of the GP and (ii) Executive
Officer/Chief Executive Officer is the Secretary
of the General Standing Committee and the
Table 2.11: Standing Committees of the PRIs
(BPRA, 2006)
Committees
GP
(Sec.
25)
PS
(Sec.
50)
ZP
(Sec.
77)
1 2 3 4
General Standing Committee x √ √
Planning, Audit, Co-ordination
and Finance Committee √ √ √
Production Committee √ √ √
Social Justice Committee √ √ √
Education Committee √ √ √
Committee on Public Health,
Family Welfare & Rural
Sanitation
√ √ √
Public Works Committee √ √ √

21 5th SFC (2015-20)
Finance, Audit & Planning Standing
Committees of the PS/ZP. For all other Standing
Committees, DM has to nominate suitable
departmental officer, which is not done
normally.
(iii) Information about all relevant schemes
should be shared with the respective Standing
Committee.
2.5.5 Accountability of the GP level
Functionaries: Officials like Tola Sevak, Vikas
Mitra, Krishi Salahakar, etc. should sit and sign
attendance at the GP office. The villagers can
then mention their problem to the GP
functionaries for necessary follow up. There
should be meeting at PS level where the
Mukhias convey problems of their areas, which
remain unaddressed at the GP level meeting, to
the departmental officers in the presence of
Pramukh and BDO.
2.5.6 Directorate of Local Fund Audit
(DLFA):
(i) State Govt. decided in principle to constitute
DLFA as recommended by the 13th FC. As an
ad-hoc arrangement, 39 Senior Auditors from
State Headquarters and Divisions were posted in
Local Fund Audit Cell. This Cell audited 158
Local Bodies in 2013-14 leading to 18 Reports.
Based on this experience, guidelines’ including
Model Audit Report Form has been circulated.
(ii) A.G. Office has recommended 551 posts as
follows for DLFA:
(iii) Decision of State Govt. on various aspects
of DLFA like organizational structure,
manpower, rules, audit manual etc. is awaited.
2.5.7 Ombudsman: PRD could not furnish
information on the status of and measures to be
taken for effective Ombudsman. As reported by
UDD, it has drafted “Ombudsman Rules” and
shared with PRD for their opinion, which is
awaited since more than a year. Given the
difference in the nature of municipalities and
panchayats and the sheer no of the PRIs,
separate Ombudsman is recommended for
the PRIs as per Section 152 (5) of BPRA,
2006.
2.5.8 Rules being framed for the PRIs: Box-
2.13.
2.6. Implementation of e-Panchayat in Bihar
2.6.1 Necessity of e-Panchayat :
If the Panchayats are to perform efficiently and
effectively all the mandated tasks which are
increasing day by day, extensive use of IT is the
only way particularly so when they are facing
acute shortage staff. Moreover, there is a strong
need to build a “digitally inclusive society”
where the large sections of rural population are
able to:
Benefit from new technologies;
Access and share information and services
freely; and
Participate in the development process more
effectively.
The Panchayats being at the interface of rural
citizens and governance structure are perhaps
the most effective vehicles for inducing mass
ICT culture at the grass roots.
2.6.2 Implementation of e-Panchayat Modules:
Objectives of the 11 common core e-Panchayat
Modules developed by MoPR for the whole
Country may be seen at Annexure-2.8.
Sl.
No
Name of the post No.
of
post
1 Director 01
2 Dy. Director 04
3 Asstt. Drrector (Sr. Audit Officer) 16
4 Audit Officer 50
5 Asst. Audit Officer 120
6 Senior Auditor 120
7 Auditor 240
Total 551
Details may be seen in para 10.5.4
A. Rules framed for the PRIs
Panchayat Election Rules, 2006
(Amendurent,2007)
District Planning Committee Rules
Gram Katchahry Sachiv Rules, 2007& 2014
State Election Commission Rules, 2008
Panchayat Service Rules, 2010
Gram Panchayat Rules,2011
Panchayat Rules, 2012 & 2014
Gram Sabha Rules, 2012
Panchayati Raj Institution Rules, 2015
B. Rules under formulation for the PRIs
Bihar Tax & Charges (imposition,
determination & collection) Rules
Ward Sabha Meeting Rules
Box 2.13
22 5th SFC (2015-20)
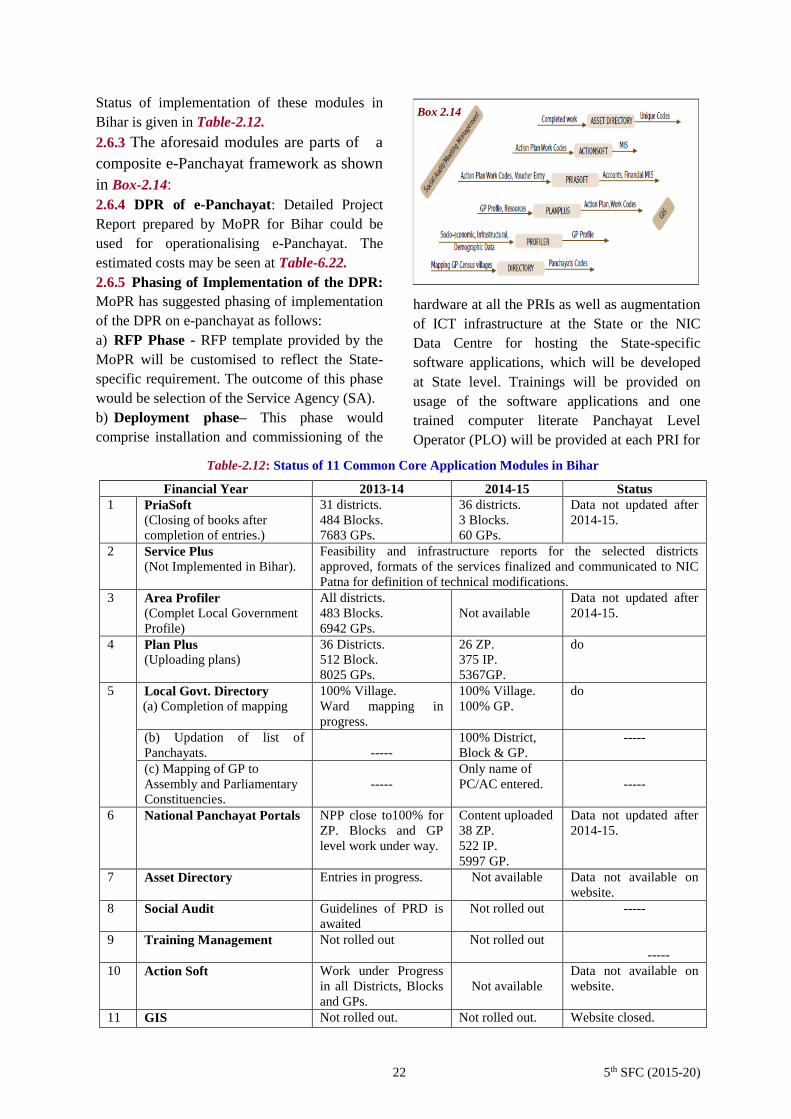
Status of implementation of these modules in
Bihar is given in Table-2.12.
2.6.3 The aforesaid modules are parts of a
composite e-Panchayat framework as shown
in Box-2.14:
2.6.4 DPR of e-Panchayat: Detailed Project
Report prepared by MoPR for Bihar could be
used for operationalising e-Panchayat. The
estimated costs may be seen at Table-6.22.
2.6.5 Phasing of Implementation of the DPR:
MoPR has suggested phasing of implementation
of the DPR on e-panchayat as follows:
a) RFP Phase - RFP template provided by the
MoPR will be customised to reflect the State-
specific requirement. The outcome of this phase
would be selection of the Service Agency (SA).
b) Deployment phase– This phase would
comprise installation and commissioning of the
hardware at all the PRIs as well as augmentation
of ICT infrastructure at the State or the NIC
Data Centre for hosting the State-specific
software applications, which will be developed
at State level. Trainings will be provided on
usage of the software applications and one
trained computer literate Panchayat Level
Operator (PLO) will be provided at each PRI for
Box 2.14
Table-2.12: Status of 11 Common Core Application Modules in Bihar
Financial Year 2013-14 2014-15 Status
1 PriaSoft
(Closing of books after
completion of entries.)
a) 31 districts.
b) 484 Blocks.
c) 7683 GPs.
d) 36 districts.
e) 3 Blocks.
f) 60 GPs.
Data not updated after
2014-15.
2 Service Plus
(Not Implemented in Bihar).
Feasibility and infrastructure reports for the selected districts
approved, formats of the services finalized and communicated to NIC
Patna for definition of technical modifications.
3 Area Profiler
(Complet Local Government
Profile)
a) All districts.
b) 483 Blocks.
c) 6942 GPs.
d)
e) Not available
f) Data not updated after
2014-15.
4 Plan Plus
(Uploading plans)
a) 36 Districts.
b) 512 Block.
c) 8025 GPs.
26 ZP.
375 IP.
5367GP.
do
5 Local Govt. Directory
(a) Completion of mapping
a) 100% Village.
b) Ward mapping in
progress.
c) 100% Village.
d) 100% GP.
e) do
(b) Updation of list of
Panchayats.
-----
f) 100% District,
Block & GP.
-----
(c) Mapping of GP to
Assembly and Parliamentary
Constituencies.
-----
g) Only name of
PC/AC entered.
-----
6 National Panchayat Portals NPP close to100% for
ZP. Blocks and GP
level work under way.
Content uploaded
38 ZP.
522 IP.
5997 GP.
Data not updated after
2014-15.
7 Asset Directory Entries in progress. Not available Data not available on
website.
8 Social Audit Guidelines of PRD is
awaited
Not rolled out -----
9 Training Management Not rolled out Not rolled out
-----
10 Action Soft Work under Progress
in all Districts, Blocks
and GPs.
Not available
Data not available on
website.
11 GIS a) Not rolled out. b) Not rolled out. Website closed.

23 5th SFC (2015-20)
backlog data entry and provision of services,
both G2C and G2G, on an ongoing basis.
c) Operations and Maintenance Phase- The
manpower provisioned for data entry would
continue to provide operational support for a
period of three years. During which the
Panchayat officials/ members are expected to
enhance their skill sets and become sufficiently
able to use all software applications.
2.6.6 Road Ahead for sustainable
implementation of e-Panchayat: - (i) Although
Bihar received e-Panchayat Puraskar in 2014, it
has not been implemented on a systemic basis.
As a result, after discontinuation of RGPSA,
even the ad-hoc arrangement made by State
Govt. to implement e-Panchayat has stopped
functioning since April, 2015.
(ii) Following Actions need to be taken
urgently for implementing e-Panchayat on a
systemic and sustainable basis:
(a) Have a clear strategy and action plan for roll-
out of e-Panchayat based on ISNA, BPR and
DPR prepared by MoPR for Bihar.
(b) Use RFP prepared by MoPR (duly modified)
for selecting Service agency.
(c) Provide ICT infrastructure and trained
manpower to all GPs, PSs and ZPs.
(d) Connect all GPs with broadband since
entries in the applications are to be made online
and on real time basis.
(e) Deploy all 11 Core Common Applications
within a time frame of say 2 years.
(f) Develop the identified State specific
Applications. (List at Annexure-2.8)
(g) Create hand-holding facilities at district &
block level, since available manpower at the GP
and PS levels are not able to address problems of
HW/SW and need continuous support.
(h) Leverage CSCs, wherever available as front-
ends for citizen services as an option.
2.6.7 Taking RTPSA services from the Block
HQs to the GPs: Service Plus module of e-
Panchayat should be adopted instead of
AdhikarSoft for the reason given in Annexure-
2.9. In that case, RTPSA services can easily be
taken from the Block HQs to the GPs.
2.7 Actions proposed in the paras above alone
would fulfill the three key Panchayat agenda of
Empowerment, Enablement and Accountability as
mentioned in para 2.1.6.
86 5th SFC (2015-20)
Chapter VI
PRIs Finances: Review and Forecast of Revenue and Expenditure
6.1 Computing Resource Gap:
6.1.1 The primary purpose of this Chapter is to
project resource gap of the PRIs for the award
period of the 5th SFC i.e., 2015-16 to 19-20. This
evidently would require review and forecast of
Revenue and Expenditure of the PRIs based on
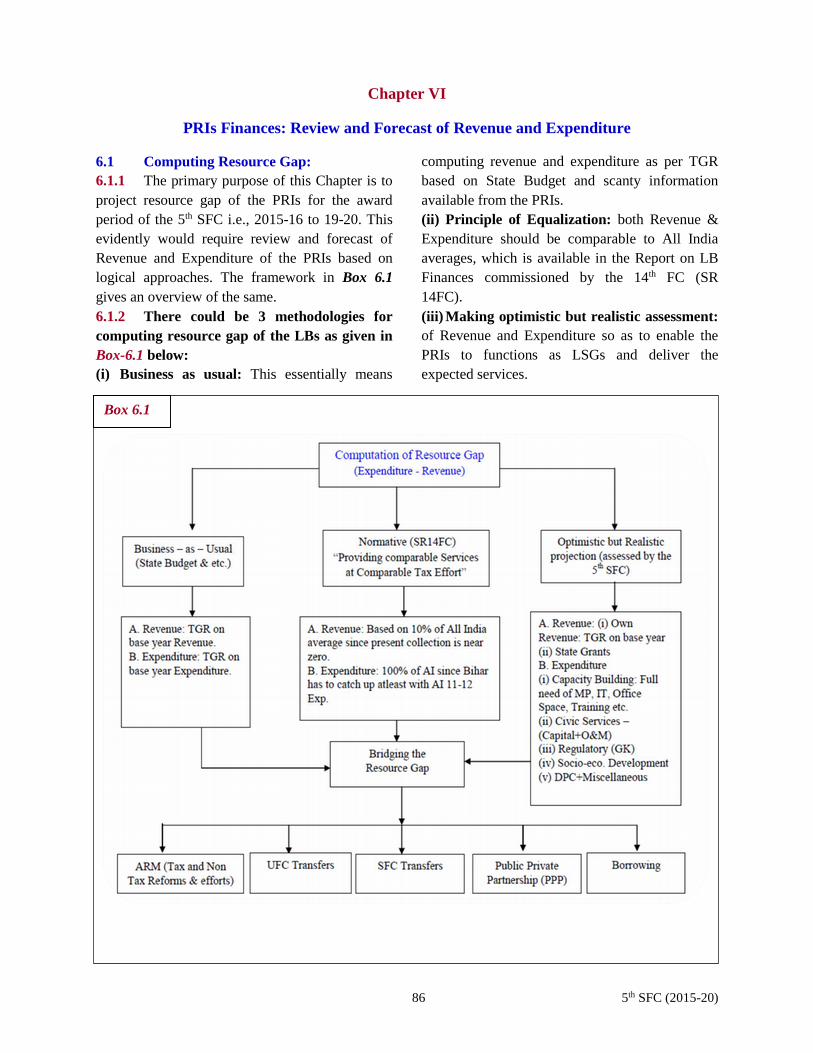
logical approaches. The framework in Box 6.1
gives an overview of the same.
6.1.2 There could be 3 methodologies for
computing resource gap of the LBs as given in
Box-6.1 below:
(i) Business as usual: This essentially means
computing revenue and expenditure as per TGR
based on State Budget and scanty information
available from the PRIs.
(ii) Principle of Equalization: both Revenue &
Expenditure should be comparable to All India
averages, which is available in the Report on LB
Finances commissioned by the 14th FC (SR
14FC).
(iii) Making optimistic but realistic assessment:
of Revenue and Expenditure so as to enable the
PRIs to functions as LSGs and deliver the
expected services.
Box 6.1

87 5th SFC (2015-20)
Powers of the LBs to realize tax & non-tax under the Constitution
243H. Powers to impose taxes by, and Funds of, the Panchayats.—The Legislature of a State may, by
law,—
(a) authorise a Panchayat to levy, collect and appropriate such taxes, duties, tolls and fees in
accordance with such procedure and subject to such limits;
(b) assign to a Panchayat such taxes, duties, tolls and fees levied and collected by the State
Government for such purposes and subject to such conditions and limits;
(c) provide for making such grants-in-aid to the Panchayats from the Consolidated Fund of the State;
and
(d) provide for constitution of such Funds for crediting all moneys received, respectively, by or on
behalf of the Panchayats and also for the withdrawal of such moneys there-from, as may be specified
in the law.
6.2 Resources of the PRIs:
Resources of the PRIs come primarily in three
ways i.e., own revenue, FC/SFC transfers, and
Scheme transfers for agency functions as shown
in the flowchart below (Box-6.2). Historically,
most of the PRIs revenue comes by way of
Agency functions and FC/SFC transfers. Own
revenue of the PRIs in Bihar is way below All-
India Average.
6.2.1 Powers of the PRIs to realize tax &
non-tax revenue:
a) Constitution: As per Article 243H, the PRIs are
to be authorized by the State Legislature to levy,
collect and appropriate tax and non-tax revenue
apart from assigning taxes etc. and providing grants
from the CFS. (Box-6.3)
b) Powers of the PRIs to realize tax & non-tax
revenue under the State Acts: As per Section
27(1, 2), 55(1, 2, and 3) & 82(1, 2, and 3) of BPRA,
2006, the PRIs have power to realize tax and non-tax
revenue as given in Table-6.1. However, Rules for
the same have to be framed and enforced urgently.
Box 6.2
Box 6.3

88 5th SFC (2015-20)
Table 6.1: Taxation Power of the PRIs in Bihar (BPRA, 2006)
Gram Panchayat Panchayat Samiti Zila Parishad
a. Tax:
Section 27. (1):- (a) Tax on occupants of
holdings;
(b) Tax on Professions,
trades, callings and
employments
b. Non-Tax: Section 27.(2):- –
(a) Registration of vehicles
not registered under any other
law
(b) sanitary arrangements at
such places of pilgrimage,
haats, melas and public use
(c) Water Rate,
(d) Lighting Fee,
(e) Conservancy Rate
a. Tax:
Section 55.(1):- (a) levy tolls in respect of any ferry
established by it or under its
management;
(b) levy following fees and rates;
(i) Registration of vehicles,
(ii) Sanitary arrangements at such places
of pilgrimage, haats and melas
(iii) License for a haat or market;
(iv) Water rate,
(v) Lighting rate
b. Non-Tax:
Section 55.(2):- (a) registration of vehicle or levy fee
there for and shall not provide sanitary
arrangements at places of pilgrimage,
haats and melas.
a. Tax:
Section 82. (1):- (a) levy tolls in respect of any ferry
established by it or under its
management.
(b) levy following fees and rates;
(i) Registration of boats or vehicles;
(ii) sanitary arrangements at such
places of pilgrimage, fairs and melas
(iii) Licence for fair or mela;
(iv) Lighting rate
(v) Water rate
b. Non-Tax:
Section 82.(2):- (a) not levy fee on such vehicles
which have already been registered by
any other authority or at the places of
pilgrimage, melas etc.
Assessment and Collection of Taxes etc.
Prepare details about assessed tax, collection made and arrears, in respect of each tax and non-tax revenue, for
each level of Panchayats, through the permanent SFC Cell in the State Government.
Analyse data collected for identifying broad trends among Panchayats and for identifying champions and
innovations. Compile such good practices.
Undertake a campaign to overcome the large slack in revenue collection.
Prepare a compendium of the relevant legal provisions and executive orders in respect of the administration of
taxes by PRIs, incentivisation programmes, innovations, recommendations of the SFC etc.
Assist the SFC to lead policy work for: (a) exploring appropriate tax and non-tax revenue assignments; (b)
ways and means of administering and enforcing them including manpower and training; and (c) achieving a
greater linkage between revenue collection and spending decisions at the local level.
Rationalise the number and type of taxes, and assign at least a few important taxes to each level of Panchayat.
Re-examine the current rates of taxation and consider an upward revision, remove maximum limits fixed on
tax as also the conditionalities that hamper or restrict taxation powers of Panchayats. Do not abolish taxes in
Panchayat domain (for example, some States have abolished house tax).
Incentivise tax and non-tax efforts of Panchayats by reworking the formulae for devolution of funds and also
provide disincentives for the non-performing PRIs. Fix user charges on a rationale basis and provide
incentives to PRIs for enforcement.
Source: MoPR, GoI
c) Mobilising revenue: Box-6.4 below gives a
schematic framework of assessment and collection
of revenue by the PRIs.
6.2.2 Assigned taxes from State Govt.: State
Govt. can assign any tax (partially or fully) to the
LBs.
Box 6.4

89 5th SFC (2015-20)
Table: 6.2 Own Revenue Sources of the PRIs
Revenue
Source
2010-11 2011-12 2012-13 2013-14 2014-15
Arr Asses Rzd Arr Asses Rzd Arr Asses Rzd Arr Asses Rzd Arr Asses Rzd
A. Tax
Property tax
Profession
tax
Sairat
Entertainment tax*
B. Non-tax
User charge
License fees
Tolls
Others
(specify)
Total
6.2.3 FC Transfers: The FC transfers comprise of
(a) Grants from the UFC, and (b) Devolution &
Grants from the SFC. These transfers can be tied
or untied (details in Chapter. VIII)
6.2.4 Resources for the Agency Functions: Funds
also flow to the LBs under State and Central
schemes for specific purposes.
6.2.5 Resources under Capital receipts: These
comprise of PPP, Borrowings/Bonds, Recovery of
loans, etc.
6.3 Review of Resources (2010-15) :
6.3.1 Own Revenue Sources:
(i) Information not received from PRD in the
format below. (Table-6.2)
(ii) It is learnt that near zero collection of own
revenue is made by both the GPs and the PSs. Some
revenues are being generated by the ZPs.
6.3.1.1 Measures taken by state government:
The PRIs are not able to realize tax or non-tax
revenue due to the absence of relevant Rules, clear
Guidelines and related manpower. Their lands etc.
cannot be used for productive purposes, being
mostly un-demarcated, encroached or disputed.
Accordingly ;
(i) State Govt. should notify Rules for collection of
holding tax etc. by the PRIs,
(ii) State Govt. should issue clarification and
circulate a model Bye-law to enable the
Panchayats to collect non-tax revenue against
services provided.
(iii) The Panchayats should mobilize revenue by
(a) creating economic assets like market, shops,
community hall etc. (b) developing natural assets
like horticulture, social forestry, fishery etc. on
their own community land, which may be given
on lease.
6.3.2 Assigned taxes from State Govt.:
Information not received from PRD.
6.3.3 FC Transfers: As per the 13th FC and the 4th
SFC recommendations, following amounts should
have flown to the PRIs (Table-6.3). Status of funds
actually received by the PRIs is awaited from PRD.
6.3.4 Resources for the Agency Functions:
Given the recent restructuring of the CSS/ACA
schemes, it would be even more important to the
review allocations to the PRIs under different
schemes.
6.3.5 Capital Receipts: The PRIs in Bihar have nil
Capital receipts as per SR14 FC. Actual status from
PRD is awaited.

90 5th SFC (2015-20)
Table 6.3: Transfers from the 13th FC and the 4th SFC
In Cr.
Sl Years 10-11 11-12 12-13 13-14 14-15 10-15
Items ( R ) ( A ) ( R ) ( A ) ( R ) ( A ) ( R ) (A) ( R ) ( R.E) ( R ) ( R.E)
The 13th FC
1 Basic grant 461 456 535 584 625 657 741 758 877 828 2614 3282
2 Performance grant 0 0 183 268 429 528 506 726 597 168 1286 1691
3 Total transfer to PRIs 461 456 718 852 1054 1185 1247 1484 1474 996 3900 4973
The 4th SFC
4 Divisible pool 6,436 9,377 7,227 12,010 8,114 15,637 9,110 10,226 32999 37025
5 7.5% of Devolution 483 703 542 901 609 1,173 683 767 2475 2777
6 Share of PRIs (70%) 338 492 379 631 426 821 478 537 1732 1944
7 Grants to PRIs 180 180 180 180 180 180 180 180 721 541
8
Tied amount for PRIs
( out of devolution) 318 318 318 318 318 318 318 318 1272 954
9 Untied amount for PRIs (out of devolution) 20 174 61 313 108 503 160 219 460 990
10 Total transfer to PRIs 518 673 560 811 606 1,001 659 717 2454 2485
Composite FC Transfers to
PRIs ( 3+10) 979 1,128 1,278 1,663 1,660 2,186 1,906 1,484 2,191 996 6,354 7,458
( R ): Recommendations by the FCs , 'A' - As per budget, R.E.: Revised Estimate.
Note: PRD to confirm and furnish details about Actuals.
Table 6.4: Central scheme transfers Rs. Cr.
Sl. Schemes 10-11 11-12 12-13 13-14 14-15 (B.E)
1 BRGF 805.48 3974.17
2 MGNREGS 1600
3 IAY 2700
4 IGNOAPS
5 SSA 4000
6 MDM 1282.29
7 Literacy Mission
8 NRHM 1200
9 ICDS
10 NRDWP
11 TSC
12 RKVY 715
13 NRLM 208
14 RGPSY 300
15 NEGAP 23.06
16 Others (specify)
17 Total
Source: Department of Planning, Govt. of Bihar.
Table 6.5: State scheme transfers Rs. Cr.
Scheme 10-11 11-12 12-13 13-14 14-15
ZP PS GP ZP PS GP ZP PS GP ZP PS GP ZP PS GP
Lohia Sanitation
MMGVY
Others (specify)
Total
Information not received from PRD
Information not received from PRD

91 5th SFC (2015-20)
Table 6.6: Projections of total revenue of the PRIs Rs. Cr.
Sl. Items 15-16 16-17 17-18 18-19 19-20 15-20
1 Own Revenue 92 102 112 123 135 564
2 14th FC Transfers 2269 3554 4097 4729 6368 21017
3 State Grant 203 223 246 270 297 1239
Total Revenue ( 1+2+3) 2564 3879 4455 5122 6800 22820
Table 6.7: All India PC Own Revenue Sources (2007-2015)
Sl.
Items Village Level (GP)
1 2 3 4 5 6 7 8
Year 2007 2011 CAGR 12-13 13-14 14-15 15-16
Own Revenue 44 64 10 70 77 85 93
1 Property taxes 22 30 8 33 36 39 42
2 Other taxes 10 15 11 17 19 21 23
3 User charges and non-tax 11 18 13 20 23 26 29
Intermediate Level (PS)
Own Revenue 11 19 15 22 25 29 34
1 Property taxes 2 2 -1 2 2 2 2
2 Other taxes 4 7 15 9 10 11 13
3 User charges and non-tax 4 10 21 12 14 17 21
District Level (ZP)
Own Revenue 44 81 16 94 110 128 149
1 Property taxes 2 3 0 3 3 3 3
2 Other taxes 27 52 18 62 73 86 101
3 User charges and non-tax 14 26 16 30 35 41 47
Total
Own Revenue 99 164 13 186 211 240 272
1 Property taxes 27 35 7 38 40 43 46
2 Other taxes 42 75 16 87 101 117 136
3 User charges and non-tax 30 54 16 62 72 83 96
6.4 Forecast of Revenue: (2015-20):
Sources of revenue of the LBs are given in Box-
6.2, whereas, Box-6.1 includes possible
methodology for projecting revenue as follows:
6.4.1 Business-as-usual: The LB window of
State Budget has no data on revenue. Own
revenues of GPs & PSs are negligible and
therefore have not been projected. For ZPs, the
Commission has calculated own revenue based on
ZP, Patna data. i.e., (i) for ZP, Patna: own revenue
of Patna ZP for 13-14 and (ii) for other ZPs: 10%
of own revenue of Patna ZP * 37 ZPs with annual
increase of 10%. For State Grant, the Commission
has projected annual increase of 10% over the
base year of 15-16. Accordingly, projection for
the next five years is given in Table-6.6.
6.4.2 Normative approach (based on
SR14FC data): As per SR14FC, revenue of the
PRIs in Bihar from internal sources has been near
zero and they are dependent entirely on FC and
Scheme transfers. For assessing revenues and
computing resource gap, following steps have
been followed.
6.4.2.1 Own Revenue Sources (ORS):
Step 1: CAGR (2007-2011) of All-India PC ORS
taken from SR14FC and used for projecting ORS
for 12-13 to 15-16. (Refer Table-6.7)
Step 2: Projection of PC ORS for Bihar made on
the basis of 10% of the projected All-India PC
ORS in 15-16 and then increased by CAGR of

92 5th SFC (2015-20)
Table 6.8 (a): PC ORS Projection for Bihar (2015-2020)
Sl.
Items PC (AI) PC (Bihar)
Year CAGR 15-16 15-16 16-17 17-18 18-19 19-20
1 2 3 4 5 6 7 8
Village Level (GP)
Own Revenue 10 93 9 10 11 12 14
1 Property taxes 8 42 4 5 5 5 6
2 Other taxes 11 23 2 3 3 3 3
3 User charges and non-tax 13 29 3 3 4 4 5
Intermediate Level (PS)
Own Revenue 15 34 3 4 4 5 6
1 Property taxes -1 2 0.22 0.22 0.21 0.21 0.21
2 Other taxes 15 13 1 1 2 2 2
3 User charges and non-tax 21 21 2 2 3 4 4
District Level (ZP)
Own Revenue 16 149 15 17 20 23 27
1 Property taxes 0 3 0 0 0 0 0
2 Other taxes 18 101 10 12 14 17 19
3 User charges and non-tax 16 47 5 5 6 7 9
Total
Own Revenue 13 272 27 31 35 40 45
1 Property taxes 7 46 5 5 5 6 6
2 Other taxes 16 136 14 16 18 21 24
3 User charges and non-tax 16 96 10 11 13 15 17
Table 6.8 (b): PC ORS Projection for Bihar (2015-2020)
Sl.
Items Estimated
GR *
Projected
GR
PC (Bihar)
Year 15-16** 16-17 17-18 18-19 19-20
1 2 3 4 5 6 7 8
Village Level (GP)
Own Revenue 95 10 9 10 11 12 14
1 Property taxes 92 10 4 5 5 6 6
2 Other taxes 97 10 2 3 3 3 3
3 User charges and non-tax 100 10 3 3 4 4 4
Intermediate Level (PS)
Own Revenue 104 10 3 4 4 4 5
1 Property taxes 76 10 0.22 0.24 0.26 0.22 0.37
2 Other taxes 105 10 1 1 2 2 2
3 User charges and non-tax 115 10 2 2 2 3 3
District Level (ZP)
Own Revenue 107 10 15 16 18 20 22
1 Property taxes 78 10 0 0 0 0 0
2 Other taxes 109 10 10 11 12 13 15
3 User charges and non-tax 106 10 5 5 6 6 7
Total
Own Revenue 102 10 27 30 33 36 40
1 Property taxes 90 10 5 5 6 6 7
2 Other taxes 106 10 14 15 16 18 20
3 User charges and non-tax 106 10 10 11 12 13 14
All-India. Refer table 6.8 (a).
Step 3: Projection of PC ORS for Bihar made on
the basis of Growth Rate of 10% only, since
CAGR for attaining PC ORS of All India level in
19-20 would be too high. Refer Col. 2 of Table-
6.8 (b).
Step 4: Projecting Rural population for Bihar:
Methodology of the SR14FC has been followed
i.e. adding yearly increase in rural population to
the current years’ for the next years’ value as

93 5th SFC (2015-20)
Part A
Rural population Growth rate (%) Yearly increase
in Population 2001 Census 2011 Census Decadal Yearly
743,16,709 923,41,436 24.25 2.43 18,02,473
Part B
Yr. 2012 2013 2014 2015 2016 2017 2018 2019 2020
Rur. Popln. (In Cr.) 9.41 9.59 9.77 9.96 10.14 10.32 10.5 10.68 10.86
Table 6.9 Tier wise total ORS Projection for Bihar (2015-2020)
Sl.
Items Tier wise projection of total ORS
Year Projected
GR 15-16 16-17 17-18 18-19 19-20 15-20
1 2 3 4 5 6 7 8
Village Level (GP)
Own Revenue 10 93 105 117 131 147 592
1 Property taxes 10 41 46 52 58 65 263
2 Other taxes 10 23 26 29 32 36 146
3 User charges and non-tax 10 29 32 36 41 45 183
Intermediate Level (PS)
Own Revenue 10 36 40 45 50 56 226
1 Property taxes 10 2 2 3 3 3 14
2 Other taxes 10 13 15 16 18 20 82
3 User charges and non-tax 10 20 23 26 29 32 130
District Level (ZP)
Own Revenue 10 150 168 188 211 236 953
1 Property taxes 10 2 3 3 4 4 16
2 Other taxes 10 101 113 126 141 158 638
3 User charges and non-tax 10 47 53 59 66 74 299
Total
Own Revenue 10 279 313 350 392 438 1771
1 Property taxes 10 46 52 58 65 72 293
2 Other taxes 10 136 153 171 192 214 866
3 User charges and non-tax 10 96 108 121 135 151 612
Table 6.10: Grants for the GPs of Bihar by the 14th FC Rs. Cr.
Year 15-16 16-17 17-18 18-19 19-20 15-20
Total 2269 3554 4097 4729 6368 21018
a. Basic grant 2269 3142 3630 4200 5674 18916
b.Performance grant 0 412 466 530 694 2102
follows (See Part A and Part B):
Step 5: Tier wise Projection of Total ORS of
Bihar for 2015-20 (Refer Table-6.9) is made by
multiplying PC ORS of Bihar (see Table-6.8 b)
with population (see Step 4).
6.4.2.2 Assigned Taxes: The Commission did
not receive information from PRD and therefore
not included revenues from the assigned taxes in
the assessment.
6.4.2.3 FC/ SFC transfers:
(a) 14thFC: The 14th FC has recommended
(Annexure-9.1 of 14th FC Report) a grant of Rs.
21,018 Cr. for the GPs of Bihar for providing core
civic services as given in Table-6.10.
(b) 5th SFC Transfers: Refer to the
recommendations in Chapter IX. (para 9.7 )
6.4.2.4 Scheme transfers: Since (a) there has
been restructuring of CSSs in the Union Budget

94 5th SFC (2015-20)
Table 6.11: Projection of Total Revenue as per SR14FC Rs. Cr
Sl. Year 15-16 16-17 17-18 18-19 19-20 15-20
1 Own Revenue 279 313 350 392 438 1771
2 14th FC Transfers 2269 3554 4097 4729 6368 21017
3 Total* 2548 3867 4447 5121 6806 22788
Table 6.12: Projection of Total Revenue as per 5th SFC Rs. Cr.
Sl. Items 15-16 16-17 17-18 18-19 19-20 15-20
1 Own Revenue (a+b+c) 157 174 193 213 237 974
a. GP 47 53 59 66 74 297
b. PS 18 20 23 25 28 114
c. ZP 92 102 112 123 135 564
2 14th FC Transfers 2269 3554 4097 4729 6368 21017
3 State Grants 203 223 246 270 297 1149
Total ( 1+2+3) 2629 3951 4536 5212 6902 23140
15-16 B.E, (b) it is still not clear which schemes
will be operative, and (c) resources under schemes
usually come along with the agency functions,
Commission has not considered scheme transfers
while calculating revenue or resource gap.
6.4.2.5 Total Revenue projection based on
Normative Approach (Refer to Table-6.9 for Own
Revenue & Table-6.10 for 14th FC Transfers) can
be summed up in Table-6.11.
6.4.3 5th SFC Approach: Optimistic but
realistic approach as follows has been adopted
since Bihar LBs have to catch up in 2019-20 with
at least All India level of 2015-16.
6.4.3.1 Own Revenue: Since information was
not received from PRD about own revenue of the
GPs and PSs of Bihar, this Commission has
adopted same methodology as explained in para-
6.4.2.1. It took only 50% of GP & PS figures from
Table-6.9 due to very low capacity of the GPs &
PSs in collecting taxes and fees. For ZPs, this
Commission has calculated own revenue based on
Patna ZP data. i.e., (i) For ZP Patna: - own
revenue of ZP, Patna for 13-14, and (ii) For other
ZPs: - 10% of own revenue of Patna ZP * 37 ZPs
with annual increase of 10%.
6.4.3.2 14th FC Transfers: Figures as per
Recommendation of the 14th FC (Table-6.10)
6.4.3.3 State Grants: Taken from the LB
window of State Budget (Table-6.6) for 15-16
with annual increase of 10% subsequently.
6.4.3.4 Total Revenue projection based on 5th SFC
Approach for 2015-20 may be seen in Table-6.12.
6.5 Expenditure of the PRIs
6.5.1 Items of Expenditure:
Box 6.5 shows the major items of expenditure.
.
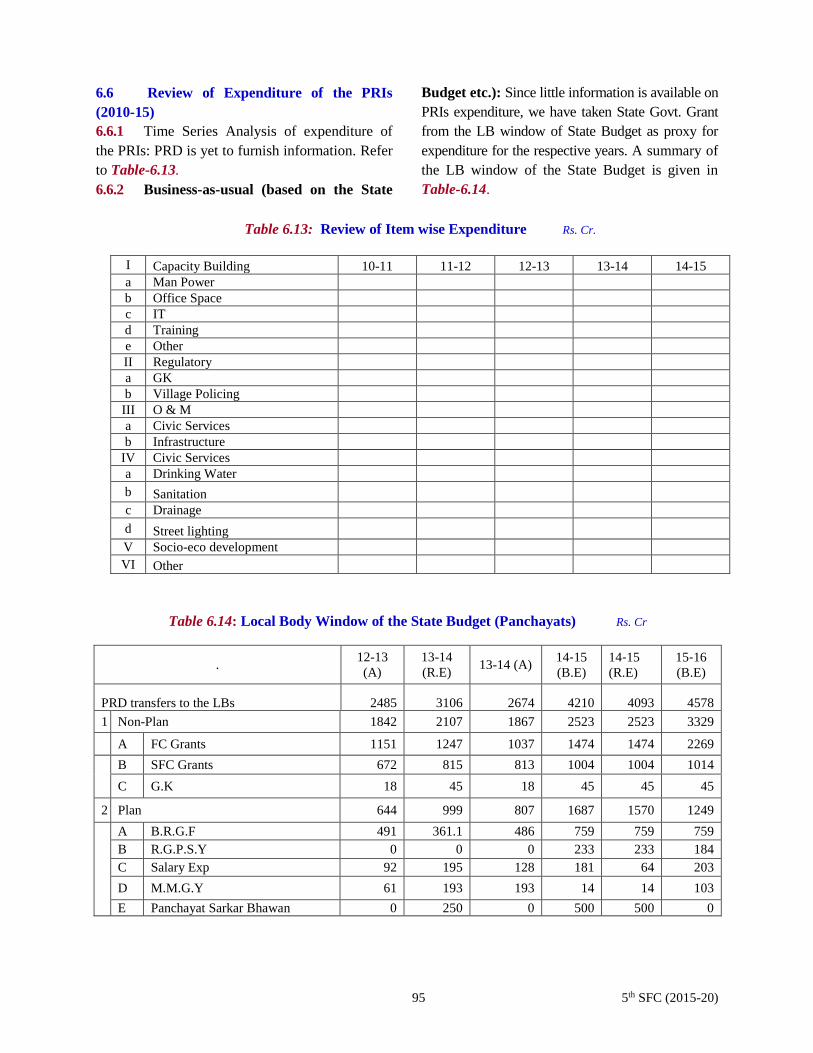
95 5th SFC (2015-20)
Table 6.13: Review of Item wise Expenditure Rs. Cr.
I Capacity Building 10-11 11-12 12-13 13-14 14-15
a Man Power
b Office Space
c IT
d Training
e Other
II Regulatory
a GK
b Village Policing
III O & M
a Civic Services
b Infrastructure
IV Civic Services
a Drinking Water
b Sanitation
c Drainage
d Street lighting
V Socio-eco development
VI Other
Table 6.14: Local Body Window of the State Budget (Panchayats) Rs. Cr
. 12-13
(A)
13-14
(R.E) 13-14 (A)
14‐15
(B.E)
14‐15
(R.E)
15‐16
(B.E)
PRD transfers to the LBs 2485 3106 2674 4210 4093 4578
1 Non-Plan 1842 2107 1867 2523 2523 3329
A FC Grants 1151 1247 1037 1474 1474 2269
B SFC Grants 672 815 813 1004 1004 1014
C G.K 18 45 18 45 45 45
2 Plan 644 999 807 1687 1570 1249
A B.R.G.F 491 361.1 486 759 759 759
B R.G.P.S.Y 0 0 0 233 233 184
C Salary Exp 92 195 128 181 64 203
D M.M.G.Y 61 193 193 14 14 103
E Panchayat Sarkar Bhawan 0 250 0 500 500 0
6.6 Review of Expenditure of the PRIs
(2010-15)
6.6.1 Time Series Analysis of expenditure of
the PRIs: PRD is yet to furnish information. Refer
to Table-6.13.
6.6.2 Business-as-usual (based on the State
Budget etc.): Since little information is available on
PRIs expenditure, we have taken State Govt. Grant
from the LB window of State Budget as proxy for
expenditure for the respective years. A summary of
the LB window of the State Budget is given in
Table-6.14.
Box 6.5

96 5th SFC (2015-20)
Table 6.15 Projections of Expenditure as per budget Rs. Cr.
Sl. Items % increase
p.a. 15-16 16-17 17-18 18-19 19-20 15-20
1 Plan
928 473 524 580 639 3144
a BRGF*
- - - - - -
b RGPSA*
- - - - - -
c MMGY 10 212 234 257 283 311 1296
d Salaries 10 215 240 267 297 329 1348
e PSBs 0 500 500 500 500 500 2500
2 Non Plan
2289 3576 4121 4756 6397 21138
a FC Grants
2269 3554 4097 4729 6368 21018
b GK 10 20 22 24 26 29 121
Total ( 1+2)
3216 4049 4645 5336 7036 26282
Table 6.16: PC-All India Rev. Exp. on core services (2007-08 & 2011-12)
Sl. Items 2007-08 2011-12 CAGR
G.P P.S. Z.P. G.P P.S. Z.P. G.P P.S. Z.P.
PC Revenue Expenditure 59 21 49 123 55 69 20 28 9
1 Roads and Bridges 16 7 14 31 20 22 19 30 12
2 Water Supply 11 2 5 21 4 7 17 17 8
3 Buildings/Community assets 14 3 3 24 10 6 15 34 19
4 Street Lighting 5 0 0 11 0 0 25 0 0
5 Sanitation, Storm Water drainage and
solid waste 7 0 1 16 2 3 25 50 29
6 Other means of communication 1 3 1 3 7 2 43 21 17
7 Other maintenance Expenditure 7 5 25 17 14 29 25 28 4
6.7 Forecast of Expenditure (2015-20):
Item-wise projection of expenditures can be
made based on Box-6.5. But the Commission is
yet to receive required data from PRD.
For assessing expenditure and resource gap,
following alternative projections are made:
6.7.1 Business-as-usual: This Commission has
assessed expenditure for the LB window items
based on State Budget (Table-6.15) excluding that
for BRGF and RGPSA, which have since been
dropped by Central Govt.
6.7.2 Normative (SR14FC): SR14FC has
projected only O & M expenditure on civic
services. For projection of the total expenditure of
the PRIs, this Commission has assessed
expenditure on Capacity building (Manpower,
Training, e-Panchayat, TSSP), Regulatory
functions (GK) etc. also (Refer to Table-6.24 &
6.26).
6.7.2.1 Expenditure on O&M: Computation of
O&M expenditure is based on revenue
expenditure as per SR14 FC as follows:
Step 1: Derived All India tier wise PC Revenue
Expenditure (2007-08 & 2011-12) on basic
services as per SR14FC and computed CAGR to
project PC Revenue Expenditure for subsequent
years (2015-20).
Step 2: Projected All India tier wise PC Revenue
Expenditure for 2015-20 based on computed
CAGR. Refer Table-6.16.
Step 3: Total Revenue Expenditure Projection for
Bihar based on PC All India Revenue Expenditure
(as per Step 2 above) multiplied by population
projections of Bihar (para 6.4.2.1) for respective
years Table-6.17. O & M expenditure would be as
in Table-6.18. Details may be seen at Annexure-6.1

97 5th SFC (2015-20)
Table 6.17: PC-All India Rev. Exp. on core services (2015-20)
Sl. Items 15-16 16-17 17-18 18-19 19-20 15-20
Village Level (GP)
PC Revenue Expenditure 262 318 387 473 578 2912
1 Roads and Bridges 63 75 90 107 127 663
2 Water Supply 39 46 53 62 73 408
3 Buildings/Community assets 42 49 56 65 75 436
4 Street Lighting 28 35 43 54 67 321
5 Sanitation, Storm Water drainage and solid waste 39 49 61 76 95 443
6 Other means of communication 10 15 21 30 43 182
7 Other maintenance Expenditure 40 50 63 78 98 458
Sl. Items Intermediate Level (PS)
PC Revenue Expenditure 203 232 266 307 353 2104
1 Roads and Bridges 85 99 116 136 160 869
2 Water Supply 16 17 18 20 22 160
3 Buildings/Community assets 48 57 69 82 99 509
4 Street Lighting 0 0 0 0 0 0
5 Sanitation, Storm Water drainage and solid waste 5 6 6 7 8 63
6 Other means of communication 8 10 11 12 14 96
7 Other maintenance Expenditure 41 44 46 48 51 408
Sl. Items District Level (ZP)
PC Revenue Expenditure 140 163 190 221 258 516
1 Roads and Bridges 73 86 100 118 138 101
2 Water Supply 16 18 20 22 24 176
3 Buildings/Community assets 26 30 34 39 44 4
4 Street Lighting 0 0 0 0 0 20
5 Sanitation, Storm Water drainage and solid waste 2 2 3 3 4 14
6 Other means of communication 2 2 2 2 2 170
7 Other maintenance Expenditure 22 26 32 38 45 0
Sl. Items Total
PC Revenue Expenditure 605 714 844 1000 1189 5532
1 Roads and Bridges 221 260 306 361 425 1633
2 Water Supply 70 80 91 104 119 744
3 Buildings/Community assets 116 136 159 186 218 949
4 Street Lighting 28 35 43 54 67 341
5 Sanitation, Storm Water drainage and solid waste 46 57 70 87 107 520
6 Other means of communication 20 26 34 44 59 448
7 Other maintenance Expenditure 104 120 140 165 194 865
Table 6.18: Tier wise O & M expenditure as per all India average (2015-20) Rs. Cr.
Sl. Tiers 15-16 16-17 17-18 18-19 19-20 15-20
1 2 3 4 5 6 7
1 G.P 2608 3225 3995 4960 6174 20962
2 P.S 2018 2353 2749 3217 3772 14108
3 Z.P 1397 1655 1960 2323 2753 10087
4 Total 6023 7232 8704 10500 12698 45157
Step 4: Expenditure on Capacity building,
Regulatory functions etc. also included (as
projected in the 5th SFC approach) to compute
total expenditure (Table 6.19).
6.7.3 5th SFC Approach: Optimistic but
realistic approach has been adopted. Since the
Bihar LBs have to catch up in 2019-20 with at
least the All India level of 15-16, this Commission
has made following projections:
6.7.3.1 O&M expenditure: is assessed as in
Table-6.18.

98 5th SFC (2015-20)
Table 6.19: Total expenditure as per SR14FC (2015-20) Rs. Cr.
Sl. Items 15-16 16-17 17-18 18-19 19-20 15-20
1 Capacity Building 285 966 935 1606 1585 5377 2 Regulatory (GK) 344 346 390 351 353 1784
3 O & M 6023 7232 8704 10500 12698 45157
Total ( 1+2+3) 6652 8544 10029 12457 14636 52318
Table 6.20: Tier wise Projected Cost on Manpower Rs. Cr.
Sl. Tier 15-16* 16-17 17-18 18-19 19-20 15-20
1 GP 1280 1280 1280 1280 5120
2 PS 110 110 110 110 440
3 ZP 23 23 23 23 92
4 GK**
5 Total 285 1413 1413 1413 1413 5652
* Amount for 15-16 as per Interim Report, if same would not be spend then utilize as untied fund.
** Honorarium to GK Secretary and Nyay Mitra is to be provided through State Budget as usual and therefore
no projection made for GK personnel.
Table 6.21: Projected Cost on Training for PRIs & GK Functionaries Rs. Cr.
Sl. Items Unit cost 15-16* 16-17 17-18 18-19 19-20 15-20
1 Training Programme 104 104 65 65 338
2 Institution (a+b+c) 122 32 32 32 218
(a) SPRC 5 Cr.X 1 = 1 Cr. 5 2 2 2 11
(b) DPRC 2 Cr.X 38= 38 Cr. 76 20 20 20 136
(c) BRC 0.10 Cr. X 414 = 41 Cr. 41 10 10 10 71
3 Total (1+2) 226 136 97 97 556
* Evidently it is not possible to spend any amount on Training in 15-16, hence Commission not projected for 15-16.
6.7.3.2 Expenditure on Capacity building: This
commission has assessed expenditure on different
items of Capacity building separately as per need
viz. Manpower, Training, e-Panchayat (IT), TSSP.
Details are given below:
(a) Manpower: Projection of manpower for all
three tiers is based on Model Panchayat Cadre
(Table 2.7).
(b) Training: All elected and official Panchayat
functionaries must undergo compulsory training
twice a year. Training cost can be divided into two
parts;
(i) Training Institutions: Total Cost on Training
Institutions for the PRIs is approx. Rs.150 Cr. for the
next four years (2016-20) as follows:
Block Resource Centers (BRCs) are to be
functional in all 534 Blocks. Since BRCs were
started in 120 Blocks earlier, provision has made
only for remaining 414 Blocks @ Rs.10 lakh each =
Rs. 41.40 Cr.
38 District Panchayat Resource Centers
(DPRCs) @ Rs. 2 Cr. each = Rs.76 Cr.
One State Panchayat Resource Center (SPRC) at
State HQ @ Rs. 5 Cr. = Rs. 5 Cr.
(ii) Training Programmes: The next PRI
elections are due in March-June, 2016 and elected
functionaries must get induction training on a
drive basis within 6 months of the elections. Since
total no. of elected representatives of the PRIs
(Table-2.1) would be 2, 59,914 (including GKs),
@ Rs. 4000 per member, training cost would be
Rs. 104 Cr. p.a. in 16-17 & 17-18. @ Rs. 2500 per
member = Rs. 65 Cr. p.a. would be required for
subsequent (2018-20) years. i.e. Total cost for
Training Programme would be Rs. 556 Cr. for
four years.(2016-20).
(iii) Cost details of Training accordingly would
be as in Table 6.21.

99 5th SFC (2015-20)
Table 6.22: Projected Costs of e-Panchayat Project Rs. Cr
No. Items 15-16* 16-17 17-18 18-19 19-20 15-20
1 State ICT** 2 1 1 1 4
2 PRIs ICT** 16 66 69 53 204
3 Manpower (IT) 9 36 38 29 112
4 Capacity Building (IT) 4 7 7 4 21
5 Block Support Group 2 8 9 7 26
6 Program Management Unit 4 4 4 4 16
7 Total 32 118 124 94 367
8 Total -Manpower Cost*** 23 82 86 65 255
* Evidently, it is not possible to spend any amount on e-Panchayat in 15-16.
** PRI (ICT) includes cost of ICT infrastructure at PRIs, whereas; State (ICT) Infrastructure is for State level.
*** Cost of Manpower (IT) has been excluded in the total cost of e-Panchayat, since IT manpower has already
been included in Manpower projection for the PRIs. (Table-6.20) .
Table 6.23: Expenditure on TSSP (2015-20)
Sl. Name of Posts
No. of post
for each
Div.
Total
No. of
post
Unit
Cost
p.m.
Total Cost p.a. (Rs. Cr.)
16-17 17-18 18-19 19-20 16-20
1 2 3 4 5 6 7 8
A. Personnel 1 Group Leader 1 10 100,000 1.20 1.20 1.20 1.20 4.80
2 Panchayat Governence
Professional 1 10
70,000 0.84 0.84 0.84 0.84 3.36
3 Economist 1 10 70,000 0.84 0.84 0.84 0.84 3.36
4 Law Officer (G.K.) 1 10 60,000 0.72 0.72 0.72 0.72 2.88
5 Development Planner 1 10 60,000 0.72 0.72 0.72 0.72 2.88
6 Finance Consultant 1 10 50,000 0.60 0.60 0.60 0.60 2.40
7 Statistical Consultant 1 10 50,000 0.60 0.60 0.60 0.60 2.40
8 PPP Professional 1 10 50,000 0.60 0.60 0.60 0.60 2.40
9 Administrative Officer 1 10 30,000 0.36 0.36 0.36 0.36 1.44
10 Accountant 1 10 25,000 0.30 0.30 0.30 0.30 1.20
11 Assistant 1 10 20,000 0.24 0.24 0.24 0.24 0.96
12 IT Assistant-cum-DEO 4 40 17,000 0.82 0.82 0.82 0.82 3.26
13 MTS1 2 20 11,000 0.26 0.26 0.26 0.26 1.06
14 IEC
1.00 1.00 1.00 1.00 4.00
15 Office Space &
Infrastructure*
# 0.66 0.66 0.66 0.66 2.64
16 Total:
9.76 9.76 9.76 9.76 39.04
Note: 1. Multi-Tasking Staff (Sweeper-cum-Peon-cum-Chaukidar) * Research and Consultancy fund would be
managed by PRD for promoting quality of planning through DPCs. ** Rent, furniture, computer with internet
connectivity, electricity and miscellaneous item.
(c) e-Panchayat: Cost details are given in Table-
6.22.
(d) Technical Support for Smart Panchayat
(TSSP):
(i) It is proposed to provide SPUR (Support
Programme for Urban Reforms) type support also
to the PRIs and the DPCs. Five key outputs
expected from TSSP are as in Box 6.6.
(ii) The cost projection for TSSP may be seen in
the Table 6.23
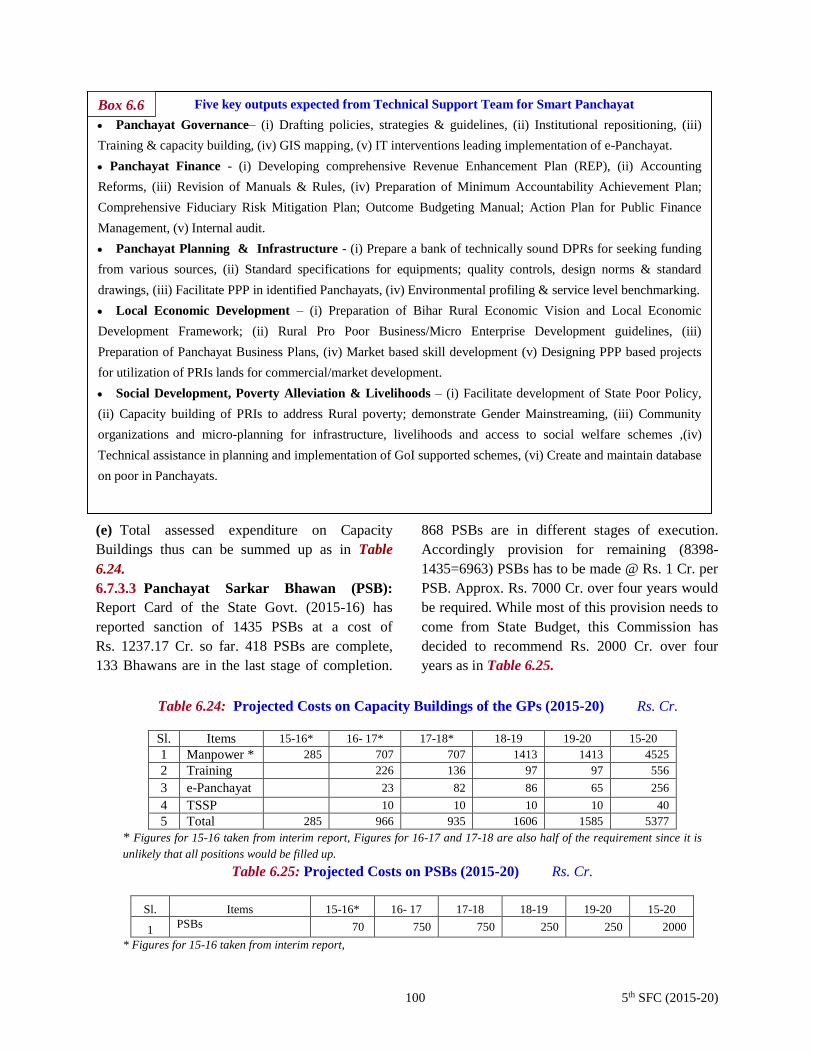
100 5th SFC (2015-20)
Five key outputs expected from Technical Support Team for Smart Panchayat
Panchayat Governance– (i) Drafting policies, strategies & guidelines, (ii) Institutional repositioning, (iii)
Training & capacity building, (iv) GIS mapping, (v) IT interventions leading implementation of e-Panchayat.
Panchayat Finance - (i) Developing comprehensive Revenue Enhancement Plan (REP), (ii) Accounting
Reforms, (iii) Revision of Manuals & Rules, (iv) Preparation of Minimum Accountability Achievement Plan;
Comprehensive Fiduciary Risk Mitigation Plan; Outcome Budgeting Manual; Action Plan for Public Finance
Management, (v) Internal audit.
Panchayat Planning & Infrastructure - (i) Prepare a bank of technically sound DPRs for seeking funding
from various sources, (ii) Standard specifications for equipments; quality controls, design norms & standard
drawings, (iii) Facilitate PPP in identified Panchayats, (iv) Environmental profiling & service level benchmarking.
Local Economic Development – (i) Preparation of Bihar Rural Economic Vision and Local Economic
Development Framework; (ii) Rural Pro Poor Business/Micro Enterprise Development guidelines, (iii)
Preparation of Panchayat Business Plans, (iv) Market based skill development (v) Designing PPP based projects
for utilization of PRIs lands for commercial/market development.
Social Development, Poverty Alleviation & Livelihoods – (i) Facilitate development of State Poor Policy,
(ii) Capacity building of PRIs to address Rural poverty; demonstrate Gender Mainstreaming, (iii) Community
organizations and micro-planning for infrastructure, livelihoods and access to social welfare schemes ,(iv)
Technical assistance in planning and implementation of GoI supported schemes, (vi) Create and maintain database
on poor in Panchayats.
Table 6.24: Projected Costs on Capacity Buildings of the GPs (2015-20) Rs. Cr.
Sl. Items 15-16* 16- 17* 17-18* 18-19 19-20 15-20
1 Manpower * 285 707 707 1413 1413 4525
2 Training 226 136 97 97 556
3 e-Panchayat 23 82 86 65 256
4 TSSP 10 10 10 10 40
5 Total 285 966 935 1606 1585 5377
* Figures for 15-16 taken from interim report, Figures for 16-17 and 17-18 are also half of the requirement since it is
unlikely that all positions would be filled up.
Table 6.25: Projected Costs on PSBs (2015-20) Rs. Cr.
Sl. Items 15-16* 16- 17 17-18 18-19 19-20 15-20
1 PSBs 70 750 750 250 250 2000
* Figures for 15-16 taken from interim report,
(e) Total assessed expenditure on Capacity
Buildings thus can be summed up as in Table
6.24.
6.7.3.3 Panchayat Sarkar Bhawan (PSB):
Report Card of the State Govt. (2015-16) has
reported sanction of 1435 PSBs at a cost of
Rs. 1237.17 Cr. so far. 418 PSBs are complete,
133 Bhawans are in the last stage of completion.
868 PSBs are in different stages of execution.
Accordingly provision for remaining (8398-
1435=6963) PSBs has to be made @ Rs. 1 Cr. per
PSB. Approx. Rs. 7000 Cr. over four years would
be required. While most of this provision needs to
come from State Budget, this Commission has
decided to recommend Rs. 2000 Cr. over four
years as in Table 6.25.
Box 6.6

101 5th SFC (2015-20)
Table 6.26: Expenditure on functioning of Gram Katchahry Rs. Cr.
Sl. Items Rate 15-16 16-17 17-18 18-19 19-20 15-20
1 Office support (Rent,
Stationary, IT, etc.)* Rs 50,000 x per GK p.a. 42 44 46 49 51 232
2 Furniture Rs 50,000 per GK one time 42 42
3 Award for Dispute
free village**
Rs 3 lakh p.a. for Sarpanch
& Panches for 300 GK 10 10 10 10 40
4 Award for Cases
filed & disposed * *
Rs 3 lakh p.a. for Sarpanch
& Panches for 300 GK 10 10 10 10 10 50
a. Honorarium to
Secretary Rs 10,000 x per GK pm 101 101 101 101 101 505
b. Nyay Mitra Rs 10,000 x per GK pm 101 101 101 101 101 505
c. Executive Assistant Rs 9,000x per GK pm 91 91 91 91 91 455
5 Total 345 357 401 362 364 1829
Note: (i) * 5% increase p.a. (ii) ** No. of GKs in a district for award for Cases filed & disposed and dispute
free village respectively would be in proportion to total GKs in the District.(iii) Honorarium to Secretary, Nyay
Mitra and Executive Assistant is to be provided through State Budget as usual.
Table 6.27: Cost of Strengthening the DPCs Rs. Cr.
Sl. Name of Posts Post per
DPC
Total
post Unit Cost
p.m.
Total Cost p.a. (Rs. Cr.)
16-17 17-18 18-19 19-20 16-20
1 2 3 4 5.00 6.00 7.00 8.00 9.00
1 Team Leader 1 38 100,000 4.56 4.56 4.56 4.56 18.24
2 Developmental Planner 1 38 70,000 3.19 3.19 3.19 3.19 12.77
3 Economist 1 38 70,000 3.19 3.19 3.19 3.19 12.77
4 PPP Consultant 1 38 50,000 2.28 2.28 2.28 2.28 9.12
5 GIS Consultant 1 38 50,000 2.28 2.28 2.28 2.28 9.12
6 Database Manager 1 38 50,000 2.28 2.28 2.28 2.28 9.12
7 Statistical Consultant 1 38 50,000 2.28 2.28 2.28 2.28 9.12
8 Administrative Officer 1 38 30,000 1.37 1.37 1.37 1.37 5.47
9 Accountant 1 38 25,000 1.14 1.14 1.14 1.14 4.56
10 Assistant 1 38 22,000 1.00 1.00 1.00 1.00 4.00
11 IT Assistant-cum-DEO 4 152 17,000 3.10 3.10 3.10 3.10 12.40
12 MTS1 2 76 11,000 1.00 1.00 1.00 1.00 4.01
13 Research &
Consultancy* 2.00 2.00 2.00 2.00 8.00
14 Office Space &
Infrastructure** 200000 0.76 0.76 0.76 0.76 3.04
15 Total 30.44 30.44 30.44 30.44 121.75
6.7.3.4 Expenditure on the Gram Katchahry:
Expenditure for proper functioning of the GK are
assessed as in Table-6.26.
6.7.3.5 Gram Raksha Dal: Expenditure not
assessed as requisite information is not available.
6.7.3.6 Expenditure on new Civic services: The
14th FC has provided Rs. 21,018 Cr. for the GPs in
Bihar for civic services. Besides, various Central
and State schemes take care of civic services
expenditure. We have, therefore, not considered
expenditure requirement on new Civic Services in
our assessment.
6.7.3.7 District Planning Committee (DPC):
Following expenditure (Table-6.27) is assessed
for strengthening of the DPCs.

102 5th SFC (2015-20)
Table 6.28: Projection of Total Expenditure as per the 5th SFC for 15-20 Rs. Cr.
Sl. Item Ref. Table
No. 15-16* 16-17 17-18 18-19 19-20 15-20
1 O & M 6.18 6023 7232 8704 10500 12698 45157
2 Capacity Building 6.24 285 966 935 1606 1585 5377 3 PSBs 6.25 750 750 250 250 2000
4 GK 6.26 344 346 390 351 353 1784
5 DPC 6.27 30 30 30 30 122
Total (1+2+3+4+5) 6652 9324 10809 12737 14916 54440
Table 6.29: Resource Gap of the PRIs in different scenarios (2015-20) Rs. Cr.
Sl. Year
1 2 3
Business as usual Normative 5th SFC
Rev. Exp. Res. Gap Rev. Exp. Res. Gap Rev. Exp. Res. Gap
1 2 3 4 5 6 7 8 9 10
1 15-16 295 3216 2921 279 6652 6373 360 6652 6292
2 16-17 325 4049 3724 313 8544 8231 397 9324 8927
3 17-18 358 4645 4287 350 10029 9679 439 10809 10370
4 18-19 393 5336 4943 392 12457 12065 483 12737 12254
5 19-20 432 7036 6604 438 14636 14198 534 14916 14382
6 15-20 1803 26282 24479 1771 52318 50547 2123 54440 52317
Note : (i)**14th FC transfer are earmarked for providing civic services, therefore expenditure on civic services not
considered for computing resource gap. (ii) Resource gap=Expenditure-Revenue.(iii) Reference Tables: (1)
Bussiness as usual: 6.6 for Revenue & 6.15 for Expenditure (2) Normative: 6.11 for Revenue & 6.19 for
Expenditure (3) 5th SFC: 6.12 for Revenue & 6.28 for Expenditure.
6.7.3.8 Total Expenditure: Total assessed
expenditure needs of the PRIs can be summed up
as in Table 6.28.
6.8 Computation of the Resource Gap:
Methodology for computing resource gap item-
wise is given in Annexure 6.2. However, due to
the unavailability of relevant data, it can’t be used.
Moreover, PRD has not furnished its own
assessment of the gap.
6.8.1 Resource gap based on different
approaches: Resource gap has been computed
for different scenarios given in Table 6.29.
Business-as-usual (Row 6, Col. 4) would be the
least desirable option, being too low. Attaining all
India level/Normative (Row 6, Col. 7) and the 5th
SFC approach (Row 6, Col. 10) are close to each
other and realistic and could be accepted. The
remaining resource gap must be bridged by
adopting innovative approaches as given in para
6.9.
6.9 Bridging the Resource Gap remaining
even after UFC/SFC transfers: (Details in
Annexure 6.3)
6.9.1 Own Additional Resources (Tax and
Non- Tax): The PRIs must make all efforts to
raise their own revenues (tax & non-tax).
Incidentally PRIs have to increase their own
revenues as an imperative to fulfill Performance
Grant (Rs. 2108 Cr.) conditionality of the 14th FC.
Moreover, this would enhance their autonomy and
accountability. Details of option available to the
PRIs for rising own resources may be seen in
Chapter X. Incidentally this Commission has
recommended incentives for ARM and also for
overall performance for five years. (Refer to para
9.6.4)
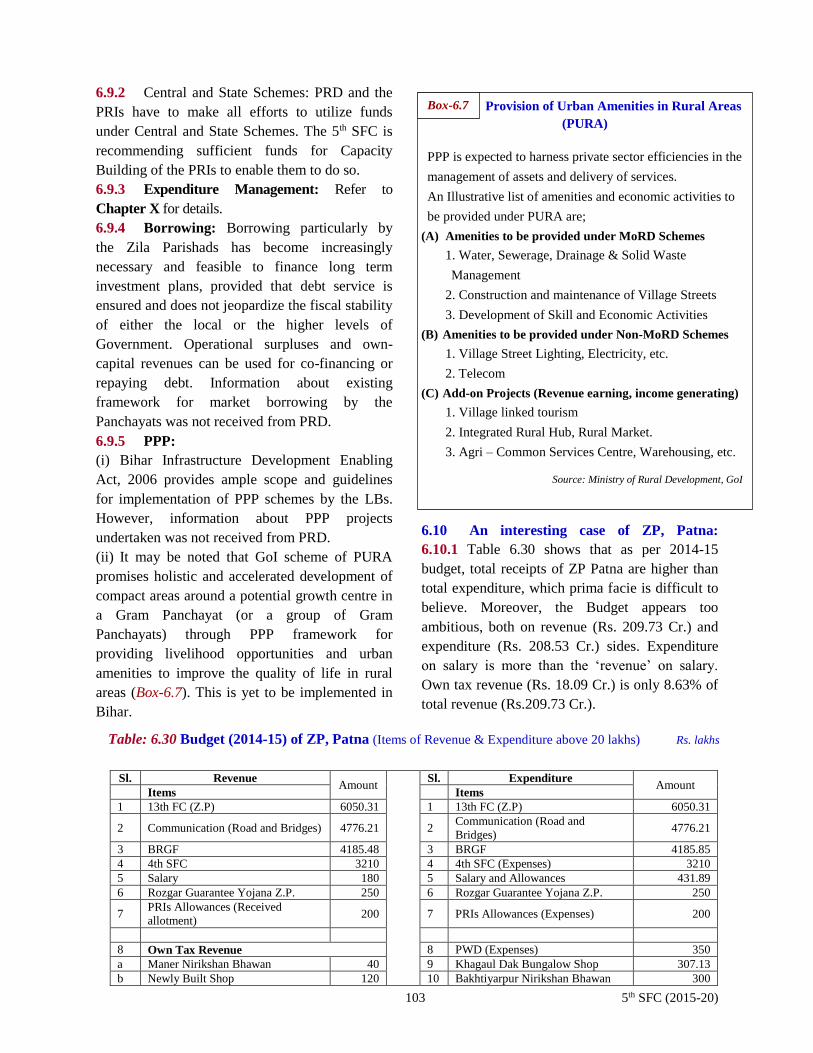
103 5th SFC (2015-20)
Provision of Urban Amenities in Rural Areas
(PURA)
PPP is expected to harness private sector efficiencies in the
management of assets and delivery of services.
An Illustrative list of amenities and economic activities to
be provided under PURA are;
(A) Amenities to be provided under MoRD Schemes
1. Water, Sewerage, Drainage & Solid Waste
Management
2. Construction and maintenance of Village Streets
3. Development of Skill and Economic Activities
(B) Amenities to be provided under Non-MoRD Schemes
1. Village Street Lighting, Electricity, etc.
2. Telecom
(C) Add-on Projects (Revenue earning, income generating)
1. Village linked tourism
2. Integrated Rural Hub, Rural Market.
3. Agri – Common Services Centre, Warehousing, etc.
Source: Ministry of Rural Development, GoI
6.9.2 Central and State Schemes: PRD and the
PRIs have to make all efforts to utilize funds
under Central and State Schemes. The 5th SFC is
recommending sufficient funds for Capacity
Building of the PRIs to enable them to do so.
6.9.3 Expenditure Management: Refer to
Chapter X for details.
6.9.4 Borrowing: Borrowing particularly by
the Zila Parishads has become increasingly
necessary and feasible to finance long term
investment plans, provided that debt service is
ensured and does not jeopardize the fiscal stability
of either the local or the higher levels of
Government. Operational surpluses and own-
capital revenues can be used for co-financing or
repaying debt. Information about existing
framework for market borrowing by the
Panchayats was not received from PRD.
6.9.5 PPP:
(i) Bihar Infrastructure Development Enabling
Act, 2006 provides ample scope and guidelines
for implementation of PPP schemes by the LBs.
However, information about PPP projects
undertaken was not received from PRD.
(ii) It may be noted that GoI scheme of PURA
promises holistic and accelerated development of
compact areas around a potential growth centre in
a Gram Panchayat (or a group of Gram
Panchayats) through PPP framework for
providing livelihood opportunities and urban
amenities to improve the quality of life in rural
areas (Box-6.7). This is yet to be implemented in
Bihar.
6.10 An interesting case of ZP, Patna:
6.10.1 Table 6.30 shows that as per 2014-15
budget, total receipts of ZP Patna are higher than
total expenditure, which prima facie is difficult to
believe. Moreover, the Budget appears too
ambitious, both on revenue (Rs. 209.73 Cr.) and
expenditure (Rs. 208.53 Cr.) sides. Expenditure
on salary is more than the ‘revenue’ on salary.
Own tax revenue (Rs. 18.09 Cr.) is only 8.63% of
total revenue (Rs.209.73 Cr.).
Box-6.7
Table: 6.30 Budget (2014-15) of ZP, Patna (Items of Revenue & Expenditure above 20 lakhs) Rs. lakhs
Sl. Revenue Amount
Sl. Expenditure Amount
Items Items
1 13th FC (Z.P) 6050.31 1 13th FC (Z.P) 6050.31
2 Communication (Road and Bridges) 4776.21 2 Communication (Road and
Bridges) 4776.21
3 BRGF 4185.48 3 BRGF 4185.85
4 4th SFC 3210 4 4th SFC (Expenses) 3210
5 Salary 180 5 Salary and Allowances 431.89
6 Rozgar Guarantee Yojana Z.P. 250 6 Rozgar Guarantee Yojana Z.P. 250
7 PRIs Allowances (Received
allotment) 200 7 PRIs Allowances (Expenses) 200
8 Own Tax Revenue 8 PWD (Expenses) 350
a Maner Nirikshan Bhawan 40 9 Khagaul Dak Bungalow Shop 307.13
b Newly Built Shop 120 10 Bakhtiyarpur Nirikshan Bhawan 300

104 5th SFC (2015-20)
Sl. Revenue Amount
Sl. Expenditure Amount
Items Items
c Paliganj Land Viduth Dept 30 11 Boundary wall Mokama Dak
Bungalow 150
d Loknayak Bhawan (26 Shops) 280 12 Masaurhi Dak Bungalow Shop 100
e Sanlagna Bhawan Bandobasti 450 13 Bus stand Development
(According to Attachment) 90
f Rent Office Space Loknayak
Bhawan 130 14 Central Land Water Dept 50
g Land Acquisition Office 15 Housing Development (Provision) 50
(i) Zila Parishad Land (Acquisition By
Govt.) 600 16 20 Medical store Maintenance 50
(ii) Road and Bridge Maintenance 36 17 Z.P Fax expense 0.5
(iii) Buildings Renovation 80.3 18 Registartion Fee Loknayak
(Refund) 46
h Others 42.6 19 Z.P Aesthetic maintenance 26.4
i Total Own Tax (a to h) 1808.9 20 Local Development Press 25.7
9 Interest income (1065.92 lakhs FD) 103.22 21 Marriage (Advance) 20
10 Road & Bridge Resources# 85 22 BRGF (Capacity Development) 50
11 BRGF (Capacity Development) 50 23 Road Maintenance 20
12 Road Cess 35 24 Bhita N. Bhawan Maintenance 20
13 Dak Bungalow (Non-Plan) 20 25 Others# 93.14
14 Others# 19
15 Total Revenue 20973.12 26 Total Expenditure 20853.13
Note: - # Road & Bridge Resources is taken 85 lacs instead of 15 lacs as per rectification in Z.P. Patna (2014-15) Revenue-Expenditure report
# Z.P Fax expense is taken as 0.50 lacs instead of 50 lacs # Others (Expenditure) 93.14 (d) Disbursement Expenes 10.00
# Others (Revenue) 19.00 (a) Motorcycle (Provision) 16.00 (e) Land and forest (Dak Bunglow) 10.00
(a) Asambandh Anudan 15.00 (b) Others Allowances 10.49 (f) Z.P Fax expense 00.50
(b) Others 04.00 (c) Living Allowances 10.00 (g) Others 36.15
6.10.2 Regular training of the key functionaries
in Budget preparation is, therefore, urgently
needed.

131 5th SFC (2015-20)
Chapter-IX
Recommendations on Devolution and Grant
9.1 Introduction:
9.1.1 It must be reiterated that for the LBs to
function as ‘self-governments’ as envisaged in the
Constitution and as “Panchayat Sarkars” as
envisioned by State Govt., they must be
empowered, enabled and made accountable. Good
governance, maximization of own revenue, sound
planning, budgeting and expenditure management
particularly in the ULBs are preconditions to
enabling the cities and towns to provide
opportunities to the people arising from
urbanization. Similarly, if the villages are to be
made more livable and productive and the
Panchayats and Gram Katchahries are to contribute
to the ‘सात-निश्चय’ of State Govt., they have to be
managed professionally.
9.1.2 Further, though funds available to the LBs
(both the PRIs and the ULBs) from various sources
are grossly inadequate for their assigned functions,
they are unable to utilize even that. Such
unsatisfactory situation is primarily due to the
capacity constraints e.g. deficiencies in skilled man-
power, office space, IT facility etc. (Para 2.4 &
Para 3.4.2) and non-implementation of much
needed ‘reforms’ (Chapter-X). Full capacity
building and ‘reforms’ in the LBs is, therefore,
at the core of our recommendations. Performance
grant conditions of the 14th FC of audited accounts
and increase in own revenue, make it all the more
urgent and unavoidable.
9.2 Consolidated Fund of the State (CFS): Grants
for the LBs would come out of the CFS (Refer Box
5.1). Projections of CFS for 2015-16 to 2019-20 are
given in Table 9.1 (Details in Para 5.4).
Incidentally, the projected CFS for 15-16 is Rs.
1,25,079 Cr. as compared to 15-16 B.E figure of
Rs. 1, 21,064 Cr (Para 5.4.5). This increase is
primarily due to the enhanced capital receipts on
account of the higher FD limits recommended by
the 14th FC for Bihar.
9.3 Divisible Pool of taxes etc.: The divisible pool
is computed by deducting cost of collection and
appropriated taxes (entertainment tax in the case of
Bihar) from SOTR as given in the State Budget.
Adjustments are to be made in the divisible pool in
the case of deficiency or excess in the Actuals.
Table 9.2 gives projection of the divisible pool from
15-16 to 19-20. Detailed Projections of each item
have been made in Chapter-V (Para 5.4.1.3).
Table 9.1: Projection of CFS for 15-16 to 19-20
Table 9.2: Projected divisible pool for 15-16 to 19-20
*The divisible pool as per 15-16 B.E figure is Rs. 29,862 Cr., as compared to Rs. 29,110 Cr. projected by the 5th SFC due to the
enhanced FD limit by the 14th FC for Bihar (See Para 5.7.2).
15-16 16-17 17-18 18-19 19-20
78841 110488 121064 125079 159496 193107 229971 274266
A. SOTR (Table 5.5) 19961 25663 30875 30141 37119 45781 56548 69954
B. SONTR (Table 5.7) 1545 3097 3396 2079 2412 2797 3245 3764
C. Share in Central taxes (Table 5.8) 34829 38082 50896 50896 64974 75083 86871 100626
D. Central Grants (Table 5.11) 12584 28903 18171 18171 21959 27778 33889 41345
E. Capital Receipts (Table 5.14) 9922 14743 17725 23791 33032 41668 49418 58576
ItemsProjections ( In Crores)
Consolidated fund of State (A to E)
13-14
(A)
14-15
(R.E)
15-16
(B.E)
15-16
B.E 15-16 16-17 17-18 18-19 19-20 Total
1 30875 30141 37119 45781 56548 69954 239544
2 33 64 78 94 114 138 489
3 30842 30077 37042 45686 56434 69816 239055
4 980 967 1161 1393 1671 2006 7198
5 29862 29110 35881 44294 54762 67811 231857
CoC: Cost of collection of taxes and duties
CoC
Divisible Pool (3-4)*
Sl.No. ItemsProjections ( In Crores)
SOTR
Entertainment tax & Sairats
Taxes excluding Ent. Tax & Sairats (1-2)

132 5th SFC (2015-20)
9.4 Resource gap of the LBs:
9.4.1 Rigorous resource gap (RG) analysis for the
LBs is not possible since required data (Annex
6.3 & Annex 7.7) are not available. However,
based on certain assumptions, the same has been
projected for the PRIs (Para 6.8) and the ULBs
(Para 7.8) for the period 2015-16 to 2019-20. A
summary is given in Table 9.3.
9.4.2 The Projected Resource Gap for the PRIs is
relatively low as their resources include Civic
Services grant recommended for the Bihar GPs
by the 14th FC totaling Rs. 21,018 Cr. Similarly,
the projected resource gap for the ULBs is
relatively low as they are expected to raise far
more own revenue and also leverage PPP and
Borrowing in a big way.
9.5 Devolution:
9.5.1 Table-5.25 (Para 5.7.2) gives scenarios of
varying devolution from 7.5% to 12% for 2015-16
to 2019-20 period as reproduced in Table 9.4.
9.5.2 Devolution for 15-16 to 19-20: Based on the
scenarios of varying % of devolution (Table 9.4),
devolution of 8.5% in 2015-16 and 9% in 2016-17
to 2019-20 of the divisible pool is recommended as
given in Table 9.5 (Details in Para 8.9.6). In case
the Actuals of SOTR is less than the projections,
the devolution would evidently be based on the
Actuals.
9.5.3 Inter LBs Share: The devolved funds would
be shared among the PRIs and the ULBs in the ratio
of 70:30 for the year 2015-16 and 60:40 for the
subsequent years as given in the Table 9.6
(justification given in Para 8.10).
Table 9.3: Resource Gap of the LBs for 15-16 to 19-20
Table 9.4: Scenarios of varying devolution to the LBs
Note: - Amount rounded off to the nearest multiple of 5.
Rev. Exp. RG Rev. Exp. RG Rev. Exp. RG
PRI 295 3216 2921 279 6652 6373 360 6652 6292
ULB 1054 2011 957 948 9117 8169 834 7427 6593
PRI 325 4049 3724 313 8544 8231 397 9324 8927
ULB 1424 2312 888 1278 10793 9515 1457 7878 6421
PRI 358 4645 4287 350 10029 9679 439 10809 10370
ULB 1696 2659 963 1498 12785 11287 1760 8411 6651
PRI 393 5336 4943 392 12457 12065 483 12737 12254
ULB 2021 3058 1037 1756 15155 13399 2125 8947 6822
PRI 432 7036 6604 438 14636 14198 534 14916 14382
ULB 2527 3517 990 2177 17976 15799 2697 9525 6828
PRI 1803 26282 24479 1771 52318 50547 2123 54438 52315
ULB 8721 13557 4836 7656 65826 58170 8872 42188 33316
Business-as-usual Normative (SR14FC) 5th SFC assessment
2015-16
2016-17
2017-18
2018-19
2019-20
Total
(2015-20)
Sl. No.
15-16*
B.E 15-16 16-17 17-18 18-19 19-20 Total
1 29862 29110 35881 44294 54762 67811 231857
7.5% 2240 2185 2690 3320 4105 5085 17385
8.0% 2390 2330 2870 3545 4380 5425 18550
8.5% 2540 2475 3050 3765 4655 5765 19710
9.0% 2690 2620 3230 3985 4930 6105 20870
9.5% 2835 2765 3410 4210 5200 6440 22025
10.0% 2925 2910 3590 4430 5475 6780 23185
10.5% 3135 3055 3765 4650 5750 7120 24340
11.0% 3285 3200 3950 4870 6025 7460 25505
11.5% 3435 3350 4125 5095 6300 7800 26670
12.0% 3585 3495 4305 5315 6570 8135 27820
Divisible Pool
Devolution2
Projections ( In Crores)Items
Sl.
No
.
*15-16 B.E data are based on Bihar Budget documents
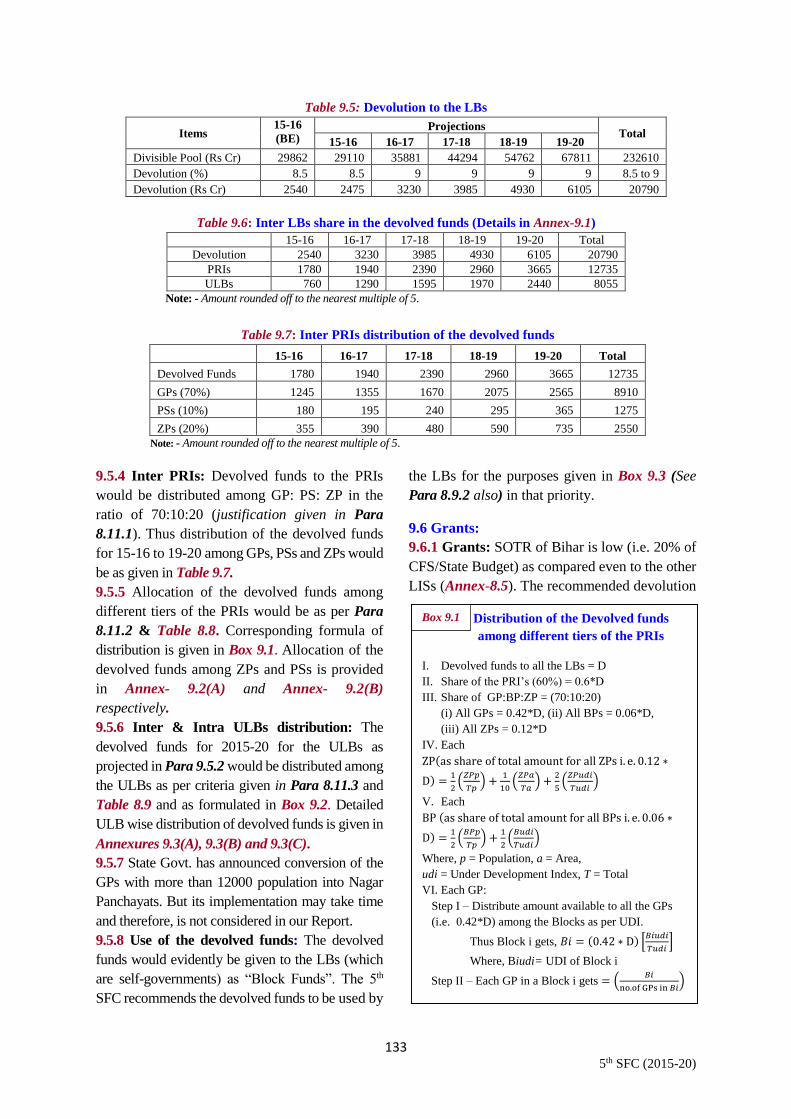
133 5th SFC (2015-20)
9.5.4 Inter PRIs: Devolved funds to the PRIs
would be distributed among GP: PS: ZP in the
ratio of 70:10:20 (justification given in Para
8.11.1). Thus distribution of the devolved funds
for 15-16 to 19-20 among GPs, PSs and ZPs would
be as given in Table 9.7.
9.5.5 Allocation of the devolved funds among
different tiers of the PRIs would be as per Para
8.11.2 & Table 8.8. Corresponding formula of
distribution is given in Box 9.1. Allocation of the
devolved funds among ZPs and PSs is provided
in Annex- 9.2(A) and Annex- 9.2(B)
respectively.
9.5.6 Inter & Intra ULBs distribution: The
devolved funds for 2015-20 for the ULBs as
projected in Para 9.5.2 would be distributed among
the ULBs as per criteria given in Para 8.11.3 and
Table 8.9 and as formulated in Box 9.2. Detailed
ULB wise distribution of devolved funds is given in
Annexures 9.3(A), 9.3(B) and 9.3(C).
9.5.7 State Govt. has announced conversion of the
GPs with more than 12000 population into Nagar
Panchayats. But its implementation may take time
and therefore, is not considered in our Report.
9.5.8 Use of the devolved funds: The devolved
funds would evidently be given to the LBs (which
are self-governments) as “Block Funds”. The 5th
SFC recommends the devolved funds to be used by
the LBs for the purposes given in Box 9.3 (See
Para 8.9.2 also) in that priority.
9.6 Grants:
9.6.1 Grants: SOTR of Bihar is low (i.e. 20% of
CFS/State Budget) as compared even to the other
LISs (Annex-8.5). The recommended devolution
Distribution of the Devolved funds
among different tiers of the PRIs
I. Devolved funds to all the LBs = D
II. Share of the PRI’s (60%) = 0.6*D
III. Share of GP:BP:ZP = (70:10:20)
(i) All GPs = 0.42*D, (ii) All BPs = 0.06*D,
(iii) All ZPs = 0.12*D
IV. Each
ZP(as share of total amount for all ZPs i. e. 0.12 ∗
D) =1
2(
𝑍𝑃𝑝
𝑇𝑝) +
1
10(
𝑍𝑃𝑎
𝑇𝑎) +
2
5(
𝑍𝑃𝑢𝑑𝑖
𝑇𝑢𝑑𝑖)
V. Each
BP (as share of total amount for all BPs i. e. 0.06 ∗
D) =1
2(
𝐵𝑃𝑝
𝑇𝑝) +
1
2(
𝐵𝑢𝑑𝑖
𝑇𝑢𝑑𝑖)
Where, p = Population, a = Area,
udi = Under Development Index, T = Total
VI. Each GP:
Step I – Distribute amount available to all the GPs
(i.e. 0.42*D) among the Blocks as per UDI.
Thus Block i gets, 𝐵𝑖 = (0.42 ∗ D) [𝐵𝑖𝑢𝑑𝑖
𝑇𝑢𝑑𝑖]
Where, Biudi= UDI of Block i
Step II – Each GP in a Block i gets = (𝐵𝑖
no.of GPs in 𝐵𝑖)
Table 9.5: Devolution to the LBs
Items 15-16
(BE) Projections
Total 15-16 16-17 17-18 18-19 19-20
Divisible Pool (Rs Cr) 29862 29110 35881 44294 54762 67811 232610
Devolution (%) 8.5 8.5 9 9 9 9 8.5 to 9
Devolution (Rs Cr) 2540 2475 3230 3985 4930 6105 20790
Table 9.6: Inter LBs share in the devolved funds (Details in Annex-9.1)
15-16 16-17 17-18 18-19 19-20 Total
Devolution 2540 3230 3985 4930 6105 20790
PRIs 1780 1940 2390 2960 3665 12735
ULBs 760 1290 1595 1970 2440 8055
Note: - Amount rounded off to the nearest multiple of 5.
Table 9.7: Inter PRIs distribution of the devolved funds
15-16 16-17 17-18 18-19 19-20 Total
Devolved Funds 1780 1940 2390 2960 3665 12735
GPs (70%) 1245 1355 1670 2075 2565 8910
PSs (10%) 180 195 240 295 365 1275
ZPs (20%) 355 390 480 590 735 2550
Note: - Amount rounded off to the nearest multiple of 5.
Box 9.1
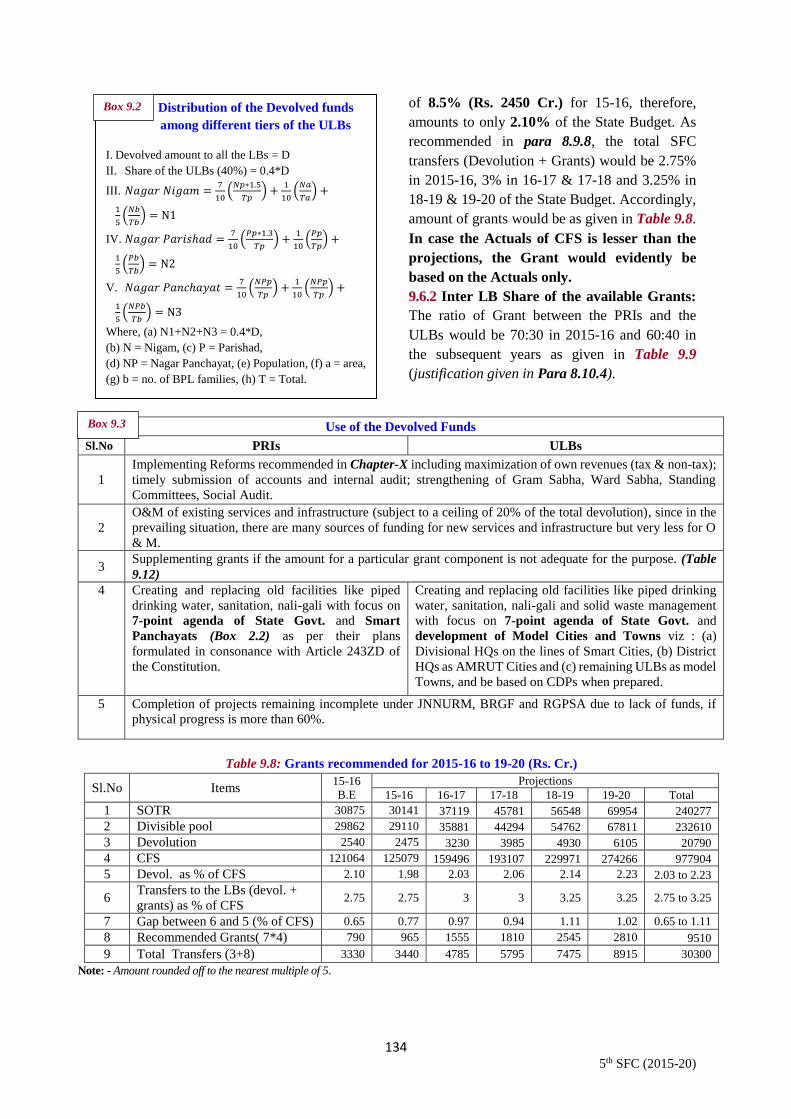
134 5th SFC (2015-20)
of 8.5% (Rs. 2450 Cr.) for 15-16, therefore,
amounts to only 2.10% of the State Budget. As
recommended in para 8.9.8, the total SFC
transfers (Devolution + Grants) would be 2.75%
in 2015-16, 3% in 16-17 & 17-18 and 3.25% in
18-19 & 19-20 of the State Budget. Accordingly,
amount of grants would be as given in Table 9.8.
In case the Actuals of CFS is lesser than the
projections, the Grant would evidently be
based on the Actuals only.
9.6.2 Inter LB Share of the available Grants:
The ratio of Grant between the PRIs and the
ULBs would be 70:30 in 2015-16 and 60:40 in
the subsequent years as given in Table 9.9
(justification given in Para 8.10.4).
Distribution of the Devolved funds
among different tiers of the ULBs
I. Devolved amount to all the LBs = D
II. Share of the ULBs (40%) = 0.4*D
III. 𝑁𝑎𝑔𝑎𝑟 𝑁𝑖𝑔𝑎𝑚 =7
10(
𝑁𝑝∗1.5
𝑇𝑝) +
1
10(
𝑁𝑎
𝑇𝑎) +
1
5(
𝑁𝑏
𝑇𝑏) = N1
IV. 𝑁𝑎𝑔𝑎𝑟 𝑃𝑎𝑟𝑖𝑠ℎ𝑎𝑑 =7
10(
𝑃𝑝∗1.3
𝑇𝑝) +
1
10(
𝑃𝑝
𝑇𝑝) +
1
5(
𝑃𝑏
𝑇𝑏) = N2
V. 𝑁𝑎𝑔𝑎𝑟 𝑃𝑎𝑛𝑐ℎ𝑎𝑦𝑎𝑡 =7
10(
𝑁𝑃𝑝
𝑇𝑝) +
1
10(
𝑁𝑃𝑝
𝑇𝑝) +
1
5(
𝑁𝑃𝑏
𝑇𝑏) = N3
Where, (a) N1+N2+N3 = 0.4*D,
(b) N = Nigam, (c) P = Parishad,
(d) NP = Nagar Panchayat, (e) Population, (f) a = area,
(g) b = no. of BPL families, (h) T = Total.
Use of the Devolved Funds
Sl.No PRIs ULBs
1
Implementing Reforms recommended in Chapter-X including maximization of own revenues (tax & non-tax);
timely submission of accounts and internal audit; strengthening of Gram Sabha, Ward Sabha, Standing
Committees, Social Audit.
2
O&M of existing services and infrastructure (subject to a ceiling of 20% of the total devolution), since in the
prevailing situation, there are many sources of funding for new services and infrastructure but very less for O
& M.
3 Supplementing grants if the amount for a particular grant component is not adequate for the purpose. (Table
9.12)
4 Creating and replacing old facilities like piped
drinking water, sanitation, nali-gali with focus on
7-point agenda of State Govt. and Smart
Panchayats (Box 2.2) as per their plans
formulated in consonance with Article 243ZD of
the Constitution.
Creating and replacing old facilities like piped drinking
water, sanitation, nali-gali and solid waste management
with focus on 7-point agenda of State Govt. and
development of Model Cities and Towns viz : (a)
Divisional HQs on the lines of Smart Cities, (b) District
HQs as AMRUT Cities and (c) remaining ULBs as model
Towns, and be based on CDPs when prepared.
5 Completion of projects remaining incomplete under JNNURM, BRGF and RGPSA due to lack of funds, if
physical progress is more than 60%.
Table 9.8: Grants recommended for 2015-16 to 19-20 (Rs. Cr.)
Sl.No Items 15-16
B.E
Projections
15-16 16-17 17-18 18-19 19-20 Total
1 SOTR 30875 30141 37119 45781 56548 69954 240277
2 Divisible pool 29862 29110 35881 44294 54762 67811 232610
3 Devolution 2540 2475 3230 3985 4930 6105 20790
4 CFS 121064 125079 159496 193107 229971 274266 977904
5 Devol. as % of CFS 2.10 1.98 2.03 2.06 2.14 2.23 2.03 to 2.23
6 Transfers to the LBs (devol. +
grants) as % of CFS 2.75 2.75 3 3 3.25 3.25 2.75 to 3.25
7 Gap between 6 and 5 (% of CFS) 0.65 0.77 0.97 0.94 1.11 1.02 0.65 to 1.11
8 Recommended Grants( 7*4) 790 965 1555 1810 2545 2810 9510
9 Total Transfers (3+8) 3330 3440 4785 5795 7475 8915 30300
Note: - Amount rounded off to the nearest multiple of 5.
Box 9.2
Box 9.3

135 5th SFC (2015-20)
9.6.3 Grants would focus on Capacity Building
and would be utilized for (a) Manpower,
Training, e-Governance, Office Space, (b) GK,
(c) Preparation of Master Plans/CDPs/DPRs/GIS
Maps, (d) Developing Divisional and District
Headquarters on the lines of Smart and AMRUT
Cities, (e) SPUR Type Professional Services to
the ULBs and the PRIs, (f) Promoting PPP, (g)
Incentive for ARM and Performance Grants
(Para 8.9.2), (h) Regulatory Bodies including
Ombudsman, State Property Tax Board, Urban
Regulator, (i) DLFA and internal audit (j)
Professionalizing SFC Cell in Finance Deptt.
9.6.4 Distribution of Grants available to the
PRIs: Total Grants of Rs. 5785 Cr. available to
the PRIs would be distributed as in Table 9.10
(composite picture in Annex-9.1). PRD would
determine the norms based on letter and spirit of
this commission’s recommendations for
disbursement of item-wise Grants among the
PRIs. Being the first year of the SFC award,
unused amount of Grants for 2015-16 would be
disbursed as ‘Block Fund’ as per para 9.5.7.
(i) Rs. 2720 Cr. for Manpower (Details in Para
6.7.3.2).
(ii) Rs. 305 Cr. for e-Panchayat and Database
Management. (Details in Para 6.7.3.2)
(iii) Rs. 200 Cr. for Training Programmes and Rs.
180 Cr. for State/Distt/Block Panchayat Resource
Centres (Details in Para 6.7.3.2)
(iv) Rs. 38 Cr. for TSSP to provide SPUR type
support to the PRIs. (Details in Para 6.7.3.2)
Table 9.9: Inter LB Share of the total Grants (Rs. Cr.)
15-16 16-17 17-18 18-19 19-20 Total
Total Grants 790 1555 1810 2545 2810 9510
PRIs 555 935 1085 1525 1685 5785
ULBs 235 620 725 1020 1125 3725
Table 9.10: Distribution of Grants among the PRIs (15-16 to 19-20) Rs. Cr.
Note: 1e-Governance covers e-Panchayat for the PRIs. 2Training Programs includes exposure visit to reputed Panchayats. 3For ZPs without Bhawan. 4Professionalizing the SFC Cell in Finance Deptt.
Need for 5
Years
Referance
Table No.15-16 16-17 17-18 18-19 19-20 15-20
1 1780 1940 2390 2960 3665 12735
2 555 935 1085 1525 1685 5785
Capacity building 6502 6.24 285 438 575 1010 1135 3443
i ManPower 5652 6.20 285 300 380 805 950 2720
ii e-Governance1 255 6.22 - 50 85 85 85 305
iii Training 556 6.21 - 80 100 110 90 380
a) Programms2
338 6.21 - 60 60 50 30 200
b) Institutions 218 6.21 - 20 40 60 60 180
iv TSSP 39 6.23 - 8 10 10 10 38
GK 1829 6.26 - 100 80 80 80 340
v Office Support 6.26 - 80 60 60 60 260
vi Case Disposal 6.26 - 10 10 10 10 40
vii Dispute free Village 6.26 - 10 10 10 10 40
C. viii PSB/ZPB3
2000 6.25 70 100 100 100 100 470
D. ix DPCs 122 6.27 - 20 20 20 20 80
Performance Grants 200 270 300 300 330 1400
x ARM 50 200 200 200 230 880
xi Overall Performance 150 70 100 100 100 520
F. xii Ombudsman - 5 5 5 5 20
G. xiii DLFA/Internal Audit - 1.80 4.80 9.80 14.80 31.20
H. xiv SFC Cell4
- 0.20 0.20 0.20 0.20 0.80
Abbreviations : (i) TSSP:Technichal Support for Smart Panchayats, (ii) GK: Gram Katchahry, (iii) PSB:
Panchayat Sarkar Bhawan, (iv) ZPB: Zila Parishad Bhawan, (v) DPC: District Planning Committee, (vi)
ARM: Additional Resource Mobilization., (vii) DLFA: Directorate of Local Fund Audit
E.
Devolution (In Cr.)
Grants (In Cr.)
A.
B.
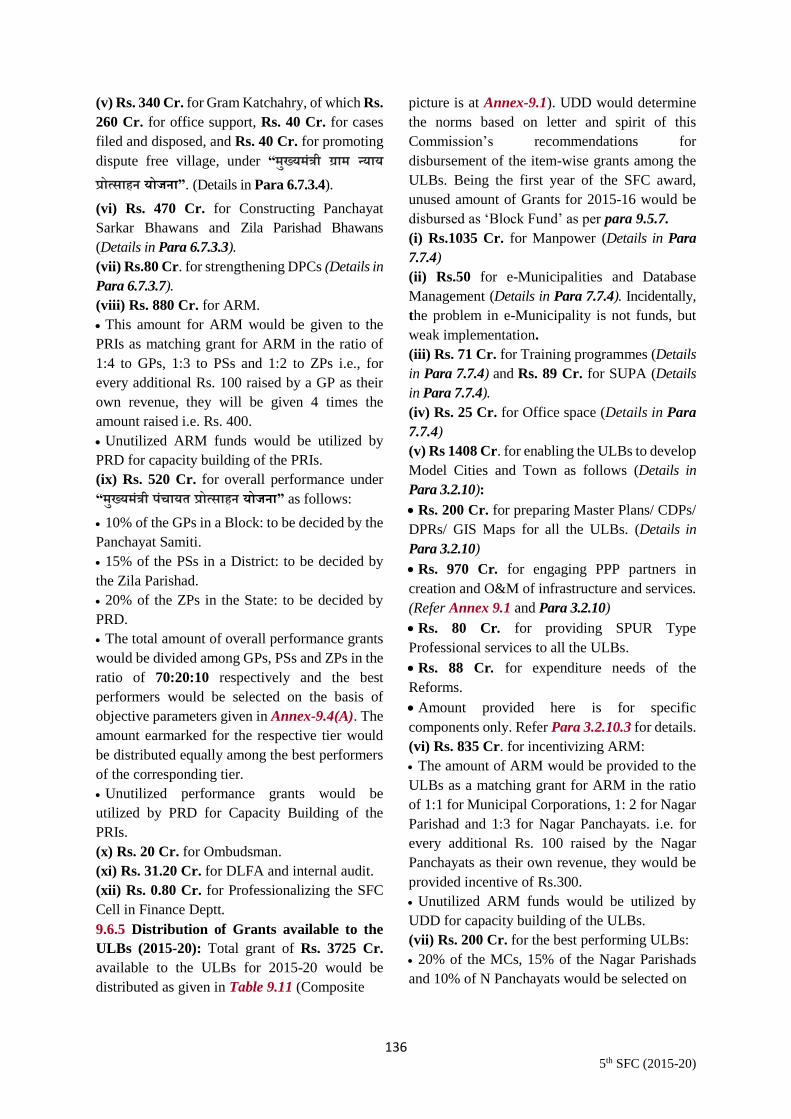
136 5th SFC (2015-20)
(v) Rs. 340 Cr. for Gram Katchahry, of which Rs.
260 Cr. for office support, Rs. 40 Cr. for cases
filed and disposed, and Rs. 40 Cr. for promoting
dispute free village, under “मुख्यमंत्री ग्राम न्याय
प्रोत्साहन योजना”. (Details in Para 6.7.3.4).
(vi) Rs. 470 Cr. for Constructing Panchayat
Sarkar Bhawans and Zila Parishad Bhawans
(Details in Para 6.7.3.3).
(vii) Rs.80 Cr. for strengthening DPCs (Details in
Para 6.7.3.7).
(viii) Rs. 880 Cr. for ARM.
This amount for ARM would be given to the
PRIs as matching grant for ARM in the ratio of
1:4 to GPs, 1:3 to PSs and 1:2 to ZPs i.e., for
every additional Rs. 100 raised by a GP as their
own revenue, they will be given 4 times the
amount raised i.e. Rs. 400.
Unutilized ARM funds would be utilized by
PRD for capacity building of the PRIs.
(ix) Rs. 520 Cr. for overall performance under
“मुख्यमंत्री पंचायत प्रोत्साहन योजना” as follows:
10% of the GPs in a Block: to be decided by the
Panchayat Samiti.
15% of the PSs in a District: to be decided by
the Zila Parishad.
20% of the ZPs in the State: to be decided by
PRD.
The total amount of overall performance grants
would be divided among GPs, PSs and ZPs in the
ratio of 70:20:10 respectively and the best
performers would be selected on the basis of
objective parameters given in Annex-9.4(A). The
amount earmarked for the respective tier would
be distributed equally among the best performers
of the corresponding tier.
Unutilized performance grants would be
utilized by PRD for Capacity Building of the
PRIs.
(x) Rs. 20 Cr. for Ombudsman.
(xi) Rs. 31.20 Cr. for DLFA and internal audit.
(xii) Rs. 0.80 Cr. for Professionalizing the SFC
Cell in Finance Deptt.
9.6.5 Distribution of Grants available to the
ULBs (2015-20): Total grant of Rs. 3725 Cr.
available to the ULBs for 2015-20 would be
distributed as given in Table 9.11 (Composite
picture is at Annex-9.1). UDD would determine
the norms based on letter and spirit of this
Commission’s recommendations for
disbursement of the item-wise grants among the
ULBs. Being the first year of the SFC award,
unused amount of Grants for 2015-16 would be
disbursed as ‘Block Fund’ as per para 9.5.7.
(i) Rs.1035 Cr. for Manpower (Details in Para
7.7.4)
(ii) Rs.50 for e-Municipalities and Database
Management (Details in Para 7.7.4). Incidentally,
the problem in e-Municipality is not funds, but
weak implementation.
(iii) Rs. 71 Cr. for Training programmes (Details
in Para 7.7.4) and Rs. 89 Cr. for SUPA (Details
in Para 7.7.4).
(iv) Rs. 25 Cr. for Office space (Details in Para
7.7.4)
(v) Rs 1408 Cr. for enabling the ULBs to develop
Model Cities and Town as follows (Details in
Para 3.2.10):
Rs. 200 Cr. for preparing Master Plans/ CDPs/
DPRs/ GIS Maps for all the ULBs. (Details in
Para 3.2.10)
Rs. 970 Cr. for engaging PPP partners in
creation and O&M of infrastructure and services.
(Refer Annex 9.1 and Para 3.2.10)
Rs. 80 Cr. for providing SPUR Type
Professional services to all the ULBs.
Rs. 88 Cr. for expenditure needs of the
Reforms.
Amount provided here is for specific
components only. Refer Para 3.2.10.3 for details.
(vi) Rs. 835 Cr. for incentivizing ARM:
The amount of ARM would be provided to the
ULBs as a matching grant for ARM in the ratio
of 1:1 for Municipal Corporations, 1: 2 for Nagar
Parishad and 1:3 for Nagar Panchayats. i.e. for
every additional Rs. 100 raised by the Nagar
Panchayats as their own revenue, they would be
provided incentive of Rs.300.
Unutilized ARM funds would be utilized by
UDD for capacity building of the ULBs.
(vii) Rs. 200 Cr. for the best performing ULBs:
20% of the MCs, 15% of the Nagar Parishads
and 10% of N Panchayats would be selected on
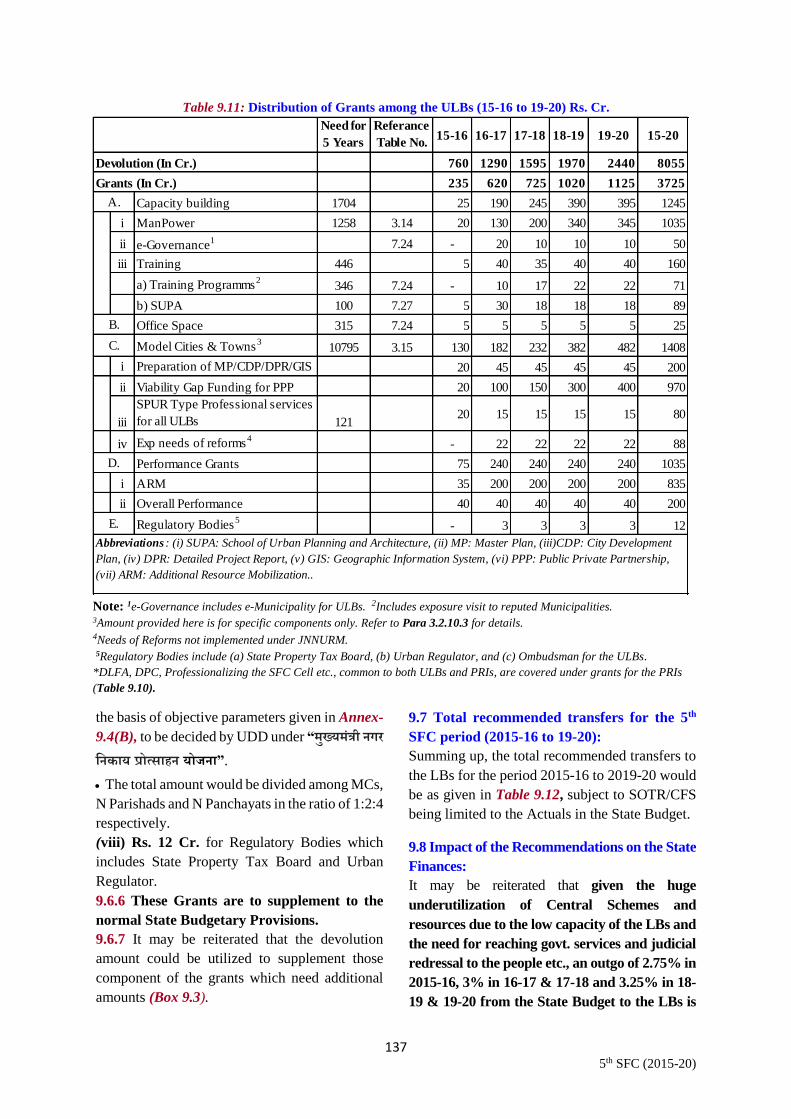
137 5th SFC (2015-20)
the basis of objective parameters given in Annex-
9.4(B), to be decided by UDD under “मुख्यमंत्री नगर
ननकाय प्रोत्साहन योजना”.
The total amount would be divided among MCs,
N Parishads and N Panchayats in the ratio of 1:2:4
respectively.
(viii) Rs. 12 Cr. for Regulatory Bodies which
includes State Property Tax Board and Urban
Regulator.
9.6.6 These Grants are to supplement to the
normal State Budgetary Provisions.
9.6.7 It may be reiterated that the devolution
amount could be utilized to supplement those
component of the grants which need additional
amounts (Box 9.3).
9.7 Total recommended transfers for the 5th
SFC period (2015-16 to 19-20):
Summing up, the total recommended transfers to
the LBs for the period 2015-16 to 2019-20 would
be as given in Table 9.12, subject to SOTR/CFS
being limited to the Actuals in the State Budget.
9.8 Impact of the Recommendations on the State
Finances:
It may be reiterated that given the huge
underutilization of Central Schemes and
resources due to the low capacity of the LBs and
the need for reaching govt. services and judicial
redressal to the people etc., an outgo of 2.75% in
2015-16, 3% in 16-17 & 17-18 and 3.25% in 18-
19 & 19-20 from the State Budget to the LBs is
Table 9.11: Distribution of Grants among the ULBs (15-16 to 19-20) Rs. Cr.
Note: 1e-Governance includes e-Municipality for ULBs. 2Includes exposure visit to reputed Municipalities. 3Amount provided here is for specific components only. Refer to Para 3.2.10.3 for details. 4Needs of Reforms not implemented under JNNURM.
5Regulatory Bodies include (a) State Property Tax Board, (b) Urban Regulator, and (c) Ombudsman for the ULBs.
*DLFA, DPC, Professionalizing the SFC Cell etc., common to both ULBs and PRIs, are covered under grants for the PRIs
(Table 9.10).
Need for
5 Years
Referance
Table No.15-16 16-17 17-18 18-19 19-20 15-20
760 1290 1595 1970 2440 8055
235 620 725 1020 1125 3725
Capacity building 1704 25 190 245 390 395 1245
i ManPower 1258 3.14 20 130 200 340 345 1035
ii e-Governance1 7.24 - 20 10 10 10 50
iii Training 446 5 40 35 40 40 160
a) Training Programms2
346 7.24 - 10 17 22 22 71
b) SUPA 100 7.27 5 30 18 18 18 89
Office Space 315 7.24 5 5 5 5 5 25
Model Cities & Towns3
10795 3.15 130 182 232 382 482 1408
i Preparation of MP/CDP/DPR/GIS 20 45 45 45 45 200
ii Viability Gap Funding for PPP 20 100 150 300 400 970
iii
SPUR Type Professional services
for all ULBs 12120 15 15 15 15 80
iv Exp needs of reforms4
- 22 22 22 22 88
Performance Grants 75 240 240 240 240 1035
i ARM 35 200 200 200 200 835
ii Overall Performance 40 40 40 40 40 200
Regulatory Bodies5
- 3 3 3 3 12
Abbreviations : (i) SUPA: School of Urban Planning and Architecture, (ii) MP: Master Plan, (iii)CDP: City Development
Plan, (iv) DPR: Detailed Project Report, (v) GIS: Geographic Information System, (vi) PPP: Public Private Partnership,
(vii) ARM: Additional Resource Mobilization..
D.
E.
Devolution (In Cr.)
Grants (In Cr.)
A.
B.
C.

138 5th SFC (2015-20)
not excessive. In fact this % is around the average
of the LISs and considerably lower than that of
similar state like UP.
9.8.1 Financial burden due to the increased
devolution: Scenarios of varying devolution and
consequential incremental financial burden on
State Govt. over the 4th SFC recommended level
of devolution of 7.5% can be seen in Para 5.7.3
(read with Table 5.26). The 5th SFC
recommendations would create incremental
financial burden on State Govt. due to the
increased devolution (going up to 9% in 2019-20)
over the 4th SFC recommended devolution as
given in Table 9.13. In case prohibition is
implemented, the loss in State Excise Duty would
automatically get excluded from the divisible
Table 9.12: Recommended transfers to LBs for 15-16 to 19-20 (Annex-9.3)
Note: 1e-Governance covers e-Panchayat for PRIs and e-Municipality for ULBs. 2Training Programs includes exposure visit to reputed Panchayats and reputed Municipalities. 3For ZPs without Bhawan. 4Amount provided here is for specific components only. Refer to Para 3.2.10.3 for details. 5Needs of Reforms not done under JNNURM
.6Regulatory Bodies for the ULBs include (a) State Property Tax Board, Urban Regulator and Ombudsman, (b) Separate Ombudsman
for the PRIs and (c) DLFA, DPC etc. for both the ULBs and the PRIs. 7Professionalizing the SFC Cell in Finance Deptt.
PRIs ULBs PRIs ULBs PRIs ULBs PRIs ULBs PRIs ULBs PRIs ULBs
1780 760 1940 1290 2390 1595 2960 1970 3665 2440 12735 8055
555 235 935 620 1085 725 1525 1020 1685 1125 5785 3725
Capacity building 285 25 438 190 575 245 1010 390 1135 395 3443 1245
i ManPower 285 20 300 130 380 200 805 340 950 345 2720 1035
ii e-Governance1 - - 50 20 85 10 85 10 85 10 305 50
iii Training - 5 80 40 100 35 110 40 90 40 380 160
a) Training Programms2
- - 60 10 60 17 50 22 30 22 200 71
b) Institutions/SUPA - 5 20 30 40 18 60 18 60 18 180 89
iv TSSP - - 8 - 10 - 10 - 10 - 38 -
GK - - 100 - 80 - 80 - 80 - 340 -
i Office Support - - 80 - 60 - 60 - 60 - 260 -
ii Case Disposal - - 10 - 10 - 10 - 10 - 40 -
iii Dispute free Village - - 10 - 10 - 10 - 10 - 40 -
Office Space/PSB/ZPB3
70 5 100 5 100 5 100 5 100 5 470 25
DPCs - - 20 - 20 - 20 - 20 - 80 -
Model Cities & Towns4
- 130 - 182 - 232 - 382 - 482 - 1408
i Preparation of MP/CDP/DPR/GIS - 20 - 45 - 45 - 45 - 45 - 200
ii Viability Gap Funding for PPP - 20 - 100 - 150 - 300 - 400 - 970
iii SPUR Type Professional services
for all ULBs- 20 - 15 - 15 - 15 - 15 - 80
iv Exp needs of reforms5
- - - 22 - 22 - 22 - 22 - 88
Performance Grants 200 75 270 240 300 240 300 240 330 240 1400 1035
i ARM 50 35 200 200 200 200 200 200 230 200 880 835
ii Overall Performance 150 40 70 40 100 40 100 40 100 40 520 200
Regulatory Bodies6
- - 5 3 5 3 5 3 5 3 20 12
DLFA/Internal Audit - - 1.80 - 4.80 - 9.80 - 14.80 - 31.20 -
SFC Cell7
- - 0.20 - 0.20 - 0.20 - 0.20 - 0.80 -
Abbreviations: (i) SUPA: School of Urban Planning and Architechture, (ii) TSSP:Technichal Support for Smart Panchayat, (iii) GK:
Gram Katchehry, (iv) PSB: Panchayat Sarkar Bhawan, (v) DPC: District Planning Committee, (vi) MP: Master Plan, (vii) CDP: City
Development Plan, (viii) DPR: Detailed Project Report, (ix) GIS: Geographic Information System, (x) PPP: Public Private Partnership,
(xi) ARM: Additional Resource Mobilization, (xii) DLFA: Directorate of Local Fund Audit, (xiii) SFC; State Finance Commission.
15-16 16-17 17-18 18-19 19-20 15-20Items
F.
G.
H.
I.
Devolution (In Cr.)
Grants (In Cr.)
A.
B.
C.
D.
E.

139 5th SFC (2015-20)
pool and therefore not lead to increase in the
financial burden.
9.8.2 Financial burden due to the increased
Grants: The 4th SFC had recommended Grants
of Rs. 233 Cr. per year in addition to the
Devolution. Table 9.14 gives incremental
financial burden on the State Budget over the 4th
SFC recommended Grants of Rs. 233 Cr. per
year, due to the 5th SFC recommendation on
Grants (See Para 5.7.6). In case prohibition is
implemented, burden on account of loss of the
State Excise Duty would at best be around 1% of
Rs 4000 Cr = Rs 40 Cr p.a. only.
9.8.3 Financial burden due to the overall
Transfers: State finances would have overall
incremental financial burden as given in Table 9.15
due to the recommendations of the 5th SFC and less
if inflation and increased CFS are taken into
account.
9.9 It is emphasized that the total Transfers
(Devolution + Grants) recommended by the 5th
SFC are over and above the normal State
Budgetary provisions for the LBs. Moreover,
since some schemes like BRGF and RGPSA have
been discontinued by Central Govt., State Govt.
may consider providing equivalent amount to the
LBs in the State Budget, which would again be in
addition to the 5th SFC transfers.
9.10 Grants amount not likely to be utilized in a
year, would be given to the PRIs and the ULBs as
‘Block Grants’ (in the first week of the last quarter)
as per formula given in Box 9.1 and Box 9.2 for
Smart Panchayats and Model Cities/Towns
respectively.
9.11 Resource Gap of the LBs after the 5th SFC
transfers: (Table 9.16)
9.11.1 Out of the total resource gap of Rs 52315
Cr. for the PRIs, Rs 12735 Cr. would be available
as devolution and Rs. 5785 Cr. as Grants (See
para 9.4), leaving a resource gap of Rs 33795 Cr.
Similarly, out of the resource gap of Rs 33316 Cr.
for the ULBs, Rs 8055 Cr. would be available as
devolution and Rs. 3725 Cr. as Grants, leaving a
resource gap of Rs 21536 Cr. Thus, total resource
gap for the LBs post 5th SFC transfers (devolution
+ grants) would be Rs. 55331 Cr. for 2015-20.
9.11.2 Bridging the Resource Gap: This
Resource Gap inclusive of the 5th SFC transfers
(Table 9.16) has to be filled through following
sources:
(i) Own Additional Resources (Tax and Non-
Tax): The LBs must make all efforts to raise their
own resources (tax & non-tax). Incidentally, one
of the conditions imposed by the 14th FC for
performance grants is increase in own revenues.
This would also enhance their autonomy and
accountability. Chapter-X may be referred to for
details of the options available to the LBs for
raising own resources.
(ii) PPP: It is evident that for reaching All India
level of infrastructure and services, the Bihar LBs
would need huge amounts, which cannot be met
through State Budget, FC/SFC transfers, Central
Schemes and own revenues. Leveraging PPP in
a big way for creation and O&M of
infrastructure and services is a necessity.
BMA, 2006 and Bihar Infrastructure
Development Enabling Act, 2006 provide ample
scope and guidelines for implementation of PPP
Table 9.13: Incremental financial burden on the
State Finances due to the increased devolution (Cr.)
Note: - Amount rounded off to the nearest multiple of 5.
Year 15-16 16-17 17-18 18-19 19-20
Devolution (%) 8.5 9 9 9 9
Additional
Financial Burden300 540 665 820 1015
*Inflation not taken into account
Table 9.14: Incremental financial burden on the
State Finances due to the increased Grants (Cr.)
Year 15-16 16-17 17-18 18-19 19-20
Grants 790 1555 1810 2545 2810
Additional
Financial Burden557 1322 1577 2312 2577
Table 9.15: Impact of overall Transfers
(Devolution + Grants) on State Finances
*In case prohibition is implemented, additional burden would be
around Rs. 40 Cr. p.a. only.
Incremental
Financial Burden 15-16 16-17 17-18 18-19 19-20 15-20
Due to devolution 300 540 665 820 1015 3340
Due to grants 557 1322 1577 2312 2577 8345
Total 857 1862 2242 3132 3592 11685

140 5th SFC (2015-20)
schemes by the LBs (Para 7.2.2). Details on PPP
may be seen in Chapter-X.
(iii) Borrowing: The possibility of market
borrowing has to be explored seriously to finance
long-term investment plans, provided that debt
service is ensured and does not jeopardize the
fiscal stability of either the local or the State
Govt. Operational surpluses and own-capital
revenues can be used for co-financing or repaying
debt (Para 7.2.3). Details on borrowing may be
seen in Chapter-X.
(iv) Central and State Schemes: The LBs have
to make all efforts to fully utilize funds available
under Central and State Schemes. The 5th SFC is
recommending sufficient funds for Capacity
Building of the LBs to enable them to do so.
(v) Expenditure Management: Sound
Expenditure Management is necessary to ensure
that available funds are utilized efficiently and
effectively on improving service delivery and
achieving LB’s objectives through professionally
planning resources & expenditure, controlling &
executing expenditure and monitoring
expenditure performance (Details in Para 10.11).
9.12 Release of funds to the LBs:
Recommendations of the 4th SFC, 13th FC and 14th
FC are given in Annex-9.4. The 5th SFC
recommends the following:
(i). As recommended by the 13th FC & the 14th
FC, the 5th SFC transfers would be released
directly into the bank account of the LBs
concerned through electronic fund transfer and
core banking system. Where such facility is
unavailable, other modes of expeditious transfer
would be notified by State Govt.
(ii). Devolution amount for 2015-16 would be
released to each PRI/ ULB in one installment
based on R.E/Actuals of the preceding year i.e.
2014-15. In the subsequent years, while first
allocation of 50% of devolved funds would be
released based upon the R.E/Actuals of SOTR of
the preceding year in April, the second
installment shall be released by October of the
year subject to submission of accounts of the
previous year, audited even through internal
Audit.
(iii). Grants as recommended by the 5th SFC for
2015-16 would be released in one installment
based on the R.E/Actuals of the preceding year.
In the subsequent years, while 1st installment
would be released along with the 1st installment
of the devolved fund (based on the RE/Actuals of
the preceding year), the 2nd installment would be
released only after securing utilization report of
the 1st installment to the extent of 50%, audited
even through internal Audit.
(iv). The details of Devolution and Grants
received and utilized shall be placed before the
respective Gram/ Ward Sabhas and on the
website of the LB at least twice a year in
December and May respectively
(v). In case some LBs fails to submit utilization
report of 1st installment of Grants within a year
Table 9.16: Resource Gap of the LBs post 5th SFC transfers for 15-20 (Rs. Cr.)
Rev. Exp. RG Devol. Grants Total
PRI 360 6652 6292 1780 555 2335 3957
ULB 834 7427 6593 760 235 995 5598
PRI 397 9324 8927 1940 935 2875 6052
ULB 1457 7878 6421 1290 620 1910 4511
PRI 439 10809 10370 2390 1085 3475 6895
ULB 1760 8411 6651 1595 725 2320 4331
PRI 483 12737 12254 2960 1525 4485 7769
ULB 2125 8947 6822 1970 1020 2990 3832
PRI 534 14916 14382 3665 1685 5350 9032
ULB 2697 9525 6828 2440 1125 3565 3263
PRI 2123 54438 52315 12735 5785 18520 33795
ULB 8872 42188 33316 8055 3725 11780 21536
2017-18
2018-19
2019-20
Total
(2015-20)
LBsyear5th SFC assessment 5th SFC transfer
Gap after
5th SFC
transfer
2015-16
2016-17

141 5th SFC (2015-20)
from the date of its release, 2nd installment due to
them would be utilized by PR/UD Departments
on Capacity Building of the LBs.
9.13 Uses of the Transferred (Devolution +
Grants) Funds:
9.13.1 Salaries of at least the existing staffs of the
ULBs and the ZPs must come from their own
revenues. State Govt. could at best meet the
arrears. It will make the LBs more autonomous
and accountable and be consistent with the
performance grant condition of the 14th FC.
9.13.2 Funds earmarked for Manpower by the 5th
SFC is only for the sanction of new and filling of
the vacant positions as per the Model Panchayat
and Municipal Cadres (Para 2.3 and Para 3.3.2
respectively).
9.13.3 Funds for e-Governance must be used
for operationalizing e-Panchayat and e-
Municipality modules in a Mission Mode. This
would also create and continuously update much
needed database, which is virtually missing
presently and leading to ill-informed decision-
making in almost all spheres of the LBs.
9.14 Governance:
9.14.1 Enabling the LBs to function as the
institutions of self-government through Capacity
Building, Sound Finances & Governance and
Accountability is at the core of our
recommendations. Accordingly, the 5th SFC
emphasizes implementation of the
recommendations made in Chapter-X as
precondition to the LBs becoming the self-
governments and fulfilling their mandate.
9.14.2 Accordingly, the SFC Cell in Finance
Department should have professionals on
contract with degree from reputed institutions in
Statistics and Economics respectively, with
emoluments of Rs. 40,000-50,000 p.m. They
would pursue reforms agenda with PRD and
UDD, undertake required research and
documentation and build database on PRIs &
ULBs for use by Finance/Urban/ Panchayati
Raj/Planning Departments and the future
SFCs/UFCs.

5th SFC (2015-20)
Smart Village Smart Ward towards Smart Andhra Pradesh
20 Non Negotiables
A Smart Village/Ward encompasses sustainable and inclusive development of all sections of its community, so enjoy a high standard of living. 100 percent achievement of the following basic amenities, outcomes and services in a definite time frame, is a non-negotiable condition for more towards Smart Village-Smart Ward:
1. Homes for all with access to toilet, safe-drinking water, and regular power. 2. Every household has diversified livelihood opportunities and/or micro-enterprise. 3. End open defecation. 4. SGHs and youths have access to skills development and Village Enterprise Development with bank and market linkages. 5. 100 percent institutional deliveries. 6. Has functional solid/liquid waste management system. 7. End all preventable maternal deaths and infant deaths. 8. Zero school drop outs of boys and girls up to 12th class.
9. Functional toilet, potable water, electricity available in Anganwadi Centres, schools, health centres, GP/Ward buildings. 10. Malnutrition fee (children below 9 years of age). 11. End girl-child marriages (girl below 18 years of age). 12. Every Farm has soil health card, enriched essential mico-nutrients and diversification with livestock and trees. 13. Every Village household has a functional bank account/PM Jan Dhan Bank Account. 14. GP/Ward has its own dynamic development plan prepared by community participation. 15. Has green trees all over its geographic boundaries. 16. Has functional water conservation and harvesting structures. 17. Has functional Information Centre, Computer Lab, and Mee-Seva Centre. 18. Has telecom/internet connectivity. 19. Gram Sabha/Ward Sabha are held four times a year with minimum two-thirds attendance. 20. Has a functional grievance redressal system.
Annexure- 2.1

5th SFC (2015-20)
Comparative Statement of Functions assigned under the Constitution and BPRA, 2006
Sr. No.
Functions under the
Constitution
Corresponding functions under The Bihar Panchayat Raj Act, 2006 Gram Panchayat
( Section 22) Panchayat Samitee
( Section 47) Zila Parishad ( Section 73)
1 Agriculture, including agricultural extension.
Promotion and development of agriculture and horticulture.
(i) Promotion and development of agriculture and horticulture; (ii) Maintenance of agricultural seed farms and horticultural nurseries; (iii) Storage and distribution of insecticides and pesticides; (iv) Propagation of improved methods of cultivation; (v) Promotion of cultivation and marketing of vegetables, fruits, herbal plants and flowers; (vi) Training of farmers and extension activities.
(i) Promotion of measures to increase agricultural production and to popularize the use of improved agricultural practices; (ii) Opening and maintenance of agricultural seed farms and commercial farms; (iii) Establishment and maintenance of godowns; (iv) Conducting agricultural fairs and exhibitions; Production Committee shall perform functions relating to agriculture, (v) Management of agricultural and horticultural extension training centres; (vi) Training of farmers;
2 Land improvement, implementation of land reforms, land consolidation and soil conservation
(i) Development of waste lands. (ii) Development and maintenance of grazing lands and preventing their unauthorised alienation and use.
Assisting the Government and Zila Parishad in the implementation of land improvement and soil conservation programmes of the Government.
Land Improvement and Soil Conservation.
3 Minor irrigation, water management and watershed development.
-------
(i) Assisting the Government and Zila Parishad in the construction and maintenance of minor irrigation works; (ii) Implementation of schemes for community and individual irrigation. maintenance of minor irrigation works;
(i) Construction, renovation and maintenance of minor irrigation works and lift irrigation; (ii) Providing for timely and equitable distribution and full use of water under irrigation schemes under the control of the Zila Parishad; (iii) Development of ground water resources; (iv) Installation of community pump sets; (v) Watershed development programme.
4 Animal husbandly, dairying and poultry.
(i) Improvement of breed of cattle, poultry and other livestock; (ii) Promotion of dairy farming, poultry and piggery; (iii) Grassland development.
(i) Maintenance of veterinary and animal husbandry services; (ii) Improvement of breed of cattle, poultry and other livestock; (iii) Promotion of dairy farming, poultry and piggery; (iv) Prevention of epidemics and contagious diseases.
(i) Establishment of Veterinary Hospitals and Dispensaries; (ii) Setting up of mobile diagnostic and clinic laboratories; (iii) Breeding farms for cows and pigs; (iv) Poultry farms, duck farms and goat farms; (v) Common cold storage facility for dairy, poultry and marine products; (vi) Fodder development programmes; (vii) Promotion of dairy farming, poultry and piggery; (viii) Prevention of epidemics and contagious diseases.
Annexure 2.2
Contd.
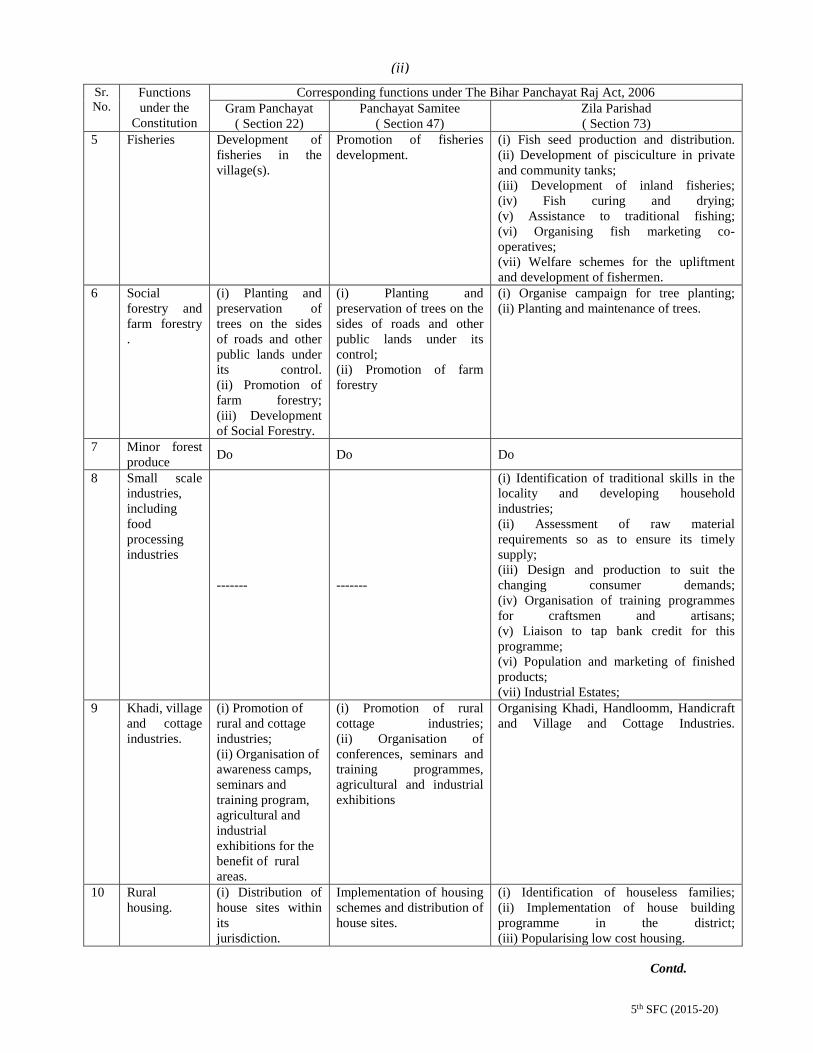
5th SFC (2015-20)
Sr. No.
Functions under the
Constitution
Corresponding functions under The Bihar Panchayat Raj Act, 2006 Gram Panchayat
( Section 22) Panchayat Samitee
( Section 47) Zila Parishad ( Section 73)
5 Fisheries Development of fisheries in the village(s).
Promotion of fisheries development.
(i) Fish seed production and distribution. (ii) Development of pisciculture in private and community tanks; (iii) Development of inland fisheries; (iv) Fish curing and drying; (v) Assistance to traditional fishing; (vi) Organising fish marketing co-operatives; (vii) Welfare schemes for the upliftment and development of fishermen.
6 Social forestry and farm forestry .
(i) Planting and preservation of trees on the sides of roads and other public lands under its control. (ii) Promotion of farm forestry; (iii) Development of Social Forestry.
(i) Planting and preservation of trees on the sides of roads and other public lands under its control; (ii) Promotion of farm forestry
(i) Organise campaign for tree planting; (ii) Planting and maintenance of trees.
7 Minor forest produce Do Do Do
8 Small scale industries, including food processing industries
------- -------
(i) Identification of traditional skills in the locality and developing household industries; (ii) Assessment of raw material requirements so as to ensure its timely supply; (iii) Design and production to suit the changing consumer demands; (iv) Organisation of training programmes for craftsmen and artisans; (v) Liaison to tap bank credit for this programme; (vi) Population and marketing of finished products; (vii) Industrial Estates;
9 Khadi, village and cottage industries.
(i) Promotion of rural and cottage industries; (ii) Organisation of awareness camps, seminars and training program, agricultural and industrial exhibitions for the benefit of rural areas.
(i) Promotion of rural cottage industries; (ii) Organisation of conferences, seminars and training programmes, agricultural and industrial exhibitions
Organising Khadi, Handloomm, Handicraft and Village and Cottage Industries.
10 Rural housing.
(i) Distribution of house sites within its jurisdiction.
Implementation of housing schemes and distribution of house sites.
(i) Identification of houseless families; (ii) Implementation of house building programme in the district; (iii) Popularising low cost housing.
Contd.
(ii)
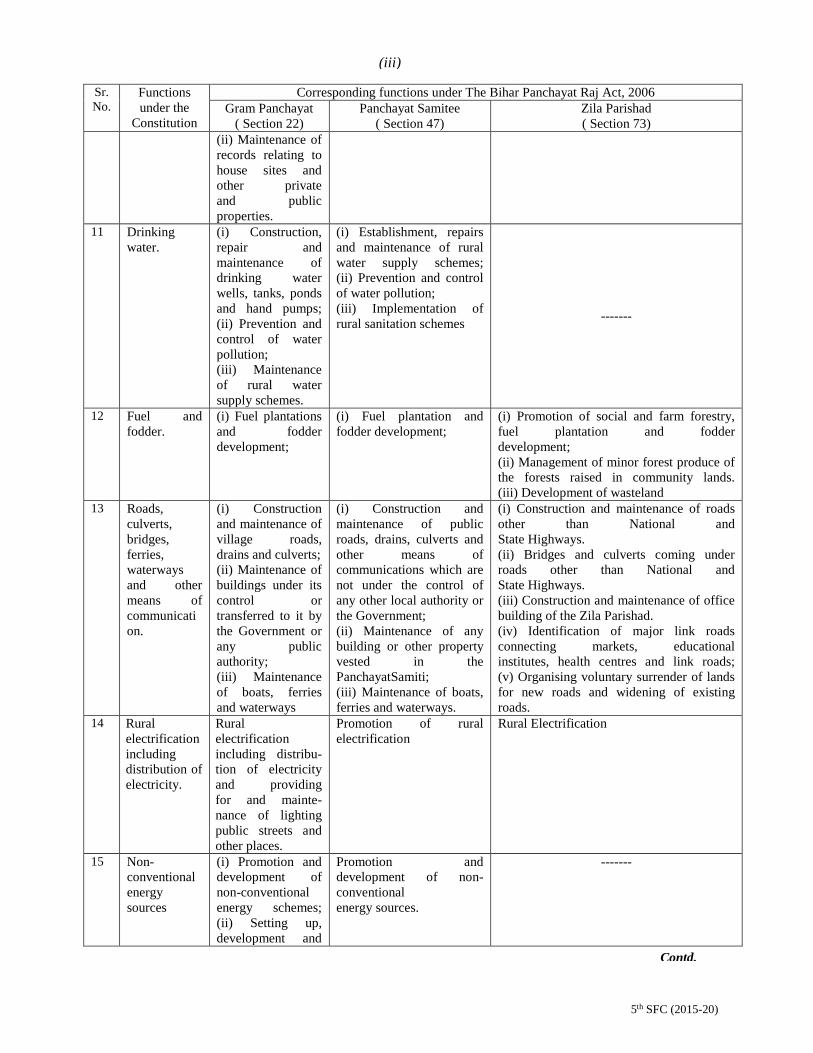
5th SFC (2015-20)
Sr. No.
Functions under the
Constitution
Corresponding functions under The Bihar Panchayat Raj Act, 2006 Gram Panchayat
( Section 22) Panchayat Samitee
( Section 47) Zila Parishad ( Section 73)
(ii) Maintenance of records relating to house sites and other private and public properties.
11 Drinking water.
(i) Construction, repair and maintenance of drinking water wells, tanks, ponds and hand pumps; (ii) Prevention and control of water pollution; (iii) Maintenance of rural water supply schemes.
(i) Establishment, repairs and maintenance of rural water supply schemes; (ii) Prevention and control of water pollution; (iii) Implementation of rural sanitation schemes -------
12 Fuel and fodder.
(i) Fuel plantations and fodder development;
(i) Fuel plantation and fodder development;
(i) Promotion of social and farm forestry, fuel plantation and fodder development; (ii) Management of minor forest produce of the forests raised in community lands. (iii) Development of wasteland
13 Roads, culverts, bridges, ferries, waterways and other means of communication.
(i) Construction and maintenance of village roads, drains and culverts; (ii) Maintenance of buildings under its control or transferred to it by the Government or any public authority; (iii) Maintenance of boats, ferries and waterways
(i) Construction and maintenance of public roads, drains, culverts and other means of communications which are not under the control of any other local authority or the Government; (ii) Maintenance of any building or other property vested in the PanchayatSamiti; (iii) Maintenance of boats, ferries and waterways.
(i) Construction and maintenance of roads other than National and State Highways. (ii) Bridges and culverts coming under roads other than National and State Highways. (iii) Construction and maintenance of office building of the Zila Parishad. (iv) Identification of major link roads connecting markets, educational institutes, health centres and link roads; (v) Organising voluntary surrender of lands for new roads and widening of existing roads.
14 Rural electrification including distribution of electricity.
Rural electrification including distribu-tion of electricity and providing for and mainte- nance of lighting public streets and other places.
Promotion of rural electrification
Rural Electrification
15 Non-conventional energy sources
(i) Promotion and development of non-conventional energy schemes; (ii) Setting up, development and
Promotion and development of non-conventional energy sources.
-------
Contd.
(iii)
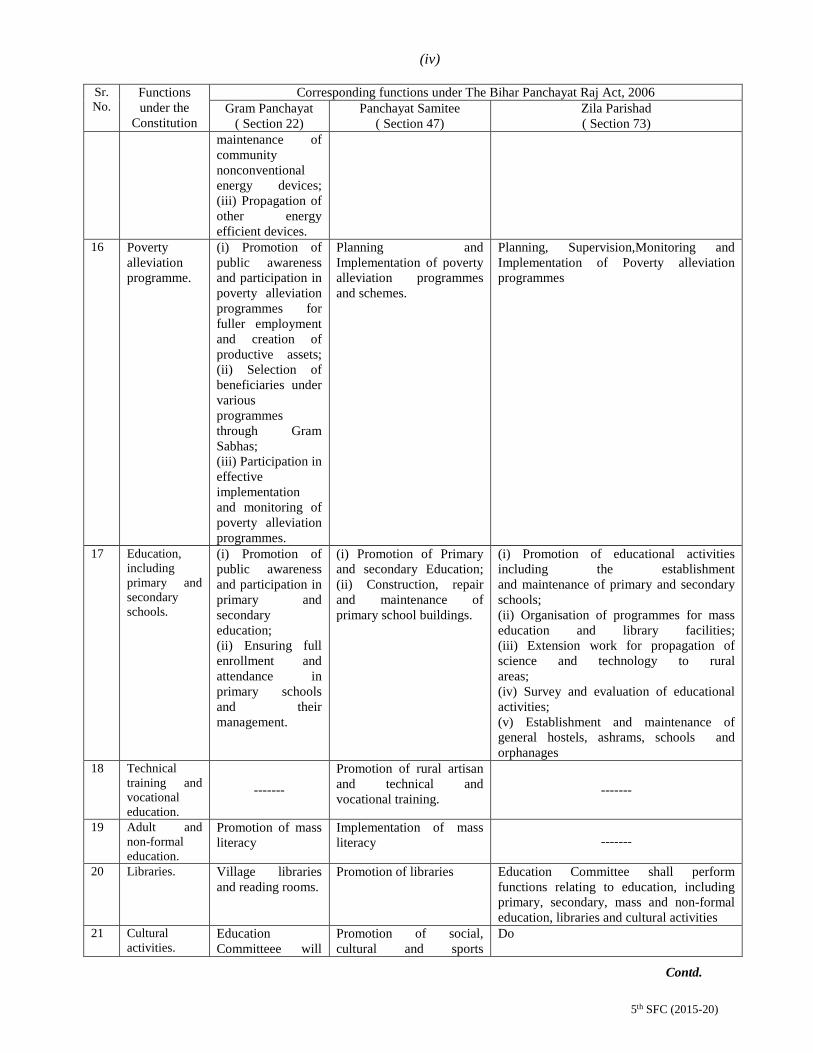
5th SFC (2015-20)
Sr. No.
Functions under the
Constitution
Corresponding functions under The Bihar Panchayat Raj Act, 2006 Gram Panchayat
( Section 22) Panchayat Samitee
( Section 47) Zila Parishad ( Section 73)
maintenance of community nonconventional energy devices; (iii) Propagation of other energy efficient devices.
16 Poverty alleviation programme.
(i) Promotion of public awareness and participation in poverty alleviation programmes for fuller employment and creation of productive assets; (ii) Selection of beneficiaries under various programmes through Gram Sabhas; (iii) Participation in effective implementation and monitoring of poverty alleviation programmes.
Planning and Implementation of poverty alleviation programmes and schemes.
Planning, Supervision,Monitoring and Implementation of Poverty alleviation programmes
17 Education, including primary and secondary schools.
(i) Promotion of public awareness and participation in primary and secondary education; (ii) Ensuring full enrollment and attendance in primary schools and their management.
(i) Promotion of Primary and secondary Education; (ii) Construction, repair and maintenance of primary school buildings.
(i) Promotion of educational activities including the establishment and maintenance of primary and secondary schools; (ii) Organisation of programmes for mass education and library facilities; (iii) Extension work for propagation of science and technology to rural areas; (iv) Survey and evaluation of educational activities; (v) Establishment and maintenance of general hostels, ashrams, schools and orphanages
18 Technical training and vocational education.
------- Promotion of rural artisan and technical and vocational training.
-------
19 Adult and non-formal education.
Promotion of mass literacy
Implementation of mass literacy -------
20 Libraries. Village libraries and reading rooms.
Promotion of libraries Education Committee shall perform functions relating to education, including primary, secondary, mass and non-formal education, libraries and cultural activities
21 Cultural activities.
Education Committeee will
Promotion of social, cultural and sports
Do
Contd.
(iv)
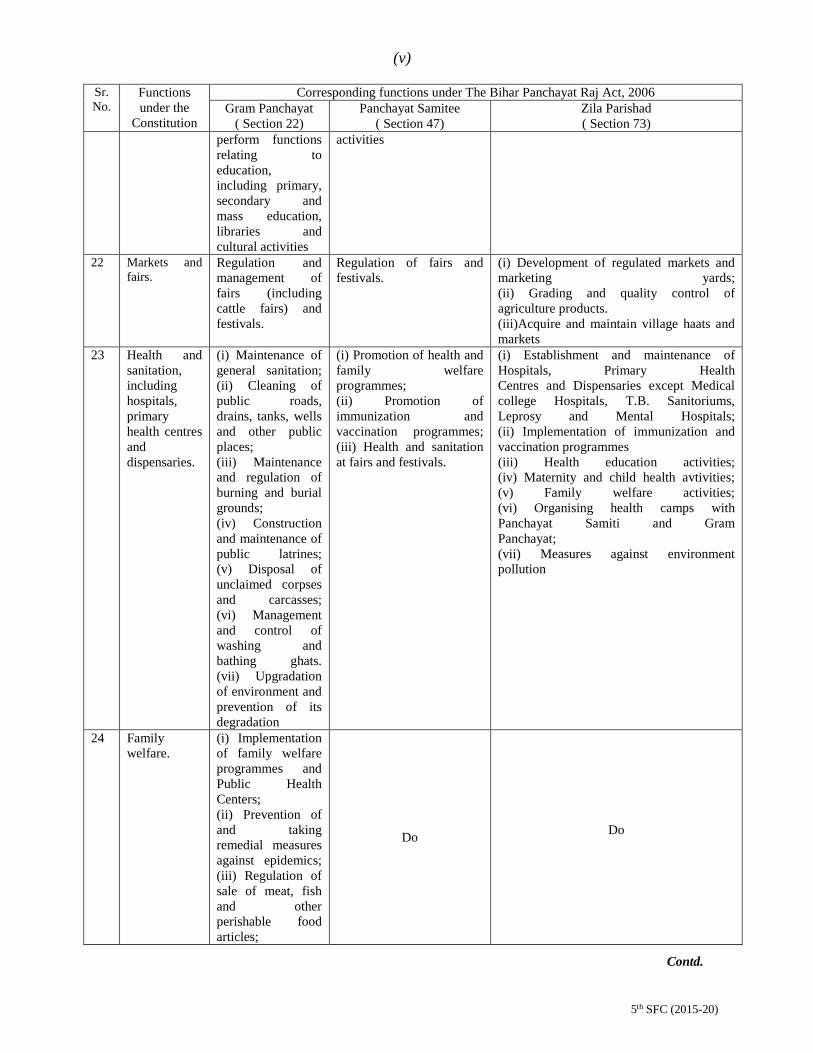
5th SFC (2015-20)
Sr. No.
Functions under the
Constitution
Corresponding functions under The Bihar Panchayat Raj Act, 2006 Gram Panchayat
( Section 22) Panchayat Samitee
( Section 47) Zila Parishad ( Section 73)
perform functions relating to education, including primary, secondary and mass education, libraries and cultural activities
activities
22 Markets and fairs.
Regulation and management of fairs (including cattle fairs) and festivals.
Regulation of fairs and festivals.
(i) Development of regulated markets and marketing yards; (ii) Grading and quality control of agriculture products. (iii)Acquire and maintain village haats and markets
23 Health and sanitation, including hospitals, primary health centres and dispensaries.
(i) Maintenance of general sanitation; (ii) Cleaning of public roads, drains, tanks, wells and other public places; (iii) Maintenance and regulation of burning and burial grounds; (iv) Construction and maintenance of public latrines; (v) Disposal of unclaimed corpses and carcasses; (vi) Management and control of washing and bathing ghats. (vii) Upgradation of environment and prevention of its degradation
(i) Promotion of health and family welfare programmes; (ii) Promotion of immunization and vaccination programmes; (iii) Health and sanitation at fairs and festivals.
(i) Establishment and maintenance of Hospitals, Primary Health Centres and Dispensaries except Medical college Hospitals, T.B. Sanitoriums, Leprosy and Mental Hospitals; (ii) Implementation of immunization and vaccination programmes (iii) Health education activities; (iv) Maternity and child health avtivities; (v) Family welfare activities; (vi) Organising health camps with Panchayat Samiti and Gram Panchayat; (vii) Measures against environment pollution
24 Family welfare.
(i) Implementation of family welfare programmes and Public Health Centers; (ii) Prevention of and taking remedial measures against epidemics; (iii) Regulation of sale of meat, fish and other perishable food articles;
Do
Do
(v)
Contd.
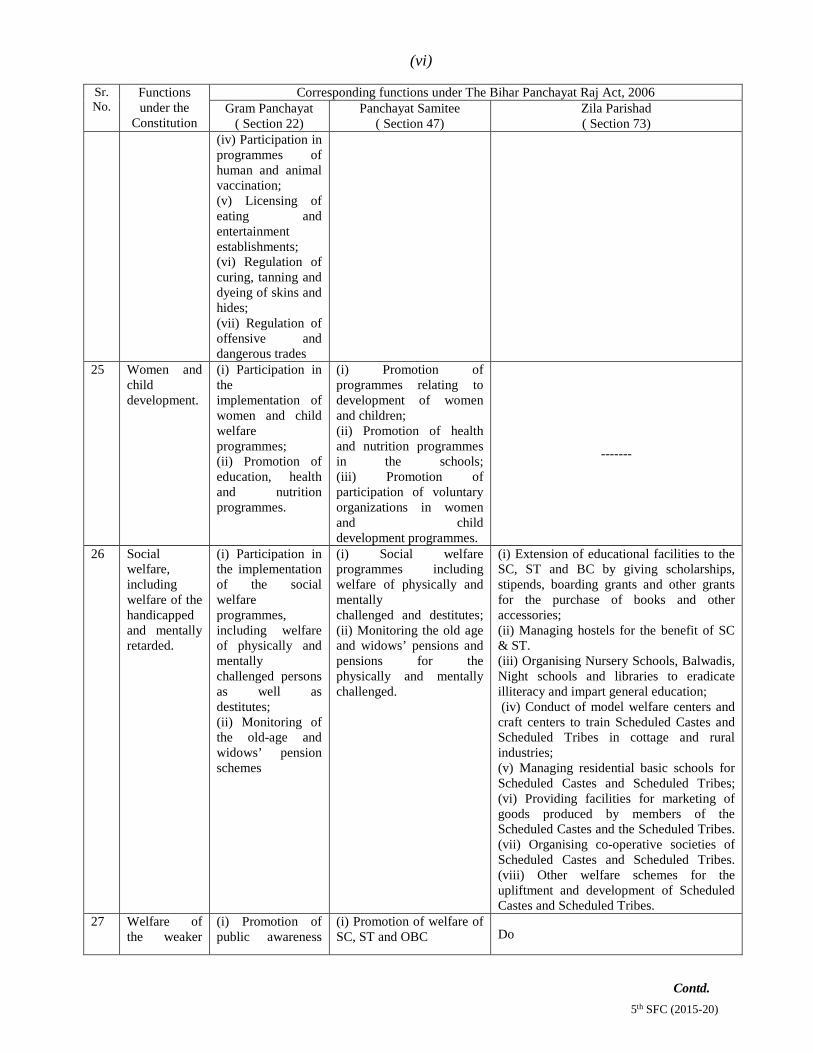
5th SFC (2015-20)
Sr. No.
Functions under the
Constitution
Corresponding functions under The Bihar Panchayat Raj Act, 2006 Gram Panchayat
( Section 22) Panchayat Samitee
( Section 47) Zila Parishad ( Section 73)
(iv) Participation in programmes of human and animal vaccination; (v) Licensing of eating and entertainment establishments; (vi) Regulation of curing, tanning and dyeing of skins and hides; (vii) Regulation of offensive and dangerous trades
25 Women and child development.
(i) Participation in the implementation of women and child welfare programmes; (ii) Promotion of education, health and nutrition programmes.
(i) Promotion of programmes relating to development of women and children; (ii) Promotion of health and nutrition programmes in the schools; (iii) Promotion of participation of voluntary organizations in women and child development programmes.
-------
26 Social welfare, including welfare of the handicapped and mentally retarded.
(i) Participation in the implementation of the social welfare programmes, including welfare of physically and mentally challenged persons as well as destitutes; (ii) Monitoring of the old-age and widows’ pension schemes
(i) Social welfare programmes including welfare of physically and mentally challenged and destitutes; (ii) Monitoring the old age and widows’ pensions and pensions for the physically and mentally challenged.
(i) Extension of educational facilities to the SC, ST and BC by giving scholarships, stipends, boarding grants and other grants for the purchase of books and other accessories; (ii) Managing hostels for the benefit of SC & ST. (iii) Organising Nursery Schools, Balwadis, Night schools and libraries to eradicate illiteracy and impart general education; (iv) Conduct of model welfare centers and craft centers to train Scheduled Castes and Scheduled Tribes in cottage and rural industries; (v) Managing residential basic schools for Scheduled Castes and Scheduled Tribes; (vi) Providing facilities for marketing of goods produced by members of the Scheduled Castes and the Scheduled Tribes. (vii) Organising co-operative societies of Scheduled Castes and Scheduled Tribes. (viii) Other welfare schemes for the upliftment and development of Scheduled Castes and Scheduled Tribes.
27 Welfare of the weaker
(i) Promotion of public awareness
(i) Promotion of welfare of SC, ST and OBC Do
Contd.
(vi)
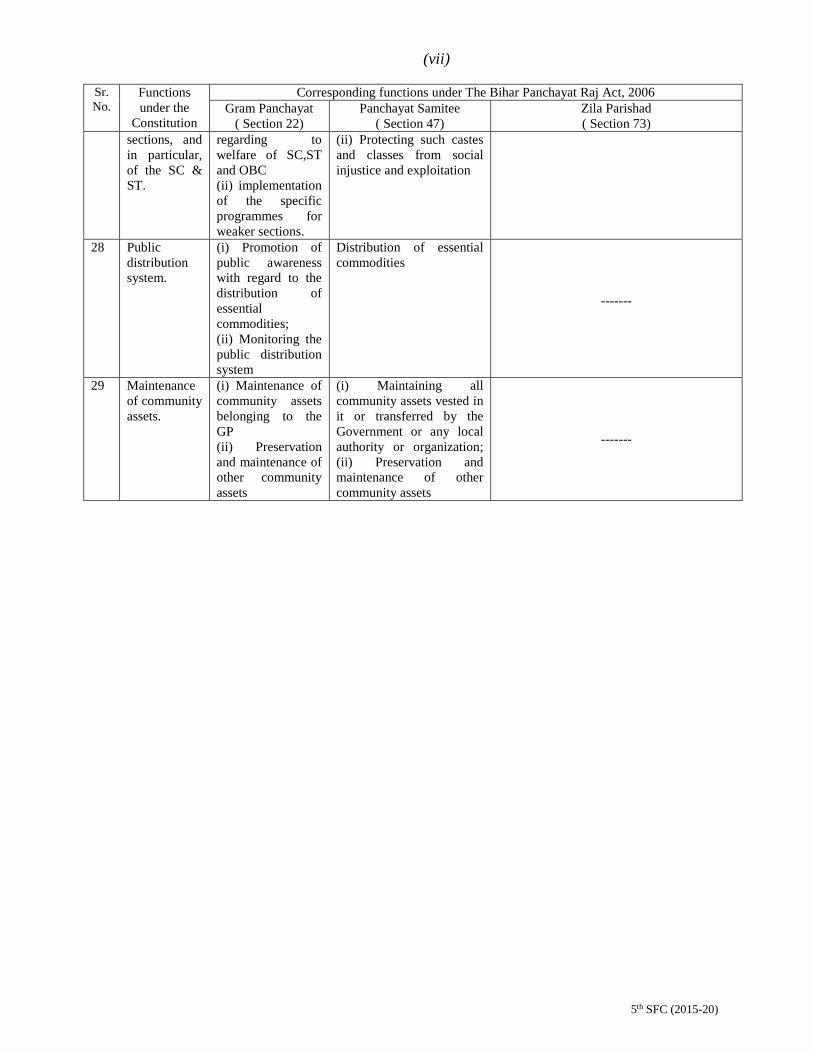
5th SFC (2015-20)
Sr. No.
Functions under the
Constitution
Corresponding functions under The Bihar Panchayat Raj Act, 2006 Gram Panchayat
( Section 22) Panchayat Samitee
( Section 47) Zila Parishad ( Section 73)
sections, and in particular, of the SC & ST.
regarding to welfare of SC,ST and OBC (ii) implementation of the specific programmes for weaker sections.
(ii) Protecting such castes and classes from social injustice and exploitation
28 Public distribution system.
(i) Promotion of public awareness with regard to the distribution of essential commodities; (ii) Monitoring the public distribution system
Distribution of essential commodities
-------
29 Maintenance of community assets.
(i) Maintenance of community assets belonging to the GP (ii) Preservation and maintenance of other community assets
(i) Maintaining all community assets vested in it or transferred by the Government or any local authority or organization; (ii) Preservation and maintenance of other community assets
-------
(vii)

5th SFC (2015-20)
Indicative format for Activity Mapping
Abbr.: DPC- District Planning Committee, ULB- Urban local Body, GS- Gram Sabha, Stg.-Standing Committee, SHG-Self Help Group, CBO-community based organization.
Broad Function Specifice Activity Central
Govt. State Govt. DPCs
Panchayati Raj Institution
ULBs GS/GP Stg.Com.
SHG, CBO, etc. District Intermediate Village
1 2 3 4 5 6 7 8 9 10 11 (A) Functions
Framing Scheme ● Objective, design, Standards etc.
Planning
● Building data base ● Preparation of macro plans ● Preparation of macro plans ● Approval of micro plans ● Consolidation of plans
Asset Creation and
Operation
● Identification of project /land/site ● Construction ● Operation & maintenance ● User Charges ● Identification of beneficiaries ● Procurement/Distribution of asset
Monitoring and
Evaluation
● Reporting ● Display of information ● Social audit ● Independent Evaluation ● IEC
(B) Functionaries
Oversight over each category of
functionaries
● Selection/Appointment ● Training/capacity building ● Payment of salary etc. ● Disciplinary control ● Attendance monitoring ● Performance evaluation
(C) Funds
Financial approval,
accounting & audit
● United/flexible funds ● Financial approval ● Authorization to release ● Reporting of expenditure ● Expenditure review ● Maintenance of accounts ● Quick audit
Annexure- 2.3

5th SFC (2015-20)
Mahatma Gandhi Dispute Free Villages Campaign A.N.P. Sinha, Secretary, MoPR No. N- 12011/4/2010-P&J Dated: 12th October, 2010 Subject: Dispute-Free Village Campaign Dear, As you are aware, the huge backlog of Cases and inordinate delays in disposal of cases in Courts is a major national concern. This problem is likely to aggravate since our society is undergoing massive, socio-economic changes leading to a variety of conflicts such as land disputes, violent strife, and family quarrels. Litigation and counter-litigation is the usual recourse in such conflicts. Increasing Litigation and Gram Nyayalayas& Nyaya Panchayats 2. With a View to ensuring inexpensive, hassle-free and speedy access to justice to citizens and also to clear backlog of cases, the Central Government enacted the Gram Nyayalayas Act, 2008. However, the enactment would meet the concerns only partly as it only brought formal judicial system one level down to intermediate level. Moreover, the Gram Nyayalayas (GNs), would number only around 6,500, if constituted as envisaged. 3. You may recall that Ministry of Panchayati Raj (MoPR) had circulated draft Nyaya Panchayats (NP) Bill for comments/suggestions of the States. The NP Bill aims to broadbase the access to justice (NPs would number over 1.5 Lakhs as against 6,500 GNs) and would institutionalize, at the Gram Panchayat (GP) level, dispute resolution by mediation, conciliation and settlement outside the formal judicial system. Dispute-Free Village Campaign of Maharastra 4.While the NP Bill is under consideration, the “Mahatama Gandhi Dispute-Free Villages Campaign”, or “ Mahatama Gandhi Tantamukt Gaon Mohim” launched by Maharashtra on 15th August, 2007 is worth emulating. The Campaign aims to resolve Village
disputes amicably with the cooperation of the people by creating a podium for reconciliation. This Campaign in its fourth year has resolved over 2.5 Lakh disputes without police or court intervention. The overall impact of the campaign has been to improve caste and religious ties in multi-community villages, defuse political tension, create a general atmosphere of security and ownership of common interest in the State. It has brought justice and reconciliation at the doorsteps of the citizens, while reducing the load of the police and judiciary. Objectives of the Campaign: 5. The Objective behind the Campaign are: a) No disputes should arise in the villages, for this, programmes of preventive measures should be undertaken. b) Settle the existing registered disputes and the newly originated disputes, so that the number of disputes is reduced. c) Make arrangements in the villages for immediate negotiations with the cooperation of the villagers for settlement. d) Take action to create feelings of security in the villages by maintenance of caste and religious goodwill and socio-political understanding. e) Introduce transparency in the duties of police, improve image of the police in the public, create a feeling that the police are the public servants. f) Take action with the help of the public for prevention of the illegal business and also eradication of such illegal businesses. g) Make efforts at village level to reduce corruption and tendency of corruption. h) Create awareness amongst the people to avoid practice of evil customary practices.
Annexure: 2.4
Contd.

5th SFC (2015-20)
6.The Campaign thus has three aspects: (i) prevention of disputes, (ii) resolution of existing disputes, and (iii) resolving nascent disputes. Under the Campaign, four types of disputes are tackled at GP level:
(a) Civil- Civil disputes like ownership disputes, inheritance disputes, and transactions in movable property, title transfer, loans, mortgage issues, payment of money or maintenance etc. and all other disputes.
(b) Revenue-Revenue disputes such as ownership of land, shed, disagreements over land boundaries, disputes under Watan Law, public thoroughfare, farm land access etc.
(c) Criminal-Cognizable and non-cognizable offences which are Compoundable under Law, i-e. Which can be settled with the consent of the parties like physical assault, embezzlement of property, various kind of fraud, cheating etc.
(d) Other disputes- Disputes other than civil, revenue and criminal disputes pertaining to cooperation, labour, disputes of industrial areas, and other disputes. In the case of criminal offences which are Non-Compoundable i-e. cannot be settled under the provisions of law, police stations or courts concerned would take action. Details of Campaign: 7. The Campaign encourages the concerned parties to communicate their grievances to a ‘Panch Panel’ (Committee at village level) which consists of village elders, police and respected citizens. The Campaign has four-tier committee. Beside the State level supervising committee chaired by Chief Minister, there are distinct, taluka and village level committees. The details regarding the composition, tenure, functions, jurisdiction, replacement and code of conduct for the members of these committees are detailed in the Campaign guidelines. English translation of the Maharashtra Government Resolution is at Annexure-II. 8. Under the Campaign, citizen committees like Gram Raksha Dal (Village Security Force) also
are organized to create a general feeling of safety and common cause. 9. The Schedule of the Campaign are as follows:
Award to Villages, Officials, Journalist: 10. With a view to encouraging villages to participate in the Campaign, the State Government gives awards consisting of memento and cash prize to villages with outstanding performance in conflict resolution at a State-level award ceremony. The campaign has a detailed scheme relating to dispute prevention, dispute resolution and nascent dispute resolution. Media and Journalists, who publicize campaign, are awarded at district, divisional and State level. Government officials with outstanding contributions are also felicitated with memento. 11. It is suggested that other States may also initiate similar campaigns/schemes for making the villages dispute free. For further information, Principle Secretary, Panchayati Raj Department, Govt. of Maharashtra could be contacted.
To
Chief Secretaries of all States (except Maharashtra) (A.N.P. Sinha)
No Month Programme
1. 15th August
Inauguration of Dispute-free Village Campaign is done.
2. August Gram Sabha is held in which participation of village in the campaign is ensured and members of the Village Committee are selected.
3. September Compilation of pending dispute is done by the participating village.
4. April Village Committee takes pending dispute for hearing and tries to settle the dispute.
5. May Village Committee declares its village as ‘Tantamukt’ meaning each dispute has been settled amicably.
6. June-July District level Committees and committees of external observers assess the performance of each village.
7. August State Government declares the list of village and distributes awards and cash amount.

5th SFC (2015-20)
Annexure: 2.5
Sl. Post Nature of
Post Unit per
GP Total No.
of Post Salary per unit pm
Total Cost (p.a.) in Cr.
1 2 3 4 5 1.Gram Panchayat (8398)
A Development Cadre 1 PDO1 Regular 1 8398 35000 352.72 B Engineering Cadre 2 Junior Engineer Regular 1 for 5 1680 30000 60.48 C Administrative Cadre 3 GP Sachiv Regular 1 8398 19000 191.47 4 LDC-cum-Tax Collector** Regular 1 8398 17000 171.32 D Accounts Cadre 5 Accountant Regular 1 8398 22000 221.71 E I.T. Cadre 6 I.T. Assistant-cum-DEO2 Regular 1 8398 17000 171.32 F Contractual Staff 0.00
7 M.T.S3 Contractual
/ Outsourced
1 8398 11000 110.85
G Total 52068 1280 2. Panchayat Samiti (534) A Development Cadre B Engineering Cadre 1 Assistant Engineer Regular 1 534 44000 28.20 2 Junior Engineer Regular 1 534 30000 19.22 C Administrative Cadre 3 LDC-cum-Tax Collector** Regular 1 534 17000 10.89 D Accounts Cadre 4 Accountant Regular 1 534 22000 14.10 E I.T. Cadre 5 I.T. Manager Regular 1 534 30000 19.22 6 I.T. Assistant-cum-DEO2 Regular 1 534 17000 10.89 F Contractual Staff 0.00
7 M.T.S3 Contractual / Outsourced 1 534 11000 7.05
G Total 3738 110
Contd.
Model Panchayat Cadre for PRIs

5th SFC (2015-20)
1. Zila Parishad
Sl. Post Nature of
Post
Unit per ZP Total No. of Post
Salary per unit
pm
Total Cost
(p.a.) in Cr.
Large* (17)
Medium* (12)
Small* (09)
1 2 3 4 5 6 7 A Development Cadre B Engineering Cadre 1 District Engineer Regular 1 1 1 38 50000 2.28 2 Assistant Engineer Regular 2 1 1 55 44000 2.90 3 Junior Engineer Regular 4 3 1 113 30000 4.07 C Administrative Cadre 4 Head Clerk Regular 1 1 1 38 25000 1.14 5 LDC-cum-Tax Collector** Regular 7 5 4 215 17000 4.39 D Accounts Cadre 6 Accountant Regular 1 1 1 38 22000 1.00 E I.T. Cadre 7 I.T. Manager Regular 1 1 1 38 30000 1.37 8 I.T. Assistant-cum-DEO2 Regular 4 3 2 122 17000 2.49 F Contractual Staff 0.00
9 M.T.S3 Contractual / Outsourced (Maximum 3) 114 11000 1.50
10 Peon-cum-Mali do (Maximum 2) 76 11000 1.00 11 Driver do (Maximum 3) 114 11000 1.50 G Total 961 23.65

5th SFC (2015-20)
PRD Budget for Perspective Plan of RGPSA (2013 - 2017) (Rs. Cr).
Sl. No. Post Unit cost
(lakh) 13-14 14 - 15 15 - 16 16 - 17 Total
A.Deputy Panchayat Secretary 0.12 0 121 121 121 363Accountant cum Data Entry Operator 0.1 0 101 101 101 302Panchayat Sahayak 0.08 0 81 81 81 242
B.Junior Engineers 0.2 0 20 20 20 61
0 0 323 323 323 968C. GP Building 15 4 8 4 0 15
D. Institutional Structure 100 0 1 0 0 1DPRCs (Panchayat District Training Centre)
200 0 40 28 8 76
Maintenance of DPRC 10 2 4 4 4 13
Block level Resource Centres 10 2 35 16 0 53
0 4 80 49 12 145E. 200 0 1 1 1 2
0 0 1 1 1 2F. 0
0 11 11 11 11 44G. 0
0 42 42 42 42 168H. 0
Rs. 65000 per GP × 8402 0.65 55 0 0 55 109
Rs 2000 per GP level x 12 months 0.02 20 20 20 20 81
Rs. 65000 per PS level x 534 0.65 3 0 0 3 7
Rs 2000 per Block Panchayat level per month
0.02 1 1 1 1 5
80 21 21 80 202I. 0 0 0 0 0
38 5 2 2 2 2 82 2 2 2 8142 487 448 470 1552
J.Experts/ Senior Retired Govt Officials 7 24 22 23 78
149 512 471 493 1629112 384 353 370 122237 128 118 123 407
Unit
Administrative Support
Sub Total
1 per GP (8406)Engineering Support
1 per cluster of 10 GPs =850Sub Total
24 buildings in 1st FY, 50 buildings in 2nd FY
One centre for excellence for capacity building d i i i i i 38
one Administrative Assistant, one Accountant cum DEO, two Peons and two Guards
20 BRCs in 1st FY, 250 in 2nd FY and 134 in 3rd FY would be established
1 per GP (8406)1 per GP (8406)
Grand Total Central Share @ 75% of the Total AmountState Share @ 25% of the Total Amount
Sub TotalIEC Activities Gram Sabha level CampaignsSub Total TotalProgramme ManagementProgramme Management
Internet Connectivity and Recurring cost for implementation of e-Panchayat MMP
Sub TotalInnovative activies to Support Panchayat processes
Strengthening of State Election Commission
Sub TotalCapacity Building &Training activities
Sub TotalE- enablement of Panchayats Laptop, UPS, Scanner and Printer
Internet Connectivity and Recurring cost for GPLaptop, UPS, Scanner and Printer for PS
Annexure: 2.6

5th SFC (2015-20)
Bihar Panchayat Strengthening Project: Objective Indicators and Status
S. No. Objective Indicators Status (Comments)
1
Increased number of trained elected representatives (ERs) performs their mandated role effectively. (Percentage, Custom)
The baseline has not been established yet for this indicator. The project is in the process of being restructured and some indicators will be modified as a result.
2
The regular meetings of the GP focus on Planning & Budgeting of various programs. (Percentage, Custom)
The baseline has not been established yet for this indicator. The project is in the process of being restructured and some indicators will be modified as a result.
3
Members from socially disadvantaged groups (SC, ST and women) actively participate at regular Gram Sabha meetings (Percentage, Custom)
The baseline has not been established yet for this indicator. The project is in the process of being restructured and some indicators will be modified as a result.
4
Increased percentage of GP project beneficiaries are from socially disadvantaged groups (SC, ST and women). (Percentage, Custom)
The baseline has not been established yet for this indicator. The project is in the process of being restructured and some indicators will be modified as a result.
5
GP Standing Committees meet regularly to discharge their statutory functions (Number, Custom)
The baseline has not been established yet for this indicator. The project is in the process of being restructured and some indicators will be modified as a result.
6
Increased number of project GPs submit annual financial statement within four months from the end of fiscal year for external audit. (Number, Custom)
The baseline has not been established yet for this indicator. The project is in the process of being restructured and some indicators will be modified as a result.
7
Increased % of people from all social groups perceive that the Gram Panchayat is increasingly “inclusive, responsive, and accountable” in helping to address their individual and community issues (Percentage, Custom)
The baseline has not been established yet for this indicator. The project is in the process of being restructured and some indicators will be modified as a result.
8
At least 75% of Project-financed GP bhawans are fully functional, with at least 60% of the premises used for intended purposes (Percentage, Custom)
None achieved so far.
9
At least 70% of the Project Elected Representatives (ER) trained and at least 40% of them perform their mandated role effectively (Percentage, Custom)
Some training has taken place under the project (unsystematically) and other training has been provided outside the project. However, there is no information on the effectiveness of the roles played by elected representatives.
10
At least 80% of project GPs regularly disclose budget and expenditure information to the public in a simple and accessible manner. (Percentage, Custom)
No progress to date.
11
At least 70% of project GPs regularly log citizen grievances and report to every Gram Sabha their progress in resolving them. (Percentage, Custom)
No progress to date.
12 At least 80% of project GPs report to every Gram Sabha their progress in implementing development schemes. (Percentage, Custom)
Not measured as there is no project MIS or base-line yet but unlikely that the target has been met.!
Annexure: 2.7
Contd.

5th SFC (2015-20)
S. No. Objective Indicators Status (Comments)
13 PRI financial management manuals, accounting manual, procurement manual are issued by year 2. (Text, Custom)
Not prepared yet.
14 By Year Three, all planned training modules have been field tested and finalized. (Text, Custom)
Training modules yet to be prepared under the project and formal training has not been launched.
15
By Year Five, a Panchayat Finance and Performance database is fully operational and captures panchayat finance and performance in Project districts (Text, Custom)
Not yet achieved; work has also not begun.
16
The State of Panchayat Report documenting the status of decentralization in Bihar and performance of panchayats is produced and widely disseminated annually from year 2. (Text, Custom)
No report produced so far.
17 At least 10% increase in GP audit coverage by LFE in project district every year. (Percentage, Custom)
Not achieved yet as the project is yet to be implemented on the ground. No current data available
18
Panchayat Performance Grants follow a transparent process and performance criteria defined in the Project Implementation Plan (PIP). (Text, Custom)
Not likely to be implemented and the component may be dropped after restructuring.
19
Project management at all levels satisfactorily implement all agreed project activities as per Annual Implementation Plans. (Text, Custom)
Project implementation has been unsatisfactory and much behind schedule. Until recently project operated with thin staffing restricted to the State Project Management Unit.
20
Project management at state and district levels regularly produces Action Taken Reports on issues raised through M&E reports, statutory audits and complaints received. (Text, Custom)
No action taken as project has not reached the district and block levels.
21 By Year 3, at least 90% of sanctioned posts in the BGSYS are filled with appropriate skills. (Percentage, Custom)
Not achieved yet. Staffing has just been initiated and 27 staff have joined the project.
22
The Executive Committee of the BGSYS satisfactorily resolves all issues raised by project management that relate to interdepartmental coordination. (Text, Custom)
The Executive Committee of the BGSYS has not met with the urgency needed to resolve project implementation issues with the result that procurement and staffing decisions have been delayed significantly.
Source: - The World Bank-Implementation Status & Results Report (BPSP),
(ii)

5th SFC (2015-20)
Objectives of 11 Common Core Application Modules of e-Panchayat
1. PriaSoft
PriaSoft is an accounting software that captures details of receipt & expenditure, automatically generates cash book, registers, utilization certificates etc.
It ensures better financial management, transparency and accountability, being online & real-time.
It enables higher authorities to track flow and usage of funds and accordingly decide on subsequent releases.
It facilitates audit. 2. Service Plus
(including grievance redressal)
A dynamic metadata-based service delivery portal to help in providing electronic delivery of all services in all states.
Quick, efficient and transparent in delivery and monitoring. Makes official transactions secure through digital signatures. Obviates need to submit the same documentation again and again to the government
for the same or different services. 3. Area Profiler Assists in creation and updation of basic statistics for village level planning &
development. Captures geographic, demographic, socio-economic and natural resources profile of
a village /Panchayat. Facilitates maintain family register village wise and capture migration details of
family members. 4. Plan Plus Helps in preparation of district plans starting from grassroots i.e. Gram Panchayats.
Enables convergence of funds from different schemes, tracks fund flows and maintains sources of funding.
5. Local Govt. Directory
It generates unique codes for each Panchayat. Capture changes to Panchayats owing to delimitation and assign codes appropriately. Links all Core Common Applications.
6. National Panchayat Portals
Generates a dynamic website for each Panchayat across the country. Acts as a single delivery gateway using single sign-on.
7. Asset Directory
Contains information of assets created & maintained by Panchayats and line departments.
Assigns a unique code to each asset to identify it uniquely and effectively utilize. Captures details of transfer and receipt of assets among entities.
8. Social Audit Gives details of statutory meeting held at ZP/BP/GP. Facilitates social audit of works taken under different schemes of central and state
governments. Provides facility for capturing agenda, issuing meeting notice, recording minutes and
action taken report for meetings. 9. Training
Management Provides details of all training programmes, viz. schedule, training material etc.
Panchayat functionaries can register for course online. Also, the partner training agencies can register.
10. Action Soft It is used for scheme Implementation and monitoring. Facilitates recording and monitoring of financial and physical progress of works
under central/state schemes by local bodies and line departments. Facilitates allocation of funds to a particular work from different schemes. Captures technical & administrative approval of a work before updating physical &
financial progress of a work. 11. GIS Displays maps of Panchayats and integrates with other applications for Panchayats
such as Panchayat Profiler, Planning and Budgeting, Asset Directory etc. so that a spatial view of the profile/plan of Panchayat is obtained.
Annexure: 2.8

5th SFC (2015-20)
Sl Features (SP) (AS) (e-D) 1 Dynamic metadata-based, configurable online service delivery
system. Yes Offline No
2 Services of can be configured (without writing any additional software) & operationalized by any office of any line department, ULB or Panchayat.
Yes No No
3 Framework Supports defining, operationalization and further management of a Service in decentralised manner, by the respective service owner department itself with little training instead of state IT department managing on their behalf
Yes
No
No
4 Configurable facility for designing application form and intermediate documents/certificates.
Yes No No
5 Mobile renderable application forms (by default). Yes No No 6 Configurable facility for creating service-specific workflow. Yes No NA 7 Configurable facility for designing complicated workflows such as
diverging/forking and converging tasks. Yes No No
8 Configurable facility to apply FIFO (First-In-First-Out) policy on all applications submitted for a service.
Yes No No
9 Configurable facility to apply Call-Back on applications processed by any work-flow player.
Yes No No
10 Configurable facility to apply bulk processing policy at the task level.
Yes No No
11 Configurable facility for specifying any number of enclosures including photographs for a service.
Yes No No
12 Configurable facility for online capturing of photograph while filling in the application form.
Yes No No
13 Provide new services related online information. Yes No Yes 14 Applicants can track the status of their application online or through
mobile app irrespective of the mode of submission. Yes No Yes
15 Anyone can access its services anywhere, anytime. Yes No NA 16 User friendly software for all the operators, applicants and also for
higher officials, because application form, its submission, verification and editing processes are very easy.
Yes No NA
17 Decentralized User management (assigning/removing officials to/from tasks).
Yes No No
18 Facility for citizen registration. Yes No No 19 Repository facility for citizens to upload documents, photographs
etc. for use while applying for a service. Yes No No
20 Obviate need to submit the same documentation/information again and again to the government for same or different services.
Yes No No
21 Facility to define service charge based on mode of submission in a generic manner.
Yes No No
22 Facility to capture break-up of service charge to various stakeholders and subsequent aggregation at various levels.
Yes No No
23 Configurable facility for charge payment by applicant in multiple steps of process flow.
Yes No No
24 Configurable facility for citizen interaction (online or face-to-face) at any point in the process flow in the delivery of service.
Yes No No
Relative Strengths and Weaknesses of Service Plus (SP), AdhikarSoft (AS) and e-District (e-D)
Annexure: 2.9
Contd.

5th SFC (2015-20)
(Source: based on field visits and online analysis). Note: - NA= Not Available
25 Facility for customizing the software for a service through pluggable pieces of code – Tenancy Extensions for Service with very unusual features.
Yes No No
26 Cost of e-Enabling a service. NIL NA NA 27 Make official transactions completely secure through digital
signatures. Yes No No
28 Bar Code enabled certificates. Yes Yes NA 29 Facility to generate a Unique ID for each citizen. Yes No No 30 Keep users database online for the validation process. Yes No Yes 31 Provide quick and efficient service delivery to citizen. Yes No No 32 Ensure monitoring of applications received, disposed and pending;
segregated along parameters of department, office level, district, subdivision, block and state.
Yes No No
33 Provide facility to receive alerts (Through SMS and/or Mail) on new services announced by the government or changes to the definition of existing services.
Yes No No
34 Pubic Grievance module can be fully configured as per the State Service Deli6ery Act.
Yes No No
35 Applicant can lodge grievances online in case of deficiency in service or failure to deliver service.
Yes No No
36 Facility to generate configurable State portal or Department portal (offering the services) or service-specific page with URL.
Yes No No
37 Integration with Payment Gateways/Treasuries. Yes No No 38 Integration with CSC e-Wallet. Yes No No 39 Integration with external software applications/databases through
web service. Yes No No
40 Multiple modes of submission (online, through kiosk & through office).
Yes No Yes
41 Integration with Aadhaar. Yes No No 42 Integration with NSDG/SSDG. Yes No No 43 Integration with e-Taal. Yes No No 44 Based on Open Source Technologies. Yes No No 45 Compliance to e-Governance Standards (Location, Name, Address
etc.) published/recommended by Deity. Yes No No
46 Audit Trail Facility. Yes No No

Tier Wise Calculation of O & M expenditure of the PRIs
Note: Calculation based on SR14FC data
Sl. Items 15-16 16-17 17-18 18-19 19-20 15-20 A. Village Level (GP)
Total Revenue Expenditure 2608 3225 3995 4960 6174 20962 1 Roads and Bridges 629 763 925 1121 1358 4796 2 Water Supply 388 462 550 655 780 2836 3 Buildings/Community assets 422 495 580 680 796 2973 4 Street Lighting 275 350 444 564 716 2349 5 Sanitation, Storm Water drainage and solid waste 387 493 628 798 1016 3322 6 Other means of communication 104 151 219 319 463 1256 7 Other maintenance Expenditure 402 511 649 823 1044 3430
Sl. Items B. Intermediate Level (PS) Total Revenue Expenditure 2018 2353 2749 3217 3772 14108 1 Roads and Bridges 843 1006 1199 1429 1703 6181 2 Water Supply 154 171 190 211 234 960 3 Buildings/Community assets 474 580 708 864 1054 3680 4 Street Lighting 0 0 0 0 0 0 5 Sanitation, Storm Water drainage and solid waste 50 58 67 77 88 340 6 Other means of communication 84 96 111 128 147 566 7 Other maintenance Expenditure 411 442 474 509 546 2381
Sl. Items C. Disctrict Level (ZP) Total Revenue Expenditure 1397 1655 1960 2323 2753 10087 1 Roads and Bridges 727 868 1036 1237 1475 5344 2 Water Supply 156 178 202 229 260 1025 3 Buildings/Community assets 259 301 350 406 472 1788 4 Street Lighting 0 0 0 0 0 0 5 Sanitation, Storm Water drainage and solid waste 20 24 29 35 43 151 6 Other means of communication 16 17 17 18 18 86 7 Other maintenance Expenditure 219 267 326 397 484 1693
Sl. Items Total (A+B+C) Total Revenue Expenditure 6023 7232 8704 10500 12698 45157 1 Roads and Bridges 2200 2637 3161 3787 4537 16321 2 Water Supply 699 811 942 1095 1274 4821 3 Buildings/Community assets 1155 1375 1638 1950 2323 8441 4 Street Lighting 275 350 444 564 716 2349 5 Sanitation, Storm Water drainage and solid waste 457 575 723 910 1147 3813 6 Other means of communication 203 264 348 465 629 1908 7 Other maintenance Expenditure 1033 1220 1448 1729 2074 7504
Annexure 6.1

In Cr.
Sl.No. Item Base yr. Growth Rate 15-16 16-17 17-18 18-19 19-20
Revenue
1 Tax Revenue
2 Non-Tax Revenue
a User fees
b Licence fees
c Others
3 FC Transfers
a UFC transfers
b SFC transfers 4 Capital receipts 5 Total ( 1+2+3+4)
Expenditure
6 Capacity Building
a Man Power
b Office Space c IT
d. Training e. Others
7 Regulatory
a Gram Cutchery b Village Policing
8 O & M
a Civic Services b Infrastructure
9 Civic Services a Drinking Water
b Sanitation c Drainage d. Street lighting
e. Socio- eco develop
f. Others 10 Total ( 6+7+8+9)
Resource Gap 11 Gap (10-5)
Format for Computation of Resource Gap Annexure 6.2
Information awaited from PRD
Information awaited from PRD

Annexure 6.3
Sources of Resources & Strategies to bridge the Resource Gap of the PRIs
Assignment & Appropriation of Taxes
Own Resources
Own Revenue Borrowing
Central/State Schemes Exp. Mgmt. • Efficiency in allocation
and Usage of Funds • e- governance
SFC Devolution& Grants UFC Grants
PPP
FC Transfers
A. Fiscal Measures • Tax &Non Tax Revenue
Borrowing
• BPRA (56, 81 & 83) provide for borrowing from market and government institutions. • Based on credit enhancements of the PRIs
B. Non Fiscal Measures • System & Procedure Assessment & Collection Efficiency GIS Mapping of properties Rationalizing/revising taxes & non- taxes Others
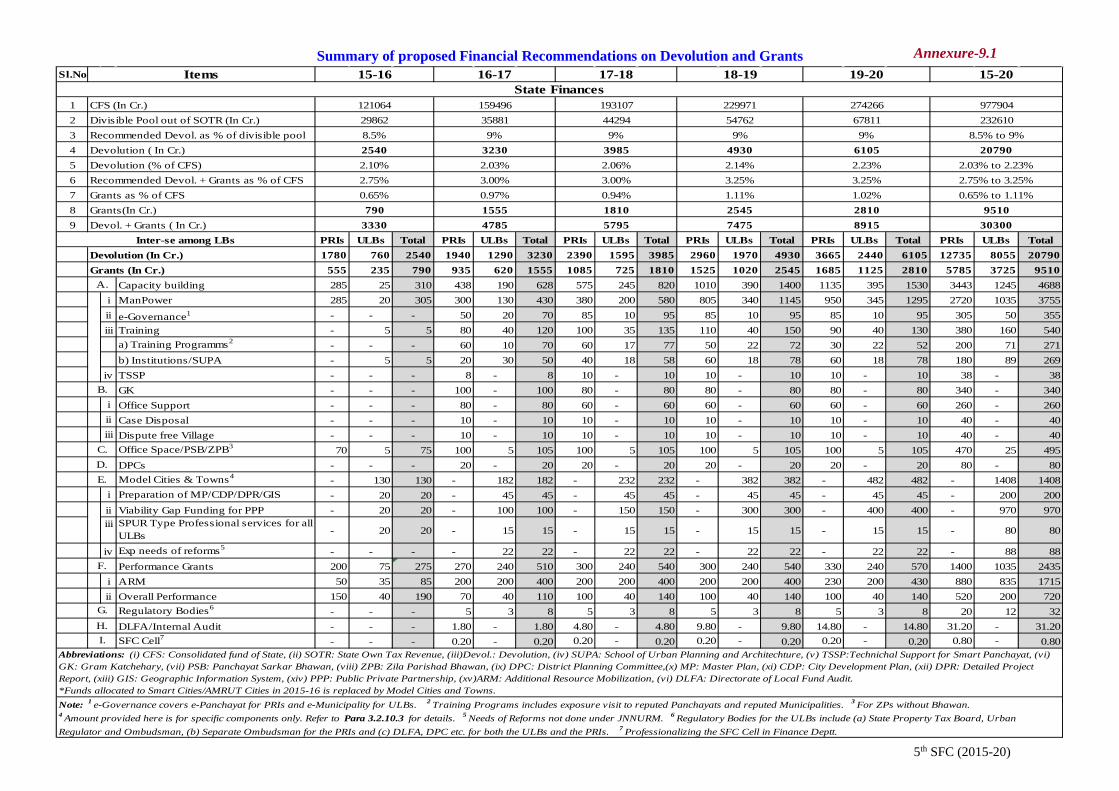
Summary of proposed Financial Recommendations on Devolution and Grants
Sl.No.
123456789
PRIs ULBs Total PRIs ULBs Total PRIs ULBs Total PRIs ULBs Total PRIs ULBs Total PRIs ULBs Total1780 760 2540 1940 1290 3230 2390 1595 3985 2960 1970 4930 3665 2440 6105 12735 8055 20790
555 235 790 935 620 1555 1085 725 1810 1525 1020 2545 1685 1125 2810 5785 3725 9510Capacity building 285 25 310 438 190 628 575 245 820 1010 390 1400 1135 395 1530 3443 1245 4688
i ManPower 285 20 305 300 130 430 380 200 580 805 340 1145 950 345 1295 2720 1035 3755ii e-Governance1 - - - 50 20 70 85 10 95 85 10 95 85 10 95 305 50 355iii Training - 5 5 80 40 120 100 35 135 110 40 150 90 40 130 380 160 540
a) Training Programms2 - - - 60 10 70 60 17 77 50 22 72 30 22 52 200 71 271b) Institutions/SUPA - 5 5 20 30 50 40 18 58 60 18 78 60 18 78 180 89 269
iv TSSP - - - 8 - 8 10 - 10 10 - 10 10 - 10 38 - 38GK - - - 100 - 100 80 - 80 80 - 80 80 - 80 340 - 340
i Office Support - - - 80 - 80 60 - 60 60 - 60 60 - 60 260 - 260ii Case Disposal - - - 10 - 10 10 - 10 10 - 10 10 - 10 40 - 40iii Dispute free Village - - - 10 - 10 10 - 10 10 - 10 10 - 10 40 - 40
Office Space/PSB/ZPB3 70 5 75 100 5 105 100 5 105 100 5 105 100 5 105 470 25 495DPCs - - - 20 - 20 20 - 20 20 - 20 20 - 20 80 - 80Model Cities & Towns4 - 130 130 - 182 182 - 232 232 - 382 382 - 482 482 - 1408 1408
i Preparation of MP/CDP/DPR/GIS - 20 20 - 45 45 - 45 45 - 45 45 - 45 45 - 200 200ii Viability Gap Funding for PPP - 20 20 - 100 100 - 150 150 - 300 300 - 400 400 - 970 970iii SPUR Type Professional services for all
ULBs - 20 20 - 15 15 - 15 15 - 15 15 - 15 15 - 80 80
iv Exp needs of reforms5 - - - - 22 22 - 22 22 - 22 22 - 22 22 - 88 88Performance Grants 200 75 275 270 240 510 300 240 540 300 240 540 330 240 570 1400 1035 2435
i ARM 50 35 85 200 200 400 200 200 400 200 200 400 230 200 430 880 835 1715ii Overall Performance 150 40 190 70 40 110 100 40 140 100 40 140 100 40 140 520 200 720
Regulatory Bodies6 - - - 5 3 8 5 3 8 5 3 8 5 3 8 20 12 32DLFA/Internal Audit - - - 1.80 - 1.80 4.80 - 4.80 9.80 - 9.80 14.80 - 14.80 31.20 - 31.20SFC Cell7 - - - 0.20 - 0.20 0.20 - 0.20 0.20 - 0.20 0.20 - 0.20 0.80 - 0.80
0.65% to 1.11%3.25%
Recommended Devol. as % of divisible pool
2.03% to 2.23%
9% 8.5% to 9%4930 6105 207909%
2.14% 2.23%
Divisible Pool out of SOTR (In Cr.)
H.I.
121064 159496
D.E.
F.
G.
Devol. + Grants ( In Cr.)Inter-se among LBs
CFS (In Cr.)
Devolution ( In Cr.)Devolution (% of CFS)Recommended Devol. + Grants as % of CFS
39852.10% 2.03% 2.06%2.75% 3.00% 3.00%
C.
Devolution (In Cr.)Grants (In Cr.)
2540 3230
A.
B.
67811 232610229971193107
8.5% 9% 9%
19-20 15-20
30300790 1555 1810 2545 2810 9510
3330 4785 5795 7475 8915
3.25% 2.75% to 3.25%
Items 15-16 16-17 17-18 18-19
Grants as % of CFSGrants(In Cr.)
Abbreviations: (i) CFS: Consolidated fund of State, (ii) SOTR: State Own Tax Revenue, (iii)Devol.: Devolution, (iv) SUPA: School of Urban Planning and Architechture, (v) TSSP:Technichal Support for Smart Panchayat, (vi) GK: Gram Katchehary, (vii) PSB: Panchayat Sarkar Bhawan, (viii) ZPB: Zila Parishad Bhawan, (ix) DPC: District Planning Committee,(x) MP: Master Plan, (xi) CDP: City Development Plan, (xii) DPR: Detailed Project Report, (xiii) GIS: Geographic Information System, (xiv) PPP: Public Private Partnership, (xv)ARM: Additional Resource Mobilization, (vi) DLFA: Directorate of Local Fund Audit. *Funds allocated to Smart Cities/AMRUT Cities in 2015-16 is replaced by Model Cities and Towns.Note: 1 e-Governance covers e-Panchayat for PRIs and e-Municipality for ULBs. 2 Training Programs includes exposure visit to reputed Panchayats and reputed Municipalities. 3 For ZPs without Bhawan.4 Amount provided here is for specific components only. Refer to Para 3.2.10.3 for details. 5 Needs of Reforms not done under JNNURM. 6 Regulatory Bodies for the ULBs include (a) State Property Tax Board, Urban Regulator and Ombudsman, (b) Separate Ombudsman for the PRIs and (c) DLFA, DPC etc. for both the ULBs and the PRIs. 7 Professionalizing the SFC Cell in Finance Deptt.
State Finances
0.65% 0.97% 0.94% 1.11% 1.02%
274266 97790429862 35881 44294 54762
Annexure-9.1
5th SFC (2015-20)
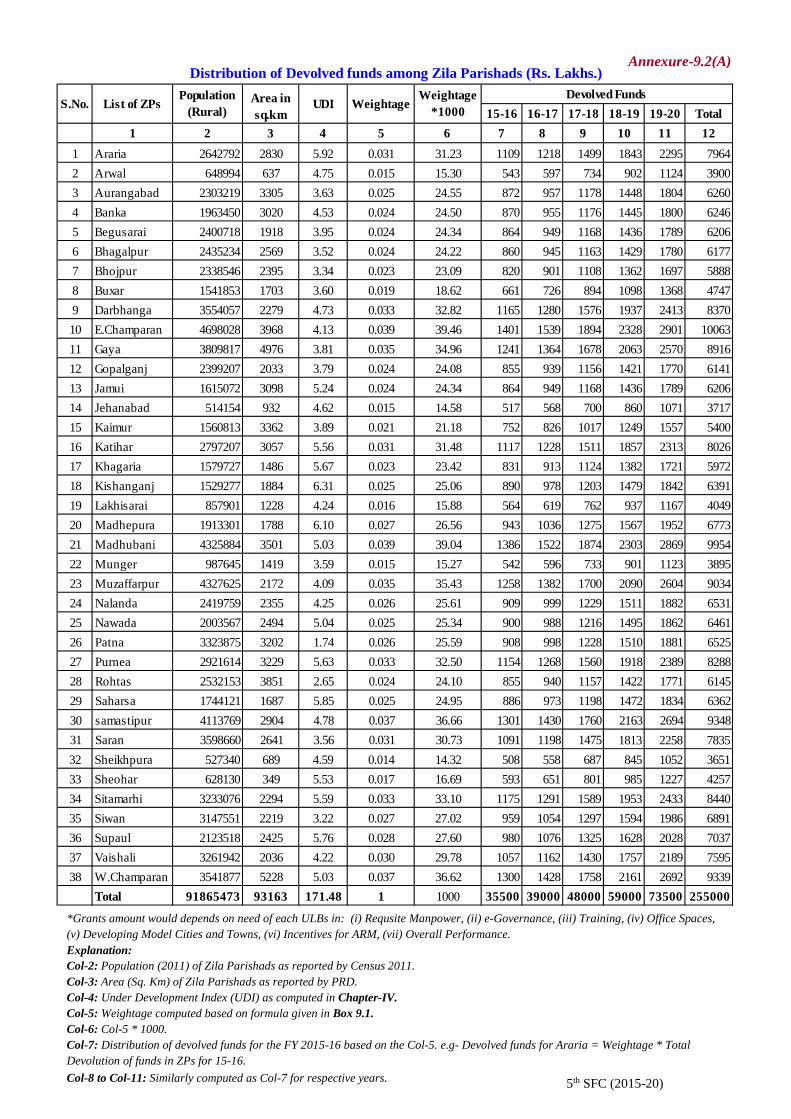
Distribution of Devolved funds among Zila Parishads (Rs. Lakhs.)
15-16 16-17 17-18 18-19 19-20 Total1 2 3 4 5 6 7 8 9 10 11 12
1 Araria 2642792 2830 5.92 0.031 31.23 1109 1218 1499 1843 2295 79642 Arwal 648994 637 4.75 0.015 15.30 543 597 734 902 1124 39003 Aurangabad 2303219 3305 3.63 0.025 24.55 872 957 1178 1448 1804 62604 Banka 1963450 3020 4.53 0.024 24.50 870 955 1176 1445 1800 62465 Begusarai 2400718 1918 3.95 0.024 24.34 864 949 1168 1436 1789 62066 Bhagalpur 2435234 2569 3.52 0.024 24.22 860 945 1163 1429 1780 61777 Bhojpur 2338546 2395 3.34 0.023 23.09 820 901 1108 1362 1697 58888 Buxar 1541853 1703 3.60 0.019 18.62 661 726 894 1098 1368 47479 Darbhanga 3554057 2279 4.73 0.033 32.82 1165 1280 1576 1937 2413 837010 E.Champaran 4698028 3968 4.13 0.039 39.46 1401 1539 1894 2328 2901 1006311 Gaya 3809817 4976 3.81 0.035 34.96 1241 1364 1678 2063 2570 891612 Gopalganj 2399207 2033 3.79 0.024 24.08 855 939 1156 1421 1770 614113 Jamui 1615072 3098 5.24 0.024 24.34 864 949 1168 1436 1789 620614 Jehanabad 514154 932 4.62 0.015 14.58 517 568 700 860 1071 371715 Kaimur 1560813 3362 3.89 0.021 21.18 752 826 1017 1249 1557 540016 Katihar 2797207 3057 5.56 0.031 31.48 1117 1228 1511 1857 2313 802617 Khagaria 1579727 1486 5.67 0.023 23.42 831 913 1124 1382 1721 597218 Kishanganj 1529277 1884 6.31 0.025 25.06 890 978 1203 1479 1842 639119 Lakhisarai 857901 1228 4.24 0.016 15.88 564 619 762 937 1167 404920 Madhepura 1913301 1788 6.10 0.027 26.56 943 1036 1275 1567 1952 677321 Madhubani 4325884 3501 5.03 0.039 39.04 1386 1522 1874 2303 2869 995422 Munger 987645 1419 3.59 0.015 15.27 542 596 733 901 1123 389523 Muzaffarpur 4327625 2172 4.09 0.035 35.43 1258 1382 1700 2090 2604 903424 Nalanda 2419759 2355 4.25 0.026 25.61 909 999 1229 1511 1882 653125 Nawada 2003567 2494 5.04 0.025 25.34 900 988 1216 1495 1862 646126 Patna 3323875 3202 1.74 0.026 25.59 908 998 1228 1510 1881 652527 Purnea 2921614 3229 5.63 0.033 32.50 1154 1268 1560 1918 2389 828828 Rohtas 2532153 3851 2.65 0.024 24.10 855 940 1157 1422 1771 614529 Saharsa 1744121 1687 5.85 0.025 24.95 886 973 1198 1472 1834 636230 samastipur 4113769 2904 4.78 0.037 36.66 1301 1430 1760 2163 2694 934831 Saran 3598660 2641 3.56 0.031 30.73 1091 1198 1475 1813 2258 783532 Sheikhpura 527340 689 4.59 0.014 14.32 508 558 687 845 1052 365133 Sheohar 628130 349 5.53 0.017 16.69 593 651 801 985 1227 425734 Sitamarhi 3233076 2294 5.59 0.033 33.10 1175 1291 1589 1953 2433 844035 Siwan 3147551 2219 3.22 0.027 27.02 959 1054 1297 1594 1986 689136 Supaul 2123518 2425 5.76 0.028 27.60 980 1076 1325 1628 2028 703737 Vaishali 3261942 2036 4.22 0.030 29.78 1057 1162 1430 1757 2189 759538 W.Champaran 3541877 5228 5.03 0.037 36.62 1300 1428 1758 2161 2692 9339
Total 91865473 93163 171.48 1 1000 35500 39000 48000 59000 73500 255000
Devolved FundsS.No. List of ZPs
Population (Rural)
Area in sq.km
UDI WeightageWeightage
*1000
Annexure-9.2(A)
*Grants amount would depends on need of each ULBs in: (i) Requsite Manpower, (ii) e-Governance, (iii) Training, (iv) Office Spaces, (v) Developing Model Cities and Towns, (vi) Incentives for ARM, (vii) Overall Performance. Explanation: Col-2: Population (2011) of Zila Parishads as reported by Census 2011. Col-3: Area (Sq. Km) of Zila Parishads as reported by PRD. Col-4: Under Development Index (UDI) as computed in Chapter-IV. Col-5: Weightage computed based on formula given in Box 9.1. Col-6: Col-5 * 1000. Col-7: Distribution of devolved funds for the FY 2015-16 based on the Col-5. e.g- Devolved funds for Araria = Weightage * Total Devolution of funds in ZPs for 15-16. Col-8 to Col-11: Similarly computed as Col-7 for respective years. 5th SFC (2015-20)

Distribution of Devolved funds among Panchayat Samitis (Rs. Lakhs.)
15-16 16-17` 17-18 18-19 19-20 Total1 2 3 4 5 6 7 8 9 10 11 12
1 Arwal Karpi 0.959 192213 0.0020 1.981 35.66 38.63 47.54 58.44 72.31 252.582 Arwal Kurtha 0.850 121818 0.0015 1.494 26.89 29.14 35.86 44.08 54.54 190.503 Arwal Kaler 0.722 148941 0.0015 1.515 27.26 29.53 36.35 44.68 55.28 193.114 Arwal Sonbhadra B 1.102 78185 0.0015 1.509 27.16 29.42 36.21 44.50 55.06 192.355 Arwal Arwal 0.633 107837 0.0012 1.205 21.69 23.49 28.91 35.54 43.97 153.606 Araria Araria 1.275 386508 0.0033 3.339 60.10 65.11 80.14 98.50 121.87 425.727 Araria Bhargama 1.553 230835 0.0028 2.776 49.96 54.12 66.61 81.88 101.31 353.898 Araria Forbesganj 1.071 396364 0.0032 3.191 57.44 62.22 76.58 94.13 116.47 406.859 Araria Jokihat 1.511 322192 0.0032 3.225 58.06 62.89 77.41 95.15 117.73 411.2310 Araria Kursaktta 1.389 149231 0.0022 2.174 39.12 42.38 52.17 64.12 79.34 277.1311 Araria Narpatganj 1.376 351773 0.0033 3.251 58.52 63.40 78.03 95.91 118.67 414.5512 Araria Palasai 1.554 248369 0.0029 2.870 51.66 55.97 68.88 84.67 104.76 365.9513 Araria Raniganj 1.512 398977 0.0036 3.640 65.53 70.99 87.37 107.39 132.87 464.1514 Araria Sikti 1.524 158543 0.0024 2.357 42.43 45.97 56.58 69.54 86.04 300.5615 AurangabadAurangabad 0.010 180949 0.0010 0.984 17.72 19.20 23.63 29.04 35.93 125.5116 AurangabadBarun 0.634 200052 0.0017 1.703 30.65 33.21 40.87 50.23 62.15 217.1117 AurangabadDaudnagar 0.530 154490 0.0014 1.354 24.38 26.41 32.51 39.96 49.44 172.6918 AurangabadDeo 0.746 173216 0.0017 1.669 30.03 32.54 40.05 49.22 60.90 212.7419 AurangabadGoh 0.949 234400 0.0022 2.198 39.57 42.87 52.76 64.85 80.24 280.3020 AurangabadHaspur 0.586 160820 0.0014 1.444 26.00 28.16 34.66 42.61 52.72 184.1421 AurangabadKutumba 0.695 226599 0.0019 1.906 34.31 37.16 45.74 56.22 69.57 243.0022 AurangabadMadanpur 0.776 211329 0.0019 1.903 34.26 37.12 45.68 56.15 69.48 242.7023 AurangabadNabinagar 0.646 281252 0.0022 2.151 38.72 41.95 51.63 63.46 78.52 274.2924 AurangabadObra 0.628 226007 0.0018 1.836 33.05 35.81 44.07 54.17 67.02 234.1225 AurangabadRafiganj 0.649 276831 0.0021 2.131 38.36 41.56 51.15 62.87 77.79 271.7426 Banka Amarpur 0.856 201351 0.0019 1.929 34.72 37.61 46.29 56.90 70.40 245.9327 Banka Banka 1.020 171324 0.0019 1.929 34.72 37.61 46.29 56.89 70.40 245.9028 Banka Barahat 1.013 149188 0.0018 1.803 32.46 35.16 43.28 53.19 65.81 229.9029 Banka Bausi 1.269 185000 0.0022 2.248 40.46 43.83 53.95 66.31 82.04 286.5930 Banka Belhar 1.082 167719 0.0020 1.970 35.47 38.42 47.29 58.13 71.92 251.2331 Banka Chanan 1.502 165634 0.0024 2.374 42.73 46.29 56.97 70.03 86.64 302.6632 Banka Dhuraiya 1.234 239762 0.0025 2.509 45.16 48.92 60.21 74.01 91.57 319.8633 Banka Katoria 1.557 186646 0.0025 2.541 45.74 49.56 60.99 74.97 92.76 324.0134 Banka Phulidumar 1.277 125251 0.0019 1.935 34.82 37.73 46.43 57.07 70.62 246.6835 Banka Rajaun 0.972 197601 0.0020 2.023 36.42 39.45 48.56 59.69 73.85 257.9736 Banka Shambhuga 0.897 173974 0.0018 1.822 32.79 35.52 43.72 53.74 66.49 232.2737 Begusarai Bachhwara 0.834 195815 0.0019 1.878 33.80 36.61 45.06 55.39 68.53 239.3938 Begusarai Bakhri 0.878 100054 0.0014 1.405 25.28 27.39 33.71 41.43 51.27 179.0839 Begusarai Balia 0.682 134628 0.0014 1.398 25.16 27.25 33.54 41.23 51.01 178.2040 Begusarai Barauni 0.034 205462 0.0011 1.140 20.52 22.23 27.36 33.64 41.62 145.3741 Begusarai Begusarai 0.146 288001 0.0017 1.694 30.50 33.04 40.67 49.99 61.85 216.0442 Begusarai Bhagwanpu 0.734 172676 0.0017 1.654 29.77 32.25 39.70 48.79 60.37 210.8943 Begusarai Birpur 0.778 97467 0.0013 1.292 23.26 25.19 31.01 38.11 47.16 164.7344 Begusarai Cheria Baria 0.690 146680 0.0015 1.470 26.47 28.67 35.29 43.38 53.67 187.4845 Begusarai Chhorahi 1.016 124191 0.0017 1.671 30.08 32.59 40.11 49.30 60.99 213.0646 Begusarai Dandari 1.102 77256 0.0015 1.503 27.06 29.31 36.07 44.34 54.86 191.6547 Begusarai Garhpura 1.101 111108 0.0017 1.685 30.32 32.85 40.43 49.70 61.49 214.7948 Begusarai Khudaband 0.837 90358 0.0013 1.312 23.62 25.59 31.50 38.71 47.90 167.3249 Begusarai Mansurchak 0.438 80510 0.0009 0.865 15.58 16.88 20.77 25.53 31.59 110.3450 Begusarai Matihani 0.660 152725 0.0015 1.474 26.53 28.74 35.37 43.48 53.79 187.91
Devolved FundsWeightage*1000
S.NO. DISTT. Block UDI Population Weightage
Explanation: Col-3: Under Development Index (UDI) as computed in Chapter-IV Col-4: Population (2011) of as reported by Census 2011. Col-5: Weightage computed based on formula given in Box 9.1. Col-6: Col-5 * 1000. Col-7: Distribution of devolved funds for the FY 2015-16 based on the Col-5. e.g- Devolved funds for Karpi = Weightage * Total Devolution of funds in BPs for 15-16. Col-8 to Col-11: Similarly computed as Col-8 for respective years.
Contd. 5th SFC (2015-20)
Annexure-9.2(B)
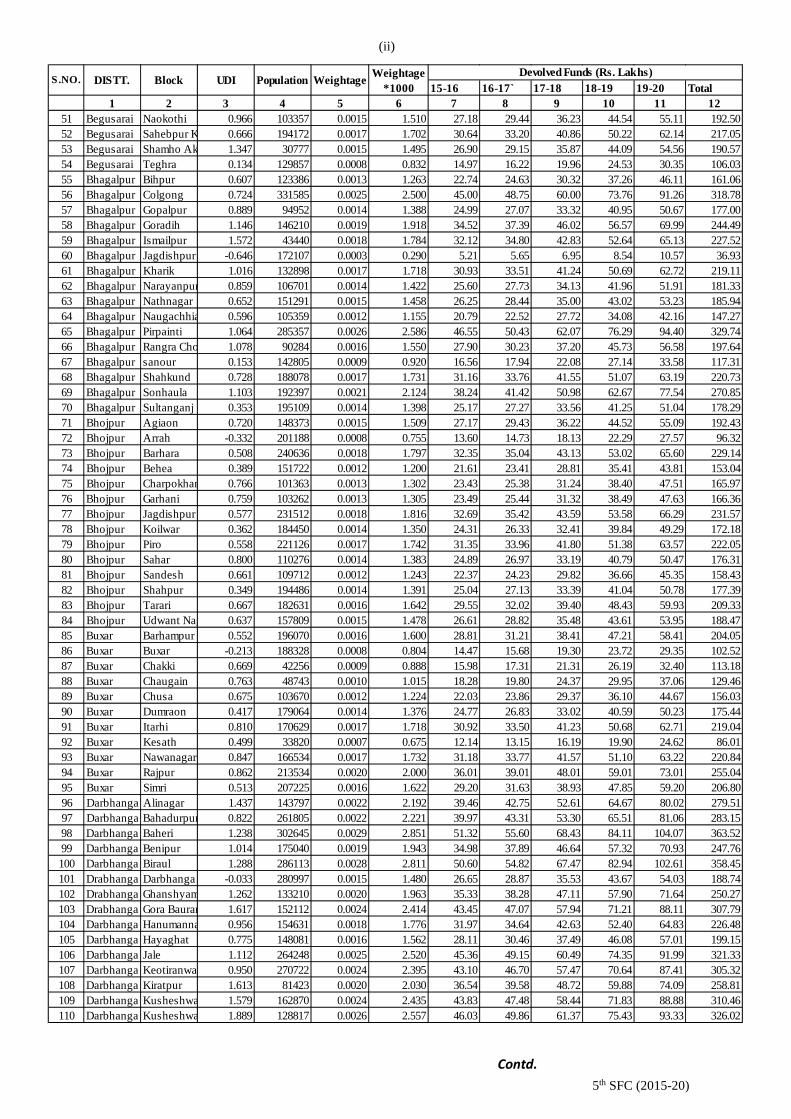
15-16 16-17` 17-18 18-19 19-20 Total1 2 3 4 5 6 7 8 9 10 11 12
51 Begusarai Naokothi 0.966 103357 0.0015 1.510 27.18 29.44 36.23 44.54 55.11 192.5052 Begusarai Sahebpur K 0.666 194172 0.0017 1.702 30.64 33.20 40.86 50.22 62.14 217.0553 Begusarai Shamho Ak 1.347 30777 0.0015 1.495 26.90 29.15 35.87 44.09 54.56 190.5754 Begusarai Teghra 0.134 129857 0.0008 0.832 14.97 16.22 19.96 24.53 30.35 106.0355 Bhagalpur Bihpur 0.607 123386 0.0013 1.263 22.74 24.63 30.32 37.26 46.11 161.0656 Bhagalpur Colgong 0.724 331585 0.0025 2.500 45.00 48.75 60.00 73.76 91.26 318.7857 Bhagalpur Gopalpur 0.889 94952 0.0014 1.388 24.99 27.07 33.32 40.95 50.67 177.0058 Bhagalpur Goradih 1.146 146210 0.0019 1.918 34.52 37.39 46.02 56.57 69.99 244.4959 Bhagalpur Ismailpur 1.572 43440 0.0018 1.784 32.12 34.80 42.83 52.64 65.13 227.5260 Bhagalpur Jagdishpur -0.646 172107 0.0003 0.290 5.21 5.65 6.95 8.54 10.57 36.9361 Bhagalpur Kharik 1.016 132898 0.0017 1.718 30.93 33.51 41.24 50.69 62.72 219.1162 Bhagalpur Narayanpur 0.859 106701 0.0014 1.422 25.60 27.73 34.13 41.96 51.91 181.3363 Bhagalpur Nathnagar 0.652 151291 0.0015 1.458 26.25 28.44 35.00 43.02 53.23 185.9464 Bhagalpur Naugachhia 0.596 105359 0.0012 1.155 20.79 22.52 27.72 34.08 42.16 147.2765 Bhagalpur Pirpainti 1.064 285357 0.0026 2.586 46.55 50.43 62.07 76.29 94.40 329.7466 Bhagalpur Rangra Cho 1.078 90284 0.0016 1.550 27.90 30.23 37.20 45.73 56.58 197.6467 Bhagalpur sanour 0.153 142805 0.0009 0.920 16.56 17.94 22.08 27.14 33.58 117.3168 Bhagalpur Shahkund 0.728 188078 0.0017 1.731 31.16 33.76 41.55 51.07 63.19 220.7369 Bhagalpur Sonhaula 1.103 192397 0.0021 2.124 38.24 41.42 50.98 62.67 77.54 270.8570 Bhagalpur Sultanganj 0.353 195109 0.0014 1.398 25.17 27.27 33.56 41.25 51.04 178.2971 Bhojpur Agiaon 0.720 148373 0.0015 1.509 27.17 29.43 36.22 44.52 55.09 192.4372 Bhojpur Arrah -0.332 201188 0.0008 0.755 13.60 14.73 18.13 22.29 27.57 96.3273 Bhojpur Barhara 0.508 240636 0.0018 1.797 32.35 35.04 43.13 53.02 65.60 229.1474 Bhojpur Behea 0.389 151722 0.0012 1.200 21.61 23.41 28.81 35.41 43.81 153.0475 Bhojpur Charpokhar 0.766 101363 0.0013 1.302 23.43 25.38 31.24 38.40 47.51 165.9776 Bhojpur Garhani 0.759 103262 0.0013 1.305 23.49 25.44 31.32 38.49 47.63 166.3677 Bhojpur Jagdishpur 0.577 231512 0.0018 1.816 32.69 35.42 43.59 53.58 66.29 231.5778 Bhojpur Koilwar 0.362 184450 0.0014 1.350 24.31 26.33 32.41 39.84 49.29 172.1879 Bhojpur Piro 0.558 221126 0.0017 1.742 31.35 33.96 41.80 51.38 63.57 222.0580 Bhojpur Sahar 0.800 110276 0.0014 1.383 24.89 26.97 33.19 40.79 50.47 176.3181 Bhojpur Sandesh 0.661 109712 0.0012 1.243 22.37 24.23 29.82 36.66 45.35 158.4382 Bhojpur Shahpur 0.349 194486 0.0014 1.391 25.04 27.13 33.39 41.04 50.78 177.3983 Bhojpur Tarari 0.667 182631 0.0016 1.642 29.55 32.02 39.40 48.43 59.93 209.3384 Bhojpur Udwant Nag 0.637 157809 0.0015 1.478 26.61 28.82 35.48 43.61 53.95 188.4785 Buxar Barhampur 0.552 196070 0.0016 1.600 28.81 31.21 38.41 47.21 58.41 204.0586 Buxar Buxar -0.213 188328 0.0008 0.804 14.47 15.68 19.30 23.72 29.35 102.5287 Buxar Chakki 0.669 42256 0.0009 0.888 15.98 17.31 21.31 26.19 32.40 113.1888 Buxar Chaugain 0.763 48743 0.0010 1.015 18.28 19.80 24.37 29.95 37.06 129.4689 Buxar Chusa 0.675 103670 0.0012 1.224 22.03 23.86 29.37 36.10 44.67 156.0390 Buxar Dumraon 0.417 179064 0.0014 1.376 24.77 26.83 33.02 40.59 50.23 175.4491 Buxar Itarhi 0.810 170629 0.0017 1.718 30.92 33.50 41.23 50.68 62.71 219.0492 Buxar Kesath 0.499 33820 0.0007 0.675 12.14 13.15 16.19 19.90 24.62 86.0193 Buxar Nawanagar 0.847 166534 0.0017 1.732 31.18 33.77 41.57 51.10 63.22 220.8494 Buxar Rajpur 0.862 213534 0.0020 2.000 36.01 39.01 48.01 59.01 73.01 255.0495 Buxar Simri 0.513 207225 0.0016 1.622 29.20 31.63 38.93 47.85 59.20 206.8096 Darbhanga Alinagar 1.437 143797 0.0022 2.192 39.46 42.75 52.61 64.67 80.02 279.5197 Darbhanga Bahadurpur 0.822 261805 0.0022 2.221 39.97 43.31 53.30 65.51 81.06 283.1598 Darbhanga Baheri 1.238 302645 0.0029 2.851 51.32 55.60 68.43 84.11 104.07 363.5299 Darbhanga Benipur 1.014 175040 0.0019 1.943 34.98 37.89 46.64 57.32 70.93 247.76100 Darbhanga Biraul 1.288 286113 0.0028 2.811 50.60 54.82 67.47 82.94 102.61 358.45101 Drabhanga Darbhanga -0.033 280997 0.0015 1.480 26.65 28.87 35.53 43.67 54.03 188.74102 Drabhanga Ghanshyam 1.262 133210 0.0020 1.963 35.33 38.28 47.11 57.90 71.64 250.27103 Drabhanga Gora Bauram 1.617 152112 0.0024 2.414 43.45 47.07 57.94 71.21 88.11 307.79104 Darbhanga Hanumanna 0.956 154631 0.0018 1.776 31.97 34.64 42.63 52.40 64.83 226.48105 Darbhanga Hayaghat 0.775 148081 0.0016 1.562 28.11 30.46 37.49 46.08 57.01 199.15106 Darbhanga Jale 1.112 264248 0.0025 2.520 45.36 49.15 60.49 74.35 91.99 321.33107 Darbhanga Keotiranwa 0.950 270722 0.0024 2.395 43.10 46.70 57.47 70.64 87.41 305.32108 Darbhanga Kiratpur 1.613 81423 0.0020 2.030 36.54 39.58 48.72 59.88 74.09 258.81109 Darbhanga Kusheshwa 1.579 162870 0.0024 2.435 43.83 47.48 58.44 71.83 88.88 310.46110 Darbhanga Kusheshwa 1.889 128817 0.0026 2.557 46.03 49.86 61.37 75.43 93.33 326.02
S.NO. DISTT. Block UDI Population Weightage Weightage*1000
Devolved Funds (Rs. Lakhs)
Contd. 5th SFC (2015-20)
(ii)

15-16 16-17` 17-18 18-19 19-20 Total1 2 3 4 5 6 7 8 9 10 11 12
111 Darbhanga Manigachh 0.981 228618 0.0022 2.199 39.58 42.88 52.78 64.87 80.27 280.39112 Darbhanga Singhwara 0.957 267601 0.0024 2.385 42.94 46.51 57.25 70.37 87.07 304.14113 Darbhanga Tardih 1.123 123299 0.0018 1.772 31.90 34.56 42.53 52.28 64.68 225.94114 E. ChamparaAreraj 0.668 137909 0.0014 1.402 25.23 27.33 33.64 41.35 51.16 178.70115 E. ChamparaChakia 0.900 276809 0.0024 2.379 42.81 46.38 57.08 70.17 86.82 303.26116 E. ChamparaMotihari 0.438 237818 0.0017 1.712 30.82 33.39 41.10 50.52 62.50 218.33117 E. ChamparaRaxual 0.907 176492 0.0018 1.845 33.22 35.98 44.29 54.44 67.36 235.28118 E. ChamparaAdapur 1.418 203513 0.0025 2.495 44.90 48.64 59.87 73.59 91.05 318.06119 E. ChamparaBanjaria 1.238 162684 0.0021 2.098 37.76 40.90 50.34 61.88 76.56 267.44120 E. ChamparaBankatwa 1.445 116863 0.0021 2.055 36.99 40.07 49.32 60.63 75.01 262.03121 E. ChamparaChiraria 1.367 195590 0.0024 2.402 43.23 46.83 57.64 70.85 87.66 306.20122 E. ChamparaDhaka 1.151 276081 0.0026 2.622 47.20 51.14 62.94 77.36 95.72 334.36123 E. ChamparaGhorasahan 1.234 174864 0.0022 2.159 38.86 42.10 51.81 63.69 78.80 275.25124 E. ChamparaHarsidhi 1.230 222551 0.0024 2.412 43.42 47.03 57.89 71.15 88.04 307.53125 E. ChamparaKalyanpur 1.124 267568 0.0026 2.550 45.90 49.73 61.20 75.23 93.08 325.15126 E. ChamparaKesaria 1.102 175595 0.0020 2.033 36.59 39.64 48.79 59.97 74.19 259.17127 E. ChamparaKotwa 1.215 168788 0.0021 2.108 37.94 41.10 50.58 62.17 76.93 268.72128 E. ChamparaMadhuban 1.263 143250 0.0020 2.018 36.32 39.35 48.43 59.53 73.65 257.29129 E. ChamparaMehsi 1.164 147145 0.0019 1.940 34.93 37.84 46.57 57.24 70.83 247.40130 E. ChamparaNarkatia 1.324 170758 0.0022 2.226 40.06 43.40 53.42 65.66 81.24 283.78131 E. ChamparaPaharpur 1.242 183018 0.0022 2.211 39.80 43.12 53.07 65.23 80.71 281.93132 E. ChamparaPakri Dayal 1.308 116634 0.0019 1.919 34.53 37.41 46.04 56.60 70.03 244.61133 E. ChamparaPatahi 1.289 166445 0.0022 2.168 39.03 42.29 52.04 63.97 79.15 276.48134 E. ChamparaPhenhara 1.149 80329 0.0016 1.566 28.19 30.54 37.59 46.20 57.16 199.68135 E. ChamparaPiprakothi 1.089 77089 0.0015 1.489 26.80 29.04 35.74 43.93 54.35 189.86136 E. ChamparaRamgarhwa 1.302 200998 0.0024 2.367 42.60 46.15 56.80 69.81 86.38 301.74137 E. ChamparaSugauli 1.271 191992 0.0023 2.288 41.18 44.61 54.90 67.48 83.50 291.67138 E. ChamparaTetaria 1.455 102808 0.0020 1.989 35.80 38.79 47.74 58.68 72.60 253.61139 E. ChamparaSangrampur 0.942 144071 0.0017 1.705 30.69 33.24 40.92 50.29 62.23 217.37140 Gopalganj Baikunthpu 0.913 217165 0.0021 2.070 37.27 40.37 49.69 61.08 75.57 263.99141 Gopalganj Barauli 0.833 221999 0.0020 2.017 36.31 39.33 48.41 59.50 73.62 257.17142 Gopalganj Bhorey 0.864 178199 0.0018 1.812 32.61 35.32 43.48 53.44 66.12 230.97143 Gopalganj Bijaipur 0.839 133038 0.0015 1.544 27.79 30.10 37.05 45.54 56.35 196.83144 Gopalganj Gopalganj 0.196 152188 0.0010 1.013 18.23 19.75 24.30 29.87 36.96 129.10145 Gopalganj Hathua 0.550 221804 0.0017 1.737 31.27 33.88 41.70 51.25 63.41 221.51146 Gopalganj Katiya 0.661 110637 0.0012 1.248 22.46 24.33 29.95 36.81 45.54 159.09147 Gopalganj Kuchaikote 0.631 332041 0.0024 2.411 43.39 47.01 57.86 71.12 87.99 307.38148 Gopalganj Manjha 0.736 199452 0.0018 1.800 32.40 35.10 43.19 53.09 65.69 229.47149 Gopalganj Pach Deuri 0.882 99933 0.0014 1.408 25.35 27.46 33.80 41.55 51.41 179.58150 Gopalganj Phulwaria 0.529 130801 0.0012 1.226 22.06 23.90 29.42 36.16 44.74 156.29151 Gopalganj Sidhwalia 1.027 141563 0.0018 1.775 31.96 34.62 42.61 52.38 64.81 226.37152 Gopalganj Thawe 0.412 116106 0.0010 1.031 18.56 20.11 24.75 30.42 37.64 131.49153 Gopalganj Uchkagaon 0.428 151437 0.0012 1.238 22.28 24.13 29.70 36.51 45.17 157.80154 Jamui Barhat 1.091 92207 0.0016 1.573 28.32 30.67 37.75 46.41 57.42 200.57155 Jamui Chakai 1.451 235188 0.0027 2.698 48.57 52.62 64.76 79.60 98.49 344.03156 Jamui Gidhapur 0.848 77558 0.0013 1.254 22.57 24.46 30.10 37.00 45.78 159.90157 Jamui Islamnagar 1.127 136768 0.0018 1.849 33.28 36.05 44.37 54.54 67.48 235.73158 Jamui Jamui 0.543 144757 0.0013 1.316 23.68 25.65 31.57 38.81 48.02 167.73159 Jamui Jhajha 0.745 226858 0.0020 1.957 35.22 38.16 46.96 57.73 71.42 249.49160 Jamui Khaira 1.008 235761 0.0023 2.264 40.74 44.14 54.33 66.78 82.62 288.60161 Jamui Lakshmipur 1.089 124149 0.0017 1.743 31.38 34.00 41.84 51.43 63.63 222.28162 Jamui Sikandara 1.099 148711 0.0019 1.885 33.93 36.76 45.24 55.61 68.80 240.33163 Jamui Sono 1.094 210445 0.0022 2.213 39.83 43.15 53.11 65.28 80.77 282.13164 Jehanabad Ghoshi 0.734 108130 0.0013 1.306 23.51 25.47 31.35 38.53 47.67 166.52165 Jehanabad Hulasganj 0.675 94485 0.0012 1.175 21.15 22.92 28.20 34.67 42.89 149.83166 Jehanabad Jehanabad 0.277 151551 0.0011 1.089 19.61 21.24 26.15 32.14 39.76 138.90167 Jehanabad Kako 0.876 173487 0.0018 1.798 32.37 35.06 43.15 53.04 65.63 229.26168 Jehanabad Makhdump 0.797 228160 0.0020 2.015 36.27 39.29 48.36 59.44 73.54 256.89169 Jehanabad Modanganj 0.982 87718 0.0014 1.442 25.95 28.11 34.60 42.53 52.62 183.81170 Jehanabad Ratni Faridp 0.870 146586 0.0016 1.648 29.66 32.14 39.55 48.62 60.15 210.12
Weightage*1000
Devolved Funds (Rs. Lakhs)S.NO. DISTT. Block UDI Population Weightage
Contd. 5th SFC (2015-20)
(iii)

15-16 16-17` 17-18 18-19 19-20 Total1 2 3 4 5 6 7 8 9 10 11 12
171 Kaimur Bhabua 0.570 251261 0.0019 1.916 34.48 37.36 45.98 56.51 69.92 244.24172 Kaimur Bhagwanpu 0.933 91113 0.0014 1.411 25.40 27.52 33.87 41.63 51.51 179.93173 Kaimur Chainpur 1.090 187692 0.0021 2.086 37.55 40.67 50.06 61.53 76.13 265.94174 Kaimur chand 1.015 133682 0.0017 1.721 30.98 33.56 41.30 50.77 62.81 219.42175 Kaimur Durgawati 0.711 136962 0.0014 1.439 25.90 28.06 34.53 42.45 52.52 183.45176 Kaimur Kudra 0.414 165145 0.0013 1.298 23.36 25.30 31.14 38.28 47.36 165.43177 Kaimur Mohania 0.515 225181 0.0017 1.721 30.98 33.56 41.30 50.77 62.81 219.42178 Kaimur Nuoan 0.695 106530 0.0013 1.259 22.67 24.56 30.23 37.15 45.97 160.58179 Kaimur Adhaura 1.632 57100 0.0019 1.917 34.51 37.39 46.01 56.56 69.98 244.45180 kaimur Ramgarh 0.563 132663 0.0013 1.269 22.85 24.75 30.47 37.45 46.33 161.85181 Kaimur Rampur 0.910 88876 0.0014 1.376 24.77 26.83 33.03 40.59 50.23 175.45182 Katihar Amdabad 1.406 167398 0.0023 2.289 41.20 44.64 54.94 67.53 83.55 291.85183 Katihar Azamnagar 1.568 315610 0.0032 3.246 58.43 63.30 77.91 95.76 118.48 413.89184 Katihar Balrampur 1.606 158976 0.0024 2.441 43.93 47.59 58.57 72.00 89.08 311.17185 Katihar Barari 1.391 285381 0.0029 2.909 52.36 56.72 69.81 85.81 106.18 370.89186 Katihar Barsoi 1.658 344133 0.0035 3.489 62.80 68.03 83.73 102.92 127.34 444.82187 Katihar Dandkhora 1.300 68055 0.0016 1.649 29.69 32.16 39.58 48.66 60.20 210.29188 Katihar Falka 1.527 155663 0.0023 2.345 42.21 45.73 56.28 69.18 85.59 298.98189 Katihar hasanganj 1.329 55906 0.0016 1.612 29.02 31.44 38.69 47.56 58.84 205.55190 Katihar Kadwa 1.418 346902 0.0033 3.267 58.81 63.71 78.41 96.38 119.25 416.56191 Katihar Katihar -0.282 95556 0.0002 0.236 4.25 4.60 5.66 6.96 8.61 30.09192 Katihar Kohra 1.409 282813 0.0029 2.913 52.43 56.80 69.91 85.93 106.32 371.39193 Katihar Kursela 0.974 63928 0.0013 1.305 23.49 25.44 31.32 38.49 47.63 166.37194 Katihar Manihari 1.261 164778 0.0021 2.131 38.36 41.55 51.14 62.86 77.78 271.70195 Katihar Mansahi 1.378 84257 0.0018 1.813 32.64 35.36 43.52 53.49 66.18 231.19196 Katihar Pranpur 1.401 144297 0.0022 2.160 38.88 42.11 51.83 63.71 78.83 275.36197 Katihar Sameli 1.275 84486 0.0017 1.713 30.84 33.41 41.12 50.54 62.53 218.44198 E. ChamparaTurkaulia 1.202 180366 0.0022 2.157 38.83 42.06 51.77 63.63 78.73 275.03199 Gaya Amas 0.762 105027 0.0013 1.318 23.72 25.70 31.63 38.87 48.10 168.02200 Gaya Atri 1.119 82296 0.0015 1.547 27.84 30.16 37.12 45.63 56.46 197.21201 Gaya Banke Baza 1.005 129624 0.0017 1.690 30.42 32.95 40.56 49.85 61.68 215.47202 Gaya Barachatti 1.073 142534 0.0018 1.826 32.88 35.62 43.84 53.88 66.67 232.88203 Gaya Belaganj 0.753 222003 0.0019 1.939 34.90 37.81 46.53 57.19 70.76 247.19204 Gaya Bodh Gaya 0.879 197804 0.0019 1.932 34.77 37.67 46.37 56.99 70.51 246.32205 Gaya Dhobi 1.202 155413 0.0020 2.022 36.40 39.44 48.54 59.66 73.82 257.85206 Gaya Dumaria 1.199 128699 0.0019 1.876 33.77 36.58 45.02 55.34 68.47 239.18207 Gaya Fatehpur 1.216 235612 0.0025 2.468 44.43 48.13 59.24 72.81 90.09 314.71208 Gaya Gaya Town -0.668 178342 0.0003 0.301 5.42 5.88 7.23 8.89 11.00 38.41209 Gaya Guraru 0.744 139379 0.0015 1.485 26.73 28.96 35.64 43.81 54.20 189.34210 Gaya Gurua 0.924 184286 0.0019 1.904 34.26 37.12 45.69 56.16 69.48 242.71211 Gaya Imamganj 1.051 192812 0.0021 2.075 37.35 40.46 49.80 61.21 75.73 264.55212 Gaya Khizirsarai 0.975 176048 0.0019 1.910 34.37 37.24 45.83 56.33 69.70 243.47213 Gaya Konch 0.807 201920 0.0019 1.884 33.91 36.73 45.21 55.57 68.76 240.17214 Gaya Manpur 1.015 148418 0.0018 1.800 32.41 35.11 43.21 53.11 65.72 229.56215 Gaya Mohanpur 1.348 200149 0.0024 2.408 43.34 46.95 57.78 71.03 87.88 306.98216 Gaya Muhra 1.216 100820 0.0017 1.743 31.37 33.98 41.83 51.41 63.61 222.21217 Gaya Neemchak B 1.070 98603 0.0016 1.586 28.56 30.94 38.08 46.80 57.91 202.28218 Gaya Paraiya 0.903 101969 0.0014 1.440 25.92 28.08 34.57 42.49 52.57 183.63219 Gaya Sherghati 0.616 114759 0.0012 1.226 22.07 23.91 29.42 36.17 44.75 156.32220 Gaya Tan Kuppa 1.333 124940 0.0020 1.988 35.79 38.77 47.71 58.65 72.57 253.48221 Gaya Tikari 0.601 239187 0.0019 1.881 33.85 36.68 45.14 55.48 68.65 239.81222 Gaya Wazirganj 20.995 221731 0.0219 21.910 394.37 427.24 525.83 646.33 799.70 2793.48223 Khargaria Alauli 1.608 282127 0.0031 3.106 55.90 60.56 74.53 91.61 113.35 395.96224 Khargaria Beldaur 1.488 200223 0.0025 2.546 45.83 49.65 61.10 75.10 92.93 324.60225 Khargaria Chautham 1.171 153831 0.0020 1.983 35.70 38.68 47.60 58.51 72.40 252.89226 Khagaria Gogri 0.769 279017 0.0023 2.261 40.70 44.09 54.27 66.71 82.54 288.31227 Khagaria Khargaria 0.763 331952 0.0025 2.540 45.72 49.53 60.96 74.93 92.71 323.86228 Khargaria Mansi 0.707 88511 0.0012 1.174 21.14 22.90 28.19 34.64 42.86 149.73229 Khargaria Parbatta 0.757 244066 0.0021 2.061 37.09 40.18 49.45 60.79 75.21 262.73230 Kishanganj Bahadyrgan 1.263 216589 0.0024 2.413 43.43 47.05 57.91 71.18 88.06 307.62
S.NO. DISTT. Block UDI Population Weightage Weightage*1000
Devolved Funds (Rs. Lakhs)
Contd.
5th SFC (2015-20)
(iv)

15-16 16-17` 17-18 18-19 19-20 Total1 2 3 4 5 6 7 8 9 10 11 12
231 Kishanganj Dighalbank 1.633 208356 0.0027 2.733 49.19 53.29 65.59 80.62 99.75 348.43232 Kishanganj Kishanganj 0.531 135352 0.0013 1.253 22.55 24.43 30.07 36.96 45.73 159.75233 Kishanganj Kochadham 1.300 292124 0.0029 2.856 51.40 55.69 68.54 84.24 104.24 364.11234 Kishanganj Pothia 1.404 262494 0.0028 2.799 50.37 54.57 67.16 82.56 102.15 356.81235 Kishnaganj Terhagachh 1.595 141039 0.0023 2.334 42.00 45.51 56.01 68.84 85.18 297.53236 Kishanganj Thakurganj 1.417 273323 0.0029 2.869 51.65 55.95 68.87 84.65 104.73 365.85237 Lakhisarai Barahiya 0.448 85945 0.0009 0.904 16.28 17.64 21.71 26.68 33.01 115.31238 Lakhisarai Chanan 1.327 107144 0.0019 1.886 33.94 36.77 45.26 55.63 68.83 240.44239 Lakhisarai Halsi 1.236 115997 0.0018 1.845 33.20 35.97 44.27 54.41 67.33 235.18240 Lakhisarai Lakhisarai 0.348 121216 0.0010 0.996 17.92 19.41 23.89 29.37 36.34 126.94241 Lakhisarai Pipariya 0.907 51496 0.0012 1.172 21.10 22.86 28.13 34.58 42.79 149.46242 Lakhisarai Ramgarh Ch 1.051 85105 0.0015 1.495 26.91 29.15 35.88 44.10 54.57 190.62243 Lakhisarai Surajgarha 0.519 290998 0.0021 2.079 37.42 40.54 49.90 61.33 75.89 265.08244 Madhepura Alamnagar 1.586 175401 0.0025 2.509 45.17 48.93 60.22 74.02 91.59 319.93245 Madhepura Bihariganj 1.172 135534 0.0019 1.886 33.96 36.78 45.27 55.65 68.85 240.51246 Madhepura Chausa 1.509 152693 0.0023 2.311 41.59 45.06 55.46 68.17 84.34 294.62247 Madhepura Gamharia 1.441 82522 0.0019 1.866 33.59 36.38 44.78 55.04 68.10 237.90248 Madhepura Ghailarh 1.591 91818 0.0021 2.064 37.15 40.24 49.53 60.88 75.33 263.14249 Madhepura Gwalpara 1.423 126020 0.0021 2.082 37.48 40.60 49.97 61.43 76.00 265.48250 Madhepura Kishanganj 1.438 189159 0.0024 2.437 43.87 47.53 58.50 71.91 88.97 310.78251 Madhepura Kumarkhan 1.420 243629 0.0027 2.713 48.84 52.91 65.12 80.04 99.03 345.94252 Madhepura Madhepura 0.958 191375 0.0020 1.976 35.56 38.53 47.42 58.29 72.12 251.92253 Madhepura Murliganj 1.280 185631 0.0023 2.263 40.73 44.12 54.30 66.75 82.59 288.49254 Madhepura Puraini 1.518 104436 0.0021 2.060 37.08 40.16 49.43 60.76 75.18 262.62255 Madhepura Shankarpur 1.426 106222 0.0020 1.979 35.62 38.58 47.49 58.37 72.22 252.28256 Madhepura Singhehwar 1.278 134159 0.0020 1.983 35.70 38.68 47.60 58.51 72.40 252.89257 MadhubaniAnd hratha 1.134 191680 0.0022 2.151 38.73 41.95 51.63 63.47 78.53 274.31258 MadhubaniBabubarhi 1.273 217331 0.0024 2.426 43.67 47.31 58.23 71.57 88.55 309.33259 MadhubaniBasopatti 1.233 173499 0.0022 2.151 38.71 41.93 51.61 63.44 78.49 274.19260 MadhubaniBenipatti 0.945 361400 0.0029 2.878 51.81 56.13 69.08 84.91 105.06 367.00261 MadhubaniBifsi 1.178 320704 0.0029 2.890 52.01 56.35 69.35 85.24 105.47 368.42262 MadhubaniGhoghardih 1.233 174831 0.0022 2.158 38.85 42.08 51.79 63.66 78.77 275.15263 MadhubaniHarlakhi 1.307 196251 0.0023 2.346 42.23 45.75 56.30 69.21 85.63 299.12264 MadhubaniJainagar 1.067 171918 0.0020 1.979 35.61 38.58 47.49 58.37 72.22 252.27265 Madhubani Jhanjharpur 1.061 174930 0.0020 1.989 35.80 38.78 47.73 58.67 72.59 253.56266 MadhubaniKajauli 1.191 117282 0.0018 1.807 32.52 35.23 43.36 53.30 65.95 230.37267 MadhubaniKaluahi 1.068 143583 0.0018 1.827 32.89 35.63 43.86 53.91 66.70 232.98268 MadhubaniLadania 1.410 175561 0.0023 2.337 42.07 45.57 56.09 68.94 85.30 297.96269 MadhubaniLakhanpur 1.062 167841 0.0020 1.952 35.13 38.06 46.84 57.57 71.23 248.83270 MadhubaniLaukaha 1.411 212127 0.0025 2.534 45.62 49.42 60.82 74.76 92.50 323.13271 MadhubaniLaukahi 1.603 208317 0.0027 2.704 48.66 52.72 64.89 79.76 98.68 344.70272 MadhubaniMadhepur 1.337 267606 0.0028 2.760 49.69 53.83 66.25 81.43 100.75 351.94273 MadhubaniMadhubani 0.588 247856 0.0019 1.915 34.47 37.34 45.96 56.49 69.90 244.16274 MadhubaniMadhuwap 1.246 134704 0.0020 1.955 35.19 38.12 46.92 57.67 71.36 249.27275 MadhubaniPamdaul 0.795 270642 0.0022 2.242 40.35 43.72 53.81 66.14 81.83 285.84276 MadhubaniPhulparas 1.355 166018 0.0022 2.231 40.15 43.50 53.54 65.81 81.42 284.43277 MadhubaniRajnagar 0.954 246933 0.0023 2.271 40.88 44.29 54.50 67.00 82.89 289.56278 MuzzafarpuAurai 1.159 290545 0.0027 2.708 48.74 52.80 64.99 79.88 98.83 345.24279 MuzzafarpuBandra 1.088 124057 0.0017 1.742 31.35 33.96 41.80 51.37 63.57 222.04280 MuzzafarpuBaruraj 0.905 378223 0.0029 2.930 52.74 57.13 70.32 86.43 106.94 373.55281 MuzzafarpuBochacha 1.135 245659 0.0024 2.442 43.96 47.63 58.62 72.05 89.15 311.41282 MuzzafarpuDholi 0.583 90490 0.0011 1.062 19.12 20.72 25.50 31.34 38.78 135.45283 MuzzafarpuGaighat 1.082 259719 0.0025 2.466 44.38 48.08 59.18 72.74 90.00 314.39284 MuzzafarpuKanti 0.426 247807 0.0018 1.755 31.58 34.22 42.11 51.76 64.05 223.72285 MuzzafarpuKatra 1.142 244823 0.0024 2.445 44.02 47.68 58.69 72.14 89.26 311.78286 MuzzafarpuKurhani 0.580 435676 0.0029 2.918 52.52 56.90 70.03 86.08 106.50 372.03287 MuzzafarpuMarwan 0.620 164858 0.0015 1.499 26.98 29.23 35.97 44.22 54.71 191.12288 MuzzafarpuMinapur 1.118 340925 0.0029 2.939 52.90 57.31 70.54 86.70 107.28 374.73289 MuzzafarpuMusahri -0.659 328611 0.0011 1.119 20.15 21.83 26.86 33.02 40.85 142.71290 MuzzafarpuParoo 0.835 361662 0.0028 2.771 49.88 54.03 66.50 81.74 101.14 353.30
Weightage*1000
Devolved Funds (Rs. Lakhs)S.NO. DISTT. Block UDI Population Weightage
(v)
Contd.
5th SFC (2015-20)

15-16 16-17` 17-18 18-19 19-20 Total1 2 3 4 5 6 7 8 9 10 11 12
291 MuzzafarpuSahebganj 0.898 218214 0.0021 2.061 37.11 40.20 49.47 60.81 75.24 262.83292 MuzzafarpuSakra 0.464 306833 0.0021 2.109 37.97 41.14 50.63 62.23 77.00 268.96293 MuzzafarpuSaraiya 0.745 331651 0.0025 2.520 45.37 49.15 60.49 74.35 92.00 321.36294 Munger Asarganj 0.467 74380 0.0009 0.861 15.49 16.79 20.66 25.39 31.42 109.75295 Munger Bariarpur 0.597 109359 0.0012 1.178 21.21 22.97 28.28 34.76 43.00 150.22296 Munger Dharhara 0.517 131753 0.0012 1.220 21.95 23.78 29.27 35.98 44.52 155.51297 Munger Jamalpur 102896 0.0006 0.554 9.97 10.80 13.30 16.34 20.22 70.64298 Munger Kharagpur 0.7207 180920 0.0017 1.685 30.34 32.86 40.45 49.72 61.51 214.87299 Munger Munger -0.4732 134089 0.0003 0.255 4.59 4.97 6.12 7.53 9.31 32.53300 Munger Sangrampur 0.7675 97729 0.0013 1.284 23.10 25.03 30.80 37.86 46.85 163.65301 Munger Tarapur 0.3527 110214 0.0009 0.941 16.95 18.36 22.60 27.77 34.36 120.04302 Munger Tetiha Bamb 0.8607 76303 0.0013 1.260 22.68 24.57 30.24 37.17 45.99 160.66303 Nalanda Asthawan 0.941 163938 0.0018 1.811 32.60 35.32 43.47 53.43 66.11 230.93304 Nalanda Ben 0.985 87387 0.0014 1.442 25.96 28.13 34.62 42.55 52.65 183.91305 Nalanda Bihar -0.0131 197221 0.0010 1.049 18.88 20.46 25.18 30.95 38.29 133.75306 Nalanda Bind 1.1605 61984 0.0015 1.479 26.62 28.84 35.49 43.62 53.98 188.55307 Nalanda Chandi 0.8945 152156 0.0017 1.702 30.63 33.19 40.85 50.21 62.12 216.99308 Nalanda Ekangarsara 0.577 171214 0.0015 1.491 26.84 29.08 35.79 43.99 54.43 190.13309 Nalanda Giriak 0.8415 96845 0.0014 1.352 24.33 26.36 32.44 39.88 49.34 172.35310 Nalanda Harnaut 0.9285 176140 0.0019 1.865 33.56 36.36 44.75 55.01 68.06 237.73311 Nalanda Hilsa 0.7736 146257 0.0016 1.551 27.92 30.24 37.22 45.75 56.61 197.73312 Nalanda Islampur 0.6915 196696 0.0017 1.741 31.35 33.96 41.79 51.37 63.56 222.03313 Nalanda Karai Parsur 1.1518 73951 0.0015 1.535 27.62 29.93 36.83 45.27 56.02 195.67314 Nalanda Katrisarai 0.9202 41821 0.0011 1.133 20.40 22.10 27.20 33.43 41.36 144.48315 Nalanda Nagar Naus 1.0613 94467 0.0016 1.556 28.01 30.34 37.34 45.90 56.79 198.37316 Nalanda Noorsarai 0.9741 172351 0.0019 1.889 34.01 36.84 45.34 55.73 68.95 240.87317 Nalanda Parbalpur 0.6575 70316 0.0010 1.027 18.49 20.03 24.66 30.31 37.50 130.99318 Nalanda Rahui 0.9972 144040 0.0018 1.760 31.67 34.31 42.23 51.91 64.22 224.34319 Nalanda Rajgir 0.6631 88596 0.0011 1.131 20.36 22.06 27.15 33.37 41.29 144.24320 Nalanda Sarmera 1.2814 97083 0.0018 1.787 32.17 34.85 42.89 52.72 65.23 227.85321 Nalanda Silao 0.7832 125575 0.0014 1.449 26.08 28.25 34.77 42.74 52.89 184.74322 Nalanda tharthari 0.9926 68393 0.0013 1.348 24.26 26.28 32.34 39.76 49.19 171.83323 Nawada Akbarpur 1.0787 237292 0.0023 2.342 42.16 45.67 56.21 69.09 85.49 298.61324 Nawada Gobindpur 1.1824 95454 0.0017 1.681 30.25 32.77 40.34 49.58 61.34 214.28325 Nawada Hisua 0.9282 108489 0.0015 1.500 27.00 29.25 36.00 44.25 54.75 191.25326 Nawada Kashi Chak 1.0352 71886 0.0014 1.408 25.35 27.47 33.80 41.55 51.41 179.58327 Nawada Kawakol 1.4613 143439 0.0022 2.214 39.86 43.18 53.14 65.32 80.82 282.31328 Nawada Meskaur 1.2904 94358 0.0018 1.781 32.06 34.74 42.75 52.55 65.02 227.12329 Nawada Nardiganj 1.2611 124716 0.0019 1.916 34.49 37.36 45.98 56.52 69.93 244.27330 Nawada Narhat 1.0271 112042 0.0016 1.617 29.10 31.53 38.80 47.69 59.01 206.13331 Nawada Nawada 0.3505 223462 0.0015 1.549 27.88 30.21 37.18 45.70 56.54 197.51332 Nawada Paribarawan 1.2428 183066 0.0022 2.212 39.82 43.13 53.09 65.25 80.74 282.03333 Nawada Rajauli 0.9895 136056 0.0017 1.709 30.76 33.32 41.01 50.41 62.38 217.89334 Nawada Roh 1.1623 162507 0.0020 2.022 36.39 39.43 48.52 59.64 73.80 257.79335 Nawada Sirdala 1.2339 178472 0.0022 2.178 39.21 42.48 52.28 64.26 79.51 277.76336 Nawada Warisaligan 0.9825 153067 0.0018 1.794 32.29 34.98 43.05 52.91 65.47 228.69337 Patna Athmalgola 0.7463 90964 0.0012 1.226 22.07 23.91 29.43 36.17 44.76 156.34338 Patna Bakhtiyapur 0.6258 179485 0.0016 1.584 28.51 30.89 38.01 46.73 57.81 201.95339 Patna Barh 0.2992 154878 0.0011 1.129 20.33 22.02 27.10 33.31 41.21 143.97340 Patna Belchhi 1.1125 66165 0.0015 1.454 26.17 28.35 34.90 42.89 53.07 185.38341 Patna Bihta 0.2139 213878 0.0014 1.363 24.53 26.57 32.70 40.20 49.74 173.74342 Patna Bikram 0.3201 147024 0.0011 1.108 19.94 21.60 26.58 32.67 40.42 141.21343 Patna Daniawan 0.867 75086 0.0013 1.260 22.68 24.57 30.23 37.16 45.98 160.62344 Patna dhanarua 1.0628 211376 0.0022 2.187 39.36 42.64 52.48 64.51 79.82 278.82345 Patna Dinapu-cum -0.5086 142301 0.0003 0.264 4.76 5.16 6.35 7.80 9.65 33.71346 Patna Dulhin Baza 0.69 124966 0.0014 1.354 24.37 26.40 32.49 39.93 49.41 172.60347 Patna Fatwa 0.5455 147047 0.0013 1.330 23.94 25.94 31.92 39.24 48.55 169.58348 Patna Ghoswari 1.3132 74898 0.0017 1.699 30.58 33.13 40.78 50.12 62.01 216.62349 Patna Khusrupur 0.7701 93773 0.0013 1.265 22.77 24.66 30.35 37.31 46.16 161.26350 Patna Maner 0.5574 228930 0.0018 1.783 32.09 34.76 42.78 52.59 65.07 227.29
S.NO. DISTT. Block UDI Population Weightage Weightage*1000
Devolved Funds (Rs. Lakhs)
Contd.
5th SFC (2015-20)
(vi)

15-16 16-17` 17-18 18-19 19-20 Total1 2 3 4 5 6 7 8 9 10 11 12
351 Patna Masaurhi 0.6515 181413 0.0016 1.620 29.15 31.58 38.87 47.78 59.12 206.51352 Patna Mokameh 0.224 141733 0.0010 0.984 17.72 19.19 23.62 29.03 35.92 125.48353 Patna Naubatpur 0.5167 178583 0.0015 1.471 26.49 28.69 35.31 43.41 53.71 187.61354 Patna Paliganj 0.7813 254904 0.0021 2.143 38.58 41.80 51.44 63.23 78.24 273.29355 Patna Pandarak 0.8868 154613 0.0017 1.708 30.74 33.30 40.98 50.37 62.32 217.71356 Patna Patna Rural -1.2887 86918 -0.0008 -0.804 -14.46 -15.67 -19.28 -23.70 -29.33 -102.45357 Patna Phulwari -0.3182 191389 0.0007 0.717 12.90 13.97 17.20 21.14 26.16 91.36358 Patna Punpun 0.9422 138143 0.0017 1.674 30.12 32.63 40.16 49.37 61.08 213.37359 Patna Sampatchak 0.3395 106866 0.0009 0.910 16.39 17.75 21.85 26.86 33.23 116.08360 Purnia Amour 1.6958 290559 0.0032 3.238 58.28 63.14 77.71 95.51 118.18 412.82361 Purnia Baisa 1.7607 193127 0.0028 2.777 49.99 54.15 66.65 81.93 101.37 354.09362 Purnia Baisi 1.707 227706 0.0029 2.910 52.39 56.75 69.85 85.86 106.23 371.07363 Purnia Banmankhi 1.3246 321079 0.0030 3.036 54.65 59.20 72.86 89.56 110.81 387.07364 Purnia Barhara 1.3202 209000 0.0024 2.428 43.70 47.35 58.27 71.63 88.62 309.57365 Purnia Bhawanipur 1.505 161720 0.0024 2.356 42.40 45.94 56.54 69.49 85.99 300.36366 Purnia Dagarua 1.564 221142 0.0027 2.734 49.21 53.31 65.61 80.65 99.79 348.58367 Purnia Dhamdaha 1.293 288084 0.0028 2.827 50.89 55.13 67.85 83.40 103.19 360.44368 Purnia Jalalgarh 1.4965 112951 0.0021 2.085 37.53 40.65 50.03 61.50 76.09 265.81369 Purnia Kasba 1.3122 157920 0.0021 2.145 38.61 41.83 51.48 63.28 78.29 273.50370 Purnia Krityanand 1.3335 230504 0.0026 2.557 46.02 49.86 61.37 75.43 93.33 326.01371 Purnia Purnia East 0.2051 163078 0.0011 1.080 19.45 21.07 25.93 31.87 39.44 137.76372 Purnia Rupauli 1.5461 234686 0.0028 2.789 50.21 54.39 66.94 82.28 101.81 355.62373 Purnia Srinagar 1.6285 110058 0.0022 2.199 39.59 42.89 52.79 64.88 80.28 280.43374 Rohtas Akhorhi Go 0.3846 120145 0.0010 1.026 18.48 20.02 24.63 30.28 37.46 130.87375 Rohtas Bikramganj 0.1176 115100 0.0007 0.736 13.24 14.35 17.66 21.71 26.86 93.81376 Rohtas Chenari 0.7088 131528 0.0014 1.408 25.34 27.45 33.78 41.52 51.38 179.47377 Rohtas Dawath 0.6267 89565 0.0011 1.101 19.81 21.46 26.42 32.47 40.17 140.33378 Rohtas Dehri -0.299 137783 0.0004 0.447 8.04 8.71 10.73 13.18 16.31 56.98379 Rohtas Dinara 0.5872 225468 0.0018 1.793 32.28 34.97 43.04 52.91 65.46 228.66380 Rohtas Karakat 0.3825 209284 0.0015 1.504 27.08 29.33 36.10 44.38 54.91 191.80381 Rohtas Kargahar 0.3811 225082 0.0016 1.588 28.58 30.97 38.11 46.85 57.96 202.47382 Rohtas Kochas 0.5237 170025 0.0014 1.432 25.78 27.93 34.37 42.25 52.28 182.61383 Rohtas Nasriganj 0.418 115117 0.0010 1.032 18.58 20.13 24.78 30.45 37.68 131.62384 Rohtas Nauhatta 0.9489 94065 0.0014 1.443 25.97 28.13 34.63 42.56 52.66 183.95385 Rohtas Nokha 0.4293 146025 0.0012 1.210 21.78 23.59 29.04 35.69 44.16 154.26386 Rohtas Rajpur 0.4641 75213 0.0009 0.863 15.53 16.83 20.71 25.46 31.50 110.02387 Rohtas Rohtas 0.2284 86049 0.0007 0.689 12.40 13.43 16.53 20.32 25.14 87.81388 Rohtas Sanjhauli 0.3357 62621 0.0007 0.668 12.03 13.03 16.04 19.72 24.40 85.22389 Rohtas Sasaram -0.2098 210875 0.0009 0.928 16.71 18.11 22.28 27.39 33.89 118.38390 Rohtas Sheosagar 0.5934 176080 0.0015 1.534 27.61 29.91 36.81 45.24 55.98 195.54391 Rohtas Suryapur 0.491 57529 0.0008 0.794 14.30 15.49 19.06 23.43 28.99 101.26392 Rohtas Tilouthu 0.24 109249 0.0008 0.825 14.85 16.09 19.80 24.34 30.11 105.20393 Saharsa Banma Itahr 1.4977 90943 0.0020 1.967 35.41 38.37 47.22 58.04 71.81 250.85394 Saharsa Kahara 0.1852 141805 0.0009 0.946 17.03 18.45 22.71 27.92 34.54 120.65395 Saharsa Mahishi 1.6065 206774 0.0027 2.699 48.57 52.62 64.76 79.61 98.50 344.06396 Saharsa Nauhatta 1.4321 161784 0.0023 2.284 41.12 44.54 54.82 67.38 83.37 291.23397 Saharsa Patarghat 1.2745 128322 0.0019 1.948 35.07 38.00 46.76 57.48 71.12 248.43398 Saharsa Salkhua 1.7478 132844 0.0024 2.440 43.92 47.58 58.56 71.98 89.05 311.08399 Saharsa Satar kataiy 1.2503 151060 0.0020 2.047 36.85 39.92 49.13 60.39 74.72 261.00400 Saharsa Saur Bazar 1.4255 214166 0.0026 2.560 46.07 49.91 61.43 75.51 93.43 326.36401 Saharsa Simri Bakhti 1.3497 280582 0.0028 2.843 51.17 55.43 68.22 83.86 103.75 362.43402 Saharsa sonbarsa 1.2677 235841 0.0025 2.521 45.37 49.15 60.50 74.36 92.01 321.39403 Samastipur Bibhutpur 1.0216 338149 0.0028 2.829 50.92 55.16 67.89 83.45 103.25 360.67404 Samastipur Bithan 1.5905 148565 0.0024 2.369 42.65 46.20 56.86 69.89 86.48 302.08405 Samastipur Dalsinghsar 0.7456 184956 0.0017 1.732 31.17 33.77 41.56 51.08 63.20 220.78406 Samastipur Hasanpur 1.1291 227421 0.0023 2.339 42.10 45.60 56.13 68.99 85.36 298.18407 Samastipur Kalyanpur 0.9276 310439 0.0026 2.587 46.56 50.44 62.08 76.31 94.42 329.82408 Samastipur Khanpur 1.2409 195729 0.0023 2.278 41.01 44.43 54.68 67.21 83.16 290.48409 Samastipur Mohanpur 1.0556 115032 0.0017 1.661 29.90 32.39 39.86 49.00 60.62 211.77410 Samastipur Mohiuddina 0.9676 184521 0.0019 1.948 35.07 37.99 46.76 57.47 71.11 248.41
Weightage*1000
Devolved Funds (Rs. Lakhs)S.NO. DISTT. Block UDI Population Weightage
Contd.
5th SFC (2015-20)
(vii)

15-16 16-17` 17-18 18-19 19-20 Total1 2 3 4 5 6 7 8 9 10 11 12
411 Samastipur Morwa 1.0388 186075 0.0020 2.027 36.48 39.52 48.65 59.79 73.98 258.43412 Samastipur Patori 0.8904 179956 0.0018 1.848 33.26 36.03 44.34 54.50 67.44 235.56413 Samastipur Pusa 0.3406 132932 0.0011 1.052 18.93 20.51 25.24 31.03 38.39 134.11414 Samastipur Roser 0.8357 169469 0.0017 1.737 31.27 33.87 41.69 51.24 63.40 221.48415 Samastipur Samastipur 0.0429 283174 0.0016 1.567 28.21 30.56 37.61 46.23 57.20 199.81416 Samastipur Sarairajan 0.9696 254835 0.0023 2.329 41.92 45.41 55.89 68.70 85.00 296.93417 Samastipur Shivaji Nag 1.21 193850 0.0022 2.238 40.28 43.64 53.70 66.01 81.68 285.31418 Samastipur Singhia 1.3959 210035 0.0025 2.508 45.15 48.91 60.20 73.99 91.55 319.80419 Samastipur Tajpur 0.5851 161626 0.0014 1.448 26.06 28.23 34.74 42.70 52.84 184.57420 Samastipur Ujiarpur 0.8727 297811 0.0025 2.465 44.36 48.06 59.15 72.71 89.96 314.25421 Samastipur Vidhyapati N 0.9906 152916 0.0018 1.801 32.41 35.12 43.22 53.12 65.73 229.60422 Samastipur Warisnagar 0.8462 216123 0.0020 1.999 35.98 38.97 47.97 58.96 72.95 254.83423 Saran Amnour 0.8671 200395 0.0019 1.935 34.82 37.72 46.43 57.07 70.61 246.66424 Saran Baniapur 0.7234 262673 0.0021 2.128 38.31 41.50 51.08 62.78 77.68 271.34425 Saran Chapra -0.1662 240287 0.0011 1.130 20.34 22.03 27.12 33.33 41.24 144.06426 Saran Dariapur 1.0376 296164 0.0026 2.619 47.13 51.06 62.84 77.25 95.58 333.86427 Saran Dighwara 0.391 96811 0.0009 0.907 16.33 17.69 21.77 26.76 33.11 115.65428 Saran Ekma 0.5275 214445 0.0017 1.675 30.15 32.67 40.20 49.42 61.14 213.58429 Saran Garkha 0.7861 268156 0.0022 2.220 39.95 43.28 53.27 65.48 81.01 282.99430 Saran Ishupur 0.8041 146822 0.0016 1.584 28.51 30.89 38.02 46.73 57.81 201.96431 Saran Jalalpur 0.515 174156 0.0014 1.446 26.03 28.20 34.70 42.65 52.78 184.35432 Saran Lahladpur 0.6612 79969 0.0011 1.083 19.49 21.12 25.99 31.95 39.53 138.08433 Saran Maker 1.011 84695 0.0015 1.454 26.16 28.34 34.89 42.88 53.06 185.33434 Saran Manjhi 0.4036 268073 0.0018 1.842 33.15 35.91 44.20 54.33 67.22 234.82435 Saran Marhaura 0.7468 235191 0.0020 2.003 36.06 39.06 48.08 59.10 73.12 255.42436 Saran Mashrakh 0.7746 188899 0.0018 1.781 32.07 34.74 42.75 52.55 65.02 227.13437 Saran Nagra 0.5787 124028 0.0012 1.239 22.30 24.16 29.73 36.55 45.22 157.95438 Saran Panapur 1.1217 121738 0.0018 1.762 31.72 34.36 42.29 51.99 64.32 224.69439 Saran Parsa 0.9505 155838 0.0018 1.777 31.99 34.65 42.65 52.42 64.86 226.56440 Saran Revelganj 0.2546 80621 0.0007 0.685 12.34 13.36 16.45 20.22 25.01 87.38441 Saran Sonepur 0.3843 232340 0.0016 1.630 29.34 31.79 39.13 48.09 59.50 207.86442 Saran Taraiya 0.8599 138721 0.0016 1.595 28.72 31.11 38.29 47.06 58.23 203.41443 Seohar Dumri Katsa 1.0911 93398 0.0016 1.579 28.43 30.80 37.91 46.59 57.65 201.38444 Seohar Piprarhi 1.1297 117948 0.0017 1.750 31.50 34.12 41.99 51.62 63.87 223.09445 Seohar Purnahiya 1.0101 91949 0.0015 1.492 26.85 29.09 35.80 44.01 54.45 190.20446 Seohar Seohar 0.8308 127142 0.0015 1.504 27.08 29.33 36.10 44.38 54.91 191.80447 Seohar Tariani Cho 1.1911 197693 0.0022 2.240 40.32 43.67 53.75 66.07 81.75 285.57448 Shekhpura Ariari 1.2121 112070 0.0018 1.799 32.39 35.09 43.19 53.08 65.68 229.43449 Shekhpura Barbigha 0.5096 90092 0.0010 0.988 17.78 19.26 23.71 29.14 36.06 125.96450 Sheikhpura Chewara 1.1805 73267 0.0016 1.559 28.07 30.41 37.42 46.00 56.91 198.81451 Sheikhpura Ghat Kusum 1.3251 48346 0.0016 1.568 28.22 30.57 37.63 46.25 57.22 199.89452 Sheikhpura Sheikhpura 0.6212 136084 0.0013 1.346 24.22 26.24 32.30 39.70 49.12 171.58453 Sheikhpura Shekhopur 0.6823 67481 0.0010 1.037 18.66 20.21 24.88 30.58 37.83 132.16454 Sitamarhi Bairgania 0.9917 89259 0.0015 1.459 26.26 28.45 35.02 43.04 53.26 186.04455 Sitamarhi Bajpatti 1.2901 215507 0.0024 2.433 43.80 47.45 58.40 71.78 88.82 310.25456 Sitamarhi Bathnaha 1.3736 262527 0.0028 2.769 49.84 53.99 66.45 81.68 101.07 353.04457 Sitamarhi Belsand 1.2895 100340 0.0018 1.813 32.63 35.35 43.50 53.47 66.16 231.11458 Sitamarhi Bokhara 1.3834 130886 0.0021 2.070 37.26 40.36 49.67 61.06 75.55 263.89459 Sitamarhi Charaut 1.2177 79310 0.0016 1.629 29.31 31.76 39.09 48.04 59.44 207.64460 Sitamarhi Dumra 0.673 354748 0.0026 2.574 46.34 50.20 61.78 75.94 93.96 328.21461 Sitamarhi Majorganj 1.3619 102785 0.0019 1.897 34.15 37.00 45.53 55.97 69.25 241.90462 Sitamarhi Nanpur 1.2904 182429 0.0023 2.256 40.60 43.98 54.13 66.54 82.33 287.58463 Sitamarhi Parihar 1.4809 338222 0.0033 3.282 59.08 64.01 78.78 96.83 119.81 418.50464 Sitamarhi Parsauni 1.4145 86016 0.0019 1.859 33.46 36.25 44.61 54.84 67.85 237.00465 Sitamarhi Pupri 1.0316 156473 0.0019 1.860 33.49 36.28 44.65 54.88 67.90 237.20466 Sitamarhi Riga 1.1208 206979 0.0022 2.220 39.97 43.30 53.29 65.50 81.04 283.10467 Sitamarhi Runisaidpu 1.2208 372579 0.0032 3.211 57.79 62.61 77.06 94.72 117.19 409.37468 Sitamarhi Sonbrsa 1.3628 251248 0.0027 2.698 48.56 52.60 64.74 79.58 98.46 343.93469 Sitamarhi Suppi 1.2451 122239 0.0019 1.887 33.96 36.79 45.28 55.66 68.87 240.56470 Sitamarhi Sursand 1.208 209945 0.0023 2.322 41.80 45.29 55.74 68.51 84.77 296.10
S.NO. DISTT. Block UDI Population Weightage Weightage*1000
Devolved Funds (Rs. Lakhs)
Contd. 5th SFC (2015-20)
(viii)
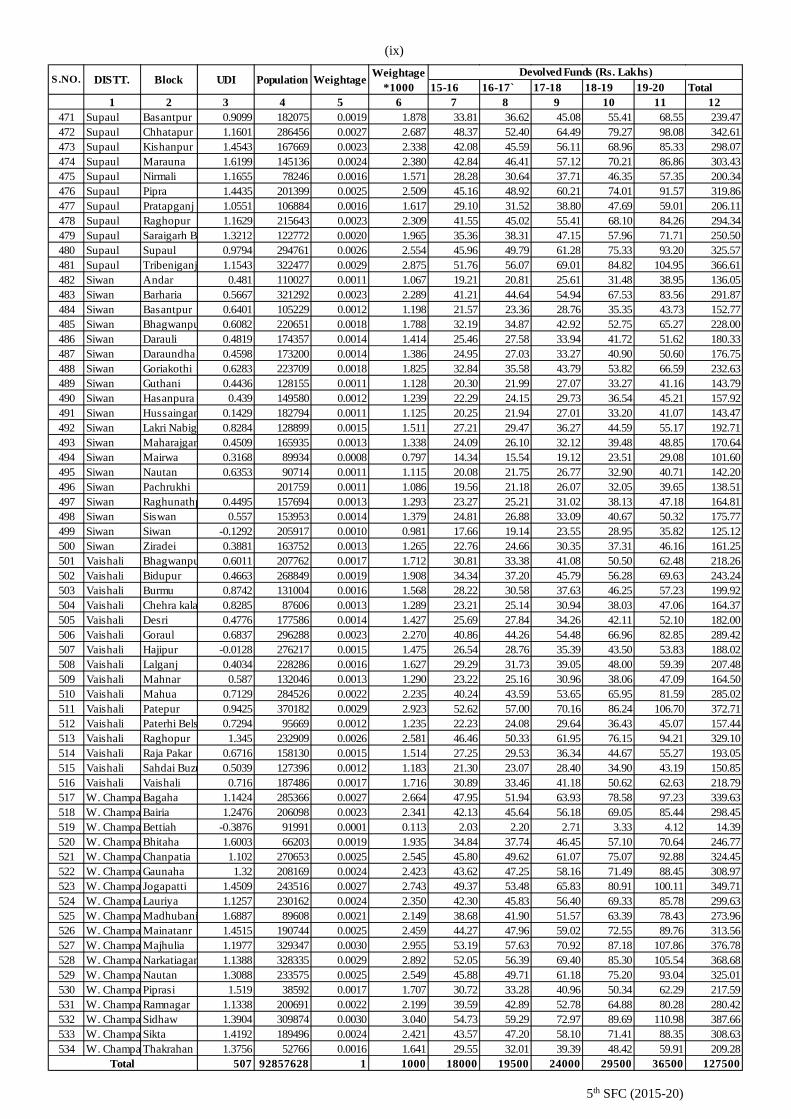
15-16 16-17` 17-18 18-19 19-20 Total1 2 3 4 5 6 7 8 9 10 11 12
471 Supaul Basantpur 0.9099 182075 0.0019 1.878 33.81 36.62 45.08 55.41 68.55 239.47472 Supaul Chhatapur 1.1601 286456 0.0027 2.687 48.37 52.40 64.49 79.27 98.08 342.61473 Supaul Kishanpur 1.4543 167669 0.0023 2.338 42.08 45.59 56.11 68.96 85.33 298.07474 Supaul Marauna 1.6199 145136 0.0024 2.380 42.84 46.41 57.12 70.21 86.86 303.43475 Supaul Nirmali 1.1655 78246 0.0016 1.571 28.28 30.64 37.71 46.35 57.35 200.34476 Supaul Pipra 1.4435 201399 0.0025 2.509 45.16 48.92 60.21 74.01 91.57 319.86477 Supaul Pratapganj 1.0551 106884 0.0016 1.617 29.10 31.52 38.80 47.69 59.01 206.11478 Supaul Raghopur 1.1629 215643 0.0023 2.309 41.55 45.02 55.41 68.10 84.26 294.34479 Supaul Saraigarh B 1.3212 122772 0.0020 1.965 35.36 38.31 47.15 57.96 71.71 250.50480 Supaul Supaul 0.9794 294761 0.0026 2.554 45.96 49.79 61.28 75.33 93.20 325.57481 Supaul Tribeniganj 1.1543 322477 0.0029 2.875 51.76 56.07 69.01 84.82 104.95 366.61482 Siwan Andar 0.481 110027 0.0011 1.067 19.21 20.81 25.61 31.48 38.95 136.05483 Siwan Barharia 0.5667 321292 0.0023 2.289 41.21 44.64 54.94 67.53 83.56 291.87484 Siwan Basantpur 0.6401 105229 0.0012 1.198 21.57 23.36 28.76 35.35 43.73 152.77485 Siwan Bhagwanpu 0.6082 220651 0.0018 1.788 32.19 34.87 42.92 52.75 65.27 228.00486 Siwan Darauli 0.4819 174357 0.0014 1.414 25.46 27.58 33.94 41.72 51.62 180.33487 Siwan Daraundha 0.4598 173200 0.0014 1.386 24.95 27.03 33.27 40.90 50.60 176.75488 Siwan Goriakothi 0.6283 223709 0.0018 1.825 32.84 35.58 43.79 53.82 66.59 232.63489 Siwan Guthani 0.4436 128155 0.0011 1.128 20.30 21.99 27.07 33.27 41.16 143.79490 Siwan Hasanpura 0.439 149580 0.0012 1.239 22.29 24.15 29.73 36.54 45.21 157.92491 Siwan Hussaingan 0.1429 182794 0.0011 1.125 20.25 21.94 27.01 33.20 41.07 143.47492 Siwan Lakri Nabig 0.8284 128899 0.0015 1.511 27.21 29.47 36.27 44.59 55.17 192.71493 Siwan Maharajgan 0.4509 165935 0.0013 1.338 24.09 26.10 32.12 39.48 48.85 170.64494 Siwan Mairwa 0.3168 89934 0.0008 0.797 14.34 15.54 19.12 23.51 29.08 101.60495 Siwan Nautan 0.6353 90714 0.0011 1.115 20.08 21.75 26.77 32.90 40.71 142.20496 Siwan Pachrukhi 201759 0.0011 1.086 19.56 21.18 26.07 32.05 39.65 138.51497 Siwan Raghunathp 0.4495 157694 0.0013 1.293 23.27 25.21 31.02 38.13 47.18 164.81498 Siwan Siswan 0.557 153953 0.0014 1.379 24.81 26.88 33.09 40.67 50.32 175.77499 Siwan Siwan -0.1292 205917 0.0010 0.981 17.66 19.14 23.55 28.95 35.82 125.12500 Siwan Ziradei 0.3881 163752 0.0013 1.265 22.76 24.66 30.35 37.31 46.16 161.25501 Vaishali Bhagwanpu 0.6011 207762 0.0017 1.712 30.81 33.38 41.08 50.50 62.48 218.26502 Vaishali Bidupur 0.4663 268849 0.0019 1.908 34.34 37.20 45.79 56.28 69.63 243.24503 Vaishali Burmu 0.8742 131004 0.0016 1.568 28.22 30.58 37.63 46.25 57.23 199.92504 Vaishali Chehra kala 0.8285 87606 0.0013 1.289 23.21 25.14 30.94 38.03 47.06 164.37505 Vaishali Desri 0.4776 177586 0.0014 1.427 25.69 27.84 34.26 42.11 52.10 182.00506 Vaishali Goraul 0.6837 296288 0.0023 2.270 40.86 44.26 54.48 66.96 82.85 289.42507 Vaishali Hajipur -0.0128 276217 0.0015 1.475 26.54 28.76 35.39 43.50 53.83 188.02508 Vaishali Lalganj 0.4034 228286 0.0016 1.627 29.29 31.73 39.05 48.00 59.39 207.48509 Vaishali Mahnar 0.587 132046 0.0013 1.290 23.22 25.16 30.96 38.06 47.09 164.50510 Vaishali Mahua 0.7129 284526 0.0022 2.235 40.24 43.59 53.65 65.95 81.59 285.02511 Vaishali Patepur 0.9425 370182 0.0029 2.923 52.62 57.00 70.16 86.24 106.70 372.71512 Vaishali Paterhi Bels 0.7294 95669 0.0012 1.235 22.23 24.08 29.64 36.43 45.07 157.44513 Vaishali Raghopur 1.345 232909 0.0026 2.581 46.46 50.33 61.95 76.15 94.21 329.10514 Vaishali Raja Pakar 0.6716 158130 0.0015 1.514 27.25 29.53 36.34 44.67 55.27 193.05515 Vaishali Sahdai Buzu 0.5039 127396 0.0012 1.183 21.30 23.07 28.40 34.90 43.19 150.85516 Vaishali Vaishali 0.716 187486 0.0017 1.716 30.89 33.46 41.18 50.62 62.63 218.79517 W. Champa Bagaha 1.1424 285366 0.0027 2.664 47.95 51.94 63.93 78.58 97.23 339.63518 W. Champa Bairia 1.2476 206098 0.0023 2.341 42.13 45.64 56.18 69.05 85.44 298.45519 W. Champa Bettiah -0.3876 91991 0.0001 0.113 2.03 2.20 2.71 3.33 4.12 14.39520 W. Champa Bhitaha 1.6003 66203 0.0019 1.935 34.84 37.74 46.45 57.10 70.64 246.77521 W. Champa Chanpatia 1.102 270653 0.0025 2.545 45.80 49.62 61.07 75.07 92.88 324.45522 W. Champa Gaunaha 1.32 208169 0.0024 2.423 43.62 47.25 58.16 71.49 88.45 308.97523 W. Champa Jogapatti 1.4509 243516 0.0027 2.743 49.37 53.48 65.83 80.91 100.11 349.71524 W. Champa Lauriya 1.1257 230162 0.0024 2.350 42.30 45.83 56.40 69.33 85.78 299.63525 W. Champa Madhubani 1.6887 89608 0.0021 2.149 38.68 41.90 51.57 63.39 78.43 273.96526 W. Champa Mainatanr 1.4515 190744 0.0025 2.459 44.27 47.96 59.02 72.55 89.76 313.56527 W. Champa Majhulia 1.1977 329347 0.0030 2.955 53.19 57.63 70.92 87.18 107.86 376.78528 W. Champa Narkatiagan 1.1388 328335 0.0029 2.892 52.05 56.39 69.40 85.30 105.54 368.68529 W. Champa Nautan 1.3088 233575 0.0025 2.549 45.88 49.71 61.18 75.20 93.04 325.01530 W. Champa Piprasi 1.519 38592 0.0017 1.707 30.72 33.28 40.96 50.34 62.29 217.59531 W. Champa Ramnagar 1.1338 200691 0.0022 2.199 39.59 42.89 52.78 64.88 80.28 280.42532 W. Champa Sidhaw 1.3904 309874 0.0030 3.040 54.73 59.29 72.97 89.69 110.98 387.66533 W. Champa Sikta 1.4192 189496 0.0024 2.421 43.57 47.20 58.10 71.41 88.35 308.63534 W. Champa Thakrahan 1.3756 52766 0.0016 1.641 29.55 32.01 39.39 48.42 59.91 209.28
507 92857628 1 1000 18000 19500 24000 29500 36500 127500
Weightage*1000
Devolved Funds (Rs. Lakhs)
Total
S .NO. DISTT. Block UDI Population Weightage
5th SFC (2015-20)
(ix)

Distribution of Devolved funds among Nagar Nigams (Rs. Cr.)
15-16 16-17 17-18 18-19 19-20 TOTAL1 2 3 4 5 6 7 8 9 10 11 12 13
1 Patna Patna 108.34 1684297 0.208 0.162 162.170 123.25 209.20 258.66 319.47 395.69 1306.282 Nalanda Bihar Shariff 23.5 297268 0.037 0.029 28.791 21.88 37.14 45.92 56.72 70.25 231.923 Bhojpur Arrah 30.97 261430 0.033 0.026 25.719 19.55 33.18 41.02 50.67 62.75 207.174 Gays Gaya 50.17 474093 0.059 0.046 46.409 35.27 59.87 74.02 91.43 113.24 373.825 Bhagalpur Bhagalpur 30.17 400146 0.050 0.039 38.699 29.41 49.92 61.72 76.24 94.43 311.726 Muzzaffarpur Muzzaffarpur 26.43 354462 0.044 0.034 34.269 26.04 44.21 54.66 67.51 83.62 276.047 Darbhanga Darbhanga 19.18 296039 0.036 0.029 28.509 21.67 36.78 45.47 56.16 69.56 229.648 Katihar Katihar 24.54 240838 0.030 0.024 23.539 17.89 30.37 37.54 46.37 57.43 189.619 Begusarai Begusarai 8.98 252008 0.031 0.024 23.984 18.23 30.94 38.26 47.25 58.52 193.1910 Purnea Purnea 44.52 282248 0.036 0.028 28.196 21.43 36.37 44.97 55.55 68.80 227.1211 Munger Munger 17.5 213303 0.026 0.021 20.684 15.72 26.68 32.99 40.75 50.47 166.61
384.3 4756132 0.590 0.461 460.970 350 595 735 908 1125 3713Total
Normalized Weightage*
1000
Devolved FundSl. No. Nagar Nigams
Area (Sq Km)
Popu. (2011)
WeightageDistrictNormalized Weightage
Annexure-9.3(A)
*Grants amount would depends on need of each ULBs in followings: (i) Manpower, (ii) e-Governance, (iii) Training, (iv) Office Spaces, (v) Developing Model Cities and Towns, (vi) Incentives for ARM, (vii) Overall Performance, (viii)Regulatory Bodies. Explanation: Col-3: Area (Sq. Km) of ULBs as reported by UDD Col-4: Population (2011) of ULBs as reported by UDD Col-5: Weightage computed based on formula given in Box 9.2 Col-6: Normalized weightage. e.g.- for Patna = Weightage of Patna(i.e. 0.208) ÷ Weightage of Total ULBs (i.e. 1.2802 = 0.590+0.268+0.329) Col-7: Col-6 * 1000 Col-8: Distribution of devolved funds for the FY 2015-16 based on the Col-6. e.g- Devolved funds for Patna = Normalized weightage * Total Devolution of funds in ULBs for 15-16 Col-9 to Col-12: Similarly computed as Col-8 for respective years
5th SFC (2015-20)

Distribution of Devolved funds among Nagar Parishads (Rs. Cr.)
15-16 16-17 17-18 18-19 19-20 TOTAL1 2 3 4 5 6 7 8 9 10 11 12 13
1 Patna Barh 4.5 61470 0.007 0.005 5.171 3.93 6.67 8.25 10.19 12.62 41.652 Patna Khagaul 5.32 44364 0.005 0.004 3.812 2.90 4.92 6.08 7.51 9.30 30.713 Patna Danapur 11.63 182429 0.020 0.015 15.279 11.61 19.71 24.37 30.10 37.28 123.084 Patna Mokama 14.18 60678 0.007 0.005 5.481 4.17 7.07 8.74 10.80 13.37 44.155 Patna Masaurhi 9.43 59803 0.007 0.005 5.226 3.97 6.74 8.34 10.30 12.75 42.106 Patna Phulwari Sharif 6.48 81740 0.009 0.007 6.895 5.24 8.89 11.00 13.58 16.82 55.547 Buxur Buxur 5.16 102861 0.011 0.009 8.561 6.51 11.04 13.65 16.87 20.89 68.968 Buxur Dumraon 15.33 53618 0.006 0.005 4.952 3.76 6.39 7.90 9.76 12.08 39.899 Rohtash Sasaram 10.9 147408 0.016 0.012 12.404 9.43 16.00 19.78 24.44 30.27 99.9210 Rohtash Dehri Dalmiya N 21.32 137231 0.015 0.012 11.980 9.11 15.45 19.11 23.60 29.23 96.5011 Kaimur Bhabhua 7.12 50179 0.006 0.004 4.355 3.31 5.62 6.95 8.58 10.63 35.0812 Nalanda Hilsa 12.67 51052 0.006 0.005 4.640 3.53 5.99 7.40 9.14 11.32 37.3813 Jehanabad Jehanabad 20.23 103202 0.012 0.009 9.172 6.97 11.83 14.63 18.07 22.38 73.8814 Aurangabad Aurangabad 21.33 102244 0.012 0.009 9.137 6.94 11.79 14.57 18.00 22.29 73.6015 Nawada Nawada 5.68 98029 0.010 0.008 8.188 6.22 10.56 13.06 16.13 19.98 65.9616 Arval Arval* 24.43 51849 0.007 0.005 5.160 3.92 6.66 8.23 10.17 12.59 41.5717 Sitamarhi Sitamarhi 7.77 67818 0.007 0.006 5.814 4.42 7.50 9.27 11.45 14.19 46.8318 Vaisali Hajipur 19.64 147688 0.016 0.013 12.765 9.70 16.47 20.36 25.15 31.15 102.8319 E.champaran Motihari 13.89 126158 0.014 0.011 10.793 8.20 13.92 17.21 21.26 26.33 86.9420 E.champaran Raxaul 5.82 55536 0.006 0.005 4.740 3.60 6.11 7.56 9.34 11.56 38.1821 W.champaran Bettiah 8.01 132209 0.014 0.011 11.057 8.40 14.26 17.64 21.78 26.98 89.0622 W.champaran Bagaha 46.83 112634 0.014 0.011 10.968 8.34 14.15 17.49 21.61 26.76 88.3523 W.champaran Narkatiaganj 10.96 49507 0.006 0.004 4.449 3.38 5.74 7.10 8.76 10.85 35.8324 Bhagalpur Sultanganj 12.29 52892 0.006 0.005 4.775 3.63 6.16 7.62 9.41 11.65 38.4625 Darbhanga Benipur* 46.02 75317 0.010 0.008 7.904 6.01 10.20 12.61 15.57 19.28 63.6626 Madhubani Madhubani 2.52 75736 0.008 0.006 6.254 4.75 8.07 9.98 12.32 15.26 50.3827 Samastipur Samastipur 3.45 67925 0.007 0.006 5.655 4.30 7.29 9.02 11.14 13.80 45.5528 Munger Jamalpur 10.65 105434 0.011 0.009 8.983 6.83 11.59 14.33 17.70 21.92 72.3629 Lakisarai Lakhisarai 24.79 99979 0.012 0.009 9.087 6.91 11.72 14.49 17.90 22.17 73.1930 Sheikhpura Sheikhpura 15.58 62927 0.007 0.006 5.718 4.35 7.38 9.12 11.26 13.95 46.0631 Jamui Jamui 26.45 87357 0.010 0.008 8.125 6.17 10.48 12.96 16.01 19.82 65.4532 Khagaria Khagaria 2.97 49406 0.005 0.004 4.131 3.14 5.33 6.59 8.14 10.08 33.2833 Begusarai Beehat* 23.45 67952 0.008 0.006 6.431 4.89 8.30 10.26 12.67 15.69 51.8034 Saran Chapra 16.96 202352 0.022 0.017 17.105 13.00 22.07 27.28 33.70 41.74 137.7835 Siwan Siwan 13.05 135066 0.015 0.011 11.484 8.73 14.81 18.32 22.62 28.02 92.5136 Gopalganj Gopalganj 11.11 67339 0.008 0.006 5.904 4.49 7.62 9.42 11.63 14.41 47.5637 Saharsa Saharsa 21.13 156540 0.017 0.014 13.543 10.29 17.47 21.60 26.68 33.04 109.0938 Madhepura Madhepura 25.84 54472 0.007 0.005 5.428 4.13 7.00 8.66 10.69 13.24 43.7239 Saupaul Supaul 22.37 65437 0.008 0.006 6.185 4.70 7.98 9.87 12.18 15.09 49.8240 Araria Araria 30.97 79021 0.010 0.008 7.622 5.79 9.83 12.16 15.02 18.60 61.4041 Araria Forbesganj 4.98 50475 0.005 0.004 4.296 3.26 5.54 6.85 8.46 10.48 34.6042 Kishanganj Kishanganj 30.12 105782 0.013 0.010 9.765 7.42 12.60 15.57 19.24 23.83 78.65
653.33 3741116 0.422 0.329 329 250 425 525 649 804 2653
Sl. No.
Nagar Parisads
Area (Sq Km)
Popu. (2011)
Weightage Normalized Weightage
Devolved FundNormalized Weightage*
1000District
Total
5th SFC (2015-20)
Annexure-9.3(B)

Distribution of Devolved funds among Nagar Panchayats (Rs. Cr.)
15-16 16-17 17-18 18-19 19-20 TOTAL
1 2 3 4 5 6 7 8 9 10 11 12 131 Patna Fatwah 4.9 50961 0.004 0.003 3.376 2.57 4.36 5.39 6.65 8.24 27.202 Patna Maner 12 40068 0.004 0.003 2.970 2.26 3.83 4.74 5.85 7.25 23.923 Patna Bakhtiarpur 13.18 47897 0.004 0.004 3.505 2.66 4.52 5.59 6.91 8.55 28.234 Patna Khusrupur 4.23 15731 0.001 0.001 1.147 0.87 1.48 1.83 2.26 2.80 9.245 Patna Bikram* 13.99 22486 0.002 0.002 1.948 1.48 2.51 3.11 3.84 4.75 15.696 Rohtas kochas 24795 0.002 0.002 1.550 1.18 2.00 2.47 3.05 3.78 12.497 Patna Naubatpur* 14.39 25011 0.003 0.002 2.121 1.61 2.74 3.38 4.18 5.17 17.088 Bhojpur Piro 6.47 33785 0.003 0.002 2.363 1.80 3.05 3.77 4.66 5.77 19.039 Bhojpur Behea 4.06 26707 0.002 0.002 1.827 1.39 2.36 2.91 3.60 4.46 14.7210 Bhojpur Jagdishpur 25.63 32447 0.004 0.003 3.021 2.30 3.90 4.82 5.95 7.37 24.3311 Bhojpur Koilwar 5.6 17725 0.002 0.001 1.325 1.01 1.71 2.11 2.61 3.23 10.6712 Bhojpur Shahpur 11.04 17767 0.002 0.002 1.538 1.17 1.98 2.45 3.03 3.75 12.3913 Rohtas Bikramganj 15.64 48465 0.005 0.004 3.636 2.76 4.69 5.80 7.16 8.87 29.2914 Rohtas Koath 5.87 18890 0.002 0.001 1.408 1.07 1.82 2.25 2.77 3.44 11.3415 Rohtas Nokha 13.45 27302 0.003 0.002 2.228 1.69 2.87 3.55 4.39 5.44 17.9416 Rohtas Nasriganj 8.69 23819 0.002 0.002 1.826 1.39 2.36 2.91 3.60 4.45 14.7117 Nalanda Islampur 6 35641 0.003 0.002 2.461 1.87 3.17 3.93 4.85 6.00 19.8218 Nalanda Silao 9 25674 0.003 0.002 1.954 1.48 2.52 3.12 3.85 4.77 15.7419 Nalanda Rajgir 50.18 41587 0.006 0.005 4.543 3.45 5.86 7.25 8.95 11.08 36.5920 Jahanabad Makhdumpur 23.47 31994 0.004 0.003 2.909 2.21 3.75 4.64 5.73 7.10 23.4321 Gaya Bodh Gaya 19.58 38439 0.004 0.003 3.161 2.40 4.08 5.04 6.23 7.71 25.4722 Gaya Sherghati 10.79 40666 0.004 0.003 2.960 2.25 3.82 4.72 5.83 7.22 23.8523 Gaya Tikari 2.66 21324 0.002 0.001 1.436 1.09 1.85 2.29 2.83 3.50 11.5724 Aurangabad Rafiganj 4.56 35536 0.003 0.002 2.399 1.82 3.09 3.83 4.73 5.85 19.3225 Aurangabad Nabinagar 17.42 23984 0.003 0.002 2.174 1.65 2.80 3.47 4.28 5.30 17.5126 Aurangabad Daudnagar 13.96 52364 0.005 0.004 3.815 2.90 4.92 6.08 7.51 9.31 30.7327 Nawada Warisaliganj 31.11 34056 0.004 0.003 3.334 2.53 4.30 5.32 6.57 8.13 26.8528 Nawada Hisua 6.33 32585 0.003 0.002 2.283 1.73 2.94 3.64 4.50 5.57 18.3929 Vaishali Mahuaa 25964 0.002 0.002 1.624 1.23 2.09 2.59 3.20 3.96 13.0830 Bhagalpur Naugachhia 11.24 49069 0.004 0.004 3.503 2.66 4.52 5.59 6.90 8.55 28.2231 Bhagalpur Kahalgaon 0.63 33700 0.003 0.002 2.132 1.62 2.75 3.40 4.20 5.20 17.1732 Banka Banka 18.87 45977 0.005 0.004 3.605 2.74 4.65 5.75 7.10 8.80 29.0433 Banka Amarpur 11.18 25336 0.003 0.002 2.017 1.53 2.60 3.22 3.97 4.92 16.2534 Sitamarhi Bairgania 14.32 42895 0.004 0.003 3.236 2.46 4.18 5.16 6.38 7.90 26.0735 Sitamarhi Belsand 10.09 20566 0.002 0.002 1.677 1.27 2.16 2.67 3.30 4.09 13.5036 Sitamarhi Dumra 2.28 15674 0.001 0.001 1.068 0.81 1.38 1.70 2.10 2.61 8.6137 Sitamarhi Janakpur Road 3.1 15129 0.001 0.001 1.066 0.81 1.38 1.70 2.10 2.60 8.5938 Muzzaffarpur Motipur 12.77 28572 0.003 0.002 2.281 1.73 2.94 3.64 4.49 5.57 18.3739 Muzzaffarpur Kanti 16.16 25051 0.003 0.002 2.192 1.67 2.83 3.50 4.32 5.35 17.6640 Muzzaffarpur Sahebganj 9.81 23224 0.002 0.002 1.832 1.39 2.36 2.92 3.61 4.47 14.7641 vaishali Lalganj 7.86 37098 0.003 0.003 2.624 1.99 3.38 4.19 5.17 6.40 21.1442 vaishali Mahnar Bazar 10.02 48293 0.004 0.003 3.408 2.59 4.40 5.44 6.71 8.31 27.4543 Sheohar Sheohar 9.33 28116 0.003 0.002 2.119 1.61 2.73 3.38 4.17 5.17 17.0744 E.champaran Chakia 6.23 20686 0.002 0.002 1.535 1.17 1.98 2.45 3.02 3.74 12.3645 E.champaran Sugauli 19.25 38815 0.004 0.003 3.172 2.41 4.09 5.06 6.25 7.74 25.5546 E.champaran Dhaka 12.93 42063 0.004 0.003 3.131 2.38 4.04 4.99 6.17 7.64 25.2247 E.champaran Areraj 13.7 26014 0.003 0.002 2.157 1.64 2.78 3.44 4.25 5.26 17.3748 E.champaran Kesaria 17.1 18984 0.002 0.002 1.849 1.41 2.39 2.95 3.64 4.51 14.8949 E.champaran Mahesi 7.16 25995 0.002 0.002 1.903 1.45 2.45 3.03 3.75 4.64 15.3350 E.champaran Pakaridayal* 19.13 29582 0.003 0.003 2.590 1.97 3.34 4.13 5.10 6.32 20.86
S.NoNagar
PanchayatsArea
(Sq Km)Population (2011) Weightage
Normalized Weightage
Normalized Weightage*
1000District
Devolved Fund
Contd. 5th SFC (2015-20)
Annexure-9.3(C)

15-16 16-17 17-18 18-19 19-20 TOTAL1 2 3 4 5 6 7 8 9 10 11 12 13
51 Kaimur Mohniya 32221 0.003 0.002 2.015 1.53 2.60 3.21 3.97 4.92 16.2352 W.champaran Chanpatia 7.57 27095 0.003 0.002 1.987 1.51 2.56 3.17 3.91 4.85 16.0153 W.champaran Ramnagar 16.2 48411 0.005 0.004 3.654 2.78 4.71 5.83 7.20 8.92 29.4354 Madhubani Jainagar 1.55 21782 0.002 0.001 1.422 1.08 1.83 2.27 2.80 3.47 11.4555 Madhubani Jhanjharpur 12.44 30590 0.003 0.002 2.394 1.82 3.09 3.82 4.72 5.84 19.2956 Madhubani Ghoghardiha 8.73 18257 0.002 0.001 1.479 1.12 1.91 2.36 2.91 3.61 11.9257 Samastipur Dalsinghsarai 2.94 23862 0.002 0.002 1.606 1.22 2.07 2.56 3.16 3.92 12.9458 Samastipur Rosera 1.03 31155 0.003 0.002 1.988 1.51 2.56 3.17 3.92 4.85 16.0159 Munger Haweli Kharagp 9.74 31385 0.003 0.002 2.339 1.78 3.02 3.73 4.61 5.71 18.8460 Lakhisarai Barahiya 26.54 43032 0.005 0.004 3.718 2.83 4.80 5.93 7.32 9.07 29.9561 Jamui Jhajha 9.87 40646 0.004 0.003 2.924 2.22 3.77 4.66 5.76 7.13 23.5562 Sheikhpura Barbigha 15.6 46075 0.004 0.003 3.485 2.65 4.50 5.56 6.87 8.50 28.0763 Khagaria Gogari Jamalpur 9.49 37753 0.003 0.003 2.728 2.07 3.52 4.35 5.37 6.66 21.9764 Begusarai Bakhree* 10.65 40043 0.004 0.003 2.916 2.22 3.76 4.65 5.74 7.12 23.4965 Begusarai Tegharha* 15.8 56234 0.005 0.004 4.128 3.14 5.32 6.58 8.13 10.07 33.2566 Begusarai Balia* 14.74 47550 0.005 0.004 3.544 2.69 4.57 5.65 6.98 8.65 28.5567 Saran Sonepur 8.27 37776 0.003 0.003 2.682 2.04 3.46 4.28 5.28 6.54 21.6168 Saran Dighwara 13.27 32741 0.003 0.003 2.561 1.95 3.30 4.08 5.04 6.25 20.6369 Saran Madhaura 12.62 29932 0.003 0.002 2.360 1.79 3.04 3.76 4.65 5.76 19.0170 Saran Revelganj 12.48 39039 0.004 0.003 2.924 2.22 3.77 4.66 5.76 7.13 23.5571 Siwan Maharajganj 7.6 24282 0.002 0.002 1.812 1.38 2.34 2.89 3.57 4.42 14.6072 Siwan Mairwa 6.23 23565 0.002 0.002 1.715 1.30 2.21 2.73 3.38 4.18 13.8173 Gopalganj Mirganj 5.48 26240 0.002 0.002 1.853 1.41 2.39 2.96 3.65 4.52 14.9274 Gopalganj Barauli 22.21 41877 0.004 0.003 3.478 2.64 4.49 5.55 6.85 8.49 28.0275 Gopalganj Kataiya 12.06 20193 0.002 0.002 1.729 1.31 2.23 2.76 3.41 4.22 13.9376 Supaul Birpur 8.67 19932 0.002 0.002 1.582 1.20 2.04 2.52 3.12 3.86 12.7477 Supaul Nirmali 5.3 20189 0.002 0.001 1.468 1.12 1.89 2.34 2.89 3.58 11.8278 Madhepura Murliganj 14.07 28691 0.003 0.002 2.339 1.78 3.02 3.73 4.61 5.71 18.8479 Purnia Kasba 15.74 30421 0.003 0.003 2.511 1.91 3.24 4.01 4.95 6.13 20.2380 Purnia Banmankhi 20.15 30336 0.003 0.003 2.677 2.03 3.45 4.27 5.27 6.53 21.5681 Araria Jogbani 15.12 39281 0.004 0.003 3.041 2.31 3.92 4.85 5.99 7.42 24.5082 Kishanganj Baadurganj 29.17 36993 0.004 0.003 3.442 2.62 4.44 5.49 6.78 8.40 27.7383 Kishanganj Thakurganj 10.46 18348 0.002 0.002 1.552 1.18 2.00 2.48 3.06 3.79 12.5084 Katihar Manihari 11.31 26629 0.003 0.002 2.103 1.60 2.71 3.35 4.14 5.13 16.9485 Saran Parsa Bazar 36520 0.003 0.002 2.284 1.74 2.95 3.64 4.50 5.57 18.3986 Saran Ekama Bazar 30449 0.002 0.002 1.904 1.45 2.46 3.04 3.75 4.65 15.3487 Saharsa S.Bakhtiyarpur 21654 0.002 0.001 1.354 1.03 1.75 2.16 2.67 3.30 10.91
980.46 2745688 0.268 0.210 209.64 159 270 334 413 512 1689
Devolved FundArea (Sq Km)
Population (2011)
Weightage Normalized Weightage
Normalized Weightage*
1000
Total
S.NoDistrict Nagar Panchayats
5th SFC (2015-20)
(ii)
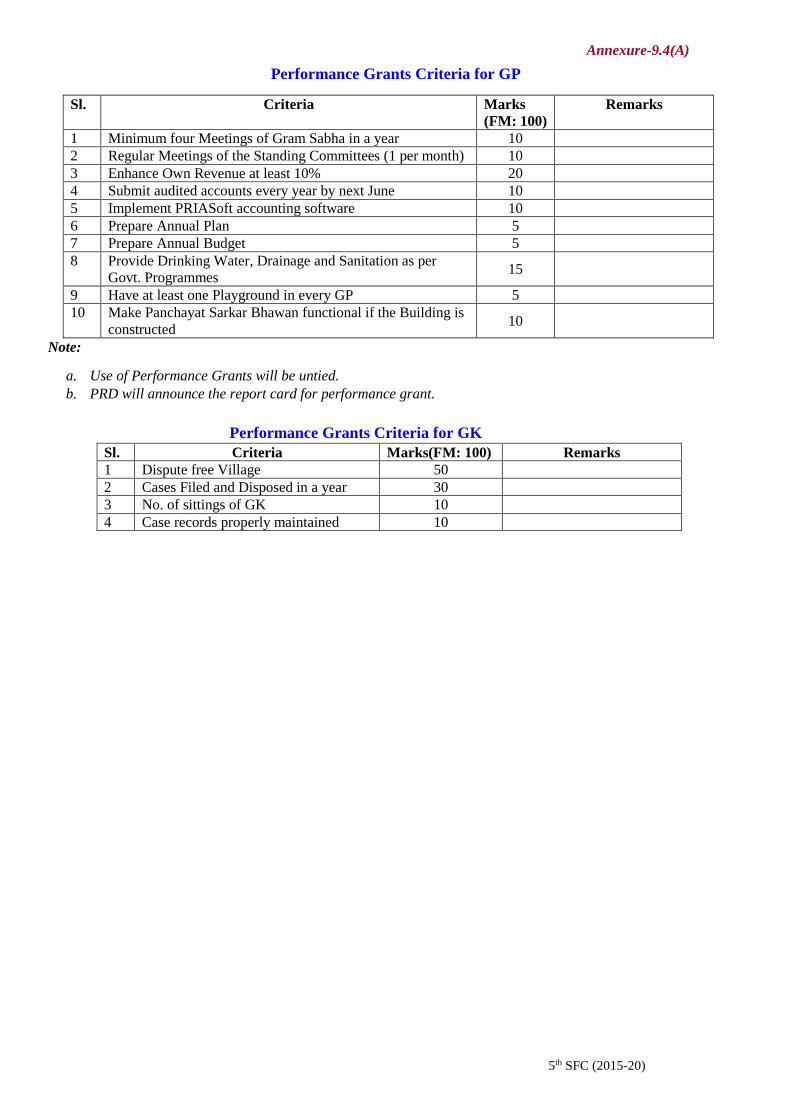
Performance Grants Criteria for GP
Sl. Criteria Marks (FM: 100)
Remarks
1 Minimum four Meetings of Gram Sabha in a year 10 2 Regular Meetings of the Standing Committees (1 per month) 10 3 Enhance Own Revenue at least 10% 20 4 Submit audited accounts every year by next June 10 5 Implement PRIASoft accounting software 10 6 Prepare Annual Plan 5 7 Prepare Annual Budget 5 8 Provide Drinking Water, Drainage and Sanitation as per
Govt. Programmes 15
9 Have at least one Playground in every GP 5 10 Make Panchayat Sarkar Bhawan functional if the Building is
constructed 10
Note:
a. Use of Performance Grants will be untied. b. PRD will announce the report card for performance grant.
Performance Grants Criteria for GK
Sl. Criteria Marks(FM: 100) Remarks 1 Dispute free Village 50 2 Cases Filed and Disposed in a year 30 3 No. of sittings of GK 10 4 Case records properly maintained 10
Annexure-9.4(A)
5th SFC (2015-20)

Performance Criteria for ULBs
Note:
a. Use of Performance Grants will be untied. b. Conditions 1a, 2a are mandatary, whereas, others are additional/optional. c. UDD will announce the report card for performance grant. d. Qualifying marks for performance grants will be 60, 50 and 40 for Nigams, Parishads and
Panchayats respectively.
Sr. No.
Criteria Marks (FM: 100)
Remarks
1.a Additional revenue from Own Sources exceeding 20%, 15% and 10% for Nigams, Parishads and Panchayats respectively compared to previous year
15
b Meeting 90% of target of OTR 5 Target must be fixed based on no. of holdings and GIS
2.a CAG audit report/Internal Auditor reports 10 CA&G should rate ULBs as: a. Satisfactory, b. Less than Satisfactory, c. Unsatisfactory
b Double entry system of accounting 5 c. Preparation of Annual Plan 5 d. Preparation of Annual Budget 5 3. 75%, 65%, 60% Expenditure of
a. Total Central Grants for Nigams, Parishads and Panchayats respectively
10
b. MMNVY funds for Nigams, Parishads and Panchayats respectively
5
4. Functional Ward Sabha/Committee 10 5. Regular Standing Committee Meeting (Min 1 in a
month) 10 Action taken report must be
submitted to UDD. 6. Preparation of CDP/Master Plan 5 Based on GIS mapping 7. Improve levy and collection of user charges by 10% 5 8. e-municipality functional 5 Atleast 5 modules 9. Meeting the 40%, 30% and 20% SLB for Nigams,
Parishads and Panchayats respectively 5
Annexure-9.4(B)
5th SFC (2015-20)

Criminal Power of GK: (1) A bench of the Gram Katchahry shall, after hearing the parties and after considering the evidence adduced by the parties, record its decision in writing, and may sentence any offender convicted by it to pay a fine not exceeding one thousand rupees: Provided that if the members of the bench present during the trial of a case fail to come to a unanimous decision, the decision of the majority of such members shall be the decision of the bench : Provided further that in the case of equality of votes of the members of a bench present during the trial of a case, the Sarpanch shall have a second or casting vote and the decision of the bench shall be in accordance with such second or casting vote. (2) No sentence of imprisonment, simple or rigorous, whether substantive or in default of payment of fine shall be awarded by any bench. (3) When a bench imposes a fine under sub-section (1), it may, when passing the order, direct that the whole or any part of the fine recovered shall be applied in payment of compensation for any loss or injury caused by the offence. (4) When any person is sentenced by a bench of the Gram Katchahry, the bench shall, on the request of the person so sentenced, either in writing or orally, suspend the operation of such sentence for a period prescribed for filing appeal under this Act. A copy of the order passed by a Gram Katchahry or bench thereof shall be made available free of cost to the parties within one week from the date of passing of such order in the manner prescribed for this purpose.
Civil Power of GK: Notwithstanding anything contained in the Bengal, Agra and Assam Civil Courts Acts, 1887 (13 of 1887), the Provincial Small Cause Courts Act, 1887 (9 of 1887) and the Code of Civil Procedure, 1908 (5 of 1908) and subject to the provisions of this Act a bench of the Gram Katchahry shall have jurisdiction to hear and determine the following classes of suits:- (a) When the value of the suit does not exceed ten thousand rupees, namely – (i) Suits for money due on contracts;
(ii) Suits for the recovery of movable property or the value of such property; (iii) Suits for the recovery of rent; and (iv) Suits for compensation for wrongfully taking or injuring movable property, or for damaged property caused by cattle trespass (b) All suits of partition except wherein complicated question of law or title is involved; But where the Gram Katchahry is of the view that where in a suit for partition, complicated question of law or title is involved, Gram Katchahry shall transfer such suit to the court of competent jurisdiction: Provided that the parties to a suit of the above description under clauses (a) and (b) may by a written agreement refer the suit to the bench for decision irrespective of the value of the suit and the bench shall, subject to such rules as may be prescribed as to court-fees and other matters, have jurisdiction to hear and determine the said suit under this Act.
Appendix: 2.1 Criminal & Civil Powers of G.K under BPRA, 2006
