reinsurance and rating agency models thomas m. mount, acas, maaa a.m. best company
Post on 19-Dec-2015
214 views
TRANSCRIPT
Reinsurance and Reinsurance and Rating Agency Rating Agency
ModelsModelsThomas M. Mount, ACAS, MAAAThomas M. Mount, ACAS, MAAA
A.M. Best CompanyA.M. Best Company

Reinsurance Products Reinsurance Products Requiring Adjustments to Requiring Adjustments to
Capital Model:Capital Model: Capped Quota ShareCapped Quota Share Aggregate Stop LossAggregate Stop Loss Loss Portfolio TransfersLoss Portfolio Transfers Adverse Development CoversAdverse Development Covers Catastrophe BondsCatastrophe Bonds SidecarsSidecars

Where do Frequent Where do Frequent Adjustments to BCAR Occur Adjustments to BCAR Occur
due to Reinsurance?due to Reinsurance? NWP capital factorsNWP capital factors Net loss & LAE reserve capital factorsNet loss & LAE reserve capital factors SurplusSurplus Credit riskCredit risk Potential Shock Loss (PMLs)Potential Shock Loss (PMLs) Stress TestsStress Tests

Origin of NWP Risk Origin of NWP Risk Capital FactorsCapital Factors
Lognorm(1.9607, 0.11756) Shift=-2.0183
0
1
2
3
4
5
6
-0.5 -0.4 -0.3 -0.2 -0.1 0 0.1 0.2 0.3 0.4
(Profit)/Loss % (All years)
1% in tail
breakeven
99%industry mean
Capital factor

Origin of Reserve Risk Origin of Reserve Risk Capital FactorsCapital Factors
Industry Reserve Capital Factor Calc.
0
0.5
1
1.5
2
2.5
-30% -20% -10% 0% 10% 20% 30% 40% (Favorable)/Adverse Reserve Development % of Original Reserves
1% in tail
zerodefic.
99%capital factor

Impact of Traditional Quota Share on Impact of Traditional Quota Share on NWP Risk Capital FactorsNWP Risk Capital Factors
Treatment of Traditional Quota Share 20% ofNWP Risk toPrimary Co.
Capital Charge = 31% of NWP 31% of 31% of Primary Co's NWP
ELR = 78%
20% ofNWP
Primary Co.
BEFORE Quota Share AFTER Quota Share
Assumptions: Primary Co. NWP = $100M Assumptions: Primary Co. cedes 80%Capital Charge = 31% Primary Co. NWP after QS = $20M
Capital Charge = 31%
BCAR Treatment: Primary Co. NWP = $100M BCAR Treatment: Primary Co. NWP = $20M(pg 6) Primary Co. NWP Required Capital = $31M (pg 6) Primary Co. NWP Required Capital = $6.2M
80% ofNWP Risk to
ReinsurerNWP Risk to
Primary Company
100% of
Reinsurer's NWP
80% ofNWP
Reinsurer
100% ofNWP
Primary Company

Impact of Capped Quota Share on Impact of Capped Quota Share on NWP Risk Capital FactorsNWP Risk Capital Factors
109%
16% of Reinsurer's NWP Risk to 31% of 93% Primary 31% of
Co. Primary Co's NWP15% of Reinsurer's NWP
78%
20% Share toPrimary Co.
AFTER Quota Share and Loss Ratio Cap
Assumptions: Primary Co. cedes 80%Primary Co. NWP after QS = $20MCapital Charge = 31% (prior to QS transactions)Reinsurer Maximum Loss Ratio = 93%Primary Company's Ultimate Loss Ratio = 78% (prior to QS transactions)
BCAR Treatment: Primary Co. NWP = $20M(pg 6) Primary Co. NWP Required Capital = $6.2M + $12.8M = $19.0M
= .31 * $20M + .16 * 80MPrimary Co. Capital Factor = .95 (after QS transactions)
= $19M of Req Capital / $20M of NWP
Risk to Primary Company
Reinsurer's NWPRisk To Reinsurer
80% Share toReinsurer

Capped Quota ShareCapped Quota ShareSummary of Impact on BCARSummary of Impact on BCAR
NWP capital factors increased to reflect NWP capital factors increased to reflect retained risk in excess of retained retained risk in excess of retained premiumpremium
Additional premium charges, sliding Additional premium charges, sliding scale contingent commissions, etc can scale contingent commissions, etc can also increase retained riskalso increase retained risk
Smaller impact on reserve capital factorsSmaller impact on reserve capital factors Reinsurance dependence factor may Reinsurance dependence factor may
increaseincrease Credit risk required capital increasesCredit risk required capital increases Overall BCAR is Improved - due to Overall BCAR is Improved - due to
transfer of risk to reinsurer but at a rate transfer of risk to reinsurer but at a rate lower than cession percentagelower than cession percentage

Impact of Aggregate Stop Loss on Impact of Aggregate Stop Loss on APHS and Reserve Risk Required APHS and Reserve Risk Required
CapitalCapitalCompany With ASL Company Without ASL
75% LR 75% LR
Initial Assumptions: Initial Assumptions:Reported Surplus 215 M Reported Surplus 200 MPre ASL Reserve 100 M Pre ASL Reserve 100 MReserves ceded to ASL 100 M Reserves ceded to ASL 0 MNet Reserve after ASL 0 M Net Reserve after ASL 100 MDeficiency 0 M Deficiency 0 MNeeded Reserve for Required Capital calc 100 M Needed Reserve for Required Capital calc 100 MDiscount Factor 85 % Discount Factor 85 %Discnt'd Needed Reserve for Required Capital Calc 85 M Discnt'd Needed Reserve for Required Capital Calc 85 MCapital Factor 0.300 Capital Factor 0.300Required Capital 26 M Required Capital 26 MReserve Equity 15 M Reserve Equity 15 MSurplus Gain from ASL 15 M Surplus Gain from ASL 0 MAPHS 215 M APHS 215 M
$100 M Undisct'd
Required Capital$26 M
ceded to ASL
Required Capital$26 M
Reported Reserve$100 M Undisct'd

Aggregate Stop LossAggregate Stop LossSummary of Impact on BCARSummary of Impact on BCAR
ASL can impact premium and reserve risksASL can impact premium and reserve risks Benefit to premium and reserves depends on Benefit to premium and reserves depends on
layer cededlayer ceded Always need to add back ceded premium Always need to add back ceded premium Need to increase reserve required capital by Need to increase reserve required capital by
amount of required capital on ceded reserveamount of required capital on ceded reserve Schedule P may be distorted, Deficiency Schedule P may be distorted, Deficiency
distorteddistorted Reinsurance recoverables increasedReinsurance recoverables increased Reinsurance dependence factor increasedReinsurance dependence factor increased Credit risk required capital increasedCredit risk required capital increased Overall BCAR improves depending on the Overall BCAR improves depending on the
layer cededlayer ceded

Impact of Adverse Development Impact of Adverse Development Cover on Reserve Risk Required Cover on Reserve Risk Required
CapitalCapital
1,000,000 1,000,000
150,000250,000
306,590206,590
0
0
Before ADC After ADC
as of 12/31/01
Do
llars
Capital Charge
Ceded Layer
Deficiency
Booked Reserves

Adverse Development CoverAdverse Development CoverSummary of Impact on BCARSummary of Impact on BCAR
Surplus increased for prepaid deficiencySurplus increased for prepaid deficiency Surplus reduced for cost of ADCSurplus reduced for cost of ADC Reserve required capital reducedReserve required capital reduced Reinsurance recoverables increasedReinsurance recoverables increased Reinsurance dependence factor increasedReinsurance dependence factor increased Credit risk required capital increasedCredit risk required capital increased Overall BCAR is Improved - due to transfer Overall BCAR is Improved - due to transfer
of reserve risk to reinsurerof reserve risk to reinsurer

Effect of Reinsurance on Effect of Reinsurance on Modeled PML Modeled PML
Published capital score (BCAR)Published capital score (BCAR) Surplus reduced by first eventSurplus reduced by first event
Greater of 1/100 Wind,1/250 EQ, Recent Greater of 1/100 Wind,1/250 EQ, Recent actual lossactual loss
Per Occurrence curvePer Occurrence curve Net of reinsuranceNet of reinsurance Gross of reinstatement premGross of reinstatement prem Net of 35% FITNet of 35% FIT
Direct impact on balance sheet strength Direct impact on balance sheet strength & FSR& FSR

Effect of Reinsurance on Effect of Reinsurance on Stress TestStress Test
What does BCAR score look like after first What does BCAR score look like after first event happens?event happens? Potentially Main driver of our view of balance Potentially Main driver of our view of balance
sheet strengthsheet strength Look at Impact of 1Look at Impact of 1stst event on insurer’s event on insurer’s
balance sheet:balance sheet: Surplus reduced by 1Surplus reduced by 1stst event event Recoverables go up by ceded portion of 1Recoverables go up by ceded portion of 1stst
event loss (we use 80% of recoverable)event loss (we use 80% of recoverable) Downgrade reinsurers one FSR level (incr credit Downgrade reinsurers one FSR level (incr credit
risk)risk) Net reserves increase by pre-tax net loss Net reserves increase by pre-tax net loss
Add to reserve page if exposed to potential Add to reserve page if exposed to potential development on the booked lossdevelopment on the booked loss
Use 80% of net lossUse 80% of net loss

Effect of Reinsurance on Effect of Reinsurance on Stress TestStress Test
After all those adjustments:After all those adjustments: STILL EXPOSED TO A SECOND EVENT !!!STILL EXPOSED TO A SECOND EVENT !!!
Reduce surplus by second eventReduce surplus by second event Larger of 1/100 Wind, 1/100 EQ, or Recent Larger of 1/100 Wind, 1/100 EQ, or Recent
actual eventactual event Net of reins, gross of reinstate, net of 35% FIT, Net of reins, gross of reinstate, net of 35% FIT,
per occurper occur Direct Impact on balance sheet strength and FSRDirect Impact on balance sheet strength and FSR
Wanted 2 separate large per occurrence Wanted 2 separate large per occurrence eventsevents Better than aggregate seasonBetter than aggregate season Validated in 2004, 2005Validated in 2004, 2005

Effect of Reinsurance on Stress Test Effect of Reinsurance on Stress Test
Stressed BCAR can fall up to 30 Stressed BCAR can fall up to 30 points from current points from current required required capital as determined by capital as determined by committeecommittee 15 points for most cos (i.e. 1 FSR level)15 points for most cos (i.e. 1 FSR level) 30 points for cos with30 points for cos with
Good Catastrophe managementGood Catastrophe management Financial FlexibilityFinancial Flexibility
Potentially Greater Flexibility for Dedicated Potentially Greater Flexibility for Dedicated Subs of Strong Parent CompaniesSubs of Strong Parent Companies Issue is willingness to recapitalizeIssue is willingness to recapitalize

CAT Bonds:CAT Bonds:Why Does AMBest Measure Why Does AMBest Measure
Basis Risk? Basis Risk?
AMBest’s objective in measuring AMBest’s objective in measuring basis risk is to determine how much basis risk is to determine how much reinsurancereinsurance creditcredit should be given should be given to certain types of to certain types of parametric*parametric* Cat Cat Bonds in the Bonds in the BCAR analysisBCAR analysis..
*For the purpose of this document and discussion, AMB *For the purpose of this document and discussion, AMB considers non-indemnity catastrophe bonds as parametric considers non-indemnity catastrophe bonds as parametric
catastrophe bonds. catastrophe bonds.

Measuring Basis Risk: Measuring Basis Risk: Mechanical StepsMechanical Steps
AMBest’s method of estimating basis risk:AMBest’s method of estimating basis risk:
1.1. Calculate a score based on a scoring table and Calculate a score based on a scoring table and correlate the score to a reinsurance credit correlate the score to a reinsurance credit table*.table*.
2.2. Calculate a ratio based on PML impact that Calculate a ratio based on PML impact that directly ties to reinsurance credit*.directly ties to reinsurance credit*.
3.3. Take the Take the lesserlesser of the results from steps 1 and of the results from steps 1 and 2.2.
4.4. Other considerations.Other considerations. * Information used in this calculation is provided by the peril modeler or sponsor.* Information used in this calculation is provided by the peril modeler or sponsor.

Complete Step 1: Basis Risk ScoreComplete Step 1: Basis Risk Score
ShortfallShortfall 11 0.350.35 0.350.35
Exhaustion prob.Exhaustion prob. 11 0.250.25 0.250.25
PerilPeril 33 0.100.10 0.300.30
Peril modelerPeril modeler 33 0.100.10 0.300.30
Data qualityData quality 33 0.100.10 0.300.30
Certainty of bus.Certainty of bus. 22 0.100.10 0.200.20
TotalTotal 1.701.70
Scoring-based reins creditScoring-based reins credit 81%81%
Sum up weighted score (ie, Sum up weighted score (ie, 1.701.70)) Determine Basis Risk Score based Determine Basis Risk Score based
on the following AMB table:on the following AMB table:
90%90% 11
75%75% 22
50%50% 33
30%30% 44
10%10% 55
CreditCredit
SummedSummedBasis RiskBasis Risk
ScoreScore
AMB Scoring-BasedAMB Scoring-BasedReinsurance Credit ScaleReinsurance Credit Scale
81%81% 1.701.70
Scoring-based reinsurance credit is Scoring-based reinsurance credit is 81%.81%.
ScoreScore WeightWeight Wt x ScoreWt x Score
Index Re Basis Risk Scoring TableIndex Re Basis Risk Scoring Table

Step 2 - Capital Effectiveness Ratio Step 2 - Capital Effectiveness Ratio
CapitalCapitalEffectiveness =Effectiveness =RatioRatio
PMLPML Before Adding the Effect of Before Adding the Effect of the Bond – PML After Adding the the Bond – PML After Adding the
Effect of the BondEffect of the Bond
Bond Principal BalanceBond Principal Balance
90% x90% x
= 90% x 80.0%= 90% x 80.0%
$800,000,000 – $700,000,000$800,000,000 – $700,000,000
$$125,000,000125,000,000 = 90% x= 90% x
= = 72%72%

Step 3: Absolute Reinsurance Credit Step 3: Absolute Reinsurance Credit Absolute reinsurance credit is the lower of:Absolute reinsurance credit is the lower of:
Scoring-based reinsurance credit (step 1)Scoring-based reinsurance credit (step 1) Capital effectiveness ratio (step 2)Capital effectiveness ratio (step 2)
The reinsurance credit is The reinsurance credit is 7272%% of Cat Bond of Cat Bond issue, calculated as follows:issue, calculated as follows:
72% x $125 mil = 72% x $125 mil = $90.0$90.0 mil mil
81%81%
72%72%
The adjusted per Occurrence PML is:The adjusted per Occurrence PML is:= per Occurrence PML - Reinsurance Credit Amount= per Occurrence PML - Reinsurance Credit Amount= $750 mil - $90 mil= $750 mil - $90 mil= = $660 mil$660 mil
Compare to:Compare to: Taking full limit credit = $625 = $750 - $125Taking full limit credit = $625 = $750 - $125 Taking modeled credit = $650 = $750 - $100Taking modeled credit = $650 = $750 - $100
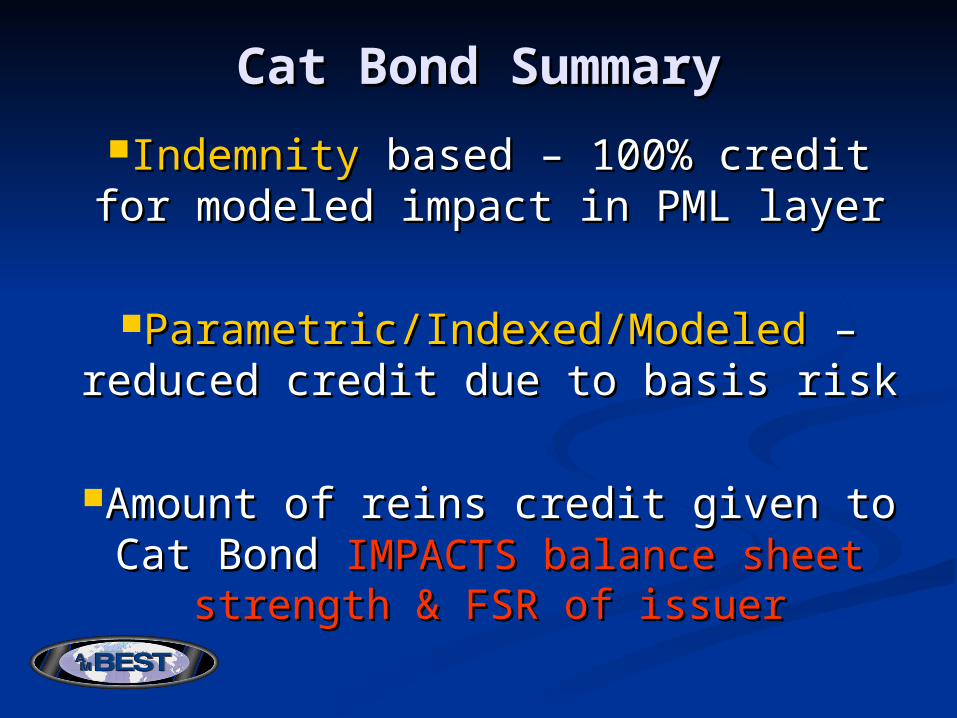
Cat Bond SummaryCat Bond Summary
IndemnityIndemnity based – 100% credit for based – 100% credit for modeled impact in PML layermodeled impact in PML layer
Parametric/Indexed/ModeledParametric/Indexed/Modeled – reduced – reduced credit due to basis riskcredit due to basis risk
Amount of reins credit given to Cat Bond Amount of reins credit given to Cat Bond IMPACTS balance sheet strength & FSR of IMPACTS balance sheet strength & FSR of
issuerissuer

Sidecars – Sidecars – Role of Structured Finance Role of Structured Finance
GroupGroup
1.1. Rate the debt of sidecars and, where Rate the debt of sidecars and, where appropriate, issue ICRs.appropriate, issue ICRs.
2.2. Calculate the Calculate the “tail risk”“tail risk” to insure the to insure the appropriate reinsurance credit is appropriate reinsurance credit is given to the given to the sponsorsponsor of the sidecar of the sidecar

Determining Tail Risk? Determining Tail Risk? Tail Risk is the risk that must be borne Tail Risk is the risk that must be borne by the by the
sponsorsponsor if the sidecar is not sufficiently if the sidecar is not sufficiently capitalized to support the reinsurance capitalized to support the reinsurance transaction.transaction.
In order to determine Tail Risk, the following In order to determine Tail Risk, the following question must be asked: “What capital level question must be asked: “What capital level is required in order to maintain a is required in order to maintain a sidecar’ssidecar’s assumed FSR?”assumed FSR?”
The “shadow rating” for the sidecar is the The “shadow rating” for the sidecar is the same as that of the sponsoring company.same as that of the sponsoring company.

AMBest’s AMBest’s Assumed One -Yr Average Assumed One -Yr Average Impairment RatesImpairment Rates
A++A++
0.03%0.03%
3,3333,333
99.97%99.97%
A+A+
0.06%0.06%
1,6671,667
99.94%99.94%
AA
0.21%0.21%
476476
99.79%99.79%
A-A-
0.27%0.27%
370370
99.73%99.73%
FSR RatingFSR Rating
Annual Default ProbabilityAnnual Default Probability
Return PeriodReturn Period
Confidence IntervalConfidence Interval

Sidecar’s Aggregate Exceedence Sidecar’s Aggregate Exceedence CurveCurve
ReturnReturnPeriodPeriod
1010
2525
5050
100100
250250
370370
500500
LossesLosses
100,000100,000
150,000150,000
200,000200,000
250,000250,000
300,000300,000
330,000330,000
350,000350,000
Stressed*Stressed*LossesLosses
(Stress factor: 110%)(Stress factor: 110%)
110,000110,000
165,000165,000
220,000220,000
275,000275,000
330,000330,000
363,000363,000
385,000385,000
ConfidenceConfidenceIntervalInterval
90.00%90.00%
96.00%96.00%
98.00%98.00%
99.00%99.00%
99.60%99.60%
99.73%99.73%
99.80%99.80%
*Use stressed losses if not confident with modeled loss.

Calculating Tail Risk: IllustrationCalculating Tail Risk: Illustration
1.1. Aggregate Exceedence CurveAggregate Exceedence Curve
2.2. Shadow Rating of the sidecarShadow Rating of the sidecar
3.3. Annual Default Probability assoc with FSRAnnual Default Probability assoc with FSR
4.4. Confidence Interval Confidence Interval
5.5. Obtain the Required CollateralObtain the Required Collateral
6.6. Initial Sidecar CollateralInitial Sidecar Collateral
7.7. Retained CashRetained Cash
8.8. Total Sidecar Collateral (step 6 + step 7)Total Sidecar Collateral (step 6 + step 7)
9.9. Tail Risk:Tail Risk:
= = Max 0, Required Collateral (step 5) – Total Collateral (step 8)Max 0, Required Collateral (step 5) – Total Collateral (step 8)
Previous pagePrevious page
A-A-
0.27%0.27%
99.73%99.73%
$363,000$363,000
$110,000$110,000
$53,000$53,000
$163,000$163,000
$200,000$200,000
Source: AMBest’s Assumed 1-Year Average Impairment Rates table
Source: Sidecar Aggregate Exceedence Curve tableSource: Sidecar’s pro-forma Financial Statements

Sidecar SummarySidecar Summary
Modeling of AEP curves Modeling of AEP curves extremelyextremely importantimportant
Direct impact on the balance sheet Direct impact on the balance sheet strength & FSR of the sponsorstrength & FSR of the sponsor