reconciliation and the opining actuary wendy germani, fcas maaa holmes gwynn, acas maaa presented...
TRANSCRIPT

Reconciliation and the Opining Actuary
Wendy Germani, FCAS MAAAHolmes Gwynn, ACAS MAAAPresented CLRS – Fall 2004

Why Reconciliations
Schedule PPart 1
A/S Page 3Liabilities
ActuarialData Base

Why Reconciliation-Opiners View
I evaluated that data for reasonableness and consistency. I also reconciled that data to Schedule P, Part 1 of the company’s current Annual Statement.

Potential for Malpractice
Companies can misinterpret actuarial data requests.
Subsequent audits may show the actuary used bad data.
Data omissions can be material. Companies can fraudulently feed actuaries
bad data.

Relationship to Accounting
In general the actuarial work product gets turned over to the accountant to complete financial reporting.
Accountants must allocate at times. Sometimes they involve the actuary, sometimes
not. The actuary needs to understand how his work
is being put to use to develop Schedule P.

New This Year
“The auditor is required to determine what historical data and methods have been used by management in developing the loss reserve estimate and whether the auditor will rely on the same data or different statistical data in evaluating the reasonableness of the loss reserve estimate…

New This Year cont.
“ Through inquiry of the Appointed Actuary, the auditor should obtain an understanding of the data identified by the Appointed actuary as significant.”
A complete and thorough reconciliation may be all the auditor needs.
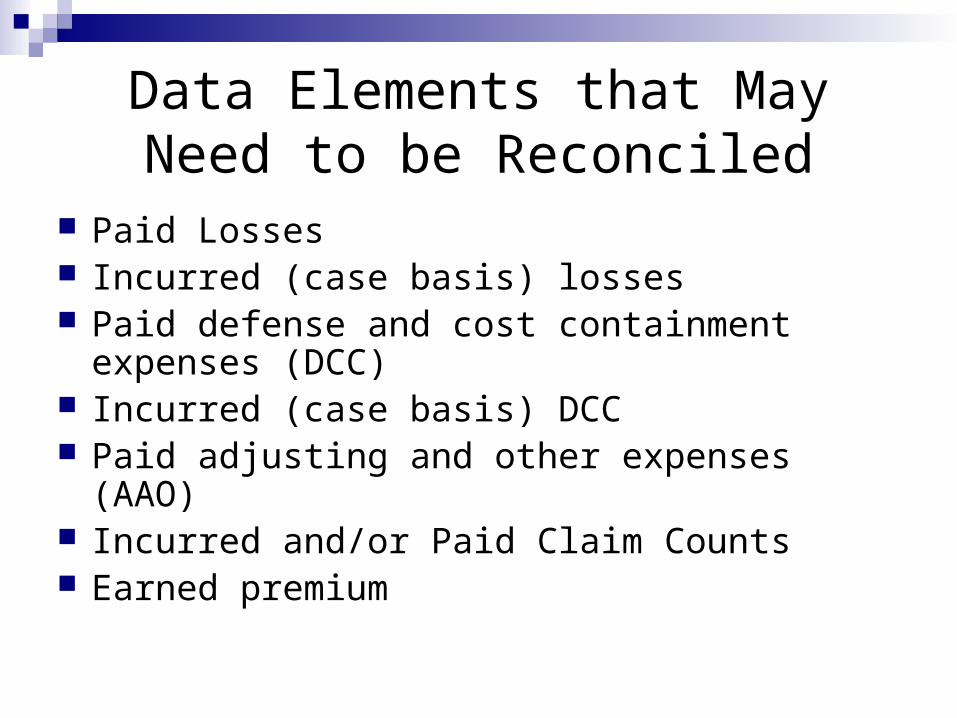
Data Elements that May Need to be Reconciled
Paid Losses Incurred (case basis) losses Paid defense and cost containment expenses
(DCC) Incurred (case basis) DCC Paid adjusting and other expenses (AAO) Incurred and/or Paid Claim Counts Earned premium

Examples
Situations reflect the actuaries need to: Combine sub-lines Incremental vrs Cumulative paid data Bifurcate data by line of business Account for losses not subject to actuarial review Combined (Pooled) Companies Splitting Loss adjustment Expenses Allocation of IBNR to LOB & Acc Year Cells.

Exhibit 1
Reconciliation of Net Case Loss ReservesEvaluation as of 12/31/2003
Schedule P _______ Actuarial Data _________
Accident
Case Loss Reserves
Case Reserves Medical
Case Reserves Indemnity
Total Case Reserves
Work Comp
Pool Case Reserves
Adjusted Actuarial
Case Reserves
Unreconciled Difference
$
Unreconciled Difference as % of Carried Case Loss Reserves
Year (1) (2) (3) (4) (5) (6) (7) (8)Prior 42,663 8,168 33,751 41,919 600 42,519 144 0.3%
1994 13,270 2,553 10,547 13,100 42 13,142 128 1.0%1995 14,744 2,725 11,719 14,444 300 14,744 - 0.0%1996 21,378 5,245 13,636 18,881 2,598 21,479 (101) -0.5%1997 20,622 6,233 10,389 16,622 4,000 20,622 - 0.0%1998 20,528 7,212 10,303 17,515 3,000 20,515 13 0.1%1999 13,358 4,838 7,928 12,766 580 13,346 12 0.1%2000 20,497 8,233 10,703 18,936 1,500 20,436 61 0.3%2001 29,235 12,775 13,646 26,421 3,164 29,585 (350) -1.2%2002 49,525 22,354 22,354 44,708 4,500 49,208 317 0.6%2003 72,774 36,612 25,628 62,240 10,500 72,740 34 0.0%
Total 318,593 116,948 170,604 287,551 30,784 318,335 258 0.1%
Notes:
(1) = Col 13 - 14 from Schedule P Part 1D (5) From Company Data(2) See Actuarial Data (eg. EX 3, Col 2) (6) = (4) + (5)(3) See Actuarial Data (eg. Ex. 4 Col 2) (7) = (1) - (6)(4) = (2) + (3) (8) = (7) / (1)
Case 1Reconciliation to Schedule P
Workers CompensationFor XYZ Insurance Company

Exhibit 2
Reconciliation of Net Incremental Paid Losses and DCCE ('000's omitted)
____________ Schedule P Data _________________ _____Actuarial Data ________ABC
Insurance Cum. Paid
Loss & DCCE as
of 12/31/2002
ABC Insurance Cum. Paid
Loss & DCCE as
of 12/31/2003
XYZ Insurance Cum. Paid
Loss & DCCE as
of 12/31/2002
XYZ Insurance Cum. Paid
Loss & DCCE as of 12/31/2003
Incremental Paid Loss &
DCCE in 2003
Cum. Paid Loss and DCCE as
of 12/31/2002
Cum. Paid Loss and DCCE as
of 12/31/2003
Incremental Paid Loss & DCCE in
2003
Excess Stop Loss
Treaty
Total Adjusted Actuarial
Data
Year (1) (2) (3) (4) (5) (6) (7) (8) (9) (10) (11) (12)1994 14 14 5 5 - 19 19 - - - - 1995 180 190 60 63 13 240 253 13 - 13 - 0.00%1996 233 291 78 97 77 310 388 78 - 78 (1) -1.30%1997 209 246 153 132 16 462 529 67 50 17 (1) -6.25%1998 207 236 69 92 52 276 369 93 40 53 (1) -1.92%1999 126 180 52 70 72 207 280 73 - 73 (1) -1.39%2000 183 262 61 87 105 244 349 105 - 105 - 0.00%2001 271 327 90 113 79 362 452 90 - 90 (11) -13.92%2002 596 643 199 210 58 795 837 42 - 42 16 27.59%2003 - 608 - 207 815 - 827 827 12 815 - 0.00%
Total 2,019 2,997 767 1,076 1,287 2,915 4,303 1,388 102 1,286 1 0.08%
Notes:
(1), (2), (3), (4) = Col 4 - 5 + 6 - 7 from Schedule P Part 1A (9) From Company (5) = (2) - (1) + (4) - (3) (10) = (8) - (9) (6) See Actuarial Data (eg. Ex. 1 Col 4) (11) = (5) - (10) (7) See Actuarial Data (eg.Ex. 1 Col. 3) (12) = (11) / (5) (8) = (7) - (6)
Case 2Reconciliation to Schedule P
HomeownersFor ABC Insurance Company and XYZ Insurance Company on a Combined Basis
Difference $ %

Exhibit 3
Reconciliation of Net Cummulative Paid Losses and DCCE ('000's omitted)
____Schedule P Data_______ Actuarial DataABC
Insurance Cum. Paid
Loss & DCCE as
of 12/31/2003
XYZ Insurance
Cum. Paid Loss &
DCCE as of
12/31/2003
Cummulative Paid Loss &
DCCE
Cum. Paid Loss and
DCCE as of 12/31/2003
Paid Excess
Stop Loss Treaty
Adjusted Actuarial
Paid
Year (1) (2) (3) (4) (5) (6) (7) (8)1994 14 5 19 19 - 19 - 0.00%1995 190 63 253 253 - 253 - 0.00%1996 291 97 388 388 - 388 - 0.00%1997 246 132 378 529 150 379 (1) -0.26%1998 236 92 328 369 40 329 (1) -0.30%1999 180 70 250 280 - 280 (30) -12.00%2000 262 87 349 349 - 349 - 0.00%2001 327 113 440 452 - 452 (12) -2.73%2002 643 210 853 837 - 837 16 1.88%2003 608 207 815 827 12 815 - 0.00%
Total 2,997 1,076 4,073 4,303 202 4,101 (28) -0.69%
Notes:
(1), (2) = Col 4 - 5 + 6 - 7 from Schedule P Part 1A (6) = (4) - (5)(3) = (1) + (2) (7) = (5) - (6)(4) See Actuarial Data (eg. Ex. 1 Col 4) (8) = (7) / (3)(5) From Company
Difference $ %
For ABC Insurance Company and XYZ Insurance Company on a Combined Basis
Case 2 Reconciliation to Schedule P
Homeowners

Exhibit 4
Reconciliation of Net Paid DCCE and A & OEEvaluation as of 12/31/2003
___Schedule P_____ ____Actuarial Data______ Adjusted Actuarial Data Paid DCCE
Paid A & OE
Paid ALAE per analysis
Paid ULAE per
analysis
Transferred from ALAE to A & OE
Transferred from ULAE To DCCE
Paid DCCE Paid A & OE Unreconciled Difference
DCCE
Unreconciled Difference A & OE
Year (1) (2) (3) (4) (5) (6) (7) (8) (9) (10)1994 1,451 5,563 1,185 5,829 290 556 1,451 5,563 - - 1995 5,529 18,277 4,807 18,999 1,106 1,828 5,529 18,277 - - 1996 11,619 34,350 11,148 34,921 2,424 3,395 12,119 33,950 (500) 400 1997 11,267 37,447 9,776 38,938 2,253 3,745 11,267 37,447 - - 1998 8,877 31,053 7,547 32,383 1,775 3,105 8,877 31,053 - - 1999 6,025 20,712 4,819 21,418 1,145 2,051 5,725 20,512 300 200 2000 8,705 14,070 8,989 14,286 1,741 1,457 8,705 14,570 - (500) 2001 10,761 15,627 11,351 15,038 2,152 1,563 10,761 15,627 - - 2002 6,474 15,357 6,233 15,598 1,295 1,536 6,474 15,357 - - 2003 2,514 11,109 1,906 11,717 503 1,111 2,514 11,109 - -
Total 73,222 203,565 67,760 209,127 14,684 20,347 73,422 203,465 (200) 100
Notes:(1) = Col 6-7 from Schedule P Part 1 D (7) = (3) - (5) + (6)(2) = Col 8 - 9 From Schedule P Part 1 D (8) = (4) + (5) - (6)(3) See Actuarial Data (eg. Ex. 1 Col 4) (9) = (1) - (7)(4) See Actuarial Data (eg. Ex. 2 Col. 4) (10) = (2) - (8)(5), (6) From Company Data (or from accounting)
Reconciliation to Schedule PWorkers Compensation
For XYZ Insurance Company
Case 4

Exhibit 5
Reconciliation of Net Cummulative Paid Loss and DCCEEvaluation as of 12/31/2003
Schedule P Actuarial Actuarial Actuarial Paid Loss & DCCE as of 12/31/2003
Paid Loss & DCCE at 9/30/2003
Paid Loss & DCCE
4th Qt 2003
Paid Loss & DCCE as of 12/31/2003
Difference Schedule P - Actuarial
Data
Difference as %
Year (1) (2) (3) (4) (5) (6)1994 10,700 10,700 - 10,700 - - 1995 9,010 9,005 5 9,010 - - 1996 8,920 8,913 7 8,920 - - 1997 10,248 10,217 31 10,248 - - 1998 21,425 21,345 80 21,425 - - 1999 29,200 29,148 352 29,500 (300) (0) 2000 44,900 43,106 1,619 44,725 175 0 2001 41,500 39,054 2,696 41,750 (250) (0) 2002 32,500 29,993 2,758 32,751 (251) (0) 2003 13,988 12,219 2,431 14,650 (662) (0)
Total 222,390 213,698 9,976 223,675 (1,285) (0)
Notes:
(1) = Col 4 - 5 +6 -7 from Schedule P Part 1C (5) = (1) - (4)(2) See Actuarial Data (eg. Ex 3, Col 2) (6) = (5) / (4)(3) See Actuarial Data (eg. Ex. 4 Col 2)(4) = (2) + (3)
Reconciliation to Schedule PCommercial Auto Liability
For Auto Insurance Company
Case 6

Exhibit 6
Reconciliation of Net Reserves for LossesEvaluation as of 12/31/2003
_________Schedule P____________ ___________Actuarial________ Difference Carried - IndicatedNet Case Reserves
Net Carried IBNR
Total Carried
Reserves
Net Case Reserves
Net Indicated
IBNR
Total Indicated Reserves
Net Case Reserves
Net IBNR Net Reserves
Difference as %
Year (1) (2) (3) (4) (5) (6) (7) (8) (9) (10)1994 1,736 260 1,996 1,736 271 2,007 - (10) (10) -0.6%1995 2,906 523 3,429 2,906 513 3,419 - 10 10 0.4%1996 4,243 849 5,092 4,243 840 5,083 - 8 8 0.2%1997 3,372 1,012 4,384 3,372 996 4,368 - 15 15 0.5%1998 6,612 2,645 9,257 6,612 2,650 9,262 - (5) (5) -0.1%1999 43,050 24,108 67,158 43,050 24,180 67,230 - (72) (72) -0.2%2000 107,459 64,475 171,934 107,459 64,153 171,612 - 322 322 0.3%2001 224,853 157,397 382,250 224,555 158,184 382,739 298 (787) (489) -0.2%2002 414,462 331,570 746,032 414,526 324,938 739,464 (64) 6,631 6,567 1.6%2003 560,724 1,121,448 1,682,172 560,851 1,143,877 1,704,728 (127) (22,429) (22,556) -4.0%
Total 1,369,416 1,704,285 3,073,701 1,369,306 1,720,598 3,089,907 100 (16,324) (16,209) -1.2%
Notes:
(1) = Col 13 - 14 from Schedule P Part 1C (5) See Actuarial Data (eg Ex 1 Col1) (9) = (3) - (6)(2) = Col 15 - 16 From Part 1C (6) = (4) + (5) (10) = (9) / (3)(3) = (1) + (2) (7) = (1) - (4)(4) See Actuarial Data (eg. Ex 1 Col 2) (8) = (2) - (5)
Case 7Reconciliation to Schedule PCommercial Auto Liability
For Auto Insurance Company

Questions???