regression analysis ii: linear models - icpsr analysis ii...icpsr summer program regression analysis...
TRANSCRIPT
ICPSR Summer Program Regression Analysis II Tim McDaniel
June/July 2014 SYLLABUS Page 1 of 21
REGRESSION ANALYSIS II: Linear Models June/July 2014
Tim McDaniel Buena Vista University — Storm Lake, Iowa USA — [email protected]
Introduction
This course is intended for social scientists who are comfortable with algebra and basic statistics
and now want to learn applied ordinary least squares (OLS) multiple regression analysis for their
own research and to understand the work of others.
As social scientists, it is important that we know how to use multiple regression. But it is also
important for us to know why and how multiple regression works (and fails) under varying
conditions. Given this, we will discuss much of the mathematical and statistical theory behind
multiple regression and also some potential drawbacks and circumstantial limitations. So while
the presentations will not be purely theoretical, neither will this course be “cookbook” in nature.
The primary goal of the course is to develop an applied and intuitive (as opposed to purely
theoretical or mathematical) understanding of the topics. Whenever possible presentations will
be in “Words,” “Picture,” and “Math” languages in order to appeal to a variety of learning styles.
Course Topics
We will begin with a quick review of basic univariate statistics and hypothesis testing. I am
assuming that most (but probably not all...) of this material will indeed be a review for you.
After that we will cover various topics in bivariate and then multiple regression, including
• Model specification and interpretation
• Diagnostic tests and plots
• Analysis of residuals and outliers
• Transformations to induce linearity
• Multicollinearity
• Multiplicative interaction terms
• Dummy (dichotomous) independent variables
• Categorical (e.g., Likert scale) independent variables
Finally, in the last few classes we will consider topics including
• Logit models and analysis, and probit models
• Applications involving matrix algebra
• Heteroskedasticity
• Autocorrelation
• Generalized Least Squares (GLS) and Weighted Least Squares (WLS)
• Influence and leverage

ICPSR Summer Program Regression Analysis II Tim McDaniel
June/July 2014 SYLLABUS Page 2 of 21
Lecture Transcript Notes
This course will utilize approximately 875 pages of Lecture Transcript Notes. These Lecture
Transcript Notes are organized in five Booklets and will serve as the sole required “textbook” for
this course and also as an information resource for you after the course ends. In addition, these
Lecture Transcript Notes will significantly reduce the amount of notes you have to write during
class, which means you can concentrate much more on learning and understanding the material.
A detailed outline of the Lecture Transcript Notes is included in this syllabus. Each of the five
Booklets of Lecture Transcript Notes also have a Table of Contents with page numbers.
Packets 1, 2, and 3 constitute “Booklet #1” of the Lecture Transcript Notes. This first Booklet is
furnished free of charge to all participants taking the course in the first class and will be used for
the first two classes. The remainder of the twenty Lecture Transcript Notes Packets (Numbers 4 -
20, contained in Booklets #2 - #5) are available for purchase at the Photoduplicating Office in
Room 160 in the basement of the ISR building; the total cost is approximately $45.00. We will
begin using Booklet #2 on the third class day. Further details will be shared the first class day.
I urge you to purchase this year’s edition of the Lecture Transcript Notes, as opposed to using an
earlier edition; I have made several substantive additions, deletions, and other changes this year.
Although these Lecture Transcript Notes are detailed, comprehensive, and self-contained, it is
still advisable for you to study the relevant Packets before and (especially!) after each class, ask
questions during class, and talk to either me or a Teaching Assistant outside of class if you are to
maximize your learning and other benefits from this course. The Lecture Transcript Notes
contain several algebraic derivations and proofs; we will not use class time to work through most
of them, but instead they are provided for your information and consideration outside of class.
Textbooks and Other Readings
There is no required textbook (other than the aforementioned five Lecture Transcript Notes
Booklets, which constitute a de facto textbook) for this course. Later in this syllabus I provide
you with information about several optional supplemental readings from various textbooks and
journals, organized across each of the twenty Packets of the required Lecture Transcript Notes
Booklets. See the beginning of the “Some Suggested Readings” section for a discussion of the
four textbooks (each a different style) included in these optional readings.
I do not think that any one of these four textbooks is significantly better than the others; instead,
the one(s) that you might find best will depend upon a number of personal factors, including
your particular learning style. Therefore, instead of just picking one textbook, I have designed
the course so that you can experiment and pick-and-choose which style of learning and
(therefore) textbook(s) you prefer. Of course, you may decide to read and study (and maybe
purchase) none, one, two, three, or even all four of these textbooks; again, that is entirely up to
you. See the alphabetized list of “Some Suggested Readings” near the end of this syllabus for
the textbook readings corresponding to each Packet of the Lecture Transcript Notes. Finally,
other textbooks are also appropriate for this course; see me if you have any questions about this.
ICPSR Summer Program Regression Analysis II Tim McDaniel
June/July 2014 SYLLABUS Page 3 of 21
At the end of this syllabus you will find a bibliography for the textbooks and all of the other
readings. I have included quite a few of the Sage University Paper Series on Quantitative
Applications in the Social Sciences “Little Green Book” monographs; I like these a lot. You
may notice that some (though certainly not all) of the other readings are from political science
books and journals; however, this is not a cause for either rejoicing or concern since they deal
with methodological topics that are easily and broadly generalizable across other social science
disciplines (I would not have selected them otherwise!). I have also been careful to select
readings and substantive examples from other areas and journals (e.g., criminal justice,
economics, law, sociology, and social science in general). All materials listed in the
bibliography are available from the Summer Program Library. In addition, all textbooks and
monographs should be available for purchase; but before you actually buy anything I strongly
suggest you first “check it out” (in more ways than one!) from the Summer Program Library.
Classes, Assignments, Software, and Matrix Algebra
I will hold an Optional Session the evening of our first class day (Tuesday); the time and room
will be announced during the first day’s class. During this optional evening session I will
continue and finish a review of basic univariate statistics that we will have started earlier that day
(in the first class). The Lecture Transcript Notes for this review are in the Packets 1 and 2 (in
Booklet #1). Some of you will find a continuation and completion of this review useful, while
others may decide not to attend this first evening’s session (remember it is optional!); in either
case, you at least will have the Lecture Transcript Notes for this review of basic statistics. We
will start Packet 3 at the beginning of the second (Wednesday’s) class.
A portion of the first Assignment involves some mathematical and summation notation
manipulation; its primary purpose is to re-familiarize you with these basic tools and cognitive
processes. For the last three Assignments you will use SPSS as a means to generate computer
output; then your substantive task will be to interpret, analyze, and evaluate that output.
It is important to note that this is a course on Regression Analysis, NOT on computer or software
usage. So do not worry if you are unfamiliar with SPSS; it is very quick and easy to learn and
use (which is why we use it in this course!). We will examine SPSS output, and discuss how it
was generated, in class. Similarly, do not be concerned if you will (or currently do) use some
software other than SPSS in your own work; never forget that our goal here is to “learn
Regression Analysis,” not to “learn a particular brand of computer software usage.” While you
are welcome to use any software package to complete the assignments, the Teaching Assistants
and I will not use, or support, any computer software package other than SPSS.
There are computer counselors available to aid you in using the computers and SPSS to generate
the output that you will use in your Assignments. The data files for the homework, as well as for
extended and comprehensive in-class examples, are available on the Summer Program’s
computer server. I will distribute an extensive and comprehensive “Tutorial and Answer Key”
for each Assignment; each of these will provide you with yet another excellent learning
opportunity. IMPORTANT: You will definitely want to attend some of the ICPSR Summer
Program Lecture Series “Introduction to Computing” sessions if you are not already extremely
comfortable with basic computer operations and SPSS.
ICPSR Summer Program Regression Analysis II Tim McDaniel
June/July 2014 SYLLABUS Page 4 of 21
I have designed the course so that matrix algebra will not be used during the first three weeks. I
feel it is better and more efficient to learn as much of the regression material as possible in a
more familiar and comfortable environment (i.e., simple scalar algebra). Packet 15, which you
can study during the weekend between the third and fourth weeks, consists of an introduction to
matrices and matrix algebra. Then I will present an overview of most of the multiple regression
material again on Monday of the fourth week, this time in matrix algebra format. Some of the
more advanced topics that we will cover in the fourth week will also be presented using matrices.
Understanding matrix algebra is necessary for a thorough comprehension of these topics, and is
also vital should you decide to take more advanced courses in statistical research methods.
IMPORTANT: You will definitely want to attend the first two weeks or so of the ICPSR
Summer Program Lecture Series “Mathematics for Social Scientists II” if you are at all deficient
in your understanding and application of matrix algebra.
Learning and the Course’s Teaching Assistants
The primary purpose of the class meetings, Lecture Transcript Notes, Assignments, and the
Optional Learning Exercise is to help you learn this material. You are not in this alone.
Studying and learning with other participants is probably a very good idea for many of you, as is
taking advantage of Office Hours opportunities involving myself and the Teaching Assistants.
The Teaching Assistants and I make every effort to be accessible to you. I encourage you to
attend our office hours or make an appointment if those hours do not fit your schedule. Early in
the course I will give you information (e.g., an office hours schedule) regarding these matters.
Practical Matters Involving Assignments and Grading
Quantity. There are four Assignments (100 total points) that count toward your course grade:
• Assignment #1 — “Summation Notation, Basic Algebra & Regression” — 10 points.
• Assignment #2 — “Bivariate Regression” — 20 points.
• Assignment #3 — “Multiple Regression (and Interaction Terms)” — 40 points.
• Assignment #4 — “Categorical Independent Variables” — 30 points.
Also: Optional Learning Exercise — “Logit” — Does not count toward your course grade.
Purpose. The primary purpose of the Assignments and the Optional Learning Exercise is to
further enhance your learning of the material. The Assignments also serve as the sole graded
evaluation vehicle for those of you taking the course for a grade.
Due Date. You will submit each Assignment at the beginning of class on the day it is due.
Answer Keys. Everyone in the class will receive a “Tutorial and Answer Key” for each
Assignment immediately after it is due. Use each of these as an opportunity to learn!
Calculator. You might need a basic calculator for some of the Assignment tasks.

ICPSR Summer Program Regression Analysis II Tim McDaniel
June/July 2014 SYLLABUS Page 5 of 21
Details Matter. Your work will be graded on its quality, clarity, completeness, and accuracy.
• You can either type your work or write it out by hand. In either case, make it very easy
to read, follow, and understand (e.g., be organized and if you write then print neatly).
• Clearly label which question you are answering (e.g., “A” or “B” or “C” ).
• Show all of your work and supporting evidence, not just your bottom-line answer.
• Neatly write (print!) your name and the Assignment Number at the top of the first page.
• Staple all of the submitted sheets of paper together, in the upper-left-hand corner.
No Late Submissions. Unless we have made specific and explicit arrangements beforehand, no
Assignment submitted late (i.e., after the due date and time) will be accepted.
Not “For Credit”? Not a Problem! If you are not taking the course “for credit” then you can still
submit none, some, or all of the Assignments for grading; it is completely up to you. Any work
you decide to submit will be evaluated as if you were taking the course for credit.
Grading Templates. In order to facilitate more efficient and accurate grading by the course’s
Teaching Assistants, and also to enhance your understanding of the grading (e.g., partial credit)
decisions and your total numerical grade, each Assignment (except the first one) will be returned
along with a completed grading template form.
Grade Appeals. If you ever have any questions about any of your grades (e.g., partial credit
decisions) then you can see me (not a Teaching Assistant!) to discuss the situation, including
possibly appealing a grading decision. However, here are a couple of relevant course policies:
• You must wait until at least the next day after receiving your grade. This “Next Day
Rule” gives you time to study and contemplate your work-product, your notes, the
Lecture Transcript Notes, the Grading Template, and the relevant “Tutorial and Answer
Key”... and then to think about your work and the corresponding grading decision.
• The maximum amount of time you have to appeal a grading decision is three class days
after that Assignment is returned; after then no grading appeals will be considered. Exceptions to this course policy:
• The “Next Day Rule” is waived for Assignment #4.
• All grading appeals must be made before the end of my last day’s office hours.
Working Together and Doing Your Own Work. I encourage you to work and learn with other
participants on all learning activities in this course, including the Assignments. However, all of
the work on each Assignment you submit needs to be your work; i.e., you need to produce your
own actual submitted work-product material. See me if you have any questions about this.
Conclusion
Learning the material in this course will require a substantial amount of effort on your part; but
that is why you are here! The payoff will be well worth that effort. Let me know if the Teaching
Assistants or I can be of any additional assistance to you in this endeavor. Finally, I consider it
an honor to be your instructor for this course.
ICPSR Summer Program Regression Analysis II Tim McDaniel
June/July 2014 SYLLABUS Page 6 of 21
Course (and Lecture Transcript Notes) Outline
Packet I. Basic Statistics Review
1 A. Summations and Sigma Notation
B. Basic Statistics
1. Mean
2. Variance and Standard Deviation
3. Probability
4. Random Variables
a. Continuous versus Discrete
b. Nominal, Ordinal, and Interval
5. Standardized Variables
6. Expected Value
7. Covariance, Correlation, and Causality
8. Independence
9. Normal Distribution: Notation, Skewness & Kurtosis, Areas
10. Central Limit Theorem
11. Student’s t Distribution
12. Hypothesis Testing
13. Prob-Values (“p-Values”)
14. Confidence Intervals
15. Properties of Estimators: Unbiased, Consistent, Efficient, Sufficient
———————————————————————————————————————
Packet II. Supplement to Basic Statistics Review
2 A. A Closer Look at Population and Sample Variances
B. Hypothesis Testing: Summary, Flowchart, Protocol, and p-Values
C. Some Abuses and Misuses of Probability and Statistics
D. Symbol Glossary
———————————————————————————————————————
Packet III. Bivariate Regression
3 A. Notation
B. Fitting a Line
C. Ordinary Least Squares Assumptions
Assignment D. Deriving the Sample Intercept and the Slope Coefficient Using Algebra
#1 E. Centered Variables
Given F. The Estimated Slope Coefficient (“b”)
1. Variance and Confidence Interval
2. Confidence Interval and Hypothesis Testing
G. The Gauss-Markov Theorem
H. Appendix: Deriving the Formulas for “a” and “b” Using Calculus
———————————————————————————————————————
ICPSR Summer Program Regression Analysis II Tim McDaniel
June/July 2014 SYLLABUS Page 7 of 21
Packet I. Residuals
4 1. Definition and Estimation
2. Population “Error” as a Disturbance, or Stochastic Element
J. Explained, Unexplained, and Total Deviations and Sums of Squares
K. Goodness of Fit
1. Coefficient of Determination (R-Squared)
a. Correlations (Again...)
b. Why the R-Squared Can Be Inappropriate and Misleading
c. Perils of Maximizing R-Squared: A Monte Carlo Simulation
2. Standard Error of Regression (SER)
L. Standardized Variables and Beta Weights
M. Reporting OLS Regression Results
N. Regression Forced Through the Origin
1. Definition, Illustrations, and Examples
2. The Importance of Theoretical and Substantive Justifications
O. Comparison of Centering, Standardizing, and Forcing Through the Origin
P. Another Note on the Meaning and Interpretation of “a,” “b,” and Y-Hat
Q. An Analogy: Means, Slopes, Standardization, Samples and Populations
———————————————————————————————————————
Packet R. Functional Transformations of Independent Variables
5 1. The Need for Transformations
2. The Regression is Still Linear
3. The Natural Log and the Square Root Transformations
4. The X-Squared Transformation (a First Look)
5. Presenting Findings with Transformed Independent Variables
———————————————————————————————————————
Packet S. Interpolation, Predictive Intervals, and Extrapolation
6 T. Some Simple Diagnostic Plots
1. Y vs. X (and an Introduction to Outliers)
2. Y vs. Y-Hat
Assignment 3. Residual vs. X
#2 4. Residual vs. Case Number
Given 5. Residual vs. Lagged Residual
6. Residual vs. Y-Hat
U. Simpson’s Paradox, Aggregation Bias, and the Ecological Fallacy
V. Generation and Interpretation of Computer Output Using Real Data
1. Setting-Up the Substantive Example
2. Generating and Analyzing the SPSS Output
W. The Usefulness of Simple Scatter Plots: An Illustration
X. R-Squared, “b,” and SER: A Monte Carlo Simulation
———————————————————————————————————————
ICPSR Summer Program Regression Analysis II Tim McDaniel
June/July 2014 SYLLABUS Page 8 of 21
Packet IV. Multiple Regression
7 A. Limits of Bivariate Regression
B. Trivariate Regression
1. Visualization
2. The Residual Term
a. Definition
b. The SER and Degrees of Freedom
3. The (Two) Estimated Slope Coefficients
a. Partial Effects Equations, Models, and Venn Diagrams
b. Computing the Two Slope Coefficients
c. Variance and Confidence Intervals
d. Meaning and Interpretation
4. Holding One Variable Constant: What’s That All About?
5. The Impact on OLS Assumptions
C. Multiple Regression: The General OLS Model
1. The Slope Coefficient
a. Partial Effects Equations
b. Computing the Slope Coefficients
c. OLS Assumptions and the Gauss-Markov Theorem
d. Meaning and Interpretation
e. Variance and Confidence Intervals
2. The Residual Term
a. Definition
b. The SER and Degrees of Freedom
3. Degrees of Freedom: From One to Many Variables
———————————————————————————————————————
Packet 4. Summary and Review of Partial Effects and the Interpretation of “b”
8 5. Summary and Review of T-Stats, p-Values, and Hypothesis Tests
6. Units of the SER and Comparing SER’s Across Equations
7. R-Squared and Adjusted R-Squared
a. Review of the R-Squared Statistic
b. Inappropriateness of Comparing R-Squareds across Models
c. R-Squared and Functional Transformations
d. Multiple Independent Variables and the Effect on R-Squared
e. Computing and Interpreting the Adjusted R-Squared Value
8. Interactions
a. Description and Analogy to Functional Transformations
b. Models with an Interaction of Two Dummy Variables
c. Models with an Interaction of a Dummy and a Continuous Variable
d. Interpreting Models with Interactions (Values, Algebra, Graphs)
e. Model Specification (e.g., “Can I Exclude a Stand-Alone Term?”)
———————————————————————————————————————
ICPSR Summer Program Regression Analysis II Tim McDaniel
June/July 2014 SYLLABUS Page 9 of 21
Packet 9. Multicollinearity and Multicollinearity Diagnostics
9 a. Perfect Multicollinearity: An Example
b. Auxiliary R-Squared, Tolerance, and Variance Inflation Factor
c. Explaining Multicollinearity Using Venn Diagrams
d. Consequences, Including Possible “Backdoor Bias”
e. When to Suspect Multicollinearity Problems
f. How NOT to Diagnose Multicollinearity: Bivariate Correlations
g. Possible Remedies
h. A Statistics, Estimation, and Information (Not a Theory!) Problem
i. Multicollinearity and Models with Interaction Terms
j. Narrowing Down the Source of the Multicollinearity
10. Dummy and Categorical Independent Variables
a. Definition and Interpretation
b. The Importance of “Intervalness” for Independent Variables
c. Replacing a Categorical Independent Variable with Dummies
i. Implementation and Interpretation
ii. Excluding One Dummy Variable from the Model
d. Graphing Models with Dummy Variables (and Interactions)
e. Comparison: “Regression Forced Through Origin” to “Having X
in an Interaction, but Not as a Stand-Alone, Term”
f. Interpretation of Category Dummies and “Jumps”
———————————————————————————————————————
Packet 11. Functional Transformations
10 a. Things to Consider Regarding Transforming Y
b. Log Transformations and Constant Elasticity Models
c. Conditional Impacts and Slopes in Models with Interaction Terms
d. More on Models with an X-Squared (e.g., Threshold Models)
e. The Bend Rule
12. Model Specification
a. Review of Types of Specification Error
b. Omitting Relevant Variables: Derivation and Consequences
c. Including Irrelevant Variables: Derivation and Consequences
d. Variable Selection
e. Perils of Stepwise Regression
f. An Alternative to Standardization for Interval-Level Discrete X’s
13. Missing Data
a. Data Missing at Random: Dependent and Independent Variables
b. “Solutions” and Their Potential Problems
i. Casewise (Listwise) Deletion
ii. Pairwise Deletion
iii. Mean and Conditional Mean Substitution
iv. Other Methods (e.g., Profile Models)
14. Measurement Errors: In Y and in an X
15. Partial Effects Plots and Linearity in Multiple Regression Models
———————————————————————————————————————
ICPSR Summer Program Regression Analysis II Tim McDaniel
June/July 2014 SYLLABUS Page 10 of 21
Packet 16. Summary: The Effects of Multicollinearity and Specification Errors
11 on Slope Coefficient Estimation and Hypothesis Testing
a. Type I and Type II Errors
Assignment b. Flowcharts: Review of the Logic of Hypothesis Testing
#3 c. Essay: Hypothesis Testing and American Criminal Trials
Given 17. Review: Category Dummy Variables
18. Review: Models with Continuous, Dummy, and Interaction Terms
19. Review: Diagnostic Partial Plots
20. Omitted Variable Plots
21. Another Look at Outliers: What They Are and Why They Matter
22. Flowchart: “Tim McDaniel’s Guide to Dealing with Outliers”
23. Multiple Regression: A Computer Example Using ANES Data
a. Setting-Up the Example (American National Election Study)
b. Generation and Interpretation of Computer Output
i. Control Variables, Multicollinearity, and Diagnostic Plots
ii. Categorical Independent Variables, Intervalness, and “Jumps”
c. Review, Analysis, and Wrap-Up of Computer Example
24. Sub-Group Differences: “Dummy*Continuous” Interaction Terms
———————————————————————————————————————
Packet V. Analysis of Variance and the F-Test
12 A. The F Distribution
B. Total, Regression, and Error Sum of Squares... and the ANOVA Table
C. The F-Statistic and the F-Test
1. A Test Involving All of the Regression Coefficients
2. The Special Case When the F-Test and Student’s t-Test Are Identical
D. Analysis and Demonstrations Using Computer Output
1. Interpreting the F-Test: A “Randomly Generated Variables” Example
2. Another Look at R-Squared, Adjusted R-Squared, and SER
———————————————————————————————————————
Packet VI. Categorical Independent Variables (and F-Tests): A Closer Look
13 A. Problems using Categorical and Non-Interval Independent Variables
B. Review: Replacing a Categorical X with Dummy Variables in OLS
C. Various Tests Involving the F Distribution
Assignment 1. A Review of the Whole-Model F-Test in a Regression Environment
#4 2. Nested F-Tests: Testing Groups (Subsets) of Regression Coefficients
Given a. Purpose, Hypotheses, and Procedures
b. Group Significance of Multicollinear Variables (e.g., Interactions)
c. Equivalent to Testing the SER’s
3. The Chow Test
a. Purpose, Hypotheses, and Procedures
b. Applications: Structural Shifts and Aggregation Bias
c. Generalized (Multiple Subgroup) Chow Test and Aggregation Bias
4. Overview of Comparing “Safe” versus “Risky” Models
(Packet 13 is continued on the next page)

ICPSR Summer Program Regression Analysis II Tim McDaniel
June/July 2014 SYLLABUS Page 11 of 21
(Packet 13, continued from the previous page)
5. Comparison of SER’s With No Prior Knowledge of Relative Model
Performance (i.e., When There is No “Safe” or “Risky” Model)
6. Relative Statistical Contribution of Groups of Variables in a Model
(“Which Variable [or Group of Variables] Is ‘More Important’?”)
7. A General Discussion of F-Tests, Using ANOVA Terminology
D. Collapsing Categories of a Categorical Variable
1. Set-Up and Notation
2. Statistical Hypothesis Test for Collapsing Categories
E. Treating a Categorical Variable as Interval-Level
1. Set-Up and Notation, and “Contextually Interval”
2. Statistical Hypothesis Test for Intervalness
F. Monte Carlo Simulation Results: Which Dummy to Exclude
G. Generalizations of the F-Test
1. For Collapsing Categories and for Intervalness
2. For “Safe” and “Tested” Models in General
H. Optional: Discussion and Analysis of a Substantive Example (Venezuela)
1. Description of the Study
2. Statistical Tests Performed
3. Potential Effects of Multicollinearity
4. Different Specifications, Interpretations, and Conclusions
5. Interpretation of Manipulated Coefficients
———————————————————————————————————————
Packet VII. Dichotomous Dependent Variables and the Logit Model
14 A. Examples
B. The Binary Choice Model
1. Description and Illustration
Optional 2. Problems Using OLS with a Dichotomous Dependent Variable
Learning a. Over- or Under-Estimating Y
Exercise b. Var(e), Heteroskedasticity, and the Goldberger Procedure
Given c. Probable Non-Linearity
3. Using an S-Shaped Curve Instead of a Line
a. Description and Theory
(Note: b. Fit and Bias
The C. The Logit Model
Optional 1. The Logistic Function and Log-Odds
Learning 2. Interpreting Logit Coefficients
Exercise 3. Interpreting and Presenting the Results of Logit Analysis: An Example
is not 4. Estimating Coefficients: Maximum Likelihood Estimation
graded.) 5. Significance of Coefficients: The Likelihood Ratio Test and the Z Test
6. Using and Interpreting Logit Output: An Education Example
———————————————————————————————————————
ICPSR Summer Program Regression Analysis II Tim McDaniel
June/July 2014 SYLLABUS Page 12 of 21
Packet VIII. Matrices and Matrix Algebra
15 A. General Terms and Definitions
B. Addition, Subtraction, and Multiplication: How to Do It
(For you C. An Example: Matrix Multiplication and Lawyers
to review D. Inverse Matrices
over the E. Ranks and Singularity
weekend) F. Properties of Matrix Algebra
G. Expressing Linear Equations in Matrix Form: A Teaser...
———————————————————————————————————————
Packet XII. Outliers and Graphical Techniques (“Weird Points and Pretty Pictures”)
16 A. Outliers: Detection, Classification, and Possible Effects
1. Influence
a. Definition and Description
b. Detection Using Statistics
i. DFBETA and DFBETAS
ii. Cook’s Distance (D)
iii. DFFITS
2. Leverage
a. Definition and Description
b. Hat Values
3. Studentized Residuals
a. Definition, Calculation, and the Bonferroni Adjustment
b. A Note on Notation and Terminology (It’s a Mess...)
c. Case Dummies and Joint Cases
B. Diagnostic Plots and Graphical Techniques
1. Proportional Leverage Plots: Definition and Different Types
2. Jointly Influential Observations: Definition and Examples
3. Conditional Effects Plots
a. Definition, Description, Presentation, and Interpretation
b. Models with Interaction Terms (Including Confidence Bounds)
c. The Importance of “Conditional”
4. Jittered Data Plots (for Categorical Independent Variables)
5. Scatterplot Matrix
———————————————————————————————————————
Packet IX. Multiple Regression Using Matrices
17 A. The General Linear Model
B. OLS Using Matrices
C. The Matrix of Residuals
D. OLS Assumptions in Matrix Form
E. Variance-Covariance Matrices
F. Deriving “b” and Var(b)
G. SER, R-Squared, and Adjusted R-Squared in Matrix Form
H. Review: Multicollinearity
(Packet 17 is continued on the next page)
ICPSR Summer Program Regression Analysis II Tim McDaniel
June/July 2014 SYLLABUS Page 13 of 21
(Packet 17, continued from the previous page)
I. Ordinal and Dummy Variables: An Example Using Matrices
J. Example: A Singular X’X Matrix
K. Transformations and Interactions in Matrix Form: OLS is Still Linear
L. Appendix: A Proof that the Matrix Derivation of “B” Minimizes the SSE
———————————————————————————————————————
Packet X. Heteroskedasticity (and Generalized / Weighted Least Squares)
18 A. Definition and Omega Matrices
B. Variance-Covariance Matrices
C. Detection of Heteroskedasticity Using Diagnostic Plots
D. Types of Heteroskedasticity
E. When to Expect Heteroskedasticity
F. Consequences of Using OLS with Heteroskedastic Errors
G. Detection of Heteroskedasticity Using Statistical Tests
1. Goldfeld-Quandt Test
2. Glejser Test
3. Likelihood Ratio Test
H. Correcting for Heteroskedasticity Using Generalized Least Squares
1. Introduction, and Deriving the Slope Coefficients using GLS
2. Benefits of Using GLS When You Have Heteroskedastic Errors
3. GLS as Weighted Least Squares (WLS)
4. The Underlying Logic of WLS: An Example Using State-Level Data
5. Using GLS Given a Model for Var(e): The General Case
———————————————————————————————————————
Packet XI. Autocorrelation
19 A. Definition of First-Order Autocorrelation
B. When to Expect Autocorrelation
C. Algebraic Interpretation of First-Order Autocorrelation
D. Examples of Positive and Negative First-Order Autocorrelation
E. Four Common Types of Time Series Models
F. Consequences of Using OLS with Autocorrelation
G. Detection of Autocorrelation
1. Diagnostic Plots
2. Using a Bivariate Model
3. The Durbin-Watson Statistic (First-Order Autocorrelation)
a. Algebraic Derivation and Implementation
b. Some Things to Keep in Mind
4. The Wallis Test (Fourth-Order Autocorrelation)
H. Correcting for First-Order Autocorrelation
1. The Prais-Winsten GLS Estimator: Algebraic Procedure and Proofs
2. Some Other GLS Methods
———————————————————————————————————————
ICPSR Summer Program Regression Analysis II Tim McDaniel
June/July 2014 SYLLABUS Page 14 of 21
Packet XIII. More on Dichotomous Dependent Variables: The Probit Model
20 A. The Normal Distribution Revisited
1. The Standard Normal Distribution
2. The Normal (Gaussian) CDF
B. The Probit Function
C. Finding Probabilities Using the Normal Distribution
D. Interpreting and Presenting Probit Coefficients
E. Maximum Likelihood Estimation of Probit Models
F. Deciding Between Using Logit versus Probit Models
XIV. Chart: Some Potential Problems When Using OLS Regression Models
XV. Final Remarks
A. More than One Equation: Simultaneous Equations Models
B. Additional Topics for Further Study
C. The Importance of Parsimony and Presentation
D. The Dangers of Over-Reliance on Statistical Procedures
═══════════════════════════════════════════════════════
Some Suggested Readings
Again: The Lecture Transcript Notes that I wrote and we use in each class serve as the de facto
required textbook for this course. I advise you to use the outline in this syllabus (along with the
Table of Contents at the start of each Booklet) as a guide for these Lecture Transcript Notes.
The additional readings in this section of the syllabus (details of which can be found in the
Bibliography section that immediately follows) are totally optional for you.
Several of these readings are from the following four traditional textbooks, each of which I like a
lot. While there are many similarities between them, I think that each takes a somewhat different
(though at times only subtly different) pedagogical approach.
• Gujarati takes more of a “Math Language” (but neither advanced nor solely) approach.
• Hamilton takes more of a “Picture Language” (lots of graphics, etc.) approach.
• Kennedy takes more of an “English Language” (narrative explanations) approach.
• Wooldridge takes more of a “Combined” (and accessible and comprehensive) approach.
You will also notice several “little green books” from the Sage Series on Quantitative
Applications in the Social Sciences. Both the more recent ones and the older classics are very
useful as learning vehicles.
Finally, I have included several articles from a number of journals across several academic
disciplines—again, some that are older classics and some others that are more recent.
So... here are the suggested optional readings for each Packet of the Lecture Transcript Notes:
ICPSR Summer Program Regression Analysis II Tim McDaniel
June/July 2014 SYLLABUS Page 15 of 21
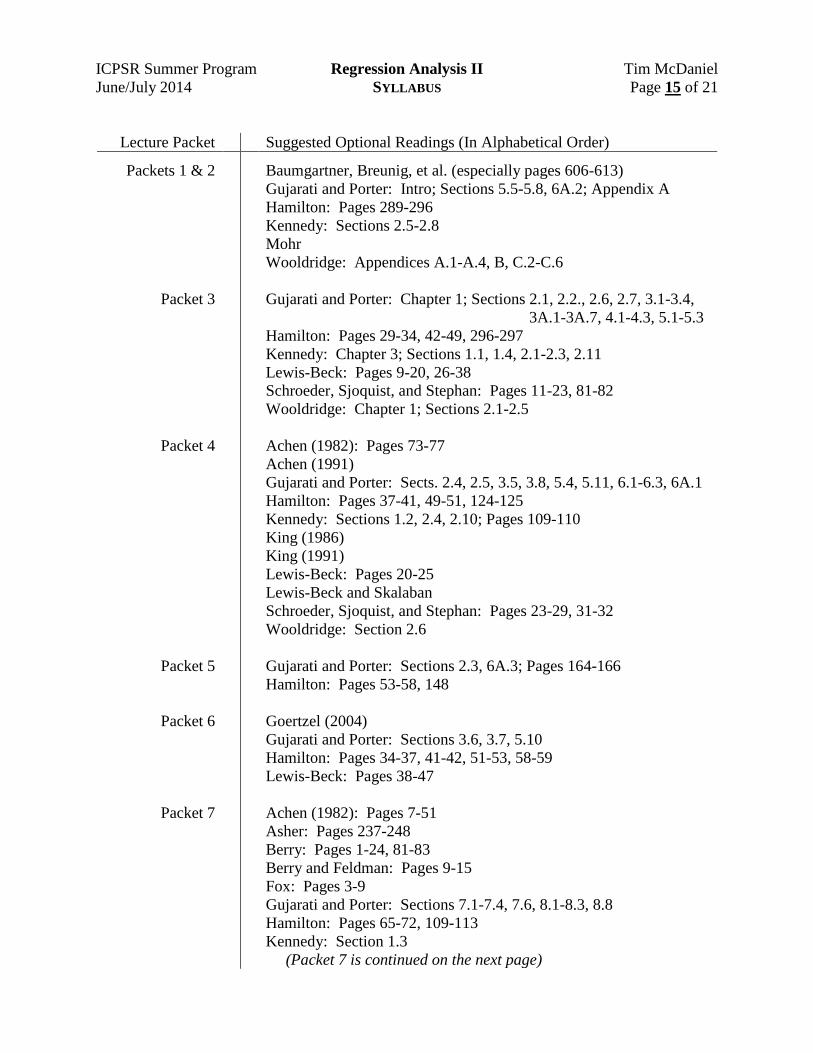
Lecture Packet Suggested Optional Readings (In Alphabetical Order)
Packets 1 & 2
Packet 3
Packet 4
Packet 5
Packet 6
Packet 7
Baumgartner, Breunig, et al. (especially pages 606-613)
Gujarati and Porter: Intro; Sections 5.5-5.8, 6A.2; Appendix A
Hamilton: Pages 289-296
Kennedy: Sections 2.5-2.8
Mohr
Wooldridge: Appendices A.1-A.4, B, C.2-C.6
Gujarati and Porter: Chapter 1; Sections 2.1, 2.2., 2.6, 2.7, 3.1-3.4,
3A.1-3A.7, 4.1-4.3, 5.1-5.3
Hamilton: Pages 29-34, 42-49, 296-297
Kennedy: Chapter 3; Sections 1.1, 1.4, 2.1-2.3, 2.11
Lewis-Beck: Pages 9-20, 26-38
Schroeder, Sjoquist, and Stephan: Pages 11-23, 81-82
Wooldridge: Chapter 1; Sections 2.1-2.5
Achen (1982): Pages 73-77
Achen (1991)
Gujarati and Porter: Sects. 2.4, 2.5, 3.5, 3.8, 5.4, 5.11, 6.1-6.3, 6A.1
Hamilton: Pages 37-41, 49-51, 124-125
Kennedy: Sections 1.2, 2.4, 2.10; Pages 109-110
King (1986)
King (1991)
Lewis-Beck: Pages 20-25
Lewis-Beck and Skalaban
Schroeder, Sjoquist, and Stephan: Pages 23-29, 31-32
Wooldridge: Section 2.6
Gujarati and Porter: Sections 2.3, 6A.3; Pages 164-166
Hamilton: Pages 53-58, 148
Goertzel (2004)
Gujarati and Porter: Sections 3.6, 3.7, 5.10
Hamilton: Pages 34-37, 41-42, 51-53, 58-59
Lewis-Beck: Pages 38-47
Achen (1982): Pages 7-51
Asher: Pages 237-248
Berry: Pages 1-24, 81-83
Berry and Feldman: Pages 9-15
Fox: Pages 3-9
Gujarati and Porter: Sections 7.1-7.4, 7.6, 8.1-8.3, 8.8
Hamilton: Pages 65-72, 109-113
Kennedy: Section 1.3
(Packet 7 is continued on the next page)
ICPSR Summer Program Regression Analysis II Tim McDaniel
June/July 2014 SYLLABUS Page 16 of 21
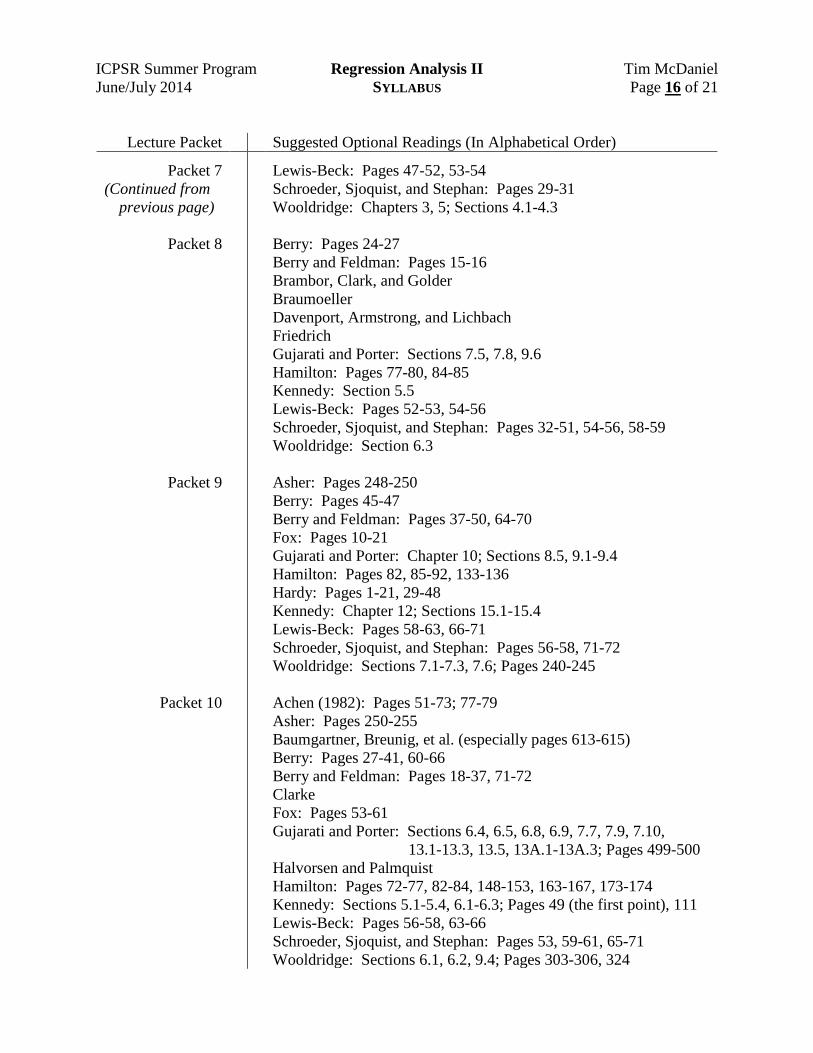
Lecture Packet Suggested Optional Readings (In Alphabetical Order)
Packet 7
(Continued from
previous page)
Packet 8
Packet 9
Packet 10
Lewis-Beck: Pages 47-52, 53-54
Schroeder, Sjoquist, and Stephan: Pages 29-31
Wooldridge: Chapters 3, 5; Sections 4.1-4.3
Berry: Pages 24-27
Berry and Feldman: Pages 15-16
Brambor, Clark, and Golder
Braumoeller
Davenport, Armstrong, and Lichbach
Friedrich
Gujarati and Porter: Sections 7.5, 7.8, 9.6
Hamilton: Pages 77-80, 84-85
Kennedy: Section 5.5
Lewis-Beck: Pages 52-53, 54-56
Schroeder, Sjoquist, and Stephan: Pages 32-51, 54-56, 58-59
Wooldridge: Section 6.3
Asher: Pages 248-250
Berry: Pages 45-47
Berry and Feldman: Pages 37-50, 64-70
Fox: Pages 10-21
Gujarati and Porter: Chapter 10; Sections 8.5, 9.1-9.4
Hamilton: Pages 82, 85-92, 133-136
Hardy: Pages 1-21, 29-48
Kennedy: Chapter 12; Sections 15.1-15.4
Lewis-Beck: Pages 58-63, 66-71
Schroeder, Sjoquist, and Stephan: Pages 56-58, 71-72
Wooldridge: Sections 7.1-7.3, 7.6; Pages 240-245
Achen (1982): Pages 51-73; 77-79
Asher: Pages 250-255
Baumgartner, Breunig, et al. (especially pages 613-615)
Berry: Pages 27-41, 60-66
Berry and Feldman: Pages 18-37, 71-72
Clarke
Fox: Pages 53-61
Gujarati and Porter: Sections 6.4, 6.5, 6.8, 6.9, 7.7, 7.9, 7.10,
13.1-13.3, 13.5, 13A.1-13A.3; Pages 499-500
Halvorsen and Palmquist
Hamilton: Pages 72-77, 82-84, 148-153, 163-167, 173-174
Kennedy: Sections 5.1-5.4, 6.1-6.3; Pages 49 (the first point), 111
Lewis-Beck: Pages 56-58, 63-66
Schroeder, Sjoquist, and Stephan: Pages 53, 59-61, 65-71
Wooldridge: Sections 6.1, 6.2, 9.4; Pages 303-306, 324

ICPSR Summer Program Regression Analysis II Tim McDaniel
June/July 2014 SYLLABUS Page 17 of 21
Lecture Packet Suggested Optional Readings (In Alphabetical Order)
Packet 11
Packet 12
Packet 13
Packet 14
Packet 15
Packet 16
Achen (2002)
Achen (2005)
Berry: Pages 41-45, 49-60
Eisenberg and Wells
Hamilton: Pages 158-163
Lewis-Beck: Pages 71-73
Schroeder, Sjoquist, and Stephan: Pages 63-65
Wooldridge: Sections 4.6, 6.4
Berry and Feldman: Pages 17-18
Gujarati and Porter: Sections 5.9, 8.4
Hamilton: Pages 92-101
Mock and Weisberg
Schroeder, Sjoquist, and Stephan: Pages 51-52
Wooldridge: Pages 152-153
Fox: Pages 61-65
Gujarati and Porter: Sections 8.7, 9.5, 13.7
Hamilton: Pages 80-82, 101
Hardy: Pages 21-29, 48-53, 78-82, 84-85
Kennedy: Sections 4.3, 4.4
McDaniel
Wooldridge: Section 4.4; Pages 143-152, 245-248
Ai and Norton
Berry: Pages 47-49
Gujarati and Porter: Sections 15.1-15.8, 15A.1
Hamilton: Chapter 7
Hardy: Pages 75-78
Kennedy: Sections 2.9, 4.5, 16.1
Markus: Pages 555-556
Menard: Chapters 1-4; Appendix
Pampel: Chapters 1-3; Appendix
Schroeder, Sjoquist, and Stephan: Pages 79-80
Wooldridge: Sections 7.5, 17.1
Gujarati and Porter: Appendices B.1-B.3
Hamilton: Pages 333-337, 344-345
Wooldridge: Appendices D.1-D.5
Bollen and Jackman
Chatterjee and Wiseman
Fox: Pages 21-40
(Packet 16 is continued on the next page)
ICPSR Summer Program Regression Analysis II Tim McDaniel
June/July 2014 SYLLABUS Page 18 of 21
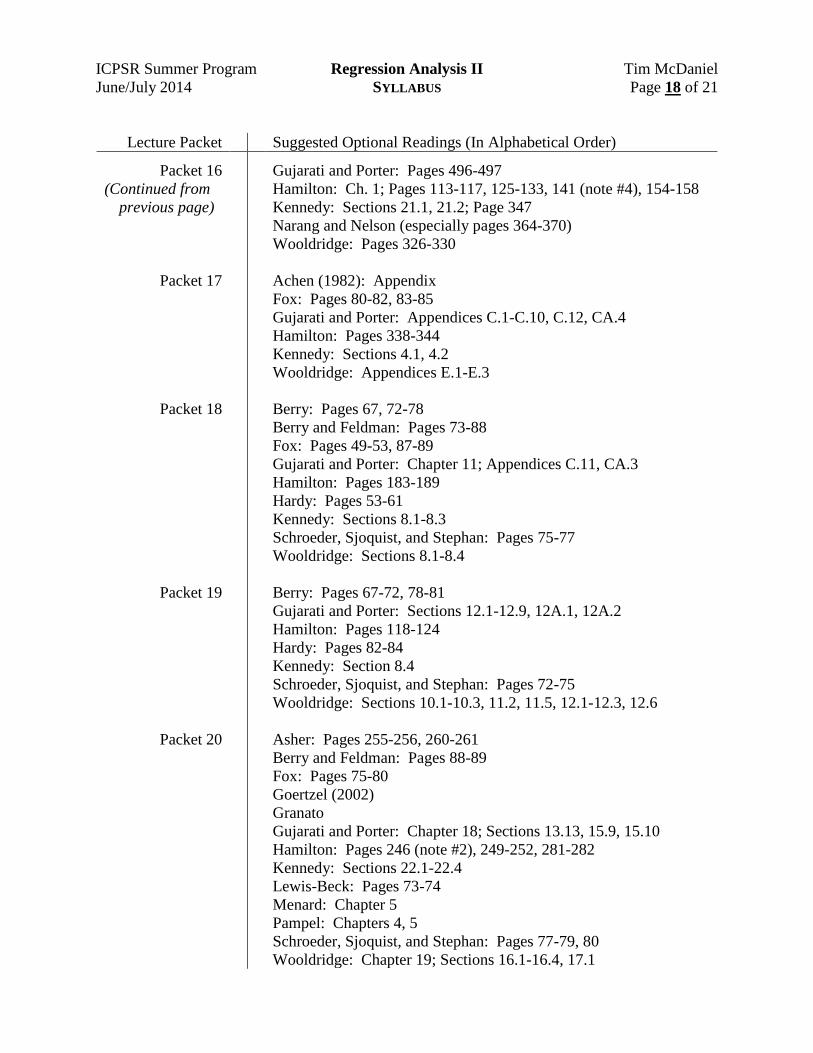
Lecture Packet Suggested Optional Readings (In Alphabetical Order)
Packet 16
(Continued from
previous page)
Packet 17
Packet 18
Packet 19
Packet 20
Gujarati and Porter: Pages 496-497
Hamilton: Ch. 1; Pages 113-117, 125-133, 141 (note #4), 154-158
Kennedy: Sections 21.1, 21.2; Page 347
Narang and Nelson (especially pages 364-370)
Wooldridge: Pages 326-330
Achen (1982): Appendix
Fox: Pages 80-82, 83-85
Gujarati and Porter: Appendices C.1-C.10, C.12, CA.4
Hamilton: Pages 338-344
Kennedy: Sections 4.1, 4.2
Wooldridge: Appendices E.1-E.3
Berry: Pages 67, 72-78
Berry and Feldman: Pages 73-88
Fox: Pages 49-53, 87-89
Gujarati and Porter: Chapter 11; Appendices C.11, CA.3
Hamilton: Pages 183-189
Hardy: Pages 53-61
Kennedy: Sections 8.1-8.3
Schroeder, Sjoquist, and Stephan: Pages 75-77
Wooldridge: Sections 8.1-8.4
Berry: Pages 67-72, 78-81
Gujarati and Porter: Sections 12.1-12.9, 12A.1, 12A.2
Hamilton: Pages 118-124
Hardy: Pages 82-84
Kennedy: Section 8.4
Schroeder, Sjoquist, and Stephan: Pages 72-75
Wooldridge: Sections 10.1-10.3, 11.2, 11.5, 12.1-12.3, 12.6
Asher: Pages 255-256, 260-261
Berry and Feldman: Pages 88-89
Fox: Pages 75-80
Goertzel (2002)
Granato
Gujarati and Porter: Chapter 18; Sections 13.13, 15.9, 15.10
Hamilton: Pages 246 (note #2), 249-252, 281-282
Kennedy: Sections 22.1-22.4
Lewis-Beck: Pages 73-74
Menard: Chapter 5
Pampel: Chapters 4, 5
Schroeder, Sjoquist, and Stephan: Pages 77-79, 80
Wooldridge: Chapter 19; Sections 16.1-16.4, 17.1
ICPSR Summer Program Regression Analysis II Tim McDaniel
June/July 2014 SYLLABUS Page 19 of 21
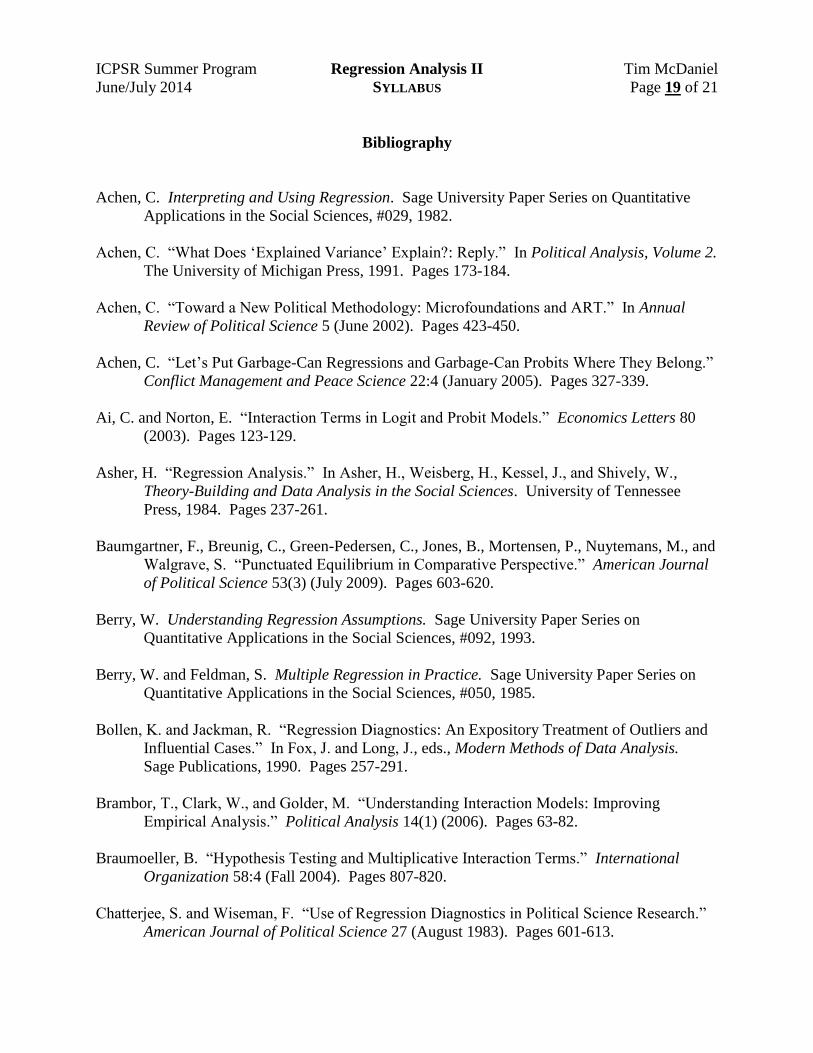
Bibliography
Achen, C. Interpreting and Using Regression. Sage University Paper Series on Quantitative
Applications in the Social Sciences, #029, 1982.
Achen, C. “What Does ‘Explained Variance’ Explain?: Reply.” In Political Analysis, Volume 2.
The University of Michigan Press, 1991. Pages 173-184.
Achen, C. “Toward a New Political Methodology: Microfoundations and ART.” In Annual
Review of Political Science 5 (June 2002). Pages 423-450.
Achen, C. “Let’s Put Garbage-Can Regressions and Garbage-Can Probits Where They Belong.”
Conflict Management and Peace Science 22:4 (January 2005). Pages 327-339.
Ai, C. and Norton, E. “Interaction Terms in Logit and Probit Models.” Economics Letters 80
(2003). Pages 123-129.
Asher, H. “Regression Analysis.” In Asher, H., Weisberg, H., Kessel, J., and Shively, W.,
Theory-Building and Data Analysis in the Social Sciences. University of Tennessee
Press, 1984. Pages 237-261.
Baumgartner, F., Breunig, C., Green-Pedersen, C., Jones, B., Mortensen, P., Nuytemans, M., and
Walgrave, S. “Punctuated Equilibrium in Comparative Perspective.” American Journal
of Political Science 53(3) (July 2009). Pages 603-620.
Berry, W. Understanding Regression Assumptions. Sage University Paper Series on
Quantitative Applications in the Social Sciences, #092, 1993.
Berry, W. and Feldman, S. Multiple Regression in Practice. Sage University Paper Series on
Quantitative Applications in the Social Sciences, #050, 1985.
Bollen, K. and Jackman, R. “Regression Diagnostics: An Expository Treatment of Outliers and
Influential Cases.” In Fox, J. and Long, J., eds., Modern Methods of Data Analysis.
Sage Publications, 1990. Pages 257-291.
Brambor, T., Clark, W., and Golder, M. “Understanding Interaction Models: Improving
Empirical Analysis.” Political Analysis 14(1) (2006). Pages 63-82.
Braumoeller, B. “Hypothesis Testing and Multiplicative Interaction Terms.” International
Organization 58:4 (Fall 2004). Pages 807-820.
Chatterjee, S. and Wiseman, F. “Use of Regression Diagnostics in Political Science Research.”
American Journal of Political Science 27 (August 1983). Pages 601-613.
ICPSR Summer Program Regression Analysis II Tim McDaniel
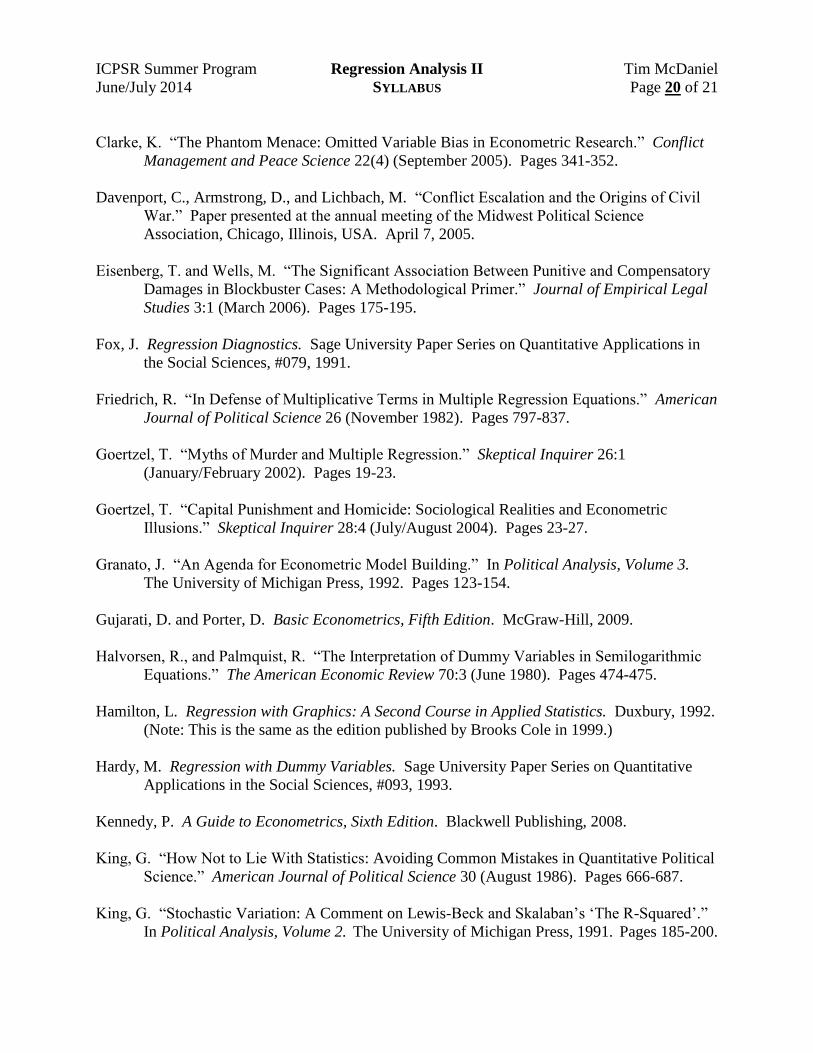
June/July 2014 SYLLABUS Page 20 of 21
Clarke, K. “The Phantom Menace: Omitted Variable Bias in Econometric Research.” Conflict
Management and Peace Science 22(4) (September 2005). Pages 341-352.
Davenport, C., Armstrong, D., and Lichbach, M. “Conflict Escalation and the Origins of Civil
War.” Paper presented at the annual meeting of the Midwest Political Science
Association, Chicago, Illinois, USA. April 7, 2005.
Eisenberg, T. and Wells, M. “The Significant Association Between Punitive and Compensatory
Damages in Blockbuster Cases: A Methodological Primer.” Journal of Empirical Legal
Studies 3:1 (March 2006). Pages 175-195.
Fox, J. Regression Diagnostics. Sage University Paper Series on Quantitative Applications in
the Social Sciences, #079, 1991.
Friedrich, R. “In Defense of Multiplicative Terms in Multiple Regression Equations.” American
Journal of Political Science 26 (November 1982). Pages 797-837.
Goertzel, T. “Myths of Murder and Multiple Regression.” Skeptical Inquirer 26:1
(January/February 2002). Pages 19-23.
Goertzel, T. “Capital Punishment and Homicide: Sociological Realities and Econometric
Illusions.” Skeptical Inquirer 28:4 (July/August 2004). Pages 23-27.
Granato, J. “An Agenda for Econometric Model Building.” In Political Analysis, Volume 3.
The University of Michigan Press, 1992. Pages 123-154.
Gujarati, D. and Porter, D. Basic Econometrics, Fifth Edition. McGraw-Hill, 2009.
Halvorsen, R., and Palmquist, R. “The Interpretation of Dummy Variables in Semilogarithmic
Equations.” The American Economic Review 70:3 (June 1980). Pages 474-475.
Hamilton, L. Regression with Graphics: A Second Course in Applied Statistics. Duxbury, 1992.
(Note: This is the same as the edition published by Brooks Cole in 1999.)
Hardy, M. Regression with Dummy Variables. Sage University Paper Series on Quantitative
Applications in the Social Sciences, #093, 1993.
Kennedy, P. A Guide to Econometrics, Sixth Edition. Blackwell Publishing, 2008.
King, G. “How Not to Lie With Statistics: Avoiding Common Mistakes in Quantitative Political
Science.” American Journal of Political Science 30 (August 1986). Pages 666-687.
King, G. “Stochastic Variation: A Comment on Lewis-Beck and Skalaban’s ‘The R-Squared’.”
In Political Analysis, Volume 2. The University of Michigan Press, 1991. Pages 185-200.
ICPSR Summer Program Regression Analysis II Tim McDaniel
June/July 2014 SYLLABUS Page 21 of 21
Lewis-Beck, M. Applied Regression: An Introduction. Sage University Paper Series on
Quantitative Applications in the Social Sciences, #022, 1980.
Lewis-Beck, M. and Skalaban, A. “The R-Squared: Some Straight Talk.” In Political Analysis,
Volume 2. Ann Arbor: The University of Michigan Press, 1991. Pages 153-171.
Markus, G. “Political Attitudes during an Election Year: A Report on the 1980 NES Panel
Study.” American Political Science Review 76 (September 1982). Pages 538-560.
McDaniel, T. “Categorical Independent Variables in Ordinary Least Squares Regression.”
Unpublished manuscript, 2001.
Menard, S. Applied Logistic Regression Analysis, Second Edition. Sage University Paper Series
on Quantitative Applications in the Social Sciences, #106, 2001.
Mock, C. and Weisberg, H. “Political Innumeracy: Encounters with Coincidence, Improbability,
and Chance.” American Journal of Political Science 36 (November 1992). Pages
1023-1046.
Mohr, L. Understanding Significance Testing. Sage University Paper Series on Quantitative
Applications in the Social Sciences, #073, 1990.
Narang, V. and Nelson, R. “Who Are These Belligerent Democratizers? Reassessing the Impact
of Democratization on War.” International Organization 63 (Spring 2009). Pages
357-379.
Pampel, F. Logistic Regression: A Primer. Sage University Paper Series on Quantitative
Applications in the Social Sciences, #132, 2000.
Schroeder, L., Sjoquist, D., and Stephan, P. Understanding Regression Analysis. Sage
University Paper Series on Quantitative Applications in the Social Sciences, #057, 1986.
Wooldridge, J. Introductory Econometrics: A Modern Approach, Fifth Edition. Cengage/South-
Western, 2013.