registered bank disclosure statement · total liabilities of the branch net of amounts due to...
TRANSCRIPT

REGISTERED BANK DISCLOSURE STATEMENT
30 SEPTEMBER 2015
THE BANK OF TOKYO-MITSUBISHI UFJ, LTD AUCKLAND BRANCH

The Bank of Tokyo-Mitsubishi UFJ, Ltd Auckland Branch
TABLE OF CONTENTS Disclosure Statement Page 1. Corporate Information 1 2. Recognition and Priority of Claims of Creditors or Classes in the Event of Insolvency 1 3. Excess of Assets Over Deposit Liabilities 1 4. Guarantee Arrangement 1 5. Directorate 1 6. Auditors 2 7. Conditions of Registration 3 8. Credit Rating 3 9. Other Material Matters 3 10. Financial Statements of the Registered Bank and the Overseas Banking Group 4 11. Directors’ and General Manager Auckland Branch’s Statement 5
Condensed Interim Financial Statements Condensed Statement of Comprehensive Income 6 Condensed Statement of Changes in Equity 7 Condensed Statement of Financial Position 8 Condensed Statement of Cash Flows 9
Notes to Condensed Interim Financial Statements 1. Statement of Significant Accounting Policies 11 2. Profit Before Income Tax Expense 12 3. Property, Plant and Equipment 13 4. Loans and Advances 13 5. Deposits 13 6. Total Liabilities of the Branch Net of Amounts Due to Related Parties 13 7. Other Liabilities 14 8. Commitments and Contingent Liabilities 14 9. Related Party Disclosures 15 10. Concentration of Credit Risk 16 11. Concentration of Funding 21

The Bank of Tokyo-Mitsubishi UFJ, Ltd Auckland Branch
TABLE OF CONTENTS
Notes to Condensed Interim Financial Statements
12. Interest Rate Risk 22 13. Maturity Analysis for Assets and Liabilities 23 14. Fair Value of Financial Instruments 24 15. Liquidity Risk Management 27 16. Profitability and Size 28 17. Asset Quality 28 18. Exposures to Market Risk 30 19. Capital Adequacy 31 20. Credit Exposures to Individual Counterparties 31 21. Insurance Business 31 22. Non-Consolidated Activities 32 23. Securitization, Funds Management, and Other Fiduciary Activities 32 24. Risk Management Policies 32 25. Financial Support 32 26. Subsequent Events 32 Auditor’s Review Report

The Bank of Tokyo-Mitsubishi UFJ, Ltd Auckland Branch
Disclosure Statement For the Six Months Ended 30 September 2015
1
This Disclosure Statement contains information as required by the Registered Bank Disclosure Statements (Overseas Incorporated Registered Banks) Order 2014 ( as amended) (‘the Order’). 1. Corporate Information
The ‘Overseas Banking Group’ includes all entities consolidated for the purposes of public reporting in Japan including The Bank of Tokyo-Mitsubishi UFJ, Ltd., its subsidiaries, and associated companies. The Disclosure Statement and Condensed Interim Financial Statements are for the Auckland Branch (the ‘Branch’) of The Bank of Tokyo-Mitsubishi UFJ, Ltd. It is the only member in the ‘Banking Group’ in New Zealand. The Ultimate Holding Company of The Bank of Tokyo-Mitsubishi UFJ, Ltd. is Mitsubishi UFJ Financial Group, Inc. incorporated in Japan. Since the balance date of the last full year Disclosure Statement, there has been no change in the Ultimate Holding Company and no material changes in regulations, legislation, or other restrictions of a legally enforceable nature that may materially inhibit the Ultimate Holding Company from providing material financial support to the Banking Group.
2. Recognition and Priority of Claims of Creditors or Classes in the Event of Insolvency
Since the balance date for the last full year Disclosure Statement there have been no material changes in any material legislative or regulatory restrictions in Japan that, in the event of a liquidation of the Registered Bank, subordinate the claims of any class of unsecured creditors of the Branch on the assets of the Registered Bank to those of any other class of unsecured creditors of the Registered Bank.
3. Excess of Assets Over Deposit Liabilities
There have been no material changes in any statute that requires the Registered Bank to hold in New Zealand an excess of assets over deposit liabilities since the balance date of the last full year Disclosure Statement. There have been no material changes in any regulatory or legislative requirements in Japan that require the Registered Bank to maintain sufficient assets to cover an ongoing obligation to pay deposit liabilities in Japan since the balance date for the last full year Disclosure Statement.
4. Guarantee Arrangement
The obligations of the Banking Group are not guaranteed under any guarantee (including government guarantee and cross guaranteeing arrangements) as at the date of signing this Disclosure Statement.
5. Directorate
5.1 Directors of The Bank of Tokyo-Mitsubishi UFJ, Ltd. as of 30 September 2015:
Name Occupation Residence Katsunori Nagayasu Chairman Japan Kiyoshi Sono Deputy Chairman Japan Nobuyuki Hirano President Japan

The Bank of Tokyo-Mitsubishi UFJ, Ltd Auckland Branch
Disclosure Statement For the Six Months Ended 30 September 2015
2
Directors of The Bank of Tokyo-Mitsubishi UFJ, Ltd., (continued) Takashi Morimura Deputy President Japan Takeshi Ogasawara Deputy President Japan Hidekazu Fukumoto Deputy President Japan Takashi Morisaki Deputy President Japan Takashi Oyamada Deputy President Japan Saburo Araki Senior Managing Director Japan Naoto Hirota Senior Managing Director Japan Tadashi Kuroda Senior Managing Director Japan Satoshi Murabayashi Senior Managing Director Japan Shuzo Iwasaki Managing Director Japan Muneaki Tokunari Managing Director Japan Takahiro Yanai Managing Director Japan Akira Hamamoto Managing Director Japan Masamichi Yasuda Managing Director Japan Teruo Ozaki Director Japan Shuzo Sumi Director Japan
The following changes in Directors of The Bank of Tokyo-Mitsubishi UFJ, Ltd. since the last full year disclosure statement were: Tadachiyo Osada resigned as Senior Managing Director on 24 June 2015. Takehiko Shimamoto resigned as Managing Director on 24 June 2015. Taihei Yuki resigned as Director on 24 June 2015. Tadashi Kuroda appointed as Senior Managing Director on 24 June 2015. Muneaki Tokunari appointed as Managing Director on 24 June 2015. Takahiro Yanai appointed as Managing Director on 24 June 2015. Akira Hamamoto appointed as Managing Director on 24 June 2015. Masamichi Yasuda appointed as Managing Director on 24 June 2015.
5.2 Signatories who have signed the Disclosure Statement. Responsible Person signing on behalf
of Directors and New Zealand Chief Executive Officer:
Name Occupation Residence Toru Masutani Regional Head for Oceania, Australia
General Manager (Responsible Person on behalf
of the Directors) Michael Ryff General Manager, Auckland Branch New Zealand
(New Zealand Chief Executive Officer)
6. Auditors Name and Address of Auditor whose report is referred to in this Disclosure Statement:
Deloitte Deloitte Centre 80 Queen Street Auckland 1010 New Zealand

The Bank of Tokyo-Mitsubishi UFJ, Ltd Auckland Branch
Disclosure Statement For the Six Months Ended 30 September 2015
3
7. Conditions of Registration There has been no change to the conditions of registration since the last disclosure statement as at 30 June 2015 to 30 September 2015. However, changes have been made to the conditions of registration to be applied on and after 1 November 2015. Changes mainly refer to (i) a new revised version of “Framework for Restrictions on High-LVR Residential Mortgage lending”(BS19),(ii) impose revised High-LVR speed limits in line with the revised BS19 and remove certain conditions in relation to the LVR restriction, and (iii) to remove superseded reference to the Financial Reporting Act 1993 and redundant capital adequacy requirements . There has been no impact on the Branch.
8. Credit Rating
The Registered Bank has the following long term credit ratings which are applicable to the Banking Group in New Zealand.
Rating scales are:
Standard & Poor’s and Fitch – Ratings are modified by the addition of a plus (+) or minus (-) sign to
show relative standing within the major rating categories. Moody’s – A numeric modifier is applied to each generic rating category from Aa to B, indicating that the counterparty is (1) in the higher end of its letter-rating category, (2) in mid-range, (3) in lower end.
9. Other Material Matters
There are no matters relating to the business or affairs of the Registered Bank and its Banking Group that are not contained elsewhere in the Disclosure Statement, and would, if disclosed, materially affect the decision of a person to subscribe for debt securities of which the Registered Bank or any member of its Banking Group is the issuer.
Current Rating Previous Rating (if changed in the
previous two years)
Date of Change
Standard & Poor’s A+ - - Moody’s A1 Aa3 2 December 2014 Fitch A - -
Credit Ratings S&P’s Moody’s Fitch
Highest quality/Extremely strong capacity to pay interest and principal AAA Aaa AAA
High quality/Very strong capacity to pay interest and principal AA Aa AA
Upper medium grade/Strong capacity to pay interest and principal A A A
Medium grade (lowest investment grade)/Adequate ability to pay interest and principal
BBB Baa BBB
Predominantly speculative/Less near term vulnerability to default BB Ba BB
Speculative, low grade/Great vulnerability B B B
Poor to default/identifiable vulnerability CCC Caa CCC
Highest speculations CC Ca CC
Lowest quality, no interest C C C
Defaulted on obligations D - D

The Bank of Tokyo-Mitsubishi UFJ, Ltd Auckland Branch
Disclosure Statement For the Six Months Ended 30 September 2015
4
10. Financial Statements of the Registered Bank and the Overseas Banking Group
The most recent publicly available Disclosure Statement for the Banking Group can be accessed via the Branch’s website: www.nz.bk.mufg.jp. Copies of the most recent publicly available Disclosure Statement for the Banking Group will be provided within two working days at no charge to any person who requests a copy. The most recent publicly available Financial Statements of the Registered Bank and the Overseas Banking Group may be accessed via the Bank’s global website: www.mufg.jp. In addition, Financial Statements are also prepared and filed with the United States Securities and Exchange Commission, Washington, D.C.


The Bank of Tokyo-Mitsubishi UFJ, Ltd Auckland Branch
Condensed Interim Financial Statements For the Six Month Ended 30 September 2015
6
Condensed Statement of Comprehensive Income
Note Six Months ended 30 September 2015
Six Months ended 30 September 2014
Unaudited Unaudited NZD NZD Interest income 2 57,263,400 64,849,437 Interest expense 2 (51,356,280) (56,858,168) Net interest income 5,907,120 7,991,269 Fees and commission income 2 6,287,487 7,793,146 Gains less losses on financial instruments 2 (197,931) (819,144) Total operating income and losses 6,089,556 6,974,002 Occupancy expenses 2 (130,149) (130,591) Personnel expenses 2 (1,553,893) (1,397,171) Auditors’ remuneration 2 (46,085) (90,224) Administration and other expenses 2 (484,829) (812,007) Profit before provision for credit impairment and income tax expense
9,781,720
12,535,278
Write back for credit impairment 2 - 379,015 Profit before income tax expense 9,781,720 12,914,293 Income tax expense (952,482) (2,578,981) Profit from continuing operations 8,829,238 10,335,312 Other comprehensive income Items that may be reclassified subsequently to profit or loss Available-for-sale securities
- Profit arising during the year 863,398 492,784 - Add: Reclassification adjustment for
loss included in profit or loss 195,521 412,361 1,058,919 905,145
Income tax expense on available-for-sale securities (296,497) (253,441)
Other comprehensive income, net of tax 762,422 651,704 Total comprehensive income, net of tax 9,591,660 10,987,016
The condensed interim statement of comprehensive income is to be read in conjunction with the accompanying notes to and forming part of the condensed interim financial statements

The Bank of Tokyo-Mitsubishi UFJ, Ltd Auckland Branch
Condensed Interim Financial Statements For the Six Month Ended 30 September 2015
7
Condensed Statement of Changes in Equity Unaudited NZD
Head Office Capital
Retained Earnings
Available-for-sale
Revaluation Reserve Total
Balance at 1 April 2014 83,000,000 15,292,760 (900,459) 97,392,301 Profit from continuing operations - 10,335,312 - 10,335,312 Other comprehensive income net of tax - - 651,704 651,704 Total comprehensive income, net of tax - 10,335,312 651,704 10,987,016 Balance at 30 September 2014 83,000,000 25,628,072 (248,755) 108,379,317 Balance at 1 April 2015 83,000,000 14,793,234 652,528 98,445,762 Profit from continuing operations - 8,829,238 - 8,829,238 Other comprehensive income, net of tax - - 762,422 762,422 Total comprehensive income, net of tax - 8,829,238 762,422 9,591,660 Balance at 30 September 2015 83,000,000 23,622,472 1,414,950 108,037,422 The condensed interim statement of changes in equity is to be read in conjunction with the accompanying notes to and forming part of the condensed interim financial statements.

The Bank of Tokyo-Mitsubishi UFJ, Ltd Auckland Branch
Condensed Interim Financial Statements For the Six Month Ended 30 September 2015
8
Condensed Statement of Financial Position
Note
As at 30 September
2015
As at 30 September
2014
As at 31 March
2015
Unaudited Unaudited Audited
NZD NZD NZD
Assets Cash and short term liquid assets 29,079,287 28,983,418 22,447,350 Amounts due from related parties 9 66,768,818 30,019,231 60,335,239 Amounts due from other financial institutions 104,570,078 54,757,663 54,578,617 Available-for-sale securities 121,384,723 224,665,080 223,252,028 Corporate loans originated by the Bank 4 2,355,035,619 2,648,930,405 2,624,567,904 Acceptances of customers - 133,129 - Derivative instruments 21,509,412 12,029,450 12,618,722 Other assets 1,225,673 1,284,251 2,277,953 Current tax asset 1,864,652 771,326 447,881 Deferred tax asset 17,881,007 9,598,456 17,885,055 Property, plant and equipment 3 460,432 676,798 575,310 Total Assets 2,719,779,701 3,011,849,207 3,018,986,059
Liabilities Amounts due to related parties 9 2,246,481,303 2,744,505,986 2,705,545,367 Deposits and commercial paper 5 338,453,396 145,613,517 201,275,541 Acceptances - 133,129 - Derivative instruments 21,614,889 11,816,071 12,456,131 Other liabilities 7 5,192,691 1,401,187 1,263,258 Total Liabilities 2,611,742,279 2,903,469,890 2,920,540,297
Equity Head Office capital 9 83,000,000 83,000,000 83,000,000 Retained earnings 23,622,472 25,628,072 14,793,234 Available-for-sale revaluation reserve 1,414,950 (248,755) 652,528 Total Equity 108,037,422 108,379,317 98,445,762
Total Liabilities and Equity 2,719,779,701 3,011,849,207 3,018,986,059
Total Interest Earning and Discount Bearing Assets 2,610,069,707 2,957,336,566 2,924,845,899 Total Interest and Discount Bearing Liabilities 2,569,741,317 2,874,144,346 2,890,153,464
The condensed interim statement of financial position is to be read in conjunction with the accompanying notes to and forming part of the condensed interim financial statements.

The Bank of Tokyo-Mitsubishi UFJ, Ltd Auckland Branch
Condensed Interim Financial Statements For the Six Month Ended 30 September 2015
9
Condensed Statement of Cash Flows
Six Months ended 30 September 2015
Six Months ended 30 September 2014
Unaudited Unaudited NZD NZD Cash Flows from Operating Activities
Interest income received 63,148,937 61,362,783 Commission fees & trading income 6,138,570 6,649,970 Interest paid (51,216,342) (55,853,002) Payment to suppliers, employees and others (2,125,281) (1,944,202)
Net cash flows from operating activities before changes in operating assets and liabilities 15,945,884 10,215,549
Net (increase) / decrease in operating assets:
Net decrease in corporate loans originated by the Bank 268,157,832 332,407,686 Net (increase) / decrease in amounts due from other financial institutions (49,991,461) 35,109,677 Net decrease in available-for-sale securities 98,415,140 61,705,065 Net (increase) in amounts due from related parties (6,433,579) (6,785,520) Net decrease in other assets 1,258,465 323,972
311,406,397 422,760,880 Net increase / (decrease) in operating liabilities:
Net increase in commercial paper and deposits 135,248,471 20,550,512 Net (decrease) in amounts due to related parties (457,274,618) (467,799,346) Net increase / (decrease) in other liabilities 3,991,853 (273,327)
(318,034,294) (447,522,161) Net cash flows from operating activities before income tax 9,317,987 (14,545,732)
Net tax paid (2,661,702) (1,962,800)
Net cash flows from operating activities 6,656,285 (16,508,532)
Cash Flows from Investing Activities
Payment for property, plant and equipment (24,348) (9,003)
Net cash flows from investing activities (24,348) (9,003)
Cash Flows from Financing Activities
Remittance to the Overseas Bank - - Capital injection - -
Net cash flows from financing activities - -
Net Change in Cash and Cash Equivalents
Net increase / (decrease) in cash and cash equivalents 6,631,937 (16,517,534) Cash and cash equivalents at beginning of year 22,447,350 45,500,952
Cash and cash equivalents at end of the period 29,079,287 28,983,418
Reconciliation of Closing Cash and Cash Equivalents
Cash and short term liquid assets 29,079,287 28,983,418
Closing cash and cash equivalents 29,079,287 28,983,418
The condensed interim statement of cash flows is to be read in conjunction with the accompanying notes to and forming part of the condensed interim financial statements.

The Bank of Tokyo-Mitsubishi UFJ, Ltd Auckland Branch
Condensed Interim Financial Statements For the Six Month Ended 30 September 2015
10
Condensed Statement of Cash Flows (continued)
Six Months ended 30 September 2015
Six Months ended 30 September 2014
Unaudited Unaudited NZD NZD
Reconciliation of profit from continuing operations to net cash flows from operating activities Profit from continuing operations 8,829,238 10,335,312 Decrease in corporate loans 269,532,285 330,445,520 (Increase) / decrease in due from other financial institutions (49,991,461) 35,109,677 Decrease in available-for-sale securities 102,926,224 60,559,592 (Increase) in due from related parties (6,433,579) (6,785,520) Decrease in other assets 1,052,279 630,547 (Decrease) / increase in certificate of deposit (23,182,246) 3,223,011 Increase in commercial paper and deposits 160,360,100 17,290,870 (Decrease) in due to related parties (459,064,064) (466,757,548) Increase / (decrease) in other payable 3,983,398 (656,489) (Decrease) in provision for credit impairment - (379,015) Movement in tax provision (1,709,220) 616,182 Non-Cash items: Depreciation of property, plant and equipment 131,915 136,797 Other 221,417 (277,466) Net cash flows from operating activities 6,656,286 (16,508,530)
The condensed interim statement of cash flows is to be read in conjunction with the accompanying notes to and forming part of the condensed interim financial statements.

The Bank of Tokyo-Mitsubishi UFJ, Ltd Auckland Branch
Notes to the Condensed Interim Financial Statements For the Six Months Ended 30 September 2015
11
1. Statement of Significant Accounting Policies a) Statement of Compliance
The Bank of Tokyo-Mitsubishi UFJ, Ltd., Auckland Branch (the Branch) operates in Auckland, New Zealand and the Registered Bank is incorporated in Japan. The Branch is profit-oriented and is an FMC Reporting Entity under the Financial Markets Conduct Act 2013. The condensed interim financial statements of the Branch incorporated in this Disclosure Statement have been prepared in accordance with Generally Accepted Accounting Practice in New Zealand (‘NZ GAAP’) and comply with the requirements of NZ IAS 34 Interim Financial Reporting and Registered Bank Disclosure Statements (Overseas Incorporated Registered Banks) Order 2014 (as amended). These condensed interim financial statements also comply with IAS 34 Interim Financial Reporting. The Branch does not qualify for any differential reporting exemptions and the condensed interim financial statements should be read in conjunction with the financial statements for the year ended 31 March 2015. The condensed interim financial statements were authorized for issue by the directors on the date of signing this Disclosure Statement. b) Basis of preparation The condensed interim financial statements are presented in New Zealand dollars. The condensed interim financial statements have been prepared on the historical cost basis, except for the revaluation of certain non-current assets and financial instruments. Cost is based on the fair-value of the consideration given in exchange for assets. c) Changes in accounting policy There have been no material changes in accounting policies since the last financial statements for year ended 31 March 2015. d) Comparative figures Certain comparative figures have been re-stated to comply with the current year presentation. There has been no re-statement on comparative figures for this condensed interim financial statement.

The Bank of Tokyo-Mitsubishi UFJ, Ltd Auckland Branch
Notes to the Condensed Interim Financial Statements For the Six Months Ended 30 September 2015
12
2. Profit Before Income Tax Expense
Six Months ended 30 September 2015
Six Months ended 30 September 2014
Unaudited Unaudited NZD NZD Operating revenue a) Interest income Corporate loans and other accounts 57,255,345 64,849,042 Related parties 8,055 395 57,263,400 64,849,437 (b) Fee and Commission income Fees and commissions income 6,287,487 7,793,146 6,287,487 7,793,146 (c) Gains less losses on financial instruments Net (loss) / gain on interest rate derivatives (134,838) 93,663 Net (loss) / gain on foreign currency (63,102) 459 Loss on sale of available-for-sale securities - (948,799) Other income 9 35,533 (197,931) (819,144) 63,352,956 71,823,439 Total interest income derived from financial assets:
At amortised cost 55,038,448 60,545,678 Available-for-sale securities 2,224,952 4,303,759 Designated at fair value through profit or loss - - Total fee income derived from financial assets that are not at fair value through profit or loss 6,119,981 7,528,416 Net (loss) / gain on financial assets / liabilities held for trading (273,793) 27,822 Net realised gain on held for trading 75,853 66,300 Other fee income 167,506 264,730 Loss on sale of available-for-sale securities - (948,799) Other income 9 35,533 63,352,956 71,823,439 Expenses (a) Interest expense Deposits and other accounts 5,145,704 1,906,326 Related parties 46,210,576 54,951,842 51,356,280 56,858,168 Total interest expense was derived from financial liabilities: At Amortised cost 51,356,280 56,858,168 Designated at fair value through profit or loss - - 51,356,280 56,858,168 (b) Other operating expenses Rental & operating lease costs 130,149 130,591 Depreciation Furniture, fixtures and fittings 16,384 18,133 Office equipment 111,183 112,218 Motor vehicles 4,348 6,446 Auditors' remuneration Audit fees 46,085 90,224 Other non-audit services - - Salaries 1,479,720 1,318,603 Staff related cost 74,173 78,568 Net losses from the disposal of fixed assets 7,311 - General administration and other operating expenses 345,603 675,210 Provision for credit impairment - (379,015) 2,214,956 2,050,978 Profit before income tax expense 9,781,720 12,914,293
Total income excluding any net loss for six months ended 30 September 2015 is NZD 63,550,896 ( six months ended 30 September 2014 : NZD 72,772,238)

The Bank of Tokyo-Mitsubishi UFJ, Ltd Auckland Branch
Notes to the Condensed Interim Financial Statements For the Six Months Ended 30 September 2015
13
3. Property, Plant and Equipment During the six months ended 30 September 2015 the Branch acquired property, plant and equipment with a cost of NZD 24,348 (six months ended 30 September 2014: NZD 9,003; twelve months ended 31 March 2015: NZD 46,600). During the six months ended 30 September 2015 the Branch disposed of property, plant and equipment with the carrying amount of NZD 7,311 (six months ended 30 September 2014: Nil; twelve months ended 31 March 2015: NZD 81).
There was no impairment loss for property, plant and equipment recognized during the six months ended 30 September 2015 (six months ended 30 September 2014: Nil; twelve months ended 31 March 2015: Nil).
4. Loans and Advances
As at
30 September 2015 As at
30 September 2014 As at
31 March 2015 Unaudited Unaudited Audited NZD NZD NZD
Corporate loans originated by the bank 2,418,731,271 2,682,689,101 2,688,263,556 Less: individual impairment allowance (63,695,652) (33,758,696) (63,695,652) 2,355,035,619 2,648,930,405 2,624,567,904
5. Deposits
As at
30 September 2015 As at
30 September 2014 As at
31 March 2015 Unaudited Unaudited Audited NZD NZD NZD
Retail deposit bearing interest 6,054,998 624,936 4,213,543 Retail deposit not bearing interest 15,193,382 15,975,157 15,572,646 Certificate deposit 24,904,115 13,189,412 48,086,360 Call deposit 63,273,461 37,596,425 49,176,102 Term deposit 229,027,440 78,227,587 84,226,890 338,453,396 145,613,517 201,275,541
6. Total Liabilities of the Branch Net of Amounts Due to Related Parties
As at
30 September 2015 As at
30 September 2014 As at
31 March 2015 Unaudited Unaudited Audited NZD NZD NZD Total Liabilities 2,611,742,279 2,903,469,890 2,920,540,297 Less: total amounts due to related parties (Note : 9) (2,261,415,197)
(2,751,246,641)
(2,710,028,333)
Total liabilities net of amounts due to related parties 350,327,082
152,223,249
210,511,964

The Bank of Tokyo-Mitsubishi UFJ, Ltd Auckland Branch
Notes to the Condensed Interim Financial Statements For the Six Months Ended 30 September 2015
14
7. Other Liabilities
As at
30 September 2015 As at
30 September 2014 As at
31 March 2015 Unaudited Unaudited Audited NZD NZD NZD Provision 127,828 130,025 120,895 Unearned income 877,612 1,070,920 923,390 Others * 4,187,251 200,242 218,973 5,192,691 1,401,187 1,263,258 *Others comprises of the cash receipts from customers that were temporary received and waiting for further instructions. 8. Commitments and Contingent Liabilities
As at
30 September 2015
As at
30 September 2014
As at
31 March 2015 Unaudited Unaudited Audited NZD NZD NZD a) Future lease rental commitments
Operating lease (primarily premises)
Due within 1 year 240,114 247,336 160,027 Due within 1 - 2 years 178,362 72,840 42,490 Due within 2 - 5 years 548,514 6,070 - Due over 5 years 193,916 - - 1,160,906 326,246 202,517
b) Other commitments Undrawn facility commitments 1,133,022,544 822,041,486 599,565,862
c) Contingent liabilities
Guarantees given 410,595 1,517,813 710,595 Performance related contingencies 17,351,095 5,164,635 6,342,505 Trade related contingencies 1,938,968 55,556 93,243 19,700,658 6,738,004 7,146,343
The Branch provides guarantees in its normal course of business on behalf of its customers and there are three principal types of guarantee:
• Guarantee given – a financial guarantee that is an agreement by which the Branch agrees to pay an
amount of money on demand on behalf of a customer to a third party during the life of the guarantee.
• Performance related contingencies – a guarantee given by the Branch that undertakes to pay a sum of money to a third party where the customer fails to fulfil certain terms and conditions of a contract.
• Trade related contingencies – contingent liabilities arising from trade-related obligations secured against
an underlying shipment of goods to make a payment to a third party if a counterparty fails to perform a contractual non-monetary obligation.
The credit risk involved in issuing guarantees is essentially the same as that involved in extending loan facilities to customers. Apart from the normal documentation for a facility of this type, the customer must also provide the Branch with a written indemnity, undertaking that, in the event the Branch is called upon to pay, the Branch will be fully reimbursed by the customer. The Branch has no financial assets that have been pledged as collateral for liabilities or contingent liabilities.

The Bank of Tokyo-Mitsubishi UFJ, Ltd Auckland Branch
Notes to the Condensed Interim Financial Statements For the Six Months Ended 30 September 2015
15
9. Related Party Disclosures The Auckland Branch is a branch of an overseas company, The Bank of Tokyo-Mitsubishi UFJ, Ltd., which is incorporated in Japan and is the ultimate parent bank.
Related party transactions are unsecured and entered into in the normal course of business. During the period there have been dealings between Auckland branch, other overseas branches and Head Office. Amounts due from related parties is only related to settlement account which is due on demand. Amount due to related parties is mainly term deposits which are due in accordance with an agreed date. The maturity analysis for these balances are presented in Note 13. The interest rate risk analysis for these balances are presented in Note 12. No related party debts have been written off or forgiven during the reporting period. Derivative instruments with related parties are used to manage interest rate and currency exposures and include foreign exchange forwards, interest rate swaps and currency options.
Six Months ended
30 September 2015
Six Months ended
30 September 2014
Twelve Months ended
31 March 2015
Unaudited Unaudited Audited NZD NZD NZD
A) Balances Assets Amounts due from related parties 66,768,818 30,019,231 60,335,239 Derivative instruments 6,717,978 5,278,090 8,039,325 73,486,796 35,297,321 68,374,564 Liabilities Amounts due to related parties 2,246,481,303 2,744,505,986 2,705,545,367 Derivative instruments 14,933,893 6,740,655 4,482,966 2,261,415,196 2,751,246,641 2,710,028,333 Equity Head Office capital 83,000,000 83,000,000 83,000,000 Off Balance Sheet Guarantee given 227,782 135,000 227,782 Performance related contingencies 400,000 692,782 600,000 627,782 827,782 827,782 B) Transactions Interest income 8,055 395 395 Interest expense 46,210,576 54,951,842 109,352,896 Net (loss) / gain from derivative instruments (3,015,367) (1,298,554) (2,323,056) Fees and commissions income 252 503 960
The Branch’s Head Office capital comprises of funds provided by the overseas bank to support the Branch’s daily operation and to fulfil local thin capitalisation requirements. It is non-interest bearing and there is no fixed date for repatriation. The capital of the registered bank is managed by the overseas bank. The Branch does not separately manage capital other than for the purpose of the Reserve Bank of New Zealand’s requirements as disclosed in Note 18 and Note 19.
Other transactions like sundry administrative charges are not material to the results and are therefore not disclosed separately.

The Bank of Tokyo-Mitsubishi UFJ, Ltd Auckland Branch
Notes to the Condensed Interim Financial Statements For the Six Months Ended 30 September 2015
16
10. Concentration of Credit Risk
Credit risk is the risk of loss to the Branch arising from the failure of a counterparty to repay principal and/or interest under a commitment entered into with the Branch. Credit risk arises from the lending, treasury and trade finance activities of the Branch. Credit risk also arises from the possibility that the counterparty to a derivative financial instrument will not adhere to the terms of the contract with the Branch when settlement becomes due. The Branch’s credit exposure on derivative financial instruments is determined in accordance with Capital Adequacy Framework (Standardized Approach) BS2A. The credit equivalent is derived by taking into account the residual maturity of each instrument. Corporate loans originated by the bank are secured partially by following collateral/credit enhancement: i. financial guarantee by either third parties or customer’s parent company ii. deposit assignment iii. asset assignment such as aircraft Concentration of credit risk is determined by management to be by industry sector, geographical location and customer credit rating. Industry sectors are determined by reference to the categories in the RBNZ M3 Institutions Standard Statistical Return. The geographical locations reflect the primary location of the underlying borrower.
The following table details the Branch’s maximum credit risk exposure without taking account of any collateral/credit enhancement held of recognised financial assets and derivative financial instruments as at the reporting date.
As at
30 September 2015 As at
30 September 2014 Unaudited Unaudited NZD NZD
Notional Principal
On Balance Sheet Cash and short term liquid assets 29,079,287 28,983,418 Amounts due from related parties 66,768,818 30,019,231 Amounts due from other financial institutions 104,570,078 54,757,663 Available-for-sale securities 121,384,723 224,665,080 Acceptances of customers - 133,129 Corporate loans originated by the Bank 2,355,035,619 2,648,930,405 Other assets 3,044,576 2,015,205 Total 2,679,883,101 2,989,504,131 Off Balance Sheet Guarantee given 410,595 1,517,813 Performance related contingencies 17,351,095 5,164,635 Trade related contingencies 1,938,968 55,556 Undrawn facility commitments 1,133,022,544 822,041,486 Total 1,152,723,202 828,779,490 Credit Equivalent Derivative instruments 30,453,840 21,281,303

The Bank of Tokyo-Mitsubishi UFJ, Ltd Auckland Branch
Notes to the Condensed Interim Financial Statements For the Six Months Ended 30 September 2015
17
10. Concentration of Credit Risk (continued) i. Concentration of Credit Risk by Customer Industry Sector
As at
30 September 2015 As at
30 September 2014 Unaudited Unaudited NZD NZD Notional principal
On Balance Sheet Communications 251,248,724 251,932,783 Construction 4,056,548 3,496,153 Electricity, gas and water 411,582,178 467,879,435 Finance 644,977,749 680,388,540 Fishing 68,887,365 64,931,093 Food manufacturing 194,561,638 184,433,578 Forestry 47,782,124 51,011,079 Mining - 32,786,087 Other manufacturing 103,297,916 157,372,678 Property and business services 139,763,181 248,057,904 Transport and storage 643,152,652 676,369,410 Wholesale trade 162,772,246 162,444,355 Wood and paper manufacturing 7,800,780 8,401,036 Total 2,679,883,101 2,989,504,131
Notional principal
Off Balance Sheet Communications 70,833,332 82,333,332 Construction 64,924,138 65,503,448 Electricity, gas and water 280,000,000 124,100,000 Finance 102,566,750 132,827,782 Fishing 9,651,516 7,557,626 Food manufacturing 474,172,058 363,152,373 Other manufacturing 72,500,000 19,055,556 Property and Business Services 39,981,826 3,010,686 Transport and storage 17,000,000 21,000,000 Wholesale trade 21,093,582 300,000 Wood and paper manufacturing - 9,938,687 Total 1,152,723,202 828,779,490
Credit equivalent derivative financial instruments
Communications 1,230,967 271,350 Electricity, gas and water 393,003 1,762,835 Finance 14,526,011 11,741,385 Fishing 2,437,901 455,242 Food manufacturing 5,235,583 3,499,925 Forestry 33,779 - Other manufacturing 423,737 2,021,363 Transport and storage 2,054,077 505,242 Wholesale trade 4,118,782 358,107 Wood and paper manufacturing - 665,854 Total 30,453,840 21,281,303

The Bank of Tokyo-Mitsubishi UFJ, Ltd Auckland Branch
Notes to the Condensed Interim Financial Statements For the Six Months Ended 30 September 2015
18
10. Concentration of Credit Risk (continued) ii. Concentration of Credit Risk by Customer Geographical Location
As at
30 September 2015 As at
30 September 2014 Unaudited Unaudited NZD NZD Notional principal
On Balance Sheet
New Zealand 2,344,600,152 2,736,964,292 Japan 225,544,782 189,167,971 Australia 39,988,284 33,374,897 Netherlands 69,749,883 29,996,971 Total 2,679,883,101 2,989,504,131 Off Balance Sheet
New Zealand 1,000,156,452 827,951,707 Japan 627,782 827,783 Australia 150,000,000 - Other 1,938,968 - Total 1,152,723,202 828,779,490
Credit equivalent of derivative financial instruments New Zealand 18,825,113 8,539,620 Japan 11,495,200 12,734,089 Australia 133,527 7,594 Total 30,453,840 21,281,303
iii. Concentration of Credit Risk by Customer Credit Rating
The following tables set out the credit quality information for balance which are neither past due nor impaired. Please refer to Note 17 for impaired asset.
There is no period end aggregate exposure equal to or exceeding 10% of the global equity of the Overseas Banking Group. *The ‘not rated’ exposure is related to inter-branch exposure.
30 September 2015 Unaudited Notional principal Credit equivalent of
Credit Rating S&P Rating On balance Sheet Off balance Sheet derivative financial
instruments 1-2 A- and above 831,452,915 87,424,138 2,798,197 3-7 B- to BBB+ 1,750,810,638 1,064,671,282 16,431,671 8-9 CCC+/- and below 30,850,730 - 33,779
Not rated* 66,768,818 627,782 11,190,193 2,679,883,101 1,152,723,202 30,453,840 30 September 2014 Unaudited Notional principal Credit equivalent of
Credit Rating S&P Rating On balance Sheet Off balance Sheet derivative financial
instruments 1-2 A- and above 958,861,591 479,503,448 566,534 3-7 B- to BBB+ 1,949,000,037 348,448,259 10,022,041 8-9 CCC+/- and below 51,623,271 - -
Not rated* 30,019,232 827,783 10,712,728 2,989,504,131 828,779,490 21,281,303

The Bank of Tokyo-Mitsubishi UFJ, Ltd Auckland Branch
Notes to the Condensed Interim Financial Statements For the Six Months Ended 30 September 2015
19
10. Concentration of Credit Risk (continued) Collateral and other credit enhancements
The general nature and amount of collateral or other credit enhancements taken to mitigate the credit risk of each financial asset class are summarized as follows: a. Cash and short term liquid assets
These exposures are mainly to relatively low risk banks ( rate A+, AA- or better). These balances are not collateralized.
b. Amounts due from related parties
These exposures are generally considered to be low risk due to the nature of the counterparties. There are typically no collateral or other credit enhancements obtained in respect of amounts due from related parties.
c. Amounts due from other financial institutions
The balance is short term deposit to other financial institutions. Collateral is not generally sought on these balances as exposures are considered to be of low risk.
d. Available-for-sale securities
These exposures are with the New Zealand government. Collateral is not sought directly with respect to these exposures.
e. Derivative instrument
The Branch is exposed to credit risk on derivative contracts, which arises as a result of counterparty credit risk. This credit risk from derivatives is mitigated where possible through master netting agreements whereby derivative assets and liabilities with the same counterparty can be offset. A master netting agreement provides the contractual framework within which dealing activities across a range of over-the-counter products are conducted and contractually binds both parties to apply close-out netting across all outstanding transactions covered by an agreement if either party defaults or other predetermined events occur. There have been no amounts set off in the statement of financial position for derivative assets and derivative liabilities as at 30 September 2015 ( 2014: Nil).

The Bank of Tokyo-Mitsubishi UFJ, Ltd Auckland Branch
Notes to the Condensed Interim Financial Statements For the Six Months Ended 30 September 2015
20
10. Concentration of Credit Risk (continued)
Financial assets subject to offsetting, enforceable master netting arrangements and similar agreements. As at 30 September 2015 NZD
Gross amounts of recognised financial
assets (a)
Gross amounts of recognized financial liabilities set off in
the statement of financial position (b)
Net amounts of financial assets presented in the statement of financial position (c) = (a) – (b)
Related amounts not setoff in the statement of
financial position (d)
Net amount (e) = (c) – (d)
Derivatives 21,509,412 - 21,509,412 (371,178) 21,138,234 Financial liabilities subject to offsetting, enforceable master netting arrangements and similar agreements.
As at 30 September 2015 NZD
Derivatives
Collateral is obtained against derivative assets but the amount is based on the creditworthiness of the counterparty. There has been no collateral obtained against derivative assets for the six month ended 30 September 2015 (2014: Nil).
f. Other Assets
Collateral is generally not sought on these balances.
g. Corporate loans originated by the Bank
The Branch assesses the integrity and ability of counterparties to meet their contracted financial obligation for repayment. Principal collateral types for corporate loans include:
i. Cash ( usually in the form of a charge over a deposit) ii. Guarantee received from third parties iii. Charges over business assets such as real estate, aircraft and ships
A client’s facilities may also be secured by different types of collateral with an agreed value, this may be less than the carrying amount of credit exposure. These facilities are deemed secured, partially secured or unsecured.
The Branch lending is generally to large corporate counterparties of strong financial standing, the majority of which borrow on unsecured terms. If there is collateral received during loan drawdown, the value of the collateral will be checked against the agreement to ensure that it complies with the agreed value.
On Balance Sheet As at As at
30 September 2015 30 September 2014 Unaudited Unaudited
NZD % NZD % Maximum Exposure 2,355,035,619 100.00 2,648,930,405 100.00
Collateral classification Secured 294,655,468 12.51 222,139,379 8.39
Partially secured 52,924,573 2.25 239,247,824 9.03 Unsecured 2,007,455,578 85.24 2,187,543,202 82.58
Gross amounts of recognised financial
liabilities (a)
Gross amounts of financial liabilities set off in the statement of financial
position (b)
Net amounts of financial assets presented in the statement of financial position (c) = (a) – (b)
Related amounts not setoff in the statement of
financial position (d)
Net amount (e) = (c) – (d)
21,614,889 - 21,614,889 (371,178) 21,243,711

The Bank of Tokyo-Mitsubishi UFJ, Ltd Auckland Branch
Notes to the Condensed Interim Financial Statements For the Six Months Ended 30 September 2015
21
10. Concentration of Credit Risk (continued)
h. Undrawn facility commitments and contingent liabilities The Branch applies the same principle for off balance sheet risk as it does for its on balance sheet risks. In the case of undrawn facility commitments, counterparties will be subject to the same principle as corporate loan and collateral may be sought depending on the strength of the counterparty and the nature of the transaction.
Off Balance Sheet As at As at 30 September 2015 30 September 2014 Unaudited Unaudited NZD % NZD % Maximum Exposure 1,152,723,202 100.00 828,779,490 100.00 Collateral classification
Secured 17,000,000 1.47 - - Partially secured - - - - Unsecured 1,135,723,202 98.53 828,779,490 100.00
11. Concentration of Funding
Concentration of funding is determined by management to be by counterparty type and geographical location. The geographical locations reflect the primary location of the underlying depositor.
As at
30 September 2015 As at
30 September 2014 Unaudited Unaudited NZD NZD a) Category analysis Customer deposits 338,453,396 145,613,517 Due to related parties 2,246,481,303 2,744,505,986 2,584,934,699 2,890,119,503
b) Counterparty analysis Agriculture 2,371,658 434,374 Communications 50,286,113 - Constructions 5,663,176 4,472,297 Electricity, gas and water - 35,007,882 Finance 2,376,791,718 2,757,695,398 Food Manufacturing 2,160,945 7,622,167 Forestry 3,989,084 5,796,493 Education 9,002,515 - Other Manufacturing 8,579,206 3,994,551 Property and business services 5,560,263 11,723 Transport and Storage 58,240,662 53,245,767 Wholesale Trade 60,499,650 20,240,157 Wood and Paper Manufacturing 1,789,709 1,598,694 2,584,934,699 2,890,119,503
c) Geographical analysis Australia 1,034,685,437 1,369,249,265 New Zealand 338,453,393 132,412,295 Japan 1,211,795,869 1,293,538,240 Singapore - 81,730,291 Fiji - 13,189,412 2,584,934,699 2,890,119,503

The Bank of Tokyo-Mitsubishi UFJ, Ltd Auckland Branch
Notes to the Condensed Interim Financial Statements For the Six Months Ended 30 September 2015
22
12. Interest Rate Risk
Interest rate risk is the risk of loss to the Branch arising from movements in interest rates thereby having an adverse effect on the net interest earnings of the Branch in the current reporting period and in future years. The following table represents the interest rate sensitivity gap of the Branch as at the reporting date. It analyses the Branch’s assets and liabilities into relevant maturity groupings based on the earlier of residual contractual maturity or interest repricing date. One of the major causes of the mismatches is timing differences in the repricing of the assets and liabilities. These mismatches are managed by the Sydney Branch as part of the overall risk management process conducted in accordance with strict policy guidelines.
30 September 2014 Unaudited
Up to 3 months
Over 3 months and up to 6
months
Over 6 months and up to 1 year
Over 1 year and up to 2
years Over 2 years
NON INTEREST SENSITIVE TOTAL
WEIGHTED AVE. EFF.
RATE NZD NZD NZD NZD NZD NZD NZD %
ASSETS
Cash and short term liquid assets 28,983,418 - - - - - 28,983,418 3.00 Amounts due from related parties - - - - -
30,019,231 30,019,231
Amounts due from other financial institutions 54,757,663 - - - - - 54,757,663 3.69 Available-for-sale securities - - 170,634,875 54,030,205 - 224,665,080 2.93 Corporate loans originated by the Bank 2,415,531,474 149,412,457 - 4,598,190 79,388,285 - 2,648,930,406 4.24 Acceptances of Customers 133,129 133,129 Property, Plant and Equipment - - - - - 676,798 676,798 Other assets - - - - - 23,683,482 23,683,482 Total assets 2,499,272,555 149,412,457 170,634,875 4,598,190 133,418,490 54,512,640 3,011,849,207 LIABILITIES
Amounts due to related parties 2,510,823,805 149,711,431 4,602,493 79,368,257 - 2,744,505,986 3.91 Deposits 116,448,948 4,689,412 8,500,000 - - 15,975,157 145,613,517 3.41 Liability for Acceptances - - - - - 133,129 133,129 Other liabilities - - - - - 13,217,258 13,217,258 Total liabilities 2,627,272,753 154,400,843 8,500,000 4,602,493 79,368,257 29,325,544 2,903,469,890
30 September 2015 Unaudited
Up to 3 months
Over 3 months and up to 6
months
Over 6 months and up to 1 year
Over 1 year and up to 2
years Over 2 years
NON INTEREST SENSITIVE TOTAL
WEIGHTED AVE. EFF.
RATE NZD NZD NZD NZD NZD NZD NZD %
ASSETS
Cash and short term liquid assets 29,079,287 - - - - - 29,079,287 2.25 Amounts due from related parties - - - - -
66,768,818 66,768,818
Amounts due from other financial institutions 104,570,078 - - - - - 104,570,078 3.03 Available-for-sale securities 39,965,400 26,800,740 - 54,618,583 - 121,384,723 3.92 Corporate loans originated by the Bank 2,204,362,962 69,881,424 - 10,268,131 70,523,102 - 2,355,035,619 3.44 Acceptances of Customers - - - - - - - Property, Plant and Equipment - - - - - 460,432 460,432 Other assets - - - - - 42,480,744 42,480,744
Total assets 2,377,977,727 96,682,164 - 10,268,131 125,141,685 109,709,994 2,719,779,701
LIABILITIES
Amounts due to related parties 2,017,429,513 47,881,975 - 10,360,450 170,809,365 - 2,246,481,303 3.20 Deposits 211,777,145 84,414,406 27,068,463 - - 15,193,382 338,453,396 3.31 Liability for Acceptances - - - - - - - Other liabilities - - - - - 26,807,580 26,807,580
Total liabilities 2,229,206,658 132,296,381 27,068,463 10,360,450 170,809,365 42,000,962 2,611,742,279
The Bank of Tokyo-Mitsubishi UFJ, Ltd Auckland Branch
Notes to the Condensed Interim Financial Statements For the Six Months Ended 30 September 2015
23
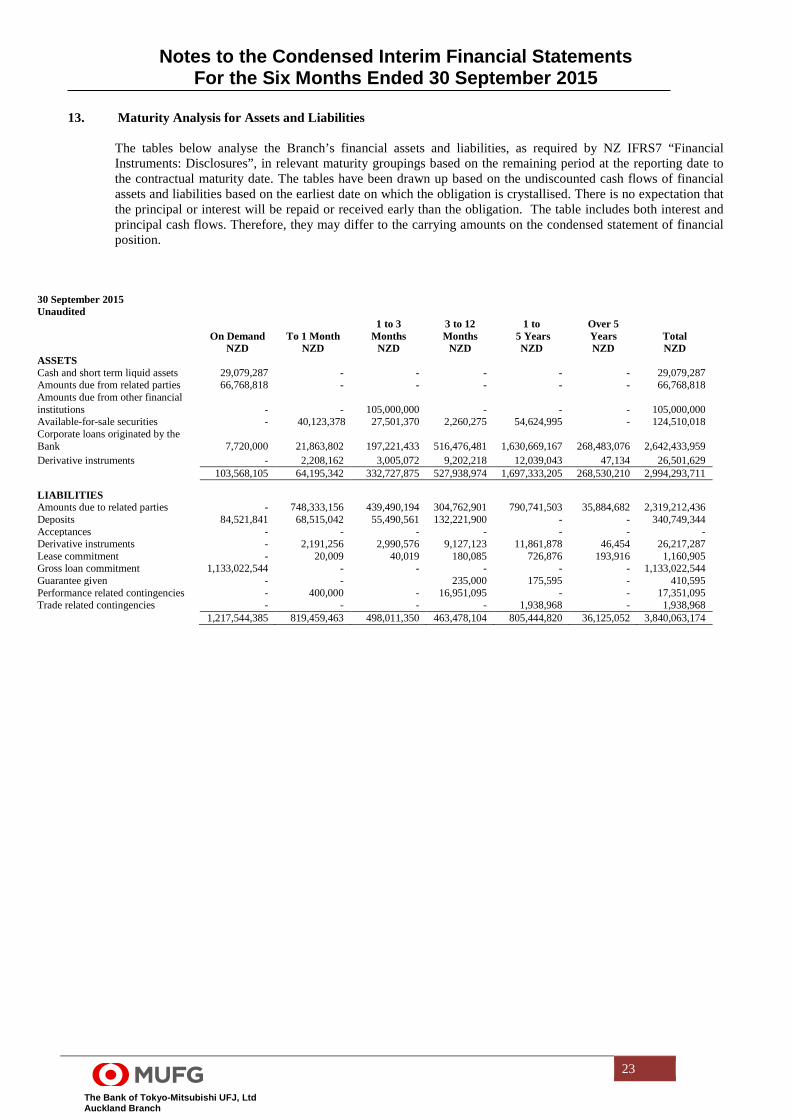
13. Maturity Analysis for Assets and Liabilities
The tables below analyse the Branch’s financial assets and liabilities, as required by NZ IFRS7 “Financial Instruments: Disclosures”, in relevant maturity groupings based on the remaining period at the reporting date to the contractual maturity date. The tables have been drawn up based on the undiscounted cash flows of financial assets and liabilities based on the earliest date on which the obligation is crystallised. There is no expectation that the principal or interest will be repaid or received early than the obligation. The table includes both interest and principal cash flows. Therefore, they may differ to the carrying amounts on the condensed statement of financial position.
30 September 2015 Unaudited
On Demand To 1 Month 1 to 3
Months 3 to 12 Months
1 to 5 Years
Over 5 Years Total
NZD NZD NZD NZD NZD NZD NZD ASSETS Cash and short term liquid assets 29,079,287 - - - - - 29,079,287 Amounts due from related parties 66,768,818 - - - - - 66,768,818 Amounts due from other financial institutions - - 105,000,000 - - - 105,000,000 Available-for-sale securities - 40,123,378 27,501,370 2,260,275 54,624,995 - 124,510,018 Corporate loans originated by the Bank 7,720,000 21,863,802 197,221,433 516,476,481 1,630,669,167 268,483,076 2,642,433,959 Derivative instruments - 2,208,162 3,005,072 9,202,218 12,039,043 47,134 26,501,629 103,568,105 64,195,342 332,727,875 527,938,974 1,697,333,205 268,530,210 2,994,293,711
LIABILITIES Amounts due to related parties - 748,333,156 439,490,194 304,762,901 790,741,503 35,884,682 2,319,212,436 Deposits 84,521,841 68,515,042 55,490,561 132,221,900 - - 340,749,344 Acceptances - - - - - - - Derivative instruments - 2,191,256 2,990,576 9,127,123 11,861,878 46,454 26,217,287 Lease commitment - 20,009 40,019 180,085 726,876 193,916 1,160,905 Gross loan commitment 1,133,022,544 - - - - - 1,133,022,544 Guarantee given - - 235,000 175,595 - 410,595 Performance related contingencies - 400,000 - 16,951,095 - - 17,351,095 Trade related contingencies - - - - 1,938,968 - 1,938,968 1,217,544,385 819,459,463 498,011,350 463,478,104 805,444,820 36,125,052 3,840,063,174

The Bank of Tokyo-Mitsubishi UFJ, Ltd Auckland Branch
Notes to the Condensed Interim Financial Statements For the Six Months Ended 30 September 2015
24
13. Maturity Analysis for Assets and Liabilities (continued)
30 September 2014 Unaudited
On Demand To 1 Month 1 to 3
Months 3 to 12 Months
1 to 5 Years
Over 5 Years Total
NZD NZD NZD NZD NZD NZD NZD ASSETS Cash and short term liquid assets 28,983,418 - - - - - 28,983,418 Amounts due from related parties 30,019,231 - - - - - 30,019,231 Amounts due from other financial institutions - 55,000,000
-
-
-
- 55,000,000
Available-for-sale securities - 527,671 2,145,863 165,593,933 60,676,314 - 228,943,781 Corporate loans originated by the Bank - 12,475,759 156,303,391 492,251,084 1,991,596,418 341,946,225 2,994,572,877 Other assets - 133,129 - - - - 133,129 Derivative instruments - 1,265,412 3,006,877 4,649,509 9,043,330 107,942 18,073,071 59,002,649 69,401,971 161,456,131 662,494,526 2,061,316,062 342,054,167 3,355,725,507
LIABILITIES Amounts due to related parties - 864,001,896 851,625,147 301,321,173 799,995,932 15,935,813 2,832,879,961 Deposits 54,136,680 73,107,240 5,352,831 13,500,000 - - 146,096,751 Acceptances - 133,129 - - - - 133,129 Derivative instruments - 1,253,245 2,984,569 4,559,128 8,878,606 107,690 17,783,238 Lease commitments - 20,621 41,243 185,472 78,910 - 326,246 Gross loan commitment 822,041,486 - - - - - 822,041,486 Guarantees given - - 1,000,000 435,000 82,813 - 1,517,813 Performance related contingencies - 400,000 - 4,671,853 92,782 - 5,164,635 Trade related contingencies - 55,556 - - - - 55,556 876,178,166 938,971,687 861,003,790 324,672,626 809,129,043 16,043,503 3,825,998,815
14. Fair Value of Financial Instruments
Quoted market prices, where available, are used to estimate the fair value of financial instruments. However, quoted market prices are not available for a substantial portion of financial instruments and fair value for such financial instruments is estimated using discounted cash flow models that utilise prices from observable current market transactions or other valuation techniques. The summary table shows the carrying amounts and estimated fair values of financial instruments as at the reporting date. The methodologies and assumptions used to estimate the fair value of the financial instruments are: a. For those assets or liabilities that are short term in nature, the related carrying value is equivalent to their fair value.
b. For floating rate loans and deposits, the carrying amount in the statement of financial position is considered a
reasonable estimate of their fair value after making allowances for impairment. For fixed rate loans and deposits, fair value is estimated using discounted cash flow models based on current market rates. The differences between estimated fair value of loans and deposits and carrying value reflect the difference between observable market interest rates and customer rates on day one and changes in interest rates since loans and deposits origination.
c. The fair values of derivative instruments are calculated using the discounted cash flow model. Swap transactions are
measured at the present value of future cash flows estimated and discounted based on the applicable yield curves derived from observable interest rates. Foreign currency forward contracts are measured using observable forward exchange rates and yield curves derived from observable interest rates matching maturities of the contracts.
d. The fair values of available-for-sales securities are derived from quoted prices in the active market.
The Bank of Tokyo-Mitsubishi UFJ, Ltd Auckland Branch
Notes to the Condensed Interim Financial Statements For the Six Months Ended 30 September 2015
25
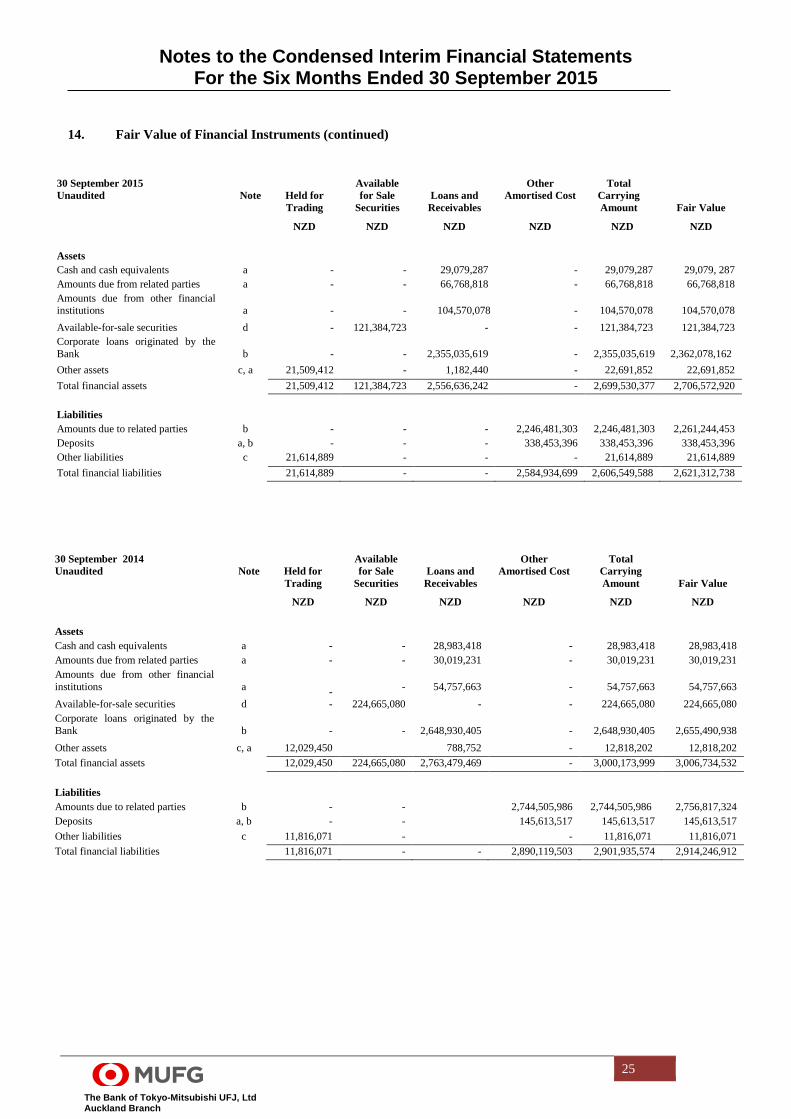
14. Fair Value of Financial Instruments (continued)
30 September 2015 Unaudited
Note
Held for Trading
Available for Sale
Securities
Loans and
Receivables
Other Amortised Cost
Total Carrying Amount
Fair Value
NZD NZD NZD NZD NZD NZD Assets Cash and cash equivalents a - - 29,079,287 - 29,079,287 29,079, 287 Amounts due from related parties a - - 66,768,818 - 66,768,818 66,768,818 Amounts due from other financial institutions
a
-
-
104,570,078
-
104,570,078
104,570,078
Available-for-sale securities d - 121,384,723 - - 121,384,723 121,384,723 Corporate loans originated by the Bank
b
-
-
2,355,035,619
-
2,355,035,619
2,362,078,162
Other assets c, a 21,509,412 - 1,182,440 - 22,691,852 22,691,852 Total financial assets 21,509,412 121,384,723 2,556,636,242 - 2,699,530,377 2,706,572,920 Liabilities Amounts due to related parties b - - - 2,246,481,303 2,246,481,303 2,261,244,453 Deposits a, b - - - 338,453,396 338,453,396 338,453,396 Other liabilities c 21,614,889 - - - 21,614,889 21,614,889 Total financial liabilities 21,614,889 - - 2,584,934,699 2,606,549,588 2,621,312,738
30 September 2014 Unaudited
Note
Held for Trading
Available for Sale
Securities
Loans and
Receivables
Other Amortised Cost
Total Carrying Amount
Fair Value
NZD NZD NZD NZD NZD NZD Assets Cash and cash equivalents a - - 28,983,418 - 28,983,418 28,983,418 Amounts due from related parties a - - 30,019,231 - 30,019,231 30,019,231 Amounts due from other financial institutions
a -
-
54,757,663
-
54,757,663
54,757,663
Available-for-sale securities d - 224,665,080 - - 224,665,080 224,665,080 Corporate loans originated by the Bank
b
-
-
2,648,930,405
-
2,648,930,405
2,655,490,938
Other assets c, a 12,029,450 788,752 - 12,818,202 12,818,202 Total financial assets 12,029,450 224,665,080 2,763,479,469 - 3,000,173,999 3,006,734,532 Liabilities Amounts due to related parties b - - 2,744,505,986 2,744,505,986 2,756,817,324 Deposits a, b - - 145,613,517 145,613,517 145,613,517 Other liabilities c 11,816,071 - - 11,816,071 11,816,071 Total financial liabilities 11,816,071 - - 2,890,119,503 2,901,935,574 2,914,246,912

The Bank of Tokyo-Mitsubishi UFJ, Ltd Auckland Branch
Notes to the Condensed Interim Financial Statements For the Six Months Ended 30 September 2015
26
14. Fair Value of Financial Instruments (continued) The following table provides an analysis of financial instruments that are measured subsequent to initial recognition at fair value, grouped into Level 1 to 3 based on the degree to which the fair value is observable. • Level 1 fair value measurements are those derived from quoted prices (unadjusted) in active markets for identical
assets or liabilities.
• Level 2 fair value measurements are those derived from inputs other than quoted prices included within Level 1 that are observable for the asset or liability for substantially the entire term of the instrument, either directly (i.e. as prices) or indirectly (i.e. derived from prices).
• Level 3 fair value measurements are those derived from valuation techniques that include inputs for the asset or
liability that are not based on observable market data (unobservable inputs).
30 September 2015 30 September 2014 Level 1 Level 2 Level 1 Level 2 Derivative financial assets
Interest rate swaps - 10,473,005 - 3,562,717 Currency Options - - - 689,638 FX forwards - 11,036,407 - 7,777,095
Total derivative financial assets - 21,509,412 - 12,029,450 Derivative financial liabilities
Interest rate swaps - 10,503,911 - 3,343,450 Currency Options - - - 689,638 FX forwards - 11,110,978 - 7,782,983
Total derivative financial liabilities - 21,614,889 - 11,816,071 Available-for-sale securities 121,384,723 - 224,665,080 -
Financial assets and financial liabilities, other than the items on the above table, are carried at amortised cost. Their fair value is represented by level 2 fair value measurements. There were no financial assets and liabilities carried at fair value categorised under Level 3 in this period.

The Bank of Tokyo-Mitsubishi UFJ, Ltd Auckland Branch
Notes to the Condensed Interim Financial Statements For the Six Months Ended 30 September 2015
27
15. Liquidity Risk Management
Liquidity risk is the risk that the Branch will not have sufficient funds to meet its financial obligations. The Branch has policies to ensure that sufficient funds are available to meet its obligations as and when they fall due, and to maintain a prudent level of liquidity buffer to meet unexpected demands for funds under adverse market situations. To achieve this objective, the Branch adopts a set of liquidity management strategies which limits the liquidity risk to acceptable levels. The compliance of such internal limits are being independently monitored and regularly reported to the Regional Head for Oceania. A contingency plan has been developed in the event of a major liquidity problem. The operations of the Branch are subject to these policies. The Branch measures its liquidity requirements by undertaking scenario analysis under the following two scenarios: Going-concern – which refers to the normal behaviour of cashflows in the ordinary course of business and would form the day-to-day focus of the Branch’s liquidity management. Bank-specific (“name”) crisis – which covers the behaviour of cash flows where there is some actual or perceived problem with the Branch. The Branch is committed to raising its liabilities from a wide range of institutional and corporate lenders. This reduces dependence upon certain lenders and the possibility that a large portion of the deposit base will be withdrawn with little notice. As part of its liquidity management policies, the Branch maintains a portfolio of readily liquid assets and has established committed funding arrangements from other institutions. Liquidity is managed by the Treasury Department of the Sydney Branch under the supervision of the Oceania Region Asset and Liability Management Committee. Reports on liquidity are reviewed by the Regional Head for Oceania, sent to the Parent Bank weekly and presented to the Oceania Region Asset and Liability Management Committee monthly.
The Branch holds the following liquid assets in order to manage its liquidity risk:
As at 30 September 2015
As at 30 September 2014
Unaudited Unaudited NZD NZD Cash and short term liquid assets 29,079,287 28,983,418 Amounts due from related parties 66,768,818 30,019,231 Amounts due from other financial institutions 104,570,078 54,757,663 Available-for-sale securities 121,384,723 224,665,080 321,802,906 338,425,392

The Bank of Tokyo-Mitsubishi UFJ, Ltd Auckland Branch
Notes to the Condensed Interim Financial Statements For the Six Months Ended 30 September 2015
28
16. Profitability and Size a) Profitability
The Overseas Banking Group Six Months Six Months ended ended 30 September 2015 30 September 2014 JPY(000’s) JPY(000’s) Net Profit After Tax 444,001,000 405,496,000 Net Profit After Tax over the previous 12 months period as a percentage of average total assets
0.36%
0.41%
b) Size Six Months Six Months ended ended 30 September 2015 30 September 2014 JPY(000’s) JPY(000’s) Total Assets 220,723,906,000 204,103,429,000 % Change in total assets over the previous 12 months
8.14% 6.22%
17. Asset Quality
(i) The Overseas Banking Group
As at 30 September 2015
JPY(000’s)
As at 30 September 2014
JPY(000’s)
Total individually impaired assets (before allowances for credit impairment loss and net of interest held in suspense)
1,275,325,000
1,297,910,000
Total individually impaired assets expressed as a percentage of total assets
0.58%
0.64%
Total individually credit impairment allowance 208,093,000 214,575,000
Total individually credit impairment allowance expressed as percentage of total individually impaired assets
16.32%
16.53% Total collective credit impairment allowance 574,917,000 502,942,000

The Bank of Tokyo-Mitsubishi UFJ, Ltd Auckland Branch
Notes to the Condensed Interim Financial Statements For the Six Months Ended 30 September 2015
29
17. Asset Quality (continued) (ii) The Bank of Tokyo-Mitsubishi UFJ, Ltd., Auckland Branch. The provision for impairment is made as a result of downgrading the Registered Bank’s internal credit rating of customers due to the customers’ cash flow problem that affects the customers’ going concern. The provision represents the Branch’s best estimate of the difference between the carrying amount of the loans and the recoverable amount based on expected future cash flows under liquidation.
As at 30 September 2015
NZD
As at 30 September 2014
NZD
Individual impaired assets – Gross amounts before provision for loan impairment:
Balance at the beginning of the period 63,695,652 64,410,714 Addition during the period - - Amounts written off - - Deletion - (715,122) Balance at the end of the period 63,695,652 63,645,652
The Bank of Tokyo-Mitsubishi UFJ, Ltd., Auckland Branch does not have any collective credit impairment allowance, and any past due but not impaired assets as at 30 September 2015. The total collective credit impairment allowance of the Overseas Banking Group covers the assets of the Branch. The aggregate amount of individual credit impairment allowance against individually impaired assets as at 30 September 2015 was NZD 63,695,652 ( 30 September 2014: NZD 33,758,695) The total interest income recognized on impaired asset over the accounting period ended 30 September 2015 is NZD 1,389,682 (30 September 2014: NZD 2,028,837)
Individual provision for loan impairment
As at
30 September 2015 NZD
As at 30 September 2014
NZD
Balance at the beginning of the period 63,695,652 34,137,710 (Credit) / Charge to financial performance for an increase in individual impairment allowance
- (379,015)
Amount written off - - Balance at the end of the period 63,695,652 33,758,695
Profit or loss charge As at
30 September 2015 NZD
As at 30 September 2014
NZD
Specific provisions for impairment against advances
- (379,015)
Total provisions for impairment against advances - (379,015)
There is no undrawn balance on lending commitments to counterparties for whom drawn balances are classified as individually impaired. There are no other amounts under administration.
The Bank of Tokyo-Mitsubishi UFJ Ltd., Auckland Branch does not have any financial assets designated as at fair value through profit or loss on which there have been changes in fair value that are attributable to changes in credit risk of the financial asset.

The Bank of Tokyo-Mitsubishi UFJ, Ltd Auckland Branch
Notes to the Condensed Interim Financial Statements For the Six Months Ended 30 September 2015
30
18. Exposures to Market Risk
Aggregate market risk exposures of The Bank of Tokyo-Mitsubishi UFJ, Ltd., Auckland Branch have been derived in accordance with Schedule 9 of the Reserve Bank Order.
Six Months ended 30 September 2015
Six Months ended 30 September 2014
Unaudited NZD
Unaudited NZD
(000’s) (000’s) (1) Aggregate Interest Rate Exposure
(a) Notional Capital Charge* 931 1,497
(b) Implied risk weighted exposure 11,638 18,713 * The Notional Capital Charge is calculated in accordance with Capital Adequacy Framework (Standardized
Approach) BS2A.
Peak End of Day Ending
30 September 2015
Peak End of Day Ending
30 September 2014 Unaudited Unaudited NZD NZD (000’s) (000’s) (1) Aggregate Interest Rate Exposure
(a) Notional Capital Charge** 2,736 3,814 (b) Implied risk weighted exposure 34,200 47,675
(2) Aggregate Foreign Currency Exposure The Bank of Tokyo-Mitsubishi UFJ, Ltd., Auckland Branch does not have any significant foreign currency
exposures. (3) Aggregate Equity Exposure The Bank of Tokyo-Mitsubishi UFJ, Ltd., Auckland Branch does not have any equity exposures. ** The peak end of day Notional Capital Charge has been derived by determining the maximum over the period
at the close of each business day derived in accordance with Capital Adequacy Framework (Standardized Approach) BS2A.
By entering into foreign exchange transactions, interest rate swap transactions, currency swap transactions and long term fixed interest deposits with the Sydney Branch, the Branch does not hold any significant foreign exchange exposure and long term interest rate exposure. Under this arrangement, the Branch is exposed to limited market risk which is immaterial.

The Bank of Tokyo-Mitsubishi UFJ, Ltd Auckland Branch
Notes to the Condensed Interim Financial Statements For the Six Months Ended 30 September 2015
31
19. Capital Adequacy
The table below presents the minimum consolidated risk-based capital ratios from 30 September 2014. The underlying figures are calculated in accordance with Japanese banking regulations based upon information derived from the consolidated financial statements prepared in accordance with Japanese GAAP, as required by the Financial Services Agency in Japan. It is expected to maintain a minimum ratio up to full implementation of Basel III at 31/3/2019 based on Basel III Internal rating-based approach as follows:
2014 2015 2016 2017 2018 2019
Minimum Common Equity Tier 1 ratio 4.0% 4.5% 4.5% 4.5% 4.5% 4.5% Capital Conservation Buffer 0.625% 1.25% 1.875% 2.5% Total 4.0% 4.5% 5.125% 5.75% 6.375% 7.0% Minimum Tier 1 ratio 5.5% 6.0% 6.0% 6.0% 6.0% 6.0% Total (with Capital Conservation Buffer) 5.5% 6.0% 6.625% 7.25% 7.875% 8.5% Minimum Capital ratio 8.0% 8.0% 8.0% 8.0% 8.0% 8.0% Total (with Capital Conservation Buffer) 8.0% 8.0% 8.625% 9.25% 9.875% 10.5%
Both the Overseas Banking Group and the Overseas Bank met those requirements at the reporting date. Overseas Banking Group As at As at
30 September 2015 30 September 2014 Unaudited Unaudited Capital ratios: Common Equity Tier 1 capital 10.77% 10.72% Tier 1 capital 12.23% 11.95% Total capital 15.39% 15.41%
Overseas Bank As at As at 30 September 2015 30 September 2014
Unaudited Unaudited Capital ratios: Common Equity Tier 1 capital 11.76% 11.57% Tier 1 capital 13.37% 13.30% Total capital 16.91% 17.12% The most recent publicly available information in relation to capital adequacy framework implemented by the overseas bank and overseas banking group are disclosed under the ultimate holding company’s annual report which can be accessed via the Bank’s global website: www.mufg.jp.
20. Credit Exposures to Individual Counterparties
Based on actual credit exposures, there is no credit exposure to any individual counterparty (excluding any booking outside New Zealand) of The Bank of Tokyo-Mitsubishi UFJ, Ltd., Auckland Branch equal to or exceeding 10% of the Overseas Banking Group’s equity at six months ended 30 September 2015. There has been no peak end-of-day aggregate credit exposure to any individual counterparty (excluding any booking outside New Zealand) of The Bank of Tokyo-Mitsubishi UFJ, Ltd., Auckland Branch equal to or exceeding 10% of the Overseas Banking Group’s equity as at 30 September 2015 during this accounting period. The credit exposure to individual counterparties was calculated on the basis of actual end of day aggregate amount of credit exposures by using investment grade credit rating over the period.
21. Insurance Business
The Bank of Tokyo-Mitsubishi UFJ, Ltd., Auckland Branch does not conduct any insurance business in or outside New Zealand.

The Bank of Tokyo-Mitsubishi UFJ, Ltd Auckland Branch
Notes to the Condensed Interim Financial Statements For the Six Months Ended 30 September 2015
32
22. Non-Consolidated Activities The Bank of Tokyo-Mitsubishi UFJ, Ltd. does not conduct any insurance business or non-financial activities in New Zealand outside The Bank of Tokyo-Mitsubishi UFJ, Ltd., Auckland Branch.
23. Securitization, Funds Management, and Other Fiduciary Activities
(a) The Bank of Tokyo-Mitsubishi UFJ, Ltd., Auckland Branch is not involved in any establishment, marketing, or sponsorship of trust, custodial, funds management or other fiduciary activities.
(b) The Bank of Tokyo-Mitsubishi UFJ, Ltd., Auckland Branch is not involved in any origination of securitized
assets or in the marketing or servicing of securitization schemes. (c) The Bank of Tokyo-Mitsubishi UFJ, Ltd., Auckland Branch is not involved in the marketing and distribution
of insurance products.
24. Risk Management Policies
The risk management policies and procedures of the Branch conform with those of the ultimate parent bank, The Bank of Tokyo-Mitsubishi UFJ, Ltd. ( “the Parent Bank”). The Branch's application of risk management systems is subject to review by the Parent Bank Internal Audit Office on a regular basis. There have been no material changes to the risk management polices since publication of the previous Disclosure Statement.
25. Financial Support
The Auckland Branch is part of The Bank of Tokyo-Mitsubishi UFJ, Ltd. The assets of the Branch are legally available for the satisfaction of debts of the entire company, not solely those appearing in the accompanying statement of financial position, and its debts may result in claims against assets not appearing thereon.
26. Subsequent Events
There has not been any matter or circumstance, other than that referred to in the financial statements or notes thereto, that has arisen since the six months ended 30 September 2015, that has significantly affected, or may significantly affect, the operations of the branch, the results of the operations, or the state of affairs of the branch in future financial years.

