supplementary regulatory capital disclosure risk associated with derivatives 12 securitization...
TRANSCRIPT

For further information, please contact: Amy South, Senior Vice-President, Investor Relations (416) 594-7386
Jason Patchett, Senior Director, Investor Relations (416) 980-8691
Supplementary
Regulatory Capital Disclosure
For the period ended January 31, 2018

January 31, 2018 Supplementary Regulatory Capital Disclosure
REGULATORY CAPITAL - TABLE OF CONTENTS This document is unaudited and should be read in conjunction with our quarterly report to shareholders and news release for Q1/18, and our 2017 annual report (including audited consolidated financial statements and accompanying management's discussion and analysis). Additional financial information is also available through our quarterly investor presentations as well as the quarterly conference call webcast. All relevant information in this document is prepared under International Financial Reporting Standards (IFRS) and all amounts are in millions of Canadian dollars, unless otherwise stated. BASEL RELATED SCHEDULES Regulatory Capital and Ratios - Basel III (All-in basis) 1 Credit Quality of AIRB Exposure - Retail Portfolios 17 Reconciliation of Capital (All-in basis) to Consolidated Regulatory Balance Sheet 3 AIRB Credit Risk Exposure - Loss Experience 21 Changes in Regulatory Capital - Basel III (All-in basis) 5 AIRB Credit Risk Exposure - Back-Testing 22 Basel III Leverage Ratio 6 Business and Government AIRB Exposures by Industry Groups 23 Risk-Weighted Assets (RWA) - Basel III 7 Exposure at Default (EAD) under the Standardized Approach 24 Changes in Common Equity Tier 1 (CET1) RWA - Basel III (All-in basis) 8 Exposure Covered by Guarantees and Credit Derivatives 25 Credit Exposure (Exposure at default) 9 Exposures Securitized as Originator 25 Credit Exposure - Geographic Concentration 10 Bank Sponsored Multi-Seller Conduits Exposure 26 Credit Exposure - Maturity Profile 11 Total Securitization Exposures - Internal ratings based (IRB) Approach 26 Credit Risk Associated with Derivatives 12 Securitization Exposures - Risk Weighted Assets and Capital Charges Credit Quality of Advanced internal ratings-based (AIRB) Exposure - Business and (IRB Approach) 27 Government Portfolios (Risk Rating Method) 13 Basel - Glossary 29

January 31, 2018 Supplementary Regulatory Capital Disclosure Page 1
REGULATORY CAPITAL AND RATIOS - BASEL III (ALL-IN BASIS 1) ($ millions) Q1/18 Q4/17 Q3/17 Q2/17 Q1/17 Q4/16 Q3/16 Q2/16 Q1/16 Cross-
Row 2 reference 3
Common Equity Tier 1 (CET1) capital: instruments and reserves
1 Directly issued qualifying common share capital plus related stock surplus 13,204 A+B 12,685 12,320 8,574 8,351 8,096 7,879 7,864 7,861 2 Retained earnings 16,701 C 16,101 15,535 15,011 14,483 13,584 13,145 12,197 11,785 3 Accumulated other comprehensive income (and other reserves) (17) D 452 167 1,083 698 790 509 522 1,124 5 Common share capital issued by subsidiaries and held by third parties (amount allowed in group CET1) 106 E 109 107 114 108 113 101 97 109 6 Common Equity Tier 1 capital before regulatory adjustments 29,994 29,347 28,129 24,782 23,640 22,583 21,634 20,680 20,879 Common Equity Tier 1 capital: regulatory adjustments
7 Prudential valuation adjustments 60 See footnote 4 62 63 60 67 69 68 63 59 8 Goodwill (net of related tax liabilities) 5,188 F+G+H 5,284 5,019 1,468 1,444 1,461 1,449 1,785 1,887 9 Other intangibles other than mortgage-servicing rights (net of related tax liabilities) 1,660 I+J+AL 1,654 1,531 1,304 1,277 1,258 1,214 1,166 1,149 10 Deferred tax assets excluding those arising from temporary differences (net of related tax liabilities) 6 K 18 24 71 66 70 56 99 117 11 Cash flow hedge reserve 39 L 33 27 46 38 23 26 18 15 12 Shortfall of allowances to expected losses 5 631 See footnote 4 474 447 242 301 283 256 193 213 14 Gain and losses due to changes in own credit risk on fair valued liabilities 27 M+AK 41 54 44 62 102 101 72 109 15 Defined benefit pension fund net assets (net of related tax liabilities) 268 N+O 160 300 191 287 156 115 110 124 16 Investments in own shares (if not already netted off paid-in capital on reported balance sheet) - See footnote 4 3 - - 5 13 4 9 9 19 Significant investments in the common stock of banking, financial and insurance entities that are outside
the scope of regulatory consolidation, net of eligible short positions (amount above 10% threshold) - P+Q - - - - - - - - 22 Amount exceeding the 15% threshold - - - - - - - - - 23 of which: significant investments in the common stock of financials - R+S - - - - - - - - 25 of which: deferred tax assets arising from temporary differences - T - - - - - - - - 28 Total regulatory adjustments to Common Equity Tier 1 7,879 7,729 7,465 3,426 3,547 3,435 3,289 3,515 3,682 29 Common Equity Tier 1 capital (CET1) 22,115 21,618 20,664 21,356 20,093 19,148 18,345 17,165 17,197 Additional Tier 1 (AT1) capital: instruments
30 Directly issued qualifying Additional Tier 1 instruments plus related stock surplus 6 2,246 1,797 1,796 1,000 1,000 1,000 1,000 1,000 1,000 31 of which: classified as equity under applicable accounting standards 2,246 U 1,797 1,796 1,000 1,000 1,000 1,000 1,000 1,000 33 Directly issued capital instruments subject to phase out from Additional Tier 1 1,003 V+see footnote 7 1,253 1,253 1,253 1,253 1,504 1,504 1,504 1,504 34 Additional Tier 1 Instruments (and CET1 instruments not in row 5) issued by subsidiaries and held by
third parties (amount allowed in group AT1) 13 W 14 13 15 14 14 13 13 15 36 Additional Tier 1 capital before regulatory adjustments 3,262 3,064 3,062 2,268 2,267 2,518 2,517 2,517 2,519 Additional Tier 1 capital: regulatory adjustments
41 Other deductions from Tier 1 capital as determined by OSFI - - - - - - - - - 41b of which: valuation adjustment for less liquid positions - - - - - - - - - 43 Total regulatory adjustments to Additional Tier 1 capital - - - - - - - - - 44 Additional Tier 1 capital (AT1) 3,262 3,064 3,062 2,268 2,267 2,518 2,517 2,517 2,519 45 Tier 1 capital (T1 = CET1 + AT1) 25,377 24,682 23,726 23,624 22,360 21,666 20,862 19,682 19,716 Tier 2 capital: instruments and provisions
46 Directly issued qualifying Tier 2 instruments plus related stock surplus 8 1,925 X 1,961 1,961 1,982 1,975 2,001 2,005 1,986 1,991 47 Directly issued capital instruments subject to phase out from Tier 2 1,182 Y 1,204 1,197 1,279 1,287 1,323 1,354 1,327 1,351 48 Tier 2 instruments (and CET1 and AT1 instruments not included in rows 5 or 34) issued by
subsidiaries and held by third parties (amount allowed in Tier 2) 18 Z 19 19 19 18 19 18 17 19 50 General allowances (Q4/17 and prior: Collective allowance) 9 269 AA+AB 263 250 73 70 74 72 71 76 51 Tier 2 capital before regulatory adjustments 3,394 3,447 3,427 3,353 3,350 3,417 3,449 3,401 3,437 57 Total regulatory adjustments to Tier 2 capital - - - - - - - - - 58 Tier 2 capital (T2) 3,394 3,447 3,427 3,353 3,350 3,417 3,449 3,401 3,437 59 Total capital (TC = T1 + T2) 28,771 28,129 27,153 26,977 25,710 25,083 24,311 23,083 23,153 60 Total RWA n/a n/a n/a n/a n/a n/a n/a n/a n/a 60a Common Equity Tier 1 (CET1) Capital RWA 10 204,647 203,321 198,459 175,431 169,350 168,996 168,077 165,419 162,583 60b Tier 1 Capital RWA 10 204,647 203,321 198,686 175,431 169,575 169,322 168,407 165,746 162,899 60c Total Capital RWA 10 204,647 203,321 198,867 175,431 169,755 169,601 168,690 166,027 163,169
For footnotes, see next page.

January 31, 2018 Supplementary Regulatory Capital Disclosure Page 2
REGULATORY CAPITAL AND RATIOS - BASEL III (ALL-IN BASIS 1) (continued) ($ millions) Q1/18 Q4/17 Q3/17 Q2/17 Q1/17 Q4/16 Q3/16 Q2/16 Q1/16 Cross-
Row 2 reference 3
Capital ratios
61 Common Equity Tier 1 (as a percentage of risk-weighted assets) 10.8% 10.6% 10.4% 12.2% 11.9% 11.3% 10.9% 10.4% 10.6% 62 Tier 1 (as a percentage of risk-weighted assets) 12.4% 12.1% 11.9% 13.5% 13.2% 12.8% 12.4% 11.9% 12.1% 63 Total capital (as a percentage of risk-weighted assets) 14.1% 13.8% 13.7% 15.4% 15.2% 14.8% 14.4% 13.9% 14.2% 64 Buffer requirement (minimum CET1 requirement plus capital conservation buffer plus G-SIB buffer requirement
plus D-SIB buffer requirement expressed as a percentage of risk-weighted assets) 8.0% 8.0% 8.0% 8.0% 8.0% 8.0% 8.0% 8.0% 8.0% 65 of which: capital conservation buffer requirement 2.5% 2.5% 2.5% 2.5% 2.5% 2.5% 2.5% 2.5% 2.5% 66 of which: institution specific countercyclical buffer requirement 0.0% 0.0% 0.0% 0.0% 0.0% n/a n/a n/a n/a 67a of which: D-SIB buffer requirement 1.0% 1.0% 1.0% 1.0% 1.0% 1.0% 1.0% 1.0% 1.0% 68 Common Equity Tier 1 available to meet buffers (as percentage of risk-weighted assets) 10.8% 10.6% 10.4% 12.2% 11.9% 11.3% 10.9% 10.4% 10.6% OSFI all-in target (minimum + capital conservation buffer + D-SIB surcharge (if applicable))
69 Common Equity Tier 1 all-in target ratio 8.0% 8.0% 8.0% 8.0% 8.0% 8.0% 8.0% 8.0% 8.0% 70 Tier 1 capital all-in target ratio 9.5% 9.5% 9.5% 9.5% 9.5% 9.5% 9.5% 9.5% 9.5% 71 Total capital all-in target ratio 11.5% 11.5% 11.5% 11.5% 11.5% 11.5% 11.5% 11.5% 11.5% Amounts below the thresholds for deduction (before risk-weighting) AG+AI+AJ+
72 Non-significant investments in the capital of other financials 279 see footnote 11 306 450 453 409 348 368 425 432 73 Significant investments in the common stock of financials 804 AD+AE+AF 802 810 828 806 814 828 1,463 1,521 75 Deferred tax assets arising from temporary differences (net of related tax liabilities) 1,030 AC 1,170 1,157 912 894 978 981 892 841 Applicable caps on the inclusion of allowances in Tier 2
Allowances eligible for inclusion in Tier 2 in respect of exposures subject to standardized approach
76 (prior to application of cap) 269 263 250 73 70 74 72 71 76 77 Cap on inclusion of allowances in Tier 2 under standardized approach 269 AA 263 250 73 70 74 72 71 76 78 Allowances eligible for inclusion in Tier 2 in respect of exposures subject to internal ratings-based approach
(prior to application of cap) - - - - - - - - - 79 Cap on inclusion of allowances in Tier 2 under ratings-based approach - AB - - - - - - - - Capital instruments subject to phase-out arrangements (only applicable between 1 Jan 2013 and 1 Jan 2022)
80 Current cap on CET1 instruments subject to phase out arrangements n/a n/a n/a n/a n/a n/a n/a n/a n/a 81 Amount excluded from CET1 due to cap (excess over cap after redemptions and maturities) n/a n/a n/a n/a n/a n/a n/a n/a n/a V+see
82 Current cap on AT1 instruments subject to phase out arrangements 1,003 footnote 7 1,253 1,253 1,253 1,253 1,504 1,504 1,504 1,504 AH+see
83 Amount excluded from AT1 due to cap (excess over cap after redemptions and maturities) 608 footnote 7 369 376 376 392 158 167 165 173 84 Current cap on T2 instruments subject to phase out arrangements 1,802 2,253 2,253 2,253 2,253 2,704 2,704 2,704 2,704 85 Amount excluded from T2 due to cap (excess over cap after redemptions and maturities) - - - - - - - - -
1 All-in is defined by OSFI as capital calculated to include all of the regulatory adjustments that will be required by 2019, but retaining the phase-out rules for non-qualifying capital instruments. OSFI mandated all institutions to have established a target CET1 ratio of 7%, comprised of the 2019 all-in minimum ratio plus conservation buffer. For the Tier 1 and Total capital ratios, the all-in targets were 8.5% and 10.5%, respectively, effective the first quarter of 2014. With the application of the 1% D-SIB CET1 surcharge, the targets are 8%, 9.5% and 11.5% effective January 2016.
2 Per OSFI's "Public Capital Disclosure Requirements related to Basel III Pillar 3" advisory in accordance with Basel III all-in-basis calculations. 3 Cross-referenced to the consolidated balance sheet, refer to pages 3 and 4.
4 Not recorded on the consolidated balance sheet.
5 Beginning in Q1/18, the allowance in the shortfall calculation is in accordance with IFRS 9. The allowance in prior periods was in accordance with International Accounting Standard (IAS) 39 and has not been restated. See external reporting changes discussed in “Notes to users” on page 1 of the Supplementary Financial Information for additional details.
6 Comprises non-cumulative Class A Preferred Shares 39, 41, 43, and 45 (effective Q3/17) and 47 (effective Q1/18) which are treated as non-viability contingent capital in accordance with OSFI's capital adequacy guidelines. 7 Comprises CIBC Tier 1 Notes - Series A and Series B due June 30, 2108 (together, the Tier 1 Notes). The adoption of IFRS 10 "Consolidated Financial Statements" required CIBC to deconsolidate CIBC Capital Trust, which resulted in the removal of
Capital Trust securities issued by CIBC Capital Trust from the consolidated balance sheet and instead recognizing the senior deposit notes issued by CIBC to CIBC Capital Trust within Business and government deposits. 8 Comprises Debentures due on October 28, 2024 and January 26, 2026 which are treated as non-viability contingent capital in accordance with OSFI's capital adequacy guidelines.
9 Prior to the first quarter of fiscal 2018, was previously collective allowances under IAS 39. 10 As a result of the option that CIBC chose for calculating the credit valuation adjustment (CVA) capital charge, the calculation of CET1, Tier 1 and Total Capital ratios is based on different RWAs, before any capital floor adjustment, beginning in Q3/14.
The charge will be phased-in during 2014-2019 and relates to bilateral over-the-counter (OTC) derivatives included in credit risk RWA. Q1/18, Q4/17 and Q2/17 RWA include capital floor adjustments. See page 7 for further details. 11 Synthetic positions not recorded on the consolidated balance sheet.
n/a Not applicable.

January 31, 2018 Supplementary Regulatory Capital Disclosure Page 3
RECONCILIATION OF CAPITAL (ALL-IN BASIS) TO CONSOLIDATED REGULATORY BALANCE SHEET 1
($ millions) Q1/18 Balance sheet Insurance entities adjustment 2 Balance sheet as in Cross as in report to Equity the regulatory scope reference to shareholders Deconsolidation accounting of consolidation Of which capital schedule 3
Assets
Cash and non-interest-bearing deposits with banks 3,301 - - 3,301 Interest-bearing deposits with banks 11,939 - - 11,939 Securities 95,284 (236.0) - 95,048 Significant investments in capital of other financial institutions not exceeding regulatory thresholds - AF Non-significant investments in capital of other financial institutions not exceeding regulatory thresholds 32 AG Significant investments in capital of non-financial institutions - Other securities 95,016 Cash collateral on securities borrowed 6,989 - - 6,989 Securities purchased under resale agreements 48,271 - - 48,271 Loans 358,633 - - 358,633 Allowance for credit losses (1,626.0) - - (1,626.0) General allowance reflected in Tier 2 capital 4 (269.0) AA Excess in allowance over expected losses reflected in Tier 2 capital - AB Allowances not reflected in regulatory capital (1,357.0) Derivative instruments 29,304 - - 29,304 Customers' liability under acceptances 9,672 - - 9,672 Land, buildings and equipment 1,735 - - 1,735 Goodwill 5,267 - - 5,267 F Software and other intangible assets 1,920 - - 1,920 I Investments in equity-accounted associates and joint ventures 555 - 404 959 Significant investments in capital of other financial institutions exceeding regulatory thresholds (10% of CET1) - P Significant investments in capital of other financial institutions exceeding regulatory thresholds (15% basket of CET1) - R Significant investments in capital of other financial institutions not exceeding regulatory thresholds 400 AD Significant investments in capital of other financial institutions related to goodwill 11 G Significant investments in capital of other financial institutions related to intangibles 4 AL Significant investments in capital of non-financial institutions 34 Investment in deconsolidated subsidiaries exceeding regulatory thresholds (10% of CET1) - Q Investment in deconsolidated subsidiaries exceeding regulatory thresholds (15% basket of CET1) - S Investment in deconsolidated subsidiaries not exceeding regulatory thresholds 404 AE Non-significant investments in capital of other financial institutions not exceeding regulatory thresholds 101 AJ Non significant investments in capital of non-financial institutions 5 Deferred tax assets 607 - - 607 Deferred tax assets excluding those arising from temporary differences 6 K Deferred tax assets arising from temporary differences exceeding regulatory thresholds (15% basket of CET1) - T Deferred tax assets arising from temporary differences not exceeding regulatory thresholds 1,030 AC Deferred tax liabilities related to goodwill (90.0) H Deferred tax liabilities related to software and other intangible assets (264.0) J Deferred tax liabilities related to defined benefit pension fund net assets (75.0) O Other assets
Defined benefit pension fund net assets 343 - - 343 N Other 14,733 (101.0) - 14,632 Non-significant investments in capital of other financial institutions not exceeding regulatory thresholds 5 AI Other 14,627
Total assets 586,927 (337.0) 404 586,994
For footnotes, see next page.

January 31, 2018 Supplementary Regulatory Capital Disclosure Page 4
RECONCILIATION OF CAPITAL (ALL-IN BASIS) TO CONSOLIDATED REGULATORY BALANCE SHEET 1 (continued)
Q1/18 Balance
($ millions) Insurance entities adjustment 2 sheet as in Cross Balance sheet the regulatory reference as in report to Equity scope of to capital Liabilities shareholders Deconsolidation accounting consolidation Of which schedule 3
Deposits 446,179 - - 446,179 Obligations related to securities sold short 15,247 - - 15,247 Cash collateral on securities lent 1,499 - - 1,499 Obligations related to securities sold under repurchase agreements 33,729 - - 33,729 Derivative instruments 29,091 - - 29,091 Acceptances 9,675 - - 9,675 Deferred tax liabilities 32 - - 32 Other liabilities 16,009 23 44 16,076 Subordinated indebtedness 3,144 - - 3,144 Subordinated indebtedness allowed for inclusion in Tier 2 capital 1,925 X Subordinated indebtedness allowed for inclusion in Tier 2 capital subject to phase out 1,182 Y Regulatory capital amortization of maturing subordinated indebtedness not allowed for Tier 2 capital - Subordinated indebtedness excluded from Tier 2 capital due to cap - Subordinated indebtedness not allowed for Tier 2 capital 37
Total liabilities 554,605 23 44 554,672
Equity
Preferred shares 2,246 - - 2,246 Preferred shares allowed for inclusion into additional Tier 1 capital 2,246 U Preferred shares allowed for inclusion into additional Tier 1 capital subject to phase out - V Preferred shares excluded from additional Tier 1 capital due to cap - AH Common shares 13,070 - - 13,070 Common shares – treasury positions 1 Common shares 13,069 A Contributed surplus 135 - - 135 B Retained earnings 16,701 (362) 362 16,701 C Gains and losses due to changes in own credit risk on fair valued liabilities 40 M Other retained earnings 16,661 AOCI (17) 2 (2) (17) D Cash flow hedges 39 L Net fair value gains (losses) arising from changes in institution's own credit risk (13) AK Other (43) Non-controlling interests 187 - - 187
Portion allowed for inclusion into CET1 106 E
Portion allowed for inclusion into additional Tier 1 capital 13 W
Portion allowed for inclusion into Tier 2 capital 18 Z
Portion not allowed for regulatory capital 50
Total equity 32,322 (360) 360 32,322
Total liabilities and equity 586,927 (337) 404 586,994 1 Per OSFI's “Public Capital Disclosure Requirements related to Basel III Pillar 3” advisory. 2 Comprises our insurance subsidiaries: CIBC Reinsurance Company Limited (CIBC Re), and CIBC Life Insurance Company Limited (CIBC Life), which are excluded from the regulatory scope of consolidation. CIBC Re provides Life and Health reinsurance to Canadian insurance and international
reinsurance companies. CIBC Re is also an active participant in the North American retrocession market. CIBC Life is primarily involved in direct underwriting of life insurance products and has assumed a closed creditor product block of business from a Canadian underwriter; current policies in-force include accidental death, hospital accident, hospital cash benefit plans, critical accident plan, accident recovery plan, term life, and creditor life and disability insurance products. As at January 31, 2018, CIBC Re had $210 million in assets, $51 million in liabilities, and $159 million in equity, and CIBC Life had $127 million in assets, $(74) million in liabilities, and $201 million in equity.
3 Refer to pages 1 and 2. 4 Prior to the first quarter of fiscal 2018, was previously collective allowances under IAS 39.

January 31, 2018 Supplementary Regulatory Capital Disclosure Page 5
CHANGES IN REGULATORY CAPITAL - BASEL III (ALL-IN BASIS 1) ($ millions) Q1/18 Q4/17 Q3/17 Q2/17 Q1/17 Q4/16 Q3/16 Q2/16 Q1/16 Common Equity Tier 1 (CET1) capital
Opening amount 21,618 20,664 21,356 20,093 19,148 18,345 17,165 17,197 16,829 Issue of common shares pursant to the acquisition of The PrivateBank 194 - 3,443 - - - - - - Issue of common shares pursant to the acquisition of Geneva Advisors - 126 - - - - - - - Issue of common shares pursant to the acquisition of Wellington Financial 47 - - - - - - - - Other issue of common shares 82 40 37 40 91 48 23 18 20 Redeemed capital - - - - - - - - - Purchase of common shares for cancellation - - - - - - - (15) (46) Premium on purchase of common shares for cancellation - - - - - - - (50) (159) Gross dividends (deduction) (592) (593) (560) (518) (502) (488) (487) (476) (466) Shares issued in lieu of cash dividends (add back) 196 201 187 191 170 164 - - - Profit for the quarter (attributable to shareholders of the parent company) 1,323 1,159 1,093 1,045 1,402 927 1,435 936 977 Removal of own credit spread (net of tax) 14 13 (10) 18 40 (1) (29) 37 (28) Change in AOCI balances included in regulatory capital
Currency translation differences (582) 431 (1,057) 503 (253) 223 86 (632) 402 Securities measured at fair value through other comprehensive income (FVOCI) (Q4/17 and prior:
Available-for-sale investments) (54) (24) (42) 35 (70) 9 40 40 (22) Cash flow hedges 6 6 (19) 8 15 (3) 8 3 (7) Post-employment defined benefit plans 107 (125) 203 (158) 219 55 (148) (11) (286) Goodwill and other intangible assets (deduction, net of related tax liabilities) 90 (388) (3,778) (51) (2) (56) 288 85 (132) Shortfall of allowance to expected losses (157) (27) (205) 59 (18) (27) (63) 20 (92) Other, including regulatory adjustments and transitional arrangements
Deferred tax assets that rely on future profitability (excluding those arising from temporary differences) 12 6 47 (5) 4 (14) 43 18 (55)
Defined benefit pension fund net assets (108) 140 (109) 96 (131) (41) (5) 14 261 Significant investments in financial institutions (amount above 10% threshold) - - - - - - - - - Amount exceeding 15% threshold - - - - - - - - - Prudential valuation adjustments 2 1 (3) 7 2 (1) (5) (4) (9) Other2 (83) (12) 81 (7) (22) 8 (6) (15) 10 Closing amount 22,115 21,618 20,664 21,356 20,093 19,148 18,345 17,165 17,197 Additional Tier 1 (AT1) capital
Opening amount 3,064 3,062 2,268 2,267 2,518 2,517 2,517 2,519 2,691 AT1 eligible capital issues 450 - 800 - - - - - - Redeemed capital - - - - - - - - - Impact of the cap on inclusion for instruments subject to phase out (251) - - - (251) - - - (173) Other, including regulatory adjustments and transitional arrangements (1) 2 (6) 1 - 1 - (2) 1 Closing amount 3,262 3,064 3,062 2,268 2,267 2,518 2,517 2,517 2,519 Total Tier 1 capital 25,377 24,682 23,726 23,624 22,360 21,666 20,862 19,682 19,716 Tier 2 capital
Opening amount 3,447 3,427 3,353 3,350 3,417 3,449 3,401 3,437 3,914 New Tier 2 eligible capital issues - - - - - - - - 1,000 Redeemed capital - - - - - - - - (1,500) Amortization adjustments - - - - - - - - - Impact of the cap on inclusion for instruments subject to phase out - - - - - - - - - Other, including regulatory adjustments and transitional arrangements (53) 20 74 3 (67) (32) 48 (36) 23 Closing amount 3,394 3,447 3,427 3,353 3,350 3,417 3,449 3,401 3,437 Total capital 28,771 28,129 27,153 26,977 25,710 25,083 24,311 23,083 23,153 1 All-in is defined by OSFI as capital calculated to include all of the regulatory adjustments that will be required by 2019, but retaining the phase-out rules for non-qualifying capital instruments. 2 Includes the net impact on retained earnings and AOCI as at November 1, 2017 from the adoption of IFRS 9. See external reporting changes discussed in “Notes to users” on page 1 of the Supplementary Financial Information for additional details.

January 31, 2018 Supplementary Regulatory Capital Disclosure Page 6
BASEL III LEVERAGE RATIO ($ millions) Q1/18 Q4/17 Q3/17 Q2/17 Q1/17 Q4/16 Q3/16 Q2/16 Q1/16 Row 1, 2
On-balance sheet exposures
1 On-balance sheet items (excluding derivatives, securities financing transactions (SFTs) and grandfathered
securitization exposures, but including collateral) 500,027 493,003 486,823 456,527 442,244 437,179 426,904 411,069 409,667 2 Asset amounts deducted in determining Basel III Tier 1 capital (7,852) (7,690) (7,411) (3,381) (3,483) (3,333) (3,188) (3,443) (3,573) 3 Total on-balance sheet exposures (excluding derivatives and SFTs) (sum of lines 1 and 2) 492,175 485,313 479,412 453,146 438,761 433,846 423,716 407,626 406,094 Derivative exposures
4 Replacement cost associated with all derivative transactions (i.e. net of eligible cash variation margin) 6,734 5,339 5,066 6,452 4,981 6,418 7,065 6,634 7,923 5 Add-on amounts for potential future exposure (PFE) associated with all derivative transactions 18,387 17,224 15,638 16,567 14,549 14,406 14,668 13,964 13,393 6 Gross up for derivatives collateral provided where deducted from the balance sheet assets pursuant to the
operative accounting framework - - - - - - - - - 7 (Deductions of receivables assets for cash variation margin provided in derivative transactions) (5,502) (4,016) (4,585) (4,990) (5,408) (5,667) (5,450) (5,280) (6,267) 8 (Exempted central counterparty (CCP)-leg of client cleared trade exposures) - - - - - - - - - 9 Adjusted effective notional amount of written credit derivatives 467 389 125 - - 216 356 239 397 10 (Adjusted effective notional offsets and add-on deductions for written credit derivatives) (467) (389) - - - (22) (154) (25) (169) 11 Total derivatives exposures (sum of lines 4 to 10) 19,619 18,547 16,244 18,029 14,122 15,351 16,485 15,532 15,277 Securities financing transaction exposures
12 Gross SFT assets recognized for accounting purposes (with no recognition of netting), after adjusting for sale
accounting transactions 55,260 45,418 45,072 43,842 44,556 33,810 36,460 35,722 34,811 13 (Netted amounts of cash payables and cash receivables of gross SFT assets) (4,501) (2,392) - - - - - - - 14 Counterparty credit risk (CCR) exposure for SFTs 2,556 1,903 1,989 2,013 1,682 1,772 1,135 860 1,005 15 Agent transaction exposures - - - - - - - - - 16 Total securities financing transaction exposures (sum of lines 12 to 15) 53,315 44,929 47,061 45,855 46,238 35,582 37,595 36,582 35,816 Other off-balance sheet exposures
17 Off-balance sheet exposure at gross notional amount 236,408 233,667 231,083 218,975 211,165 212,888 208,903 203,249 204,266 18 (Adjustments for conversion to credit equivalent amounts) (174,911) (172,103) (171,486) (163,901) (154,456) (152,187) (149,527) (146,151) (145,416) 19 Off-balance sheet items (sum of lines 17 and 18) 61,497 61,564 59,597 55,074 56,709 60,701 59,376 57,098 58,850
20 Tier 1 capital 25,377 24,682 23,726 23,624 22,360 21,666 20,862 19,682 19,716 21 Total exposures (sum of lines 3, 11, 16 and 19) 626,606 610,353 602,314 572,104 555,830 545,480 537,172 516,838 516,037
22 Basel III leverage ratio 4.0% 4.0% 3.9% 4.1% 4.0% 4.0% 3.9% 3.8% 3.8%
SUMMARY COMPARISON OF ACCOUNTING ASSETS VS. LEVERAGE RATIO EXPOSURE MEASURE
($ millions) Q1/18 Q4/17 Q3/17 Q2/17 Q1/17 Q4/16 Q3/16 Q2/16 Q1/16
Row 1, 2
1 Total consolidated assets as per published financial statements 586,927 565,264 560,912 528,591 513,294 501,357 494,490 478,144 479,032 2 Adjustment for investments in banking, financial, insurance or commercial entities that are consolidated for accounting
purposes but outside the scope of regulatory consolidation 67 80 80 120 136 129 165 130 132 3 Adjustment for fiduciary assets recognized on the balance sheet pursuant to the operative accounting framework but
excluded from the leverage ratio exposure measure - - - - - - - - - 4 Adjustment for derivative financial instruments (9,684) (5,796) (10,126) (7,583) (9,775) (12,412) (12,067) (13,209) (16,662) 5 Adjustment for securities financing transactions (i.e. repos and similar secured lending) (1,945) (489) 1,989 2,013 1,682 1,772 1,135 860 1,005 6 Adjustment for off-balance sheet items (i.e. credit equivalent amounts of off-balance sheet exposures) 61,497 61,564 59,597 55,074 56,709 60,701 59,376 57,098 58,850 7 Other adjustments (10,256) (10,270) (10,138) (6,111) (6,216) (6,067) (5,927) (6,185) (6,320) 8 Leverage ratio exposure 626,606 610,353 602,314 572,104 555,830 545,480 537,172 516,838 516,037 1 Per OSFI's "Public Disclosure Requirements related to Basel III Leverage Ratio" published in December 2017. 2 To enhance comparability, the all-in information for Q4/17 and prior quarters has been re-arranged to align with the row numbers in OSFI’s “Public Disclosure Requirements related to Basel III Leverage Ratio” published in December 2017. The information for Q4/17 and prior
quarters has not changed.

January 31, 2018 Supplementary Regulatory Capital Disclosure Page 7
RISK-WEIGHTED ASSETS ($ millions)
Q1/18 Q4/17 Q3/17 Q2/17 Q1/17 Q4/16 Q3/16 Q2/16 Q1/16 Minimum total capital RWA
RWA required 1
Credit risk 2
Standardized approach
Corporate 27,707 2,217 28,029 26,631 3,727 3,578 3,645 3,674 3,515 3,952 Sovereign 1,454 116 1,597 1,550 777 621 780 658 627 690 Banks 430 34 488 438 439 442 521 472 438 411 Real estate secured personal lending 2,437 195 2,735 2,645 2,085 2,100 2,181 2,144 2,075 2,373 Other retail 838 67 933 873 833 666 667 647 616 695 Trading book 181 14 187 188 152 130 123 105 70 67 33,047 2,643 33,969 32,325 8,013 7,537 7,917 7,700 7,341 8,188 AIRB approach Corporate 63,716 5,097 64,924 64,133 64,418 64,074 64,856 65,185 64,496 63,157 Sovereign 3 2,303 184 2,093 2,048 1,900 2,075 2,185 2,245 2,150 2,187 Banks 3,505 280 3,215 3,110 3,582 3,601 3,526 3,753 3,602 3,950 Real estate secured personal lending 15,706 1,256 14,738 14,566 13,691 13,156 12,115 11,497 10,483 10,242 Qualifying revolving retail 17,844 1,428 17,355 16,931 17,050 17,432 17,512 17,200 16,839 16,961 Other retail 7,507 601 7,579 8,296 8,182 7,965 7,813 7,738 7,596 7,334 Equity 739 59 759 813 699 734 705 693 717 726 Trading book 3,666 293 3,345 3,164 3,641 3,359 3,576 3,387 3,301 3,213 Securitization 1,276 102 1,341 1,296 1,340 1,398 2,218 2,290 1,981 2,108 Adjustment for scaling factor 6,966 557 6,911 6,852 6,860 6,818 6,860 6,830 6,660 6,582 123,228 9,857 122,260 121,209 121,363 120,612 121,366 120,818 117,825 116,460 Other credit RWA 10,675 854 11,427 11,356 10,893 10,322 10,815 11,276 12,539 12,785 Total credit risk (before adjustment for CVA phase-in) 4 166,950 13,354 167,656 164,890 140,269 138,471 140,098 139,794 137,705 137,433 Market risk (Internal Models and IRB Approach) Value-at-risk (VaR) 858 69 935 1,203 1,005 989 881 911 1,346 790 Stressed VaR 2,214 177 2,058 2,420 2,066 2,104 1,623 1,729 2,019 1,978 Incremental risk charge 2,290 183 1,843 2,186 3,167 2,383 1,624 1,209 1,134 1,295 Securitization & other 247 20 556 169 85 75 47 86 15 27 Total market risk 5,609 449 5,392 5,978 6,323 5,551 4,175 3,935 4,514 4,090 Operational risk 25,241 2,019 24,664 24,327 22,452 22,081 21,746 21,327 20,202 18,180 Total RWA before adjustments for CVA phase-in and capital floor 4, 5 A 197,800 15,822 197,712 195,195 169,044 166,103 166,019 165,056 162,421 159,703 CVA adjustment 4
CET1 RWA B 3,798 304 3,498 3,264 3,655 3,247 2,977 3,021 2,998 2,880 Tier 1 RWA C 3,940 315 3,741 3,491 3,909 3,472 3,303 3,351 3,325 3,196 Total RWA D 4,083 327 3,935 3,672 4,112 3,652 3,582 3,634 3,606 3,466 Capital floor adjustment 5
CET1 RWA E 3,049 244 2,111 n/a 2,732 n/a n/a n/a n/a n/a Tier 1 RWA F 2,907 233 1,868 n/a 2,478 n/a n/a n/a n/a n/a Total RWA G 2,764 221 1,674 n/a 2,275 n/a n/a n/a n/a n/a Total RWA after adjustments for CVA phase-in and capital floor 4, 5
CET1 capital RWA A+B+E 204,647 16,370 203,321 198,459 175,431 169,350 168,996 168,077 165,419 162,583 Tier 1 capital RWA A+C+F 204,647 16,370 203,321 198,686 175,431 169,575 169,322 168,407 165,746 162,899 Total capital RWA A+D+G 204,647 16,370 203,321 198,867 175,431 169,755 169,601 168,690 166,027 163,169 1 Refers to the minimum standard established by the BCBS before the application of the capital conservation buffer and any other capital buffers including but not limited to the capital surcharge for global/domestic systemically important banks that may be established by regulators from time to time. It is
calculated by multiplying RWA by 8%. 2 Credit risk for CIBC Bank USA is calculated under the standardized approach. 3 Includes residential mortgages insured by Canadian Mortgage and Housing Corporation (CMHC), an agency of the government of Canada, and government guaranteed student loans. 4 As a result of the option that CIBC chose for calculating the CVA capital charge, the calculation of CET1, Tier 1 and Total Capital ratios is based on different RWAs, before any capital floor adjustment, beginning in Q3/14. The charge will be phased-in during 2014-2019 and relates to bilateral OTC
derivatives included in credit risk RWA. 5 Since the introduction of Basel II in 2008, OSFI has prescribed a capital floor requirement for institutions that use the AIRB approach for credit risk. The capital floor is determined by comparing a capital requirement calculated by reference to Basel I against the Basel III calculation, as specified by OSFI.
Any shortfall in the Basel III capital requirement compared with the Basel I floor is added to RWAs. RWAs at Q1/18, Q4/17 and Q2/17 include a capital floor adjustment. See the "Continuous enhancement to regulatory capital requirements" section of the Q1/18 MD&A in our report to shareholders for a discussion of the revisions to the capital floor requirement, which will be effective beginning in the second quarter of 2018.
n/a Not applicable.

January 31, 2018 Supplementary Regulatory Capital Disclosure Page 8
CHANGES IN CET1 RISK-WEIGHTED ASSETS 1
($ millions)
Q1/18 vs. Q4/17 Q4/17 vs. Q3/17 Q3/17 vs. Q2/17 Q2/17 vs. Q1/17
Of which Of which Of which Of which counterparty counterparty
counterparty counterparty
Credit risk Credit risk credit risk 2 Credit risk credit risk 2
Credit risk credit risk 2
Credit risk credit risk 2
Balance at beginning of period 171,154 10,125 168,154 9,436 143,924 10,097 141,718 9,074
Book size 3 5,167 1,127 3,131 668 5,963 193 2,906 750
Book quality 4 (1,298) (346) (1,117) (361) (2,070) (301) (1,016) (325)
Model updates 5 69 - (558) - (631) - (1,840) (37)
Methodology and policy 6 513 380 70 - 308 - 191 -
Acquisitions and disposals 300 - - - 26,517 90 - -
Foreign exchange movements (2,967) (137) 2,160 130 (5,032) (292) 1,977 192
Other (2,190) (18) (686) 252 (825) (351) (12) 443
Balance at end of period 7 170,748 11,131 171,154 10,125 168,154 9,436 143,924 10,097
Q1/18 vs. Q4/17 Q4/17 vs. Q3/17 Q3/17 vs. Q2/17 Q2/17 vs. Q1/17 Market risk
Balance at beginning of period 5,392 5,978 6,323 5,551
Movement in risk levels 8 80 (505) (473) 849
Model updates 5 (8) 32 (261) (1)
Methodology and policy 6 - - - -
Acquisitions and disposals - - 59 -
Foreign exchange movements 145 (113) 330 (76)
Other - - - -
Balance at end of period 5,609 5,392 5,978 6,323
Q1/18 vs. Q4/17 Q4/17 vs. Q3/17 Q3/17 vs. Q2/17 Q2/17 vs. Q1/17
Operational risk
Balance at beginning of period 24,664 24,327 22,452 22,081
Movement in risk levels 9 536 215 306 371
Methodology and policy 6 - - - -
Acquisitions and disposals 41 122 1,569 -
Balance at end of period 25,241 24,664 24,327 22,452
1 Excludes capital floor adjustment. 2 Comprises derivatives and repo-style transactions. 3 Relates to net increase/decrease in the underlying exposures. 4 Relates to changes in credit risk mitigation and credit quality of the borrower/counterparty. 5 Relates to internal model or parameter changes. 6 Relates to regulatory changes implemented on an industry wide basis (i.e. Basel III) and any capital methodology changes implemented within CIBC for our portfolios. 7 Includes $3,798 million (Q4/17: $3,498 million) of CET1 CVA RWAs relating to bilateral OTC derivatives. 8 Relates to changes in open positions and market data. 9 Relates to changes in loss experience, business environment, internal control factors and revenue.

January 31, 2018 Supplementary Regulatory Capital Disclosure Page 9
CREDIT EXPOSURE (EXPOSURE AT DEFAULT 1) ($ millions) Q1/18 Q4/17 Q3/17 Q2/17 Q1/17 Q4/16 Q3/16 Q2/16 AIRB Standardized AIRB Standardized AIRB Standardized AIRB Standardized AIRB Standardized AIRB Standardized AIRB Standardized AIRB Standardized approach approach approach approach approach approach approach approach approach approach approach approach approach approach approach approach Business and government portfolios Corporate Drawn 78,623 23,150 78,312 23,390 76,424 22,316 74,544 3,362 71,977 3,204 72,807 3,370 72,146 3,126 69,382 3,086 Undrawn commitments 40,340 3,996 39,078 4,085 38,629 3,693 39,935 147 37,667 135 36,845 145 37,054 86 36,304 86 Repo-style transactions 91,235 28 76,899 39 75,016 28 72,087 38 65,326 15 53,644 33 51,372 10 49,798 14 Other off-balance sheet 14,072 703 13,484 697 13,848 675 15,688 216 15,706 235 18,350 229 15,175 440 13,336 443 OTC derivatives 9,043 46 8,990 64 8,111 75 9,885 - 8,245 - 9,001 - 8,180 - 7,870 - 233,313 27,923 216,763 28,275 212,028 26,787 212,139 3,763 198,921 3,589 190,647 3,777 183,927 3,662 176,690 3,629 Sovereign Drawn 47,049 11,108 41,439 11,827 46,090 11,061 42,224 5,026 41,810 4,759 44,055 4,773 38,454 4,740 36,908 4,498 Undrawn commitments 6,168 - 5,642 - 5,733 - 5,547 - 4,722 - 4,670 - 4,830 - 4,817 - Repo-style transactions 15,102 - 14,374 - 12,269 - 13,268 - 10,439 - 10,020 - 6,522 - 7,588 - Other off-balance sheet 536 - 533 - 554 - 682 - 693 - 753 - 803 - 759 - OTC derivatives 2,497 - 2,660 - 2,487 - 3,677 - 2,951 - 3,581 - 3,893 - 3,855 - 71,352 11,108 64,648 11,827 67,133 11,061 65,398 5,026 60,615 4,759 63,079 4,773 54,502 4,740 53,927 4,498 Banks Drawn 11,446 1,821 10,422 2,021 10,276 1,854 10,326 1,776 10,150 1,689 10,715 1,940 13,894 1,847 11,488 1,717 Undrawn commitments 996 6 840 8 984 9 1,040 - 1,089 - 1,011 - 1,036 - 889 - Repo-style transactions 26,739 - 21,469 - 22,459 - 22,296 - 24,008 - 22,720 - 22,386 - 22,741 - Other off-balance sheet 63,491 - 64,176 - 62,155 - 64,972 - 61,464 - 62,107 - 59,315 - 59,184 - OTC derivatives 8,165 222 7,527 232 6,350 233 7,603 219 6,053 160 6,005 167 5,900 211 5,304 56 110,837 2,049 104,434 2,261 102,224 2,096 106,237 1,995 102,764 1,849 102,558 2,107 102,531 2,058 99,606 1,773 Gross business and government portfolios 415,502 41,080 385,845 42,363 381,385 39,944 383,774 10,784 362,300 10,197 356,284 10,657 340,960 10,460 330,223 9,900 Less: repo-style transaction collateral 118,964 - 101,315 - 98,861 - 95,043 - 88,596 - 76,263 - 71,017 - 71,646 - Net business and government portfolios 296,538 41,080 284,530 42,363 282,524 39,944 288,731 10,784 273,704 10,197 280,021 10,657 269,943 10,460 258,577 9,900 Retail portfolios Real estate secured personal lending Drawn 224,655 3,200 223,291 3,423 219,304 3,284 211,790 2,696 206,740 2,556 201,580 2,645 195,464 2,579 189,218 2,474 Undrawn commitments 18,900 3 18,922 3 19,967 4 19,543 - 17,926 - 18,375 - 24,050 - 22,743 - 243,555 3,203 242,213 3,426 239,271 3,288 231,333 2,696 224,666 2,556 219,955 2,645 219,514 2,579 211,961 2,474 Qualifying revolving retail Drawn 21,941 - 21,982 - 21,922 - 21,578 - 21,504 - 21,597 - 21,139 - 20,661 - Undrawn commitments 49,860 - 49,140 - 46,383 - 46,623 - 48,231 - 47,140 - 46,887 - 46,545 - Other off-balance sheet 240 - 293 - 311 - 302 - 258 - 319 - 308 - 281 - 72,041 - 71,415 - 68,616 - 68,503 - 69,993 - 69,056 - 68,334 - 67,487 - Other retail Drawn 11,047 1,081 10,755 1,158 10,466 1,080 10,117 851 9,762 797 9,671 794 9,616 766 9,490 726 Undrawn commitments 2,430 27 2,396 28 2,142 30 2,088 27 2,073 25 2,026 26 1,999 26 1,975 25 Other off-balance sheet 36 - 37 - 33 - 34 - 36 - 32 - 32 - 32 - 13,513 1,108 13,188 1,186 12,641 1,110 12,239 878 11,871 822 11,729 820 11,647 792 11,497 751 Total retail portfolios 329,109 4,311 326,816 4,612 320,528 4,398 312,075 3,574 306,530 3,378 300,740 3,465 299,495 3,371 290,945 3,225 Securitization exposures 13,884 - 14,174 - 13,350 - 12,546 - 13,001 - 18,863 - 18,748 - 17,577 - Gross credit exposure 758,495 45,391 726,835 46,975 715,263 44,342 708,395 14,358 681,831 13,575 675,887 14,122 659,203 13,831 638,745 13,125 Less: repo-style transaction collateral 118,964 - 101,315 - 98,861 - 95,043 - 88,596 - 76,263 - 71,017 - 71,646 - Net credit exposure 639,531 45,391 625,520 46,975 616,402 44,342 613,352 14,358 593,235 13,575 599,624 14,122 588,186 13,831 567,099 13,125 1 Gross credit exposure after credit valuation adjustments for financial guarantors, and before allowance for credit losses.

January 31, 2018 Supplementary Regulatory Capital Disclosure Page 10
CREDIT EXPOSURE - GEOGRAPHIC CONCENTRATION 1
($ millions) Q1/18 Q4/17 Q3/17 Q2/17 Q1/17 Q4/16 Q3/16 Q2/16 Q1/16 Business and government Canada Drawn 85,135 80,338 79,063 75,259 72,212 75,116 74,422 70,482 70,148 Undrawn commitments 36,469 34,823 34,791 36,021 33,465 32,082 32,578 31,863 32,279 Repo-style transactions 8,278 6,962 6,730 8,244 7,748 7,497 4,336 4,430 5,369 Other off-balance sheet 54,903 52,371 51,675 55,082 54,291 54,925 49,518 46,711 44,658 OTC derivatives 8,118 9,133 7,625 11,394 7,973 8,887 8,722 8,424 10,610 192,903 183,627 179,884 186,000 175,689 178,507 169,576 161,910 163,064 United States Drawn 38,552 36,261 41,524 40,900 39,201 38,792 37,999 35,069 38,836 Undrawn commitments 7,562 7,417 7,596 7,403 7,360 7,923 7,937 7,556 8,355 Repo-style transactions 3,138 2,790 2,430 2,299 2,253 1,675 4,181 3,342 4,007 Other off-balance sheet 16,962 19,358 19,971 18,819 19,294 21,077 20,510 19,007 20,097 OTC derivatives 5,926 4,754 4,078 4,364 4,055 3,885 3,077 2,649 2,352 72,140 70,580 75,599 73,785 72,163 73,352 73,704 67,623 73,647 Europe Drawn 4,570 4,683 3,805 3,623 4,189 5,244 4,602 4,497 5,119 Undrawn commitments 2,198 2,133 1,946 2,085 1,791 1,725 1,661 1,674 2,539 Repo-style transactions 1,889 1,035 1,166 1,232 781 460 572 485 451 Other off-balance sheet 5,483 5,900 4,376 6,892 3,715 4,717 4,761 7,052 4,855 OTC derivatives 3,449 3,306 3,282 3,502 3,427 3,687 3,726 3,694 4,007 17,589 17,057 14,575 17,334 13,903 15,833 15,322 17,402 16,971 Other countries Drawn 8,861 8,891 8,398 7,312 8,335 8,425 7,471 7,730 6,297 Undrawn commitments 1,275 1,187 1,013 1,013 862 796 744 917 847 Repo-style transactions 807 640 557 833 395 489 174 224 156 Other off-balance sheet 751 564 535 549 563 491 504 509 550 OTC derivatives 2,212 1,984 1,963 1,905 1,794 2,128 2,448 2,262 1,606 13,906 13,266 12,466 11,612 11,949 12,329 11,341 11,642 9,456 296,538 284,530 282,524 288,731 273,704 280,021 269,943 258,577 263,138 1 This table provides information of our business and government exposures under the AIRB approach. Substantially all our retail exposures under the AIRB approach are based in Canada. Gross credit exposure after credit valuation
adjustments for financial guarantors, and before allowance for credit losses.

January 31, 2018 Supplementary Regulatory Capital Disclosure Page 11
CREDIT EXPOSURE - MATURITY PROFILE 1
($ millions) Q1/18 Q4/17 Q3/17 Q2/17 Q1/17 Q4/16 Q3/16 Q2/16 Q1/16
Business and government portfolios
Corporate
Less than 1 year 2 61,810 57,008 56,711 60,057 56,518 57,633 55,488 50,532 47,050 1 - 3 years 52,309 50,953 50,325 50,961 47,897 46,676 44,333 42,794 43,718 3 - 5 years 34,340 36,704 34,676 34,822 34,003 36,411 36,344 36,729 37,930 Over 5 years 1,714 1,952 1,818 2,169 1,957 2,108 1,638 1,272 1,447 150,173 146,617 143,530 148,009 140,375 142,828 137,803 131,327 130,145 Sovereign
Less than 1 year 2 15,110 12,181 18,998 14,516 15,532 15,277 14,571 13,966 15,493 1 - 3 years 20,506 20,091 18,926 19,695 17,024 16,886 15,951 15,129 16,780 3 - 5 years 21,070 17,774 16,496 16,883 16,819 20,131 16,302 16,196 15,175 Over 5 years 1,087 1,322 1,213 1,871 1,344 1,504 1,581 1,545 1,939 57,773 51,368 55,633 52,965 50,719 53,798 48,405 46,836 49,387 Banks
Less than 1 year 2 74,797 72,800 70,511 72,948 68,075 69,199 67,043 67,425 69,690 1 - 3 years 10,992 11,227 10,773 12,768 10,212 9,042 8,787 10,504 11,174 3 - 5 years 2,229 1,844 1,611 1,573 4,008 4,627 7,396 1,573 1,710 Over 5 years 574 674 466 468 315 527 509 912 1,032 88,592 86,545 83,361 87,757 82,610 83,395 83,735 80,414 83,606 Total business and government portfolios 296,538 284,530 282,524 288,731 273,704 280,021 269,943 258,577 263,138
Retail portfolios
Real estate and secured personal lending
Less than 1 year 2 80,217 77,712 75,496 70,478 68,450 69,027 75,233 75,821 76,395 1 - 3 years 101,537 100,461 98,288 93,231 84,631 78,550 71,028 62,362 57,985 3 - 5 years 60,735 63,138 64,414 66,324 70,175 70,880 71,746 72,266 71,271 Over 5 years 1,066 902 1,073 1,300 1,410 1,498 1,507 1,512 1,478 243,555 242,213 239,271 231,333 224,666 219,955 219,514 211,961 207,129 Qualifying revolving retail
Less than 1 year 2 72,041 71,415 68,616 68,503 69,993 69,056 68,334 67,487 66,817 72,041 71,415 68,616 68,503 69,993 69,056 68,334 67,487 66,817 Other retail
Less than 1 year 2 12,116 12,036 11,754 11,501 11,274 11,242 11,204 11,092 10,785 1 - 3 years 209 169 174 186 185 180 210 210 211 3 - 5 years 354 295 214 176 148 130 116 109 104 Over 5 years 834 688 499 376 264 177 117 86 69 13,513 13,188 12,641 12,239 11,871 11,729 11,647 11,497 11,169 Total retail portfolios 329,109 326,816 320,528 312,075 306,530 300,740 299,495 290,945 285,115
Total credit exposure 625,647 611,346 603,052 600,806 580,234 580,761 569,438 549,522 548,253
1
Excludes securitization exposures. 2 Demand loans are included in the "Less than 1 year" category.

January 31, 2018 Supplementary Regulatory Capital Disclosure Page 12
CREDIT RISK ASSOCIATED WITH DERIVATIVES
($ millions) Q1/18 Q1/18 Q4/17 Q3/17 Q2/17 Q1/17 Q4/16 Q3/16 Q2/16 Q1/16
Credit Current replacement cost equivalent Risk-weighted amount Trading ALM Total amount 1
Interest rate derivatives
Over-the-counter
Forward rate agreements 77 - 77 33 1 3 1 2 6 2 22 14 - Swap contracts 6,220 2,200 8,420 5,277 563 653 693 759 741 915 1,100 926 1,013 Purchased options 146 13 159 41 16 22 17 20 14 13 21 20 15 6,443 2,213 8,656 5,351 580 678 711 781 761 930 1,143 960 1,028 Exchange-traded - - - 48 1 2 2 2 1 2 1 1 2
Total interest rate derivatives 6,443 2,213 8,656 5,399 581 680 713 783 762 932 1,144 961 1,030
Foreign exchange derivatives
Over-the-counter
Forward contracts 5,024 21 5,045 3,618 1,061 938 970 869 839 900 732 874 911 Swap contracts 6,537 2,174 8,711 4,218 834 847 784 775 653 673 653 603 653 Purchased options 286 1 287 347 84 81 107 126 104 123 144 217 222 11,847 2,196 14,043 8,183 1,979 1,866 1,861 1,770 1,596 1,696 1,529 1,694 1,786
Credit derivatives
Over-the-counter
Credit default swap contracts - protection purchased 122 - 122 47 8 10 7 4 4 7 8 9 12 Credit default swap contracts - protection sold 15 - 15 8 - - - - - - - - - 137 - 137 55 8 10 7 4 4 7 8 9 12
Equity derivatives
Over-the-counter 1,815 115 1,930 2,155 498 520 479 540 445 379 300 306 254 Exchange-traded 2,143 - 2,143 3,682 101 84 75 70 44 49 45 45 32 3,958 115 4,073 5,837 599 604 554 610 489 428 345 351 286
Precious metal derivatives
Over-the-counter 95 - 95 54 22 19 15 20 28 17 15 10 6 Exchange-traded 208 - 208 26 1 1 1 1 1 - - 5 3 303 - 303 80 23 20 16 21 29 17 15 15 9
Other commodity derivatives
Over-the-counter 2,020 - 2,020 3,010 1,155 902 730 1,054 991 1,025 888 743 524 Exchange-traded 72 - 72 1,260 50 40 33 38 37 39 43 64 68 2,092 - 2,092 4,270 1,205 942 763 1,092 1,028 1,064 931 807 592
Non-trade exposure related to central counterparties 167 176 145 153 155 286 225 443 437
CET1 CVA charge 3,798 3,498 3,264 3,655 3,247 2,977 3,021 2,998 2,880
Total derivatives before netting 24,780 4,524 29,304 23,824 8,360 7,796 7,323 8,088 7,310 7,407 7,218 7,278 7,032 Less: effect of netting 2 (16,668)
Total derivatives 12,636 23,824 8,360 7,796 7,323 8,088 7,310 7,407 7,218 7,278 7,032
1 Sum of current replacement cost and potential future exposure, adjusted for the master netting agreements and the impact of collateral amounting to $4,536 million (Q4/17: $4,341 million). The collateral comprises cash of $3,851 million (Q4/17: $3,516 million) and government securities of $685 million (Q4/17: $825 million).
2 Comprises amounts subject to set off under enforceable netting agreements, such as ISDA agreements, derivative exchange or clearing counterparty agreements, global master repurchase agreements, and global master securities lending agreements. Under such arrangements, all outstanding transactions governed by the relevant agreement can be offset if an event of default or other predetermined event occurs.

January 31, 2018 Supplementary Regulatory Capital Disclosure Page 13
CREDIT QUALITY OF AIRB EXPOSURE - BUSINESS AND GOVERNMENT PORTFOLIOS (RISK RATING METHOD) 1
($ millions) Q1/18 Q4/17 Exposure Exposure Exposure Exposure Exposure Exposure Exposure Exposure Notional of weighted- weighted- weighted- weighted- Notional of weighted- weighted- weighted- weighted- Moody's undrawn average average average average risk undrawn average average average average risk Standard Investors EAD commitments EAD % PD % LGD % weight % RWA EAD commitments EAD % PD % LGD % weight % RWA CIBC rating & Poor's Service Corporate PD bands equivalent equivalent Investment grade 10 0.03%-0.03% AAA Aaa 1,956 6 81 0.02 18 4 74 1,742 16 75 0.02 15 3 49 21 0.03%-0.03% AA+ Aa1 1,009 246 63 0.04 18 3 30 898 266 63 0.04 24 3 24 24 0.04%-0.05% AA Aa2 4,895 857 65 0.04 10 2 118 4,411 763 65 0.04 11 3 124 27 0.05%-0.06% AA- Aa3 5,564 543 65 0.05 12 3 194 5,758 573 65 0.05 13 4 208 31 0.07%-0.09% A+ A1 4,872 1,515 64 0.08 35 18 895 4,894 1,541 64 0.08 35 19 936 34 0.09%-0.12% A A2 6,760 3,412 65 0.10 33 22 1,480 7,191 3,251 65 0.10 33 23 1,637 37 0.13%-0.16% A- A3 11,747 6,573 65 0.13 36 29 3,407 10,854 6,661 65 0.13 39 31 3,413 41 0.15%-0.22% BBB+ Baa1 20,080 10,964 66 0.17 42 37 7,333 20,655 10,703 66 0.17 42 38 7,833 44 0.19%-0.30% BBB Baa2 16,008 8,861 66 0.24 40 41 6,520 14,935 7,852 66 0.24 41 43 6,471 47 0.31%-0.38% BBB- Baa3 19,147 10,356 67 0.33 36 46 8,747 18,199 9,464 67 0.33 37 48 8,658 92,038 43,333 66 0.18 34 31 28,798 89,537 41,090 66 0.18 35 33 29,353 Non-investment grade 51 0.39%-0.61% BB+ Ba1 15,647 6,964 49 0.51 35 51 8,030 15,382 6,910 50 0.51 35 54 8,250 54 0.62%-1.09% BB Ba2 14,313 6,412 50 0.70 33 52 7,424 14,832 6,792 50 0.70 32 54 7,976 57 1.10%-1.92% BB- Ba3 11,343 4,405 51 1.28 33 65 7,361 10,805 4,126 51 1.28 33 67 7,246 61 1.93%-3.69% B+ B1 8,967 3,534 51 2.13 30 68 6,138 8,296 3,573 51 2.12 30 69 5,729 64 3.70%-7.27% B B2 4,778 1,575 56 4.19 34 92 4,251 4,262 1,422 56 4.02 32 86 3,649 67 7.28%-12.11% B- B3 851 184 52 8.29 29 100 848 921 200 51 8.46 31 106 979 55,899 23,074 51 1.41 33 61 34,052 54,498 23,023 51 1.37 33 62 33,829 Watch list 70 12.12%-20.67% CCC+ Caa1 481 87 53 18.27 41 203 974 666 249 48 18.11 41 197 1,313 75 12.12%-20.67% CCC to CCC- Caa2 to Caa3 78 26 52 16.72 71 331 258 62 4 56 16.72 75 344 212 80 20.68%-99.99% CC to C Ca 460 107 43 35.00 26 134 617 443 132 44 34.76 26 137 604 1,019 220 48 25.70 37 182 1,849 1,171 385 47 24.33 37 182 2,129 Default 90 100.00% D C 325 15 36 100.00 41 152 493 344 18 40 100.00 38 210 723 325 15 36 100.00 41 152 493 344 18 40 100.00 38 210 723 149,281 66,642 61 1.03 34 44 65,192 145,550 64,516 61 1.06 34 45 66,034 Sovereign Investment grade 00 0.01%-0.015% AAA Aaa 29,142 189 64 0.01 5 1 230 26,433 189 64 0.01 5 1 202 10 0.016%-0.025% AAA Aaa 18,250 3,097 63 0.02 13 3 526 15,904 2,927 63 0.02 13 3 456 21 0.016%-0.025% AA+ Aa1 1,887 1,265 63 0.02 14 2 36 1,388 783 63 0.02 18 2 34 24 0.016%-0.025% AA Aa2 2,837 756 65 0.02 38 9 260 2,339 533 65 0.02 41 7 171 27 0.026%-0.035% AA- Aa3 1,716 1,596 66 0.03 14 3 52 1,571 1,503 66 0.03 15 4 63 31 0.036%-0.05% A+ A1 882 785 66 0.04 25 7 64 950 915 66 0.04 20 6 59 34 0.06%-0.065% A A2 1,120 877 66 0.05 23 11 126 938 909 66 0.05 18 7 68 37 0.066%-0.08% A- A3 562 418 66 0.08 20 9 49 432 431 66 0.08 16 11 47 41 0.09%-0.16% BBB+ Baa1 535 304 66 0.14 18 12 63 576 299 66 0.14 18 12 70 44 0.16%-0.26% BBB Baa2 150 63 68 0.24 44 41 61 148 65 68 0.24 43 42 62 47 0.27%-0.42% BBB- Baa3 118 41 68 0.34 50 52 61 119 42 68 0.34 48 53 63 57,199 9,391 65 0.02 11 3 1,528 50,798 8,596 65 0.02 11 3 1,295 Non-investment grade 51 0.43%-0.61% BB+ Ba1 496 216 35 0.53 9 10 51 514 194 33 0.53 9 11 55 54 0.62%-1.09% BB Ba2 19 11 55 0.73 32 48 9 14 13 54 0.73 38 60 8 57 1.10%-1.92% BB- Ba3 23 3 68 1.40 35 69 16 11 3 58 1.40 55 115 12 61 1.93%-3.99% B+ B1 7 2 68 2.45 23 54 4 10 2 69 2.45 16 37 4 64 4.00%-7.27% B B2 30 3 69 6.00 26 82 24 18 1 66 6.00 27 86 16 67 7.28%-12.11% B- B3 - - - - - - - 1 - - 9.57 90 437 5 575 235 37 0.88 12 18 104 568 213 35 0.78 12 18 100 Watch list 70 12.12%-20.67% CCC+ Caa1 - - - - - - - 2 3 69 16.72 25 118 2 75 12.12%-20.67% CCC to CCC- Caa2 to Caa3 - - - - - - - - - - - - - - 80 20.68%-99.99% CC to C Ca - - - - - - - - - - - - - - - - - - - - - 2 3 69 16.72 25 118 2 Default 90 100.00% D C - - - - - - - - - - - - - - - - - - - - - - - - - - - - 57,774 9,626 64 0.03 11 3 1,632 51,368 8,812 64 0.03 11 3 1,397 For footnotes, see page 16.

January 31, 2018 Supplementary Regulatory Capital Disclosure Page 14
CREDIT QUALITY OF AIRB EXPOSURE - BUSINESS AND GOVERNMENT PORTFOLIOS (RISK RATING METHOD) (continued) 1
($ millions) Q1/18 Q4/17 Exposure Exposure Exposure Exposure Exposure Exposure Exposure Exposure Notional of weighted- weighted- weighted- weighted- Notional of weighted- weighted- weighted- weighted- Moody's undrawn average average average average risk undrawn average average average average risk Standard Investors EAD commitments EAD % PD % LGD % weight % RWA EAD commitments EAD % PD % LGD % weight % RWA CIBC rating & Poor's Service Banks PD bands equivalent equivalent Investment grade 10 0.03%-0.03% AAA Aaa 2,725 - - 0.02 24 8 206 2,724 - - 0.02 22 5 122 21 0.03%-0.03% AA+ Aa1 55 87 - 0.03 20 6 3 44 86 - 0.03 28 8 4 24 0.04%-0.05% AA Aa2 31,969 - - 0.04 6 1 301 36,085 - - 0.04 7 1 401 27 0.05%-0.06% AA- Aa3 7,036 - - 0.05 15 7 459 2,709 - - 0.05 26 11 275 31 0.07%-0.09% A+ A1 19,016 50 65 0.08 22 8 1,472 16,683 50 65 0.08 22 8 1,358 34 0.09%-0.12% A A2 12,883 102 64 0.10 7 4 464 14,419 62 69 0.10 6 3 461 37 0.13%-0.16% A- A3 6,659 285 65 0.13 15 8 524 7,079 330 63 0.13 16 9 603 41 0.17%-0.22% BBB+ Baa1 5,144 376 64 0.17 14 10 537 4,542 341 65 0.17 16 12 544 44 0.23%-0.30% BBB Baa2 502 220 64 0.24 7 7 38 516 145 68 0.24 10 10 50 47 0.31%-0.42% BBB- Baa3 1,048 402 63 0.34 14 15 161 586 300 63 0.34 16 17 98 87,037 1,522 60 0.08 12 5 4,165 85,387 1,314 60 0.08 12 5 3,916 Non-investment grade 51 0.43%-0.61% BB+ Ba1 396 106 49 0.53 (3) (4) (16) 35 53 42 0.53 44 53 6 54 0.62%-1.09% BB Ba2 243 1 67 0.73 18 27 66 396 46 50 0.73 12 18 70 57 1.10%-1.92% BB- Ba3 144 - - 1.40 42 95 136 75 - - 1.40 33 76 57 61 1.93%-3.99% B+ B1 256 - - 2.45 9 23 60 210 1 69 2.45 10 25 52 64 4.00%-7.27% B B2 512 48 50 6.00 13 47 243 443 - - 6.00 12 44 196 67 7.28%-12.11% B- B3 1 - - 9.57 40 144 2 1 - - 9.57 40 144 1 1,552 155 49 2.77 12 32 491 1,160 100 46 3.10 11 31 382 Watch list 70 12.12%-20.67% CCC+ Caa1 1 - - 16.72 40 181 3 - - - - - - - 75 12.12%-20.67% CCC to CCC- Caa2 to Caa3 - - - - - - - - - - - - - - 80 20.68%-99.99% CC to C Ca - - - - - - - - - - - - - - 1 - - 13.51 32 147 3 - - - - - - - Default 90 100.00% D C - - - - - - - - - - - - - - - - - - - - - - - - - - - - 88,590 1,677 59 0.12 12 5 4,659 86,547 1,414 59 0.12 12 5 4,298 295,645 77,945 61 0.56 23 24 71,483 283,465 74,742 61 0.58 23 25 71,729 Commercial mortgages (Slotting approach) Strong 743 9 78 70 520 899 43 56 70 629 Good 122 - - 90 110 131 - - 90 118 Satisfactory 23 - - 117 27 30 15 60 117 35 Weak - - - - - - - - - - Default 5 - - - - 5 - - - - 893 9 78 74 657 1,065 58 57 73 782 Total business and government 296,538 77,954 61 24 72,140 284,530 74,800 61 26 72,511 For footnotes, see page 16.

January 31, 2018 Supplementary Regulatory Capital Disclosure Page 15
CREDIT QUALITY OF AIRB EXPOSURE - BUSINESS AND GOVERNMENT PORTFOLIOS (RISK RATING METHOD) 1
($ millions) Q3/17 Q2/17 Exposure Exposure Exposure Exposure Exposure Exposure Exposure Exposure Notional of weighted- weighted- weighted- weighted- Notional of weighted- weighted- weighted- weighted- Moody's undrawn average average average average risk undrawn average average average average risk Standard Investors EAD commitments EAD % PD % LGD % weight % RWA EAD commitments EAD % PD % LGD % weight % RWA CIBC rating & Poor's Service Corporate PD bands equivalent equivalent Investment grade 10 0.03%-0.03% AAA Aaa 2,015 16 69 0.02 15 3 57 1,934 16 72 0.02 18 3 61 21 0.03%-0.03% AA+ Aa1 875 257 63 0.03 24 3 23 478 276 64 0.03 19 4 19 24 0.04%-0.05% AA Aa2 4,605 604 67 0.04 12 3 126 6,050 872 65 0.04 10 2 134 27 0.05%-0.06% AA- Aa3 5,452 642 64 0.05 12 4 189 8,967 726 65 0.05 12 3 306 31 0.07%-0.09% A+ A1 5,280 1,474 64 0.08 34 18 954 5,239 1,621 65 0.08 31 17 871 34 0.09%-0.12% A A2 7,045 3,047 65 0.10 35 23 1,629 7,040 3,215 65 0.10 34 23 1,645 37 0.13%-0.16% A- A3 10,223 6,233 65 0.13 40 32 3,319 10,142 5,857 66 0.13 41 34 3,421 41 0.17%-0.22% BBB+ Baa1 20,821 11,693 66 0.17 43 38 7,890 19,197 10,065 66 0.17 42 38 7,294 44 0.23%-0.30% BBB Baa2 14,416 7,842 66 0.24 42 44 6,336 15,518 8,019 66 0.24 43 45 6,919 47 0.31%-0.42% BBB- Baa3 17,518 8,644 68 0.33 37 48 8,456 16,528 7,983 68 0.33 37 48 7,960 88,250 40,452 66 0.18 36 33 28,979 91,093 38,650 66 0.17 34 31 28,630 Non-investment grade 51 0.43%-0.61% BB+ Ba1 14,401 7,588 45 0.51 35 55 7,850 15,735 9,129 53 0.47 34 48 7,603 54 0.62%-1.09% BB Ba2 14,804 6,854 50 0.70 33 54 8,054 13,892 6,662 55 0.70 33 56 7,756 57 1.10%-1.92% BB- Ba3 10,780 4,542 51 1.28 33 68 7,341 10,802 4,654 56 1.28 34 68 7,390 61 1.93%-3.99% B+ B1 7,403 3,078 52 2.07 30 68 4,998 7,792 3,245 56 2.06 31 69 5,408 64 4.00%-7.27% B B2 4,166 1,294 56 3.99 32 85 3,523 4,407 1,553 57 4.09 32 85 3,732 67 7.28%-12.11% B- B3 1,038 224 50 8.62 33 122 1,265 1,214 279 54 8.72 33 118 1,432 52,592 23,580 49 1.38 33 63 33,031 53,842 25,522 55 1.40 33 62 33,321 Watch list 70 12.12%-20.67% CCC+ Caa1 778 280 48 17.91 38 188 1,465 680 340 53 18.05 43 208 1,413 75 12.12%-20.67% CCC to CCC- Caa2 to Caa3 56 1 55 16.72 82 378 211 76 9 50 16.72 59 277 210 80 20.68%-99.99% CC to C Ca 329 112 44 35.44 29 148 487 664 297 52 34.63 33 173 1,149 1,163 393 47 22.81 38 186 2,163 1,420 646 52 25.73 39 195 2,772 Default 90 100.00% D C 411 36 48 100.00 36 228 959 456 55 50 100.00 30 209 953 411 36 48 100.00 36 228 959 456 55 50 100.00 30 209 953 142,416 64,461 60 1.10 35 46 65,132 146,811 64,873 62 1.18 34 45 65,676 Sovereign Investment grade 00 0.01%-0.015% AAA Aaa 32,367 189 64 0.01 5 1 204 32,041 189 65 0.01 3 - 143 10 0.016%-0.025% AAA Aaa 14,342 2,949 63 0.02 13 3 416 10,713 2,298 64 0.02 13 3 283 21 0.016%-0.025% AA+ Aa1 1,343 772 63 0.02 18 3 34 3,081 1,503 63 0.02 11 2 64 24 0.016%-0.025% AA Aa2 2,238 586 65 0.02 38 6 143 1,957 375 67 0.02 38 7 137 27 0.026%-0.035% AA- Aa3 1,493 1,580 66 0.03 17 5 70 1,434 1,425 66 0.03 17 5 73 31 0.036%-0.05% A+ A1 1,059 983 66 0.04 21 7 72 966 806 68 0.04 22 6 61 34 0.06%-0.065% A A2 938 835 66 0.05 19 7 69 868 811 67 0.05 17 7 65 37 0.066%-0.08% A- A3 489 502 66 0.08 17 10 50 688 671 66 0.08 14 9 59 41 0.09%-0.16% BBB+ Baa1 523 249 66 0.14 19 12 62 348 115 70 0.14 21 13 46 44 0.16%-0.26% BBB Baa2 142 58 69 0.24 45 40 57 159 55 69 0.24 44 40 63 47 0.27%-0.42% BBB- Baa3 60 40 69 0.34 53 54 32 59 43 68 0.34 44 45 26 54,994 8,743 65 0.02 10 2 1,209 52,314 8,291 65 0.02 8 2 1,020 Non-investment grade 51 0.43%-0.61% BB+ Ba1 559 179 36 0.53 10 12 65 581 237 50 0.53 12 15 87 54 0.62%-1.09% BB Ba2 38 13 52 0.73 43 74 28 37 19 57 0.73 45 80 30 57 1.10%-1.92% BB- Ba3 8 3 58 1.40 44 97 8 10 2 64 1.40 33 66 6 61 1.93%-3.99% B+ B1 12 2 68 2.45 14 31 4 12 2 68 2.45 18 44 5 64 4.00%-7.27% B B2 18 1 69 6.00 30 100 19 8 1 67 6.00 30 94 8 67 7.28%-12.11% B- B3 2 - - 9.57 74 353 6 1 - - 9.57 77 372 5 637 198 38 0.77 13 20 130 649 261 51 0.68 14 22 141 Watch list 70 12.12%-20.67% CCC+ Caa1 - - - - - - - - - - - - - - 75 12.12%-20.67% CCC to CCC- Caa2 to Caa3 2 3 69 16.72 25 118 2 2 3 67 16.72 25 118 2 80 20.68%-99.99% CC to C Ca - - - - - - - - - - - - - - 2 3 69 16.72 25 118 2 2 3 67 16.72 25 118 2 Default 90 100.00% D C - - - - - - - - - - - - - - - - - - - - - - - - - - - - 55,633 8,944 64 0.03 10 2 1,341 52,965 8,555 65 0.03 8 2 1,163 For footnotes, see page 16.

January 31, 2018 Supplementary Regulatory Capital Disclosure Page 16
CREDIT QUALITY OF AIRB EXPOSURE - BUSINESS AND GOVERNMENT PORTFOLIOS (RISK RATING METHOD) (continued) 1
($ millions) Q3/17 Q2/17 Exposure Exposure Exposure Exposure Exposure Exposure Exposure Exposure Notional of weighted- weighted- weighted- weighted- Notional of weighted- weighted- weighted- weighted- Moody's undrawn average average average average risk undrawn average average average average risk Standard Investors EAD commitments EAD % PD % LGD % weight % RWA EAD commitments EAD % PD % LGD % weight % RWA CIBC rating & Poor's Service Banks PD bands equivalent equivalent Investment grade 10 0.03%-0.03% AAA Aaa 2,242 - - 0.02 21 5 115 1,784 - - 0.02 22 6 98 21 0.03%-0.03% AA+ Aa1 44 82 - 0.03 26 7 3 104 88 - 0.02 9 3 3 24 0.04%-0.05% AA Aa2 34,617 - - 0.04 7 1 398 35,614 - - 0.04 7 1 463 27 0.05%-0.06% AA- Aa3 5,568 - - 0.05 15 6 330 6,128 - - 0.05 17 6 377 31 0.07%-0.09% A+ A1 12,682 49 65 0.08 25 9 1,144 14,440 50 65 0.08 24 9 1,273 34 0.09%-0.12% A A2 13,967 67 64 0.10 6 3 462 13,966 74 65 0.10 7 4 495 37 0.13%-0.16% A- A3 6,692 431 63 0.13 15 8 557 7,934 477 64 0.13 15 8 672 41 0.17%-0.22% BBB+ Baa1 5,149 115 68 0.17 15 11 569 4,226 90 66 0.17 15 11 480 44 0.23%-0.30% BBB Baa2 932 516 64 0.24 11 10 93 1,617 815 64 0.24 10 10 165 47 0.31%-0.42% BBB- Baa3 387 302 63 0.34 13 14 55 548 104 64 0.34 19 20 112 82,280 1,562 61 0.08 12 5 3,726 86,361 1,698 61 0.08 12 5 4,138 Non-investment grade 51 0.43%-0.61% BB+ Ba1 119 76 46 0.53 9 22 26 85 3 64 0.53 31 45 38 54 0.62%-1.09% BB Ba2 316 - - 0.73 12 19 59 452 - - 0.73 12 19 84 57 1.10%-1.92% BB- Ba3 49 4 32 1.40 32 80 39 36 - - 1.40 20 46 16 61 1.93%-3.99% B+ B1 309 1 68 2.45 8 19 60 334 3 60 2.45 10 26 88 64 4.00%-7.27% B B2 303 - - 6.00 16 59 179 484 - - 6.00 16 60 289 67 7.28%-12.11% B- B3 - - - - - - - - - - - - - - 1,096 81 46 2.85 13 33 363 1,391 6 61 2.98 14 37 515 Watch list 70 12.12%-20.67% CCC+ Caa1 10 - - 16.72 16 82 8 - - - - - - - 75 12.12%-20.67% CCC to CCC- Caa2 to Caa3 - - - - - - - - - - - - - - 80 20.68%-99.99% CC to C Ca - - - - - - - - - - - - - - 10 - - 16.72 15 80 8 - - - - - - - Default 90 100.00% D C - - - - - - - 4 - - 100.00 40 501 18 - - - - - - - 4 - - 100.00 40 501 18 83,386 1,643 60 0.11 12 5 4,097 87,756 1,704 61 0.13 12 5 4,671 281,435 75,048 60 0.59 23 25 70,570 287,532 75,132 62 0.65 23 25 71,510 Commercial mortgages (Slotting approach) Strong 943 108 52 70 660 1,024 10 60 70 717 Good 98 4 50 90 88 106 - - 91 96 Satisfactory 43 15 60 114 49 52 17 71 115 60 Weak 1 - - 200 2 10 - - 260 26 Default 4 - - - - 7 - - - - 1,089 127 53 73 799 1,199 27 67 75 899 Total business and government 282,524 75,175 60 25 71,369 288,731 75,159 62 25 72,409 1 Gross credit exposure after credit valuation adjustments for financial guarantors and credit risk mitigation, and before allowance for credit losses.

January 31, 2018 Supplementary Regulatory Capital Disclosure Page 17
CREDIT QUALITY OF AIRB EXPOSURE - RETAIL PORTFOLIOS 1
($ millions) Q1/18
Exposure Exposure Exposure Exposure Expected losses
Notional of weighted- weighted- weighted- weighted- adjusted
undrawn average average average average Expected average
EAD commitments EAD % PD % LGD % risk weight % RWA losses risk weight % 2
Canadian residential mortgages and HELOCs PD bands
Insured Drawn and Undrawn 3
Exceptionally low 0.01% - 0.10% 85,018 - - 0.01 5 1 790 1 1 0.11% - 0.20% 389 - - 0.18 23 21 83 - 22 Very low 0.21% - 0.35% 694 - - 0.25 19 21 147 - 22 0.36% - 0.50% 1 - - 0.49 13 20 - - 21 Low 0.51% - 1.00% 88 - - 0.53 22 34 30 - 36 86,190 - - 0.01 5 1 1,050 1 - Uninsured Undrawn 4
Exceptionally low 0.01% - 0.10% 13,395 45,078 30 0.04 32 3 464 2 4 0.11% - 0.20% 4,481 4,994 90 0.14 24 7 329 2 8 Very low 0.21% - 0.35% 551 1,622 34 0.30 36 19 107 1 21 0.36% - 0.50% - - - - - - - - - Low 0.51% - 1.00% 279 931 30 0.53 31 25 71 - 27 1.01% - 2.00% 155 486 32 1.16 36 50 78 1 55 Medium 2.01% - 5.00% 29 72 41 4.36 40 121 36 1 143 5.01% - 10.00% - - - - - - 23 - - High 10.01% - 99.99% 11 28 38 26.77 37 215 - 1 338 Default 100.00% - - - - - - - - - 18,901 53,211 36 0.11 30 6 1,108 8 6 Uninsured Drawn 4
Exceptionally low 0.01% - 0.10% 73,458 n/a n/a 0.06 20 3 2,309 9 3 0.11% - 0.20% 15,589 n/a n/a 0.18 23 9 1,348 7 9 Very low 0.21% - 0.35% 23,245 n/a n/a 0.31 19 11 2,494 14 11 0.36% - 0.50% 303 n/a n/a 0.45 21 15 44 - 16 Low 0.51% - 1.00% 7,573 n/a n/a 0.77 25 26 1,966 15 28 1.01% - 2.00% 14,015 n/a n/a 1.26 18 26 3,613 31 29 Medium 2.01% - 5.00% 3,497 n/a n/a 3.65 22 60 2,099 28 70 5.01% - 10.00% 26 n/a n/a 7.16 19 76 20 - 93 High 10.01% - 99.99% 490 n/a n/a 33.67 22 122 598 36 213 Default 100.00% 268 n/a n/a 100.00 24 40 107 70 369 138,464 n/a n/a 0.68 20 11 14,598 210 12
Qualifying revolving credit
Exceptionally low 0.01% - 0.10% 30,533 36,292 77 0.04 96 3 859 13 3 0.11% - 0.20% 8,608 9,506 70 0.14 91 7 622 11 9 Very low 0.21% - 0.35% 6,286 5,250 88 0.26 88 12 741 15 15 0.36% - 0.50% 2,711 2,722 67 0.43 88 17 474 10 22 Low 0.51% - 1.00% 7,204 5,738 63 0.72 89 26 1,903 46 34 1.01% - 2.00% 7,227 4,009 69 1.42 92 45 3,278 94 62 Medium 2.01% - 5.00% 6,556 2,909 69 3.05 90 78 5,087 180 112 5.01% - 10.00% 1,616 353 69 7.12 87 131 2,113 100 208 High 10.01% - 99.99% 1,253 351 70 31.12 89 214 2,684 348 562 Default 100.00% 47 - - 100.00 84 179 83 36 1,154 72,041 67,130 75 1.33 92 25 17,844 853 40
Other retail Exceptionally low 0.01% - 0.10% 3,347 1,284 77 0.08 33 6 196 1 6 0.11% - 0.20% 429 447 66 0.14 81 25 107 - 26 Very low 0.21% - 0.35% 1,267 585 58 0.28 73 37 471 3 40 0.36% - 0.50% 1 4 12 0.43 95 63 - - 68 Low 0.51% - 1.00% 3,271 787 55 0.79 69 63 2,067 18 70 1.01% - 2.00% 1,547 224 62 1.39 77 88 1,357 16 101 Medium 2.01% - 5.00% 2,382 116 66 3.09 64 89 2,130 50 116 5.01% - 10.00% 467 36 67 7.77 82 129 603 30 209 High 10.01% - 99.99% 737 243 59 49.49 35 77 566 87 227 Default 100.00% 65 - - 100.00 74 15 10 60 1,161 13,513 3,726 65 4.39 60 56 7,507 265 80 329,109 124,067 58 0.77 34 13 42,107 1,337 18
For footnotes, see page 20.

January 31, 2018 Supplementary Regulatory Capital Disclosure Page 18
CREDIT QUALITY OF AIRB EXPOSURE - RETAIL PORTFOLIOS 1
($ millions) Q4/17
Exposure Exposure Exposure Exposure Expected losses
Notional of weighted- weighted- weighted- weighted- adjusted
undrawn average average average average Expected average
EAD commitments EAD % PD % LGD % risk weight % RWA losses risk weight % 2
Canadian residential mortgages and HELOCs PD bands
Insured Drawn and Undrawn 3
Exceptionally low 0.01% - 0.10% 87,815 - - 0.01 5 1 816 1 1 0.11% - 0.20% 366 - - 0.18 22 21 77 - 22 Very low 0.21% - 0.35% 702 - - 0.25 19 21 146 - 21 0.36% - 0.50% 1 - - 0.47 15 23 - - 24 Low 0.51% - 1.00% 79 - - 0.53 21 34 27 - 35 88,963 - - 0.01 5 1 1,066 1 1 Uninsured Undrawn 4
Exceptionally low 0.01% - 0.10% 13,196 44,389 30 0.04 31 3 448 2 4 0.11% - 0.20% 4,708 5,226 90 0.14 24 7 345 2 8 Very low 0.21% - 0.35% 543 1,607 34 0.30 35 19 104 1 20 0.36% - 0.50% - - - - - - - - - Low 0.51% - 1.00% 280 926 30 0.53 30 25 69 - 27 1.01% - 2.00% 153 473 32 1.16 36 49 76 1 54 Medium 2.01% - 5.00% 32 75 43 4.35 39 119 38 1 140 5.01% - 10.00% - - - - - - - - - High 10.01% - 99.99% 9 27 35 26.35 37 217 21 1 340 Default 100.00% - - - - - - - - - 18,921 52,723 36 0.11 29 6 1,101 8 6 Uninsured Drawn 4
Exceptionally low 0.01% - 0.10% 72,647 n/a n/a 0.06 20 3 2,257 9 3 0.11% - 0.20% 13,851 n/a n/a 0.17 23 8 1,157 6 9 Very low 0.21% - 0.35% 23,305 n/a n/a 0.31 19 11 2,484 14 11 0.36% - 0.50% 310 n/a n/a 0.45 20 14 45 - 16 Low 0.51% - 1.00% 6,591 n/a n/a 0.77 24 25 1,671 12 28 1.01% - 2.00% 13,624 n/a n/a 1.26 17 25 3,439 30 28 Medium 2.01% - 5.00% 3,315 n/a n/a 3.68 21 59 1,967 26 69 5.01% - 10.00% 29 n/a n/a 7.28 20 77 22 - 94 High 10.01% - 99.99% 417 n/a n/a 33.28 22 121 503 30 209 Default 100.00% 240 n/a n/a 100.00 24 39 92 65 377 134,329 n/a n/a 0.64 20 10 13,637 192 12
Qualifying revolving credit
Exceptionally low 0.01% - 0.10% 29,988 35,725 77 0.04 92 3 777 11 3 0.11% - 0.20% 8,456 9,361 70 0.14 85 7 579 10 8 Very low 0.21% - 0.35% 6,319 5,284 88 0.26 84 11 706 14 14 0.36% - 0.50% 4,118 4,007 64 0.41 88 17 698 15 22 Low 0.51% - 1.00% 5,753 4,425 64 0.76 83 26 1,498 37 34 1.01% - 2.00% 7,146 3,953 69 1.42 89 44 3,162 90 60 Medium 2.01% - 5.00% 6,634 2,939 70 3.05 87 75 4,996 177 109 5.01% - 10.00% 1,637 361 72 7.15 83 126 2,059 98 200 High 10.01% - 99.99% 1,319 374 85 30.48 88 211 2,785 355 547 Default 100.00% 45 - - 100.00 85 209 95 35 1,170 71,415 66,429 74 1.36 89 24 17,355 842 39
Other retail
Exceptionally low 0.01% - 0.10% 3,259 1,301 76 0.08 33 6 192 1 6 0.11% - 0.20% 430 450 65 0.14 78 24 104 - 26 Very low 0.21% - 0.35% 1,202 564 57 0.28 73 37 446 2 40 0.36% - 0.50% 6 9 41 0.39 95 59 3 - 63 Low 0.51% - 1.00% 3,170 741 54 0.79 69 63 1,999 17 70 1.01% - 2.00% 1,555 221 62 1.39 77 87 1,353 16 100 Medium 2.01% - 5.00% 2,319 107 67 3.12 65 91 2,119 50 118 5.01% - 10.00% 470 37 64 7.76 81 127 598 30 206 High 10.01% - 99.99% 721 266 60 48.08 35 76 551 84 223 Default 100.00% 56 - - 100.00 78 380 214 33 1,101 13,188 3,696 65 4.29 60 57 7,579 233 80 326,816 122,848 58 0.74 33 12 40,738 1,276 17
For footnotes, see page 20.

January 31, 2018 Supplementary Regulatory Capital Disclosure Page 19
CREDIT QUALITY OF AIRB EXPOSURE - RETAIL PORTFOLIOS 1
($ millions) Q3/17
Exposure Exposure Exposure Exposure Expected losses
Notional of weighted- weighted- weighted- weighted- adjusted
undrawn average average average average Expected average
EAD commitments EAD % PD % LGD % risk weight % RWA losses risk weight % 2
Canadian residential mortgages and HELOCs PD bands
Insured Drawn and Undrawn 3
Exceptionally low 0.01% - 0.10% 89,986 - - 0.01 5 1 836 1 1 0.11% - 0.20% 368 - - 0.18 22 21 76 - 21 Very low 0.21% - 0.35% 715 - - 0.25 19 21 148 - 21 0.36% - 0.50% 1 - - 0.47 16 24 - - 25 Low 0.51% - 1.00% 77 - - 0.53 21 33 26 - 35 91,147 - - 0.01 5 1 1,086 1 1 Uninsured Undrawn 4
Exceptionally low 0.01% - 0.10% 12,999 43,718 30 0.04 31 3 440 2 4 0.11% - 0.20% 6,052 6,884 88 0.14 24 7 453 2 8 Very low 0.21% - 0.35% 400 1,196 33 0.34 35 21 84 - 22 0.36% - 0.50% - - - - - - - - - Low 0.51% - 1.00% 311 1,032 30 0.53 31 26 79 1 28 1.01% - 2.00% 165 507 32 1.16 35 48 79 1 53 Medium 2.01% - 5.00% 30 77 39 4.36 38 115 34 - 135 5.01% - 10.00% - - - - - - - - - High 10.01% - 99.99% 11 30 36 26.84 38 218 23 1 344 Default 100.00% - - - - - - - - - 19,968 53,444 37 0.11 29 6 1,192 7 6 Uninsured Drawn 4
Exceptionally low 0.01% - 0.10% 67,817 n/a n/a 0.06 20 3 2,097 8 3 0.11% - 0.20% 14,079 n/a n/a 0.18 23 9 1,205 6 9 Very low 0.21% - 0.35% 21,237 n/a n/a 0.31 18 10 2,202 12 11 0.36% - 0.50% 300 n/a n/a 0.44 21 15 44 - 16 Low 0.51% - 1.00% 6,299 n/a n/a 0.77 24 25 1,571 12 27 1.01% - 2.00% 14,595 n/a n/a 1.26 18 26 3,781 33 29 Medium 2.01% - 5.00% 3,149 n/a n/a 3.68 21 59 1,848 24 68 5.01% - 10.00% 34 n/a n/a 7.35 19 73 25 - 90 High 10.01% - 99.99% 422 n/a n/a 32.93 22 121 511 30 209 Default 100.00% 224 n/a n/a 100.00 24 40 90 64 396 128,156 n/a n/a 0.66 20 10 13,374 189 12
Qualifying revolving credit
Exceptionally low 0.01% - 0.10% 28,879 34,945 75 0.04 91 3 741 11 3 0.11% - 0.20% 8,187 9,184 68 0.14 86 7 561 10 8 Very low 0.21% - 0.35% 5,672 5,272 76 0.27 83 11 638 13 14 0.36% - 0.50% 3,811 3,935 58 0.41 88 17 643 14 21 Low 0.51% - 1.00% 5,465 4,414 59 0.77 83 26 1,425 35 34 1.01% - 2.00% 7,020 3,957 66 1.42 89 44 3,084 88 60 Medium 2.01% - 5.00% 6,496 2,936 64 3.06 86 75 4,859 172 108 5.01% - 10.00% 1,600 371 69 7.21 82 125 1,999 95 199 High 10.01% - 99.99% 1,445 550 89 27.49 86 201 2,901 342 497 Default 100.00% 41 - - 100.00 83 195 80 32 1,161 68,616 65,564 71 1.38 88 25 16,931 812 39
Other retail
Exceptionally low 0.01% - 0.10% 3,068 1,505 67 0.08 36 7 210 1 7 0.11% - 0.20% 173 152 69 0.12 85 24 41 - 25 Very low 0.21% - 0.35% 1,157 623 48 0.29 79 41 476 3 44 0.36% - 0.50% 243 239 47 0.42 84 54 132 1 59 Low 0.51% - 1.00% 1,180 476 49 0.67 74 63 739 6 69 1.01% - 2.00% 3,057 147 57 1.40 84 96 2,933 36 110 Medium 2.01% - 5.00% 2,424 114 61 3.08 66 92 2,237 52 119 5.01% - 10.00% 513 80 66 7.11 82 127 653 30 201 High 10.01% - 99.99% 773 301 61 44.47 41 83 643 87 226 Default 100.00% 53 - - 100.00 79 435 232 30 1,137 12,641 3,637 59 4.48 65 66 8,296 246 90 320,528 122,645 56 0.75 33 13 40,879 1,255 18
For footnotes, see page 20.
January 31, 2018 Supplementary Regulatory Capital Disclosure Page 20
CREDIT QUALITY OF AIRB EXPOSURE - RETAIL PORTFOLIOS 1
($ millions) Q2/17
Exposure Exposure Exposure Exposure Expected losses
Notional of weighted- weighted- weighted- weighted- adjusted
undrawn average average average average Expected average
EAD commitments EAD % PD % LGD % risk weight % RWA losses risk weight % 2
Canadian residential mortgages and HELOCs PD bands
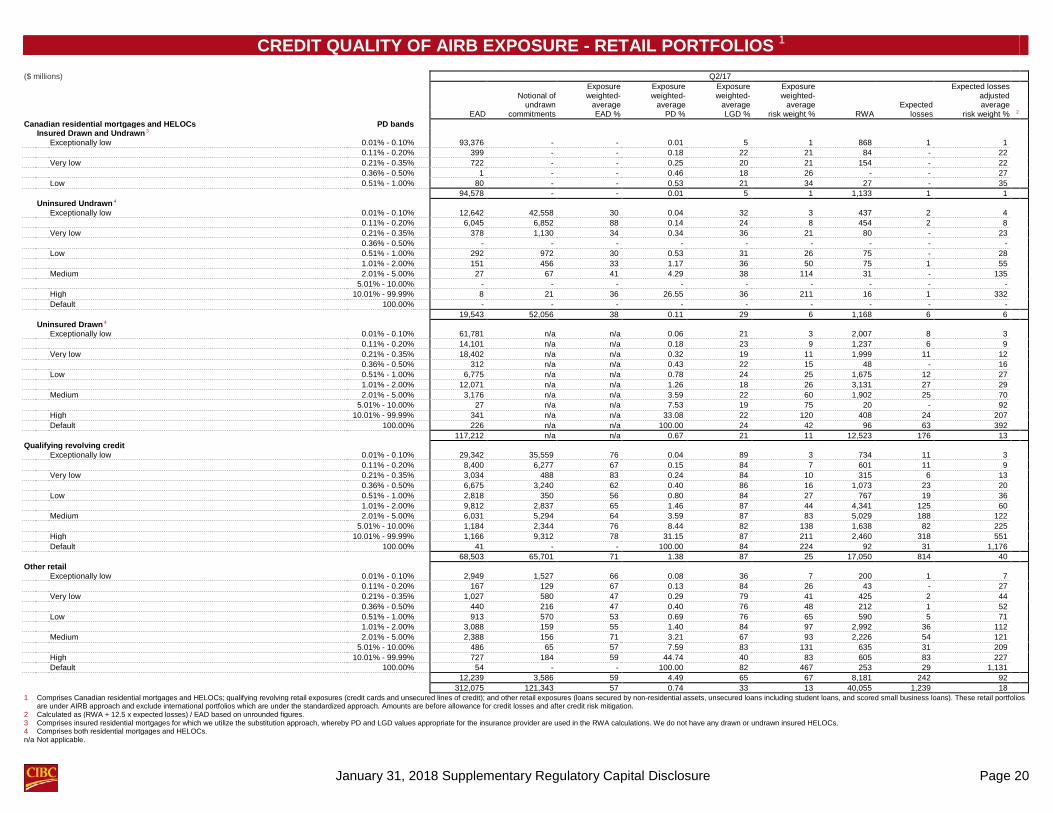
Insured Drawn and Undrawn 3
Exceptionally low 0.01% - 0.10% 93,376 - - 0.01 5 1 868 1 1 0.11% - 0.20% 399 - - 0.18 22 21 84 - 22 Very low 0.21% - 0.35% 722 - - 0.25 20 21 154 - 22 0.36% - 0.50% 1 - - 0.46 18 26 - - 27 Low 0.51% - 1.00% 80 - - 0.53 21 34 27 - 35 94,578 - - 0.01 5 1 1,133 1 1 Uninsured Undrawn 4
Exceptionally low 0.01% - 0.10% 12,642 42,558 30 0.04 32 3 437 2 4 0.11% - 0.20% 6,045 6,852 88 0.14 24 8 454 2 8 Very low 0.21% - 0.35% 378 1,130 34 0.34 36 21 80 - 23 0.36% - 0.50% - - - - - - - - - Low 0.51% - 1.00% 292 972 30 0.53 31 26 75 - 28 1.01% - 2.00% 151 456 33 1.17 36 50 75 1 55 Medium 2.01% - 5.00% 27 67 41 4.29 38 114 31 - 135 5.01% - 10.00% - - - - - - - - - High 10.01% - 99.99% 8 21 36 26.55 36 211 16 1 332 Default 100.00% - - - - - - - - - 19,543 52,056 38 0.11 29 6 1,168 6 6 Uninsured Drawn 4
Exceptionally low 0.01% - 0.10% 61,781 n/a n/a 0.06 21 3 2,007 8 3 0.11% - 0.20% 14,101 n/a n/a 0.18 23 9 1,237 6 9 Very low 0.21% - 0.35% 18,402 n/a n/a 0.32 19 11 1,999 11 12 0.36% - 0.50% 312 n/a n/a 0.43 22 15 48 - 16 Low 0.51% - 1.00% 6,775 n/a n/a 0.78 24 25 1,675 12 27 1.01% - 2.00% 12,071 n/a n/a 1.26 18 26 3,131 27 29 Medium 2.01% - 5.00% 3,176 n/a n/a 3.59 22 60 1,902 25 70 5.01% - 10.00% 27 n/a n/a 7.53 19 75 20 - 92 High 10.01% - 99.99% 341 n/a n/a 33.08 22 120 408 24 207 Default 100.00% 226 n/a n/a 100.00 24 42 96 63 392 117,212 n/a n/a 0.67 21 11 12,523 176 13
Qualifying revolving credit
Exceptionally low 0.01% - 0.10% 29,342 35,559 76 0.04 89 3 734 11 3 0.11% - 0.20% 8,400 6,277 67 0.15 84 7 601 11 9 Very low 0.21% - 0.35% 3,034 488 83 0.24 84 10 315 6 13 0.36% - 0.50% 6,675 3,240 62 0.40 86 16 1,073 23 20 Low 0.51% - 1.00% 2,818 350 56 0.80 84 27 767 19 36 1.01% - 2.00% 9,812 2,837 65 1.46 87 44 4,341 125 60 Medium 2.01% - 5.00% 6,031 5,294 64 3.59 87 83 5,029 188 122 5.01% - 10.00% 1,184 2,344 76 8.44 82 138 1,638 82 225 High 10.01% - 99.99% 1,166 9,312 78 31.15 87 211 2,460 318 551 Default 100.00% 41 - - 100.00 84 224 92 31 1,176 68,503 65,701 71 1.38 87 25 17,050 814 40
Other retail
Exceptionally low 0.01% - 0.10% 2,949 1,527 66 0.08 36 7 200 1 7 0.11% - 0.20% 167 129 67 0.13 84 26 43 - 27 Very low 0.21% - 0.35% 1,027 580 47 0.29 79 41 425 2 44 0.36% - 0.50% 440 216 47 0.40 76 48 212 1 52 Low 0.51% - 1.00% 913 570 53 0.69 76 65 590 5 71 1.01% - 2.00% 3,088 159 55 1.40 84 97 2,992 36 112 Medium 2.01% - 5.00% 2,388 156 71 3.21 67 93 2,226 54 121 5.01% - 10.00% 486 65 57 7.59 83 131 635 31 209 High 10.01% - 99.99% 727 184 59 44.74 40 83 605 83 227 Default 100.00% 54 - - 100.00 82 467 253 29 1,131 12,239 3,586 59 4.49 65 67 8,181 242 92 312,075 121,343 57 0.74 33 13 40,055 1,239 18
1 Comprises Canadian residential mortgages and HELOCs; qualifying revolving retail exposures (credit cards and unsecured lines of credit); and other retail exposures (loans secured by non-residential assets, unsecured loans including student loans, and scored small business loans). These retail portfolios are under AIRB approach and exclude international portfolios which are under the standardized approach. Amounts are before allowance for credit losses and after credit risk mitigation.
2 Calculated as (RWA + 12.5 x expected losses) / EAD based on unrounded figures. 3 Comprises insured residential mortgages for which we utilize the substitution approach, whereby PD and LGD values appropriate for the insurance provider are used in the RWA calculations. We do not have any drawn or undrawn insured HELOCs. 4 Comprises both residential mortgages and HELOCs. n/a Not applicable.

January 31, 2018 Supplementary Regulatory Capital Disclosure Page 21
AIRB CREDIT RISK EXPOSURE - LOSS EXPERIENCE
Q1/18 Q4/17 Q3/17 Q2/17
Expected Actual Expected Actual Expected Actual Expected Actual loss loss loss loss loss loss loss loss rate % 1 rate % 1 rate % 1 rate % 1 rate % 1 rate % 1 rate % 1 rate % 1
Business and government portfolios
Corporate 0.62 0.05 0.62 0.05 0.62 0.06 0.62 0.11 Sovereign 0.01 - 0.01 - 0.01 - 0.02 - Banks 0.15 - 0.12 - 0.17 - 0.15 - Retail portfolios
Real estate secured personal lending 0.09 0.01 0.08 0.01 0.08 0.01 0.08 0.01 Qualifying revolving retail 4.05 2.81 4.03 2.88 4.02 2.96 4.01 3.05 Other retail 2.48 0.94 2.44 0.96 2.44 0.99 2.46 1.02
Q1/17 Q4/16 Q3/16 Q2/16 Expected Actual Expected Actual Expected Actual Expected Actual loss loss loss loss loss loss loss loss rate % 1 rate % 1 rate % 1 rate % 1 rate % 1 rate % 1 rate % 1 rate % 1
Business and government portfolios
Corporate 0.67 0.24 0.57 0.29 0.56 0.31 0.53 0.25 Sovereign 0.01 - 0.01 - 0.01 - 0.01 - Banks 0.12 - 0.13 - 0.12 - 0.11 - Retail portfolios
Real estate secured personal lending 0.08 0.01 0.07 0.01 0.07 0.01 0.06 0.01 Qualifying revolving retail 3.97 3.05 3.68 2.97 3.66 2.86 3.42 2.77 Other retail 2.41 1.06 2.38 1.07 2.21 1.04 2.13 1.03
1
Actual loss rates for each quarter represent the write-offs less recoveries plus the change in allowance for impaired loans for the previous 12 months, divided by the outstanding balance at the beginning of the previous 12 month period. The expected loss rate represents the loss rate that was predicted by the Basel parameter estimates at the beginning of the period defined above.
Differences between actual and expected loss rates are due to the following reasons:
Expected losses are generally calculated using "through the business cycle" risk parameters while actual losses are determined at a "point in time" and reflect more current economic conditions. “Through the cycle" parameters are estimated to include a long time horizon and as a result, actual losses may exceed expected losses during an economic downturn and may fall below expected losses during times of economic growth.

January 31, 2018 Supplementary Regulatory Capital Disclosure Page 22
AIRB CREDIT RISK EXPOSURE - BACK-TESTING
Q1/18 Q4/17
Average Actual Average Average Actual Average estimated default estimated Actual Estimated Actual estimated default estimated Actual Estimated Actual PD % rate % LGD % LGD % EAD % EAD % PD % rate % LGD % LGD % EAD % EAD %
Business and government portfolios 1
Corporate 3.15 0.43 33.30 19.20 74.45 77.20 3.01 0.50 42.13 27.20 74.80 58.64
Sovereign 0.71 - 97.00 100.00 69.73 n/a 0.67 - 97.00 100.00 69.21 n/a
Banks 1.60 - n/a n/a 68.60 n/a 1.47 - n/a n/a 75.08 n/a
Retail portfolios 2
Real estate secured personal lending
Uninsured residential mortgages and personal loans 0.63 0.46 21.27 10.39 n/a n/a 0.60 0.46 21.31 9.96 n/a n/a
Insured residential mortgages 0.62 0.58 n/a n/a n/a n/a 0.61 0.58 n/a n/a n/a n/a
Home equity line of credit 0.21 0.19 38.93 16.81 94.21 89.24 0.21 0.20 42.22 14.83 97.29 94.27
Qualifying revolving retail 1.28 1.13 89.12 88.31 102.64 95.30 1.30 1.15 89.57 88.39 103.46 96.96
Other retail 2.40 1.83 81.64 78.57 97.35 97.30 2.38 1.81 82.42 81.42 96.73 91.14
Q3/17 Q2/17 Average Actual Average Average Actual Average
estimated default estimated Actual Estimated Actual estimated default estimated Actual Estimated Actual
PD % rate % LGD % LGD % EAD % EAD % PD % rate % LGD % LGD % EAD % EAD %
Business and government portfolios 1
Corporate 3.03 0.55 43.99 33.32 77.11 58.85 3.00 0.55 52.59 31.61 77.02 58.25
Sovereign 0.69 0.08 n/a n/a 72.81 67.45 0.67 0.08 n/a n/a 71.61 67.45
Banks 1.53 - n/a n/a 79.37 n/a 1.67 - n/a n/a 85.50 n/a
Retail portfolios 2
Real estate secured personal lending
Uninsured residential mortgages and personal loans 0.60 0.46 20.16 6.33 n/a n/a 0.63 0.43 20.12 9.31 n/a n/a
Insured residential mortgages 0.60 0.57 n/a n/a n/a n/a 0.62 0.57 n/a n/a n/a n/a
Home equity line of credit 0.20 0.18 37.55 14.92 96.06 91.47 0.21 0.18 38.57 19.49 95.69 91.66
Qualifying revolving retail 1.30 1.14 88.35 87.81 100.95 100.13 1.27 1.12 88.52 87.85 99.95 95.59
Other retail 2.46 1.91 85.28 75.44 97.44 92.97 2.50 1.89 85.17 80.71 96.96 92.06
1
Estimated LGD is based on accounts that default. Estimated EAD is based on all accounts. For actual LGD, payments are discounted to the default date using discount rates based on opportunity cost (the highest interest rate at which we would originate a new loan in the corresponding portfolio). Estimated and actual EAD include only revolving facilities.
2 Both estimated and actual EAD are based on accounts that default. Actual LGD is based on payments received after default for accounts that defaulted 24 months before the effective month, using a discount rate based on opportunity cost. Estimated and actual EAD include only revolving products (lines of credit, credit cards, and overdraft facilities). Retail information is based upon our internal parameter monitoring system, which covers more than 90% of retail exposures.
n/a Not applicable.

January 31, 2018 Supplementary Regulatory Capital Disclosure Page 23
BUSINESS AND GOVERNMENT AIRB EXPOSURES BY INDUSTRY GROUPS 1
($ millions)
Q1/18 Q4/17 Q3/17 Q2/17 Q1/17 Q4/16 Q3/16 Q2/16 Q1/16
Drawn Undrawn
commitments Repo-style
transactions
Other off- OTC
derivatives
Total
balance
sheet Total Commercial mortgages 886 7 - - - 893 1,065 1,088 1,200 1,406 1,694 2,126 2,617 7,746 Financial institutions 36,495 4,949 12,594 70,493 12,459 136,990 129,106 131,342 135,655 131,665 134,727 126,294 120,458 120,593 Retail and wholesale 4,628 2,765 - 257 195 7,845 7,532 7,335 7,285 7,187 6,967 7,001 7,016 6,769 Business services 6,654 2,556 79 654 95 10,038 9,769 9,739 9,046 8,860 8,682 8,308 8,183 7,659 Manufacturing - capital goods 2,306 1,998 - 422 106 4,832 4,694 4,678 4,817 4,616 4,651 4,783 4,763 5,218 Manufacturing - consumer goods 3,054 1,602 - 227 43 4,926 4,909 4,886 4,875 4,566 4,546 4,705 4,621 4,403 Real estate and construction 28,613 6,594 76 972 122 36,377 36,067 36,811 36,964 34,817 34,549 33,616 30,896 25,445 Agriculture 5,469 1,531 - 26 38 7,064 6,936 6,826 6,886 6,692 6,582 6,749 6,590 6,526 Oil and gas 7,042 8,306 - 973 2,251 18,572 18,104 17,330 17,431 16,762 17,655 17,185 16,497 18,653 Mining 1,253 2,957 - 672 167 5,049 5,253 4,945 4,934 4,782 5,104 4,800 4,725 5,276 Forest products 469 454 - 143 8 1,074 1,083 1,040 1,096 1,091 1,072 1,196 1,207 1,221 Hardware and software 846 396 - 31 71 1,344 1,420 1,286 1,213 1,125 1,108 1,198 1,346 1,179 Telecommunications and cable 1,028 1,023 - 425 189 2,665 2,850 2,799 2,324 2,058 2,040 2,138 2,126 2,321 Broadcasting, publishing, and printing 410 137 - - 4 551 504 525 636 872 889 899 884 730 Transportation 3,663 1,986 - 444 674 6,767 6,729 6,649 6,277 5,891 5,867 5,731 5,254 5,175 Utilities 4,015 5,061 - 1,997 644 11,717 12,062 11,721 12,991 11,670 11,197 11,435 11,725 11,848 Education, health, and social services 2,556 999 22 90 94 3,761 3,921 3,712 3,946 3,699 3,624 3,699 3,573 3,443 Governments 27,731 4,183 1,341 273 2,545 36,073 32,526 29,812 31,155 25,945 29,067 28,080 26,096 28,933 137,118 47,504 14,112 78,099 19,705 296,538 284,530 282,524 288,731 273,704 280,021 269,943 258,577 263,138 1 Gross credit exposure after credit valuation adjustments for financial guarantors, and before allowance for credit losses.

January 31, 2018 Supplementary Regulatory Capital Disclosure Page 24
EXPOSURE AT DEFAULT UNDER THE STANDARDIZED APPROACH ($ millions) Risk-weight category
0% 20% 35% 50% 75% 100% 150% Total Q1/18 Corporate - 67 - 17 - 27,743 96 27,923 Sovereign 6,444 3,961 - 112 - 562 29 11,108 Banks - 1,709 - 109 - 231 - 2,049 Real estate secured personal lending - - - - 3,080 115 8 3,203 Other retail - - - - 1,078 27 3 1,108 6,444 5,737 - 238 4,158 28,678 136 45,391 Q4/17 6,820 6,178 - 241 4,314 28,990 432 46,975 Q3/17 6,020 6,048 - 243 4,085 27,503 443 44,342 Q2/17 3,890 1,854 - 491 3,259 4,511 353 14,358 Q1/17 3,828 1,757 - 366 3,068 4,207 349 13,575 Q4/16 3,673 1,910 - 509 3,133 4,480 417 14,122 Q3/16 3,767 1,929 - 383 3,022 4,299 431 13,831 Q2/16 3,570 1,799 - 366 2,863 4,087 440 13,125 Q1/16 4,178 1,963 - 280 3,196 4,715 532 14,864

January 31, 2018 Supplementary Regulatory Capital Disclosure Page 25
EXPOSURE COVERED BY GUARANTEES AND CREDIT DERIVATIVES 1
($ millions) Q1/18 Q4/17 Q3/17 Q2/17
Provider of guarantees/ credit
derivatives Provider of guarantees/ credit
derivatives Provider of guarantees/ credit
derivatives Provider of guarantees/ credit
derivatives
Corporate Sovereign Bank Corporate Sovereign Bank Corporate Sovereign Bank Corporate Sovereign Bank
Corporate 9,142 1,055 3,133 9,136 871 2,723 8,628 950 3,154 9,000 2,385 3,949 Sovereign 97 8,402 - 17 7,934 - 17 8,389 - 18 9,026 - Banks 28 2,525 32,609 - 2,633 32,960 - 2,051 32,550 - 1,633 33,312 Real estate secured personal lending 2,285 83,906 - 2,301 86,663 - 2,339 88,810 - 2,352 92,225 - Other retail - 9 - - 10 - - 11 - - 12 - 11,552 95,897 35,742 11,454 98,111 35,683 10,984 100,211 35,704 11,370 105,281 37,261
Q1/17 Q4/16 Q3/16 Q2/16 Provider of guarantees/ credit
derivatives Provider of guarantees/ credit
derivatives Provider of guarantees/ credit
derivatives Provider of guarantees/ credit
derivatives
Corporate Sovereign Bank Corporate Sovereign Bank Corporate Sovereign Bank Corporate Sovereign Bank
Corporate 8,985 988 4,142 8,433 1,078 5,328 7,833 1,071 3,810 7,253 1,142 3,043 Sovereign 111 9,243 - 113 10,091 - 114 6,226 - 18 8,556 - Banks - 1,675 31,469 - 1,810 32,633 - 5,086 31,589 - 1,861 30,672 Real estate secured personal lending 2,210 92,235 - 2,215 95,242 - 2,210 97,656 - 2,199 100,408 - Other retail - 13 - - 14 - - 16 - - 17 - 11,306 104,154 35,611 10,761 108,235 37,961 10,157 110,055 35,399 9,470 111,984 33,715
EXPOSURE SECURITIZED AS ORIGINATOR 2
($ millions) Q1/18 Q4/17 Q3/17 Q2/17 Q1/17 Q4/16 Q3/16 Q2/16 Q1/16
Total Total Total Total Total Total Total Total Total Commercial mortgages Securitized - - - 7 63 156 194 209 223 Sold - - - 7 63 156 194 209 223
1 This table provides information on credit mitigants against exposures analyzed under the AIRB approach. 2 There were no impaired and other past due loans or net write-offs for periods shown.

January 31, 2018 Supplementary Regulatory Capital Disclosure Page 26
BANK SPONSORED MULTI-SELLER CONDUITS EXPOSURE
($ millions) Q1/18 Q4/17 Q3/17 Q2/17 Q1/17 Q4/16 Q3/16 Q2/16 Q1/16
Asset amount
Canadian residential mortgages 1,324 946 665 502 589 546 593 - - Auto and fleet leases 875 1,064 1,106 1,178 1,248 1,070 1,147 1,223 1,292 Auto loans 956 1,075 1,200 809 911 1,054 577 677 778 Franchise loans 394 454 489 477 449 468 470 461 409 Credit cards 495 720 720 720 875 875 725 710 710 Equipment leases/loans 1,775 1,391 1,215 1,118 1,257 1,364 1,218 1,186 1,198 Legislated utility cost recovery 244 - - - - - - - - Dealer floorplan 350 - 155 55 55 55 55 55 55 6,413 5,650 5,550 4,859 5,384 5,432 4,785 4,312 4,442
Impaired and other past due loans 1 18 18 17 20 19 18 17 18 18
TOTAL SECURITIZATION EXPOSURES (IRB APPROACH)
($ millions) Q1/18 Q4/17 Q3/17 Q2/17 Q1/17 Q4/16 Q3/16 Q2/16 Q1/16 Undrawn Of which
Investments liquidity and Written credit Total resecuritization
and loans credit facilities derivatives exposure exposure 2 Total Exposure Non-Trading
Third party securitized assets 3
CIBC sponsored conduits and structured vehicles 1,034 8,662 - 9,696 - 9,343 8,659 7,571 7,896 7,921 7,348 6,424 6,352 Third party structured vehicles 2,671 1,492 25 4,188 30 4,831 4,691 4,975 5,105 10,942 11,400 11,153 12,516 Trading 4 163 - - 163 - 157 156 109 146 125 155 159 277 Total EAD 3,868 10,154 25 14,047 30 14,331 13,506 12,655 13,147 18,988 18,903 17,736 19,145
1
Impaired and other past due loans are in respect of the assets that are collateral to the short-term notes issued by the multi-seller conduits. CIBC retains no direct credit exposure to the assets in the conduits. The risk of loss from these assets is substantially reduced through the presence of credit enhancement which is in place for each program in the conduits. In some instances, the amount of impaired and other past due loans is for an entire asset pool which may be funded by multiple parties in addition to the CIBC-sponsored multi-seller conduits. The CIBC-sponsored multi-seller conduits would only be exposed to the pro-rata portion of the impaired and other past due loan amounts based on the proportional amount of ownership interests funded by them, not the entire amount for the asset pool reported above.
2 Resecuritization exposure comprises $5 million (Q4/17: $5 million) of investments and loans, nil (Q4/17: nil) of undrawn credit facilities and $25 million (Q4/17: $32 million) of written credit derivatives. 3 Comprises collateralized loan obligations, asset-backed commercial paper, trust preferred securities, collateralized debt obligations, and others. There were no securitization exposures relating to bank's own securitized assets. 4 Comprises asset-backed securities.
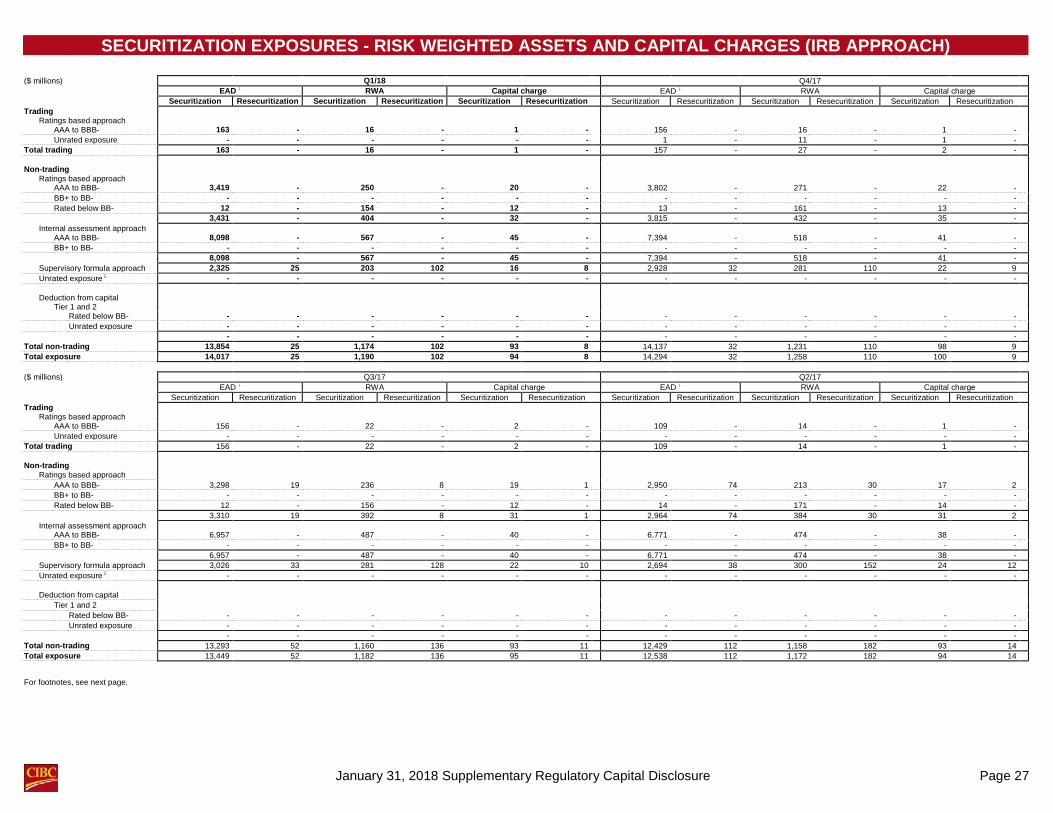
January 31, 2018 Supplementary Regulatory Capital Disclosure Page 27
SECURITIZATION EXPOSURES - RISK WEIGHTED ASSETS AND CAPITAL CHARGES (IRB APPROACH)
($ millions)
Q1/18 Q4/17 EAD 1 RWA Capital charge EAD 1 RWA Capital charge Securitization Resecuritization Securitization Resecuritization Securitization Resecuritization Securitization Resecuritization Securitization Resecuritization Securitization Resecuritization Trading
Ratings based approach
AAA to BBB- 163 - 16 - 1 - 156 - 16 - 1 - Unrated exposure - - - - - - 1 - 11 - 1 - Total trading 163 - 16 - 1 - 157 - 27 - 2 -
Non-trading
Ratings based approach
AAA to BBB- 3,419 - 250 - 20 - 3,802 - 271 - 22 - BB+ to BB- - - - - - - - - - - - - Rated below BB- 12 - 154 - 12 - 13 - 161 - 13 - 3,431 - 404 - 32 - 3,815 - 432 - 35 - Internal assessment approach
AAA to BBB- 8,098 - 567 - 45 - 7,394 - 518 - 41 - BB+ to BB- - - - - - - - - - - - - 8,098 - 567 - 45 - 7,394 - 518 - 41 - Supervisory formula approach 2,325 25 203 102 16 8 2,928 32 281 110 22 9 Unrated exposure 2 - - - - - - - - - - - -
Deduction from capital
Tier 1 and 2
Rated below BB- - - - - - - - - - - - - Unrated exposure - - - - - - - - - - - - - - - - - - - - - - - - Total non-trading 13,854 25 1,174 102 93 8 14,137 32 1,231 110 98 9 Total exposure 14,017 25 1,190 102 94 8 14,294 32 1,258 110 100 9
($ millions) Q3/17 Q2/17 EAD 1 RWA Capital charge EAD 1 RWA Capital charge Securitization Resecuritization Securitization Resecuritization Securitization Resecuritization Securitization Resecuritization Securitization Resecuritization Securitization Resecuritization Trading
Ratings based approach
AAA to BBB- 156 - 22 - 2 - 109 - 14 - 1 - Unrated exposure - - - - - - - - - - - - Total trading 156 - 22 - 2 - 109 - 14 - 1 -
Non-trading
Ratings based approach
AAA to BBB- 3,298 19 236 8 19 1 2,950 74 213 30 17 2 BB+ to BB- - - - - - - - - - - - - Rated below BB- 12 - 156 - 12 - 14 - 171 - 14 - 3,310 19 392 8 31 1 2,964 74 384 30 31 2 Internal assessment approach
AAA to BBB- 6,957 - 487 - 40 - 6,771 - 474 - 38 - BB+ to BB- - - - - - - - - - - - - 6,957 - 487 - 40 - 6,771 - 474 - 38 - Supervisory formula approach 3,026 33 281 128 22 10 2,694 38 300 152 24 12 Unrated exposure 2 - - - - - - - - - - - -
Deduction from capital
Tier 1 and 2
Rated below BB- - - - - - - - - - - - - Unrated exposure - - - - - - - - - - - - - - - - - - - - - - - - Total non-trading 13,293 52 1,160 136 93 11 12,429 112 1,158 182 93 14 Total exposure 13,449 52 1,182 136 95 11 12,538 112 1,172 182 94 14
For footnotes, see next page.

January 31, 2018 Supplementary Regulatory Capital Disclosure Page 28
SECURITIZATION EXPOSURES - RISK WEIGHTED ASSETS AND CAPITAL CHARGES (IRB APPROACH) (continued)
($ millions)
Q1/17 Q4/16 EAD 1 RWA Capital charge EAD 1 RWA Capital charge Securitization Resecuritization Securitization Resecuritization Securitization Resecuritization Securitization Resecuritization Securitization Resecuritization Securitization Resecuritization Trading
Ratings based approach
AAA to BBB- 146 - 14 - 1 - 125 - 12 - 1 - Unrated exposure - - - - - - - - - - - - Total trading 146 - 14 - 1 - 125 - 12 - 1 -
Non-trading
Ratings based approach
AAA to BBB- 3,136 102 235 41 19 3 3,662 373 272 238 22 19 BB+ to BB- - - - - - - - - - - - - Rated below BB- 13 - 163 - 13 - 13 - 168 - 13 - 3,149 102 398 41 32 3 3,675 373 440 238 35 19 Internal assessment approach
AAA to BBB- 7,110 - 498 - 40 - 7,192 - 523 - 42 - BB+ to BB- - - - - - - - - - - - - 7,110 - 498 - 40 - 7,192 - 523 - 42 - Supervisory formula approach 2,595 37 343 118 28 9 7,323 44 811 206 65 16 Unrated exposure 2 - - - - - - - - - - - -
Deduction from capital
Tier 1 and 2
Rated below BB- - - - - - - - - - - - - Unrated exposure - - - - - - - - - - - - - - - - - - - - - - - - Total non-trading 12,854 139 1,239 159 100 12 18,190 417 1,774 444 142 35 Total exposure 13,000 139 1,253 159 101 12 18,315 417 1,786 444 143 35
($ millions) Q3/16 Q2/16 EAD 1 RWA Capital charge EAD 1 RWA Capital charge Securitization Resecuritization Securitization Resecuritization Securitization Resecuritization Securitization Resecuritization Securitization Resecuritization Securitization Resecuritization Trading
Ratings based approach
AAA to BBB- 155 - 15 - 1 - 159 - 12 - 1 - Unrated exposure - - - - - - - - - - - - Total trading 155 - 15 - 1 - 159 - 12 - 1 -
Non-trading
Ratings based approach
AAA to BBB- 4,118 540 305 317 24 25 4,057 628 293 346 23 28 BB+ to BB- - - - - - - - - - - - - Rated below BB- 13 - 163 - 13 - 13 - 157 - 13 - 4,131 540 468 317 37 25 4,070 628 450 346 36 28 Internal assessment approach
AAA to BBB- 6,375 - 446 - 36 - 5,501 - 385 - 30 - BB+ to BB- - - - - - - - - - - - - 6,375 - 446 - 36 - 5,501 - 385 - 30 -
Supervisory formula approach 7,410 46 868 191 70 15 7,086 44 663 129 53 10 Unrated exposure 2 - - - - - - - 1 - 8 - 1
Deduction from capital
Tier 1 and 2
Rated below BB- - - - - - - - - - - - - Unrated exposure - - - - - - - - - - - - - - - - - - - - - - - - Total non-trading 17,916 586 1,782 508 143 40 16,657 673 1,498 483 119 39 Total exposure 18,071 586 1,797 508 144 40 16,816 673 1,510 483 120 39 1 Net of financial collateral of $5 million (Q4/17: $5 million) for resecuritization exposures. 2 Pertains to unrated exposures not subject to supervisory formula approach.

January 31, 2018 Supplementary Regulatory Capital Disclosure Page 29
BASEL - GLOSSARY Advanced internal ratings-based (AIRB) approach for credit risk Real estate secured personal lending
Internal models based on historical experience of key risk assumptions such as PD, LGD and EAD are used to compute the capital requirements subject to OSFI approval. A transitional capital floor based on Basel I standards is also calculated by banks under the AIRB approach for credit risk and an adjustment to RWAs may be required as prescribed by OSFI.
This exposure class includes residential mortgages and home equity lines of credit extended to individuals. Regulatory capital Basel III regulatory capital, as defined by OSFI's Capital Adequacy Requirements Guideline, is comprised of Common Equity Tier
1 (CET1), Additional Tier 1 (AT1) and Tier 2 capital. CET1 capital includes common shares, retained earnings, AOCI (excluding AOCI relating to cash flow hedges and changes to FVO liabilities attributable to changes in own credit risk) and qualifying instruments issued by a consolidated banking subsidiary to third parties, less regulatory adjustments for items such as goodwill and other intangible assets, deferred tax assets, net assets related to defined benefit pension plans, and certain investments. AT1 capital primarily includes non-viability contingent capital (NVCC) preferred shares, qualifying instruments issued by a consolidated subsidiary to third parties, and non-qualifying innovative Tier 1 notes which are subject to phase-out rules for capital instruments. Tier 1 capital is comprised of CET1 plus AT1. Tier 2 capital includes NVCC subordinated indebtedness, non-qualifying subordinated indebtedness subject to phase-out rules for capital instruments, eligible collective allowance under the standardized approach, and qualifying instruments issued by a consolidated subsidiary to third parties. Total capital is comprised of Tier 1 capital plus Tier 2 capital. Under Basel III, qualifying regulatory capital instruments must be capable of absorbing loss at the point of non-viability of the financial institution; non-qualifying capital instruments are excluded from regulatory capital at a rate of 10% per annum commencing January 1, 2013 through to January 1, 2022.
Advanced measurement approach (AMA) for operational risk A risk-sensitive approach to calculating the capital charge for operational risk based on internal risk measurement models, using a combination of quantitative and qualitative risk measurement techniques.
Business and government portfolio A category of exposures that includes lending to businesses and governments, where the primary basis of adjudication relies on the determination and assignment of an appropriate risk rating, that reflects the credit risk of the exposure.
Common Equity Tier 1 (CET1), Tier 1 and Total capital ratios CET1, Tier 1 and total regulatory capital, divided by RWAs, as defined by OSFI's Capital Adequacy Requirements Guideline, which is based on BCBS standards. During the period beginning in the third quarter of 2014 to the fourth quarter of 2018, on an all-in basis, before any capital floor requirement, there are three different levels of RWAs for the calculation of CIBC’s CET1, Tier 1 and Total capital ratios. This occurs because of the option CIBC has chosen for the phase-in of the CVA capital charge.
Retail portfolios
Corporate exposures A category of exposures that primarily includes consumer, but also small business lending, where the primary basis of adjudication relies on credit scoring models. All direct credit risk exposures to corporations, partnerships and proprietorships, and exposures guaranteed by those entities.
Credit risk Resecuritization The risk of financial loss due to a borrower or counterparty failing to meet its obligations in accordance with contractual terms. A securitization exposure in which the risk associated with an underlying pool of exposures is tranched and at least one of the
underlying exposures is a securitization exposure. Drawn exposure The amount of credit risk exposure resulting from loans already advanced to the customer. Risk-weighted assets (RWA) RWAs consist of three components: (i) RWAs for credit risk are calculated using the AIRB and standardized approaches. The
AIRB RWAs are calculated using PDs, LGDs, EADs, and in some cases maturity adjustment, while the standardized approach applies risk weighting factors specified in the OSFI guidelines to on- and off- balance sheet exposures; (ii) RWAs for market risk in the trading portfolio are based on the internal models approved by OSFI with the exception of the RWAs for traded securitization assets where we are using the methodology defined by OSFI; and (iii) RWAs for operational risk relating to the risk of losses resulting from people, inadequate or failed internal processes, and systems or from external events are calculated under the AMA and standardized approaches. During the period beginning in the third quarter 2014 to the fourth quarter of 2018, CET1 capital RWA, Tier 1 capital RWA, and total capital RWA, will differ due to the phase in of the CVA capital charge. Since the introduction of Basel II in 2008, OSFI has prescribed a capital floor requirement for institutions that use the AIRB approach for credit risk. The capital floor is determined by comparing a capital requirement calculated by reference to Basel I against the Basel III calculation, as specified by OSFI. Any shortfall in the Basel III capital requirement compared with the Basel I floor is added to RWAs.
Exposure at default (EAD) An estimate of the amount of exposure to a customer at the event of, and at the time of, default. Internal models approach (IMA) for market risk Models, which have been developed by CIBC and approved by OSFI, for the measurement of risk and regulatory capital in the trading portfolio for general market risk, debt specific risk, and equity specific risk.
Internal ratings based (IRB) approach for securitization exposures Capital calculation method for securitizations available to the banks approved to use IRB approach for underlying exposures securitized. IRB for securitization comprises several calculation approaches (Ratings-Based, Supervisory Formula, Internal Assessment Approach).
Leverage exposure For the purposes of the leverage ratio, exposure is defined under the rules as on-balance sheet assets (unweighted) less Tier 1 capital regulatory adjustments plus derivative exposures, securities financing transaction exposures with a limited form of netting under certain conditions, and other off-balance sheet exposures (such as commitments, direct credit substitutes, forward asset purchases, standby/trade letters of credit, securitization exposures).
Securitization
The process of selling assets (normally financial assets such as loans, leases, trade receivables, credit card receivables or mortgages) to trusts or other structured entities (SEs). A SE normally issues securities or other forms of interests to investors and/or the asset transferor, and the SE uses the proceeds of the issue of securities to purchase the transferred assets. The SE will generally use the cash flows generated by the assets to meet the obligations under the securities or other interests issued by the SE, which may carry a number of different risk profiles.
Leverage ratio Defined as Tier 1 capital divided by Leverage Exposure. Sovereign exposures Loss given default (LGD) All direct credit risk exposures to governments, central banks and certain public sector entities, and exposures guaranteed by
those entities. An estimate of the amount of exposure to a customer that will not be recovered following a default by that customer, expressed as a percentage of the exposure at default.
Standardized approach for credit risk Operational risk Applied to exposures when there is not sufficient information to allow for the use of the AIRB approach for credit risk. Credit risk
capital requirements are calculated based on a standardized set of risk weights as prescribed in the Basel Accord. The standardized risk weights are based on external credit assessments, where available, and other risk related factors, including export credit agencies, exposure asset class, collateral, etc.
The risk of loss resulting from people, inadequate or failed internal processes, and systems or from external events. Probability of default (PD) An estimate of the likelihood of default for any particular customer which occurs when that customer is not able to repay its obligations as they become contractually due.
Standardized approach for operational risk
Capital is based on prescribed percentages that vary by business activity and is applied to the three-year average gross income. Qualifying revolving retail This exposure class includes credit cards, unsecured lines of credit and overdraft protection products extended to individuals. Under the standardized approach, these exposures would be included under “other retail”.