regional sections 10.17 - arundel community development
TRANSCRIPT

Regional SectionFebruary 2012

February 2012 Page i
BALTIMORE METRO AREA ANALYSIS OF IMPEDIMENTS TO FAIR HOUSING CHOICE
2. REGIONAL PROFILE ...................................................................... 4 I. Introduction ............................................................................................................... 4 II. Regional Overview .................................................................................................... 6 III. Demographic Profile ................................................................................................. 6
a. Population Trends ....................................................................................................... 6 b. Areas of Racial and Ethnic Minority Concentration ..................................................... 8 c. Residential Segregation Patterns ............................................................................... 9 d. Persons with Limited English Proficiency .................................................................. 10
IV. Economic Profile ..................................................................................................... 12 a. Race/Ethnicity and Income ....................................................................................... 12 b. Concentrations of LMI Persons ................................................................................. 14 c. Disability and Income ................................................................................................ 14 d. Familial Status and Income ....................................................................................... 16 e. Ancestry and Income ................................................................................................ 17 f. Protected Class Status and Unemployment ............................................................. 18
V. Housing Market Profile ............................................................................................ 19 a. Housing Inventory ..................................................................................................... 19 b. Types of Housing Units ............................................................................................. 20 c. Foreclosure Trends ................................................................................................... 21 d. Protected Class Status and Homeownership ............................................................ 22 e. The Tendency of the Protected Classes to Live in Larger Households .................... 23 f. Cost of Housing ........................................................................................................ 24 3. Regional Inventory of Public and Publicly Assisted Housing .................................... 29 4. Distribution of Section 8 Housing Choice Vouchers .................................................. 33
VI. Home Mortgage Financing ...................................................................................... 35 a. Mortgage Lending Practices ..................................................................................... 35 b. High-Cost Lending Practices .................................................................................... 40
VII. Regional Patterns in Fair Housing Complaints ....................................................... 42 a. Comparison of Classes Protected by Law ................................................................ 42 b. Trends in Fair Housing Complaints ........................................................................... 43 c. Hate Crimes .............................................................................................................. 45
8. REGIONAL CONSIDERATIONS ...................................................... 46 I. Regional Transportation Network ........................................................................... 46 II. Comparison of Jurisdictional Tax Profiles ............................................................... 50 III. Real Estate Advertising ........................................................................................... 56 IV. Regional Research and Publications Review ......................................................... 57 V. Intergovernmental Cooperation and Coordination .................................................. 65 VI. Fair Housing Advocacy Organizations .................................................................... 66 VII. State of Maryland Qualified Allocation Plan ............................................................ 68
9. REGIONAL IMPEDIMENTS TO FAIR HOUSING CHOICE ..................... 70
10. REGIONAL FAIR HOUSING ACTION PLAN ...................................... 74
11. SIGNATURE PAGE FOR PARTICIPATING JURISDICTIONS ................. 78 Appendix: Public Display Period, Public Hearing, Comments Received and Jurisdictions' Responses
February 2012 Page 2
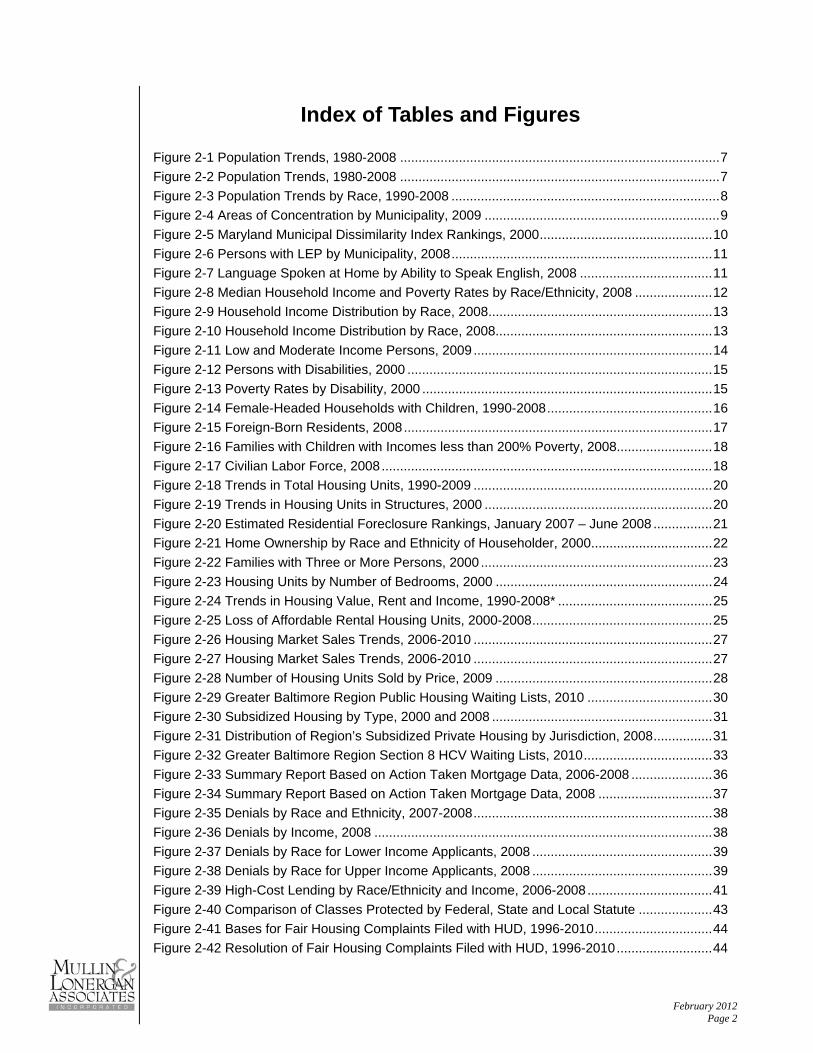
Index of Tables and Figures
Figure 2-1 Population Trends, 1980-2008 ....................................................................................... 7
Figure 2-2 Population Trends, 1980-2008 ....................................................................................... 7
Figure 2-3 Population Trends by Race, 1990-2008 ......................................................................... 8
Figure 2-4 Areas of Concentration by Municipality, 2009 ................................................................ 9
Figure 2-5 Maryland Municipal Dissimilarity Index Rankings, 2000 ............................................... 10
Figure 2-6 Persons with LEP by Municipality, 2008 ....................................................................... 11
Figure 2-7 Language Spoken at Home by Ability to Speak English, 2008 .................................... 11
Figure 2-8 Median Household Income and Poverty Rates by Race/Ethnicity, 2008 ..................... 12
Figure 2-9 Household Income Distribution by Race, 2008 ............................................................. 13
Figure 2-10 Household Income Distribution by Race, 2008........................................................... 13
Figure 2-11 Low and Moderate Income Persons, 2009 ................................................................. 14
Figure 2-12 Persons with Disabilities, 2000 ................................................................................... 15
Figure 2-13 Poverty Rates by Disability, 2000 ............................................................................... 15
Figure 2-14 Female-Headed Households with Children, 1990-2008 ............................................. 16
Figure 2-15 Foreign-Born Residents, 2008 .................................................................................... 17
Figure 2-16 Families with Children with Incomes less than 200% Poverty, 2008.......................... 18
Figure 2-17 Civilian Labor Force, 2008 .......................................................................................... 18
Figure 2-18 Trends in Total Housing Units, 1990-2009 ................................................................. 20
Figure 2-19 Trends in Housing Units in Structures, 2000 .............................................................. 20
Figure 2-20 Estimated Residential Foreclosure Rankings, January 2007 – June 2008 ................ 21
Figure 2-21 Home Ownership by Race and Ethnicity of Householder, 2000 ................................. 22
Figure 2-22 Families with Three or More Persons, 2000 ............................................................... 23
Figure 2-23 Housing Units by Number of Bedrooms, 2000 ........................................................... 24
Figure 2-24 Trends in Housing Value, Rent and Income, 1990-2008* .......................................... 25
Figure 2-25 Loss of Affordable Rental Housing Units, 2000-2008 ................................................. 25
Figure 2-26 Housing Market Sales Trends, 2006-2010 ................................................................. 27
Figure 2-27 Housing Market Sales Trends, 2006-2010 ................................................................. 27
Figure 2-28 Number of Housing Units Sold by Price, 2009 ........................................................... 28
Figure 2-29 Greater Baltimore Region Public Housing Waiting Lists, 2010 .................................. 30
Figure 2-30 Subsidized Housing by Type, 2000 and 2008 ............................................................ 31
Figure 2-31 Distribution of Region’s Subsidized Private Housing by Jurisdiction, 2008 ................ 31
Figure 2-32 Greater Baltimore Region Section 8 HCV Waiting Lists, 2010 ................................... 33
Figure 2-33 Summary Report Based on Action Taken Mortgage Data, 2006-2008 ...................... 36
Figure 2-34 Summary Report Based on Action Taken Mortgage Data, 2008 ............................... 37
Figure 2-35 Denials by Race and Ethnicity, 2007-2008 ................................................................. 38
Figure 2-36 Denials by Income, 2008 ............................................................................................ 38
Figure 2-37 Denials by Race for Lower Income Applicants, 2008 ................................................. 39
Figure 2-38 Denials by Race for Upper Income Applicants, 2008 ................................................. 39
Figure 2-39 High-Cost Lending by Race/Ethnicity and Income, 2006-2008 .................................. 41
Figure 2-40 Comparison of Classes Protected by Federal, State and Local Statute .................... 43
Figure 2-41 Bases for Fair Housing Complaints Filed with HUD, 1996-2010 ................................ 44
Figure 2-42 Resolution of Fair Housing Complaints Filed with HUD, 1996-2010 .......................... 44

February 2012 Page 3
Figure 8-1 Percent of Transit-Dependent Households, 2000......................................................... 46
Figure 8-2 Percent of Transit-Dependent Households by Race, 2000 .......................................... 47
Figure 8-3 Mode of Transportation to Work, 2000 ......................................................................... 47
Figure 8-4 Estimated Taxes per $100,000 AV, FY 2009-10 .......................................................... 51
Figure 8-5 Anne Arundel County Property Levies, FY 2009-10 ..................................................... 52
Figure 8-6 Baltimore City Property Levies, FY 2009-10 ................................................................. 53
Figure 8-7 Harford County Property Levies, FY 2009-10 ............................................................... 54
Figure 8-8 Howard County Property Levies, FY 2009-10 .............................................................. 55

February 2012 Page 4
2. REGIONAL PROFILE
I. Introduction
More than 15 years ago, pre-eminent urban scholar David Rusk declared that the City of Baltimore, programmed by patterns of metropolitan development to house a disproportionate share of the region’s poor Blacks, was on a path of inexorable decline.1 The extreme concentration of minority poor, Rusk argued, isolates the City socially and economically from surrounding counties and has ignited “social dynamite” – a combination of ills such as high crime rates, poor education, family disintegration and dependence on welfare – that distributes fallout well beyond City borders.
The notion that urban problems belong to the City alone is outmoded. Baltimore City is the economic, cultural and functional epicenter of the metropolitan region built to surround it. For that reason, any condition that renders the City less competitive creates a drag on the viability of surrounding communities. Reinforcing the theoretical prospect that the fates of suburban counties are inextricably bound with the fate of their urban core is the very concrete fact that traditionally urban problems have begun to impact the older, more densely populated areas of the suburbs. The Greater Baltimore Committee noted in 1997 that “we can readily see that [such areas] are facing social and economic problems that we formerly associated with city neighborhoods.”2 This is demonstrated throughout the demographic and economic analysis provided in this document, in which foreclosure, vacancy and blight have encroached increasingly upon inner-ring suburban communities.
Local government boundaries are transcended by many issues of planning and community development – housing market trends, transportation networks, environmental concerns and the spread of poverty, to name a few. The metropolitan region has emerged as a more practical unit of measurement in handling these issues. Communities that understand themselves as partners in advancing the success of the entire region are better positioned for sustainable positive outcomes than communities that regard their neighbors as competitors. In regions where jurisdictions compete for revenue-generating high-value housing and commercial development and limit the type of sites that are less likely to bolster the municipal bottom line (for instance, affordable housing for lower-income populations with greater service needs), economic disparity across the region weakens the entire region.
Regional governance can be understood as a system built to respond to circumstantial change. It ranges in implementation from extremely informal exercises in intergovernmental cooperation to drastic border changes, such as annexation or
1 Baltimore Unbound: A Strategy for Regional Renewal. Johns Hopkins University Press. October 1, 1995. 2 Greater Baltimore Committee. “Promoting Regional Governance in the Baltimore, Maryland Area.” Regional Government Innovations. ed. Roger L. Kemp. McFarland, 2003. p. 240.
February 2012 Page 5
consolidation to achieve regional goals.3 Thus far, fair housing efforts in the Baltimore region can be characterized only as loosely cooperative. The City of Baltimore and the outlying counties of Anne Arundel, Baltimore, Harford and Howard have jointly completed plans to affirmatively further fair housing since the 1996 Regional Analysis of Impediments to Fair Housing Choice, but the implementation of fair housing activities has occurred on a fragmented basis, with each community working toward achieving its own set of goals. At this point, while major impediments continue to limit fair housing choice in the Baltimore metropolitan area, no system exists for the implementation of meaningful regional fair housing solutions.
Those may come in the final remedies of Thompson v. HUD, the landmark desegregation case to determine whether the U.S. Department of Housing and Urban Development acted unlawfully by failing to affirmatively desegregate Baltimore City public housing. In 2005, Federal District Judge Marvin J. Garbis found HUD liable for failing to implement a regional strategy for desegregation and the deconcentration of poverty in Baltimore, explaining that the City “should not be viewed as an island reservation for use as a container for all of the poor of a contiguous region.” Garbis’ decision emphasizes the need for regional solutions, concluding that the City of Baltimore and its housing authority did not have the option of investing resources to expand the supply of affordable housing units outside city limits. The next phase of the case involves the creation of a remedy that is acceptable to HUD, the plaintiffs and the court. Based on the 2005 findings of the case and expert testimony that has been presented since on the range of potential remedial actions, the court-imposed remedy is expected to introduce more heavily structured regional governance to housing-related activities in the Baltimore area.
In the absence of centralized control imposed by state or federal governing bodies, responsibility rests with each of the jurisdictions participating in the AI to devise and implement methods of collectively addressing patterns of racial and economic segregation.
3 In The Regional Governing of Metropolitan America (Westview Press, 2002), David Y. Miller defines four types of metropolitan regionalism along this scale: coordinating, administrative, fiscal and structural.

February 2012 Page 6
II. Regional Overview
This section of the AI presents a demographics overview of the Baltimore region. Trends in population, households, housing, income and employment are summarized for the region as a whole with comparisons made among the five AI jurisdictions – Anne Arundel County, Baltimore County, the City of Baltimore, Harford County and Howard County – where appropriate. Following this section are individual AIs for each jurisdiction, all of which include a list of impediments to fair housing choice and a fair housing action plan to be undertaken by each respective jurisdiction. A regional fair housing action plan, which addresses issues such as public transportation, housing accessibility and real estate advertising, is included at the end of the document. The list of regionally-based actions will require collaborative undertaking by all five jurisdictions.
III. Demographic Profile
a. Population Trends
The population across the five jurisdictions comprising the Baltimore region has increased steadily in recent decades, growing 17% between 1980 and 2008. The fastest growth occurred during the 1980s, when the region’s population increased 7.5%. Growth has slowed since then, with the regional population increasing only 3.5% between 2000 and 2008.
As shown in Figure 2-1, Howard County experienced the most rapid growth among AI jurisdictions, with a population more than doubling from 118,572 in 1980 to 247,995 in 2008. On the other hand, the City of Baltimore lost 150,000 residents (19%), the majority of whom were White. The City’s White population decreased 41.1% during this period. The City’s sustained and substantial loss in numbers, in light of population growth in all surrounding counties, illustrates the extent to which the region’s urban core has emptied into its suburbs.
White flight characterized the City’s population loss in the decades following 1950, when the White population fell by more than 435,000 while the Black population grew by 210,000.4 A central cause of White flight in the Baltimore region was the expansion of suburban living opportunities for those who could afford them, facilitated by the construction of new highways and the policies of the Federal Housing Administration (FHA) mortgage insurance program, which guaranteed home loans only in “low risk” areas, typically, low-density, predominantly White suburban neighborhoods. In recent years, this trend has stabilized, leaving behind in Baltimore what some researchers speculate is a core number of White residents who prefer urban living.5
4 Siegel, Eric. “A New Exodus.” The Baltimore Sun, 1/4/2010 5 Ibid.

February 2012 Page 7
Figure 2-1 Population Trends, 1980-2008
1980 1990 2000 2008
% Change
1990‐2008
Regional total 2,045,927 2,200,023 2,321,689 2,402,588 17.4%
Anne Arundel County (Urban)* 339,035 394,053 449,811 478,509 41.1%
Baltimore City 786,775 743,616 651,154 636,919 ‐19.0%
Baltimore County 655,615 692,134 754,292 798,814 21.8%
Harford County 145,930 182,892 218,590 240,351 64.7%
Howard County 118,572 187,328 247,842 247,995 109.2%
*Excludes the City of Annapolis
Source: US Census Bureau
Figure 2-2 Population Trends, 1980-2008
0
500,000
1,000,000
1,500,000
2,000,000
2,500,000
3,000,000
Regional total
Anne Arundel County
(Urban)*
Baltimore City
Baltimore County
Harford County
Howard County
1980
1990
2000
2008
The region has become increasingly diverse since 1990. Whereas the non-White population accounted for 30.3% of the population in 1990, by 2008 this had increased to 39.3%. The region’s overall White population decreased slightly during those years (3.1%), with losses in the City and Baltimore County balanced by gains totaling 14.4% across Anne Arundel, Harford and Howard counties.
Among non-White residents, Blacks continue to comprise the largest racial group. However, the largest population growth has been among Asian/Pacific Islanders and persons of all other races. The Asian/Pacific Islander increased by almost 60,000 residents, or 173.6%, and persons of all other races tripled from 24,920 to 78,809.
The Hispanic population experienced the most rapid growth of all minority groups from 1990 to 2008. In 1990, there were less than 25,000 Hispanic residents in the region, accounting for 1.1% of the total population. By 2008, this number had nearly quadrupled to 84,000, constituting 3.5% of the region’s population.

February 2012 Page 8
Figure 2-3
Population Trends by Race, 1990-2008
# % # % # %
Regional Total 2,200,023 100.0% 2,321,689 100.0% 2,420,588 100.0% 10.0%
White Population 1,534,233 69.7% 1,509,819 65.0% 1,487,074 61.4% ‐3.1%
Non‐White 665,790 30.3% 823,237 35.5% 950,528 39.3% 42.8%
Black 598,136 27.2% 679,813 29.3% 746,908 30.9% 24.9%
Asian/Pacific 33,942 1.5% 56,436 2.4% 92,880 3.8% 173.6%
All Other Races 24,920 1.1% 60,849 2.6% 78,809 3.3% 216.2%
Hispanic 23,255 1.1% 50,318 2.2% 83,969 3.5% 261.1%
Source: U.S. Census Bureau
1990 2000 2008% Change
1980‐2008
b. Areas of Racial and Ethnic Minority Concentration
This AI defines areas of racial or ethnic minority concentration as census tracts in which the percentage of a specific minority or ethnic group is 10 percentage points higher than across the jurisdiction overall. Within each of the five jurisdictions, the threshold for determining an area of concentration is different because the percentage of Blacks, Asians and Hispanics differs for each.
For example, areas of concentration of Black residents in Anne Arundel County include census tracts where the percentage of Blacks was 24.9% and higher, while in Baltimore City, the threshold is 71.7%. Figure 2-4 lists the thresholds for the primary minority groups in each of the five jurisdictions.
OBSERVATION: Since 1990, the non-White population across the Baltimore metropolitan region, defined as the City and the four counties covered by this report, has increased from 30.3% to 39.3% of the total population. Diversity has increased within the minority population, with the proportion of non-Black racial and ethnic minorities expanding steadily.

February 2012 Page 9
Figure 2-4 Areas of Concentration by Municipality, 2009
Black
Asian/Pacific
Islander Hispanic
% % %
Anne Arundel County (Urban)* 478,509 24.9% ‐‐‐ 14.7%
Baltimore City 636,919 71.7% 12.1% 12.6%
Baltimore County 789,814 35.1% 14.1% 13.3%
Harford County 240,351 21.9% ‐‐‐ 12.7%
Howard County 274,995 28.0% 22.4% 15.5%
*Excludes the City of Annapolis
Source: DemographicsNow
Census Tract
Total
Population
Areas of Concentration
Some census tracts in each jurisdiction qualified as areas of Black and/or Hispanic concentration. Three jurisdictions (Baltimore City and the counties of Baltimore and Howard) also had concentrations of Asian residents. The regional map on the following page depicts the locations of minority concentrations.
c. Residential Segregation Patterns
Residential segregation is a measure of the degree of separation of racial or ethnic groups living in a neighborhood or community. Typically, the pattern of residential segregation involves the existence of predominantly homogenous, White suburban communities and low-income minority inner-city neighborhoods. A potential impediment to fair housing is created where either latent factors, such as attitudes, or overt factors, such as real estate practices, limit the range of housing opportunities for minorities. A lack of racial or ethnic integration in a community creates other problems, such as reinforcing prejudicial attitudes and behaviors, narrowing opportunities for interaction, and reducing the degree to which community life is considered harmonious. Areas of extreme minority isolation often experience poverty and social problems at rates that are disproportionately high. Racial segregation has been linked to diminished employment prospects, poor educational attainment, increased infant and adult mortality rates and increased homicide rates.
The distribution of racial or ethnic groups across a geographic area can be analyzed using an index of dissimilarity. This method allows for comparisons between subpopulations, indicating how much one group is spatially separated from another within a community. The index of
OBSERVATION: Areas of racial and/or ethnic concentration occur in each entitlement jurisdiction. The highest number and proportion of concentrated tracts are found in the City of Baltimore.

LegendSurrounding Counties
County Boundaries
Census Tract Boundaries
Racially Impacted TractBlack Concentration
Asian Concentration
Ethnically Impacted TractHispanic Concentration
Regional Map of Areas of Concentration in Baltimore Region, 2010Regional Map of Areas of Concentration in Baltimore Region, 2010
Baltimore Regional Analysis of Impediments to Fair Housing ChoiceBaltimore Regional Analysis of Impediments to Fair Housing Choice
Baltimore
Baltimore City
Harford
Anne Arundel
Howard

February 2012 Page 10
dissimilarity is rated on a scale from 0 to 100, in which a score of 0 corresponds to perfect integration and a score of 100 represents total segregation.6 The index is typically interpreted as the percentage of the minority population (in this instance, the Black population) that would have to move in order for a community or neighborhood to achieve full integration. A dissimilarity index of less than 30 indicates a low degree of segregation, while values between 30 and 60 indicate moderate segregation, and values above 60 indicate high segregation.
Overall, the Baltimore region was moderately segregated in 2000. Howard County had the lowest dissimilarity index of 36.2. Anne Arundel and Harford Counties and the City of Baltimore were more segregated, with dissimilarity indices around 50. Baltimore County had the highest dissimilarity index of 64.9, making it highly segregated. According to this data, 64.9% of Blacks would have to move elsewhere within Baltimore County in order to achieve full integration.
Figure 2-5 Maryland Municipal Dissimilarity Index Rankings, 2000
1 Howard County 35,412 183,886 247,842 36.2
2 Anne Arundel County 65,280 397,893 489,656 47.6
3 Harford County 19,831 189,489 218,590 49.1
4 Baltimore city 417,231 206,445 651,154 49.3
5 Baltimore County 149,943 561,524 754,292 64.9
Dissimilarity
Index
Source: CensusScope & U.S. Census 2000
Rank City
Black
Population
White
Population
Total
Population
d. Persons with Limited English Proficiency
Persons with limited English proficiency (LEP), including immigrants, may encounter obstacles to fair housing by virtue of language and cultural barriers within their new environment. To assist these individuals, it is important that a community recognizes their presence and the potential for discrimination, whether intentional or inadvertent, and establishes policies to eliminate barriers.
6 The index of dissimilarity is a commonly used demographic tool for measuring inequality. For a given geographic area, the index is equal to 1/2 ∑ ABS [(b/B)-(A/a)], where b is the subgroup population of a census tract, B is the total subgroup population in a city, a is the majority population of a census tract, and A is the total majority population in the city. ABS refers to the absolute value of the calculation that follows.
OBSERVATION: Overall, the Baltimore region was moderately segregated in 2000. Among participating jurisdictions, Baltimore County was determined to be the most segregated, with a dissimilarity index of 64.9 among Black residents and White residents.

February 2012 Page 11
In 2008, the Census Bureau reported that 89,991 persons in the Baltimore region spoke English less than “very well,” representing 3.9% of the region’s total population. Howard County had the highest proportion of persons with LEP, with 7.2% of the County’s population speaking English less than “very well.”
Figure 2-6
Persons with LEP by Municipality, 2008 Number of Persons
with LEP % of Total Population
Regional total 89,991 3.9%
Anne Arundel County 14,210 3.0%
Baltimore City 18,691 3.1%
Baltimore County 34,271 4.6%
Harford County 4,524 2.0%
Howard County 18,295 7.2%
Source: 2006‐2008 American Community Survey (B16001)
Figure 2-16 shows the number of persons with LEP by language. In the Baltimore-Towson MSA, there were 32,804 Spanish-speakers who also spoke English less than “very well.” Additionally, there were a significant number of persons with LEP for the following language groups: Korean, Chinese, Russian, French, and Tagalog (spoken by persons from the Philippines).
Figure 2-7
Language Spoken at Home by Ability to Speak English, 2008
Language Group Number of LEP Persons
Spanish 32,804
Korean 9,713
Chinese 8,522
Russian 5,362
French 3,016
Tagalog 2,681
Source: 2006‐2008 American Community Survey (B16001)
Note: Data for Baltimore‐Townson Census Metropolitan
Statistical Area includes the five jursidictions plus
additional areas.
OBSERVATION: Across the region, there were more than 32,000 Spanish-speaking households that reported a limited ability to speak and understand English, in addition to other limited-English language groups of considerable size. Each jurisdiction is responsible to determine whether the language needs of its target population served are being met in the administration of government programs.

February 2012 Page 12
IV. Economic Profile
a. Race/Ethnicity and Income
Household income is one of several factors used to determine a household’s eligibility for a home mortgage loan. In 2008, median household income (MHI) for the Baltimore-Towson MSA was $66,122.7 As Figure 2-6 shows, MHI and poverty rates were highly variable in the region. Within the City of Baltimore, MHI was $39,083, less than half that of Howard and Anne Arundel counties. Additionally, the poverty rate in the City was four times as great as it was in those counties. Harford and Baltimore counties also had higher MHI and lower poverty rates than the City of Baltimore.
Figure 2-8
Median Household Income and Poverty Rates by Race/Ethnicity, 2008
Anne Arundel County $83,285 4.1% Harford County $77,085 5.6%
Whites $87,593 3.4% Whites $79,524 4.4%
Blacks $62,518 8.0% Blacks $62,763 13.0%
Asians $84,301 2.1% Asians* $82,448 ‐‐‐
Hispanics $50,156 9.6% Hispanics* $45,942 ‐‐‐
Baltimore City $39,083 19.6% Howard County $101,710 4.1%
Whites $53,886 13.3% Whites $109,478 3.1%
Blacks $32,969 22.9% Blacks $76,003 7.3%
Asians* $45,273 ‐‐‐ Asians $98,400 5.3%
Hispanics $34,583 18.3% Hispanics $80,221 8.3%
Baltimore County $63,128 8.3%
Whites $66,272 6.5%
Blacks $55,449 11.3%
Asians $64,802 11.4%
Hispanics $55,927 15.9%
*The poverty rates for Asians and/or Hispanics were not available
Poverty Rate
Median Household
Income Poverty Rate
Median Household
Income
Source: U.S. Census Bureau, 2008 American Community Survey (B19013, B19013A, B19013B, B19013D, B19013I, C17001, C17001A,
C17001B, C17001D, C17001I)
A review of median household income reveals a stark contrast among racial and ethnic groups across the Baltimore region. On average, the MHI of Black households in 2008 was more than $20,000 less than that of Whites. The disparity is greatest in Baltimore City, where MHI for Blacks is equivalent to only 61.2% of that for Whites. In Baltimore County, the disparity of earnings among Blacks and Whites was the smallest, with Blacks earning the equivalent of 83.7% MHI for Whites. Across the region, minorities were significantly more likely to live in poverty.
Figure 2-9 details the income distribution of White and Black households throughout the region. Sample sizes for Asians and Hispanics were too small to analyze in several jurisdictions. Black households were relatively evenly dispersed across different income levels, and as many households
7 The Census-designated Metropolitan Statistical Area includes the five jurisdictions in the study area as well as Carroll County, Queen Anne’s County and the City of Towson.

February 2012 Page 13
earned less than $25,000 annually as those that earned more than $75,000. White households, on the other hand, were far more likely to fall in the highest income bracket. Half of White households earned more than $75,000, compared to the 13.5% of White households that earned less than $25,000.
Figure 2-9
Household Income Distribution by Race, 2008
# % # % # % # %
Regional Total 912,594 158,668 17.4% 193,626 21.2% 166,170 18.2% 392,708 43.0%
White Households 595,904 80,545 13.5% 108,466 18.2% 106,117 17.8% 300,776 50.5%
Black Households 263,969 70,078 26.5% 72,951 27.6% 50,597 19.2% 69,305 26.3%
$75,000 and higher
Note: The sample sizes for Asians and Hispanics were not large enough in all five jurisdictions to calculate a regional total
Source: U.S. Census Bureau, 2008 American Community Survey (C19001, B19001A, B19001B, B19001D, B19001I)
Total
$0 to $24,999 $25,000 to $49,999 $50,000 to $74,999
Figure 2-10 Household Income Distribution by Race, 2008
0%
10%
20%
30%
40%
50%
60%
$0 to $24,999
$25,000 to $49,999
$50,000 to $74,999
$75,000 and higher
White Households
Black Households
OBSERVATION: The median household income for Blacks and Hispanics in each participating jurisdiction is significantly lower than for Whites and Asians. This situation limits housing choice for Blacks and Hispanics.

February 2012 Page 14
b. Concentrations of LMI Persons
The CDBG program includes a statutory requirement that at least 70% of the funds invested benefit low- and moderate-income (LMI) persons. As a result, HUD provides the percentage of LMI persons in each census block group for entitlement communities such as the five covered in this AI. The following table shows the total number of LMI persons in the region and in each of the five jurisdictions. Reflecting the MHI trends discussed earlier, the percentage of LMI persons was highest in the City of Baltimore. In 2009, almost two-thirds of the City’s residents were considered LMI. This was about twice as great as the proportion of LMI persons in the four counties. The concentration of LMI persons was lowest in Howard County, where one in five persons was considered LMI.
Figure 2-11
Low and Moderate Income Persons, 2009
# Universe %
Regional total 939,013 2,261,896 41.51%
Anne Arundel County (Urban)* 127,281 438,656 29.02%
Baltimore City 408,229 625,380 65.28%
Baltimore County 281,705 736,626 38.24%
Harford County 71,019 217,027 32.72%
Howard County 50,779 244,207 20.79%
*Excludes the City of Annapolis
City
Low and Moderate Income Persons
Source: U. S. Dept. of Housing & Urban Development, 2009
c. Disability and Income
The Census Bureau reports disability status for non-institutionalized disabled persons age 5 and over. As defined by the Census Bureau, a disability is a long-lasting physical, mental or emotional condition that can make it difficult for a person to do activities such as walking, climbing stairs, dressing, bathing, learning or remembering. This condition can also impede a person from being able to go outside the home alone or to work at a job or business.
The Fair Housing Act prohibits discrimination based on physical, mental, or emotional handicap, provided reasonable accommodation can be made. Reasonable accommodation may include changes to address the needs of disabled persons, including adaptive structural (e.g., constructing an
OBSERVATION: As of 2010, 41.5% of households across the region qualified as low- and moderate-income by HUD standards. The location of LMI areas is generally highly correlated with areas of racial concentration.

February 2012 Page 15
entrance ramp) or administrative changes (e.g., permitting the use of a service animal).
In the Baltimore region, 407,600 persons ages five and older reported a disability in 2000, representing 19.4% of the population. In Baltimore City, 27.5% of persons reported a disability.
Figure 2-12
Persons with Disabilities, 2000
Civilian non‐institutionalized
population ages 5 and up
With at least one
type of disability %
Regional total 2,106,319 407,600 19.4%
Anne Arundel County (Urban)* 402,345 61,828 15.4%
Baltimore City 584,903 160,906 27.5%
Baltimore County 693,088 126,903 18.3%
Harford County 199,764 31,479 15.8%
Howard County 226,219 26,484 11.7%
*Excludes the City of Annapolis
Source: U.S. Census Bureau, 2000 Census SF‐3 (PCT34)
According to the National Organization on Disabilities, a significant income gap exists for persons with disabilities, given their lower rate of employment. In the Baltimore region, persons with disabilities were much more likely than persons without disabilities to live in poverty. In 2000, among all persons with a disability in the Baltimore region, 16.7% lived below the level of poverty, compared to 8.4% of persons without a disability.
Figure 2-13 Poverty Rates by Disability, 2000
With Disabilites
Without
Disabilites
Regional total 16.7% 8.4%
Anne Arundel County (Urban)* 8.2% 3.8%
Baltimore City 26.9% 20.3%
Baltimore County 10.4% 5.4%
Harford County 9.1% 4.0%
Howard County 9.8% 3.1%
*Excludes the City of Annapolis
% Living in Poverty
Source: U.S. Census Bureau, 2000 Census SF‐3 (PCT34)
OBSERVATION: The percentage of persons with a disability living in poverty was higher than that for persons without a disability. Across the region, 16.7% of persons with disabilities were living in poverty, compared to 8.4% of persons without a disability.

February 2012 Page 16
d. Familial Status and Income
The Census Bureau divides households into family and non-family households. Family households are married couple families with or without children, single-parent families and other families made up of related persons. Non-family households are either single persons living alone, or two or more non-related persons living together.
Women have protection under Title VIII of the Civil Rights Act of 1968 against discrimination in housing. Protection for families with children was added in the 1988 amendments to Title VIII. Except in limited circumstances involving elderly housing and owner-occupied buildings of one to four units, it is unlawful to refuse to rent or sell to families with children.
The total number of households in the region increased 8.3% between 1990 and 2008, while family households increased at a slower rate of 1.8%. The number of female-headed households increased 4.6%, while the number of female-headed households with children decreased slightly. At the same time, married couple families remained relatively stable, while the number of married couples with children decreased 5%. Male-headed households with children increased at roughly the same rate as all households and comprised 1.9% of all households in 2008.
Figure 2-14 Female-Headed Households with Children, 1990-2008
# % # % # %
Regional Total Households 842,463 100.0% 892,708 100% 912,594 100%
Family Households 580,793 68.9% 596,357 66.8% 591,136 64.8%
Married‐couple family 418,705 49.7% 426,310 47.8% 418,125 45.8%
With Children 192,050 22.8% 195,645 21.9% 182,411 20.0%
Without Children 226,655 26.9% 230,665 25.8% 219,892 24.1%
Female‐Headed Households 129,834 15.4% 133,094 14.9% 135,844 14.9%
With Children 73,862 8.8% 74,305 8.3% 72,734 8.0%
Without Children 55,972 6.6% 58,789 6.6% 63,110 6.9%
Male‐Headed Household 32,254 3.8% 36,953 4.1% 37,367 4.1%
With Children 15,111 1.8% 17,948 2.0% 17,641 1.9%
Without Children 17,143 2.0% 19,005 2.1% 19,726 2.2%
Non‐family and 1‐person Households 261,670 31.1% 296,351 33.2% 321,458 35.2%
1990 2000 2008
Sources: U.S. Census Bureau, 1990 (SFT‐3, P019), Census 2000 (SF‐3, P10); 2008 American Community Survey (B11005)
Female-headed households with children often experience difficulty in obtaining housing, primarily as a result of lower incomes and the unwillingness of landlords to rent their units to families with children. In the Baltimore region in 2008, 22.8% of female-headed households with children were living in poverty, compared to 2.5% of married households

February 2012 Page 17
with children and 14.3% of male-headed households which children.8 Although females raising children comprised only 14.9% of the total number of families in the Baltimore, they accounted for 54% of all families living in poverty.
e. Ancestry and Income
It is illegal to refuse the right to housing based on place of birth or ancestry. Census data in 2008 on native and foreign-born populations reveal that 8% of residents of the Baltimore region were foreign-born. The highest concentrations of foreign-born residents were in Baltimore County and Howard County, where 9.3% and 16.1% of residents, respectively, were born outside of the U.S. Baltimore City and Harford County had the lowest proportions of foreign born residents, at 5.9% and 4.5%, respectively.
Figure 2-15 Foreign-Born Residents, 2008
% Foreign Born
Regional total 8.0%
Anne Arundel County (Urban)* 6.1%
Baltimore City 5.9%
Baltimore County 9.3%
Harford County 4.5%
Howard County 16.1%
*Excludes the City of Annapolis
Source: U.S. Census Bureau, 2008 American Community Survey
(C05002), 2006‐2008 American Community Survey (C05002) for
Urban County
Throughout the region, families with children who were living with at least one foreign-born parent were about as likely to be living below 200% of the poverty level as families with children of native parents. However, this varied throughout the region. In Harford and Howard Counties, families with at least one foreign-born parent were twice as likely to have incomes less than 200% of the poverty level, as seen in Figure 2-16. In Baltimore City, however, families with only native-born parents were more likely to fall into this lower income category.
8 U.S. Census Bureau, 2008 American Community Survey (C17010)
OBSERVATION: Female-headed households with children accounted for more than half of families living below the level of poverty across the region in 2000, despite representing less than 15% of all households.

February 2012 Page 18
Figure 2-16
Families with Children with Incomes less than 200% Poverty, 2008
One or more Foreign‐
Born Parents Only Native Parents
Regional total 26.7% 26.8%
Anne Arundel County (Urban)* 18.4% 14.5%
Baltimore City 47.1% 53.1%
Baltimore County 27.9% 23.3%
Harford County 30.0% 16.2%
Howard County 14.4% 7.0%
*Excludes the City of Annapolis
Source: U.S. Census Bureau, 2008 American Community Survey (C05010), 2006‐2008
American Community Survey (C05010) for Urban County
% Living under 200% of Poverty Level
f. Protected Class Status and Unemployment
Overall unemployment in the Baltimore region was 5.7% in 2008, which was roughly on par with Maryland’s statewide rate of 5.4%. Blacks in the region were more than twice as likely as Whites to be unemployed, with rates of 9.8% and 4%, respectively. Blacks in the Baltimore region also had a higher unemployment rate than Blacks throughout Maryland.
Figure 2-17
Civilian Labor Force, 2008
Maryland Total %
Baltimore
Regional Total %
Total Civilian Labor Force (CLF) 3,118,499 100% 1,331,480 100%
Employed 2,951,517 94.6% 1,255,804 94.3%
Unemployed 166,982 5.4% 75,676 5.7%
Male CLF 1,583,022 100.0% 670,265 100.0%
Employed 1,495,322 94.5% 628,393 93.8%
Unemployed 87,700 5.5% 41,872 6.2%
Female CLF 1,535,477 100.0% 661,215 100.0%
Employed 1,456,195 94.8% 627,411 94.9%
Unemployed 79,282 5.2% 33,804 5.1%
White CLF 1,920,280 100% 851,903 100%
Employed 1,844,199 96.0% 818,023 96.0%
Unemployed 76,081 4.0% 33,880 4.0%
Black CLF 902,248 100% 391,562 100%
Employed 826,754 91.6% 353,281 90.2%
Unemployed 75,494 8.4% 38,281 9.8%
Note: Sample sizes for Asians and Hispanics were not large enough in all five jurisdictions to
calculate a regional total.
Source: U.S. Census Bureau, 2008 American Community Survey (C23001, C23002A, C23002B,
C23002D, C23002I)

February 2012 Page 19
V. Housing Market Profile
a. Housing Inventory
More than 150,000 housing units were added to the housing inventory in the Baltimore region between 1990 and 2009, representing a growth rate of 17.4%. About two-thirds of this growth was in Anne Arundel and Baltimore counties. Both counties experienced a housing stock increase of nearly 50,000 units. Harford and Howard counties had the largest proportional increase in housing stock, reflecting the population growth in those areas during this period.
Baltimore City was the only jurisdiction in which a net loss in housing units occurred. Between 1990 and 2009, the City’s inventory fell by nearly 10,000 units.

February 2012 Page 20
Figure 2-18 Trends in Total Housing Units, 1990-2009
# % # % # % # %
Regional total 864,508 100.0% 958,806 100.0% 1,014,996 100.0% 150,488 17.4%
Anne Arundel County (Urban)* 140,223 16.2% 168,631 17.6% 185,256 18.3% 45,033 32.1%
Baltimore City 303,704 35.1% 300,477 31.3% 293,850 29.0% ‐9,854 ‐3.2%
Baltimore County 281,552 32.6% 313,734 32.7% 330,663 32.6% 49,111 17.4%
Harford County 66,446 7.7% 83,146 8.7% 98,189 9.7% 31,743 47.8%
Howard County 72,583 8.4% 92,818 9.7% 107,038 10.5% 34,455 47.5%
*Excludes the City of Annapolis
Source: DemographicsNow
Change 1990‐20091990 2000 2009
b. Types of Housing Units
Of the 951,331 structures in the Baltimore region in 2000, 72.4% were single-family units and 26.3% were multi-family units. Mobile homes accounted for 1.2% of the region’s housing stock. Anne Arundel County had the highest proportion of single-family units, which comprised 82.7% of all of its housing.
Baltimore City had the highest number of multi-family structures, as they constituted 34.8% of all City housing stock. Among all the multi-family units in the Baltimore region, 41.7% were located within the City of Baltimore.
Figure 2-19
Trends in Housing Units in Structures, 2000
Regional total 951,331 688,964 63,524 54,086 74,778 58,279 250,667 11,474 226
Anne Arundel County (Urban)* 161,156 133,345 3,553 5,391 11,502 3,528 23,974 3,768 69
Baltimore City 300,477 195,729 43,409 17,449 12,688 30,985 104,531 162 55
Baltimore County 313,734 224,283 12,435 21,849 35,257 17,341 86,882 2,523 46
Harford County 83,146 66,294 2,600 3,498 5,592 1,926 13,616 3,218 18
Howard County 92,818 69,313 1,527 5,899 9,739 4,499 21,664 1,803 38
*Excludes the City of Annapolis
Total
Source: U.S. Census Bureau, Census 2000 (SF 3, H30)
Total Units
Single‐family
units
(detached
and
Multi‐family units
Mobile
home
Boat, RV,
van, etc2 to 4 5 to 9 10 to 19 20 or more
OBSERVATION: There has been a 17.4% net gain in housing units across the region since 1990. The strongest gains were reported in Howard County and Harford County, which experienced increases nearing 50%. While the number of units in each county grew, the City lost nearly 10,000 units, or 3.2% of its total inventory.

February 2012 Page 21
c. Foreclosure Trends
Foreclosure activity is related to fair housing to the extent that it is disproportionately dispersed, both geographically and among members of the protected classes. Concentrated foreclosures and residential vacancy threaten the viability of neighborhoods as well as the ability of families to maintain housing and build wealth. The propensity of lenders to target high-risk borrowers for expensive loans has had a larger impact on minority households than on White households in the Baltimore region. Households carrying heavy cost burdens are prime candidates for mortgage delinquency and foreclosure. Foreclosure also places additional stress on the rental housing market, as displaced homeowners seek affordable apartments.
According to HUD NSP foreclosure estimates released in October 2008, Maryland had an overall foreclosure rate of 3.3%.9 On the whole, the Baltimore region had a slightly lower foreclosure rate of 3%. Baltimore City had the highest foreclosure rate, 5.4%, followed by Baltimore County, which had a rate of 3.2%. In Howard County, the foreclosure rate was only 1.4%.
Figure 2-20 Estimated Residential Foreclosure Rankings, January 2007 – June 2008
Regional Total 487,134 14,500 3.0%
Anne Arundel County (Urban)* 125,833 2,732 2.2%
Baltimore City 81,414 4,376 5.4%
Baltimore County 158,374 5,133 3.2%
Harford County 57,211 1,385 2.4%
Howard County 64,302 874 1.4%
Maryland 1,288,710 42,381 3.3%
Source: HUD NSP Estimates, released October 2008
# Mortgages # Foreclosures % Foreclosure
* Excludes the City of Annapolis
9 HUD NSP estimates data, covering the period between January 2007 and June 2008, is not an exact count, but distributes the results of a national survey across geographic areas according to a model considering rates of metropolitan area home value decline, unemployment and high-cost mortgages.
OBSERVATION: Of all multi-family housing units across the region, 41.7% were located in the City of Baltimore. More than half of the largest multi-unit structures, consisting of 20 or more dwellings, were located in the City.
OBSERVATION: During the period of foreclosure actions studied, the Baltimore region experienced a foreclosure rate of 3%, slightly lower than the statewide rate of 3.3%. The highest rate of 5.4% occurred in Baltimore City, while the lowest, 1.4%, occurred in Howard County.

February 2012 Page 22
d. Protected Class Status and Homeownership
The value in home ownership lies in the accumulation of wealth as the owner’s share of equity increases with the property’s value. Paying a monthly mortgage instead of rent is an investment in an asset that is likely to appreciate. According to one study, “a family that puts 5 percent down to buy a house will earn a 100% return on the investment every time the house appreciates 5 percent.”10
In 2000, Whites had the highest rate of home ownership in the region at 74.5%. Asians had the second-highest rate at 54.7%. Blacks and Hispanics had much lower rates of 47.2% and 48%, respectively.
Figure 2-21 details the home ownership rates by race and ethnicity throughout the region. Home ownership varied across the jurisdictions. For example, in Baltimore City, 29.8% of Asians owned their home, compared to 72.5% in Harford County. However, in all of the jurisdictions, home ownership was highest among White residents. Several factors impact the rate of home ownership in a jurisdiction, including income, the size of the owner housing stock compared to the rental housing stock, the cost of housing and the presence of transient populations such as college students and military households.
Figure 2-21 Home Ownership by Race and Ethnicity of Householder, 2000
# % # % # % # %
Regional total 452,249 74.5% 115,706 47.2% 11,218 54.7% 6,521 48.0%
Anne Arundel County (Urban)* 113,398 81.0% 9,998 57.6% 1,737 59.4% 1,576 60.2%
Baltimore City 58,342 61.0% 67,789 44.5% 1,234 29.8% 1,250 34.5%
Baltimore County 169,511 73.2% 26,718 48.1% 3,980 54.1% 1,950 47.8%
Harford County 56,974 81.0% 3,778 53.6% 529 72.5% 588 50.3%
Howard County 54,024 78.2% 7,423 57.0% 3,738 66.8% 1,157 55.2%
*Excludes the City of Annapolis
Source: U.S. Census Bureau, Census 2000 (SF 3, H11, H12)
White Black Asian Hispanic
10 Kathleen C. Engel and Patricia A. McCoy, “From Credit Denial to Predatory Lending: The Challenge of Sustaining Minority Homeownership,” in Segregation: The Rising Costs for America, edited by James H. Carr and Nandinee K. Kutty (New York: Routledge 2008) p 82.
OBSERVATION: Blacks and Hispanics are more likely to be renters than to own homes across the Baltimore region.

February 2012 Page 23
e. The Tendency of the Protected Classes to Live in Larger Households
Larger families may be at risk for housing discrimination on the basis of race or the presence of children (familial status). A larger household, whether or not children are present, can raise fair housing concerns. If a jurisdiction has policies or programs that restrict the number of persons that can live together in a single housing unit, and members of the protected classes need more bedrooms to accommodate their larger household, a fair housing concern exists because restrictions on the size of the unit have a negative impact on members of the protected classes.
In the Baltimore region, minorities were more likely than Whites to live in families with three or more persons. Hispanics households had the highest proportion of large families, followed by Asian and Black households. Across the five AI jurisdictions, Baltimore County had the lowest proportion of larger families for all racial and ethnic groups.
Figure 2-22
Families with Three or More Persons, 2000
Regional total 57.2% 67.2% 71.8% 75.8%
Anne Arundel County (Urban)* 59.4% 69.7% 75.7% 78.9%
Baltimore City 51.5% 67.4% 56.2% 73.2%
Baltimore County 36.6% 46.1% 42.4% 49.2%
Harford County 61.2% 67.3% 69.5% 81.6%
Howard County 61.8% 66.2% 75.8% 80.2%
Source: U.S. Census Bureau, Census 2000 (SF 4, PCT17)
*Excludes the City of Annapolis
Hispanic
Families with Three or More Persons
White Black Asian
To adequately house larger families, a sufficient supply of larger dwelling units consisting of three or more bedrooms is necessary. Across the Baltimore region, 25.7% of the rental housing stock contained three or more bedrooms, compared to 82% of the owner housing stock. By jurisdiction, the inventory of larger rental units varied. Anne Arundel County had the highest proportion of three-bedroom rental units (37.7%), which was twice that of Baltimore County (18.5%).

February 2012 Page 24
Figure 2-23 Housing Units by Number of Bedrooms, 2000
Total
3 or more
bedrooms % of Total Total
3 or more
bedrooms % of Total
Regional total 302,987 77,874 25.7% 587,960 482,017 82.0%
Anne Arundel County (Urban)* 36,390 13,730 37.7% 126,974 106,695 84.0%
Baltimore City 128,117 34,319 26.8% 129,879 98,408 75.8%
Baltimore County 97,303 17,995 18.5% 202,574 165,308 81.6%
Harford County 17,548 5,764 32.8% 62,119 52,942 85.2%
Howard County 23,629 6,066 25.7% 66,414 58,664 88.3%
*Excludes City of Annapolis
Source: U.S. Census Bureau, Census 2000 (SF 3, H42)
Race
Renter Units Owner Units
Housing Units by Number of Bedrooms
f. Cost of Housing
Increasing housing costs are not a direct form of housing discrimination. However, a lack of affordable housing does constrain housing choice. Residents may be limited to a smaller selection of neighborhoods because of a lack of affordable housing in those areas.
1. Rental Housing The median housing value in the Baltimore-Towson MSA increased 78.9% between 1990 and 2008, after adjusting for inflation.11 Median gross rent increased 19.2% during the same period. By comparison, real household income increased only 4.2%.
11 Housing value is the Census respondent’s estimate of how much the property (house and lot, mobile home and lot, or condominium unit) would sell for if it were for sale. This differs from the housing sales price which is the actual price that the house sold for.
OBSERVATION: Across the region, only 25.7% of renter-occupied housing stock in 2009 contained three or more bedrooms, compared to 82% of the owner-occupied housing stock. A recent rise in non-family and one-person households indicates an increased general demand for smaller units. However, participating jurisdictions must continue to monitor the needs of minority renters, who are more likely to live in families with four or more residents.

February 2012 Page 25
Figure 2-24 Trends in Housing Value, Rent and Income, 1990-2008*
1990 2000 2008
Change
1990‐2008
Actual Dollars $100,000 $134,900 $310,600 210.6%
2008 Dollars $173,631 $174,336 $310,600 78.9%
Actual Dollars $490 $626 $1,014 106.9%
2008 Dollars $851 $809 $1,014 19.2%
Actual Dollars $36,550 $49,938 $66,122 80.9%
2008 Dollars $63,462 $64,537 $66,122 4.2%
*Data only available for Baltimore MSA. The MSA is the Census Metropolitan
Statistical Area, and includes the five jursidictions plus additional
municipalities in the Greater Baltimore Region.
Sources: U.S. Census Bureau, 1990 Census (STF3‐H061A, H043A, P080A),
Census 2000 (SF3‐H76, H63, P53), 2008 American Community Survey (B25077,
B25064, B19013); Calculations by Mullin & Lonergan Associates, Inc.
Median Housing Value
Median Gross Rent
Median Household Income
The affordability problem posed by real household income failing to keep pace with median rents has been compounded by a loss of affordable rental units across the region. Between 2000 and 2008, the number of affordable rental units renting for less than $500 per month decreased by 33,443 units, or 69% of all units in that price range. At the same time, the number of higher-rent units ($1,000 per month or higher) increased 338.5%, from 32,130 in 2000 to 140,882 in 2008. Most of this increase was in Baltimore City and Baltimore County. Over 27,000 high-rent units were added to the housing stock in Baltimore City and 45,000 in Baltimore County. These two jurisdictions also experienced the largest declines in affordable units renting for $500 or less.
Figure 2-25
Loss of Affordable Rental Housing Units, 2000-2008
2000 2008
% Change
2000‐2008 2000 2008
Change
2000‐2008
Regional total 107,995 33,443 ‐69.0% 32,130 140,882 338.5%
Anne Arundel County (Urban)* 3,442 1,291 ‐62.5% 8,168 31,392 284.3%
Baltimore City 62,695 23,893 ‐61.9% 5,456 33,141 507.4%
Baltimore County 36,402 5,678 ‐84.4% 9,458 54,475 476.0%
Harford County 3,675 1,484 ‐59.6% 1,361 8,980 559.8%
Howard County 1,781 1,097 ‐38.4% 7,687 12,894 67.7%
Units Renting for less than $500 Units Renting for more than $1,000
*Excludes the City of Annapolis
Source: U.S. Census Bureau, Census 2000, SF‐3 (H52); 2008 American Community Survey (B25063)

February 2012 Page 26
The National Low Income Housing Coalition provides annual information on the Fair Market Rent (FMR) and affordability of rental housing in counties and cities in the U.S. for 2009. In the Baltimore-Towson MSA, the FMRfor a two-bedroom apartment is $1,203. In order to afford this level of rent and utilities, without paying more than 30% of income on housing, a household must earn $4,010 monthly or $48,120 annually. Assuming a 40-hour work week, 52 weeks per year, this level of income translates into a housing wage of $23.13.
In the Baltimore-Towson MSA, a minimum wage worker earns an hourly wage of $7.25. In order to afford the FMR for a two-bedroom apartment, a minimum wage earner must work 128 hours per week, 52 weeks per year. Or, a household must include 3.2 minimum wage earners working 40 hours per week year-round in order to make the two-bedroom FMR affordable.
In the Baltimore-Towson MSA, the estimated average wage for a renter is $14.79 an hour. In order to afford the FMR for a two-bedroom apartment at this wage, a renter must work 63 hours per week, 52 weeks per year. Or, working 40 hours per week year-round, a household must include 1.6 workers earning the average renter wage in order to make the two-bedroom FMR affordable.
Monthly Supplemental Security Income (SSI) payments for an individual are $674 in the Baltimore-Towson MSA. If SSI represents an individual's sole source of income, $202 in monthly rent is affordable, while the FMR for a one-bedroom is $1,002.
OBSERVATION: It is becoming more expensive to rent an apartment in the Baltimore region. Between 2000 and 2008, the number of units renting for less than $500/month declined by more than 74,552 (69%), while units renting for $1,000/month or more increased by more than 108,752 (338.5%). The decrease represents both the physical loss of units from the inventory and cases in which the demand for units has caused an increase in monthly rental rates.
OBSERVATION: While the median gross rent in the Baltimore-Towson MSA increased an inflation-adjusted 19.2% between 1990 and 2008 and median housing value jumped by 78.9%, the area’s real household income increased only 4.2%.
OBSERVATION: Minimum-wage earners and single-wage-earning households cannot afford a housing unit renting for the HUD fair market rent. Minorities and female-headed households are disproportionately impacted due to their lower incomes.

February 2012 Page 27
2. Sales Housing The housing market in the Baltimore region has slowed in activity since 2006, coinciding with the beginning of the national housing slump. As of December 2010, the number of units sold was 19,990, almost half of the number sold during 2006. During the same period, the average length of time a house remained on the market nearly doubled from 59 days to 103 days. Median sales price throughout the region dropped from a peak of $264,200 in 2007 to $235,150 in 2010.
Figure 2-26
Housing Market Sales Trends, 2006-2010
2006 2007 2008 2009 2010*
Number of units sold 35,834 29,384 21,396 22,241 19,900
Average No. Days on Market 59 90 119 120 103
Median Sale Price $257,300 $264,200 $256,600 $236,200 $235,150
Average Sale Price as % of Average List Price 95.5% 94.3% 91.1% 89.8% 91.5%
*Includes sales closed through November 2010
Source: Real Estate Business Intelligence; Calculations by Mullin & Lonergan Associates
Single‐Family Properties
Figure 2-27 Housing Market Sales Trends, 2006-2010
$220,000
$225,000
$230,000
$235,000
$240,000
$245,000
$250,000
$255,000
$260,000
$265,000
$270,000
0
5,000
10,000
15,000
20,000
25,000
30,000
35,000
40,000
2006 2007 2008 2009 2010
Number of units sold
Median Sale Price
The availability of affordable sales units differs across the geographic areas. On the whole, 6.7% of units sold across the region in 2009 were priced less than $100,000. However, in Baltimore City, 28.8% of units sold were in this price range, compared to only 0.2% of units (a total of only four units) sold in Howard County. On the other end of the spectrum, within Baltimore City, units selling for more than $500,000 comprised 3.4% of the sales market. By comparison, these more expensive homes accounted for 16.9% of units sold in Anne Arundel

February 2012 Page 28
County and 28% in Howard County. Therefore, lower-income households are often priced out of the sales market in the suburban counties surrounding Baltimore City, in particular Anne Arundel and Howard Counties. This has contributed to a concentration of LMI homeowners within the City of Baltimore in addition to adding pressure to the market for affordable rental units in suburban areas. Each jurisdiction offers some form of assistance to lower-income homeowners through its federal entitlement programs, such as down payment and/or closing cost assistance or rehabilitation loans or grants, but such programs cannot entirely equalize the affordability of opportunity across communities so drastically different.
Figure 2-28
Number of Housing Units Sold by Price, 2009
#% of Total
sales#
% of Total
sales#
% of Total
sales#
% of Total
sales
Regional total 16,726 1,123 6.7% 6,371 38.1% 7,189 43.0% 2,043 12.2%
Anne Arundel County 4,283 51 1.2% 1,110 25.9% 2,399 56.0% 723 16.9%
Baltimore City 2,904 835 28.8% 1,404 48.3% 567 19.5% 98 3.4%
Baltimore County 5,097 169 3.3% 2,597 51.0% 1,900 37.3% 431 8.5%
Harford County 2,118 64 3.0% 989 46.7% 924 43.6% 141 6.7%
Howard County 2,324 4 0.2% 271 11.7% 1,399 60.2% 650 28.0%
Source: Real Estate Business Intelligence; Calculations by Mullin & Lonergan Associates
Total Sales
Less than $100,000 $100,000 to $249,999 $250,000 to $499,999 $500,000 or more
OBSERVATION: An excess of supply in the City of Baltimore has depressed housing values, making the City the lowest-priced area of the region in which to purchase a home. As the region’s Black households have a median income far lower than the median household income for Whites, Black residents are more likely to experience neighborhood limitations in locating an affordable home to purchase. This situation underscores the need to expand affordable housing opportunities in areas that do not have a concentration of minorities, the majority of which are located outside of Baltimore City.

February 2012 Page 29
3. Regional Inventory of Public and Publicly Assisted Housing
The majority of public housing units across the greater Baltimore region are located in racially concentrated lower-income neighborhoods, by virtue of their heavy concentration in areas of the City of Baltimore that are more than 70% Black.12 More than 90% of all public housing units across the region are owned and operated by the Housing Authority of the City of Baltimore (HABC), which houses more than 20,000 residents in 10,000 housing units. Additionally, Anne Arundel County operates 1,026 units; the City of Havre de Grace operates 60 units in Harford County; and Howard County operates 50 units. There are no public housing units anywhere in Baltimore County or outside of Havre de Grace in Harford County.
Federal funding became available in the late 1930s for local housing authorities to house lower-income populations, though the initiative to develop public housing programs was left to local governments. The City of Baltimore established HABC in 1937 to house its lowest-income residents. Other jurisdictions, such as Baltimore County, have maintained a deliberate decision not to build public housing.
The minimal availability of public housing available outside of the City burdens HABC disproportionately with the task of housing the poorest residents of the entire region, though the Authority’s shrinking inventory is increasingly insufficient to meet demand. In 1996, Congress repealed the federal requirement that demolished public housing units must be replaced on a one-for-one basis. Since that time, HABC’s inventory has dwindled precipitously. A 2007 report estimates that the number of occupied HABC units dropped 42% in 15 years, from 16,525 units in 1992 to 9,625 in 2007.13 HABC counted 10,322 occupied units in March 2010.
While the Authority’s practice of demolition without equal replacement has been attributed to its declining budget, HABC’s obligations resulting from recent lawsuits also impact its ability to replace housing. For instance, the outcome of the Bailey case required the Authority to divert more than $20 million from Replacement Housing Factor Funds and Section 8 voucher funds to retrofit 830 units for tenants with disabilities. Nonetheless, HABC’s elimination of dwelling units from the public housing stock has escalated since its implosion of high-rise projects, and that trend is especially problematic given the considerable growth of the population in need of affordable family housing.
12 The concentration of public housing units in neighborhoods of extreme concentrations of Black residents is demonstrated by the public housing map in the Baltimore City section of the AI. As of 2000, only 9.5% of family public housing units across the region were located in census tracts with poverty rates below 10%, according to testimony from plaintiff’s expert witness Jill Khadduri, former director of HUD’s Division of Policy Development, in Thompson v. HUD records. 13 Jacobsen, Joan. “The Dismantling of Public Housing.” The Abell Foundation, October 2007. Available online at abell.org/publications/detail.asp?ID=134

February 2012 Page 30
Public housing waiting lists across the region demonstrate overwhelming demand. According to recent estimates from each public housing authority with units in the five-jurisdiction area covered by the AI, there are currently 11,458 units suitable for occupancy.14 These units are roughly 97% occupied, and an additional 20,086 families continue to wait for public housing. Thus the standing inventory can accommodate only about one-third of those in need. Most of the households on a waiting list (93.6%) are extremely low income, earning less than 30% of the area median family income, and nine of every 10 are racial or ethnic minorities. More than 3,600 households on waiting lists reported a disability.
Figure 2-29
Greater Baltimore Region Public Housing Waiting Lists, 2010
Anne Arundel County 1,026 4,192 3,853 3,044 341
City of Baltimore 10,322 15,193 14,463 14,550 3,232
Havre de Grace 60 353 201 257 20
Howard County 50 348 284 304 82
TOTAL 11,458 20,086 18,801 18,155 3,675
Disabled
Sources: Housing Commission of Anne Arundel County, Housing Authority of Baltimore City, Havre de Grace Housing
Authority, Howard County Housing Commission
Total PHA unitsTotal HHs on
Waiting List
Extremely Low
IncomeMinority
Privately owned housing units developed with public subsidy are more common across the Baltimore region. HUD’s Picture of Subsidized Housing dataset contains records on the number of subsidized units by type for 2000 and 2008. Comparisons between the two years are based on an assumption of consistent data collection and reporting methods. HUD’s records show that in 2008, there were 36,121 affordable rental units across the Baltimore region subsidized by Low-Income Housing Tax Credits (LIHTC), Section 236 funds, project-based Section 8 vouchers or other multifamily housing development programs. This represents a 19.8% regional increase in the availability of such units from 2000, when HUD reported 30,151. Among project types, Section 236 became less prevalent, as the number of units subsidized by this funding source dropped by 5,356, or 65%. At the same time, HUD reported substantial gains in LIHTC units
14 HABC has 1,235 additional units that are vacant and offline due to renovation, consent-decree-mandated alterations, modernization, disposition, demolition or approval for non-dwelling purposes.
OBSERVATION: The minimal availability of public housing available outside of the City burdens the Housing Authority of Baltimore City disproportionately with the task of housing the poorest residents of the entire region, though the Authority’s shrinking inventory is increasingly insufficient to meet demand.

February 2012 Page 31
(6,246, or 68.6%), project-based Section 8 units (3,502, or 39.1%) and affordable units financed by other sources (1,578, or 40.8%). Details appear in the following table.
Figure 2-30
Subsidized Housing by Type, 2000 and 2008
Si tes 140 193 37.9%
Units 9,100 15,346 68.6%
Si tes 45 19 ‐57.8%
Units 8,239 2,883 ‐65.0%
Si tes 102 99 ‐2.9%
Units 8,946 12,448 39.1%
Si tes 54 79 46.3%
Units 3,866 5,444 40.8%
Total Subsidized Units 30,151 36,121 19.8%
Project‐Based Section 8
Other Ass is ted Multi fami ly
Source: HUD Picture of Subsidized HousingNote: Some variation may exist in HUD classif ication of sites by funding type betw een years of study.
2000 2008 % Change
LIHTC
Section 236
The region’s subsidized private rental units are concentrated within the City of Baltimore, but not to the extent that the region’s public housing exists almost exclusively in the City. More than half of the region’s assisted private units are in the City, and the remaining 47% of units are distributed among the four outlying counties.
Figure 2-31
Distribution of Region’s Subsidized Private Housing by Jurisdiction, 2008
10%
53%19%
11%7%
Anne Arundel County
City of Baltimore
Baltimore County
Harford County
Howard County
Source: HUD Picture of Subsidized Housing

February 2012 Page 32
The number of privately owned assisted units across the Baltimore region is nearly three times as large as the number of public housing units. The availability of these affordable units and the recent increase in their supply create housing opportunities for lower-income households. However, these opportunities are, for the most part, limited to areas of poverty and minority concentration. Stakeholders interviewed during the preparation of the AI described housing development climates that discouraged the expansion of affordable multifamily rental developments into neighborhoods that are traditionally White and low-poverty.
For example, the majority of subsidized units in Harford County are located in or near Havre de Grace, Aberdeen, Magnolia, Joppa and Joppatowne, all of which qualify as areas of Black and/or LMI concentration. In the City of Baltimore, subsidized housing is concentrated in neighborhoods that are at least 70% Black and sparse in areas that are less than 15% Black, according to a scatter plot of HUD data that appears in the City’s section of the AI. Affordable development opportunities are limited in Baltimore County, where subsidized rental LIHTC housing projects are easily politically defeated due to the County’s requirement that developers gain approval from a County Council member prior to applying for financial assistance. The County has funded only two tax-credit projects, both of which involve the rehabilitation of existing buildings. In Anne Arundel County, subsidized housing is most commonly located in the minority-concentrated area surrounding Annapolis and Odenton. Likewise, in Howard County, assisted affordable units are focused in areas of racial concentration in the southern end of the County. Across all jurisdictions in the region, affordable housing for seniors or persons with disabilities was more likely to be located in non-impacted areas of opportunity than affordable housing for lower-income families.
OBSERVATION: Privately owned subsidized affordable units are concentrated in the City of Baltimore, where 53% of all such units across the region are located. In other jurisdictions, assisted housing is commonly located in areas of racial concentration.

February 2012 Page 33
4. Distribution of Section 8 Housing Choice Vouchers
In addition to public housing and privately owned subsidized housing, Section 8 Housing Choice Vouchers also provide affordable housing opportunities across the Baltimore region. In total, housing authorities across the region administer 23,901 Section 8 housing choice vouchers. In addition to those currently using vouchers, there are 49,086 households on voucher waiting lists, which suggests that the supply of vouchers can accommodate only about one-third of demand. It is worth noting that HABC’s waiting list has been closed to everyone except persons with disabilities since 2003 and closed entirely since 2008. If HABC’s list had continued to accumulate the names of everyone attempting to apply for a voucher within the last seven years, it would almost certainly be much longer. As it is, Baltimore County has the longest current waiting list at 20,197 households competing for 5,799 vouchers, a wait that will exceed seven years for the newest applicants.
The majority of households on the waiting list (87.1%) have incomes below 30% of the area median family income. More than three-quarters (78.2%) are of minority race or ethnicity, and more than one in five (21%) reported a disability.
Figure 2-32 Greater Baltimore Region Section 8 HCV Waiting Lists, 2010
Anne Arundel County 1,392 8,082 6,746 5,562 1,662
City of Baltimore 14,543 15,193* 14,463 14,550 3,232
Baltimore County 5,799 20,197 17,168 14,946 4,093
Harford County 1,094 2,424 1,967 1,343 579
Howard County 1,073 3,190 2,410 2,002 747
TOTAL 23,901 49,086 42,754 38,403 10,313
Sources: Housing Commission of Anne Arundel County, Housing Authority of Baltimore City, Baltimore County
Housing Office, Harford County Housing Agency, Howard County Housing Commission
* HABC's voucher waiting l i s t closed to everyone except persons with disabi l i ties in 2003, then to
everyone in 2008.
Total VouchersTotal HHs on
Waiting List
Extremely Low
IncomeMinority Disabled
Vouchers administered by HABC are subject to legal remedies and other program stipulations that carry regional significance. As a result of the consent decree following Bailey v. HABC, 850 tenant-based vouchers and 500 project-based vouchers were set aside for non-elderly persons with disabilities, as defined in the decree. HABC was required to offer these vouchers in order of application to eligible disabled persons on the waiting list who are participating in the Enhanced Leasing Assistance Program (ELAP) until the vouchers are exhausted. As vouchers expire, they are offered to the next eligible family. ELAP is administered by an outside
February 2012 Page 34
contractor to provide housing search assistance to non-elderly persons with disabilities.
Additionally, up to 500 vouchers are set aside for issuance to eligible chronically homeless households, as determined and referred by Baltimore Homeless Services. As part of the 10-Year Plan to End Homelessness, non-elderly persons with disabilities on the waiting list who are also chronically homeless and participate in ELAP may receive priority for the 1,350 Bailey set-aside vouchers over non-elderly persons who are not chronically homeless.
Finally, more than 1,700 voucher holders have leased a unit through the Baltimore Housing Mobility Program, a specialized, regional tenant-based voucher program in which participants receive mobility counseling and assistance in locating housing in non-impacted areas. This program developed in response to the partial consent decree resulting from Thompson v. HUD, in which HUD was accused of failing to affirmatively desegregate Baltimore City public housing.15
The map on the following page depicts the distribution of Section 8 vouchers per 1,000 households by census tract within each jurisdiction. Tracts with greater concentrations of voucher holders were more likely to be located in or near the region’s urban core, while tracts with no voucher holders among their residents were more likely to be located in the more sparsely developed suburban or rural areas of outlying counties.
15 The partial consent decree additionally required HABC to create 911 hard units of affordable housing in non-impacted areas. As of May 2010, in addition to HOPE VI developments, HABC had completed 214 partnership units, 40 scattered-site units and 10 other units, with an additional 89 near completion.
OBSERVATION: In total, housing authorities across the region administer 23,901 Section 8 housing choice vouchers. In addition to households currently using vouchers, there are 49,086 households on voucher waiting lists, which suggests that the supply of vouchers can accommodate only about one-third of demand. Housing mobility initiatives have leveraged vouchers as a means of mitigating segregation, but many voucher households continue to locate in neighborhoods of racial concentration, primarily in and around the region’s core.

Legend
Surrounding Counties
County Boundaries
Voucher Holders Per Every 1000 Households0.00
0.01 - 19.99
20.00 - 79.99
80.00 - 161.00
Regional Overview of Section 8 Voucher Holders Regional Overview of Section 8 Voucher Holders in Baltimore Region, 2010in Baltimore Region, 2010
Baltimore Regional Analysis of Impediments to Fair Housing ChoiceBaltimore Regional Analysis of Impediments to Fair Housing Choice
Baltimore
Baltimore City
Harford
Anne Arundel
Howard

February 2012 Page 35
VI. Home Mortgage Financing
a. Mortgage Lending Practices
Under the terms of the Financial Institutions Reform, Recovery, and Enforcement Act of 1989 (F.I.R.R.E.A.), any commercial lending institution that makes five or more home mortgage loans must report all residential loan activity to the Federal Reserve Bank under the terms of the Home Mortgage Disclosure Act (HMDA). The HMDA regulations require most institutions involved in lending to comply and report information on loans denied, withdrawn, or incomplete by race, sex, and income of the applicant. The information from the HMDA statements assists in determining whether financial institutions are serving the housing needs of their communities. The data also helps to identify possible discriminatory lending practices and patterns.
HMDA data for 2006 through 2008 was analyzed for the Baltimore region. Reviewing this data helps to determine the need to encourage area lenders, other business lenders and the community at large to actively promote existing programs and develop new programs to assist residents in securing home mortgage loans for home purchases. The data focus on the number of homeowner mortgage applications received by lenders for home purchase of one- to four-family dwellings and manufactured housing units in the region.
Figure 2-33 summarizes the trends in applications, denials, and originations across the region from 2006 to 2008.

February 2012 Page 36
Figure 2-33 Summary Report Based on Action Taken Mortgage Data, 2006-2008
# % # % # %
Applied for 77,398 100.0% 53,730 100.0% 31,940 100.0%
Black 21,802 28.2% 13,432 25.0% 6,803 21.3%
White 41,158 53.2% 30,512 56.8% 19,268 60.3%
Asian 4,091 5.3% 2,782 5.2% 1,701 5.3%
Hispanic* 4,961 6.4% 2,504 4.7% 927 2.9%
Other race 668 0.9% 441 0.8% 236 0.7%
No information/NA 9,679 12.5% 6,563 12.2% 3,932 12.3%
Originated 53,107 68.6% 36,362 67.7% 22,178 69.4%
Black 13,108 60.1% 7,584 56.5% 4,188 61.6%
White 31,120 75.6% 22,649 74.2% 14,336 74.4%
Asian 2,872 70.2% 1,935 69.6% 1,086 63.8%
Hispanic* 3,444 69.4% 1,593 63.6% 590 63.6%
Other race 408 61.1% 273 61.9% 158 66.9%
No information/NA 5,599 57.8% 3,921 59.7% 2,410 61.3%
Denied 10,508 13.6% 7,715 14.4% 3,896 12.2%
Black 4,489 20.6% 3,137 23.4% 1,345 19.8%
White 3,874 9.4% 3,034 9.9% 1,727 9.0%
Asian 490 12.0% 340 12.2% 245 14.4%
Hispanic* 798 16.1% 494 19.7% 151 16.3%
Other race 109 16.3% 87 19.7% 34 14.4%
No information/NA 1,546 16.0% 1,117 17.0% 545 13.9%
* Hispanic ethnicity is counted independently of race.
Source: Federal Financial Institutions Examination Council, 2006‐08
2006 2007 2008
Note: Data is for home purchase loans for owner‐occupied one‐to‐four family and manufactured units. Total
applications includes loans purchased by another institution. Other application outcomes include approved
but not accepted, withdrawn and incomplete.
Between 2006 and 2008, the region experienced a steep drop in the number of mortgage loan applications. This can be attributed primarily to stagnating home sales rates in the region that coincide with the national housing market crisis. Throughout the region, the number of loan applications dropped 58.7%. The applications for Blacks and Hispanics fell at even greater rates of 68.8% and 81.3%, respectively, suggesting that these protected classes became disproportionately less able to afford home ownership.
Over the course of the two years, the percentage of applications that resulted in loan originations increased slightly, a trend likely related to the decreasing number of total applications. Correspondingly, the number of overall application denials decreased between 2006 and 2008.
A more in-depth analysis of HMDA data for each City is included in Section 3 of each individual AI; however, a summary of the aggregate data for the region is included below.

February 2012 Page 37
Figure 2-34 provides the summary data for loan actions for the year 2008, the most recent year for which data is available.
Figure 2-34
Summary Report Based on Action Taken Mortgage Data, 2008
# % # % # % # % # %
Conventional 20,276 63.5% 13,469 66.4% 1,619 8.0% 2,615 12.9% 2,573 12.7%
FHA 9,904 31.0% 7,305 73.8% 344 3.5% 1,153 11.6% 1,102 11.1%
VA 1,754 5.5% 1,401 79.9% 51 2.9% 126 7.2% 176 10.0%
FSA/RHS 6 0.0% 3 50.0% 0 0.0% 2 33.3% 1 16.7%
One to four‐family unit 31,326 98.1% 22,001 70.2% 1,901 6.1% 3,590 11.5% 3,834 12.2%
Manufactured housing unit 614 1.9% 177 28.8% 113 18.4% 306 49.8% 18 2.9%
American Indian/Alaska Native 114 0.4% 73 64.0% 4 3.5% 20 17.5% 17 14.9%
Asian/Pacific Islander 1,701 5.3% 1,086 63.8% 128 7.5% 245 14.4% 242 14.2%
Black 6,803 21.3% 4,188 61.6% 369 5.4% 1,345 19.8% 901 13.2%
Hawaiian 122 0.4% 85 69.7% 5 4.1% 14 11.5% 18 14.8%
White 19,268 60.3% 14,336 74.4% 1,206 6.3% 1,727 9.0% 1,999 10.4%
No information/Not Applicable 3,932 12.3% 2,410 61.3% 302 7.7% 545 13.9% 675 17.2%
Hispanic** 927 2.9% 590 63.6% 72 7.8% 151 16.3% 114 12.3%
Male 18,893 59.2% 13,309 70.4% 1,195 6.3% 2,199 11.6% 2,190 11.6%
Female 10,996 34.4% 7,626 69.4% 652 5.9% 1,410 12.8% 1,308 11.9%
No information 2,051 6.4% 1,243 60.6% 167 8.1% 287 14.0% 354 17.3%
Total 31,940 100.0% 22,178 69.4% 2,014 6.3% 3,896 12.2% 3,852 12.1%
* Total applications do not include loans purchased by another institution.
** Hispanic ethnicity is counted independently of race.
Note: Percentages in the Approved, Approved Not Accepted, Denied, and Withdrawn/Incomplete categories are calculated for each line item with the corresponding Total
Applications figures. Percentages in the Total Applications categories are calculated from their respective total figures. There were no FSA/RHS loans in 2008.
Total
Applications*Originated Approved Not Accepted Denied
Withdrawn/
Incomplete
Loan Type
Loan Purpose: Home Purchase
Applicant Race
Applicant Sex
Source: Federal Financial Institutions Examination Council, 2008
i. Conventional Loans vs. Government-Backed Loans
Loan types in 2008 included conventional mortgage loans and a variety of government-backed loans, including FHA, VA, and FSA/RHS. Comparing these loan types helps to determine if the less stringent underwriting standards and lower down payment requirements of government-backed loans expand home ownership opportunities. In the Baltimore region, 36.5% (11,664) of the households that applied for a mortgage loan applied for a government-backed loan.
The denial rates for government-backed loans were lower than the denial rate for conventional loans.
The denial rate for FHA loans was 11.6%.
The denial rate for VA-guaranteed loans was 7.2%.
The denial rate for conventional loans was 12.9%.
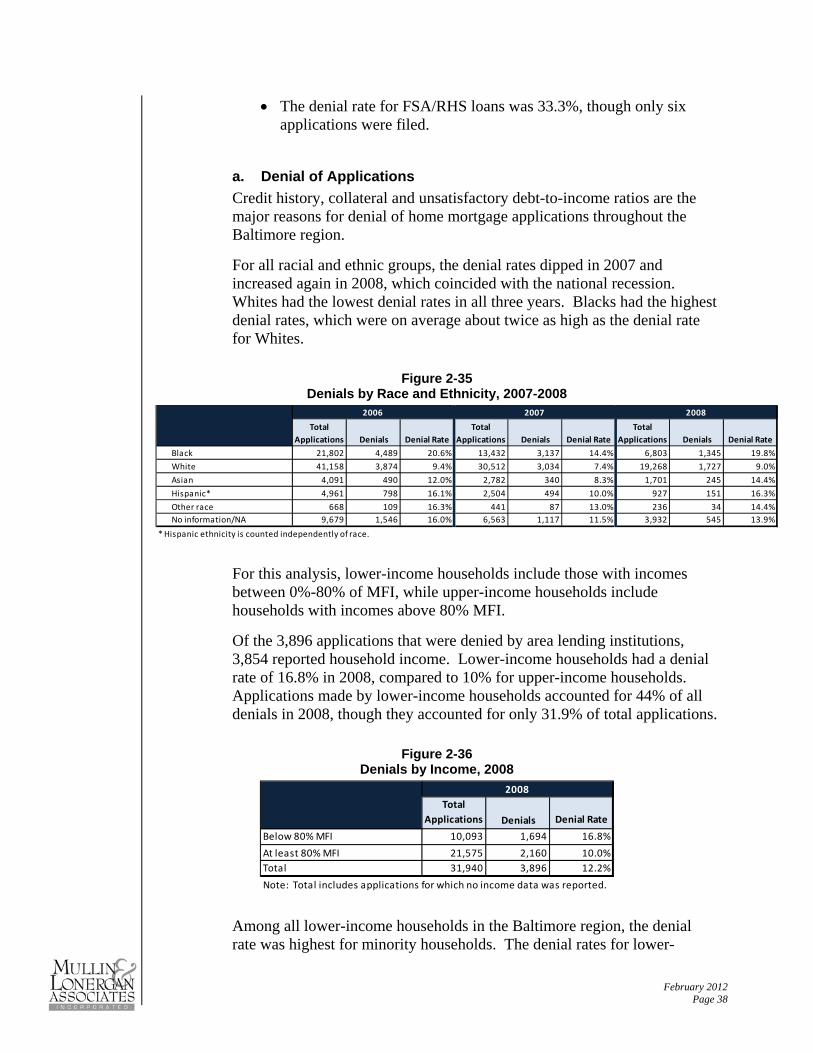
February 2012 Page 38
The denial rate for FSA/RHS loans was 33.3%, though only six applications were filed.
a. Denial of Applications
Credit history, collateral and unsatisfactory debt-to-income ratios are the major reasons for denial of home mortgage applications throughout the Baltimore region.
For all racial and ethnic groups, the denial rates dipped in 2007 and increased again in 2008, which coincided with the national recession. Whites had the lowest denial rates in all three years. Blacks had the highest denial rates, which were on average about twice as high as the denial rate for Whites.
Figure 2-35
Denials by Race and Ethnicity, 2007-2008
Black 21,802 4,489 20.6% 13,432 3,137 14.4% 6,803 1,345 19.8%
White 41,158 3,874 9.4% 30,512 3,034 7.4% 19,268 1,727 9.0%
Asian 4,091 490 12.0% 2,782 340 8.3% 1,701 245 14.4%
Hispanic* 4,961 798 16.1% 2,504 494 10.0% 927 151 16.3%
Other race 668 109 16.3% 441 87 13.0% 236 34 14.4%
No information/NA 9,679 1,546 16.0% 6,563 1,117 11.5% 3,932 545 13.9%
2007 2008
Total
Applications Denials
2006
* Hispanic ethnicity is counted independently of race.
Denial Rate
Total
Applications Denials Denial Rate
Total
Applications Denials Denial Rate
For this analysis, lower-income households include those with incomes between 0%-80% of MFI, while upper-income households include households with incomes above 80% MFI.
Of the 3,896 applications that were denied by area lending institutions, 3,854 reported household income. Lower-income households had a denial rate of 16.8% in 2008, compared to 10% for upper-income households. Applications made by lower-income households accounted for 44% of all denials in 2008, though they accounted for only 31.9% of total applications.
Figure 2-36
Denials by Income, 2008
Below 80% MFI 10,093 1,694 16.8%
At least 80% MFI 21,575 2,160 10.0%
Total 31,940 3,896 12.2%
Note: Total includes applications for which no income data was reported.
2008
Total
Applications Denials Denial Rate
Among all lower-income households in the Baltimore region, the denial rate was highest for minority households. The denial rates for lower-

February 2012 Page 39
income Black and Hispanic households were 20.1% and 21.1%, respectively, compared to 13.5% of lower-income White households. Asian households had the highest denial rate of 23.5%.
Figure 2-37 Denials by Race for Lower Income Applicants, 2008
Black 3,186 640 20.1%
Asian 400 94 23.5%
Am. Indian/Alaska Native 38 7 18.4%
Hispanic* 399 84 21.1%
White 5,346 722 13.5%
Hawaiian 34 5 14.7%
Not Provided/NA 1,089 226 20.8%
Total 10,093 1,694 16.8%
** Total applications do not include loans purchased by another institution
* Hispanic ethnicity is counted independently of race.
2008
Total
Applications** Denials Denial Rate
Denial rates were lower for upper-income households compared to lower-income households. Upper-income Asian and Hispanic households had significantly lower denial rates of 11.6% and 12.3%, respectively. Whites continued to have the lowest denial rate of 7.2%. Upper-income Black households, however, had a denial rate of 19.5%, only slightly smaller than that of lower-income Black households.
Figure 2-38 Denials by Race for Upper Income Applicants, 2008
Black 3,586 698 19.5%
Asian 1,295 150 11.6%
Not Provided/NA 2,762 303 11.0%
White 13,770 988 7.2%
Hispanic* 522 64 12.3%
Am. Indian/Alaska Native 74 12 16.2%
Hawaiian 88 9 10.2%
Total 21,575 1,236 5.7%
** Total applications do not include loans purchased by another institution
* Hispanic ethnicity is counted independently of race.
Total
Applications** Denials Denial Rate
2008
OBSERVATION: Upper-income Black households across the region were denied mortgage loans at a rate (19.5%) higher than lower-income White applicants (13.5%)

February 2012 Page 40
b. High-Cost Lending Practices
The widespread housing finance market crisis of recent years has brought a new level of public attention to lending practices that victimize vulnerable populations. Subprime lending, designed for borrowers who are considered a credit risk, has increased the availability of credit to low-income persons. At the same time, subprime lending has often exploited borrowers, piling on excessive fees, penalties and interest rates that make financial stability difficult to achieve. Higher monthly mortgage payments make housing less affordable, increasing the risk of mortgage delinquency and foreclosure and the likelihood that properties will fall into disrepair.
Some subprime borrowers have credit scores, income levels and down payments high enough to qualify for conventional, prime loans, but are nonetheless steered toward more expensive subprime mortgages. This is especially true of minority groups, which tend to fall disproportionately into the category of subprime borrowers. The practice of targeting minorities for subprime lending qualifies as mortgage discrimination.
Since 2005, Housing Mortgage Disclosure Act data has included price information for loans priced above reporting thresholds set by the Federal Reserve Board. This data is provided by lenders via Loan Application Registers and can be aggregated to complete an analysis of loans by lender or for a specified geographic area. HMDA does not require lenders to report credit scores for applicants, so the data does not indicate which loans are subprime. It does, however, provide price information for loans considered “high-cost.”
A loan is considered high-cost if it meets one of the following criteria:
A first-lien loan with an interest rate at least three percentage points higher than the prevailing U.S. Treasury standard at the time the loan application was filed. The standard is equal to the current price of comparable-maturity Treasury securities.
A second-lien loan with an interest rate at least five percentage points higher than the standard.
Not all loans carrying high APRs are subprime, and not all subprime loans carry high APRs. However, high-cost lending is a strong predictor of subprime lending, and it can also indicate a loan that applies a heavy cost burden on the borrower, increasing the risk of mortgage delinquency.
Figure 2-39 summarize the trends in high-cost lending for 2006 to 2008. As the number of originations decreased, so did the proportion of high-cost loans. For lower income households, high-cost loans comprised 10.7% of all originations in 2008, which was one-third of the rate of high-cost loans in 2006. Among upper income households, high-cost loans fell from 28% to 5.2% of all mortgages.

February 2012 Page 41
Minority households are disproportionately affected by high-cost loans in the region. Among lower-income households, Blacks are about twice as likely to have a high-cost loan across the three years. Among upper income households, Blacks are about three times as likely as other groups to have a high-cost loan.
Figure 2-39 High-Cost Lending by Race/Ethnicity and Income, 2006-2008
Am. Indian/Alaska Native 55 26 47.3% 84 35 ‐‐‐
Asian 389 73 18.8% 2,119 405 19.1%
Black 7,065 3,111 44.0% 8,286 4,319 52.1%
Hawaiian 48 14 29.2% 186 37 19.9%
White 6,997 1,462 20.9% 18,926 3,476 18.4%
Not provided 1,586 608 38.3% 3,693 1,053 28.5%
Hispanic* 792 345 43.6% 1,721 880 51.1%
Total 16,140 5,294 32.8% 33,294 9,325 28.0%
Am. Indian/Alaska Native 54 11 20.4% 69 18 26.1%
Asian 323 36 11.1% 1,468 106 7.2%
Black 5,035 1,146 22.8% 4,318 1,205 27.9%
Hawaiian 33 3 9.1% 91 11 12.1%
White 5,443 618 11.4% 13,695 1,070 7.8%
No information/NA 1,234 222 18.0% 2,489 297 11.9%
Hispanic* 584 119 20.4% 727 197 27.1%
Total 12,122 2,036 16.8% 22,130 2,707 12.2%
Am. Indian/Alaska Native 25 3 12.0% 33 2 6.1%
Asian 221 14 6.3% 801 31 3.9%
Black 2,981 425 14.3% 2,266 324 14.3%
Hawaiian 26 1 3.8% 49 4 8.2%
White 3,867 284 7.3% 8,701 365 4.2%
No information/NA 717 72 10.0% 1,542 66 4.3%
Hispanic* 290 43 14.8% 266 17 6.4%
Total 7,837 842 10.7% 13,658 792 5.8%
Lower Income Upper Income
Total
Originations High‐Cost % High‐Cost
Total
Originations High‐Cost % High‐Cost
2006
2007
2008
18.6%
Note: Does not include loans for which no income data was reported.
* Hispanic ethnicity is counted independently of race.
Three‐Year Totals 36,099 8,172 22.6% 69,082 12,824
OBSERVATION: Black and Hispanic mortgage holders across the region were consistently more likely to have high-cost loans than White mortgage holders. Among lower-income households, Blacks were about twice as likely to have a high-cost loan across the three years. Among upper income households, Blacks were about three times as likely as other groups to have a high-cost loan.

February 2012 Page 42
VII. Regional Patterns in Fair Housing Complaints This section provides a review of fair housing complaints or compliance reviews where a charge of a finding of discrimination has been made. Additionally, this section will review the existence of any fair housing discrimination suits filed by the United States Department of Justice or private plaintiffs in addition to the identification of other fair housing concerns or problems.
A more in-depth analysis of the housing discrimination complaints filed in each of the five jurisdictions is included in Section 2 of each individual AI; however, a summary of the aggregate data for the region is included below.
a. Comparison of Classes Protected by Law
Distinctions between anti-discrimination laws at the federal, state and local levels are significant because they represent the levels at which persons claiming discrimination can seek recourse. In general, local laws across the Baltimore region provide a wider scope of protection than the federal Fair Housing Act and the Maryland Human Relations Act, though there are some exceptions. Three jurisdictions (Anne Arundel County, Baltimore County and the City of Baltimore) do not prohibit discrimination on the basis of familial status, as federal and state law do. This means that residents of those areas who allege this type of discrimination cannot pursue cases at the local level. While sexual orientation is not a basis for federal protection, it is protected by the State of Maryland and all regional jurisdictions except Baltimore County. Therefore, Baltimore County residents who experience this type of discrimination may only pursue recourse at the state level.
The importance of local anti-discrimination laws as a policy stance should not be understated. The lack of laws against familial status discrimination in Anne Arundel County, Baltimore County and Baltimore City has a minimal practical effect – such practices are still made illegal by state and federal law – but it is a point of inconsistency with the Fair Housing Act that should be remedied as a part of each community’s efforts to affirmatively further fair housing.
Local jurisdictions in the Baltimore region provide protection on a variety of progressive fronts that are less commonly found in other areas of the country, including gender identity, genetic information, political opinion and personal appearance. A detailed comparison of all categories receiving statutory anti-discrimination protection across the region appears in the following table.

February 2012 Page 43
Figure 2-40 Comparison of Classes Protected by Federal, State and Local Statute
Protected Class
Federal Fair
Housing Act
Maryland
Human
Relations Act
Anne Arundel
County Exec.
Order 26
Baltimore City
Codes Article IV
Baltimore
County Code
Article 29
Harford County
Code Chapter
95
Howard County Human Rights
Law
Race • • • • • • •
Color • • • • • • •
National Origin • • • • • • •
Religion • • • • • • •
Sex • • • • • • •
Familial Status • • • •
Disability • • • • • • •
Marital Status • • • • • •
Sexual Orientation • • • • •
Gender Identity •
Genetic Information •
Creed • • • •
Age • • • • •
Occupation • • •
Political Opinion • • •
Personal Appearance • • •
Source of Income * •
Ancestry •
* The City of Baltimore protects some sources of income (alimony and child support), but not others, such as rental assistance
b. Trends in Fair Housing Complaints
A lack of filed complaints does not necessarily indicate a lack of housing discrimination. Some persons may not file complaints because they are not aware of how to go about filing a complaint or where to go to file a complaint. In a tight rental market, tenants avoid confrontations with prospective landlords. Discriminatory practices can be subtle and may not be detected by someone who does not have the benefit of comparing his treatment with that of another home seeker. Other times, persons may be aware that they are being discriminated against, but they may not be aware that the discrimination is against the law and that there are legal remedies to address the discrimination. Finally, households may be more interested in achieving their first priority of finding decent housing and may prefer to avoid going through the process of filing a complaint and following through with it. Therefore, education, information, and referral regarding fair housing issues remain critical to equip persons with the ability to reduce impediments.
OBSERVATION: In general, local laws across the Baltimore region provide a wider scope of protection than the federal Fair Housing Act and the Maryland Human Relations Act, though there are some exceptions. Varying protections among jurisdictions emphasize the need for education and outreach at the local level on fair housing rights and procedures for complaint.

February 2012 Page 44
The Office of Fair Housing and Equal Opportunity (FHEO) at HUD receives complaints from persons regarding alleged violations of the Fair Housing Act. Between January 1996 and August 2010, 630 cases were filed through HUD for the entire region. Baltimore City had the highest number of complaints (242), accounting for one-third of all complaints in the region. Baltimore City also had the highest number of complaints per 100,000 residents (calculated using 2008 population). Although Harford County had the lowest number of complaints, Anne Arundel County had the lowest rate of complaints, with 18.6 complaints filed per 100,000 residents.
Figure 2-41
Bases for Fair Housing Complaints Filed with HUD, 1996-2010
Total
Complaints
# Complaints
per 100,000Race Retaliation Sex Color Disability
National
Origin Religion Harrassment
Familial
Status
Anne Arundel County 89 18.6 38 4 6 5 39 7 1 ‐‐‐ 7
Baltimore City 242 38.0 110 6 22 7 97 11 14 2 19
Baltimore County 176 22.0 91 1 11 9 57 9 6 ‐‐‐ 18
Harford County 56 23.3 22 2 4 4 18 1 1 ‐‐‐ 9
Howard County 67 27.0 22 ‐‐‐ 3 1 16 1 1 1 7
Regional Total 630 ‐‐‐ 283 13 46 26 227 29 23 3 60
Source: U.S. Department of Housing and Urban Development
Race was the most commonly alleged basis of discrimination, followed by disability. Together, race and disability accounted for 81% of all complaints. Several complaints alleged more than one basis for discrimination.
Of the 630 cases in the region, 377 (60%) were found to be without probable cause and closed. An additional 151 (24%) were withdrawn by the complainant and ten (1.6%) were successfully conciliated. Twenty-two cases (3.5%) were settled by a judicial consent order, which often results in a Voluntary Compliance Agreement (VCA). Three cases are pending trial – two in Baltimore City and one in Baltimore County. Details on the resolution of complaints for each jurisdiction are included in Figure 2-42.
Figure 2-42 Resolution of Fair Housing Complaints Filed with HUD, 1996-2010
Total
Complaints
FHAP Judicial
Consent OrderPending Trial
Successful
Conciliation No Cause Found No Jurisdiction
Uncooperative
Complainant
Complainant
WithdrawnOther
Anne Arundel County 89 3 ‐‐‐ 1 48 4 3 27 3
Baltimore City 242 8 2 2 141 5 12 55 17
Baltimore County 176 7 1 2 111 2 3 47 3
Harford County 56 2 ‐‐‐ 3 32 2 ‐‐‐ 12 5
Howard County 67 2 ‐‐‐ 2 45 1 1 10 6
Regional Total 630 22 3 10 377 14 19 151 34
Source: U.S. Department of Housing and Urban Development

February 2012 Page 45
c. Hate Crimes
Federal law allows for the prosecution of crimes motivated by animus or enmity against a protected class, including race, color, national origin, religion, sex, familial status or disability.
Maryland law addresses hate crime specifically through Article 27 470A - Religious and Ethnic Crimes, which deems it illegal for any person to vandalize or attempt to vandalize any religious property or to interfere by force or threat of force with any person in the exercise of their religious beliefs. It is also forbidden to damage, destroy, burn or otherwise vandalize the property of a person or an institution because of their race or beliefs, or to harass or commit a crime against any person because of their “race, color, religious beliefs or national origin.” The statute includes an extra sentencing enhancement for crimes motivated by hate. Notably, Maryland’s laws against hate crimes protect fewer classes than its anti-discrimination laws related to housing and employment, which extend also to the basis of sexual orientation.
Those who experience hate crimes in Maryland are encouraged to report such incidents to local law enforcement agencies and human relations agencies. Most hate crime cases are prosecuted by the state.
The U.S. Department of Justice compiles hate crime statistics annually. In 2008, the latest year for which data is available, there were 100 hate crime incidents reported across the State of Maryland. Three occurred in Baltimore City and three in Anne Arundel County (in both jurisdictions, two related to sexual orientation, one related to race); nine were reported across Baltimore County (three race, three religion, two sexual orientation, one ethnicity); five occurred in Harford County (all related to race); and 22 were reported in Howard County (16 race, three religion, one sexual orientation and one ethnicity). The discrepancy in reported instances among jurisdictions could be related to differences in reporting or classification protocol among law enforcement agencies. It is also likely that many hate crimes go unreported. The presence of hate crimes in all AI jurisdictions is an indicator that discrimination exists and likely factors into the reality of daily life in many communities.
OBSERVATION: Race and disability constitute the most common bases for fair housing complaints to HUD across the Baltimore region, combining to represent 81% of all complaints filed.

February 2012 Page 46
8. REGIONAL CONSIDERATIONS
I. Regional Transportation Network Households without a vehicle, which in most cases are primarily low-moderate income households, are at a disadvantage in accessing jobs and services, particularly if public transit is inadequate or absent. Access to public transit is critical to these households. Without convenient access, employment is potentially at risk and the ability to remain housed is threatened. In 2000, there were 39,848 households in the greater Baltimore Region without access to a vehicle, comprising 15.1% of all households. Baltimore City had the greatest proportion of transit-dependent households, at 35.9%. Throughout the region, renter households were significantly more likely than owners to be transit-dependent, with 31.3% of renter households without access to a vehicle, compared to 6.7% of owner households. In the counties surrounding the urban core, renter-occupied households were more than four times as likely as owner-occupied households to depend on public transportation.
Figure 8-1
Percent of Transit-Dependent Households, 2000
All Households Renter‐Occupied Owner‐Occupied
Total 15.1% 31.3% 6.7%
Baltimore City 35.9% 51.3% 18.9%
Anne Arundel County 5.3% 13.4% 2.7%
Baltimore County 8.9% 18.2% 4.4%
Harford County 5.6% 15.9% 2.7%
Howard County 4.3% 11.7% 1.6%
Source: U.S. Census Bureau, 2000 Census SF3 (H44)
Among categories of race and ethnicity, minority households were more likely than White households to be transit-dependent. Whereas 8.4% of White households in the region were transit-dependent, almost four times as many (31.9%) of Black households were similarly without access to a vehicle. Asian and Hispanic households also experienced higher rates of transit-dependence, at 10.4% and 14.4%, respectively. These aggregate trends were also reflected in the individual counties that compose the region, except in Baltimore County, where Asians were less likely than White households to be transit-dependent.

February 2012 Page 47
Figure 8-2
Percent of Transit-Dependent Households by Race, 2000 White Black Asian Hispanic
Total 8.4% 31.9% 10.4% 14.4%
Baltimore City 22.7% 44.4% 32.4% 28.7%
Anne Arundel County 4.0% 14.0% 6.3% 9.4%
Baltimore County 8.0% 12.6% 5.4% 12.6%
Harford County 4.8% 13.5% 6.6% 6.4%
Howard County 3.4% 8.7% 3.4% 5.2%
Source: U.S. Census Bureau, 2000 Census, SF3 (HCT33A, HCT33B, HCT33D, HCT33H)
The table below shows the modes of transportation that residents the Baltimore region used to get to work in 2000. The majority of residents (86.6%) drove to work, with 74.9% of people driving alone. Only 6.6% of residents used public transportation. Buses and trolleys were the most popular form of public transportation. Among those who used public transportation, 70% used buses.
Figure 8-3 Mode of Transportation to Work, 2000
# %
Tota l sample 1,125,423 100.0%
Car, truck, or van: 973,195 86.5%
Drove a lone 843,033 74.9%
Carpooled 130,162 11.6%
Public transportation: 74,672 6.6%
Bus or trol ley bus 52,162 4.6%
Subway or elevated 10576 0.9%
Rai l road 6,814 0.6%
Motorcycle 606 0.1%
Bicycle 1865 0.2%
Walked 34,373 3.1%
Other means 6,265 0.6%
Worked at home 34,447 3.1%
Source: U.S Census Bureau, 2000 Census (SF3‐P30)
Baltimore Region*
*Includes Baltimore Ci ty and the counties of Anne
Arundel , Baltimore, Harford and Howard
The Baltimore region is served primarily by the Maryland Transit Administration (MTA). MTA is a multi-modal system with 73 local and commuter bus routes and 89 subway, light rail, and commuter train stations. In 2009, MTA provided over 100 million passenger trips, about two-thirds of which were on fixed-route buses. MTA also funds locally operated transit systems (LOTS), which provide local fixed route services in the county areas.

February 2012 Page 48
a. Destinations and Routes MTA services are concentrated in (1) the more densely populated areas in Baltimore City and the surrounding areas, and (2) the commuter corridor between Maryland and Washington D.C. Within the City of Baltimore, transportation links major tourist, business and residential areas. The Metro Subway and most bus routes run from about 5 a.m. to midnight, and several bus routes offer all-night services. The light rail runs north-south through the City, connecting the BWI Thurgood Marshall Airport and Cromwell in the south and the Hunt Valley Business District located north of City Center. Moving further out of the City, fixed routes become more sparse and infrequent. The Maryland Area Regional Commuter (MARC) train provides weekday service on three commuter rail routes to Union Station in Washington D.C. Commuter buses connect major urban areas to Baltimore City, including Annapolis, Columbia, Havre de Grace and Bel Air. Within Howard County, which is situated between Baltimore and Washington D.C., a variety of bus routes service local areas and connect residents to both Baltimore and the Washington D.C. area. For counties north of the City, including Baltimore and Harford Counties, connection options are more limited. In addition to the MARC trains and commuter buses, locally operated transit systems (LOTS) provide local transportation routes within each of the four counties covered in this AI. Many of these LOTS routes, however, do not offer evening, weekend or Sunday service. Therefore, transit-dependent households may have constrained mobility to access jobs and resources. This is particularly important for renter-households in the counties. As discussed earlier, renter households are significantly more likely to not have access to a vehicle.
b. Accessibility
All of MTA’s fixed route buses are equipped with wheelchair lifts and/or ramps, in accordance with the Americans with Disabilities Act (ADA). Metro and light rail stations are also equipped with elevators and boarding platforms for passengers using mobility devices. In conformance with ADA regulation, MTA offers paratransit services for passengers who cannot independently access fixed route services.
Through its Commuter Choice program, MTA has developed incentives to encourage taking public transportation to work. Eligible employers are able to
February 2012 Page 49
distribute reduced fare passes to their employees and can receive tax credits for providing commuter benefits.
The metropolitan planning organization for the region is the Baltimore Regional Transportation Board (BRTB). The BRTB oversees regional planning efforts and provides direction and oversight in the development of the region’s federally mandated long-range transportation plan. The most current long-range plan, Outlook 2035, outlines a strategy for developing a transit system that is efficient, accommodating for future growth, and environmentally friendly. Outlook 2035 has seven goals:
1. Improve safety 2. Maximize transportation system management and operations 3. Increase accessibility and mobility 4. Preserve the environment 5. Improve transportation system security 6. Link transportation investment to land use and economic
development 7. Foster inter-jurisdictional participation and cooperation.
Outlook 2035 predicts that regional growth and economic development will center in the suburban areas of the region. According to the BRTB projections, there will be substantial job growth in Anne Arundel and Harford Counties, and most commuting will be between suburban areas, instead of into urban centers.16
Given the current sparseness of transportation options within and between suburban areas, appropriate planning will be important to ensure transit-dependent households will be able to benefit from this projected employment growth.
16 BRTB, “Transportation Outlook 2035 Socioeconomic Forecasts” http://www.baltometro.org/content/view/811/537/
OBSERVATION: The lack of adequate public transportation between the urban core of Baltimore City and the employment growth centers expected in the upcoming years will exacerbate the intractable concentrations of poverty and disenfranchisement in the City. A key component of future regional planning initiatives must involve the linking of inner city residents with job opportunities in the outlying suburban areas.

February 2012 Page 50
II. Comparison of Jurisdictional Tax Profiles Taxes impact housing affordability. While real estate tax differentials are not an impediment to fair housing choice in and of themselves, they can impact the choice that households make with regard to where to live. Tax increases can be burdensome to low-income homeowners, and increases are usually passed on to renters through rent increases. Tax rates for specific districts and the assessed value of all properties are the two major calculations used to determine revenues collected by a jurisdiction. Determining a jurisdiction’s relative housing affordability, in part, can be accomplished using tax rates.
However, a straight comparison of tax rates to determine whether a property is affordable or unaffordable gives an incomplete and unrealistic picture of property taxes. Local governments with higher property tax rates, for example, may have higher rates because the assessed values of properties in the community are low, resulting in a fairly low tax bill for any given property. In all of the communities surrounding a jurisdiction, rates for various classes of property (residential, commercial, industrial, etc.) are assigned to balance each community’s unique set of resources and needs. These factors and others that are out of the municipality’s control must be considered when performing tax rate comparisons.
Taxes in Maryland are assessed through a tax rate per $100 of a property’s value. Property taxes are a significant source of revenue for counties and municipalities, used to fund education and social and administrative services. In addition to locally levied taxes, the state draws .112 mills per $100 on all real property throughout Maryland.
Property taxes in Maryland are levied on the assessed fair market value of a property. Local and county governments conduct assessments every three years, and increases in property values are phased in over the three years between assessments. For example, if a property’s assessed value increases by $30,000, the taxable value of a property will increase by $10,000 each of the next three years. This phase-in helps to avoid sharp increases in a resident’s tax liability due to rapid increases in property values.
Additionally, Maryland’s policy of requiring reassessment every three years minimizes inequity in the system of taxation, as changes in assessed value keep pace with changes in market value across the board. In states that do not require periodic reassessment, the assessed values of years long past continue to apply to 1) neighborhoods that are in decline, resulting in over-taxation on poorer residents, and 2) neighborhoods where values have increased, resulting in under-taxation on those who are prospering. This is not the case across Maryland, where assessments are generally up-to-date. However, rapid shifts in the local housing market over the past decade, including sliding home values in the neighborhoods hit hardest by foreclosure, have added room for inequity.
Although most revenues in Maryland are traditionally raised through four main taxing agencies (state, county, municipality and school district), smaller taxing districts with specific functions – such as providing funds for fire protection,

February 2012 Page 51
mosquito abatement, or libraries – are increasing in popularity. In response to particular local needs, some jurisdictions have established various special service areas where additional rates apply.
The table below shows the estimated taxes per $100,000 assessed value of a property in several major taxation jurisdictions in the Greater Baltimore area. The following narrative more closely examines local tax policies in Baltimore City and the counties of Anne Arundel, Baltimore, Harford and Howard.
Figure 8-4
Estimated Taxes per $100,000 AV, FY 2009-10
JurisdictionEst. Taxes per $100,000
Assessed Value
Baltimore City $2,380
Baltimore County $1,212
Howard County ‐ Urban $1,342
Anne Arundel County $988
Annapol i s City $1,165
Harford County $1,176
Aberdeen City $1,864
Source: Maryland Department of Assessments and Taxation
a. Anne Arundel County
Anne Arundel County (excluding Annapolis) has the lowest property tax rate in the region. The County is divided into two taxing zones: Annapolis and the balance of the County. The County-wide tax rate is 0.876 mills. Within Annapolis, the County charges a levy of 0.523 mills, while the City charges its own levy of 0.53 mills, for a total tax rate of 1.053 mills.
OBSERVATION: Real estate taxes are a factor in housing choice inasmuch as they affect affordability across jurisdictions. The highest rates across the region are found in Baltimore City. Center cities in metropolitan areas commonly exercise a high tax effort to support existing urban services from a base of shrinking population and generally lower housing values. Estimated total property taxes per $100,000 in valuation were roughly half as expensive in outlying counties, though the property values in those areas are higher.

February 2012 Page 52
Figure 8-5 Anne Arundel County Property Levies, FY 2009-10
Levy TypeRate per $100
assessed value
County Tax ‐ Excluding Annapol is 0.876
County Tax ‐ Annapol i s 0.523
Annapol is City Tax 0.53
State Tax 0.112
Source: Anne Arundel Office of Finance For a house valued at $100,000 in 2009-2010 in Anne Arundel County without exemptions or credits, the annual property tax is an estimated $988, or about $82 a month. The same house in Annapolis would have an annual property tax of $1,165, or about $97 a month. There is also an additional annual $275 trash collection fee for every household in the County. For lower-income households, Anne Arundel County administers the Homeowners Tax Credit to provide tax relief.
b. City of Baltimore
Baltimore City has the highest real estate tax rate in Maryland, ranging from 2.38 to 2.512 mills per $100 of assessed value depending on district. City government establishes the municipal tax rate, which was 2.268 mills in 2009-2010. This relatively high rate is due largely to the mismatched range of services the City provides as an emptying urban core: The City is in the difficult process of scaling its expenditures back to match the lesser demands of a dwindling population. It is also due to the hollowing out of the City in another way: As residents move away and property values decline, the tax burden falls more heavily onto the shoulders of those who stay. Within the City there are two special Community Benefits Districts (CBD) where additional levies apply. Since 1993, City law has allowed a limited number of neighborhoods to be designated as self-taxing, quasi-public management authorities that oversee safety, sanitation, development and beautification projects. The two districts are Midtown (which includes parts of Bolton Hill, Charles North, Madison Park and Mount Vernon) and Charles Village. Neither neighborhood has a concentration of Black or lower-income residents. Other neighborhoods may earn designation as a CBD, but the process requires substantial grassroots organization and fundraising. Park Heights, a Black-concentrated, lower-income neighborhood on the northwest side of the City, failed in an effort to organize as a CBD in the late 1990s. The table below details the various tax levies for Baltimore City.

February 2012 Page 53
Figure 8-6 Baltimore City Property Levies, FY 2009-10
City Tax 2.268
State Tax 0.112
Specia l District ‐ Midtown Community Benefi ts 0.13
Specia l District ‐ Charles Vi l lage Community Benefi ts 0.120
Source: Live Baltimore
Levy Type Rate per $100 assessed value
For a property valued at $100,000 without exemptions or credits, the annual property tax in 2009-2010 was an estimated $2,380, or about $198 per month. In the Community Benefits Districts, the annual tax liability would increase by $330 in Midtown and $318 in Charles Village. Baltimore City offers a variety of tax credits and incentives to assist target populations as well as to foster development. The Homeowners and Homestead Credits and Fallen Hero Tax Credit provide tax relief to eligible property owners. Additional credits are available to individuals, organizations and corporations to promote urban revitalization and renovation. These include:
Newly constructed dwelling credit, to encourage the construction and purchases of new homes;
Vacant dwelling credit, to promote the renovation and reuse of vacant residential properties;
Brownfield credit, to encourage the redevelopment of contaminated abandoned and/or underutilized industrial and commercial sites; and
Enterprise Zone credit, to encourage investment in one of the City’s 8 designated economically distressed zones.
Tax credits are also available for home improvements and renovations of historic properties.
c. Baltimore County
Property taxes accounted for less than half of Baltimore County’s revenue in 2008. The County has a uniform composite tax rate of $1.10 per $100 assessed value and has no special taxing districts or zones. Therefore, a property valued at $100,000 in 2009-2010 without exemptions or credits would have an estimated annual property tax of $1,212, or about $101 per month. Households are also responsible for a

February 2012 Page 54
water and sanitation fee according to their level of water usage throughout the year. Baltimore County offers a variety of tax credits and incentives to assist target populations as well as to encourage development. The Homeowners Tax Credit and Hardship Installment Payment Program provide tax relief to eligible households. Additional credits are available to individuals, organizations, and corporations to promote urban revitalization and renovation. These include:
Brownfield credit, to encourage the redevelopment of
contaminated abandoned and/or underutilized industrial and commercial sites;
Credit for historic and architectural protection, for eligible residential and commercial rehabilitation work; and
Revitalization credits for improvements in commercially zoned areas.
d. Harford County
Property taxes accounted for more than half of the general fund revenues in Harford County in 2000 and were the primary source of funding for education and public safety in the County. Harford charges a countywide tax rate of 0.908 mills and a highway tax of 0.156 mills. Three municipalities (Aberdeen, Bel Air, and Havre de Grace) levy additional taxes. The table below includes the levy types in Harford County.
Figure 8-7
Harford County Property Levies, FY 2009-10
State Tax 0.112
Highway Tax 0.156
Municipa l i ty Levy ‐ Aberdeen 0.69
Municipa l i ty Levy ‐ Bel Air 0.500
Municipa l i ty Levy ‐ Havre de Grace 0.61
Source: Harford County Economic Development
Levy Type Rate per $100 assessed value
For a house valued at $100,000 in 2009-2010 in Harford County without exemptions or credits, the annual property tax is an estimated $1,176, or about $98 a month. Properties in Aberdeen, Bel Air, and Havre de Grace would have higher tax liabilities of $1,864, $1,676, and $1,786, respectively. Households are also responsible for a water and sanitation fee according to their use of water throughout the year.

February 2012 Page 55
Harford County and the taxing municipalities within the County offer credits and exemptions for the elderly, disabled and lower-income families. The County administers the Homeowners Tax Credit and the Homestead Exemption. Property owners may also qualify for the Solar Energy/Geothermal Device Tax Credit for the installation of approved devices.
e. Howard County
Property taxes accounted for about one-third of revenues in Howard County in 2010, and were used primarily to fund education, as well as facility management, public safety and other community services. The County is divided into two taxing zones, metropolitan and rural. Fire tax rates vary between the districts, and within the metropolitan district, and additional ad valorem charge is levied to cover water and sewer system costs. The table below includes the various tax levies throughout the County.
Figure 8-8
Howard County Property Levies, FY 2009-10
State Tax 0.112
Fire Tax ‐ Metro 0.136
Fire Tax ‐ Rura l 0.12
Ad Valorem ‐ Metro 0.080
*Levies do not include annual trash col lection fees
Source: Howard County Department of Finance
Levy Type Rate per $100 assessed value
For a property in the metropolitan district of Howard County valued at $100,000 without credits or exemptions, the estimated annual property tax in 2009-2010 is $1,341, or about $112 a month. This does not include the annual trash collection fee, which is an additional $225 for trash, recycling and yard service, $210 for only trash and recycling or $39 for only recycling. Howard County offers a variety of assistance programs for residents to lower their property tax liability. The Homestead Credit limits the annual increase in taxable assessment on the owner-occupied residential properties to a fixed percentage. In Howard County, the County assessment increase is limited to 5%, and the State assessment increase is limited to 10%. Households with incomes under a certain income threshold can qualify for the Homeowners Tax Credit Program, and seniors may be eligible for tax relief in the form of credits and deferrals. Howard County also provides credits to low income households to assist in covering trash collection fees. Lastly, owners

February 2012 Page 56
may receive tax credits for installing solar or geothermic energy devices.
III. Real Estate Advertising Under federal law, no advertising with respect to the sale or rental of a dwelling may indicate any preference, limitation, or discrimination because of race, color, religion, sex, handicap, familial status or national origin. In addition, Maryland law extends protection to persons based on marital status. The prohibition on discriminatory practices applies to publishers, such as newspapers and directories, as well as persons and entities who place real estate advertisements.
Publishers and advertisers are responsible under federal law for making, printing, or publishing advertisements that violate the Fair Housing Act on its face. Thus, they should not publish or cause to be published an advertisement that expresses a preference, limitation or discrimination on the basis of race, color, religion, sex, handicap, familial status, or national origin. The law, as found in the Fair Housing Amendments Act of 1988, describes the use of words, photographs, symbols or other approaches that are considered discriminatory.
A review of The Baltimore Sun was conducted to evaluate the frequency and type of unlawful advertising.17 No advertisements for rental or sale units included any type of discriminatory qualification on the type of occupants sought. Placement of the fair housing logo was consistent.
Central Maryland Homes was also reviewed.18 Each ad in this publication had an Equal Housing logo, and an Equal Housing explanation appeared on the site’s table of contents. On the companion website, Greater Baltimore Homes (www.homes-online.com), the logo was apparent, but the explanation of fair housing rights appeared to be absent. No discriminatory language was found.
The Baltimore County Housing Office provides GoSection8.com as a tool for Housing Choice Voucher holders and participating landlords. A review of that site revealed a lengthy and complete section on fair housing rights. No discriminatory ads were found.
17 The Sunday edition dated January 31, 2009, was randomly selected for review. 18 Volume 29, No. 2, January 27, 2010
OBSERVATION: The tax credits and exemptions available to home buyers and others who seek to revitalize Baltimore City neighborhoods through home ownership initiatives are crucial to the long-term success of re-inventing many City neighborhoods. Without the critical component of a stabilizing home ownership segment in many lower income neighborhoods, reversing decades-long trends of deterioration, neglect, disinvestment and suburban flight cannot occur.

February 2012 Page 57
Homes.com, a heavily trafficked national website featuring homes across the region, did not appear to contain any information for potential home buyers on fair housing law, rights or responsibilities. The site’s various search features did not provide users with a means to locate homes with accessibility features. No discriminatory language was found.
IV. Regional Research and Publications Review
f. Kirwan “Communities of Opportunity” Framework
In research activities related to community development, fair housing and social justice, the Kirwan Institute for the Study of Race and Ethnicity at The Ohio State University applies a conceptual model that evaluates the extent to which people have access to critical opportunities that influence life outcomes. The Institute groups resources and services these into three major opportunity structures – economic opportunity/mobility, neighborhood health and educational opportunity.
The “Communities of Opportunity” model is based on the premise that affirmatively connecting people to critical opportunity structures creates positive, transformative community change. The model is designed to promote fair investment among people and neighborhoods across a region with the ultimate goal of improving life outcomes regionwide. Through the application of the model, the Institute aims to mitigate the extent to which some citizens have been long isolated from opportunity by entrenched patterns of racial and economic segregation. There are two ultimate goals: to bring opportunity to areas where it does not exist, and to connect people to areas where it does.
The Institute’s director, John Powell, applied the framework to the Baltimore region in his 2005 expert testimony in Thompson v. HUD. Powell proposed that the Thompson remedy should ultimately consider the distribution of affordable housing across the region on the basis of fair access to opportunity structures, not simply on the basis of fair sharing between suburban and urban areas. In the Baltimore region in particular, access to critical opportunity structures for lower-income households and minorities has been limited by development patterns and policies that perpetuate racial, ethnic and economic segregation.
To measure opportunity, the Kirwan framework studies economic health (by proxy of job availability and growth), educational opportunity (by way of student performance, student economic status and teacher qualifications) and neighborhood quality (using a wide range of data reflecting neighborhood stability and quality of life). A collection of variables is selected to determine an opportunity index

February 2012 Page 58
score for each opportunity structure. The Kirwan study maps on the following pages illustrate these measurements in the Baltimore region.
In evaluating Baltimore, Powell classified each census tract in the region according to the opportunity score on a five-point scale: very low, low, moderate, high or very high. The individual economic opportunity structures can also be combined and understood as a composite measure of opportunity for the Baltimore region. Some of the outcomes of the analysis were as follows.
Economic opportunity and mobility are focused in three primary areas: North of the City of Baltimore in Baltimore County, in some areas near downtown Baltimore and in areas of Howard and Anne Arundel counties southwest of the City.
The region’s healthiest neighborhoods are almost entirely outside of the City of Baltimore. Large clusters of healthy neighborhoods exist in all of the outlying counties.
The distribution of educational opportunity is heavily skewed toward suburban counties. All of the census tracts falling into the “very low” category of educational opportunity fall within the City.
Ultimately, judging by the composite index, high-opportunity census tracts are concentrated in suburban counties. While the City is the primary location of census tracts with “very low” opportunity, “very high” opportunity tracts are clustered in northern Anne Arundel County, central Baltimore County, southern Harford County and southern Howard County.
Powell additionally found that Black households are segregated disproportionately into low-opportunity areas and that affordable housing is deficient in high-opportunity areas. In making recommendations for the Thompson remedy, he concluded:
The remedy must be sensitive to opportunity and to the importance of location in determining access to opportunity.
The remedy must be regional.
The remedy must be conscious of race, due to the nature of the violation and HUD’s fair housing duties and the realities of the housing market.
The remedy should not force the dispersal of public housing residents who wish to remain in their present location.
The remedy must be driven by the goals of desegregation and opportunity access.
The remedy should make use of the variety of tools available to HUD, such as vouchers and new unit production.

Educational Opportunity Index for the Baltimore RegionKirwan Institute for the Study of Race and Ethnicity, 2005
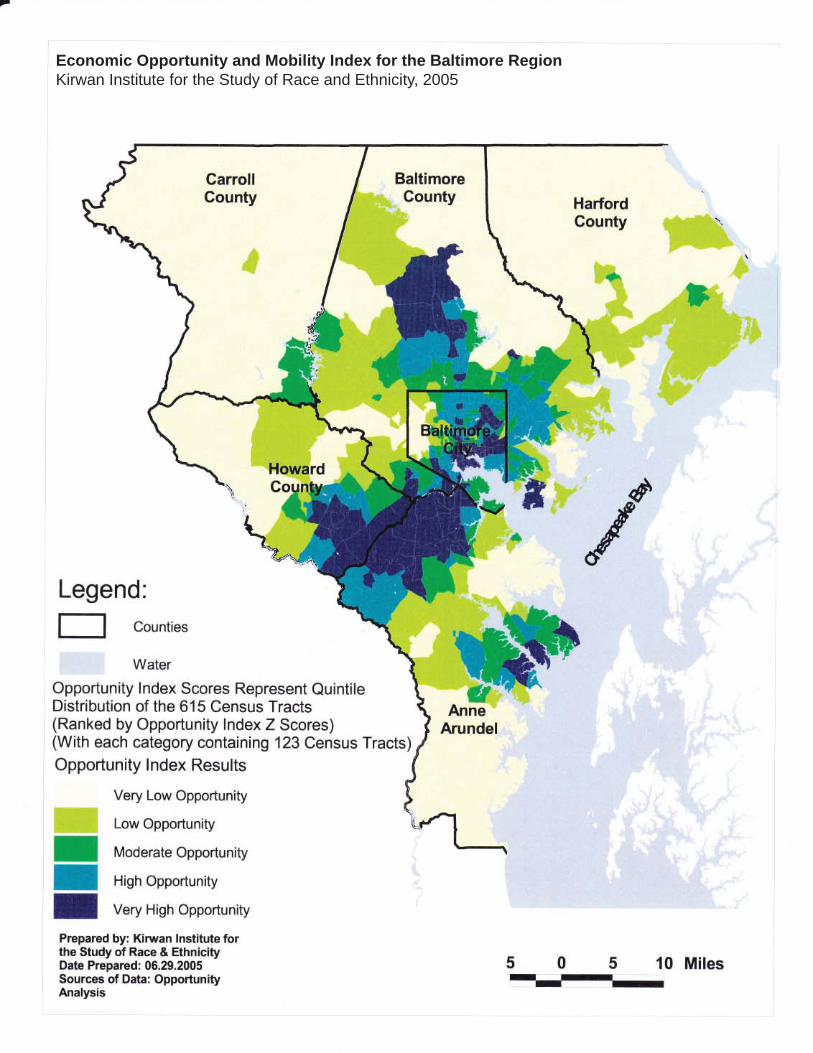
Economic Opportunity and Mobility Index for the Baltimore RegionKirwan Institute for the Study of Race and Ethnicity, 2005

Comprehensive Opportunity Index for the Baltimore RegionKirwan Institute for the Study of Race and Ethnicity, 2005

Neighborhood Health (Opportunity) for the Baltimore RegionKirwan Institute for the Study of Race and Ethnicity, 2005

February 2012 Page 59
g. PRRAC/BRHC Evaluation of Baltimore Housing Mobility Program
In October 2009, the Poverty Race Research and Action Council (PRRAC) and the Baltimore Regional Housing Campaign (BRHC) published a progress report on a specialized regional voucher mobility initiative that was designed as a partial remedy in the settlement of Thompson v. HUD. The Baltimore Mobility Program is currently administered by Metropolitan Baltimore Quadel under contract with the Housing Authority of Baltimore City and under the oversight of HUD and the Maryland ACLU. In the first six years following its launch in 2003, the program moved 1,522 families to low-poverty, racially integrated City and suburban neighborhoods.
The program assists current and former public housing families and those on the waiting list for public housing to locate and secure housing opportunities in low-poverty, predominantly White neighborhoods. Families who meet eligibility criteria and enroll in the program receive financial and budgeting education, tours through high-opportunity neighborhoods and personal counseling to find and move into private-market housing. The Housing Choice Vouchers administered through the program can be used anywhere in the Baltimore region, but they are specifically targeted to areas where less than 10% of residents live in poverty, where less than 30% are racial minorities and where less than 5% of all housing units are HUD-owned or HUD-assisted. Following their affirmative move, families in the program receive at least two years of counseling to help them adjust to their new communities, in addition to employment and transportation assistance. This ensures that participants can access the employment opportunities in suburban areas that may not be well connected to the region’s public transit system. MBQ further expands the geography of opportunity to voucher holders by marketing the program to landlords and monitoring the placement locations of participating families.
The 2009 evaluation deemed the program’s early results to be promising, “proving that poor African-American families are able and willing to make it beyond the confines of traditional public housing neighborhoods and that low-poverty and predominantly White neighborhoods are able and willing to enfold the new families into the fabric of the community.”19
The program is strongly results-oriented, so the preponderance of quantitative measures testifying to its success is perhaps not surprising. The evaluation cites MBQ administrative and demographic data, a 2007 ACLU survey of participants who had lived in new
19 Engdahl, Laura. “New Homes, New Neighborhoods, New Schools: A Progress Report on the Baltimore Housing Mobility Program.” Poverty and Race Research Action Council and the Baltimore Regional Housing Campaign, October 2009. Available at prrac.org/projects/baltimore.php

February 2012 Page 60
neighborhoods for at least 14 months and a 2008 ACLU survey of recent first-time movers in the program. Results from all three sources indicate that the impact of the program in its first six years was substantial, both in the number of families assisted and in the degree to which participating families experienced a better quality of life. Specifically, according to selected statistics from the evaluation:
Of the 1,522 families that moved to low-poverty, racially integrated neighborhoods, 88% moved from inner-city Baltimore to suburban counties. Neighborhoods moved from were 80% Black and 33% poor, while neighborhoods moved to were 21% Black and 7.5% poor.
In schools in the new neighborhoods, an average of 33% of students are eligible for free or reduced lunch, compared with 83% in the original neighborhood schools of participant families. Roughly nine in 10 settled parents said that their children appeared to be learning better or much better in their new schools.
After moving, 80% of participants said that they felt safer, more peaceful and less stressed. Nearly 40% said they felt healthier.
Most participant families who were eligible to move from their initial unit (62%) chose to stay. Of those who chose to move again, only 19% moved from the suburbs back to the City. Families who made a second move went to neighborhoods that were less segregated and significantly less poor than the areas where they lived before joining the program.
The evaluation draws a conclusion that is inevitable, based on the strength of the program’s results: The early successes of the Baltimore Housing Mobility Program elevate it as a model for using vouchers to connect disadvantage minority families to the opportunities available in resource-rich low-poverty neighborhoods.
h. Moving to Opportunity
The City of Baltimore was among five U.S. cities selected by HUD to participate in Moving to Opportunity, a long-term research demonstration project initiated in the mid-1990s. The program randomly selected experimental groups of households with children and provided them with housing counseling and vouchers that required them to move to low-poverty neighborhoods. HUD’s premise was to determine the extent to which moving poor families out of poverty-concentrated neighborhoods would increase their life chances. The experimental design for Moving to Opportunity was heavily influenced by the Gautreaux initiative in Chicago, a court-ordered remedy for

February 2012 Page 61
racial segregation in that city’s public housing program. In the Gautreaux remedy, low-income Black families experienced positive employment and education outcomes after being relocated to predominantly White neighborhoods in the city and its suburbs.
Moving to Opportunity was a longitudinal study to gauge outcomes on three groups: the experimental group, which received Housing Choice Vouchers that they could use only in census tracts with less than 10% poverty, a Section 8 comparison group that received vouchers with no restrictions or counseling, and an in-place control group, which continued to receive project-based assistance. In Baltimore, the experimental group included 252 households.20
According to updates presented at the National Conference on Assisted Housing Mobility in June 2010, final evaluation is still underway to determine the program’s results. However, HUD has supported research on Moving to Opportunity that has produced the following initial conclusions:
Families in the experimental group did not move far. Their new neighborhoods were the worst of the best – while poverty levels were lower than in their original neighborhoods, as the program required, the new neighborhoods were still areas of racial minority concentration and were more likely to be central-city areas with rising poverty. Of the 300-plus eligible low-poverty tracts where participants across all of the test cities could move, they moved to only 44 different tracts, most of which were in decline.
That phenomenon could be due to a variety of decision constraints, ranging from structural (discrimination, lack of available housing or employment) to family experience (strong social connections in limited areas) or simply the complications of life in poverty (domestic violence, low-wage work, health problems, depression).
Safety was a primary motivating factor for those who participated in the program. Participants experienced large gains in neighborhood safety and physical/mental health. Anxiety, depression and obesity, which are all barriers to employment, were decreased.
Gains in school quality were limited, and there was no evidence of gains in learning. This is possibly due to many participants having stayed in central city neighborhoods.
20 Shroder, Mark, HUD Office of Policy Department and Research. “Moving to Opportunity: An Experiment in Social and Geographic Mobility.” Cityscape, Vol 5, No. 2, 2001.

February 2012 Page 62
i. 2002 Regional Fair Housing Action Plan
In Fall 2001, following up on HUD and local government concerns that few of the action steps identified in the 1996 Analysis of Impediments to Fair Housing Choice in the Baltimore Metropolitan Area had been implemented, the Baltimore Metropolitan Council convened the six participating entitlement jurisdictions (the cities of Annapolis and Baltimore, along with Anne Arundel, Baltimore, Harford and Howard counties) to address the regional plans and the lack of initiative in implementing strategies to eliminate the identified impediments. During a series of meetings, jurisdictions expressed several objections to the methodology and recommendations of the 1996 AI, arguing that the report’s conclusions were based on national trends rather than local data, and that the AI recommended actions beyond the scope of local government. In moving forward with a regional plan to address impediments within their control, the participants requested technical assistance from HUD, which selected the Maryland Center for Community Development to assist in the composition of a revised regional action plan for fair housing.
The resulting 12-page document was the 2002 Baltimore Regional Fair Housing Action Plan (FHAP), intended to amend the 1996 AI. It focuses on subject areas that the jurisdictions agreed were regional in nature and within the local government realm of expertise and control: assisted housing, mortgage lending, home sales/rental practices and homeowner’s insurance. Summaries of the actions agreed upon in each action area by the participating entitlement communities are as follows.
1. Assisted Housing
Acknowledging a lack of universal Section 8 Housing Choice Voucher acceptance and a highly competitive market for voucher holders in search of housing, the AI jurisdictions planned to a) improve the market attractiveness of the Section 8 programs, b) improve the administration of the Section 8 program; and c) provide training for voucher holders.
OBSERVATION: Overall, the evaluation of housing mobility programs has demonstrated successes achieved by moving people out of high-poverty areas and into resource-rich, low-poverty neighborhoods. The results of such programs must be the foundational basis for any regional fair housing initiatives undertaken in the Baltimore region.

February 2012 Page 63
Specifically:
The jurisdictions agreed to share the cost of hiring Baltimore Metropolitan Council to conduct research on rental housing data to determine if adjustments should be made to fair market rents (FMRs) to remove barriers to housing opportunities. The jurisdictions planned to use the outcome of the research to work with HUD to adjust FMRs accordingly. (July 2002 to January 2003)
To improve the negative public perception of the Section 8 program, the jurisdictions planned to coordinate regional landlord outreach activities by hiring an outside contractor. The FHAP envisions a multi-year education and outreach campaign designed to frame affordable housing as an economic development issue centered on working families. (Summer 2002 to Fall 2004)
The jurisdictions planned to improve regional
administration of the voucher program by reducing bureaucratic barriers for private landlords (July to December 2002) and by standardizing program information across the region. (December 2002 to July 2003)
To provide training for tenants, the jurisdictions planned to
contract with an outside agency, which would provide standardized education on consumer issues and tenant rights and responsibilities regionwide. (No timeline)
2. Homeowner’s Insurance
The participating jurisdictions agreed that discrimination in the market for homeowner’s insurance was a serious issue worth addressing, though the local governments had limited direct experience in handling this type of problem. The FHAP strategy is to increase awareness of the impact of homeowner’s insurance practices on minority homebuyers by hosting an educational workshop. (Fall 2002 to Spring 2003)
3. Mortgage Lending
Similarly, the jurisdictions recognized the continued existence of discrimination in the mortgage lending market, though they determined that more discussions were needed to determine appropriate strategies to address the issue on a regional basis. The

February 2012 Page 64
FHAP has a stated goal to expand conventional mortgage lending to low-income households and racial and ethnic minorities at all income levels. As possible avenues for future collective action, the FHAP suggests:
Conducting regional outreach to promote the use of housing counseling among homebuyers
Contracting for regional mortgage lending testing to determine the extent of existing discrimination
Applying as a regional group for funding and education
under HUD’s Fair Housing Initiatives Program, which would also require the establishment of a regional complaint and referral process
4. Sales and Rental Practices
The jurisdictions reported “little knowledge” of discrimination in this area, but planned to determine if patterns of discrimination existed against members of the protected classes. This effort would be initiated by meetings among entitlement jurisdictions in 2002 to discuss action items, possibly to include testing for discrimination or educational programs for landlords and real estate agents.
The years that have passed since the publication of the 2002 Baltimore Regional Fair Housing Action Plan allow for long-range perspective on the intents and effects of the document. It serves as a record of the communication among participating jurisdictions in efforts to address the regional barriers to fair housing choice identified in the 1996 AI. The FHAP demonstrates a collective understanding of issues transcending local government boundaries and was produced as a result of a collective will to advance fair housing choice. At the same time, the most important regional impediment apparent in the document may be one that is not addressed by action steps – the difficulty that individual jurisdictions face in imposing regional solutions without a centralized implementation agency or leadership structure. The FHAP notes that “each jurisdiction may undertake fair housing activities on their own, but no group exists to advance regionally coordinated activities that cross jurisdictions.”
This, perhaps, is the explanation for any of the action steps that remain seemingly incomplete.

February 2012 Page 65
V. Intergovernmental Cooperation and Coordination The nature of intergovernmental relations in the Baltimore region as they relate to affirmatively furthering fair housing can be characterized as loosely cooperative. Organizations such as the Baltimore Regional Housing Campaign have recognized the need for meaningful multi-jurisdictional approaches to the difficult task of distributing housing opportunities fairly across the entire region, but a lack of structure uniting local governments in this task has made it nearly impossible. This is demonstrated in the region’s 2002 Fair Housing Action Plan, in which the few truly coordinated efforts that were proposed to mitigate discrimination have been implemented in only limited ways or not at all.
HUD holds each jurisdiction participating in the regional AI accountable to meet fair housing standards. Without exception, the approach of each, as recorded in Comprehensive Annual Performance Evaluation Reports (CAPERs) for their respective CDBG and HOME programs, has been to pursue the solutions most readily accessible and most easily implemented through locally administered means – educational programs and outreach, most commonly.
The Baltimore Metropolitan Council is the federally recognized metropolitan planning organization that organizes elected executives from each of the AI jurisdictions. The Council was created to collaborate on strategies, plans and programs that serve regional interests, but it has never served as a vehicle for the implementation of regional housing policy. Instead, it addresses such practical concerns as cooperative purchasing, computer mapping and the allocation of federal transportation spending. The Council served as the facilitating agency for the most recent AI, completed in 1996, and followed up with the production of the Fair Housing Action Plan in 2002. Though the Council provided a forum for discussion among jurisdictions, the task of addressing impediments to fair housing choice was ultimately left to each individual local government.
The region’s enduring segregation and the limitations to fair housing choice identified in this document make the case that more meaningful steps are needed. Achieving better fair housing outcomes across the Baltimore region would not require a large increase in spending for any jurisdiction, but better planning, a higher degree of consistency and a genuinely dedicated commitment to meaningful progress by all.
One example is the way in which Section 8 Housing Choice Vouchers are administered. The City of Baltimore and the four contiguous counties participating in the AI each operate a separate voucher program. Each program has its own set of policies and procedures, including preferences for admission, payment standards for persons with disabilities or locations outside of concentrated areas, and portability of vouchers to other jurisdictions. Due to the close proximity of the five jurisdictions and the close interconnections between housing, employment and transportation, the residents of the region could greatly benefit from a regional Section 8 program. That is, one administering entity for the five Section 8 programs currently in place in greater Baltimore.

February 2012 Page 66
Such an endeavor would require a great deal of re-organization and collaboration, but the benefits to the potential end-users of the program would outweigh the initial costs. Ideally, there would be one set of policies and procedures for the program, which would be administered for the entire region. While there may be one intake office located in each jurisdiction, there would be a single set of rules and regulations, including portability requirements that would enable applicants to move around the region without any artificial barriers based on municipal boundaries. Such a system would affirmatively further fair housing for the multitude of members of the protected classes who rely on Section 8 vouchers for housing choice.
Similar approaches are recommended in the Fair Housing Action Plan of this AI to improve other policy areas. In total, they represent a shift in the mindset of participating jurisdictions to collectively implement means of expanding housing choice.
VI. Fair Housing Advocacy Organizations In the absence of substantive fair housing action at the regional level, the work of fair housing advocacy organizations has become critically important to creating new housing opportunities for members of the protected classes in and around Baltimore.
In particular, the Baltimore Regional Housing Campaign advocates for the alignment of public policies and private investments to overcome racial and economic segregation and promote the right and means of all families to live in opportunity-rich, low-poverty areas with high-performing schools and economic prosperity. The Campaign involves the Greater Baltimore Urban League, the Innovative Housing Institute, BRIDGE, ACLU of Maryland, the Poverty and Race Research Action Council (PRRAC) and the Citizens Planning and Housing Association. The group’s work has included advocacy for land use policies that increase housing choice for low-income families, facilitating investment that creates affordable housing in high-opportunity communities, working to eliminate impediments to fair housing and building regional support for mixed-income communities and housing mobility programs. Through such actions, the
OBSERVATION: A regional Section 8 Housing Choice Voucher Program in the Baltimore area would expand fair housing choice for low-income minorities, in particular Black households, whose current housing opportunities are restricted to the urban core of the City of Baltimore. With better housing and education opportunities available in the suburban counties, as well as the majority of projected employment growth, to not regionalize the Section 8 program would perpetuate the long-established residential segregation patterns. This inaction, in and of itself, would be discriminatory.

February 2012 Page 67
Campaign serves a watchdog function that has been essential to the progress made in the Baltimore region to affirmatively further fair housing.
The Campaign’s component advocacy organizations have worked in similar roles, evaluating the policy direction of local governments and driving changes that eliminate impediments to housing choice. Legal Aid, in addition to the aforementioned agencies, has influenced housing policy discussions.
Testing for fair housing discrimination in the private market in the greater Baltimore region has been the responsibility of Baltimore Neighborhoods, Inc., which contracts with entitlement communities to provide this service as well as education and outreach. Other organizations providing education and outreach include the Greater Baltimore Community Housing Resource Board and the Maryland Disability Law Center.
Residents who experience housing discrimination can report it to a variety of public and non-profit agencies, including the Baltimore City Community Relations Commission, the Baltimore County Human Relations Commission, the Anne Arundel County Human Relations Commission, the Howard County Office of Human Rights, the Maryland Disability Law Center, HUD FHEO and Baltimore Neighborhoods, Inc. All of these organizations provide complaint intake, investigation, mediation and referral, and some are additionally empowered to enforce anti-discrimination laws.
OBSERVATION: There is an overlap of services provided within the fair housing advocacy industry in the Baltimore region. While Baltimore Neighborhoods, Inc. is the only organization that provides paired testing services, several advocacy organizations provide outreach and education services. Another category of advocacy organizations serves a fair housing watchdog function (i.e., ACLU, Legal Aid, etc.). Generally speaking, there is little communication and collaboration within the industry. Some advocates compete against one another for scarce CDBG funds to support their operations. Some advocacy organizations are struggling for their very financial survival. This competitive climate detracts from the region’s ability to address fair housing impediments. All of this suggests the need for a streamlined and more highly organized framework for the delivery of fair housing services to the region.

February 2012 Page 68
VII. State of Maryland Qualified Allocation Plan The Qualified Allocation Plan (QAP) is a public policy that establishes the Maryland Department of Housing and Community Development’s priorities for rental housing initiatives financed in part with equity from the sale of Low Income Housing Tax Credits. The QAP is periodically updated for updates and legislative changes. The latest QAP, approved in late January 2011, includes changes from the 2010 QAP.
Because the competition for tax credits is robust, tax credit developers design their rental housing projects to achieve maximum scoring under DHCD’s scoring categories. The QAP has a major impact on what populations are served, the types of projects that will be undertaken (i.e., new construction or rehabilitation of existing dwellings) and, indirectly, where rental housing is built or rehabilitated.
In a recent federal fair housing case, The Inclusive Communities Project, Inc. v. Texas Department of Housing and Community Affairs (N.D. Tex. 2010), the Texas QAP was challenged by a local affordable housing advocate. The Department of Housing and Community Affairs is the housing finance agency for the State of Texas. The lawsuit alleged that TDHCA disproportionately approved tax credits for low-income housing in minority neighborhoods and denied applications for family tax credit housing in predominantly Caucasian neighborhoods. The plaintiff alleged that TDHCA's policy in awarding credits perpetuated racial segregation in violation of the FHA. TDC argued that it prioritized tax credit applications for projects located in QCTs in accordance with Section 42 and that as such, it was unavoidable that tax credit projects would be located in concentrated minority neighborhoods rather than Caucasian neighborhoods. TDHCA submitted a motion for summary judgment (i.e., dismissal of the case). On September 28, 2010, Judge Fitzwater denied TDHCA's motion and affirmed the plaintiff's standing to sue. This case is now headed to trial. It is within this context that DHCD’s QAP plays a critical role in the fair housing landscape across the Baltimore region.
When a draft of the 2011 Maryland QAP was originally released for public review in late 2010, the Baltimore Regional Housing Campaign (BRHC) responded to DHCD with comments indicating that the QAP is out of compliance with DHCD’s federal obligation to affirmatively further fair housing. Particularly:
BRHC noted that a threshold requirement for local government support was carried from the 2010 QAP into the new edition. This “exclusionary tool,” as it is labeled in the comments, allows a community that is hostile to affordable housing for lower-income families to block proposed projects. Local governments may withhold approval for projects without stating a justification. The result is that developers opt out of developing family housing in areas known for resistance to lower-income housing, choosing instead to concentrate efforts on elderly housing or other locations known to accept lower-income housing. This presents an impediment to fair housing

February 2012 Page 69
choice by substantially narrowing the types and locations of neighborhoods where affordable family housing is likely to be developed.
In an effort to incentivize the spread of affordable housing into areas of opportunity, thereby mitigating economic and racial segregation, the 2011 QAP awards five points to applications for projects with “above average” indicators of opportunity. BRHC argued that five points out of a total of 305 is inadequate, and that DHCD should award 10 points, along with other considerations, for projects meeting that criterion.
OBSERVATION: Tax-credit housing projects across the Baltimore region are strongly influenced by the state’s allocation policy for tax credits, the Qualified Allocation Plan. The current iteration of this document presents multiple policy impediments to fair housing choice.

February 2012 Page 70
9. REGIONAL IMPEDIMENTS TO FAIR HOUSING CHOICE Regional impediments are those barriers that are multi-jurisdictional in nature and that limit fair housing choice for members of the protected classes. The purpose of this section of the AI is to encourage local officials to think and act regionally to overcome impediments that transcend individual HUD entitlement jurisdictions or otherwise offer opportunities to achieve efficiencies in housing production or the delivery of fair housing services. 1. The Baltimore Regional Fair Housing Group (“the Group”) is an
underutilized asset. The Group is an informal affiliation of HUD entitlement communities in the Baltimore Metropolitan Area. In concept, the Group is a valuable mechanism for intergovernmental cooperation on matters pertaining to housing and community development. Members of the Group (including Baltimore City, Baltimore County, Howard County and Harford County) collaborated to conduct this regional AI in 2009. Anne Arundel County later joined in the AI initiative. The motivation for conducting the AI on a regional scale was to define a fair housing strategy wherein each entitlement jurisdiction would play a role in affirmatively further fair housing in the Baltimore Metropolitan Area. Fair housing-related legal actions in the Baltimore area during the past 15 years envision a regional approach to the deconcentration of poverty in the City of Baltimore. Furthermore, there are certain fair housing activities such as education, outreach, testing and enforcement that can be conducted more efficiently at the regional level. While the Group has taken an important step in conducting a regional AI, it has not yet realized its full potential as an important organizational facilitator for positive change.
2. There is a lack of adequate public transportation connecting the urban core of Baltimore City with the suburban employment centers in the surrounding counties. For example, Anne Arundel County has only two bus routes (Ritchie Highway corridor and Riviera Beach), and there is a relative absence of fixed-route service to BWI airport. Route-planning decisions made by the Maryland Transit Administration are ostensibly based on balancing need with available resources, but the pattern of areas served and underserved suggests that the process is not without political influence. Gaps in the existing transportation network exacerbate the intractable concentrations of poverty in the City.
3. There are no requirements in the Smart Sites nomination form pertaining
specifically to affordable housing. Through the Smart Sites program, high-impact smart growth initiatives can attain project-based designation that facilitates agency coordination and the targeting of resources. In its nomination form, the State provides additional points to developers seeking low income housing tax credits for projects located in a Transit Oriented Development (“TOD”) Zone, but does not require that jurisdictions submitting sites for TOD

February 2012 Page 71
designation include a strategy to ensure that there is a range of housing opportunities available.
4. Section 8 Housing Choice Vouchers are one of the most effective means of
deconcentrating poverty in the Baltimore metropolitan area. However, the Section 8 program faces impediments, as follow:
a. The program is administered by separate agencies that maintain
unique sets of administrative requirements and procedures, an arrangement that complicates porting for voucher holders who wish to move among local jurisdictions. The administration of portability in each jurisdiction should be coordinated to achieve maximum consistency with other housing authorities across the region, which would have the effect of opening more doors to voucher holders.
b. The lack of a state law prohibiting discrimination on the basis of
a person’s source of income means that effectively, landlords in localities that do not offer this protection may lawfully deny housing to voucher holders. Currently, only Howard County has a law that prohibits discrimination based on source of income. New fair housing legislation is needed throughout the region that adds source of income as a protected class. Bills prohibiting discrimination based on source of income have been considered by the State legislature over the past few years. Although they have not been enacted, the support for this legislation has grown. There is a need for the entitlement jurisdictions to work together on the enactment of such a law.
c. Voucher payment standards are insufficient to afford units in
numerous areas of the region, and significant federal cutbacks in the resources available to the Section 8 program have made raising payment standards unrealistic. Ideally, payment standards would be increased for persons with disabilities and other members of the protected classes who wish to make affirmative moves from impacted neighborhoods to higher-cost, non-impacted neighborhoods. Funding limitations make this prospect currently impossible.
5. Segregated housing patterns in the region are reinforced by a provision in
Maryland’s Qualified Allocation Plan that requires local government to approve and contribute to tax credit projects. This policy increases the likelihood that proposed tax credit projects will be resisted by NIMBYists or through political intervention.

February 2012 Page 72
6. Fair housing training as a component of real estate agent continuing education is lacking. Training is limited to a discussion of federal fair housing law. There is little or no required training for real estate agents relative to state fair housing law or the provisions of local fair housing laws. Several fair housing trainers across the state provide fair housing training services, but the quality and depth of the training varies considerably depending on the entity that is providing the training.
7. The results of paired testing conducted in Baltimore City, Baltimore
County and Harford County indicate that housing discrimination continues to exist, at least in these jurisdictions. While some forms of discrimination may be intentional, other acts of discrimination reflect a lack of knowledge and understanding on the part of landlords. There is a need for expanded fair housing training and routine continuing education for landlords, apartment management staff, condominium associations and homeowner associations.
8. Budgetary, practical and legal considerations have made it difficult to
maintain existing public and affordable housing and create new units. More than 90% of all public housing units across the region are owned and operated by the Housing Authority of the City of Baltimore (HABC), which houses more than 20,000 residents in 10,000 housing units. Many of HABC’s units are non-viable and obsolete, yet resources do not exist that would allow the Authority to replace units at the rate at which they are lost from the inventory. The reduction in the number of public and assisted housing units often reduces the number of hard units available to low-income persons across the region, many of whom are members of the protected classes.
9. A lack of affordable, accessible units is an impediment to persons with
mobility disabilities. During the development of this AI, advocates reported an undersupply of affordable units accessible to persons with disabilities. However, it was beyond the scope of this report to determine whether and the extent to which there is an unmet need for accessible housing. Additional research is needed throughout the region to define the unmet need for accessible and visitable housing. This information will aid PHAs and other agencies in their Section 504 planning responsibilities and will guide public agencies in determining the appropriate number of accessible units to demand of developers receiving public funds.
10. Tax credit equity investors lack an appetite for scattered site projects. This
eliminates an opportunity to acquire abandoned and foreclosed properties for the creation of affordable family rental housing. Participating jurisdictions should advocate that Maryland’s QAP be amended to more effectively incentivize scattered site tax credit housing in the Baltimore area.

February 2012 Page 73
11. Due to the varying methods among participating jurisdictions of responding to fair housing complaints and enforcing local fair housing statutes, there is the potential for confusion among residents as to which rights and procedures apply in which areas. The Maryland Commission on Civil Rights serves as a regional agency to enforce both state and federal fair housing laws, but local provisions vary. It would be helpful for housing consumers to be educated on local, state and federal fair housing laws and enforcement procedures.
12. Without exception, PHAs and local CDBG/HOME administrators interviewed
during the AI expressed a commitment to comply with HUD’s expectations with regard to affirmatively furthering fair housing (AFFH). However, the participation of elected officials and the strengthening of political will are key to the implementation of fair housing strategies. It is important that City and county elected officials fully understand and respect HUD’s mandate to AFFH, a task HUD delegates to recipients of the federal funds it administers. Elected leaders in the Baltimore region would benefit from an educational effort aimed at expanding knowledge and awareness of HUD’s expectations on the part of elected officials. An education effort may also facilitate meaningful participation among elected leaders in the regional fair housing discussion and taking steps to AFFH in the Baltimore region.

February 2012 Page 74
10. REGIONAL FAIR HOUSING ACTION PLAN This section of the AI identifies specific actions that can be taken to ameliorate regional impediments to fair housing choice.
a. Actions to preserve the supply of affordable rental housing for families:
i. On a regional basis, support a replacement policy that encourages the region to work together to:
1. Preserve the number of affordable housing units available by replacing vacant units or creating equivalent units in opportunity areas whenever economically feasible, and/or
2. Provide housing choice vouchers, subject to funding availability, relocation assistance and mobility counseling for displaced families within the region.
b. Actions to expand the supply of affordable rental housing for
families in opportunity areas:
i. Encourage the State of Maryland to revise its QAP and other vehicles for affordable housing to:
1. Create a setaside for tax credit projects in opportunity areas of the Baltimore region
2. Give preference to family units in opportunity neighborhoods
3. Eliminate local approval requirements, and 4. Create incentives for scattered site tax credit projects.
c. Actions to educate elected officials on affirmatively furthering fair
housing:
i. Work with HUD, the Maryland Commission on Civil Rights, BMC or all three to conduct AFFH workshops for the elected officials of the participating jurisdictions.
d. Actions to expand the supply of accessible and affordable housing:
i. Determine the unmet need for affordable, accessible housing for
persons with mobility impairments in the Baltimore Metropolitan Area.
ii. Take steps to address the identified unmet need for affordable, accessible housing for persons with mobility or sensory impairments in the Baltimore Metropolitan Area, which may include increasing the percentage of newly constructed rental housing units that must be made accessible for wheelchair users

February 2012 Page 75
in accordance with the governing standards in place, and/or requiring that some percentage of newly constructed residential units meet universal design standards.
iii. Sponsor informational and education sessions for those local
jurisdictions in the region that do not have inclusionary zoning laws. The sessions would focus on using such legislation to require that a percentage of all newly constructed housing units be affordable to low and moderate income households, and on tools that may be used as incentives to create affordable housing, such as public infrastructure subsidies, density bonuses and tax increment financing..
iv. Convene a meeting with the State of Maryland Department of Housing and Community Development, which already maintains a database of apartments and identifies units that are wheelchair accessible, to discuss steps that may be taken that will result in more landlords listing their units in the State database, especially landlords with units that are accessible or have accessible features. Such steps may include, but not be limited to, conducting regional outreach and education to property managers on the importance of submitting information regarding accessible units to the database. Explore how the database may be improved and/or linked to services like socialservice.com.
e. Organizational strategies for inter-jurisdictional cooperation and collaboration relative to fair housing:
i. Formalize the regional efforts to address fair housing issues through a formal memorandum of understanding (“MOU”), entered into by Anne Arundel, Baltimore, Harford and Howard Counties and Baltimore City (the “Baltimore Regional Fair Housing Group” or the “Group”). Pursuant to the MOU, each jurisdiction would address the regional issues by committing staff time to meet on a regular basis and financial resources, as available, such as local entitlement funds, competitive FHIP funds, and Sustainable Communities Initiative planning funds to carry out regional actions to address fair housing impediments. Funds received would be made available for uniform fair housing testing, education and outreach throughout the region.
ii. The Baltimore Regional Fair Housing Group will set goals each year and establish a schedule, which prioritizes the action steps recommended under this plan and articulates the scope of work and expected outcomes for each action. The Group’s regional

February 2012 Page 76
accomplishments will be reported in each participating jurisdiction’s CAPER.
iii. The Baltimore Regional Fair Housing Group will work to
establish routine interaction and cooperation among the Baltimore Metropolitan Council (“BMC”), fair housing advocates, the entity implementing the mobility program established pursuant to the Thompson partial consent decree, transportation agencies, planning and zoning officials and other interested parties regarding the implementation of the regional AI.
iv. Examine the Section 8 porting procedures of each jurisdiction and, to the extent they are inconsistent, make them consistent. Work with HUD to convene a meeting to discuss porting procedures and regional cooperation. Request additional financial assistance from HUD to allow jurisdictions to implement increased payment standards to encourage moves to opportunity areas. If HUD provides the requested financial assistance, implement the increased payment standards.
f. Actions to encourage the inclusion of public transportation in
opportunity areas of the region:
i. Encourage entities engaged in transportation planning to involve housing agencies, housing advocates and developers of affordable housing in their planning and policy development processes, including obtaining their comments on specific programs, initiatives and policies released by local, state and federal transportation agencies and on funding strategies.
ii. Encourage coordination between transportation and housing agencies to more effectively align housing and transportation investments and resources and to reflect both state and federal policies that are requiring more integrated approaches to community revitalization and development.
iii. Encourage MTA to create a bus line that circles the Baltimore
beltway and includes multiple stops.
iv. Encourage MTA to review public transportation routes to ensure that:
1. Service is provided between residential opportunity areas
and areas of employment opportunity and job growth for both first shift and second shift workers

February 2012 Page 77
2. Service is provided between affordable housing resources and areas of employment opportunity and job growth for both first shift and second shift workers
3. Service is provided between residential opportunity areas and educational institutions and health care facilities, and
4. The various transportation systems are connected in order for riders to move easily from one system to another.
iv. Encourage the State to include affordable housing as part of the
requirements at sites designated as either a Smart Site or Transit Oriented Development (TOD) site.
vi. Pursue HUD and MD-DHCD Sustainable Communities opportunities, which will include:
1. Working with BMC on responding to Sustainable
Communities NOFAs, and 2. Seeking funds to create a regional housing strategy, which
would include funds for staff and a study to develop regional funding mechanisms.
g. Legislative actions
i. Advocate for the adoption of a statewide law that would include source of income as a class protected from discrimination.
h. Education and Outreach
i. Continue to hold routine regional education events on fair
housing issues, especially as a means by which to educate housing professionals on relevant fair housing issues.
ii. Develop a brochure, to be distributed regionally and placed on each jurisdiction’s website, and a training program to educate multi-family property managers and landlords, especially those that operate in multiple jurisdictions, and real estate agents on the different fair housing ordinances and their applicability across the region. Use the Howard County training package and agreement with the Howard County Association of Realtors as a model.

February 2012 Page 78
11. SIGNATURE PAGE FOR PARTICIPATING JURISDICTIONS By my signature, I certify that the Analysis of Impediments to Fair Housing Choice for the Baltimore region is in compliance with the intent and directives of the regulations of the Community Development Block Grant program. Anne Arundel County (Signature of Authorizing Official) (Date) Baltimore County (Signature of Authorizing Official) (Date) City of Baltimore (Signature of Authorizing Official) (Date) Harford County (Signature of Authorizing Official) (Date) Howard County (Signature of Authorizing Official) (Date)

1
Appendix PUBLIC REVIEW OF DRAFT AI AND REVIEW OF COMMENTS RECEIVED The Analysis of Impediments to Fair Housing Choice prepared for the City of Baltimore and the surrounding counties of Anne Arundel, Baltimore, Harford and Howard, as well as for the region as a whole, was made available for public review and comment beginning December 7, 2011 and ending on February 1, 2012. Copies of the draft documents were available to access online. Hard copies were also available for review at the Enoch Pratt Free Library located at 400 Cathedral Street in downtown Baltimore. A Public Hearing was held on January 18, 2012 in the Board of Estimates Room in Baltimore City Hall. A copy of the minutes from the Public Hearing is included in this Appendix. Written comments on the draft AI documents were accepted through February 1, 2012. Copies of all written comments received through February 1, 2012 are included in this Appendix. Several of the written comments warrant no response from the jurisdictions. These comments stated a position on the Draft AI, but did not pose a question or request additional information. The following narrative provides responses to those written comments which the jurisdictions deemed needed a response. A comment regarding the analysis of the State of Maryland’s Qualified Allocation Plan (QAP) and disputed conclusions drawn in that section of the Draft AI was received from John Greiner, Housing Policy Officer, Maryland Department of Housing and Community Development.
Jurisdictions’ Response: The Draft AI has been updated to reflect the clarifications provided on the frequency of QAP updates and the use of public housing waiting lists. It has also been updated to note the statutory requirement to favor projects in qualified census tracts. However, the jurisdictions maintain that the local support requirements contained in the QAP establish an institutional mechanism for local “NIMBY” opposition to LIHTC housing without regard to the worthiness of projects proposed, as well as a pocket veto for local governments over LIHTC allocations that would discourage developers from even considering sites in communities resistant to affordable housing. The effects of this policy are obvious in the geographic concentration of LIHTC developments across the Baltimore region. The Baltimore Regional Housing Commission (BRHC) has commissioned original research demonstrating that even when LIHTC family projects are located in higher-opportunity suburban areas outside the City, they are often located in pockets of racial and ethnic segregation. These and other conclusions are further explained in BRHC’s housing discrimination complaint filed against the State of Maryland in August 2011.
Comments regarding the failure of the AI to address impediments to fair housing choice encountered by homeless persons were received from Carolyn Johnson, Managing Attorney,

2
Homeless Persons Representative Project, Inc. and Lauren Young, Director of Litigation, Maryland Disability Law Center.
Jurisdictions’ Response: The Draft AI included demographic data on members of the protected classes. To the extent that the homeless population includes members of the protected classes (African Americans, families with children and people with disabilities as specified in the comment), then the Draft AI addressed impediments relative to the homeless population. To the extent that planning commissions, elected bodies and other public boards and commissions involved in the decision-making process (required of/by applicants of such facilities) may need fair housing training, such training is included in the Fair Housing Action Plan (FHAP). To the extent that management and operational staff of such homeless facilities may need fair housing training, such training is included in the FHAP.
Comments regarding the failure of the Draft AI to provide a detailed action plan were received from Lauren Young, Director of Litigation, Maryland Disability Law Center and Barbara A. Samuels, Managing Attorney – Fair Housing, American Civil Liberties Union of Maryland.
Jurisdictions’ Response: The uncertainty of decreases in federal entitlement funding in the current year and over the next several years has caused the jurisdictions to proceed with caution in their respective and regional fair housing planning and implementation initiatives. To the extent that the recommended actions will be implemented, the jurisdictions will invest federal entitlement dollars to accomplish this. However, establishing benchmarks that may prove unattainable due to severe budgetary limitations will not serve any advantage.
A comment regarding the lack of participation by non-governmental rental housing providers in the AI process was received from Katherine Kelly Howard, Legislative Committee Chair, Maryland Multi-Housing Association, Inc.
Jurisdictions’ Response: The lack of an invitation was an inadvertent omission during the stakeholder interviewing process. The Maryland Multi-Housing Association will be noted as a stakeholder in the next AI process.
A comment about the process of how the FHAPs will be incorporated into each respective jurisdiction’s Consolidated Plan, Annual Plan, Public Housing Agency Plan, or Moving to Work Plan was received from Barbara A. Samuels, Managing Attorney – Fair Housing, American Civil Liberties Union of Maryland.
Jurisdictions’ Response: Each jurisdiction has the option of including fair housing initiatives from their AI document, as well as the regional AI document, into their current planning process. There is also the option of amending the current year’s planning document to incorporate the same.

3
The jurisdictions have made the determination that additional research will not be conducted at this time nor incorporated in the Draft AI. Relative to several comments, the jurisdictions were of the opinion that some of the additional analysis requested by comments would have simply bolstered the case already stated in the Draft AI: the need to create affordable housing opportunities outside of impacted areas. The Draft AI is the result of a process initiated in September 2009. The jurisdictions believe that it is in the best interest of all parties involved, most notably members of the protected classes, to conclude the AI process and begin the implementation of the FHAPs. Comments relative to the lack of specific data shall be maintained on file by the jurisdictions for the next AI process.

Baltimore Metropolitan Region’s Analysis of Impediments to Fair Housing Choice
Public Hearing Minutes
Wednesday, January 18, 2012
6:30 p.m.
Board of Estimates Room, City Hall 100 N. Holliday Street, Baltimore MD 21202
On January 18, 2012, the Baltimore Regional Fair Housing Group held a public hearing to solicit comments from the citizens of the Baltimore metropolitan area, including interested stakeholders, on the draft Analysis of Impediments to Fair Housing Choice (AI), which was released by Baltimore City and Anne Arundel, Baltimore, Harford and Howard Counties on Wednesday, December 7, 2011 for public review and comment. Representatives from the local jurisdictions in attendance included Ms. Erin Karpewicz, Anne Arundel County; Ms. Amy Wilkinson and Mr. Steve Janes, Baltimore City; Ms. Elizabeth Glenn and Andrea Van Arsdale, Baltimore County; Ms. Sharon Grzanka and Ms. Sylvia Bryant, Harford County; and Ms. Tiffany Smith and Ms. Mary Campbell, Howard County. Also in attendance was Ms. Marjorie Williams, representing Mullin & Lonergan Associates, the independent consultant hired to conduct the AI. A listing of individual members of the public in attendance is attached as “Exhibit 1.” At 6:31 p.m. Ms. Wilkinson called the public hearing to order. She welcomed everyone to the hearing and introduced the local government representatives identified in the preceding paragraph and Ms. Williams to the audience. She stated that the purpose of the hearing was to provide an overview of the AI process, the observed possible impediments and the corresponding action items, and to afford the public an opportunity to comment on the document. Ms. Williams gave an overview of the AI process and the documentation utilized to conduct the analysis and provided a definition of affirmatively furthering fair housing. Ms. Williams then presented an overview of impediments identified and action steps listed in both the Regional AI and each individual local component. A copy of her presentation is attached as “Exhibit 2.” Ms. Wilkinson then reviewed the process for providing comments on the AI. She stated that those in attendance who indicated on the sign-in sheet that they wanted to speak would be given an opportunity to speak for up to five (5) minutes. She also strongly encouraged those wishing to comment to also provide written comments on or before February 1, 2012. Those wishing to speak were then called in order of sign up. The following members of the general public and individuals representing organizations provided verbal comments:
Ms. Katherine Howard, representing Maryland Multi-Housing Association Ms. Cecilia Norman “Wingo”

William Fields Ms. Lauren Young, representing the Maryland Disability Law Center Ms. Maureen Daly, representing BRIDGE and Beyond the Boundaries for the Archdiocese of Baltimore Ms. Naomi Binko, representing BRIDGE Bro. Jerry O’Leary, representing Beyond the Boundaries of the Archdiocese of Baltimore and the Bishop Murphy Initiative for Justice and Peace Rev. Alan D. Traher, representing The Lutheran Church of Our Redeemer and BRIDGE Mr. Mel Freeman, representing Citizens Planning and Housing Association Ms. Carolyn Johnson, representing the Homeless Persons Representation Project Mr. Patrick Maier, representing the Innovative Housing Institute and the Baltimore Regional Housing Campaign Ms. Barbara Samuels, representing ACLU of Maryland Ms. Helene F. Perry, representing Beyond the Boundaries Ms. Ferguson, representing Baltimore County NAACP Mr. Gregory Countess, representing the Legal Aid Bureau Ms. Wilkinson then reminded those in attendance that written comments would be accepted until Wednesday, February 1, 2012 at 4:30 p.m. and that copies of the AI were available online and at various locations, and that a printout of the public notice detailing the availability of the AI was being handed out to anyone who needed it. At 8:40 p.m. the public hearing was concluded. Written Comments The attached written comments regarding the Draft Baltimore Metropolitan Region’s Analysis of Impediments to Fair Housing were received from the following individuals and organizations, on or before February 1, 2012:
1. Naomi Binko 2. Kaitlin Brennan, Housing Development Coordinator, Main Street Housing, Inc. 3. Gregory Countess, Assistant Director of Advocacy for Housing & Community Economic
Development and Tabinda Riaz, Staff Attorney, Maryland Legal Aid Bureau, Inc. 4. Maureen Daly 5. Mel Freeman, Executive Director, Citizens Planning & Housing Association, Inc. 6. John M. Greiner, Housing Policy Officer, Maryland Department of Housing and
Community Development 7. Katherine Kelly Howard, Legislative Committee Chair, Maryland Multi-Housing
Association, Inc. 8. Carolyn Johnson, Managing Attorney, Homeless Persons Representation Project, Inc. 9. Patrick Maier, Executive Director, Innovative Housing Institute, on behalf of the
Baltimore Regional Housing Campaign

10. Brother Jerry O’Leary 11. Helene Perry 12. Michael Robinson, Baltimore Neighborhoods, Inc. 13. Barbara Samuels, Managing Attorney – Fair Housing, American Civil Liberties Union of
Maryland 14. Rev. Alan Traher, Pastor, The Lutheran Church of Our Redeemer 15. Lauren Young, Director of Litigation, Maryland Disability Law Center