regional drought mechanism - unescap.org · diminishing water levels in pasak chonlasit dam,...
TRANSCRIPT
16/10/2017
1
Regional Drought Mechanism
21st Session of ICC, RESAP
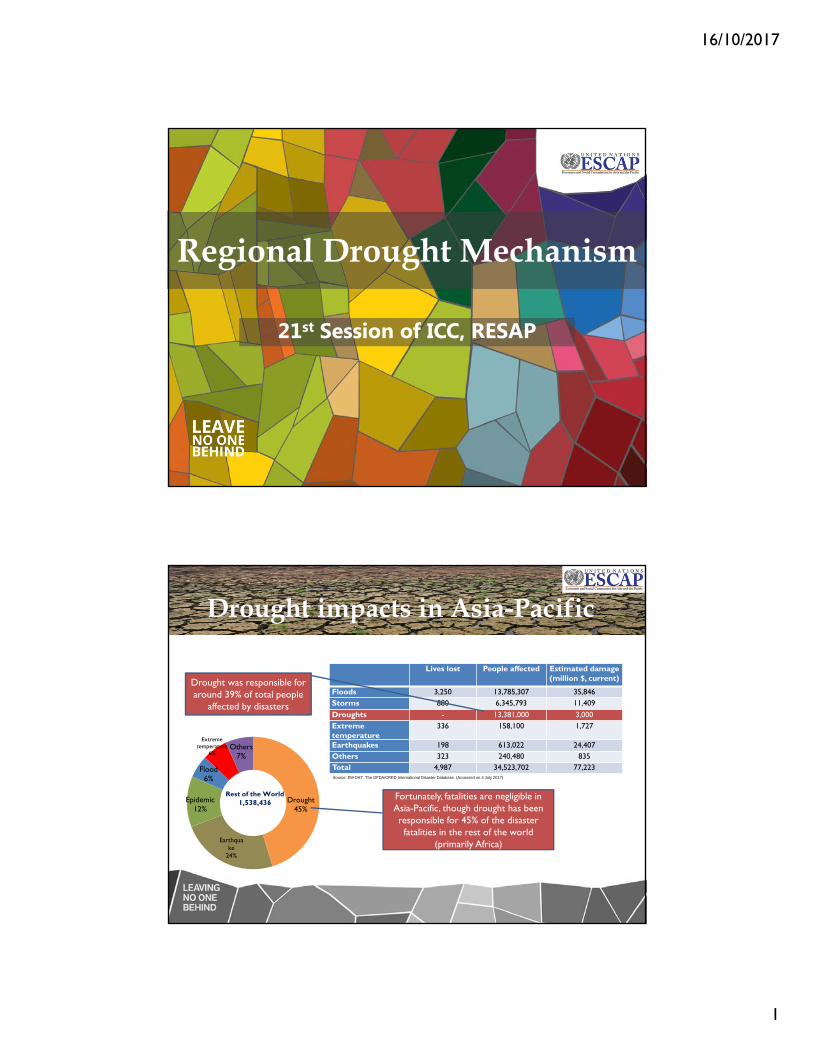
Lives lost People affected Estimated damage(million $, current)
Floods 3,250 13,785,307 35,846Storms 880 6,345,793 11,409
Droughts - 13,381,000 3,000Extreme temperature
336 158,100 1,727
Earthquakes 198 613,022 24,407Others 323 240,480 835Total 4,987 34,523,702 77,223Source: EM-DAT: The OFDA/CRED International Disaster Database. (Accessed on 4 July 2017)
Drought was responsible for around 39% of total people
affected by disasters
Drought45%
Earthquake
24%
Epidemic12%
Flood6%
Extreme temperature
6%Others
7%
Rest of the World 1,538,436
Fortunately, fatalities are negligible in Asia-Pacific, though drought has been responsible for 45% of the disaster fatalities in the rest of the world
(primarily Africa)
Drought impacts in Asia-Pacific
16/10/2017
2
In Cambodia, over 40,000 hectares of rice among 250,000 hectares of affected farmland were destroyed by drought in 2015 . Source: United Nations Office for Coordination of Humanitarian Affairs (2016). El Niño: Overview of Impact, Projected Humanitarian Needs and Response. Available from http://reliefweb.int/report/world/el-ni-o-overview-impact-projected-humanitarian-needs-and-response-21-september-2016
Viet Nam had its worst drought in 90 years, affecting 52 out of 63 provinces with a state of emergency declared in 18, affecting over 2 million people.
Source: Reliefweb (2016). South-East Asia: Drought - 2015-2017. Available from http://reliefweb.int/disaster/dr-2015-000180-vnm. (Accessed on 12 April 2017)
Diminishing water levels in Pasak Chonlasit Dam, Lopburi Province, Thailand, 2015. Source: GISTDA 2015
17 of Thailand’s reservoirs only had between 1 and 20 per cent of usable storage.
The El Niño also increased the risk of forest fires. In Indonesia, the toxic haze affected more than 40 million
people and caused illness to more than 500,000 people. Source: Relief Web Viet Nam: Drought and Saltwater Intrusion Situation Update No. 6 (as of 16 September 2016).
Available at http://reliefweb.int/report/viet-nam/viet-nam-drought-and-saltwater-intrusion-situation-update-no-6-16-september-2016 (Accessed on 17 April 2017)
El Niño induced drought in SE Asia
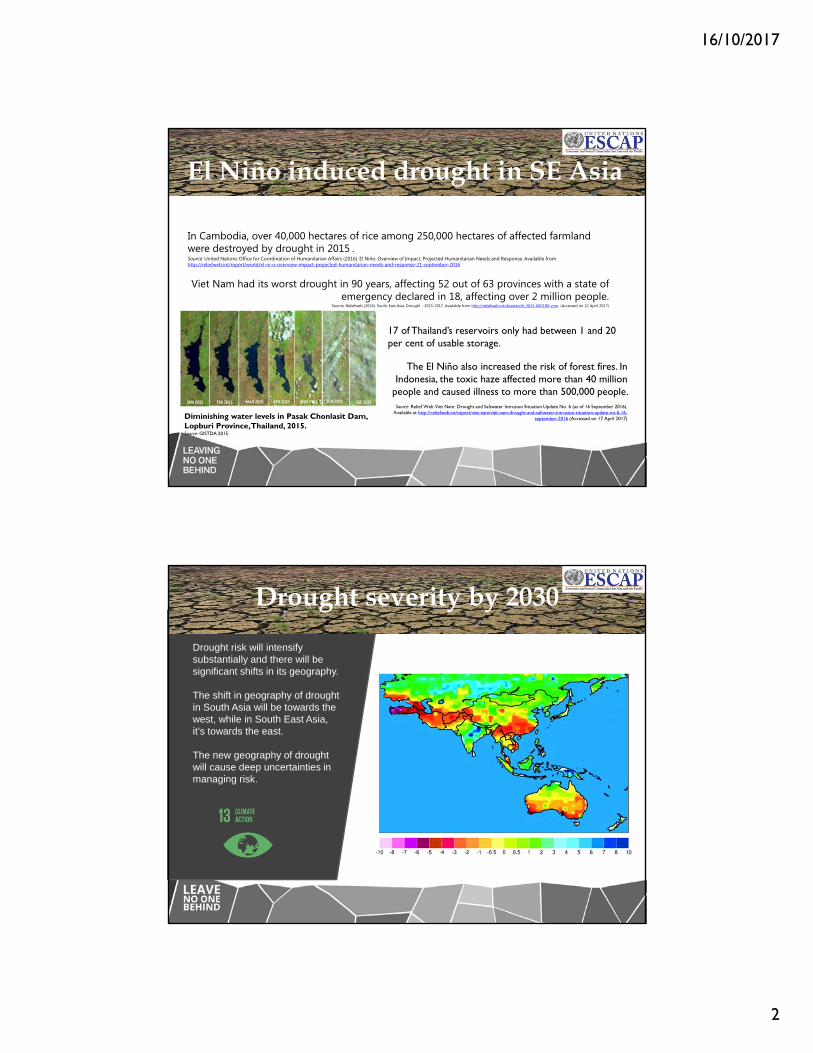
Drought risk will intensify substantially and there will be significant shifts in its geography.
The shift in geography of drought in South Asia will be towards the west, while in South East Asia, it’s towards the east.
The new geography of drought will cause deep uncertainties in managing risk.
Drought severity by 2030
16/10/2017
3
Regional Drought Mechanism Regional cooperative programme under RESAP to support
capacity building in space applications, the use of innovative tools and long term drought management.
Brings together countries more experienced in space applications and drought management (China, India, Thailand, Australia) with drought-prone countries (Cambodia, Myanmar, Mongolia, Sri Lanka, Nepal, Bangladesh, Kyrgyzstan, Afghanistan, etc.)
Enhance capacity of drought-prone countries to utilize integrated space and in-season ground data and information for drought monitoring and early warning
Ultimate aim for the Mechanism is to create a toolbox or menu of products, information and services to support the management of drought.
Drought mapping was made combined by 3 regions which has more than
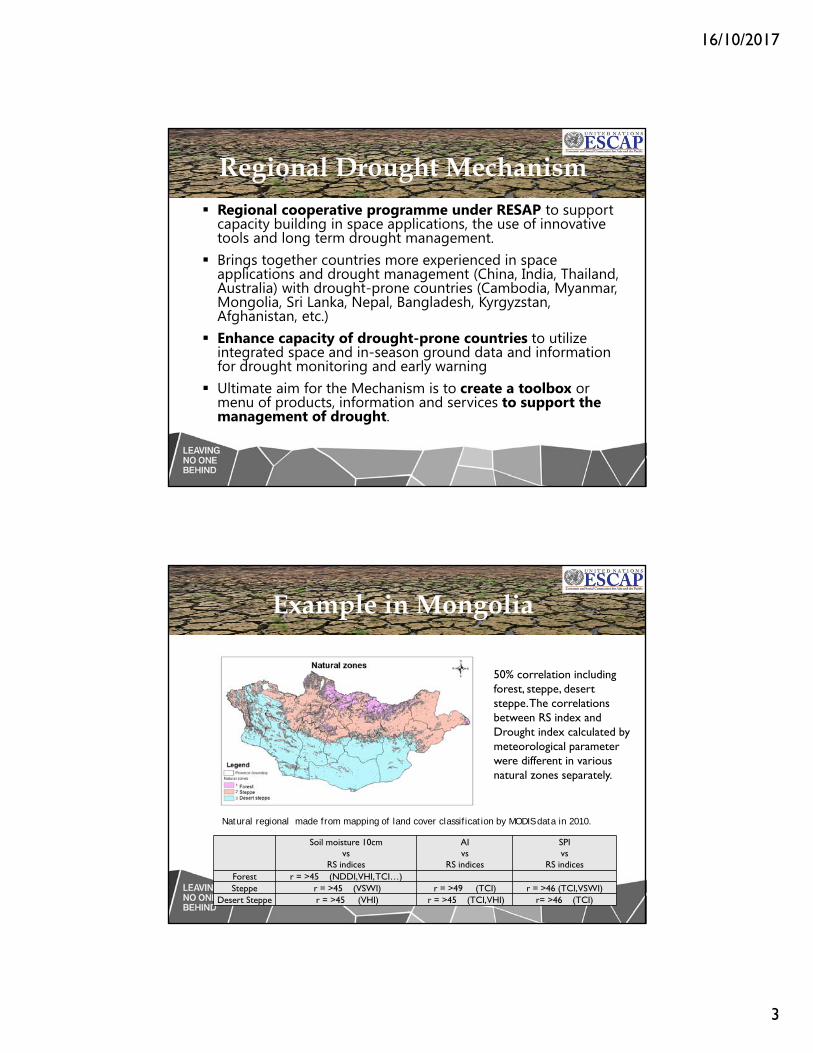
Natural regional made from mapping of land cover classification by MODIS data in 2010.
Agro-ecological zones identified
Soil moisture 10cm vs
RS indices
AIvs
RS indices
SPIvs
RS indicesForest r = >45 (NDDI, VHI, TCI…)Steppe r = >45 (VSWI) r = >49 (TCI) r = >46 (TCI, VSWI)
Desert Steppe r = >45 (VHI) r = >45 (TCI, VHI) r= >46 (TCI)
Example in Mongolia
50% correlation including forest, steppe, desert steppe. The correlations between RS index and Drought index calculated by meteorological parameter were different in various natural zones separately.

16/10/2017
4
Indices tested
VCI VHI VSDI
VTCI VSWI NMDI SPI AI
NDDI TCI
Mapping 10 drought indices using data 14 years.
Choice the following drought indices.
- RS drought indices (NDDI, TCI, VCI, VHI, VSWI)
- Meteorological indices (SPI, AI)
Indices tested
Customized tools for the country and environment

16/10/2017
5
Ground validation allows customization to the national conditions
The Seasonal Streamflow Forecasts of BOM will customize the water accounting system to Cambodia and help validate the drought indices in the DroughtWatch.
Uses methods to derive rainfall from satellite datasets and sparse in-situ networks to correct inherent biases of satellite data.
16/10/2017
6
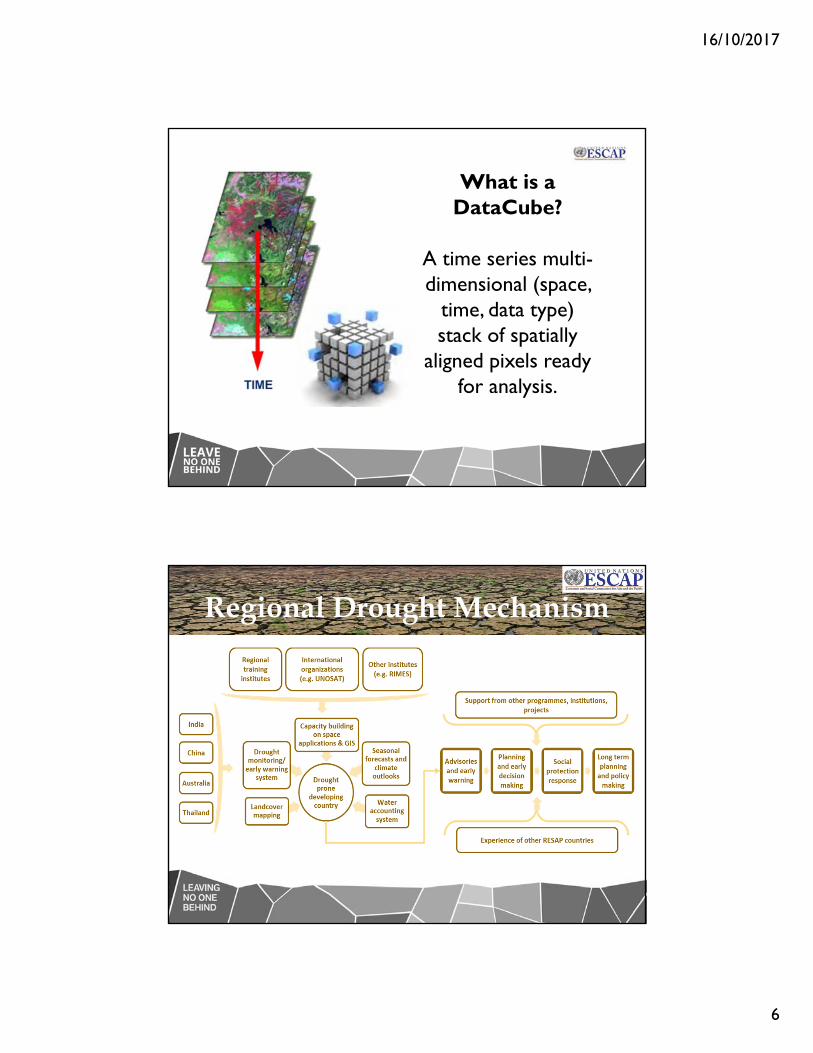
What is a DataCube?
A time series multi-dimensional (space,
time, data type) stack of spatially
aligned pixels ready for analysis.
Regional Drought MechanismRegional Drought Mechanism

16/10/2017
7
Thank you!