regional differences in philanthropy - rene bekkers · 3 this chapter explores regional differences...
TRANSCRIPT
1
Regional Differences in Philanthropy
René Bekkers
Center for Philanthropic Studies, VU University Amsterdam, the Netherlands
October 3, 2013
Chapter prepared for the
Routledge Companion to Philanthropy
edited by J. Harrow, T. Jung & S. Phillips
London: Routledge
ISBN 9780415783255
2
Acknowledgements
A previous version of this paper has been presented under the same title at the 41st Arnova
Conference, November 15, 2012, in Indianapolis and at the 6th ERNOP conference, July 11,
2013, in Riga. I thank the editors of the volume, John Wilson, and Pamala Wiepking for helpful
remarks. The current chapter is a revision of part 1 of the conference paper, posted at
http://www.giving.nl/2013/09/regional-differences-in-philanthropy-rene-bekkers/

3
This chapter explores regional differences in philanthropy, narrowly defined here as the
contribution of money to nonprofit organizations.1 Across the globe, the practices and traditions
in philanthropy differ strongly from one place to another. There are striking differences not only
in the size and nature of philanthropy between nations but also in the methods used to contribute
to nonprofit organizations. Regional differences occur not only between countries. At a smaller
geographic scale differences can be found between states (e.g., in the USA: Bielefeld, Rooney &
Steinberg, 2008; Putnam, 2000), provinces, regions, departments (e.g., in France: Cerphi, 2010),
municipalities (e.g., in the Netherlands: Bekkers & Veldhuizen, 2008), neighborhoods and zip
codes.
Regional differences are often found and used in fundraising practice (Schneider, 1996).
Nonprofit organizations use (small scale) geographical criteria to segment their donor database
or select target groups of potential donors for fundraising campaigns (Sargeant, Shang and
Associates, 2010, p. 160). In this chapter differences between geographical units (regardless of
scale) are called ‘regional differences’. The majority of studies on regional differences seek to
understand country differences in philanthropy, and the majority of these studies are about
differences between countries in Europe.
1 Philanthropy broadly defined is ‘voluntary action for the public good’ (Payton, 1988), which also includes
contributions of time (volunteering), blood and organ donation, and direct contributions to causes and recipients
without interference of nonprofit organizations. It is likely that regional differences in informal philanthropy and
volunteering are due to similar processes as regional differences in philanthropy. While the focus of this chapter is
on monetary donations, insights from the literature on other forms of volunteering also contribute to this chapter and
will be identified as such, and will be discussed primarily in footnotes.

4
Regional differences in philanthropy in Europe
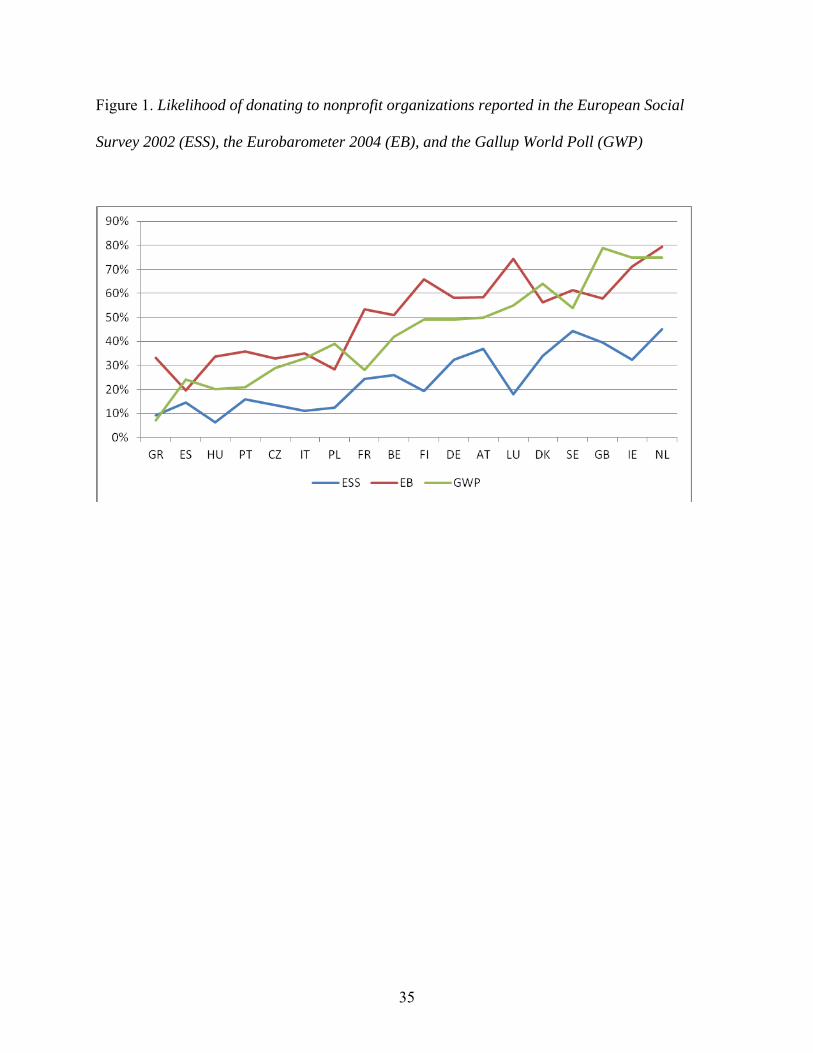
Figure 1 presents country differences in the likelihood of donating to nonprofit
organizations in three datasets. Only those countries that were covered in all of the datasets are
included in this figure. The countries in the figure are ordered by the average proportion of
respondents reporting donations in the three datasets.
[INSERT FIGURE 1 ABOUT HERE]
A first source of data on country differences is the extensive Eurobarometer (EB) survey
from 2004 on civic engagement. The EB data show that the proportion of the population
reporting donations to at least one out of 14 categories of nonprofit organizations varies from
20% in Spain to almost 80% in the Netherlands.2 A second source of data on country differences
in philanthropy is the Gallup World Poll (GWP).3 The GWP data show that the proportion of the
population reporting donations to charity in the course of a calendar year varies from 79% in the
UK to 7% in Greece (CAF, 2011). A third dataset, the European Social Survey (ESS) from 2002,
also shows considerable differences between countries in Europe.4
2 The Eurobarometer surveys are a series of opinion polls commissioned by the European Commission. EB62.2,
conducted among at least 1,000 citizens above the age of 15 through personal interviews by TNS Opinion & Social
in November-December 2004.
3 The World Gallup Poll is an omnibus survey on a broad variety of topics. Data are collected among at least 1,000
citizens per country above the age of 15 primarily through telephone interviews (in countries with at least 80%
telephone coverage; otherwise face-to-face interviews).
4 The ESS is a biennial general household survey conducted among at least 1,000 citizens above the age of 15
through face-to-face interviews throughout the European Union.

5
The country differences are spread over different ranges in the three datasets. In the ESS
the scores vary from 6% in Hungary to 45% in the Netherlands. In the EB the scores vary from
20% in Spain to 79% in the Netherlands; in the GWP they vary from 7% in Greece to 79% in the
UK.5
The figures for Spain and the Netherlands, the lowest and highest scoring countries in the
Eurobarometer survey, are 24% and 75%, respectively. As these numbers demonstrate, the
proportion of the population reporting engagement in philanthropy varies considerably for
specific countries between the three datasets. The figures for Finland are 65% in the
Eurobarometer but only 50% in the Gallup World Poll. The figures for the United Kingdom
show an opposite difference: a higher percentage (79%) in the Gallup data than in the
Eurobarometer (58%). In the ESS only 19% of the respondents in Finland reported donations,
and 39% of the respondents in the UK.
The discrepancies between these proportions vividly illustrate that in research on
philanthropy ‘methodology is destiny’ (Rooney, Steinberg & Schervish, 2001, 2004): the
different sampling strategies, data collection modes and questions used to measure philanthropy
can yield very different estimates for specific countries. While the proportions are markedly
different for some countries, the correlations between the proportions from the three datasets are
fairly strong: the EB-ESS correlation is .74; the ESS-Gallup correlation is .81 and the EB-Gallup
correlation is .80. The fact that these correlations are so high underscores that there are reliable
cross-country differences in philanthropy.
5 Because the research design of the ESS is more strongly standardized than that of the EB and the GWP, the larger
differences in the latter two datasets may be inflated by error variance.
6
How can the differences between countries in Europe in the engagement in philanthropy
be explained? What are the commonalities between countries with high proportions of donors in
the various datasets, and what are the commonalities between countries with low proportions?
One commonality of more philanthropic countries seems to be a geographic location in the richer
northwestern part of Europe, opposed to the more southern location and lower GDP of less
philanthropic countries. Also outside Europe we see high proportions of the population engaging
in philanthropy in countries with a higher GDP like Australia and the US (CAF, 2012). In other
respects, however, the highest proportions of donors are found in a quite heterogeneous
collection of countries. Both densely populated countries like the Netherlands and sparsely
populated countries like Sweden have high proportions of donors. While a predominantly
Catholic religious tradition is a commonality of the low ranking countries, we also see high
proportions of donors in two Catholic countries (Ireland, Luxemburg), amidst predominantly
Protestant countries (Denmark, Sweden) and secular countries (the Netherlands). Also there is a
mix of both large (Great Britain, Sweden) as well as small countries (the Netherlands,
Luxemburg). Also at the lower end of the distribution we find large (Spain) as well as small
countries (Czech Republic).
A warning on the analysis regional differences
While for fundraising purposes it may be enough to know which zip codes yield the
highest levels of giving, for scholars regional differences pose an interesting but notoriously
difficult research problem. The difficulty lies both in theory and empirics.
From a theoretical point of view, regional differences can be explained by a plethora of
different theories and hypotheses. In this chapter I discuss these theories and review the

7
empirical evidence available on these hypotheses. I will not examine the methodological
problems involved in testing hypotheses on regional differences. These problems pervade the
literature and discussing them would have doubled the length of this chapter. I will deal with
these problems and with potential solutions in future work.
Here I would like to issue a general warning. One of the most pressing problems is the
ecological fallacy that arises from correlating macro-level characteristics with each other
(Snijders and Bosker, 1999). Analyses that report correlations between characteristics of regions
suggest that contextual (‘ecological’) effects are at work. In fact, however, compositional effects
are often driving regional differences. In most cases differences in the composition of the
population are generating regional differences, and not so much the nature of the region. Without
adequate data and statistical models to analyze them the results of comparative studies can be
highly misleading. In the 1990s, hierarchical or ‘multilevel’ regression models have been
popularized as a statistical tool for the analysis of context influences (Snijders & Bosker (1999)
provide a useful introduction). Multilevel models can be used to test whether regional differences
are due to compositional or contextual influences.
The typical finding in multilevel analyses is that contextual influences are fairly small,
usually explaining only 5 to 10 percent of the variance. This means that the strong correlations
that are often found between regional characteristics are primarily due to the composition of the
population. An example is the correlation of .77 between voter turnout and the proportion of
blood donors in municipalities in the Netherlands (Bekkers & Veldhuizen, 2008). A subsequent
multilevel analysis (Veldhuizen & Bekkers, 2011), however, showed that only 6.5% of the
variance in blood donation at the individual level is due to the characteristics of the municipality;
93.5% of the variance was due to composition effects. Voter turnout was one of the significant
8
municipality characteristics but it explained only 0.03% of the variance. Another example is the
.58 correlation between GDP and the proportion of the population reporting engagement in
philanthropy (CAF, 2010). In a multilevel model, Gesthuizen, Van der Meer and Scheepers
(2008b) found the correlation between GDP and engagement in philanthropy at the individual
level to be only .005. These two examples should remind the reader that aggregate correlations
are likely to be substantially higher than the contextual influence. The implication for research
on regional differences is that explanations of regional differences should take the composition
of the population into account.
Two types of explanations of regional differences
Explanations for regional differences originate in different disciplines, including cross-cultural
psychology, political science, economics, history, sociology, and geography, each with its own
theories. In this sense the explanation of regional differences is similar to the explanation of
differences at the individual level: a comprehensive understanding of regional differences
requires a multidisciplinary approach.
Across these different disciplines, explanations of philanthropic activity can be grouped
into two types (Bekkers & Wiepking, 2011a): explanations that focus on the characteristics of
donors (and non-donors), and explanations that focus on the characteristics of situations in
which people donate (or do not donate). At the individual level, the first type of explanation
answers the question ‘who gives?’ and the second type answers the question ‘when do people
give?’ At the country level, the first type of explanation implies that philanthropy is flourishing
in some countries simply because these countries are populated by more philanthropic citizens.
This type of explanation figures prominently in cross-national comparative research. However,
9
the composition of the population is hard to influence by policy makers and fundraising
professionals. In contrast, the second type of question focuses on situations that are amenable to
change and influence. Hence it is this type of question that should occupy policy makers,
fundraising professionals and other professionals in the nonprofit sector.
Mechanisms that explain country differences in philanthropy
A comprehensive review of the empirical literature on philanthropy by individuals and
households (Bekkers & Wiepking, 2011a) groups the characteristics of situations into eight
mechanisms that drive charitable giving: (1) awareness of need; (2) solicitation; (3) costs and
benefits; (4) altruism; (5) reputation; (6) psychological benefits; (7) values; (8) efficacy.
Translating these mechanisms from the individual level to a higher level of aggregation,
individuals are expected to give more when they live in regions in which they (1) are more
strongly aware of the needs for contributions; (2) are more actively solicited for contributions;
(3) face lower material costs and reap more benefits from contributing; (4) are more strongly
concerned with the welfare of recipients; (5) obtain more social rewards or avoid larger
punishments for contributing; (6) feel better about their contribution or avoid feeling bad about
not contributing; (7) more strongly recognize their contribution as a way to create a world that is
consistent with their ideal world view; (8) experience their contribution to be more effective. The
remainder of this chapter is a discussion of these mechanisms. For each mechanism, I first
present the hypothesis and then the empirical evidence in research on regional differences.
10
Awareness of need
The awareness of need mechanism implies that knowing about the existence of a need for
contributions is a necessary condition for philanthropy. It is not a sufficient condition, however.
The empirical literature on philanthropy shows that many factors are moderating the effect of
need on giving (Bekkers & Wiepking, 2011a). The road from objective need to donations is
difficult, twisting and turning between the hills of the media landscape and the mountains of
denial of responsibility. Potential donors get information about objective needs through news
media. The news media infrastructure affects the information available to individuals.6 A general
hypothesis is that freedom of press and a higher level of activity of news media increases the
availability of information on social needs. A more specific hypothesis is that individuals in
countries with a stronger international orientation, have a higher awareness of needs among
distant recipients, and the amount contributed to international relief and development
organizations is larger. Individuals living in countries with a stronger focus on local issues will
be less likely to know about natural disasters, famine, war and disease overseas and will
therefore be less likely to engage in international philanthropy. The assumption that individuals
in countries with a stronger international orientation are less parochial and more prosocial
towards anonymous strangers in other countries receives support in an experiment (Buchan et al.,
2008) and in an advanced analysis of data on willingness to help immigrants from the European
Values Study (Koster, 2007). The specific hypothesis about engagement in international
philanthropy has not been tested extensively. A comparison of donations to international relief
6 In addition, news media preferences of consumers determine the selection of information that reaches them.
Potential donors interpret this information in a way that fits their world view and suits their psychological needs.
Research in social psychology shows that people have refined ways of legitimizing inaction when faced with
opportunities to give. These individual level processes however do not seem to be much different between regions.
11
and development in the United States and the Netherlands provides support for the hypothesis.
The US media are more strongly focused on domestic and local issues than the Dutch media
(Janssen, Kuipers & Verboord, 2008). Correspondingly, international giving accounts for a much
smaller portion of total giving in the US than in the Netherlands. Further comparisons of
additional countries are required to test this hypothesis.
At a smaller scale, awareness of local needs may translate into higher giving to address
these needs. One would expect higher levels of giving to local organizations in regions with
higher proportions of unemployed and homeless people for instance. To date, only one national
study has tested such predictions. Borgonovi (2008) found that the percentage of the population
in poverty in US counties is not related to either religious or secular giving, controlling for
individual level covariates. This finding shows that ‘voluntary resources are manifestly not
funnelled to those most in “need”, nor are organizations agglomerated in the most needy areas of
the metropolitan region’, as Wolch and Geiger (1983, p. 1078) concluded in an early study of
voluntarism in the Los Angeles metropolitan area. More recently, Britto, VanSlyke & Francis
(2011) analyzed data from 20 counties in the greater Metro Atlanta Area, finding that
engagement in philanthropy actually decreased with an index of community problems composed
of the percentage below poverty, the crime rate, and the median income of the respondent’s
county. This finding shows that the capacity to engage in philanthropy is an important factor in
responsiveness to need. As community problems increase, the resources to engage in
philanthropy to fight these problems decrease.

12
Solicitation
Many forms of philanthropy occur in response to solicitations for contributions. Without
solicitations, people are unlikely to engage in philanthropy spontaneously. However, it is
difficult to estimate the causal effect of solicitation at the individual level using cross-sectional
survey data. As targeting donors is selective, and often based on past donation behavior,
solicitations are endogenous (Lim, 2010; Paik & Navarre-Jackson, 2011). Experiments show that
many people actively avoid situations in which they are likely to be asked to donate money
(Pancer, McMullen, Kabatoff, Johnson & Pond, 1979; DellaVigna, List & Malmender, 2012).
Participants in these experiments who do receive solicitations are more likely to donate. This
does not mean however that an exogenous increase in the number of solicitations will lead to
higher levels of giving. In fact, two large scale studies among donors of health charities in the
Netherlands, one field experiment and an analysis of registered contributions, even find that
donors receiving an additional solicitation decrease the level of giving, at least in the short run
(Van Diepen, Donkers & Franses, 2009a, 2009b).
No studies to date have tested the hypothesis that individuals residing in places that are
targeted more heavily for fundraising campaigns are more likely to donate. One study has tested
whether the presence of a higher number of active nonprofit organizations in a region makes
individuals in that region more likely to contribute. Controlling for numerous other factors,
Bielefeld, Rooney & Steinberg (2008) find no relationship between the number of active
nonprofit organizations in a and the volume or likelihood of engagement in philanthropy.7
7 Rotolo and Wilson (2011) do find a positive relationship between the number of nonprofit organizations in a state
and the likelihood of secular volunteering at the individual level, but not with religious volunteering.
13
Costs
Access to financial resources lowers the costs of engagement in philanthropy (Bryant, Slaughter,
Kang, and Tax 2003; Wilson and Musick 1997). At the individual level, a higher level of
education, household income, income from wealth, and a stronger sense of financial security are
associated with higher levels of philanthropy (Bekkers & Wiepking, 2011b; Wiepking &
Bekkers, 2012). Mohan et al. (2004) document the importance of resources in regional
differences in blood donation. Gesthuizen, van der Meer & Scheepers (2008b) analyze data on
charitable giving of money from the Eurobarometer in a multilevel model and find that donations
are lower in countries with more highly educated citizens, taking individual level education into
account.8
Citizens in countries with a more stable economy can be expected to feel more financially
secure and to donate more as a result. The level of financial security is likely to be lower in
countries with higher levels of income inequality, especially among lower educated citizens.
Higher GDP, national wealth, and lower levels of income inequality are likely to be associated
with higher levels of philanthropy, in part through a higher sense of financial security. The
World Giving Index 2010 (CAF) shows a positive association between the proportion of the
population in a country reporting donations to charity and GDP. This analysis, however, did not
take individual level characteristics into account. Data from the Eurobarometer show a negative
relationship between income inequality and donations, controlling for many individual level
8 Philanthropy is profiting less from national levels of education than other forms of involvement in voluntary
associations. The number of memberships at the individual level shows a clear increase with the average level of
education in a country, but ‘activity’ in voluntary associations does not. Rotolo & Wilson (2011) find no relationship
between the proportion of university graduates in a state and the individual likelihood of volunteering, taking
individual level education into account.
14
characteristics of households (Gesthuizen, Van der Meer, and Scheepers, 2008a). A study of
donations in Indonesia also shows a negative relationship between income inequality and giving
(Okten & Osili, 2004). A sophisticated analysis of data from the US however shows no
relationship between income inequality at the county level and household giving (Borgonovi,
2008). The same paper also shows a surprisingly negative relationship between mean county
income and secular household giving. A previous analysis at the aggregate level of giving in
metropolitan areas in the US does reveal a positive relationship between median income and
amounts donated (Wolpert, 1988). A historical geography of almshouses in the UK shows a
positive relationship between accumulated wealth of regions and the number of almshouses
(Bryson, McGuiness, & Ford, 2002). Olson and Caddell (1994) find that individuals contribute less
to their congregation when the average income of fellow congregation members increases. This is
most likely the result of “free riding”: a lower perceived need for contributions.
People in different countries experience different levels of fiscal incentives for charitable
giving (Dehne, Friedrich, Nam, and Parsche, 2008), affecting the monetary costs of financial
donations. One testable hypothesis in this area is that countries which offer a deduction for
donations have higher levels of philanthropy. Another testable hypothesis is that persons with
more financial resources will be more likely to engage in philanthropy in countries which allow
charitable deductions in the income tax. Individual tax benefits for giving resulting from these
fiscal incentives are larger for people with more financial resources (Simmons and Emanuele
2004).9
9 It should be noted however that the establishment of such laws depends on the attitudes and political preferences of
citizens. Estimates of the cross-national or regional effects of tax laws should therefore take political values
(discussed below) into account. Without such controls it is difficult to avoid finding support for a crowding in
hypothesis. Long (2000) also warns for omitted variable bias, but does not examine political values.
15
Benefits
The benefits (expected to be) received upon a donation increase the likelihood of giving to a
nonprofit organization. If the organization provides collective goods to its members, such as in
the case of a church, a trade union or a sports club, members of smaller groups contributing to
collective goods enjoy more benefits from their contributions (Olson, 1965). Support for the
hypothesis that selective benefits increase giving is in the finding that giving is higher in
congregations in which the size of the church budget per person is higher (Peifer, 2010).10 The
more general hypothesis is that philanthropy decreases with group size. This hypothesis could
also be explained as a result of ‘free riding’: the larger the number of potential other contributors,
the lower each individual contribution is required to be in order to produce the desired (level of
the) collective good. In addition, the ‘bystander effect’ also leads to the hypothesis that group
size is negatively related to philanthropy (Darley & Latané, 1968). In larger groups the feeling of
responsibility for collective well being is spread over more thinly over a larger number of people.
At a higher level of aggregation, research on experimental games across different cultures
shows strong regional differences in monetary offers to anonymous others in an ultimatum game
(Henrich et al., 2005; 2010). The experiments show that stronger market integration is positively
related to offers in ultimatum games. This finding can also be explained as an investment with un
uncertain revenue. Individuals who are used to economic interdependence upon strangers tend to
have a higher level of trust that their investment will be rewarded.
10 Several other studies in the sociology of religion show negative relationships between congregation size and
congregational giving; for an exhaustive list of references see Bekkers & Wiepking, 2011, p. 935). These studies are
mostly about aggregate levels of giving, and do not include individual level controls.

16
Altruism: the crowding out hypothesis
The altruism mechanism implies that individuals engage in philanthropy in order to help
recipients. Economists have tested the implications of theoretical models of giving including
altruistic motives by testing the ‘crowding out hypothesis’. Assuming that individuals are
motivated to give (partly) because they care about the well being of recipients, they should lower
their own contributions when others increase their contributions. Vice versa, donors should
increase their contributions when others decrease theirs. At the regional level, individuals should
lower their contributions to nonprofit organizations as the amounts contributed by other
individuals, corporations, institutional donors, or government increase.
Research testing the crowding out hypothesis in philanthropy has focused mainly on the
relationship between the level of government funding and private contributions to nonprofit
organizations within a specific country, yielding mixed results (for an overview see Bekkers &
Wiepking, 2011a, p. 936 and p. 949-951). Some studies find no significant relationship between
government funding and private giving (e.g., Brooks, 1999). Some studies do find that
government funding crowds out private giving – though the crowd out is usually less than
‘perfect’ (Payne, 1998; Brooks, 2003a). Still other studies find crowding in: the level of
government funding is positively related to the level of private giving (e.g., Brooks, 2003b,
Khanna, 1995, Khanna & Sandler, 2000). One study of donations to American theatres found
that government funding from the federal, state and local level affected donations differently
(Borgonovi, 2005). A study of religious giving (Peifer, 2010) found that contributions were
lower in congregations with higher levels of alternative funding (from investments or fees).
Because most of the evidence cited above comes from data about one single region it is
not necessarily bearing on the cross-national relationship. The relevant question is whether the

17
level of private giving to nonprofit organizations is lower in regions that provide higher levels of
government funding for these organizations. While many studies on volunteering have tested
such a crowding out hypothesis11, to date only two studies on charitable giving have investigated
this question. One study in the context of public broadcasting contributions (Kropf & Knack,
2003), finds some support for ‘crowding in’. It is not clear though whether government subsidies
increase private giving or vice versa (or both). Another study on donations to a variety of
nonprofit organizations in Europe based on EB data finds no relationship between social security
expenditure of countries and engagement in philanthropy at the individual level (Gesthuizen,
Van der Meer & Scheepers, 2008b). A recent study (Sokolowski, 2013) reports a positive
correlation between government payments to nonprofit organizations and aggregate levels of
private giving, but fails to take individual level correlates into account.
Reputation
Individuals living in regions in which philanthropy is valued positively will be able to obtain
positive social rewards for making donations as a form of action in line with the norm. In the
literature on volunteering it has been argued that the presence of religious groups creates a
positive social norm with respect to volunteering (Ruiter & De Graaf, 2006). This argument can
be generalized to all forms of prosocial behavior, including kindness to strangers (such as in the
parable of the Good Samaritan; Wuthnow, 1991) and organized philanthropy. The level of
compliance with the norm depends on the level of cohesion within the group: the higher the level
11 Most of these studies have not found crowding out (e.g., Salamon & Sokolowski, 2001; Ruiter & De Graaf, 2006;
Van Oorschot & Arts, 2005; Van Oorschot, Arts & Gelissen, 2006). Two recent studies however did find (weak)
crowding out (Stadelmann-Steffen, 2011; Hackl, Halla, & Pruckner, 2012).
18
of cohesion, the higher the level of compliance (Bekkers & Schuyt, 2008). This hypothesis has
been labeled the ‘community explanation’ for the differences in levels of philanthropy between
religious groups (Wuthnow, 1991; Bekkers & Schuyt, 2008).
From this perspective it is not merely an individual’s religiosity that encourages
philanthropy, but also the religious context in which individuals decide on donations.12 A
testable hypothesis is that regions with a higher level of religiosity have higher levels of
philanthropy, net of individual level religiosity.13
Gitell & Tebaldi (2006) find that average the charitable contribution per tax filer in US
states decreases with the proportion of the population that is Catholic, and increases with the
proportion that is protestant or has another religion. A similar finding is reported for 453
municipalities in the Netherlands (Bekkers & Veldhuizen, 2008).14 It should be noted, however,
that these studies did not include religious affiliation at the individual level. A study on
charitable donations in 23 European countries shows that not only individual religious values
affect donations, but also the religious context in which people live (Wiepking and Bekkers
2008). In her article on differences in giving and volunteering across US counties, Borgonovi
(2008) find that religious giving and volunteering increased with the county level of devoutness,
controlling for individual levels of religiosity. In addition, religious giving is lower in counties
dominated by Catholics. County level religious heterogeneity is associated with a lower
12 Note that religion is also important for charitable activity through the mechanisms of solicitation and reputation
discussed above.
13 Ruiter & De Graaf (2006) find support for this hypothesis in a multilevel analysis of volunteering.
14 Rotolo & Wilson (2011) find the highest level of volunteering in the Mormon state of Utah. They find a clearly
positive relationship between the number of congregations and levels of religious volunteering (though not secular
volunteering).
19
likelihood of religious volunteering. In an analysis of country level data (n=15) Sivesind & Selle
(2009) report that the negative association between public welfare spending and donations is
weaker in religious heterogeneous countries.
Several other findings can be viewed as support for the influence of reputation. Assuming
that communities in less densely populated areas are more close-knit one would expect negative
relationships between population density and engagement in philanthropy. Indeed lower
population density has been associated with acts of helpfulness shown by local residents to
strangers in field experiments (Levine, Martinez, Brase, & Sorenson, 1994; Levine, Reysen &
Ganz, 2008). Borgonovi (2008) found religious household giving to be higher in less densely
populated counties. While these findings are surprising from an economies of scale hypothesis
(Booth, Higgins & Cornelius, 1989), they fit the ‘community explanation’ of giving and
volunteering.
The behavior of others can be taken as a proxy or cue for the social norm that individuals
need to comply with in order to maintain a positive reputation. Survey studies indeed suggest
that people adapt their giving to what others in their environment are giving (Carman 2006;
Olson & Caddell 1994; Wu et al 2004).15 In a survey study on social influences in workplace
giving, Carman (2006) finds that charitable giving is especially influenced by behavior of co-
workers in the same salary quartile. Bekkers (2011) analyzes a large sample of tax payers in the
15 Note however that positive ‘peer effects’ may also be the result of psychological benefits (if one feels a good
about conforming to internalized social norms or would feel bad or guilt about deviance from the norm), or
enhanced confidence in charitable organizations (if one takes the behavior of others as a signal of trustworthiness).
Also it should be noted that ‘peer effects’ as observed in surveys in the form of a (partial) correlation between
contributions of individuals in the same environment may be the result of correlations among omitted variables, of
self-selection of individuals with similar gift levels in the same environment, or both (An, 2011).
20
Netherlands and finds that individuals living in municipalities with a higher proportion of
citizens donating more than 1% of income are more likely to do so themselves.
Assuming that the reputational damage of not engaging in philanthropy is higher in
regions with higher levels of prosocial behavior, one would expect to find higher levels of
philanthropy in such regions. Kropf & Knack (2003) show that contributions to public
broadcasting are higher in areas with stronger civic norms, measured by an index of census
response rates, voter turnout, and belief in the honesty of others. In their early study on United
Way contributions, Booth, Higgins & Cornelius (1989) find voter turnout to be positively
correlated to the amount raised. In a study of donations to secular charities, Bekkers &
Veldhuizen (2008) find a very strong correlation between voter turnout and the amount donated
per household in municipalities in the Netherlands.
Values
Values are crucial for engagement in philanthropy. At the individual level, religious, political,
and altruistic values can explain differences in charitable giving (Bekkers & Wiepking 2011). As
these values are more dominant in a region, they can be expected to create a culture in which
giving is viewed as more positive and desirable.
Altruistic values. Engagement in philanthropy may be motivated by altruistic concerns
for recipients. Such concerns may be internalized into a stable disposition, which we call
altruistic values. Several studies have found positive relationships between altruistic values and
engagement in philanthropy at the individual level. It is likely that cultural differences in value
systems are associated with differences in philanthropy. To study cultural differences in value
systems several models of values have been advocated in cross-cultural psychology (Hofstede,

21
2001; Schwartz, 1992). One testable hypothesis based on Hofstede’s system is that individuals in
collectivist cultures are more likely to engage in informal helping family members and friends,
but are less likely help strangers. One study testing this hypothesis (Kemmelmeier, Jambor &
Letner, 2006) found that more individualistic states in the US had higher rates of donors to
causes that represent individualist values (self-actualization, personal growth and development,
and individual achievement). This study however did not include individual level controls.16
From Schwartz’ theory, benevolence and universalism would be expected to be associated with
engagement in philanthropy (Plagnol & Huppert, 2010). To date, however, no study has tested
this hypothesis.
Religious values. Religious involvement is one of the strongest correlates of charitable
behavior by households and individuals (Bekkers and Wiepking 2011b). The stronger people’s
religious involvement, the more actively they follow their group’s (positive) norms on altruistic
behavior (Bekkers and Schuyt 2008; Wuthnow 1991). As explained above, individuals in more
religious regions may be more active in philanthropy due to higher levels of solicitations and
reputational benefits. A third perspective on the relationship between religion and philanthropy is
that religion is an institution that instills prosocial values in individuals, e.g. through parables
such as the Good Samaritan in the Christian tradition (Wuthnow 1991). From this perspective it
is not merely being asked more often or the social pressure to be a good citizen that explains the
16 In a study on volunteering, Finkelstein (2011) found individualism and collectivism at the individual level to be
associated with different motives for engagement. No association was found between volunteer hours and
individualism or collectivism. Rotolo and Wilson (2011) also failed to find a link between volunteer rates and
individualism/collectivism.

22
relationship between religiosity and philanthropy, but also the endorsement of religious values
that inspires people to engage in philanthropy.17
Political values are also important factors in philanthropy, though the relationship at the
individual level is complicated because of conflicting influences of cultural conservatism and
prosocial value orientation (Malka, Soto, Cohen & Miller, 2011). In a book primarily about the
US, Brooks (2006) argues that the extent to which people believe in state-induced income
redistribution is negatively related to philanthropy. In Europe, however, persons with a left wing
political orientation are found to be more active participants in voluntary associations (Van
Oorschot, Arts, and Gelissen 2006). A study on philanthropy in the Netherlands found that
persons with a left-wing political orientation are more likely to give to charitable organizations
(Bekkers and Wiepking 2006). Hughes and Luksetich (1999) find that total private contributions to
art museums are higher in states with a higher proportion of the population voting Republican in
presidential elections. In contrast, Bielefeld, Rooney & Steinberg (2005) find no support for a link
between political color of a state and individual giving. Positive relationships between democratic
history and donations are found in two studies (Gesthuizen, Van der Meer & Scheepers, 2008a,
2008b).
Political values are embodied in institutions and visions of the role of the state in the
provision of welfare (Salamon & Anheier, 1989). In the literature on civic engagement several
studies have examined whether volunteering rates differ between types of welfare states (e.g.,
Van Oorschot, Arts & Gelissen, 2006). Based on the work of Esping-Andersen (1990), nation
states with different work and social welfare policies are expected to have different volunteer 17 Rotolo & Wilson (2011) measured religious values at the regional level as a correlate of individual level, finding a
positive relationship with religious (but not secular) volunteering. However, the validity of this finding is limited as
variables for individual level religiosity were not included.
23
rates. The usefulness of the typology in comparative research has been contested, as the level of
welfare effort seems to be the driving influence behind the differences between types (Scheepers,
Te Grotenhuis & Gelissen, 2002). Salamon & Anheier (1998) present four ideal types of regimes
by crossing government social welfare spending (low vs high) with the size of the nonprofit
sector (small vs large), hypothesizing that the level and nature of volunteering varies between
these types. Comparisons of means suggest support for these hypotheses (Salamon &
Sokolowski, 2001) but they are not formal statistical tests. The low numbers of countries in some
of the types would make such tests fairly meaningless.
Efficacy
Countries differ in their legal systems and their treatment of nonprofit organizations (Salamon,
1997; Dehne et al., 2008). These differences may translate into differences in philanthropy. One
important pathway is through charitable deductions, which lower the costs of giving (see above).
In addition, legal systems influence philanthropy through regulation of the activities of nonprofit
organizations, including fundraising practices. The regulation of fundraising and the level of
transparency of charitable organizations is likely to affect the level of charitable confidence
among the general public (Bekkers, 2003). The level and nature of regulation differs strongly
between countries (Breen 2008, Salamon 1997). Ortmann and Svítková (2006) formulated a
theoretical model of regulation, and predicted that certification increases the quality of services
provided by charitable organizations as well as private donations. One would expect that regions
with more strict requirements for registration, transparency and accountability of charitable
organizations (such as the United States, United Kingdom and the Netherlands) would
experience fewer cases of fraud, abuse of donations and the misleading of (potential) donors

24
(Bekkers, 2003). As a result, one would expect public support for charitable organizations in
these regions to be higher. In a comparison of US states, however, Irvin (2005) no difference in
amounts donated between states with loose and more strict nonprofit regulation. In a cross-
sectional analysis, however, it may be that regions with higher levels of fraud and abuse are
found to have imposed more strict regulation to reduce these problems. Also donors may suspect
that irregularities are more frequent in countries with more strict regulations. Another problem in
the identification of effects of regulation is that more regulation causes more bureaucracy, which
may decrease (perceived) efficacy as well as private donations (Charity Commission 2005).
Investigating donations to ‘activist organizations’ (humanitarian and to environmental,
peace, and animal organizations), Evers & Gesthuizen (2011) found that the national level of
trust is positively related to engagement in philanthropy in a regression analysis including
individual level trust as well. This finding is consistent with the explanation that citizens in high
trust countries have more confidence in fundraising nonprofit organizations and are therefore
more likely to engage in philanthropy. Unfortunately, however, confidence in nonprofit
organizations was not measured in this study.
Conclusion
There seem to be strong regional differences in philanthropy. A higher GDP, a north-western
location in Europe and a less Catholic cultural background seem to be characteristics that
countries with higher levels of engagement in philanthropy have in common. One should be
careful to make such generalizations because different datasets yield very different estimates of
the proportion of the population engaging in philanthropy in specific countries. Also it should be
noted that data on amounts donated in different countries are not yet available for comparative
25
research. In an ongoing research project (Wiepking & Handy, forthcoming) existing datasets are
compiled. Given the differences in the research methodology used in different datasets, however,
it will be extremely difficult to estimate the magnitude and origins of the differences in
philanthropy.
Progress in research on regional differences in philanthropy is hampered by a lack of high
quality data. The collection of high quality data on philanthropy that allow for a cross-national
comparative study should be placed at the top of the priority list of scholars in this field. The
European Research Network on Philanthropy (ERNOP) is working to achieve this goal. When
such data become available, researchers should use adequate statistical models to test for the
origins of regional differences. Such hierarchical or multi-level models should include both
individual as well as country level predictors. The current practice in many studies suggests
regional differences to be due to context effects , but fails to take account of composition effects.
Do citizens give less in Catholic countries because a Catholic tradition discourages giving or
because Catholics give less, regardless of where they live? Do citizens in higher GDP countries
give more because of the more favourable macro-economic situation in their countries or
because these citizens have higher incomes and are more likely to have wealth in assets? In
addition to GDP and religious tradition there are likely to be other regional characteristics that
are correlated with philanthropy, such as a democratic history, welfare state regimes and
openness of the economy. Given the current state of research it is too early to jump to
conclusions about the existence and origins of regional differences.
In the absence of high quality data, I have discussed some of the hypotheses that can be
constructed to explain regional differences in philanthropy. When high quality data become
available, these hypotheses should be tested using appropriate statistical models.
26
References
An, W. (2011). Models and Methods to Identify Peer Effects. Pp. 514-532 in Scott, J. &
Carrington, P.J. (Eds). The Sage Handbook of Social Network Analysis. London: Sage
Publications.
Bekkers, R. (2003). Trust, Accreditation, and Philanthropy in the Netherlands. Nonprofit &
Voluntary Sector Quarterly, 32 (4): 596‐615.
Bekkers, R. & Schuyt, T.N.M. (2008). And Who is Your Neighbor? Explaining the Effect of
Religion on Charitable Giving and Volunteering. Review of Religious Research, 50 (1):
74‐96.
Bekkers, R. & Veldhuizen, I. (2008). Geographical Differences in Blood Donation and
Philanthropy in the Netherlands: What Role for Social Capital? Journal of Economic &
Social Geography, 99 (4): 483‐496.
Bekkers, R., & Wiepking, P. (2006). To Give or Not to Give…That is the Question. Nonprofit &
Voluntary Sector Quarterly, 35 (3): 533�540.
Bekkers, R. & Wiepking, P. (2011a). A Literature Review of Empirical Studies of Philanthropy:
Eight Mechanisms that Drive Charitable Giving. Nonprofit and Voluntary Sector Quarterly,
40(5): 924‐973.
Bekkers, R. & Wiepking, P. (2011b). Who Gives? A Literature Review of Predictors of
Charitable Giving. Part One: Religion, Education, Age, and Socialisation. Voluntary Sector
Review, 2(3): 337‐365.
Bekkers, R. & Wiepking, P. (2011c). ‘Accuracy of Self‐reports on Donations to Charitable
Organizations’. Quality & Quantity, 45(6): 1369‐1383.
27
Bielefeld, W., Rooney, P., & Steinberg, K. (2005). How do need, capacity, geography, and
politics influence giving? In A. C. Brooks (Ed.), Gifts of money in Americas communities
(pp. 127-158). Lanham, MD: Rowman & Littlefield.
Borgonovi, F. (2006). Do public grants to American theatres crowd-out private donations?
Public Choice, 126 (3-4): 429–451.
Booth, A., Higgins, D., & Cornelius, R. (1989). Community influences on funds raised by
human service volunteers. Nonprofit and Voluntary Sector Quarterly, 18(1), 81-92.
Breen, O.B. (2008). ‘EU Regulation of Charitable Organizations: The Politics of Legally
Enabling Civil Society.’ The International Journal of Not-for-Profit Law, 10(3): 50-78.
Britto, S., Van Slyke, D.M., & Francis, T.I. (2011). The Role of Fear of Crime in Donating and
Volunteering: A Gendered Analysis. Criminal Justice Review, 36 (4)``: 414-434.
Brooks, A. C. (1999). Do public subsidies leverage private philanthropy for the arts? Empirical
evidence on symphony orchestras. Nonprofit and Voluntary Sector Quarterly, 28(1), 32-45.
Brooks, A. C. (2003a). Do government subsidies to nonprofits crowd out donations or donors?
Public Finance Review, 31, 166-179.
Brooks, A. C. (2003b). Taxes, subsidies, and listeners like you: Public policy and contributions
to public radio. Public Administration Review, 63, 554-561.
Brooks, A.C. (2006). Who Really Cares. The Surprising Truth about Compassionate
Conservatism. New York: Basic Books.
Bryson, J.R., McGuiness, M. & Ford, R.G. (2002). Chasing a loose and baggy monster:
almshouses and the geography of charity. Area, 34(1): 48-58.
Buchan, N.R., Grimalda, G., Wilson, R. Brewer, M., Fatas, E., & Foddy, M. (2008).
Globalization and Human Cooperation. PNAS, 106 (11): 4138-4142.
28
CAF (2010). The World Giving Index 2010. West Malling: CAF.
CAF (2011). World Giving Index 2011: A Global View of Giving Trends. West Malling: CAF.
CAF (2012). World Giving Index 2012: A Global View of Giving Trends. West Malling: CAF.
Cerphi (2010). Le don d’argent des ménages aux associations et aux foundations: Étude des dons
realisés par les Français en 2008, enregistrés dans les declarations de revenus 2009. Paris:
CERPHI.
Charity Commission. 2005. Report of findings of a survey of public trust and confidence in
charities. Opinion Leader Research.
Darley, J.M., & Latané, B. (1968). Bystander Intervention in Emergencies: Diffusion of
Responsibility. Journal of Personality & Social Psychology, 8(4): 377-383.
Dehne, A., Friedrich, P., Nam, C.W., & Parsche, R. (2008). Taxation of Nonprofit Associations
in an International Comparison. Nonprofit and Voluntary Sector Quarterly, 37 (4): 709-729.
DellaVigna, S., List, J.A. & Malmender, U. (2012). Testing for Altruism and Social Pressure in
Charitable Giving. Quarterly Journal of Economics, 127 (1): 1-56.
Esping-Andersen, G. 1990. The Three Worlds of Welfare Capitalism. Oxford: Polity Press.
Evers, A. & Gesthuizen, M. (2011). The impact of generalized and institutional trust on donating
to activist, leisure, and interest organizations: individual and contextual effects. International
Journal of Nonprofit and Voluntary Sector Marketing, 16(4): 381–392.
Gesthuizen, M., Van der Meer, T. & Scheepers, P. (2008a). Ethnic Diversity and Social Capital
in Europe: Tests of Putnams Thesis in European Countries Scandinavian Political Studies,
32(2): 121-142.
29
Gesthuizen, M., Van der Meer, T. & Scheepers, P. (2008b). Education and Dimensions of Social
Capital: Do Educational Effects Differ Due to Educational Expansion and Social Security
Expenditure? European Sociological Review, 24(5): 617-632.
Gittell, R., & Tebaldi, E. (2006). Charitable giving: Factors influencing giving in the U.S. States.
Nonprofit and Voluntary Sector Quarterly, 35, 721-736.
Hackl, F., Halla, M. & Pruckner, G.J. (2012). Volunteering and the State. Public Choice, 151:
465-495.
Henrich, J. et al. (2005). Economic man in cross‐cultural perspective: Behavioral experiments
in 15 small‐scale societies. Behavioral and Brain Sciences, 28, 795–815.
Hofstede, G. (2001). Cultures Consequences: comparing values, behaviors, institutions, and
organizations across nations. Thousand Oaks: Sage.
Irvin, R. (2005). State Regulation of Nonprofit Organizations: Accountability Regardless of
Outcome. Nonprofit and Voluntary Sector Quarterly, 34 (2): 161-178.
Janssen, S., Kuipers, G. & Verboord, M. (2008). Cultural Globalization and Arts Journalism:
The International Orientation of Arts and Culture Coverage in Dutch, French, German, and
U.S. Newspapers, 1955 to 2005. American Sociological Review, 73: 719-740.
Kemmelmeier, M. Jambor, E.A., & Letner, J. (2006). Individualism and Good Works: Cultural
Variation in Giving and Volunteering Across the United States. Journal Of Cross-Cultural
Psychology, 37 (3): 327-344.
Khanna, J., Posnett, J. & Sandler, T. (1995). Charity Donations in the UK: New Evidence Based
on Panel Data. Journal of Public Economics 56:257-272.
Khanna, J. & Sandler, T. (2000). Partners in giving: The crowding-in effects of UK government
grants. European Economic Review 44:1543-1556.
30
Knack, S. and Keefer, P. (1997) Does social capital have an economic payoff? A cross-country
investigation, Quarterly Journal of Economics, 112(4), 1251–1288.
Koster, F. (2007). Globalization, Social Structure, and the Willingness to Help Others: a
Multilevel Analysis Across 26 Countries. European Sociological Review, 23(4): 537-551.
Kropf, M., & Knack, S. (2003). Viewers like you: Community norms and contributions to public
broadcasting. Political Research Quarterly, 56, 187-197.
Levine, R.V., Martinez, T.S., Brase, G., & Sorenson, K. (1994). Helping in 36 U.S. cities.
Journal of Personality & Social Psychology, 67, 69-82.
Levine, R.V., Reysen, S. & Ganz, E. (2008). The kindness of strangers revisited: a comparison of
24 US cities. Social Indicators Research, 85: 461-481.
Lim, C. (2010). Mobilizing on the margin: How does interpersonal recruitment affect citizen
participation in politics? Social Science Research, 39: 341-355.
Malka, A., Soto, C.J., Cohen, A.B., & Miller, D.T. (2011). Religiosity and Social Welfare:
Competing Influences of Cultural Conservatism and Prosocial Value Orientation. Journal of
Personality, 79(4): 1-30.
Mohan, J., Barnard, S., Jones, K. & Twigg, L. (2004). Social capital, place and health: creating,
validating and applying small-area indicators in the modelling of health outcomes. London:
NHS Health Development Agency.
Olson, D. V. A., & Caddell, D. (1994). Generous congregations, generous givers:
Congregational contexts that stimulate individual giving. Review of Religious Research, 36,
168-180.
Ortmann, A., & Svítková, K. (2006). Certification as a Viable Quality Assurance Mechanism:
Theory and Suggestive Evidence. CERGE-EI Working Paper 228.
31
Paik, A. & Navarre-Jackson, L. (2011). Social Networks, Recruitment, and Volunteering: Are
Social Capital Effects Conditional on Recruitment? Nonprofit and Voluntary Sector
Quarterly, 40: 476-496.
Pancer, S.M., McMullen, L.M., Kabatoff, R.A.,, Johnson, K.G., & Pond, C.A. (1979). Conflict
and Avoidance in the Helping Situation. Journal of Personality and Social Psychology
37:1406-1411.
Payne, A.A. (1998). Does the government crowd-out private donations? New evidence from a
sample of non-profit firms. Journal of Public Economics 69:323– 345.
Payton, R.L. (1988). Philanthropy: Voluntary Action for the Public Good. Santa Barbara:
Greenwood Press.
Peifer, J.L. (2010). The Economics and Sociology of Religious Giving: Instrumental Rationality
or Communal Bonding? Social Forces, 88(4): 1569-1594.
Plagnol, A.C., Huppert, F.A. (2010). Happy to Help? Exploring the factors Associated with
Variations in Rates of Volunteering Across Europe. Social Indicators Research, 97: 157-176.
Putnam, R.D. (2000). Bowling Alone: The Collapse and Revival of American Community. New
York: Simon & Schuster.
Rooney, P.M., Steinberg, K.S. & Schervish, P.G. (2001). A Methodological Comparison of
Giving Surveys: Indiana as a Test Case. Nonprofit & Voluntary Sector Quarterly, 30 (3):
551-568.
Rooney, P.M., Steinberg, K.S. & Schervish, P.G. (2004). Methodology Is Destiny: The Effect of
Survey Prompts on Reported Levels of Giving and Volunteering. Nonprofit & Voluntary
Sector Quarterly, 33 (4): 628-654.
32
Rotolo, T. & Wilson, J. (2012). State-Level Differences in Volunteerism in the United States:
Research Based on Demographic, Institutional, and Cultural Macrolevel Theories. Nonprofit
& Voluntary Sector Quarterly, 41(3): 452-473.
Ruiter, S. & De Graaf, N.D. (2006). National Context, Religiosity, and Volunteering: Results
from 53 Countries. American Sociological Review, 71 (2): 191–210.
Salamon, L.M. (1997). The International Guide to Nonprofit Law. John Wiley & Sons.
Salamon, L.M., & Anheier, H.K. (1998). Social Origins of Civil Society: Explaining the
Nonprofit Sector Cross-Nationally. Voluntas, 9(3): 213-248.
Salamon, L.M. & Sokolowski, W. (2001). Volunteering in Cross-National Perspective: Evidence
From 24 Countries. Working Papers of the Johns Hopkins Comparative Nonprofit Sector
Project, no. 40. Baltimore: The Johns Hopkins Center for Civil Society Studies.
http://ccss.jhu.edu/wp-content/uploads/downloads/2011/09/CNP_WP40_2001.pdf
Sargeant, A., Shang, J. & Associates (2010). Fundraising Principles and Practice. San Francisco:
Jossey-Bass.
Scheepers, P., Te Grotenhuis, M. & Gelissen, J. (2002) Welfare States and Dimensions of Social
Capital: Cross-national Comparisons of Social Contacts in European Countries, European
Societies 4 (2): 185–207.
Schwartz, S.H. (1992). Universals in the Content and Structure of Values: Theoretical Advances
and Empirical Tests in 20 countries. Advances in Experimental Social Psychology, 25: 1-64.
Simmons, W. O., & Emanuele, R. (2004). Does government spending crowd out donations of
time and money? Public Finance Review, 32, 498-511.
33
Sivesind, K.H., & Selle, P. (2009), Does public spending crowd out nonprofit welfare? Pp. 105-
134 in Enjolras, B., & Sivesind, K.H. (Eds.) Civil Society in Comparative Perspective.
Bingley: Emerald.
Snijders, T. and R. Bosker (1999). Multilevel Analysis. London: Sage.
Sokolowski, S.W. (2013). Effects of Government Support of Nonprofit Institutions on Aggregate
Private Philanthropy: Evidence from 40 Countries. Voluntas, 24: 359-381.
Stadelmann-Steffen, I. (2011). Social Volunteering in Welfare States: Where Crowding Out
Should Occur. Political Studies, 59: 135-155.
Van Diepen, M., Donkers, B. & Franses, P.H. (2009a). Dynamic and Competitive Effects of
Direct Mailings: A Charitable Giving Approach. Journal of Marketing Research, 46: 120-
133.
Van Diepen, M., Donkers, B. & Franses, P.H. (2009b). Does irritation induced by charitable
direct mailings reduce donations? International Journal of Research in Marketing, 26: 180-
188.
Van Oorschot, W., & Arts, W. (2005). The social capital of European welfare states: The
crowding out hypothesis revisited. Journal of European Social Policy, 15 (1): 5–26.
Van Oorschot, W., Arts, W., & Gelissen, J. (2006). Social Capital in Europe: Measurement and
Social and Regional Distribution of a Multifaceted Phenomenon. Acta Sociologica 49:149-
167.
Veldhuizen, I. & Bekkers, R. (2011). Social Capital and Blood Donation in the Netherlands.
Paper presented at the 40th Arnova Conference, Toronto, November 18, 2011.

34
Wiepking, P. & Bekkers, R. (2012). Who Gives? A Literature Review of Predictors of Charitable
Giving. Part Two: Gender, Marital Status, Income, and Wealth. Voluntary Sector Review, 3
(2): 217-245.
Wiepking, P. & Handy, F. (forthcoming). Generous People, Generous Nations: A cross-national
study of philanthropy.
Wolch, J. & Geiger, R. (1983). The urban dimension of voluntary resources: an exploratory
analysis. Environment and Planning A 15 1067-1082.
Wolpert, J. (1988). The Geography of Generosity: Metropolitan Disparities in Donations and
Support for Amenities. Annals of the Association of American Geographers, 78(4): 665-679.
Wuthnow, R. (1991). Acts of compassion: Caring for others and helping ourselves. Princeton,
NJ: Princeton University Press.
35
Figure 1. Likelihood of donating to nonprofit organizations reported in the European Social
Survey 2002 (ESS), the Eurobarometer 2004 (EB), and the Gallup World Poll (GWP)