region report - bourne-partners.com · 5 latin american economic overview total gdp for the region...
TRANSCRIPT

Region Report Latin America
May 2013

2
Table of Contents
Regional Overview 4
Markets of Interest 8
Brazilian Market Overview
Mexican Market Overview
Regional Market Comps 15
Regional IPO and M&A Activity
Select Transactions
Latin American Outlook 23
In Summary 27
Firm Overview 29

3
33 24 49 56 68 $0 mm
$10 mm
$20 mm
$30 mm
$40 mm
$50 mm
0
10
20
30
40
50
60
70
80
2008 2009 2010 2011 2012
M&A Transactions Transaction Size
Latin American Tearsheet
Trading & Transaction Comps(2)
Industry Outlook(1)
Market Dynamics(1)
$81 billion healthcare expenditure in 2011
One-third of emerging market pharmaceutical sales
Rapidly increasing middle class and dramatic growth in
the relative affluence of the population
Increases in domestic consumption and public funding
Latin American countries are expecting double-digit
yearly growth between now and 2015
(U.S. and Western Europe: 0-4%)
Rapid phase-out of “similares”
Enterprise Value Multiples
Median EBITDA Multiple: 8.1x in 2012
Median Revenue Multiple: 1.8x in 2012
Total number of deals: 68 in 2012
Stock Performance relative to 5-year benchmarks
Performance relative to S&P 500: +73%
Performance relative to Healthcare Sector: +42%
Increase in Non-Latin American Acquirers
Latin American Healthcare M&A Transactions
Source: Bourne Partners Proprietary Research, CapitalIQ, April 2013
Source: Bourne Partners Proprietary Research, CapitalIQ, April 2013
Source:
(1) WHO; WorldBank
(2) Bourne Partners Proprietary Research, CapitalIQ, April 2013
58%
42%
2009
Latin America
Outside Latin America
40%
60%
2012
Average

Regional Overview

5
Latin American Economic Overview
Total GDP for the region in 2012 was $5.7 trillion, and is expected to surpass $7.5 trillion in 2017(1)
GDP has grown 215% over the last ten years, compared to global GDP growth of 114%
Latin American population has grown 15% over the last ten years, compared to global population growth of 12%
The seven largest countries (Brazil, Mexico, Argentina, Colombia, Venezuela, Chile, and Peru) account for over 80% of the region’s population and over 90% of GDP. The two largest, Brazil and Mexico, account for 54% of the population and 62% of GDP
Population is expected to grow by 5.88% over the next five years to nearly 620 million
The fastest growing countries (with a current population of at least 10 million) are Guatemala, Venezuela, Bolivia, the Dominican Republic and Peru
However, regional growth has been somewhat stymied by the reduced demand for its commodity exports in India, Russia, and China as their economic growth has slowed
Bounce back from 2008 global economic crisis
Macroeconomic policies – targeting inflation and debt reduction
Trade expansion – growing relationship with China
Domestic market – closing income gap and increasing purchasing power
• In Brazil alone, 49 million people have moved up into the middle class and middle-upper class over the last eight years.
Increasing inter-region trade and domestic demand
Trade between Latin American countries has increased nine-fold over the last twenty years
Infrastructure upgrades have become top spending priorities in the wake of natural disasters and decades of inattention
Regional Trends (2)
Source:
(1) International Monetary Fund
(2) Economist Intelligence Unit

6
Latin American Healthcare Overview
Total healthcare expenditure as percentage of GDP is 7.7% in the region
Per capita healthcare expenditure (an exchange rate adjusted $671) provides significant room for continued growth
Out-of-pocket spending represents 72.4% of the regions overall healthcare expenditure
This overwhelming out-of-pocket spend is extremely attractive especially in countries with fluctuating political situations because healthcare providers are less reliant on developing governments
However, less government involvement has led to an IP protection environment that is suspect within the majority of countries
Source:
(1) WHO
(2) World Bank
Healthcare Expenditure as Percentage of GDP (2)
Per Capita Healthcare Expenditure (Purchasing Power Parity)(1)
$8,608
$3,551
$1,009 $1,191 $614
$1,197 $962 $463 $642
$-
$2,000
$4,000
$6,000
$8,000
$10,000
0%
2%
4%
6%
8%
10%
12%
14%
16%
18%
20%
2000 2001 2002 2003 2004 2005 2006 2007 2008 2009 2010
U.S.A.
Europe
Brazil
Chile
Colombia
Costa Rica
Mexico
Peru
Venezuela

7
Latin American Market Dynamics
Brand Loyalty
Latin American countries have proven to be very brand loyal, which
has led to a slower adoption rate for generic drugs
Some of this is attributable to consumer preference, while a portion is
a direct result of consumer concerns over safety and efficacy
Although government payers have historically represented a smaller
share of healthcare spend across the region, government initiatives to
offer higher quality healthcare across the populous have taken hold as
economic growth has spurred the rapid expansion of the middle
classes
In 1999 the Brazilian government mandated that by 2014 all similares
would need to prove bioequivalence to stay on the market
Similar regulations have popped up across the region (most notably in
Mexico) as governments try to reign in safety and provide an
environment that is conducive for investment and innovation
The reduction in similares will ultimately lead to a more lucrative
generics market, where a branded generic company could enter and
achieve significant market share quickly
Latin American Healthcare Market Share (by $)
Government Initiatives
Eradication of “Similares”
Source: IMS Health
Central America, 4%
Brazil, 38%
Mexico, 19%
Argentina, 12%
Venezuela, 8%
Colombia, 6% Others, 13%

Markets of Interest

9
Proprietary Research
Brazilian population of 195 million makes Brazil the largest Latin American country by both population and land mass(1)
The public Unified Health System (UHS) covers 75% of Brazil’s population, and Brazil is the second largest insurance
market in the world behind only the United States(2)
Brazil also has the largest economy in Latin American with a GDP of $2.5 trillion (7th largest worldwide)(1)
However, the business environment remains challenging and often lacks transparency
Nearly 60% of private expenditure comes from out-of-pocket payments, with the other 40% from private insurance(2)
Brazilian pharmaceutical market accounted for $25.6 billion, roughly 3% of the global market(3)
The aging population combined with the growth in the Brazilian upper- and middle-classes has resulted in CAGR of over
15% for pharmaceutical spending between 2006 and 2010(3)
The UHS network consists of more than 6,000 hospitals
and 60,000 outpatient centers(2)
Distributors have little control over pricing due to
consolidation of pharmacies
There are over 550 pharmaceutical firms operating in the
country(3)
90% of retail pharmacies are independent(2)
Major chains only make up 8% of locations(2)
45% of sales may be skewed by off-invoice discounting
of similares by local companies(3)
Relationships with major retailers is key
Geography leads to fragmentation
Total healthcare expenditure as a percentage of GDP: 9%(1)
Brazilian Market Overview
Brazilian Market Highlights and Key Takeaways
Brazilian Pharmaceutical Market Product Mix (by $)( 4)
Branded Generics
34%
Branded Drugs 30%
Exclusive Branded
Drugs 3%
Generics 14%
OTC 19%
Source:
(1) World Bank
(2) WHO
(3) IMS Health
(4) Business Monitor International

10
Brazilian Pharmaceutical Market
A tight pricing environment, driven by Brazil’s aggressive shift towards reference pricing, is likely to limit growth in patented pharmaceutical sales
Brazil has a large generics industry due to government policy aimed at increasing accessibility of pharmaceuticals to low-income individuals. By law, purchases by the government must favor generics
Rumors of a possible international pharmaceutical purchase of Aché Laboratorios Farmaceuticos, one of Brazil’s largest pharmaceutical companies, persist, and illustrate the multinationals desires to enter the market
25 of the most popular drugs lost patents in 2010 and 2011. Consumption of generics is projected to grow at a fast pace, and generics should represent a third of total market volume by 2016(1)
2012 market size was $37 billion and it is expected to grow to over $45 billion in 2016(1)
80% of Brazilian pharmaceutical companies are locally owned, but they only supply 30% of the market(2)
70% of the market is provided by imports and Brazilian subsidiaries of foreign firms, primarily from the US and Europe(2)
Rising demand for cheap biosimilar drugs has led the government to form BioBrazil, a 100% Brazilian pharmaceutical company to eventually produce world class biosimilar drugs (biosimilars are simply called biologics in Brazil to avoid confusion with similares)
$20 bn $24 bn $24 bn
$29 bn $35 bn $37 bn $38 bn $40 bn $42 bn
$45 bn
2007 2008 2009 2010 2011 2012 2013* 2014* 2015* 2016*
*Estimated
Brazilian Pharmaceutical Market Growth(4)
Source:
(1) WHO
(2) IMS Health
(3) Business Monitor International
(4)Sindusfarma

11
Proprietary Research
Mexico is the second largest pharmaceutical market in Latin America (behind Brazil), with regulatory benefits well-defined(1)
45.2 million Mexicans used health services in 2010, and there are over 20,000 hospitals and outpatient centers(1)
Popular Insurance supports all primary care, 95% of secondary care and 60% of catastrophic illnesses(1)
A vast majority of private expenditure on healthcare is direct spending, nearly 60% of which is used to buy medications(1)
Unbranded generics are gradually gaining acceptance and are the fastest growing segment (shown in chart below)
Healthcare spending as a percentage of GDP was only 6% in 2010, below the Latin American average of 7.4%(2)
Expected sales growth of 6% CAGR over the next 5 years is at lower end of Latin America(3)
Government underfunding of sector leads to high out-of-pocket expense for consumer
Mexico is an attractive investor opportunity but has
some challenges
Historic narcoterrorism and increased exposure to the
slowly recovering U.S. economy pose risks
Best IP protection in region(3)
Strengthened by data exclusivity
Mexico has emphasized reaching
internationally acceptable IP protection
48% of pharmaceutical spending is out-of-pocket(2)
75% of market revenue comes from branded drugs(3)
Mexican Market Overview
Mexican Market Highlights and Key Takeaways
Mexico's Pharmaceutical Market Sales Snapshot(4)
0
5
10
15
20
25
30
35
40
45
50 Generic Sales OTC Sales Prescription Sales
*Estimated
20
05
20
06
2007
20
08
20
09
20
10
20
11
20
12
20
13
*
20
14
*
20
15
* Source:
(1) WHO
(2) World Bank
(3) IMS Health
(4) Market Publishers

12
Proprietary Research
Total healthcare expenditure represents 6.5% of Colombia’s GDP(1)
Per capita healthcare expenditure is $614 adjusted for exchange rate fluctuation(1)
Public sector accounts for 84% of healthcare spending and 40% of pharmaceutical spending, which have allowed
Colombia to follow Brazil’s lead and demand regional reference pricing(1)
Multinationals control the market with a 60% share(2)
Multinationals use Colombia as a distribution hub for the entire Andean Region (Colombia, Peru, Bolivia, Ecuador)
70% of pharmaceuticals are locally produced, but only account for 20% of revenue(3)
Recent Free Trade Agreement with the U.S. could ease local production preference
Registration can be cumbersome due to lack of staff
Recent growth in pharmaceutical volume is largely
attributable to a nationwide shift to generics
OTC sales represent 15% of the market, but are
expected to rise due to increases in real income and
a more health conscious population(4)
91% of the population is covered by the government
mandated General Health and Social Security System(3)
Public hospital system has seen drastic improvement
as over 240 hospitals were improved during the period
between 2002 and 2010(3)
Colombian Market Overview
Colombian Market Highlights and Key Takeaways
Projected Columbian Pharmaceutical Market Growth(5)
$4.5 bn $4.7 bn
$5.1 bn $5.5 bn
$5.9 bn
2012 2013 2014 2015 2016 Source:
(1) World Bank
(2) IMS Health
(3) WHO
(4) Business Monitor International
(5) MINSALUD

13
Total healthcare expenditure represents 7.4% of
GDP(1)
Out-of-pocket spending as a percentage of total
private healthcare expenditure is nearly 70%(2)
Per capita healthcare expenditure is among the
largest in Latin America at an exchange rate adjusted
total of $1,191(1)
Local manufacturers account for roughly 60% of the
total Chilean pharmaceutical market(3)
Branded generics make up 50% of the
pharmaceutical market
Patented drugs make up 40% and
Generics make up the remaining 10% of the
market
80% of sales occur through retail pharmacies(3)
Local generics cost below 20% of their branded
counterparts(2)
General System of Health recently guaranteed all
citizens access, timeliness, quality, and financial
protection regarding the Chilean healthcare system
The system covers over 69 different health
problems(2)
Chilean and Venezuelan Market Overviews
Chilean Market Highlights and Key Takeaways
Total healthcare expenditure represents only 5.3% of
GDP for the commodities exporting giant(1)
Likewise, per capita healthcare expenditure ($642) is
among the lowest in Latin America(2)
During the reign of recently deceased dictator, Hugo
Chavez, the Venezuelan government increased funding
for public social programs (including nationalized
healthcare) by more than 17x(2)
However, drug scarcity and a lack of specialists
continues to plague the country’s healthcare system
Private hospitals within the country are extremely
expensive, but have first-world practitioners and
services
However, public hospitals are over-crowded and lack
the necessary practitioners to maintain an acceptable
level of service
It is unclear what path the government will take
following the election of a new leader, but Bolivarian
socialism is expected to maintain at least a tenuous grip
on the country’s political machine
Venezuelan Market Highlights and Key Takeaways
Source:
(1) World Bank
(2) WHO
(3) IMS Health

14
Total healthcare expenditure represents only 4.9% of Peru’s GDP(1)
Peru has the lowest per capita spend on healthcare ($463) as well as the slowest growth among Latin American
countries(2)
The population is largely covered by two large public insurers(1)
Seguro Integral de Salud (“SIS”) – serves the poor population of the country and operates like Medicare/Medicaid
EsSalud – serves the employed population and is similar to an employer based health plan in the U.S.
20% of the population is still completely unserved(1)
Access to facilities, practitioners, and medication are limited and often require tremendous wait times(1)
Peruvian and Costa Rican Market Overviews
Peruvian Market Highlights and Key Takeaways
Total healthcare expenditure represents a staggering 10.3% of GDP and per capita healthcare spend is among the
highest in Latin America at $1,197(2)
The retail pharmacy market is dominated by very few retailers and that group should only consolidate as external
market participants enter the retail pharmacy space similar to Walmart’s disruption of Mexican retail pharmacy upon its
entrance into the market
Costa Rican Market Highlights and Key Takeaways
Source:
(1) WHO
(2) World Bank

Regional Market Comps

16
Latin American M&A Activity in General
M&A has become both a viable and very popular exit strategy for capital or resource constrained private companies within
Latin America
Many global healthcare companies are able to leverage their balance sheets in order to enter these attractive markets as
opposed to investing time and capital into building from scratch
Latin American markets are extremely fragmented due to the prevalence of small, family-owned companies operating within
the region’s healthcare space. However, some of the more ambitious management teams have emphasized growth and
competition elimination through acquisition in recent years
A growing number of acquisitions have been forecast to be nearly immediately acccretive, leading to rising share prices not
only for the acquiree but also for the acquirer
On a geographic basis there appears to be an increasing focus on Latin American emerging markets by U.S. and European
companies seeking to enter these markets for production, sourcing, and sales

17
0
2
4
6
8
10
12
14
0
10
20
30
40
50
60
70
80
2000 2001 2002 2003 2004 2005 2006 2007 2008 2009 2010 2011 2012 2013 YTD
Lin
e G
rap
h A
xis
Bar
Ch
art
Axis
Latin American Healthcare IPO and M&A Activity
Private LatAm Healthcare Companies Acquired/Merged
Total Transaction Volume
Public LatAm Healthcare Companies Acquired/Merged
Initial Public Offerings of LatAm Healthcare Companies
Regional IPO and M&A Activity (2000 - Present)
2000 2001 2002 2003 2004 2005 2006 2007 2008 2009 2010 2011 2012 2013 YTD
Public LatAm Healthcare
Companies Acquired/Merged - - - - 1 - - - - 1 2 2 13 2
Private LatAm Healthcare
Companies Acquired/Merged 5 8 8 3 9 15 24 37 33 23 47 54 55 8
Initial Public Offerings of LatAm
Healthcare Companies - - - - - - 4 3 1 1 1 4 3 2
Total 5 8 8 3 10 15 28 40 34 25 50 60 71 12
Transaction volume has dramatically increased since last decade (23% CAGR from 2000 to 2012)
Total transaction volume has been driven by private M&A transactions; however, as more buyers make their exits we’re seeing an increase in both IPOs and the subsequent acquisitions of these public companies
Note: 2013 YTD through April 2013;
Source: Bourne Partners Internal Research

18
USD in millions, except for per-share amounts
4/1/2013 LTM
CYE
Company Ticker
Share
Price
Shares
Out
Equity
Value
Net Debt
(Cash)
Enterprise
Value Sales EBITDA EBIT EPS Sales EBITDA
CYE
EPS
CYE+1
EPS
Book
Value
Amil Participacoes SA BOVESPA:AMIL3 15.67 366.7 5,747.8 85.7 5,833.5 5,108.3 116.5 42.0 0.03 5,538.8 444.4 0.56 0.70 2.0
Qualicorp S.A. BOVESPA:QUAL3 10.29 264.1 2,716.8 88.0 2,804.7 449.4 126.4 47.1 0.10 570.0 216.3 0.52 0.57 3.7
Clínica de Marly S.A. BVC:MARLY 2.25 10.7 24.0 (12.2) 11.8 63.7 13.7 10.5 0.57 0.0 0.0 0.00 0.00 7.2
Clinica las Condes S.A. SNSE:LAS CONDES 86.82 8.3 718.5 20.2 738.7 265.9 59.7 47.7 3.34 0.0 0.0 0.00 0.00 38.0
Instituto de Diagnostico S.A. SNSE:INDISA 3.90 80.6 313.9 63.7 377.6 161.3 30.4 24.0 0.15 0.0 0.0 0.00 0.00 1.0
Fleury S/A BOVESPA:FLRY3 9.47 156.3 1,479.9 185.1 1,665.1 733.1 154.6 105.6 0.31 861.4 191.4 0.54 0.69 5.3
Banmedica S.A. SNSE:BANMEDICA 2.65 804.7 2,129.9 302.1 2,432.0 1,876.9 197.0 157.4 0.10 0.0 0.0 0.00 0.00 0.5
Diagnosticos da America BOVESPA:DASA3 5.70 310.6 1,770.1 412.9 2,183.0 1,105.3 187.3 114.0 0.12 1,265.7 266.1 0.29 0.41 4.1
Cremer SA BOVESPA:CREM3 6.46 32.9 212.2 81.8 294.0 301.7 27.5 14.8 0.13 290.9 41.1 0.42 0.56 4.2
Cruz Blanca Salud S.A. SNSE:CRUZBLANCA 1.23 637.7 783.1 181.6 964.7 983.9 79.4 61.6 0.05 1,111.7 97.4 0.08 0.10 0.6
Margin Analysis Enterprise Value/ P/E
Company Ticker FYE
Data
as of
Gross
Profit EBITDA EBIT Sales EBITDA EBIT
Sales
CYE LTM CYE CYE+1
Price to
Book
Amil Participacoes SA BOVESPA:AMIL3 31-Dec 1-Apr-13 24.6% 2.3% 0.8% 1.1 x 50.1 x 138.8 x 1.1 x 483.3 x 27.9 x 22.3 x 7.7 x
Qualicorp S.A. BOVESPA:QUAL3 31-Dec 1-Apr-13 74.5% 28.1% 10.5% 6.2 x 22.2 x 59.5 x 4.9 x 107.4 x 19.8 x 18.0 x 2.8 x
Clínica de Marly S.A. BVC:MARLY 31-Dec 1-Apr-13 28.5% 21.5% 16.6% 0.2 x 0.9 x 1.1 x NM 3.9 x NM NM 0.3 x
Clinica las Condes S.A. SNSE:LAS CONDES 31-Dec 1-Apr-13 26.1% 22.5% 18.0% 2.8 x 12.4 x 15.5 x NM 26.0 x NM NM 2.3 x
Instituto de Diagnostico S.A. SNSE:INDISA 31-Dec 1-Apr-13 29.1% 18.8% 14.9% 2.3 x 12.4 x 15.8 x NM 26.2 x NM NM 3.9 x
Fleury S/A BOVESPA:FLRY3 31-Dec 1-Apr-13 26.9% 21.1% 14.4% 2.3 x 10.8 x 15.8 x 1.9 x 30.7 x 17.6 x 13.8 x 1.8 x
Banmedica S.A. SNSE:BANMEDICA 31-Dec 1-Apr-13 22.3% 10.5% 8.4% 1.3 x 12.3 x 15.5 x NM 26.7 x NM NM 5.8 x
Diagnosticos da America BOVESPA:DASA3 31-Dec 1-Apr-13 30.9% 16.9% 10.3% 2.0 x 11.7 x 19.2 x 1.7 x 48.2 x 19.5 x 14.0 x 1.4 x
Cremer SA BOVESPA:CREM3 31-Dec 1-Apr-13 27.3% 9.1% 4.9% 1.0 x 10.7 x 19.8 x 1.0 x 48.3 x 15.5 x 11.5 x 1.5 x
Cruz Blanca Salud S.A. SNSE:CRUZBLANCA 31-Dec 1-Apr-13 20.9% 8.1% 6.3% 1.0 x 12.1 x 15.7 x 0.9 x 26.6 x 15.3 x 12.9 x 2.1 x
All estimates from Capital IQ Median 27.7% 20.0% 12.4% 2.1 x 12.4 x 15.8 x 1.8 x 28.7 x 19.6 x 16.0 x 2.5 x
NM - not meaningful Mean 32.8% 17.7% 11.7% 2.3 x 16.6 x 35.1 x 2.4 x 94.1 x 21.2 x 17.0 x 3.2 x
Min 22.3% 2.3% 0.8% 0.2 x 0.9 x 1.1 x 1.1 x 3.9 x 17.6 x 13.8 x 0.3 x
Max 74.5% 28.1% 18.0% 6.2 x 50.1 x 138.8 x 4.9 x 483.3 x 27.9 x 22.3 x 7.7 x
Latin American General Healthcare Trading Comps
The Latin American region offers an extremely attractive healthcare industry given the high gross profit and EBITDA margins
The average enterprise value of the selected Latin American stocks indicates that the healthcare sector generally trades at
roughly 2x revenue with median EBITDA multiples just over 12x; however, these trading comps represent a wide array of
companies from various countries and sectors within healthcare, which makes these multiples less meaningful for individual
entity valuation.
Source: Bourne Partners Proprietary Research, CapitalIQ, April 2013

19
-100.00%
-50.00%
0.00%
50.00%
100.00%
150.00%
Latin American Trading Performance
S&P 500 Healthcare Index Latin American Index* S&P 500 Index
Latin American Index
S&P 500 Index
S&P Healthcare Index
Over the last five years, publicly traded Latin American healthcare companies have drastically outperformed both the S&P 500 and the S&P Healthcare Sector as a whole, most notably during the 2010 and early 2011
Rapid growth throughout the U.S. recession allowed the Latin American healthcare industry to build the sizeable spread seen in the graph; however, slow recovery in the U.S. has recently decreased the peak 2011 spread
*Latin American Index is comprised of the companies in the trading multiple basket from slide 18; Bourne Partners Internal Research
+92.3%
+50.1%
+19.1%
Notable Growth Period

20
Latin American Transaction Comps
Announced Date Target Buyer Geographic Location Enterprise Value LTM Revenue LTM EBITDA EV / LTM Revenue EV / LTM EBITDA
Mar-13 Triarco Industries, Inc. Innophos Holdings United States $46.0 $25.0 NA 1.8x NA
Dec-13 Fortitech, Inc. Royal DSM N.V. (ENXTAM:DSM) United States 634.0 270.0 70.0 2.3x 9.1x
Nov-12 Schiff Nutrition International Inc. Reckitt Benckiser LLC United States 1,433.0 285.8 43.0 5.0x 33.3x
Aug-12 Avid Health, Inc. Church & Dwight Co. Inc. (NYSE:CHD) United States 723.3 198.5 48.6 3.6x 14.9x
Aug-12 Farma-rojeckt Sp. z o.o. Recordati SpA (BIT:REC) Poland 20.9 13.7 NA 1.5x NA
Jul-12 Laboratorio Franco Colombiano Lafranscol S.A. CFR International SpA Colombia 562.0 200.0 NA 2.8x NA
Jul-12 FIT-Bioceuticals Limited Blackmores Limited (ASX:BKL) Australia 40.9 40.0 NA 1.0x NA
May-12 Swiss Herbal Remedies Limited Valeant Pharmaceuticals International, Inc. (TSX:VRX) Canada 20.6 21.2 NA 1.0x NA
May-12 Airborne, Inc. Schiff Nutrition Group, Inc. United States 122.9 69.2 13.2 1.8x 9.3x
Feb-12 Probioticx Laboratorios Ltd. Valeant Pharmaceuticals International, Inc. (TSX:VRX) Brazil 86.3 42.9 NA 2.0x NA
Jun-11 Myprotein, Inc. The Hut Group Ltd. United Kingdom 95.3 25.0 NA 3.8x NA
Jun-11 Seroyal International Inc. Atrium Biotech Investments, Inc. Canada 111.1 40.0 NA 2.8x NA
Dec-10 Martek Biosciences Corporation Royal DSM N.V. (ENXTAM:DSM) United States 1,024.1 450.0 123.2 2.3x 8.3x
Jul-10 NBTY, Inc. Carlyle Partners V, L.P.; The Carlyle Group (NasdaqGS:CG) United States 3,784.6 2,826.3 480.6 1.3x 7.9x
NA - Not Available Median 117.0 56.1 59.3 2.1x 9.2x
NM - Not Meaningful Mean 621.8 322.0 129.8 2.4x 13.8x
High 3,784.6 2,826.3 480.6 5.0x 33.3x
Low 20.6 13.7 13.2 1.0x 7.9x
Closed Date Target Buyer
Geographic
Location
Enterprise
Value
LTM
Revenue
LTM
EBITDA
EV / LTM
Revenue
EV / LTM
EBITDA
Jan-2013 Papaiz Associados Diagnósticos por Imagem S/S Ltda. Clidec Ltda.; Fleury Centro de Procedimentos
Médicos Avançados Brazil
9.1 -
1.82
1.38
5.0
Dec-2012 Laboratorio Franco Colombiano Lafrancol S.A. CFR International SPA Colombia
562.0
160.1 -
2.81 -
Oct-2012 Amil Participacoes SA (BOVESPA:AMIL3) UnitedHealth Group Incorporated (NYSE:UNH) Brazil
5,538.5
4,977.8
159.93
1.11
34.63
Oct-2012 LMA International N.V., Substantially All Assets Teleflex Incorporated (NYSE:TFX)
246.61 -
18.72
1.96
13.17
Oct-2012 Grupo Tecnol Ltda Luxottica Group SpA (BIT:LUX) Brazil
141.41
11.6 -
1.17 -
Sep-2012 Sonorad I SA Integramedica S.A. Chile
14.7 - -
1.06 -
Sep-2012 Clinica las Condes S.A. (SNSE:LAS CONDES) Bethia S.A. Chile
750.89
265.9
54.61
2.97
13.06
Jul-2012 Multilab Indústria e Comércio de Produtos
Farmacêuticos Ltda. Takeda Farmacêutica Brasil Ltda. Brazil
270.53
75.6 -
3.86 -
Jun-2012 Laboratory Sanobiol Ltda Cristalia Produtos Quimicos Farmaceuticos Ltda. Brazil
48.32 - -
0.551 -
Mar-2012 Cruz Blanca Salud SA (SNSE:CRUZBLANCA) Cartica Capital LLC Chile
890.23
957.0
81.62
1.05
10.24
Feb-2012 Probiótica Laboratórios Ltda. Valeant Pharmaceuticals International, Inc.
(TSX:VRX) Brazil
86.33
41.9 -
1.88 -
Jul-2011 Cytolab Laboratório de Anatomia Patológica Citologia
Diagnóstica e Análises Clínicas Ltda. DASA Empreendimentos e Participações Ltda. Brazil
7.12 -
1.44
1.13
4.95
Jul-2011 Laboratório de Análises Clínicas Previlab Ltda. DASA Brasil Participações Ltda. Brazil
8.92 -
1.86
0.605
4.8
May-2011 Diagnoson Ultra-Sonografia e Densitometria Óssea
S/S, Ltda. Fleury S/A (BOVESPA:FLRY3) Brazil
38.26 -
4.31
2.46
8.88
Median
113.87
160.1
11.52
1.28
9.56
Mean
615.21
927.13
40.54
1.71
11.84
High
5,538.5
4,977.8
159.93
3.86
34.63
Low
7.12
11.6
1.44
0.55
4.8
NM – Not Material
NA – Not Available
The Brazilian and Chilean M&A environments have proven to be
extremely fertile throughout the last couple of years due to
population growth and attractive pro-business government policies
favoring internal growth
Source: Bourne Partners Proprietary Research, CapitalIQ, April 2013

21
Announce Date: October 2012
Acquirer: UnitedHealth Group Incorporated (NYSE:UNH)
Country: Brazil
Enterprise Value: $5.538 billion
Revenue Multiple: 1.1x
EBITDA Multiple: 34.6x
Target Description
Organizes, operates, and manages healthcare plans in Brazil
Network consists of 22 hospitals, 44 medical centers, 7 Total Care units, and 3 Postural Correction Units, as well as 3 Amil Health Rescue emergency centers
Transaction Overview:
UnitedHealth acquired a 60% share for $3.262 billion in cash
Strategic Rationale:
Offers the United States’ largest private insurer access to Brazil’s population of over 200 million
Current private insurance rates are extremely low in Brazil, but growth is anticipated
Select Transactions
Laboratorio Franco Colombiano S.A Amil Participacoes SA Probiótica Laboratórios Ltda
Announce Date: July 2012
Acquirer: CFR International SPA
Country: Colombia
Enterprise Value: $562 million
Revenue Multiple: 2.8x
EBITDA Multiple: N/A
Target Description
Manufactures and distributes pharmaceutical, nutraceutical, nutritional supplements, and functional food products in Colombia and internationally
Provides anti-inflammatory products, analgesics, antihistamines, antihipertensives, vasodilators, antiulcers, hipolipemiántes, antibiotics, procinetics, anti migraine products, ansiolitics, and anti-depressives
Transaction Overview:
CFR International purchased all of Laboratorio Franco Colombiano Lafrancol’s assets for $562 million in cash
Strategic Rationale:
Transforms CFR into the leading pharmaceutical company in Colombia, which is one of the most attractive LatAm markets
Announce Date: February 2012
Acquirer: Valeant Pharmaceuticals International, Inc. (TSX:VRX)
Country: Brazil
Enterprise Value: $86.33 million
Revenue Multiple: 1.88x
EBITDA Multiple: N/A
Target Description
Offers food supplements with a focus on sports nutrition
Founded in 1986 and is based in Embu das Artes, Brazil
Transaction Overview:
Valeant purchased all of Probiótica Laboratórios’ assets for $86.33 million in cash
Strategic Rationale:
The transaction offers Valeant an entrance into the rapidly expanding nutraceutical space, while also helping to establish a presence in one of the dominant pharmerging markets in the world

22
Takeda Launches New Subsidiary in Ecuador
Takeda Ecuador S.A.
Headquarters: Quito, Ecuador
Responsible for the sales and marketing of all Takeda products in Ecuador and will serve as a platform for the entry of a more diverse product mix from Takeda’s sizeable portfolio
Takeda Latin American Expansion
April 2008: Nycomed Venezuela founded
November 2009: Takeda establishes Takeda Mexico as a North American subsidiary headquartered in Mexico City
April 2011: Nycomed buys Laboratorios Farmacol as its entrance into Colombia
May 2011: Takeda acquires Nycomed and its operations in Argentina, Brazil, Colomiba, and Venezuela
July 2012: Takeda announces the acquisition of Multilab to further expand its growing manufacturing capacity in Brazil
March 2013: Takeda launches newest Latin American subsidiary in Ecuador
Newest Subsidiary
Headquartered in
Quito
Strategic Rationale
Takeda has rapidly expanded its presence in South America in order to take advantage of the rapid growth of both the regional population and economy
As the middle class of Latin American countries continues to expand, Takeda anticipates increased healthcare spend that is largely out-of-pocket, which offers unique pricing ability

Latin American Outlook

24
Latin American Outlook
Double-digit CAGR expected to continue for the next five years, and we believe that a plateued growth rate will still
outpace the 1-3% growth we anticipate in the U.S. and Western Europe(1)
Industry consolidation expected to continue as large global healthcare companies acquire smaller industry participants in
order to reduce competition and enter new market segments
As more international players move into the region, Latin American healthcare should continue to experience growth
through increased availability and technological advances increasing productivity
Market Forces Affecting Growth
Headwinds Tailwinds
Brazilian pharmaceutical market growth:
Generics expected to grow as major brands come of patent
Branded pharmaceuticals may regain some lost market share as “similares” are forced off the market by regulators
Biosimilar growth within native firms is anticipated as government backing will help local firms deal with size and scale issues associated with biologic production
U.S. Payers looking to reduce down-side risk of PPACA by expansion into Latin American markets
Regional distribution access points with substantial infrastructure build-out planned
Colombia
Peru
Ecuador
As Chinese, Russian and Indian industrial growth and construction initiatives wane, commodity exporting economies could see a drastic decrease in GDP, and stymied GDP growth could reverse the positive growth trends we anticipate (we’re already seeing this happening in Brazil)
Unreliable IP protection across region
Reference pricing becoming more prevalent throughout region, which is reducing pharmaceutical margins
Political uncertainty in select countries pose multiple threats to companies:
Narcoterrorism disrupts business
Potential for nationalization of enterprise in Bolivarian countries
Shifts in government healthcare policy as new leadership groups emerge could dramatically alter the reimbursement landscape
Source: (1) IMS Health

25
Regional Growth Drivers
Regional Access Distribution Points
Several companies currently use Colombia as a staging ground for distribution throughout the Andean region
Peru and Ecuador are also attractive locations to initiate region-wide distribution due to the multiple countries they border as
well as their sizeable coastlines and shipping industries
Brazilian Pharmaceutical Industry(1)
Growth anticipated in the generics space as major drugs come off patent in coming years
“Similares” regulated off the market
All similares must show bioequivalence by 2014, but ANVISA has said that half have yet to show bioequivalence
We believe a large number of similares market participants have chosen to exit the market rather than take on cost-
prohibitive testing
Consolidation of smaller family-owned businesses
80% or companies are locally owned, but they only supply 30% of the market
As these companies are acquire others or are acquired the larger businesses will begin to enjoy economies of scale
and corporate synergies, which should show up on the bottom line
Payer Ex-U.S. Diversification
As the effects of PPACA slowly become evident, payers will look to diversify into new territories in order to insulate
themselves from down-side risk
UNH’s acquisition of a controlling share of Amil Participacoes in Brazil is a perfect example of this strategy (see slide 21)
Latin American markets provide payers with a unique opportunity due to:
Limited government involvement
High private out-of-pocket pay ratio offers growth potential
Relative lack of competition currently in the market
Large multi-channel providers may leverage PBM introduction to lubricate potential retail pharmacy entrance
Source: (1) ANVISA, WHO, World Bank, Duetsche Bank

26
Peru’s GDP in 2012 was just over $200 billion, and is expected to grow by 43% over the next 5 years to about $286 billion in 2017. Population is projected to grow by 8% over the same period(1)
Peru is ranked 43 on the Ease of Business rankings, which is the second best rank in the region behind Chile(2)
Rapid population growth, geographic location (Long coastline and borders 5 countries), and large percentage of the population remains underserved
Select Opportunities for Growth
Peru
Chile’s economic output will continue to be positively disproportionate to it’s population. GDP will grow almost 44% over the next five years, whereas population will grow a modest 4.2%(1)
Chile is the highest ranked country in the region on the World Bank’s Ease of Business rankings at 37 due to its fair regulatory policies and an infrastructure that supports economic development(2)
A National Health Strategy is in place to drive Chilean healthcare to the forefront of Latin American healthcare by 2020
Chile
0%
1%
2%
3%
4%
5%
6%
7%
8%
9%
10%
2013 2014 2015 2016 2017
Chile
Peru
World
Country 5 Year GDP Growth
Chile 43.81% Peru 43.01% Brazil 34.19%
Colombia 31.95% Mexico 28.14%
Argentina 16.36% Venezuela 10.82%
All of Latin America 31.15%
Source:
(1) International Monetary Fund
(2) Economist Intelligence Unit
Forecasted GDP Growth

In Summary

28
Regional Summary
Removal of “similares” from the market and increased consumer
confidence in generic drugs should drive growth within the generic
and branded generic markets region-wide
Most healthcare sectors within the region are highly fragmented, but
as foreign competition begins entering the market through
acquisition, more local firm consolidation will be required to compete
As GDP and the middle classes continue to grow, expect sizeable
gains in revenue as well as profit as technological advances pair with
market growth to the benefit of aggressive firms within the region
As government involvement in healthcare continues to increase,
political stability in the region will play a major role in continued
growth

Firm Overview

30
Bourne Partners Information
Investment banking advisory
Direct investing
Operational and management consulting
Life Sciences Merchant Bank Geographic Coverage
Dots represent the countries where the
Bourne Partners team has transaction experience
Healthcare services
Specialty pharmaceuticals
Consumer Heath
Medical technology (devices)
Distribution
Segmentation
Mergers & Acquisitions Company and product focus
Primarily sell side with select buy side assignments
$10 – 250 million transaction focus
Business Development Support Services In/out-licensing of late stage and approved products
United States, European and Asian companies focused on partnering locally or in international markets
Capital Raising Mature spaces of healthcare (OTC, Specialty Pharmaceuticals, Generics, Medical Devices, Services)
$10 - 250 million raises
Debt and equity
Active calling effort on 75+ healthcare focused private equity and venture capital groups
Advisory Services

31
Bourne Partners Portfolio Companies
Single-point managed partnership solution for maximizing sales across the diverse markets of Latin America
Customized solutions to meet the needs of each partner depending on product type, stage of commercialization, and markets of interest
Experienced legal department works with local regulators, agencies, and partners to ensure time-efficient registration of each product
Market-specific distribution, promotion and sales strategies for new-to-market and existing products
Dots represent the countries
where Bourne Partners
portfolio companies conduct
business within Latin America Named patient and compassionate use distribution
Creating awareness and fulfilling demand prior to product
registration
Providing fast and reliable access to pharmaceuticals for
government agencies in heavily regulated, third world and
emerging markets
Pre-approval marketing and sales
International tender management
Clinical trials and comparator sourcing
Directly or indirectly sourcing comparator products from global
sources
Offering transparency and up-channel reporting
Providing sourcing, distribution and management services to
individual sites on an “as needed” basis

32
Bourne Partners Information
Global Perspective
Senior Deal / Operations-focused Resources
Direct Investing
Enterprise values of $10 – $250 million
Direct portfolio companies
Co-invests with other sponsors
Buyout and venture fund commitments
Senior level attention and involvement in
every project
Mix of investment professionals and
healthcare executives
Over $5 billion in transactions completed
globally
Operations members provide enhanced
support across investment life cycle and
can fill management roles on transitional
or permanent basis
Active contact and tracking of pharmaceutical
and nutraceutical companies worldwide, with
particular focus in the following regions:
United States
Latin America
• Transaction experience or partner
relationships in 15 countries within the
region
Select Advisory Clients & Involved Parties
Representative Passive, Fund, & Co-Investments
Representative Active Role Investments

33
Financial Advisory
Mergers & Acquisitions
•Seller Representation •Acquisitions •Divestitures •Asset Spinouts
Capital Sourcing/ Private Placements
•Recapitalizations •Management Buyouts •Growth Capital
Business Development
Services
•Advisory •In/Out-licensing •Strategic Studies •Strategic Consulting
Direct Investment
Controlling Active
Investments
•BurnsAdler Pharmaceuticals •Theramed Corporation •Tanner Pharmaceuticals
Private Equity Funds
•Irving Place Capital (2 funds)
•The Carlyle Group (10 funds)
•Cerberus Capital Management (1 fund)
Minority/ Co-Invest
•King Pharmaceuticals •Covis Pharma •Warner Chilcott (IPO) •Plainfield Energy •CommScope
Private Equity &
Direct Investment
Investment Banking
& Advisory
Bourne Partners Structure
34
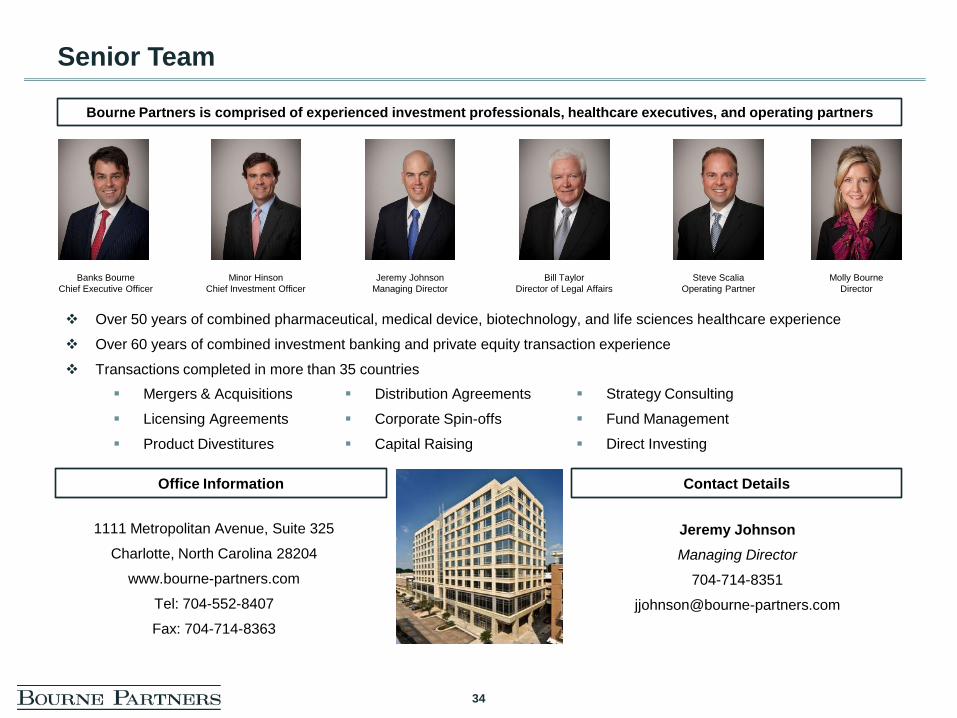
Senior Team
Over 50 years of combined pharmaceutical, medical device, biotechnology, and life sciences healthcare experience
Over 60 years of combined investment banking and private equity transaction experience
Transactions completed in more than 35 countries
Mergers & Acquisitions
Licensing Agreements
Product Divestitures
Distribution Agreements
Corporate Spin-offs
Capital Raising
Strategy Consulting
Fund Management
Direct Investing
Office Information
1111 Metropolitan Avenue, Suite 325
Charlotte, North Carolina 28204
www.bourne-partners.com
Tel: 704-552-8407
Fax: 704-714-8363
Contact Details
Jeremy Johnson
Managing Director
704-714-8351
Bourne Partners is comprised of experienced investment professionals, healthcare executives, and operating partners
Molly Bourne
Director
Banks Bourne
Chief Executive Officer
Minor Hinson
Chief Investment Officer
Jeremy Johnson
Managing Director
Bill Taylor
Director of Legal Affairs
Steve Scalia
Operating Partner