regimes of realization: using marx and kalecki to ... · economic theories from across the spectrum...
TRANSCRIPT

Regimes of Realization: Using Marx and Kalecki to Understand the U.S. Economy, Including the Great Recession and the “Recovery”
By David M. Brennan
1. Introduction
The Great Recession is “universally recognized as the worst economic crash since the
Great Depression” (Foster and Magdoff 2009, 11). In response to the Great Recession,
economic theories from across the spectrum of economic thought have provided
explanations for it. These explanations range from imputing it to exogenous events or
government policy (either too much, too little, or merely misplaced) to finding the cause
of the fundamental contradictions in capitalism. In contrast to neoclassical and Keynesian
perspectives, Marxian explanations took the path of revealing the variety of structural
contradictions that participated in the crisis. Specifically, Marxian crisis theories of the
wage-induced profit squeeze, underconsumption, the rising organic composition of
capital, and stagnation theory were employed to explain the crisis. Along with these
existing theories came newer Marxian critiques of financialization and neoliberalism.
For many within Marxism, the Great Recession indicated a watershed moment that
exposed beyond any doubt capitalism’s insurmountable contradictions and crushing
vulnerabilities. Furthermore, many Marxists argued that capitalism would not be able to
recover and reproduce itself, at least in its neoliberal form.
Despite dire predictions for the future of capitalism from various Marxian
theorists, the U.S. economy is in the midst of a long recovery. As the NBER dating
indicates, the economic recovery began in 2009 and continues into 2017. Perhaps the
recovery is not as strong as most would like, but as of the end of 2014, the U.S.

2
unemployment rate had fallen to 5.6%, compared to 9.9% in June 2009.1 During the
“sluggish” initial stages of the recovery, investment in real terms grew 25% from 2009Q4
to 2013Q1. In addition the recovery has exceeded the average recovery period of 38.7
months for the U.S.2
Perhaps more surprising than the recovery itself is that it happened without any
significant structural changes in the economy and without any significant income or
investment policy changes in the U.S. Financialization is relatively undaunted by reforms
such as Dodd-Frank.3 Neoliberalism has survived the Great Recession. A central
question, then, is how the “recovery” could occur with all the structural contradictions
outlined in the Marxian crisis literature still firmly in place. This paper attempts to
answer this fundamental question and to provide critical insights into the future of the
U.S. economy based on the form of the recovery.
I will begin with a brief review of some of the dominant Marxian approaches to
understanding the Great Recession. The purpose of this review is twofold. One purpose is
to take stock of the current Marxian views. The second purpose is to make theoretical
space for some additional insights that help to answer the primary question above. After
this review, I outline the case for incorporating selected Kaleckian insights based on his
theoretical engagements with Marxism. The paper analyzes the sources of profit
realization and the profit rate in the U.S. economy from 1964 to 2013 to explain how the
recovery happened in light of existing structural contradictions. Finally the paper will
discuss the future of the recovery and its implications. 1 Bureau of Labor Statistics seasonally adjusted unemployment rate ages 16+, Series Id LNS 14000000. Data.bsl.gov. 2 This average covers 33 cycles in the U.S. from 1854-2009. www.nber.org/cycles.html (accessed January 2 This average covers 33 cycles in the U.S. from 1854-2009. www.nber.org/cycles.html (accessed January 11, 2017). 3 See Pompa and Gainer 2013.
3
2. Marxian Perspectives on the Great Recession Writing long before the Great Recession, Boddy and Crotty (1975) posited that
during the expansion phase of the business cycle, workers’ wages could rise enough to
begin to put downward pressure on firms’ profits, with the result being an eventual
reduction in investment and an economic slowdown. While this is a minority view of the
cause of the Great Recession, recent work by Izquierdo (2013) finds that rising real
wages may indeed have contributed to the crisis. While his study is not focused solely on
the Great Recession, he investigates ten business cycles from 1947 to 2011. Just prior to
the economic expansion of 2007, Izquierdo finds “a substantial average annual increase
of real wages” (469, n. 14). These increased wages led to lower profits that contributed to
the recent crisis (470). However, he is quick to point out that for the latest cycle, the wage
gains were more likely to be at the upper end of the income bracket.
Izquierdo concludes that the “offensive rising strength of labor” is responsible for
“the most frequent type of cyclical crisis” including 2007 (470). This explanation appears
inconsistent with the income experiences of many U.S. workers over the last fifty years.
Consequently, this view that the rising strength of labor is to blame for the crisis is in a
very small minority of explanations of the crisis, Marxian or otherwise.
More important to our focus here, however, is the fact that there has been no
significant change in the distribution of income, especially of the most highly paid
workers, which would have released downward pressure on profits. Of the S&P 500
companies, the median total direct compensation of CEOs has risen from 2009 thru

4
2014.4 Therefore, it is not clear from this perspective why a recovery should happen with
incomes rising for the top employees.
In contrast, Florio (2011-2012) represents a classical underconsumptionist view of
the crisis. He theorizes that its roots were in an unstable distribution of income between
labor and capital and a growing income gap between advanced countries and the rest of
the world (5). Like many other theorists, he views the period from the late 1970s to the
early 1980s as a key period of inflection from a stable to an unstable distribution of
income. Specifically, he sees that a “pact” consisting of constant labor and capital shares
was broken in the 1980s in favor of capital shares (12). Rising debt allowed effective
demand to grow, and he supports this view of debt by providing data on personal savings
as a percentage of income in the U.S., a percentage that peaked in 1982 (18). Not
surprisingly, Florio suggests that redistributions of income between countries and
between capital and labor are needed to provide stable growth (27).
Explaining the recovery from this perspective is also difficult, however, given that
no significant change occurred in wages of typical workers. Data indicate that hourly
compensation was flat from 1973 to 2013.5 How can stagnant wages both cause the crisis
and remain during the recovery? This remains an important question.
While Izquierdo’s and Florio’s studies are directed towards understanding the
dynamics of business cycles, most Marxian approaches to the Great Recession take a
longer view. Andrew Kliman (2010) argues that “U.S. corporations’ rates of profit
declined after the mid-1950s and continued to fall or failed to rebound after recessions of
the mid-1970s and early 1980s; that no new boom followed these recessions because . . .
4See Bout (2015).5See Mishel, Gould, and Bivens (2015), table 2.

5
the amount of capital value that was destroyed was insufficient to restore profitability and
a healthy rate of investment; that the persistent fall in profitability led to sluggish
investment, slow economic growth, and a long-term explosion of debt; that the buildup of
debt has led to repeated bubbles and the bursting of these bubbles; and that the latest
crisis and economic slump are the consequence. . . .”6
Kliman is not alone in placing the primary fault for the recession on this
explanation of falling profits. Giacché (2011), Maniatis (2012), and Ivanova (2012) cite
over-accumulation as the root cause of the Great Recession. Perhaps over-accumulation
did participate in the crisis, but investment was reasonably strong during the recovery as
well. Specifically, while investment growth after the crisis was slower than in the period
preceding the crisis, it grew at an annual rate of 6.75% from 2010-2013.7 This growth in
investment would seem “out of place” in the recovery phase of an over-accumulation
crisis with “insufficient” capital destruction during the crisis.
In the clearest of terms, Duménil and Lévy (2011) differentiate themselves from
the falling-profit perspectives discussed above and from the underconsumptionist
theories. They write, “there is no synthetic technical explanation of the crisis. It was not
the effect of deficient profit rates. It was also not the consequence of a lack of demand,
the expression of the insufficient purchasing power of wages. If an overarching
explanation must be sought, it lies in the objectives of neoliberalism, the tools used in
their pursuit, and the contradictions inherent in these aims and methods” (33-34).
Contrary to theories that capitalists were too weak, profits too small, or consumption too
low, “the causes of the crisis can . . . be described in terms of ‘excess.’ Too much
6See www.marxisthumanistinitiative.org (accessed January 12, 2017).7Author’s calculations based on data from the Federal Flow of Funds accounts.

6
financialization meant a fragile financial structure, and too much globalization, an
uncontrollable world economy” (37). Duménil and Lévy recognize that crises due to
insufficient profitability are possible, and they understand the crises of the 1890s and the
1970s as such. However, they view the Great Depression and the Great Recession as
“consequences of the exercise of hegemony, class and international hegemonies, the
boundless expansion of the demands of the upper class that pushed economic mechanism
to and, finally, beyond the frontier of sustainability” (21).
Harvey (2010), like Duménil and Lévy, sees neoliberalism and the accompanying
financialization as emerging out of the profit crisis of the 1970s, but unlike Duménil and
Lévy, he sees real sector profitability as a problem again in the 1990s and asserts that this
is what pushed more money into the financial sector. “Profits began to fall after 1990 or
so in spite of an abundance of low-wage labour. Low wages and low profits are a peculiar
combination. As a result, more money went into speculation on asset values because that
is where profits were to be had. Why invest in low-profit production . . . ?”(29). Harvey
admits that various other forms of crisis are possible (i.e. wage-led profit squeeze, rising
organic composition of capital, or underconsumption), but, as for the Great Recession,
“while the epicenter lies in the technologies and organizational forms of the credit system
and the state-finance nexus, the underlying problem is excessive capitalist empowerment
vis-à-vis labour and consequent wage repression, leading to problems of effective
demand papered over by a credit-fuelled consumerism of excess in one part of the world
and a too rapid expansion of production in new product lines in another” (118).
A somewhat different take on the issues of neoliberalism and financialization
emerges from Kotz (2008). He says, financialization had wide capitalist class support,

7
and thus could come into existence within the thriving neoliberal environment that
prevailed (13). Neoliberal capitalism in the U.S. emerged out of the crisis that ended a
period of regulated capitalism in the late 1970s (Kotz 2009, 306). Neoliberalism
represented a new regime of accumulation, and once it took hold, it contributed to three
main developments in both the financial sector and the real sector: growing inequality, a
financial sector involved in highly speculative activities, and the emergence of asset
bubbles (307). Neoliberal policies kept wages low, but allowed consumption to remain
strong due to the rise in consumer debt and rising home values, which in turn enabled
workers to borrow increasingly large sums against their homes. Consequently, when the
housing bubble burst it set off not only a financial crisis but also a real sector recession.
As housing wealth declined, so did consumer spending and future rounds of investment
(315).
Beyond differences concerning the connections between neoliberalism,
financialization, and the immediate causes of the crisis, Duménil and Lévy, Harvey, and
Kotz also have different views on a post-crisis U.S. economy. Kotz is the most optimistic
that the Great Recession will usher in significant changes. “We are witnessing a crisis of
the neoliberal form of capitalism. The ability of that form of capitalism to promote
expansion of output and profits appears to have reached its end” (315). Furthermore, “the
social structure of accumulation perspective argues that, when a particular form of
capitalism enters its critical phase, this eventually gives rise either to a new form of
capitalism or to a transition beyond capitalism” (316).
While Duménil and Lévy consider a quick reversal of neoliberal policies unlikely,
they conclude “that the chances of neoliberalism are limited. . . . The objectives of
8
neoliberalism are incompatible with the maintenance of U.S. hegemony. . . . They are
also at odds with the correction of the U.S. macro trajectory” (Duménil and Lévy 2011,
327). Thus, economic progress depends on a significant transformation away from
neoliberalism. Harvey is the most pessimistic of the three regarding the likelihood of
change. He asks himself, “Can capitalism survive the present trauma?” And replies, “Yes,
of course” (215). It can survive by extracting a high cost from workers’ asset values, and
by extracting even more surplus labor, reducing standards of living for workers, and
further deteriorating the environment (216).
The most obvious question confronting theories that identify financialization
and/or neoliberalism as the source of the crisis is this: how can this explanation of the
recovery be valid, given that financialization and neoliberalism proceed unabated? It
appears that Harvey is correct in his conclusion that capitalism can survive the Great
Recession. He may also be correct in pointing to even higher levels of exploitation as the
key. But another question then arises, are these potential sources of recovery in fact
responsible for the recovery, or is something else facilitating the recovery? More
generally, what conditions exist in the aftermath of the Great Recession that promote a
recovery despite the ever-present neoliberal and over-financialized climate that enabled
the crisis?
The final Marxian perspective to be considered here is the view of Foster and
Magdoff (2009), who build their perspective from the works of Kalecki, Steindl, Baran,
and Sweezy (Foster and Magdoff 2009, 66). Their work focuses on the environment
faced by mature capitalist economies. This environment involves basic maintenance of
existing industries, long durations of low technical innovation, growing inequality, which
9
slows the growth in aggregate demand, and the existence of monopoly industries. All of
these factors contribute to low investment and stagnation in the economy (102). In such
an environment, “the pivotal issue for monopoly capital was to find additional outlets for
surplus, beyond capitalist consumption and investment, that would serve to keep the
system from sinking into an economic malaise” (65). Debt and financialization provided
the outlets for the surplus that contributed to the housing bubble that ultimately set off the
crisis. But what outlets are absorbing the surplus during the recovery? Housing, which
has been slow to recover, is clearly not the answer.
While the preceding discussion of Marxian crisis literature admittedly does not
include every contribution, it does cover a large territory. The disconcerting aspect of
these Marxian perspectives on the Great Recession is that the U.S. has experienced an
initial recovery with nearly all of the crisis-inducing factors and structures still firmly in
place. From a Marxian theoretical point of view, the recovery should be unlikely. Yet a
recovery happened quickly enough to maintain the status quo. Specifically, the recovery
began without a noteworthy devaluation of capital, a significant redistribution of income,
a demolition of neoliberal policies, a thunderous retreat from financialization, a “new
New Deal,” or something resembling socialism. In contrast to the Great Recession, the
Great Depression ushered in considerable legislative reforms on business, government
spending on jobs programs that aided the distribution of income, and military spending
that promoted investment. Nothing comparable in terms of scale or duration happened
after the Great Recession.

10
What is missing from the Marxian analysis of crisis generally and from the
analysis of the Great Recession specifically? One criticism of Marxian crisis theory
generally comes from James Crotty (1985). He writes,
From his analysis of capitalist production Marx develops the familiar
tendencies of the rate of profit to alternately rise and fall over time,
tendencies that help generate the unstable growth pattern characteristic of
capitalist economies. This analysis is fundamentally incomplete,
however, because the conditions in the sphere of circulation in any era
codetermine the vigor of accumulation, the degree and character of the
vulnerability of accumulation to adverse financial and nonfinancial
developments, the timing of the onset of the crisis, and the depth and
duration of contraction. Indeed, in the absence of an analysis of
circulation it is not clear why a fall in the rate of profit should lead to a
crisis at all; a lower but positive rate of growth is a more logical outcome
of a decline in the profit rate taking only production relations into
consideration. Marx’s views on accumulation and crisis are neither
complete nor compelling unless understood as the unity of circulation and
production. (48)
3. Kaleckian Profit Flows
Crotty was not alone in his critique of Marxian crisis theory. Michal Kalecki’s
critique of the relative neglect of circulation in Marx’s work is similar to Crotty’s.
Kalecki argued that Marx “did not systematically scrutinize the process described by his
11
reproduction schemes from the point of view of the contradictions inherent in capitalism
as a result of the problem of effective demand” (Kalecki 1991, 465).
But unlike Keynes, Kalecki sought to understand effective demand problems
within the context of the Marxian reproduction schemes. Furthermore, this was not an
inconsequential or short-lived intellectual exercise for Kalecki. It forms the basis of his
theory of profits in his book Theory of Economic Dynamics: An Essay on Cyclical and
Long-Run Changes in Capitalist Economy (1954). Issues of integrating an analysis of
circulation into the Marxian perspective were on his mind up to his death in 1970, as is
evident in “The Problem of Effective Demand with Tugan-Baranovsky and Rosa
Luxemburg” (1991) and “The Marxian Equations of Reproduction and Modern
Economics” (1991). In these three publications it is clear that Kalecki found value in
maintaining Marx’s class-based, surplus approach towards understanding profits.
The next question is how Kalecki’s approach, based on the abstractions of Marx’s
reproduction schemes, can inform the Great Recession. Some of the connections between
Marx, Kalecki, and the Great Recession are already established in the work of Foster and
Magdoff (2009). They were certainly attuned theoretically to profit realization
difficulties. They asked the key question, namely, what were the outlets for the surplus?
Yet Foster and Magdoff never captured or measured all the specific sources of profit
realization. One can, however, pick up where Foster and Magdoff left off. Fortunately,
Kalecki used the insights of the Marxian reproduction schemes and the circulation
conditions of profitability and applied them to national accounting conventions. Using a
very simplified balance sheet of the gross national product:

12
Gross Profits
Net of (direct) taxes
Gross investment
Wages of salaries
Net of (direct) taxes
Export surplus
Taxes (direct and indirect) Government expenditure on
goods and services
Capitalists’ consumption
Workers’ consumption
Gross national product Gross national product
Table 1: Kalecki’s Gross National Product8
By rearranging the terms Kalecki produced his famous profit equation:
(1) Gross profits net of taxes = Gross investment + Export surplus + Budget deficit -
Workers’ saving + Capitalist consumption.9 Even though this profit identity is frequently
cited, I argue that its significance is often overlooked. As it is based on Marx’s
production scheme theory, which is in turn based on the labor theory of value and labor
exploitation, it is mindful of the fundamental aspects of Marxism. But it is also the
product of Kalecki’s own work in attempting to integrate aspects of circulation and
8Kalecki (1954, 48). 9Ibid. (49).

13
realization into Marxism. And finally, the equation lends itself to the empirical
measurement of profits and its components.10
Unfortunately, there have been very few attempts to measure Kaleckian profit
flows for the U.S., and no estimates cover a significant portion of the post-crisis era.11
Part of the reason for this is that until recently, there was no published method to estimate
total Kaleckian profit flows and all the various component contributions for the U.S.
economy. Brennan (2014) developed such a method, building, as did Kalecki, from
national income and expense tables, and provided estimates for profits and all the sources
of realization from 1964-2009. Here that series will be extended into the recovery years.
Kalecki derived his profit identity from simplified national income and expense
accounts, and one can do the same with modern national accounts. Specifically, by
rearranging the various expenses from the Distribution of Gross Domestic Product
accounts (i.e. the expense approach) and the sources of income from the Distribution of
National Income accounts (i.e. the income approach), one can arrive at a modern profit
identity that is in keeping with Kalecki’s original profit identity.12 Using the expense and
income categories established by the Bureau of Economic Analysis, we arrive at the
following:13
(2) Profits = Personal consumption expenditures - Compensation of employees +
Gross private domestic investment + Net U.S. exports of goods and services + 10The argument is not that this equation incorporates all that is important from Marx, Kalecki, Keynes, Minsky, and the empirical measurement of profits. All that is asserted is that this equation is an important touchstone for a variety of theoretical and empirical traditions. 11 Toporowski (1999) considers contributors to profit realization relative to GDP, which gets at the relative role of investment, government deficit spending, and trade balances, but he does not calculate total profits for the U.S. 12 Categories from the actually existing accounts available from the Bureau of Economic Analysis and the Bureau of Labor Statistics are in italics. 13 For the complete step-by-step derivation of this identity from Tables 1 and 2 of the Bureau of Economic Analysis, see Brennan (2014).

14
Government consumption expenditures and gross investment - Taxes on production and
imports + Subsidies - Taxes on corporate income - Current surplus of government
enterprises - Government consumption of fixed capital - Statistical discrepancy + Net
U.S. income receipts from rest of the world - Business current transfer payments (net)
To better see how this modern equation represents Kalecki’s original equation, we should
explore each term. For Kalecki, gross investment meant private investment, while public
investment was included in government expenditure (48).
Therefore,
3) Gross investment = Gross private domestic investment
Kalecki’s export surplus is the trade deficit or surplus of goods and services.
(4) Export surplus = Net U.S. exports of goods and services
Kalecki’s budget deficit refers to government’s total revenues from taxes and other
sources minus all distributions, net of depreciation. This includes all federal, state, and
local revenues and expenses.
(5) Budget deficit = Government consumption expenditures and gross investment -
Taxes on production and imports + Subsidies - Taxes on corporate income - Current
surplus of government enterprises - Government consumption of fixed capital
Clearly, reproducing the categories of gross investment, export surplus, and
government deficits based on existing accounts is a straightforward process. The
categories of capitalists’ consumption and workers’ savings are more difficult to
reproduce, because consumption and savings data are not broken down into classes.
Hence, one cannot glean data for either of these categories from existing national

15
accounts. We know, however, that if we divide the U.S. economy into workers and
capitalists, as Kalecki did, then
(6) Total consumption = Capitalists’ consumption + Workers’ consumption
(7) Workers’ income = Workers’ consumption + Workers’ savings
Therefore,
(8) Capitalists’ consumption - Workers’ savings = Total consumption - Workers’
income
The modern accounting categories available from the Bureau of Economic Analysis that
best reflect the sum of capitalists’ consumption - workers’ savings are
(9a) Capitalists’ consumption - workers’ savings = Personal consumption
expenditures - Compensation of employees
Equation 9a maintains the profit identity, and thus its use can be justified.
However, perhaps such a representation loses some of the class distributional aspects that
Kalecki and Marx were trying to capture. The modern concept of profit deducts the wage
and salary expenses of all employees and includes payments for wages and salaries to
assembly line workers and CEOs alike. Kalecki, like Marx, maintained that capitalists,
supervisors, and managers were paid out of the existing surplus. To capture this class
aspect, I suggest that instead of deducting the compensation of all employees, one deduct
the compensation of production and nonsupervisory workers only. Then we have
(9b) Capitalists’ consumption - workers’ savings = Personal consumption
expenditures - Compensation of production and nonsupervisory labor14
14 There is no method to empirically distinguish capitalists’ consumption from other consumption or workers’ debt from other personal debt. Therefore, these must be combined. However, this is not as inconvenient as it might first appear, because capitalists, as individuals, must either consume or save their income. That which is not consumed is saved and becomes the funds available for workers to borrow. Of

16
By understanding “Capitalists’ consumption” in this way, one measures the consumption
of unproductive labor such as all top management and also the consumption of managers
and supervisors.
This then leaves a remainder from the national accounts:
(10) Remainder = - Statistical discrepancy + Net U.S. income receipts from rest of the
world - Business current transfer payments (net)
Using the definitions above for gross investment, export surplus, the government
deficit, capitalists’ consumption - workers’ savings (from equation 9b), and a remainder,
we arrive at a modern presentation of Kaleckian profit flows based on categories
currently found in modern national accounts.
(11) Kaleckian Profits = Gross investment + Export surplus + Government budget
deficit + (Capitalists’ consumption - Workers’ savings) + Remainder
Using data available from the Federal Flow of Funds and the Bureau of Labor
Statistics, we have the following chart of U.S. profits and the expenses responsible for
realization:15
course, capitalists can borrow from other capitalists in order to consume, but that is an intra-class transfer from one capitalist to another and is captured in total capitalist class consumption. 15 Data from the Federal Flow of Funds accounts were gleaned from http://www.federalreserve.gov/releases/z1/Current/data.htm, September 25, 2013 release. Data on wages and the number of employed production and nonsupervisory workers were gathered from http://data.bls.gov/pdq/querytool.jsp?survey=ce. Total wages paid to production and nonsupervisory labor were calculated by taking the total number of workers employed each quarter (Series ID CES0500000006) and multiplying by 4 to get the annualized quarterly total. That total number of production and nonsupervisory workers was multiplied by the average wage of workers in those occupations (Series ID CES0500000030). All remaining data are likewise annualized quarterly data, and are seasonally adjusted. The data have been converted to real values by using the implicit chained-type price deflator for GDP with 2009 as the base available from the Bureau of Economic Analysis, Table 1.1.9 Implicit Price Deflators for Gross Domestic Product.

17
Figure 1. Kaleckian profits and components of realization for the U.S.

18
Figure 2. Marxian rate of profit and gross investment
Because Kaleckian profits equal the total surplus in the economy and we have
data on V, the wage bill to productive labor, and the value of the capital stock is
available, the Marxian rate of profit (S/V)/((C/V)+1) can be calculated.16
Pre-Neoliberal Neoliberal Crisis “Recovery”
1964Q1-1980Q1
1980Q1-2006Q1
2006Q1-2010Q1
2010Q1-2013Q1
Total Profits 4.32% 10.45% 0.02% 2.86% Profit Rates -0.78% 0.92% -0.69% 0.95%
S/V 1.45% 3.99% 0.02% 0.31% C/V 2.96% 3.94% 0.87% -0.76%
Investment 4.96% 10.25% -8.93% 6.75% V 2.83% 6.22% 0.00% 2.53%
CC and WS 4.73% 12.15% 0.24% 2.33% Table 2. Key annual growth rates
Pre-Neoliberal Neoliberal Crisis “Recovery”
1964Q1- 1980Q1- 2006Q1- 2010Q1-
16 S = surplus value, V = value paid to productive labor, and C = value of the constant capital. Data on the capital stock are from the BLS Table 4.1 Current-Cost Net Stock of Private Nonresidential Fixed Assets by Industry Group and Legal Form of Organization. This data set is suggested by Maniatis (2012) to estimate the value of the capital stock. The data are annual, and I use linear extrapolation to arrive at quarterly estimates.
0
0.1
0.2
0.3
0.4
0.5
0.6
0.7
0
500000
1000000
1500000
2000000
2500000
3000000
3500000
1964Q1
1965Q4
1967Q3
1969Q2
1971Q1
1972Q4
1974Q3
1976Q2
1978Q1
1979Q4
1981Q3
1983Q2
1985Q1
1986Q4
1988Q3
1990Q2
1992Q1
1993Q4
1995Q3
1997Q2
1999Q1
2000Q4
2002Q3
2004Q2
2006Q1
2007Q4
2009Q3
2011Q2
2013Q1
Grossinvestment Rateofpro<it
19
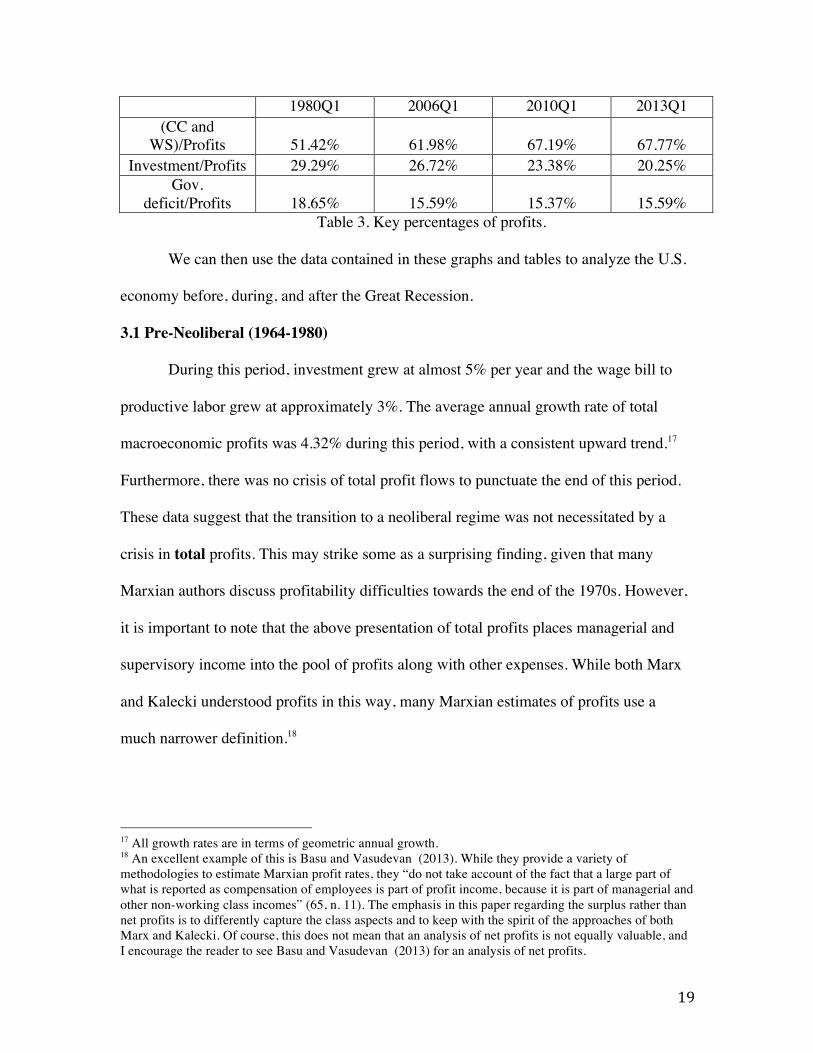
1980Q1 2006Q1 2010Q1 2013Q1 (CC and
WS)/Profits 51.42% 61.98% 67.19% 67.77% Investment/Profits 29.29% 26.72% 23.38% 20.25%
Gov. deficit/Profits 18.65% 15.59% 15.37% 15.59%
Table 3. Key percentages of profits.
We can then use the data contained in these graphs and tables to analyze the U.S.
economy before, during, and after the Great Recession.
3.1 Pre-Neoliberal (1964-1980)
During this period, investment grew at almost 5% per year and the wage bill to
productive labor grew at approximately 3%. The average annual growth rate of total
macroeconomic profits was 4.32% during this period, with a consistent upward trend.17
Furthermore, there was no crisis of total profit flows to punctuate the end of this period.
These data suggest that the transition to a neoliberal regime was not necessitated by a
crisis in total profits. This may strike some as a surprising finding, given that many
Marxian authors discuss profitability difficulties towards the end of the 1970s. However,
it is important to note that the above presentation of total profits places managerial and
supervisory income into the pool of profits along with other expenses. While both Marx
and Kalecki understood profits in this way, many Marxian estimates of profits use a
much narrower definition.18
17 All growth rates are in terms of geometric annual growth. 18 An excellent example of this is Basu and Vasudevan (2013). While they provide a variety of methodologies to estimate Marxian profit rates, they “do not take account of the fact that a large part of what is reported as compensation of employees is part of profit income, because it is part of managerial and other non-working class incomes” (65, n. 11). The emphasis in this paper regarding the surplus rather than net profits is to differently capture the class aspects and to keep with the spirit of the approaches of both Marx and Kalecki. Of course, this does not mean that an analysis of net profits is not equally valuable, and I encourage the reader to see Basu and Vasudevan (2013) for an analysis of net profits.

20
In terms of circulation, the primary source of realization was capitalists’
consumption minus workers’ savings, more easily understood as capitalists’ consumption
and workers’ debt. This made up just over 50% of expenditures responsible for
realization. Furthermore, there was a gradual rise in this percentage of profits from 51%
in 1964Q1 to 55% in 1980Q1. Investment accounted for only approximately 30% of
profits. Like capitalists’ consumption and workers’ debt, investment’s share of profits
crept upward from 28% in 1964Q1 to 32% in 1980Q1. The trade surplus is an
insignificant contributor to profits during this period, as it hovers around zero. This
leaves the government fiscal deficit to make up the rest. In 1964Q1 it accounted for 18%
of profits; in 1980Q1 it was 17%. But there were periods where government deficit
spending accounted for a higher share of profits, as in 1967Q1 when it reached 22%.
It is important to appreciate that although the period from 1964-1980 might be
understood as the fading years of a Golden Age of capitalism, investment, even then, was
never the primary driver of profit realization. Investment’s share peaked in 1979 at 33%
of profits. The primary driver then was capitalists’ consumption. This is especially true
with individual savings rates hitting a peak around this time of approximately 9% (Florio
2011-2012, 18, fig. 8). (Remember that workers’ savings discourage profit realization.)
Clearly, what allowed such high levels of capitalists’ consumption was a distribution of
income that was moving in favor of capitalists (and other unproductive labor), even
before the neoliberal era began. Another interesting aspect of the pre-neoliberal period is
the large role government deficits played in supporting profits. In some quarters,
government deficit spending supported profits almost as much as private investment.

21
In contrast to total profits, the picture regarding profit rates is very different.
While total profit flows rose by 4% annually, the profit rate declined slightly with -.78%
annual average growth. While the decline on an annual basis is small, this is a sixteen-
year period of declining profit rates. Despite the declining profit rate, investment grew at
5% annually and total payments to productive labor increased by 2.8% annually. Why
would accumulation and the hiring of productive labor occur at such rates with declining
profit rates? The answer may be the high profit flows of 4.3% per year, which allowed for
income flows that could accommodate higher investment and hiring of productive labor.
What is also revealed in this period is the important difference that profit rates and
profit flows play in the economy. While the declining profits rates did lead to a general
slowdown in economic activity, there was no immediate crisis of the type experienced in
the Great Recession. As we will see, a crisis like the Great Recession concerns the abrupt
disruption of money and profit circulation. Declining profit rates alone bring about
reduced economic growth.
3.2 Neoliberal Period (1980-2006)
Of course, capitalism needed to address the issue of falling profit rates eventually,
and the burden to improve these rates fell on the productive workers. While the
productive wage bill rose 6% annually during this period, the rate of growth of
exploitation more than doubled over the previous period. Specifically, S/V grew at 1.5%
annually in the pre-neoliberal period and at 4% in this period. Hence, neoliberalism had a
significant effect on productive labor, as many Marxian theorists duly note. Yet despite
this successful effort to extract more surplus from the labor, profit rates did not change
very much, growing at only 1% annually. What, then, was happening during this period?
22
Beyond fighting labor, this period also manifested a shifting distribution of
income towards those who received distributions from the surplus (capitalists and other
unproductive labor) and a rise in workers’ debt. While distinguishing the effect of the
shifting distribution from the rise in debt is difficult given the constraints of the data,
there is significant evidence that both occurred. Dew-Becker and Gordon (2005) find that
income gain of the top income earners occurred at the expense of the median workers
(114). The most startling evidence they find is that 45% of growth in real labor income
from 1966-2001 went to the top 99.99th percentile, and they “infer that more than half of
the 99.99th percentile consists of CEO[s] or other highly paid top executives” (Brennan
2014, 250).
With respect to rising debt levels one need only look at mortgage debt levels,
which funded much worker consumption (Kotz 2009. According to Brennan (2014), from
1952 to 1982 the growth rate of mortgages was 5.9%, a $48.8 billion annual increase in
2005 dollars. From 1982-2006 the rate was 6.8%, and there was an annual increase of
$318.6 billion (252). Harvey (2010), Kotz (2009) and Wolff (2010) also discuss the
dramatic rise in debt.
The rise in capitalists’ consumption and workers’ debt was 12% annually,
culminating in 62% of profits. This consumption and debt, as sources of realization,
dramatically increased total profit growth rates to 10.5% on a yearly basis. This suggests
that neoliberalism and the accompanying financialization were mainly about both
increasing exploitation in the production sphere and increasing the realization of that
labor-produced surplus. To increase only circulation or realization without an
accompanying increase in the real surplus to be realized eventually causes inflation.

23
However, 1980-2006 largely avoided high inflation by having increased rates of
exploitation over the preceding period. This increase in exploitation and realization
created high profit flows and improved rates of profits over the previous period. There
was one important caveat to the low inflation story, however. The housing market began
to experience inflation beginning in earnest in the early 2000s.
3.3 Crisis (2006-2010)
While many non-Marxian perspectives blame the financial and housing sector
meltdown for the Great Recession, they are only partially correct in naming the
immediate cause of the crisis. In the view presented here, the housing market implosion,
which gave rise to further financial sector difficulties, disrupted the realization of profits
as is evident in Figure 1. There is a clear decline in realized profits of approximately
$360 billion 2009 dollars from 2008Q3 to 2009Q1. Two sources of realization were
particularly hard hit. The most influential by far was capitalists’ consumption and
workers’ debt, which had the unprecedented experience of falling for three consecutive
quarters in 2008Q3, 2008Q4, and 2009Q1. While this may initially seem insignificant,
there have been no episodes of even two consecutive quarterly declines in this variable
for at least the last fifty years. Perhaps it last happened during the Great Depression;
perhaps it has never happened in the U.S. prior to the Great Recession. The other
important source of realization was investment, which fell dramatically in 2006, 2007,
and 2008. Without any doubt the disruption in credit and financial markets caused the
immediate crisis. In this sense, the Great Recession was a realization crisis.
Yet the analysis of the crisis would be incomplete if it were merely viewed as a
disruption in profit realization. The Marxian profit rate peaked in 2004Q1 at 64%. In

24
contrast to the pre-liberal period, firms did not continue to invest with declining profit
rates for sixteen years. Rather, investment peaked in 2006Q1 and was in a significant
decline until 2009Q2. This is due partly to credit rationing, but it is also due to the fact
that firms found it less profitable to invest after 2004 than before. In short, the real
conditions of production were no longer yielding ever-higher exploitation rates.
However, as a result of continued impressive profit flows, the difficult economic situation
emerging during 2004 was largely unnoticed. Total profits peaked in 2008Q3, despite the
declining contribution of investment to realization at that time. As one might expect, it
was a shifting distribution of income and increased debt that picked up most of the slack
regarding profit realization. During this period, capitalists’ consumption and workers’
debt accounted for a massive 67% of profit flows. There was also a noteworthy uptick in
government deficit spending. Profit, accumulation, and exploitation rates ran out of
momentum just before and during the time of the crisis. Specifically, from 2006Q1 to
2010Q1 on an annual basis profit rates grew at -.7%, investment grew at -9% and the rate
of exploitation at .02%. Yes, U.S. capitalism had experienced similar negative growth of
the profit rate in the recession of 1980, but the significant difference here was the very
low profit growth rates and the low growth of total profits during this period. It was the
significant dip in total profit flows coupled with the low rates of profit, accumulation, and
exploitation that formed the Great Recession.
The reason for the timing of the housing bust now also becomes clearer. The rate
of exploitation up to that time peaked during 2006Q1. Yet profit flows continued to rise
until 2008Q3. Therefore, the financial sector was essentially trying to realize profit gains
that were not there in real production. This is one reason why the housing boom could not

25
continue much past the end of 2005. While the crisis was indeed precipitated by the
housing collapse, the collapse was brought on by difficulties of both profit production
and realization.
3.4 “Recovery” (2010-2013)
As the introduction to the paper indicates, by some measures the crisis was short-
lived. What accounts for this very quick “recovery”? Clearly there was not enough time
for the fundamentals of production, income, or distribution to change significantly. The
data provided in this paper bear witness to this. The profit rate has improved but is only
growing at 1% per year. That growth is largely due to a falling trend in the organic
composition of capital at a rate of .8% per year. As Harvey suggested, an increase in
exploitation could have helped the recovery, but the rate of growth of exploitation is near
zero at .3%. This does not compare well with the growth in the rate of exploitation of
1.4% in the pre-neoliberal era or 4% in the neoliberal era.
Figure 3. Rates of exploitation
As Figure 3 illustrates, the rate of exploitation has been on a plateau since 2005. With
recent estimates of the rate of surplus value around 3.5, this means that out of an eight-
1.52
2.53
3.54
1964Q1
1965Q3
1967Q1
1968Q3
1970Q1
1971Q3
1973Q1
1974Q3
1976Q1
1977Q3
1979Q1
1980Q3
1982Q1
1983Q3
1985Q1
1986Q3
1988Q1
1989Q3
1991Q1
1992Q3
1994Q1
1995Q3
1997Q1
1998Q3
2000Q1
2001Q3
2003Q1
2004Q3
2006Q1
2007Q3
2009Q1
2010Q3
2012Q1
S/V

26
hour workday approximately 6.25 hours are appropriated as surplus labor.19 Perhaps we
are running up against the current limits of exploitation. Can productive workers
reproduce themselves and meet their needs by essentially working less than two hours a
day for themselves and six or more for the capitalist enterprise? Perhaps the current limits
can be overcome—by technology, for example—but there is no concrete and definitive
reason to think that the limit will be overcome quickly.
In the end, this “recovery” is almost completely driven by the rise in total profit
flow realization by 2.86% per year. But this rate of growth does not compare favorably to
the rate of growth of 4.32% in the pre-neoliberal period or of 10.45% in the neoliberal
period. Furthermore, profit realization cannot long outpace actual produced surpluses.
This means that unless something changes, this recovery will likely place the U.S.
economy on a footing similar to the one that caused the Great Recession. In some ways
the recovery period may even be more unstable than the period of the mid-2000s, as the
role of capitalists’ consumption and workers’ debt is at its historic high, representing
67.77% of total profit flows, and investment will play an even smaller role than in the
past. This suggests that the current path of the “recovery” will not be one of a reversal of
the neoliberal patterns but an intensification of them. Hence, the “success” of the U.S.
economy on this path will depend on productive corporations’ continued fight to
increasingly shift the distribution of income in favor of those who live off the surplus
labor and the financial sector’s enhanced ability to funnel more of that income into debt
for those who produce the surplus. In short, the “recovery” will depend on an increase in
19These estimates of the rate of exploitation are of a similar magnitude to the estimates provided by Paitaridis and Tsoulfidis (2012), who also incorporate unproductive labor into the surplus.
27
the rate of exploitation and the ability of finance to increase the debt burden on workers.
These are the unfortunate conditions of economic “success” today.
4. Conclusion
Marxian theory was not wrong about the causes of the Great Recession, although
various Marxian theories emphasized different aspects of the crisis. In the end, the rate of
profit matters for the trajectory of the economy. But to understand crises like the Great
Recession, profit rates alone are not sufficient. Crises, unlike typical recessions, are
sudden and often unforeseen. The Great Recession was both a profit rate and a profit
realization crisis. The role of consumption out of the surplus and workers’ debt provided
sources of realization that hid for some time the profit rate difficulties in the economy
that were the focus of much of Marxian crisis theory.
By measuring the sources of realization, we see the extent to which these sources
are changing over time. The common assumption that “capitalists don’t consume and
workers don’t save” is completely outdated. As the ranks of unproductive labor grow
(Moseley 1992; Mohun 2005; Paitaridis and Tsoulfidis 2012) it is important to take into
account all of that income. As Kalecki correctly argues, the consumption aspect of that
income is a source of profit realization. The proportion of unproductive labor’s income
that is not spent becomes a source of debt for productive workers. Productive workers do
save, albeit negatively, as they take on debt. This debt is also a significant source of profit
realization. What the empirical data show is that many heterodox models of the economy
assume away what have become the largest sources of profit realization. In many ways
neoliberalism is as much about disciplining labor as it is about improving the two sources
of profit realization noted here.

28
Looking forward, it appears that the U.S. economy will continue on the neoliberal
path. With regard to production, I expect productive labor to be further pressed to
produce surpluses despite the fact that it may be difficult to do so. But also I expect the
distribution of income to shift more in the direction of capitalists and other unproductive
labor while more debt is made available to workers. One very disappointing aspect of this
scenario is that even if the growth in exploitation is near zero and the profit rate has a
long downward trend, this path can be maintained for some time. Adequate profit flows
for realization allow the economy to have sufficient circulation to avoid a crisis even in
very low profit and low accumulation environments. The “recovery” is an example of
this. Despite low rates of accumulation and near-zero improvements in median wages, the
economy endures.
References Basu, D., and R. Vasudevan. 2013. Technology, distribution and the rate of profit in the
US economy: understanding the current crisis. Cambridge Journal of Economics 37: 57-89.
Boddy, R., and J. Crotty. 1975. Class conflict and macro-policy: The political business
cycle. Review of Radical Political Economics 7 (1): 1-19. Bout, A. 2015. Trends in S&P 500 CEO compensation. https://corpgov.law.harvard.edu/2015/12/30/trends-in-sp-500-ceo-compensation/ (accessed January 12, 2017). Brennan, D. 2014. ‘Too bright for comfort’: A Kaleckian view of profit realization in the
USA, 1964-2009. Cambridge Journal of Economics 38: 239-255. Crotty, J. 1985. The centrality of money, credit, and financial intermediation in Marx’s
crisis theory: An interpretation of Marx’s methodology. In Rethinking Marxism: Essays for Harry Magdoff and Paul Sweezy, ed. S. Resnick and R. Wolff, 45-81. New York: Autonomedia.
Dew-Becker, I., and B. Gordon. 2005. Where did the productivity growth go? Inflation
and the distribution of income. Brookings Papers on Economic Activity 2: 67-150.

29
Duménil, G., and D. Lévy. 2011. The Crisis of Neoliberalism. Cambridge, Mass.:
Harvard University Press. Florio, M. 2011-2012. The real roots of the Great Recession: Unstable income
distribution. International Journal of Political Economy 40 (4): 5-30. Foster, J. B., and F. Magdoff. 2009. The Great Financial Crisis: Causes and
Consequences. New York : Monthly Review Press. Giacché, V. 2011. Marx, the falling rate of profit, financialization, and the current crisis.
International Journal of Political Economy 40 (3): 18-32. Harvey, D. 2010. The Enigma of Capital. Oxford: Oxford University Press. Ivanova, M. 2012. Marx. Minsky, and the Great Recession. Review of Radical Political
Economics 45 (1): 59-75. Izquierdo, S. 2013. The cyclical decline of the profit rate as the cause of crises in the
United Sates (1947-2011). Review of Radical Political Economics 45 (4): 463-471. Kalecki, M. 1939. Essays on the Theory of Economic Fluctuations. New York: Farrar &
Rinehart. Kalecki, M. 1954. Theory of Economic Dynamics. London: Unwin Brothers. Kalecki, M. 1991. Collected Works of Michał Kalecki, vol. 2. Oxford: Clarendon Press. Kliman, A. 2010. Appearance and essence: Neoliberalism, financialization, and the
underlying crisis of capitalist consumption. http://www.marxisthumanistinitiative.org/economic-crisis/appearance-and-essence-neoliberalism-financialization-and-the-underlying-crisis-of-capitalist-production.html (accessed January 12, 2017).
Kotz, D. 2008. Neoliberalism and financialization. Paper presented at The Political
Economy of Monetary Policy and Financial Regulation: A Conference in Honor of Jane D'Arista. Political Economy Research Institute, University of Massachusetts Amherst.
Kotz, D. 2009. The financial and economic crisis of 2008: A systemic crisis of neoliberal
capitalism. Review of Radical Political Economics 41 (3): 305-317. Maniatis, T. 2012. Marxist theories of crisis and the current economic crisis. Forum for
Social Economics 41 (1): 6-29.

30
Mishel, L., E. Gould, and J. Bivens. 2015. Wage stagnation in nine charts. http://www.epi.org/publication/charting-wage-stagnation/ (accessed January 12, 2017).
Mohun, S. 2006. Distributive shares in the US economy, 1964-2001. Cambridge Journal
of Economics 30: 347-370. Moseley, F. 1992. The Falling Rate of Profit in the Postwar United States Economy. New York: St. Martin's Press. Paitaridis, D., and L. Tsoulfidis. 2012. The growth of unproductive activities, the rate of
profit, and the phase-change of the U.S. economy. Review of Radical Political Economics 44 (2): 213-233.
Pompa, F., and D. Gainer. 2013. Dodd-Frank act: After 3 years, a long to-do list. USA
Today. http://www.usatoday.com/story/money/business/2013/06/03/dodd-frank-financial-reform-progress/2377603/ (accessed January 12, 2017).
Toporowski, J. 1999. Kalecki and the declining rate of profit. Review of Political
Economy 11 (3): 355-371. Weisskopf, T. E. 1978. Marxist perspectives on cyclical crises. In U.S. Capitalism in
Crisis, ed. Union for Radical Political Economics, 241-260. New York: Union for Radical Political Economics.
Weisskopf, T. E. 1979. Marxian crisis theory and the rate of profit in the postwar U.S.
economy. Cambridge Journal of Economics 3 (4): 341-378. Wolff, R. 2010. Capitalism hits the fan. In The Economic Crisis Reader, 2nd ed., ed. G.
Friedman, F. Mosley, C. Sturr, and the Dollars and Sense Collective, 44-47. Boston: Economic Affairs Bureau of Dollars and Sense.

31