regent'smohege inner oi- regent's - · pdf filemainly at specialists who wish either...
TRANSCRIPT

I 1
Papers in this set:
90/2a Newsletter90/2b Farmer Participation in Planning, Implementation and Operation
of Small-Scale Irrigation Projects by Ian Smout90/2c Reading, Writing and Cultivating: The Role of Literacy in
Irrigation by Juliet Millican90/2d Estimating the Economic Profitability of Irrigation: The Case of
Brazil by The FAO Investment Centre;90/2c Tank Irrigation in South India: What Next? by K Palanisami
; send comments on this paper to the author or to:
Lindef||||incent .Editor^ilpgation Management NetworkOverseapiDeyelopment InstititueRegent'sMoHegeInner Oi-Regent'sLondon
Comments received by the Editor may be used in future Newsletters orP a p e r s ; y g a ' .' -''.' . . ' • • . • • :.•• _ '-..
The (Mhlons represented are those of the author and do no^^e'Qessarilyreflect^Si^SHcies of the GDI, IIMI, CTA or any organisatiori1 wit^whith
is connected. ' •!;

827
BR 90
IIMIIRRIGATION MANAGEMENT NETWORK
\ L K1 •- •./•:'•
AND
ESTIMATING THE ECONOMIC PROFITABILITY OFIRRIGATION: THE CASE OF BRAZIL
The FAO Investment Centre
ODI/IIMI Irrigation Management Network Paper90/2d

Papers in this set:
90/2a Newsletter90/2b Farmer Participation in Planning, Implementation and Operation
of Small-Scale Irrigation Projects by Ian Smout90/2c Reading, Writing and Cultivating: The Role of Literacy in
Irrigation by Juliet Millican90/2d Estimating the Economic Profitability of Irrigation: The Case of
Brazil by The FAO Investment Centre90/2e Tank Irrigation in South India: What Next? by K Palanisami
Please send comments on this paper to the author or to:
Linden VincentEditor, Irrigation Management NetworkOverseas Development InstititueRegent's CollegeInner CircleRegent's ParkLondon NW1 4NS
Comments received by the Editor may be used in future Newsletters orPapers
The opinions represented are those of the author and do not necessarilyreflect the policies of the ODI, IIMI, CTA or any organisation with whichthe author is connected.

827
BR 90
« * - ' IIMIIRRIGATION MANAGEMENT NETWORK
ESTIMATING THE ECONOMIC PROFITABILITY OFIRRIGATION: THE CASE OF BRAZIL
The FAO Investment Centre
ODI/IIMI Irrigation Management Network Paper 90/2d

Papers in this set:
90/2a Newsletter90/2b Farmer Participation in Planning, Implementation and Operation
of Small-Scale Irrigation Projects by Ian Smout90/2c Reading, Writing and Cultivating: The Role of Literacy in
Irrigation by Juliet Millican90/2d Estimating the Economic Profitability of Irrigation: The Case of
Brazil by The FAO Investment Centre90/2e Tank Irrigation in South India: What Next? by K Palanisami
Please send comments on this paper to the author or to:
Linden VincentEditor, Irrigation Management NetworkOverseas Development InstititueRegent's CollegeInner CircleRegent's ParkLondon NW1 4NS
Comments received by the Editor may be used in future Newsletters orPapers
The opinions represented are those of the author and do not necessarilyreflect the policies of the ODI, IIMI, CTA or any organisation with whichthe author is connected.

ESTIMATING THE ECONOMIC PROFITABILITY OF IRRIGATION:THE CASE OF BRAZIL
The FAO Investment Centre
Contents Page
1 Introduction 4
2 Background 4
3 Why Estimate Economic Profitability? 6
4 The Brazilian Setting 7
5 Methods Used for Estimating Economic Profitability 11
6 Summary of Results 16
7 Conclusions: Advantages and Limitations 19
• ' ' / *
The FAO Investment Centre, Via delle Terme di Caracalla, 00100 Rome,Italy.

ESTIMATING THE ECONOMIC PROFITABILITY OF IRRIGATION:THE CASE OF BRAZIL
The FAO Investment Centre
1 INTRODUCTION
Many countries now face important questions about the futuredevelopment of irrigation, especially decisions on the mixture of public andprivate activities in funding, implementation, management and maintenance.Options need to be reviewed, and priorities decided on from a portfolioof projects. Appropriate developments in infrastructure, advisory andsupport services should then follow this selection. At the moment, allthese stages of irrigation policy development are poorly documented.
This paper describes an attempt to carry out a comprehensive review ofthe economic profitability of irrigation, in the case of Brazil. It is aimedmainly at specialists who wish either to question or improve on theBrazilian analysis, or to attempt a similar exercise for another country.Presentation concentrates on the principles behind the review and onmethodology. The work concerned was carried out by a team from theFAO/World Bank Cooperative Programme.1 Readers requiring moreoperational details or wishing to discuss specific Brazilian implications ofthe results are welcome to contact the team leader.
The authors are very pleased to acknowledge the cooperation of theirBrazilian counterparts in the work described here. They would also liketo thank the Brazilian Government for its support and for permission torelease the review results to a wider readership.
2 BACKGROUND
Irrigated agriculture is quite sharply divided in Brazil between publicschemes and private development. Public schemes, almost all located inthe semi-arid northeast, comprise only some 6% of the total irrigated area,
1 S D Hocombe (Team Leader, Senior Adviser), M Raczynski(consultant, Irrigation Specialist) and M Mendez (Economist).

but until lately received the lion's share of Government attention andinternal as well as external funds; they have often sought to respond tosocial as well as economic needs. Private development has only morerecently been the object of special Government technical support(especially under the PROVARZEAS2 programme), and targeted creditlines. It comprises many forms of irrigation ranging from small to large-scale, and from primitive to highly sophisticated. It is spread through mostparts of the country. There has been a great diversity of performancebetween the two irrigation types, but with public irrigation generallytending to progress slowly and fall short of performance expectations whileprivate irrigation, especially in recent years, has expanded fast and oftengiven high profits. However, direct comparisons have been made difficultby regional differences in irrigation needs and opportunities, the specialsocial needs of the impoverished northeast, as well as by the differentinstitutional arrangements for public and private development.
It was partly for the above reasons that in 1987 the Brazilian Governmentdecided to make a comprehensive review of the complete irrigation sub-sector before making further commitments to its development. Assistedby World Bank funding, the Review took the form of five studies:
a study of future output and demand for basic commodities up to2005 (rice, maize, wheat, soya beans, common beans, and cotton);
a study of the present and possible future economic profitability ofall major forms of irrigation, whether public or private;
two separate studies of sub-sectoral legislation and institutions;
a synthesis of all the above, leading to recommendations for futuresectoral policies and development priorities.
The FAO/World Bank Cooperative Programme assisted with the secondof these studies. Work took place in 1988, and although the Government'sreview was subsequently re-worked together with The World Bank tobecome a joint policy document, the FAO team's initial contribution oneconomic profitability was not changed.
In 1990, with hindsight, it can justifiably be claimed that the Review, andespecially the estimates of economic profitability, greatly reinforced a majorchange in Government irrigation policy which was previously only incipient.
2 Varzeas are seasonally-flooded or flood-prone lowlands.
5

The Review advocated a shift in priorities away from an excessive focuson public schemes in the northeast, in which the Government had tendedto combine the roles of instigator, financier and manager in what wasoften seen as a paternalistic manner, towards a much greater stress onGovernment as the facilitator and regulator of privately-financed irrigation.As a consequence Government plans have since moved more towardscreation of satisfactory conditions for low-cost private irrigationdevelopment, through the provision of access, electricity, technical advice,credit and the like. This shift has been matched by commitments of WorldBank and other external funds. It is now intended that most futureGovernment construction of major supply works should be restricted tosettings where the water source is too distant or too costly to bedeveloped by private individuals or groups acting alone. However, in suchcases a firm commitment by potential beneficiaries to repay Governmentcosts will be a prerequisite for Government involvement, i.e. developmentshould be demand-led. Finally, while fully public irrigation with onlypartial cost recovery is still not excluded a priori from future options, it isnow recognised that special justification - usually social - is necessary.Furthermore, budgetary sources for the continuous Government fundingwhich will be needed should be secure before new commitments are madeto this type of irrigation.
3 WHY ESTIMATE ECONOMIC PROFITABILITY?
Programmes for irrigation development usually have multiple aims. Someof the most frequent are to reduce dependency on agricultural imports, togenerate exports, to reduce fluctuations in output, to intensify production,to aid human survival in semi-arid areas in times of drought, to raisefanner incomes, to create employment, to keep parastatal or privatecontractors in work, or to raise political monuments. But all irrigationprogrammes have one thing in common; they use scarce resources, whetherthese be natural (water, irrigable land), managerial, or financial.Furthermore, in the case of existing irrigation, much of the financialcontribution of Governments tends to be borrowed and hence musteventually be repaid.
Whatever the mix of economic and social aims to which a Governmentgives ultimate priority in its irrigation strategy, it is therefore prudent whenplanning sub-sectoral development to estimate the economic profitabilityof the use of the natural and financial resources being allocated. Withsuch estimates, comparisons can be made between irrigation alternatives,and with rainfed options if these exist. If, at national level, it is decidedfor social reasons to favour one of the less economically profitable forms

of irrigation, the extra public cost of doing so can be identified. From thepoint of view of the national finance ministry or a potential lender, thejustification for, and the economic implications of, the overall programmewhich is eventually proposed for financing are made explicit. If changesor adjustments are considered necessary they can be negotiated on arational and quantified basis.
In practice, few irrigation sub-sector plans are based on such estimates.Most irrigation planners have little time, or perhaps inclination, to makea systematic review of the economic profitability of all technical optionswhen formulating national irrigation strategy. Those who belong toagencies which have irrigation as their 'raison d'etre' tend to give scantattention to rainfed alternatives or even to the comparative advantage ofirrigated local production versus imports. It may be enough simply tosqueeze a 12% economic return out of the technical option preferred bythe agency's engineers. In addition, irrigation planners usually feel thatthey lack the base data and analytical methods for what is seen as acomplicated exercise. However, this paper suggests that meaningfulanalysis is possible using skills and data which can be organised fairlystraightforwardly by interested groups.
4 THE BRAZILIAN SETTING
Brazil is a huge country with a great diversity of climate and agriculturalsystems. There are also many types of irrigation and irrigator, onapproximately 2.3 million hectares of irrigated land. For developmentpurposes the Government has divided the country into five regions.
The south is subtropical, typically cool, with dry winters and warm, moistsummers. It has a highly developed, commercially-oriented agriculture inwhich both large and small farmers share. The risks of winter frost aresuch that there are few viable opportunities for out-of-season winterirrigation. And although supplementary summer irrigation can savefarmers from disaster in a dry year, on average it gives only a smallincrease over the rainfed yields of the staple summer crops of the south -maize, beans and soya. As a result, irrigation development in the southhas instead focused mainly on summer flooding of lowlands for riceproduction. Most is large-scale and mechanised, and closely integratedwith cattle production; largely for reasons of weed control, lowlands aretypically only planted with rice once in every three years and kept undernon-irrigated pasture for the other two. More recently the Governmenthas promoted conventional lowland rice irrigation on a smaller scale, underits PROVARZEAS programme.

The southeast region, stretching approximately from the Tropic ofCapricorn to 14 degrees south is, like the extreme south, dominated bytechnically advanced, commercial farmers. Although it too receives mostof its rainfall in the summer, winters are warmer. Hence, winter irrigationcan allow the farmer to crop land reliably twice instead of once, rotatingwinter plantings of wheat, peas or beans with rainfed summer crops, whichin the southeast also include cotton. Having justified acquisition of anirrigation system on the basis of the returns obtainable from an assuredwinter crop, the farmer can also use it for supplementary irrigation ofsummer crops if necessary. Although there is less of the extensive floodedrice characteristic of the south, the PROVARZEAS programme has madeprogress in all regions including the southeast, where farmers are nowstarting to grow beans and other crops on supplementary irrigation inwinter, in rotation with the main crop of summer flooded rice.
The centre west stretches from the fringes of the Amazon basin in thewest to the state of Goi£s in the east, and from 8 degrees to 24 degreessouth. At its westerly extreme it has a relatively well-distributed rainfallof up to 2500 mm/year and there is little need for irrigation. However,most of the centre west is cerrado (savanna) land, potentially productiveif its natural soil acidity is corrected, but limited by a marked dry seasonof around six months. Rainfall in the remainder of the year averagesaround 1000 mm. Since cerrado soil management techniques are newlydeveloped, much of the region is only now being opened for cultivation,mainly by advanced farmers from further south. Increasing numbers aretaking advantage of the region's many perennial rivers and streams tocomplement their rainfed cereal, soya, bean and cotton production withdry-season irrigated cropping. The large properties and level land arewell suited to centre-pivot and self-propelled irrigation systems, which haveexpanded rapidly in the last few years. Free of winter temperatureconstraints, irrigation in the cerrado can greatly increase the intensity ofland use of this vast, recently occupied area. However, the region isdisadvantaged economically by its distance from main consumption areasand ports.
The northeast includes Brazil's semi-arid lands, which have an irregularlydistributed annual rainfall averaging from 750 mm down to 250 mm. Theregion contains the country's poorest farmers and numerous landlesspeople; many farmers cultivate largely for subsistence. Unlike otherregions water resources in most of the northeast are severely constrained.One major river, the Sao Francisco, dominates the region, but thetopography generally requires that its water be extracted by pumping.There are few other naturally perennial rivers, and although some seasonalrivers have been regulated by the Government, a number have now run
8

dry due to uncontrolled water extraction. There are, however, somelowland areas suitable for flooded rice, mainly in the humid coastal strip.Where water constraints can be overcome, the warm northeastern climatefavours maize, beans, cotton and sugarcane, as well as year-round multiplehorticultural cropping and seed production. Large public-sector irrigationschemes have been constructed and allocated both to entrepreneurs andsmall-scale colonists, with the aim of overcoming intermittent regional fooddeficits while creating employment and benefitting the rural poor.Increasing use is being made of drip and sprinkler irrigation in water-scarce areas, although not always applying very modern technology.
The northern region comprises most of Brazil's humid tropics. Irrigationneeds are few, and development is limited to a small area of lowland rice.
In addition to growing staple commodities such as wheat, maize, rice,beans, soya and cotton, Brazil's irrigators have also seized on opportunitiesto grow high-value, especially horticultural, crops whenever markets permit.Thus, centre-pivot and other advanced systems are used to grow carrots,potatoes, salads and many other vegetables on a semi-industrial scale nearto the huge urban markets of the industrial southeast. The same marketsare supplied off-season with fruits, onions, melons and other vegetablesfrom the favourable climate of the northeast. Smaller scale horticulturistsare found around most towns, irrigating to supply more local demand.Expansion of tomato paste and other vegetable processing factories,especially in the northeast, has given a market opportunity for large andsmall-scale irrigators alike. Increasingly, irrigators in the northeast are airfreighting their fruit and off-season vegetables to Europe and the USA.
Over 94% of Brazil's irrigation has been developed by private individualsor companies.3 The remainder of approximately 6%, defined as publicirrigation, depends on water supplies which have been developed usingGovernment (usually Federal Government) funds, with the major worksbeing Government-operated. In the case of the public colonisationschemes of the northeast, the Government has constructed whole systemsincluding on-farm works, before allocating plots of around 5 hectares topoor or landless farmers (colonos).
3 Although at times with official credit and/or government technicaladvice, e.g. the PROVARZEAS programme. Some of this area may alsobenefit from publicly-funded drainage schemes, especially extensive ricegrowing in the south.

The division of Brazil's irrigated areas and estimated irrigation potentialbetween regions, and public and private developments, is shown below. Itshould be noted, however, that the estimate of potential in some regionsis likely to be exaggerated. In particular, although the northern regionmay have water resources and soils sufficient for 20 million hectares ofirrigation, to irrigate such a large area may not be economically justified.
TABLE 1: BRAZIL; ACTUAL AND POTENTIAL IRRIGATED AREA
Region
South
Southeast
Centre west
Northeast
North
Brazil
Total
IrrigationType
PublicPrivate
PublicPrivate
PublicPrivate
PublicPrivate
PublicPrivate
PublicPrivate
Source: After Ministry of
PresentIrrigated
24954
12580
16247
79321
18
1312,120
2,251
TechnicalPotential
4234,577
5786,979
22210,778
7185,352
20,000
1,94147,686
49,627
PercentDeveloped
621
28
72
116
<1
74
5
Irrigation and affiliated agencies, 1987.
The approximately 2.3 million hectares so far developed represents onlyabout 5% of estimated technical potential. Development has beenpiecemeal and often fragmented. For instance, the PROVARZEASprogramme, for support of private irrigation, operates in all regions and islinked to the Federal Ministry of Agriculture; it is executed through the
10

state-level units of the National Agricultural Extension Enterprise whichare linked to the agricultural secretariats of state Governments. The mainpublic irrigation agencies, on the other hand, operate only in the northeast,and were until very recently linked to a different federal ministry. Theyhave had little interaction with state-level irrigation. Each Governmentbody concerned with irrigation development has tended to set its owncriteria and agenda. Meanwhile, much private development in all regionshas taken place in a 'laissez faire' atmosphere, with minimum Governmentsupport and no systematic application of the laws on water extraction anduse. At the same time public developments in the northeast have followeda conflicting set of objectives; they have been loosely justified on socialgrounds, whereas if all legally-specified irrigation charges were to becollected and sales taxes paid, the beneficiaries would repay more than fullirrigation costs. Nevertheless, in practice far less than the legally-specifiedamounts have ever been recovered.
5 METHODS USED FOR ESTIMATING ECONOMICPROFITABILITY
For a complete analysis of profitability it is necessary to consider returnsto all the factors of production - irrigable land, water, labour and capital -for all major types of irrigation.4 It is true that not all these factors areoverriding constraints in a given setting, and hence some results will beredundant.5 However, to ensure full comparability it was consideredbetter, despite the great diversity of the Brazilian setting, to attempt ananalysis which was comprehensive than to risk being too selective.
To represent the various types of irrigation, hectare crop budgets wereprepared which were then assembled into static farm models. The analysisthus used techniques with which the FAO/World Bank team was alreadyfamiliar. After weighing the analytical complexities of including livestockactivities in the analysis against the relatively low importance of irrigatedfodders and pasture, it was decided, however, not to include livestock.
4 Return on managerial resources was considered outside the scopeof the work described here.
5 For instance, both land and water are plentiful on the cerrado andthe mechanised production system substitutes labour needs with capital.On the other hand, water and irrigable land are both scarce in thenortheast and high labour use, and labour returns are desirable to meetthe social aims of public irrigation.
11

TABLE 2: BASIC FARM MODELS FOR ANALYSIS
BasicModelNumber
1
2
3
4
5
6
7
8
9
10
Description
Private, extensiveflooded rice
Private, lowland(PROVARZEAS model)
Private or colonistsmall mobile sprinkler system
Private, centrepivot system
Privately developedor public supply, centrepivot system
Colonist, publicscheme
Private, small-scalesprinkler system tj/
Private, small-scalehorticulture
Private, large-scalescale horticulture, self-propelled irrigator
Colonist, horticulture,public scheme
Hectares RegionsRepresented
Main Crops
120
12
10
100
100
2.5
50
11 Privately developed orpublic supply, intensive,mainly localised irrigation
26
s
ALL
SE CO NE
SECO
NE
NE
NE
ALL
SE CO NE
NE
NE
Rice
R i c e , f o o dcrops
Cereals, beanssoya
Cereals, grain,legumes,tomato
Cotton plus above
Cotton, cereals,beans
Maize, beans, onionas cash crop
Leaf and rootvegetables
Above plus potato,tomato
Tomato, water-melon, onion,food crops
Grape, papayamelon
a/ S = south, SE = southeast, CO = centre west, NE = northeast.
b/ A recently introduced credit programme in the northeast is distributing small sprinkler kitsto farmers.
12

To arrive at budgets and models all accessible local data sources werereviewed. These included project feasibility studies and recent contractawards, publications in the development literature, models prepared byconsultants for a recent World Bank loan to support private irrigation inthe south, southeast and centre west, and a 1983 FAO/World Bank reviewof irrigation in the northeast. Irrigation specialists in developmentagencies, extension, research, and the private sector were interviewed.
Local consultants then carried out a series of field studies in areas, or ontypes of system for which supplementary information appeared a priorityneed. On the basis of all this information, eleven basic models weredefined to represent irrigation in Brazil and these are summarised in Table2. Where a model spans several regions over which the crop mix wouldchange (e.g. winter wheat in the south being substituted by winter beansfurther north), the cropping pattern used for analysis represents a weightedmean over the range. Because of the diversity of horticultural crops onlya few representative species were included in the models. For instance,lettuce as a proxy for all leaf vegetables, carrot as a typical root vegetable,and tomato as a processing crop.
For each model the method of water supply (gravity flow, pumped froma surface or groundwater source), and the method of distribution and on-field application were also specified. Where there were considered to betechnical alternatives with major cost or water use profitability implications-for instance, gravity versus pumped supply, or sprinkler versus furrowapplication - variants of the model were specified. Because of themarkedly greater irrigation needs in the semi-arid northeast than elsewherein Brazil, and the lower potential evapotranspiration in the south,northeastern variants with a higher irrigation volume were also specifiedfor models 2, 3, 8 and 9, and southern variants with lower volumes werespecific for models 2 and 8. In addition, because of the greater distanceof the centre west from major consumption centres and ports, variantswere made for some of these models assuming transport costs equivalentto 1000 km, instead of the 250 km assumed for all base models. Takingaccount of these variants, the eleven basic models, as defined by croppingpattern, were expanded to 34 for eventual analysis. For analysis, thefollowing were defined for each model:
- size of the irrigated farm;- annual crop areas, yields, cropping intensity and total agricultural
output;- an indication of which are winter and which are summer crops;- estimated total water requirements for each crop (Hargreaves' method);
13

- an estimate of the proportion of this total which would, depending onregion and season, need to be met by irrigation;
- off-farm water supply works, with an estimate of the total area servedby these works if, as on a public scheme, they would supply more thanone property;
- on-farm works and irrigation equipment;- on the basis of the above definitions, the estimated overall profitability
of irrigation;- hectare budgets for each crop divided between purchased inputs,
services*, other materials and hired or family labour.
For the purposes of calculation all irrigation infrastructure costs wereupdated to the present before analysis. This allowed old and new systemsto be directly compared, although at the same time it also eliminated anyadvantages which would otherwise have accrued to old systems because oftheir sunk costs. The analysis effectively examined the question, therefore,of what would be the economic profitability of a given system if builttoday, as well as used at today's levels of performance.
Using the above data the total cost of meeting water requirements wascalculated. This was done by combining amortisation of the capital costsof the system over an appropriate period7 at the prevailing opportunitycost of capital with its estimated annual operation and maintenance costs(usually a fixed annual percentage of capital cost of the infrastructurespecified). Total water cost was expressed per farm per annum, as well asper thousand cubic metres taken from the source. Crop production costswere calculated per hectare, and then per annum for the whole farm.Together, these calculations gave the annual fixed and variable costs ofirrigation, plus all other variable crop production costs. The teamabandoned attempts to include the remaining fixed elements of the annualproduction cost - amortisation of productive farm infrastructure other thanthe irrigation system, and farm management overheads. Firstly, there werevirtually no sources of information, and secondly it was felt that for mostmodels these costs would be insignificant in relation to the total of othercosts.
6 For simplicity, contract hire rates were used for all machineoperations.
7 Useful life was assumed to vary from 3 years for sprinklerheads, up to 20 years for pumps, and 50 years for dams and maincanals.
14

Examples of the forms used to tabulate the data before processing aregiven as tables 3, 4 and 5.
To produce figures comparable with the output projections generated bythe output/demand study for the rainfed sub-sector and existing irrigatedland, it was then necessary to estimate the improvements in profitabilitywhich would be obtained on new irrigated areas by 2005. To make thesecalculations it was assumed that:
- models which are, at present, relatively far from their maximumtechnical potential (assumed to be models 1, 3, 6 and 7) would increasetheir crop yields at a compound rate of 2% per year and croppingintensities at 1% per year;
- for the remaining models, all of which could be considered as alreadycloser to their maxima, increases would be limited to 1% per year and0.5% per year respectively;
- the resultant gains in gross production value would be obtained onrelatively favourable terms. Costs would rise by one dollar for everytwo dollars of gain in gross value.
The work was done at a time when Brazilian inflation was about 20% permonth. All local costs and prices were therefore converted to US dollarsat the exchange rate of the day for which they were quoted. Althoughdollars were traded in the black market at a premium of about 55%, atthe time the official conversion rate was preferred to avoid makingjudgements on the views of speculators about the future course of Brazil'scrawling peg system of exchange rate adjustment.
Capital, operation and maintenance costs of irrigation works wereconverted to economic values by applying a conversion factor of roughly0.9, to represent the removal of taxes, duties and subsidies. Mostagricultural inputs (seeds, fertilizers and pesticides) were valued at importparity prices using multi-year averages from other importing markets -mainly the USA - and recent price quotations from Brazilian importers.Unit machinery operating costs for construction of irrigation works werederived from recent Government equipment rental costs, applying separateconversion factors to capital costs, fuel and labour to bring them toeconomic values. The opportunity cost of capital was assumed to be 11%.Since there were no reliable data on regional labour markets, shadow wagerates for farm labour were calculated from real daily wages for eachregion, adjusted for assumed regional unemployment. Unemployment rateswere assumed to be 5% with 10% underemployment outside the northeast,
15

and twice these figures within the northeast. On the basis of availabledata, wages in the northeast were assumed to be 60% of those elsewhere.
Tradeable agricultural products were valued at border prices, based onimport or export parity using six-year average world prices for thecommodity concerned. Non-tradeable items - beans and horticulturalcrops - were valued at average local market prices.
The analysis was run on a standard desk-top computer using Lotus 123.The following were quantified for each model, for the present situationand 2005:
- total economic benefit generated by the model;- total economic costs of the model;- net economic benefit generated per hectare of land cropped;- net economic benefit generated per thousand m3 of water abstracted
from the source;- net economic benefit generated per man/day of labour used.
By taking account of water use for each crop within the model, it was alsopossible to derive an economic cost of production in US$ per ton for thatcommodity at present, and in 2005 under the system represented by themodel.
6 SUMMARY OF RESULTS
Table 6 shows the estimates of present and future economic profitabilityof irrigation, ranked from models with the highest ratio of net benefit tototal costs to those with the lowest ratio. The following are the keyfindings:
Basic Commodities (rice, maize, wheat, soya, beans, cotton): Present grosseconomic benefits from models growing basic commodities (rice, maize,soya, beans and cotton) are seldom greater than 1.5 times total costs (avalue of 0.5 or more for BN/CT in the tables), while the less efficientforms of irrigation at present fail to cover their costs when these arecalculated in economic terms. Under the future scenarios the mostefficient models based on these crops generate a gross benefit equivalentto about 1.75 times total costs (BN/CT = 0.75), but the three leastprofitable models (all representing colonos on public irrigation perimetersin the northeast) remain heavily in deficit.
16
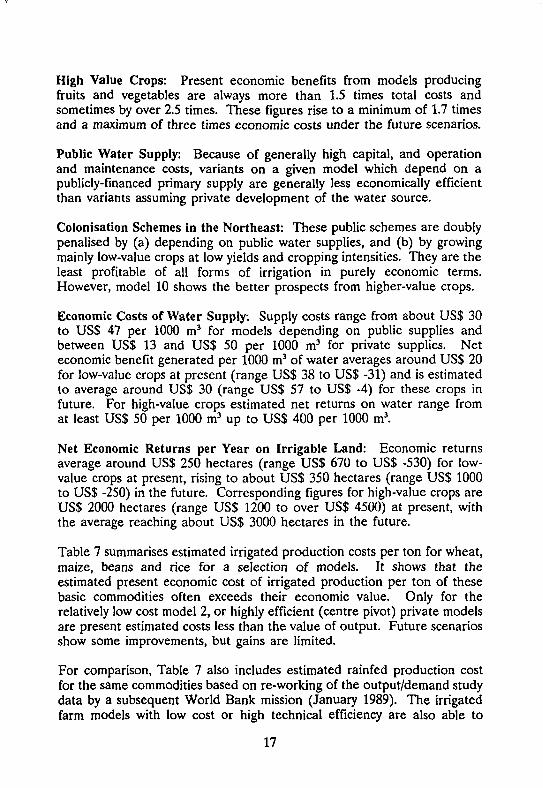
High Value Crops: Present economic benefits from models producingfruits and vegetables are always more than 1.5 times total costs andsometimes by over 2.5 times. These figures rise to a minimum of 1.7 timesand a maximum of three times economic costs under the future scenarios.
Public Water Supply: Because of generally high capital, and operationand maintenance costs, variants on a given model which depend on apublicly-financed primary supply are generally less economically efficientthan variants assuming private development of the water source.
Colonisation Schemes in the Northeast: These public schemes are doublypenalised by (a) depending on public water supplies, and (b) by growingmainly low-value crops at low yields and cropping intensities. They are theleast profitable of all forms of irrigation in purely economic terms.However, model 10 shows the better prospects from higher-value crops.
Economic Costs of Water Supply: Supply costs range from about US$ 30to US$ 47 per 1000 m3 for models depending on public supplies andbetween US$ 13 and US$ 50 per 1000 m3 for private supplies. Neteconomic benefit generated per 1000 m3 of water averages around US$ 20for low-value crops at present (range US$ 38 to US$ -31) and is estimatedto average around US$ 30 (range US$ 57 to US$ -4) for these crops infuture. For high-value crops estimated net returns on water range fromat least US$ 50 per 1000 m3 up to US$ 400 per 1000 m3.
Net Economic Returns per Year on Irrigable Land: Economic returnsaverage around US$ 250 hectares (range US$ 670 to US$ -530) for low-value crops at present, rising to about US$ 350 hectares (range US$ 1000to US$ -250) in the future. Corresponding figures for high-value crops areUS$ 2000 hectares (range US$ 1200 to over US$ 4500) at present, withthe average reaching about US$ 3000 hectares in the future.
Table 7 summarises estimated irrigated production costs per ton for wheat,maize, beans and rice for a selection of models. It shows that theestimated present economic cost of irrigated production per ton of thesebasic commodities often exceeds their economic value. Only for therelatively low cost model 2, or highly efficient (centre pivot) private modelsare present estimated costs less than the value of output. Future scenariosshow some improvements, but gains are limited.
For comparison, Table 7 also includes estimated rainfed production costfor the same commodities based on re-working of the output/demand studydata by a subsequent World Bank mission (January 1989). The irrigatedfarm models with low cost or high technical efficiency are also able to
17

produce beans and rice at economic costs per ton which are lower thanfor rainfed. For wheat and maize, however, rainfed costs are below thoseof any irrigation model. This implies that irrigation would not be thepreferred strategy to fill any future supply gaps for these two commodities.It would not, however, preclude the use of efficient irrigation for out-of-season production, or for growing seed crops of wheat or maize, in bothof which situations irrigation would bring clear technical advantages overrainfed production.
The sort of guidance which such results can give to those responsible forsectoral policy is readily appreciated. For instance they highlight:
- the need, if irrigation is to be an economically viable means ofproducing basic commoditites such as wheat, maize or cotton, toencourage only those forms of irrigation which are either cheap ortechnically efficient;
- the low probability that further investment in public irrigation in thenortheast for colonos will yield acceptable economic returns, for so longas these farmers grow only such basic commodities;
- the need, therefore, for there to be important parallel social benefitsfrom public irrigation of low-value crops by colonos in the northeast, inorder to justify the economic losses which further investments of thistype are likely to incur;
- the economic desirability of encouraging a shift in irrigated croppingpatterns from basic commoditites to high-value crops;
- the particular importance of such a shift for existing public irrigation bycolonos in the northeast, if the present drain on the economy by publicschemes is to be reversed;
- the close implied connection between expansion of the more profitableforms of irrigation and the size, location and organisation of markets forhigh-value processing or horticultural crops - which must thereforereceive close attention in future sectoral plans.
The results also provide planners with some general figures on economicvalue added from irrigation, which could be used in deciding the allocationof water resources between competing demands of agricultural and non-agricultural uses.
18

7 CONCLUSIONS: ADVANTAGES AND LIMITATIONS
The main advantage of the analysis was that it attempted to compare theeconomic profitability of all major forms of irrigation in Brazil on acommon base. Due to the past fragmentation of institutionalresponsibilities and programmes this had never previously been done. Asa result arguments on the relative merits of alternative developmentoptions - e.g. public irrigation in the northeast versus private irrigation inthe south - had previously tended to be settled on a subjective rather thanan objective basis. More rational decisions were possible subsequently, andat the time of writing seem likely to be followed up by appropriateprogrammes of technical and financial assistance.
The major limitation, as in all such modelling exercises, is that the outcomedepends on the quality of the estimates on which the calculations arebased. This is already important in determining the credibility of thenormally simple models used in ordinary project analysis. Fallibility is,unavoidably, magnified in a more complex exercise of the type describedhere. Furthermore, to formulate such an exercise, if dependent on fieldsurveys to generate all the base data, would be extremely time-consuming.The team responsible was fortunate in having had wide previous exposureto irrigation in Brazil over a number of years. It worked with high-calibrelocal counterparts and benefitted from the accumulated experience of arange of outside experts who were also assisting the Government. Localdata sources happened to cover some of the types of irrigation on whichthe team's personal experience was the most limited. A team starting asimilar exercise in another country might not have all these advantages.
Nevertheless, two positive final points can be made. Firstly, both thesetting and the range of irrigation types are likely to be less complex inmost other developing countries. Secondly, the Brazilian analysis presentedhere, which is a first run and not the culmination of a series ofapproximations or the product of any 'massaging' of the numbers, isremarkably clear cut in its indications. This leads the team to believe thatthe method of analysis used in the case of Brazil is both replicable andvalid. Indeed, similar analytical approaches have since been used by theFAO Investment Centre for irrigation reviews in Chad, Malawi andVenezuela, and have also made useful contributions to clarifying futuredevelopment options and priorities.
19

TABLE 3: BRAZIL - NATIONAL IRRIGATION SECTOR REVIEW
STUDY 2: IRRIGATION PROFITABILITYA Description of Model Farm
Model: Number: .
Situation Present
Type: Operator:
Farm physical area (hectares):
Farm irrigable area (hectares): - Total
- Developed ,
Crop/Product Area planted Average Total Gross economic value(ha/year) Yield Output (US$ '000/year)
(t/year) (t/year)
Total Total
Water Source:
Method of supply to farm:
Method of supply to field:
Method of distribution in field:
20

TABLE 4: WATER USE AND COSTS
Model: Number:
Annual Water Use
Crop, No ha Evapotranspiration Overall Efficiency Total Water Use
Farm total(m3/year)
Annual Economic Cost of Water Supply
Off-farm Area Servedworks (hectares)
Total Cost, Year Built(US$ '000)
Allocated Cost to Model(US$ '000/year)Amortisation O & M Total
Sub-total
On-farm Units Noworks
Unit Cost Total Cost(US$) (US$ '000)
Annual Cost to Model(US$ '000/yr)Amortisation O & M Total
Sub-total
Total annual economic cost of water (US$ '000/yr)
Economic cost of water per m3 (US$)
21

TABLE 5: CROP HECTARE BUDGETS (US$) continued
Labour (man day equivalents)
Quantity Economic CostF M Total Per Unit Total
land prepplantmaintainharvestpost-harvestSub-totals
total familytotal hired
Sub-total inputs
Total Variable Costs (excluding water)
Water Costs (from Section B)
Fixed Cost Allowances (footnotes)amortisation, non-irrigationfarm infrastructurefarm management
Total Economic Production Cost
22

TABLE 5: CROP HECTARE BUDGETS (US$)
Model:
Crop: ...
Inputs
seedspi materialfert 1 ....fert 2 ....fert 3 ....fest 1 ....pest 2 ....pest 3 ....pest 4 ....
Sub-total inputs
QuantityUnits No
kgnokgkgkg
Economic CostPer Unit Total
Machinery (includes driver)
animal hrtractor, heavy hrtractor, light hrharvestor hrthreshing hr
Sub-total machinery
Materials and others
e.g.
transportdrying
Sub-total materials and others23
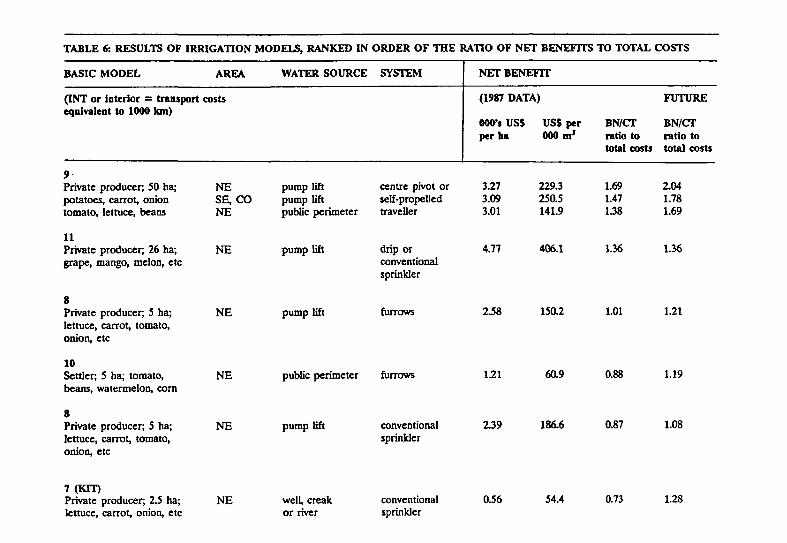
TABLE 6: RESULTS OF IRRIGATION MODELS, RANKED IN ORDER OF THE RATIO OF NET BENEFITS TO TOTAL COSTS
BASIC MODEL AREA WATER SOURCE SYSTEM NET BENEFIT
(INT or interior = transport costsequivalent to 1000 km)
(1987 DATA)
OOCs US$ US$ perper ha 000 or*
FUTURE
BN/CT BN/CTratio to ratio tototal costs total costs
Private producer; 50 ha; NEpotatoes, carrot, onion SE, COtomato, lettuce, beans NE
11Private producer, 26 ha; NEgrape, mango, melon, etc
8Private producer, 5 ha; NElettuce, carrot, tomato,onion, etc
10Settler, 5 ha; tomato, NEbeans, watermelon, corn
8Private producer; 5 ha; NElettuce, carrot, tomato,onion, etc
pump lift centre pivot orpump lift self-propelledpublic perimeter traveller
pump lift
pump lift
pump lift
drip orconventionalsprinkler
furrows
public perimeter furrows
conventionalsprinkler
3.273.093.01
229.3250.5141.9
1.691.471.38
2.041.781.69
4.77 406.1
150.2
1.21
139 186.6
1.36
1.01
60.9 0.88
0.87
1.36
1.21
1.19
1.08
7 (KIT)Private producer, 2JS ha;lettuce, carrot, onion, etc
NE well, creakor river
conventionalsprinkler
0.56 54.4 0.73 1.28

(TABLE 6: continued) (1)
8Private producer; 5 ha;lettuce, carrot, tomato,onion, etc
Private producer; 100 ha;cotton, soybeans, wheat, beans,tomato
8Private producer; 5 ha;lettuce, carrot, tomato,onion, etc
2 - InteriorPrivate producer; 12 ha;rice, corn, beans
5 • InteriorPrivate producer, 100 ha; NEcotton, soybeans, wheat,beans, tomato
(2) (3) (4) (5) (6) (7)
SE.CO
S
NE
pump lift
pump lift
pump lift
furrow
furrow
centre pivot
1.97
1.98
0.67
131.6
149.9
38.8
0.62
0.62
0.55
0.78
0.78
0.79
S pump lift
SE, CO pump lift
INT river diversionSE.CO
pump lift
( conventionalI sprinkler
furrowby gravity
centre pivot
1.8
1.8
0.29
0.64
183.2
160.8
24.4
37.2
0.54
0.54
0.54
0.53
0.7
0.7
0.75
0.77
Private producer, 100 ha;rice, corn, beans
S river diversionby gravity,
NE, INT pump lift
SE, CO river diversionby gravity
SE, CO, INT
S pump lift
'flood furrow 0.27
0.23
0.21
0.21
0.2
25.1
17.4
17J
17.6
18.6
0.5
0.39
0.38
0.34
0.33
0.71
0.61
0.57
0.39
0.53

(TABLE 6: continued) (1) (2) (3) (4) (S) (0 (7)
(2 continued) NE pump lift flood furrow 0.15 11.1 0.25 0.44
Private producer; 100 ha;cotton, soybean, com, beanstomato, wheat
SE, CO, INT pump lift ~)SE.CO J
("centre pivot 0.280.24
20.917.4
0.250.21
0.450.4
Private producer; 100 ha;cotton, soybeans, wheat,tomato, beans
NE public perimeter centre pivot 0.33 14.5 0.21 0.43
Private producer, 120 ha;rice, soybeans
Private producer, 10 ha;soybeans, beans, wheat
Settler; 5 ha;corn, beans, cotton
Settler; 10 ha;soybeans, wheat, beans
ss
NE.INTSE, CO, INTNESE.CO
NE
NE
NE
river diversionby gravity,pump lift
pump lift *J
public perimeter")
1public perimeter
f flood furrow
/ conventionalj sprinkler
furrows
conventionalsprinkler
conventionalsprinkler
0.05
-0.01
-0.11-0.13-0.16-0.18
-0.31
-0.35
-0.53
5.83
•0.62
-8.911411516.78
14.79
23.45
0.09
-0.01
-0.13-0.15-0.18-0.2
-0.33
-0.35
0.37
0.28
0.20.160.130.09
-0.02
-0.06
-30.76 -0.43 -0.17

TABLE 7: COMPARISONS OF IRRIGATED AND RAINFED PRODUCTION COSTSFOR WHEAT, MAIZE, BEANS AND RICE, 1989
Wheat Price per ton US$ 182
a. Rainfed, fully mechanised, winter crop, yield 1.7+/ha, in regions S, SE,Southern CO, production costs US$ 169 per ton.
b. Irrigated Production, in models:
(3) NE, pump lift, conventional sprinkler, private, 10 ha, (with soybean andbeans), yield 2 t/h, production costs US$ 426 per ton;
(4) SE, CO, pump lift, centre pivot, private, 100 ha, (with cotton, soybeans,maize, beans, tomatoes), yield 3 t/h, production costs US$ 207 per ton;
(5) NE, pumping from water source, centre pivot, private, 100 ha, (withcotton, soybeans, beans, tomatoes), yield 3 t/h, production costs US$ 203per ton;
Maize Price per ton US$ 140
a. Rainfed, fully mechanised, in regions S, SE, CO, yield 3.1 t/ha, productioncosts US$ 85 per ton.
b. Irrigated production, in models:
(2) SE, CO, river diversion by gravity, flood furrow irrigation, private, 12 ha(with rice, beans), yield 3.5 t/ha, production costs USS 117 per ton.
(6) NE, public perimeter, conventional sprinkler, private, 6 ha, (with beansand cotton), yield 4.0 t/ha, production costs US$ 183 per ton.
Beans Price per ton US$ 485
Rainfed:
(i) S, SE, CO, part-mechanised, yield 0.85 t/h, production costs US$ 427 perton.
(ii) NE, animal traction, fertiliser, yield 0.65 t/h, production costs US$ 419per ton.V 27

(TABLE 7: continued)
Irrigated production, in models:
(2) SE, CO, river diversion by gravity, flood furrow, private, 12 ha (with rice,corn), yield 1.6 t/h, production costs US$ 306 per ton.
(4) SE, CO, pump lift, centre pivot, private, 100 ha, (with cotton, soybeans,corn, tomatoes, wheat), yield 1.6 t/h, production costs US$ 430 per ton.
(3) NE, pump lift, conventional sprinkler, public perimeter, settler, 10 ha,(with soybeans, wheat), yield 1.2 t/h, production costs US$ 654 per ton.
(5) NE, pump lift, centre pivot, private, 100 ha, (with cotton, soyabeans,wheat, tomatoes), yield 1.6 t/h, production costs US$ 389 per ton.
(6) NE, public perimeter, conventional sprinkler, settler, 5 ha, (with corn,cotton), yield 1.0 t/h, production costs US$ 750 per ton.
Rice Price per ton US$ 127
Rainfed upland rice, Amazon fringes, favourable rainfall, yield 1.65 t/ha,production costs US$ 101 per ton.
Irrigated production, in models:
(2) SE, CO, river diversion by gravity, flood furrow, private, 12 ha, (withcorn, beans), yield 5 t/ha, production costs US$ 92 per ton.
(1) S, river diversion by gravity, flood furrow, private, 120 ha, (with soybean),yield 5 t/ha, production costs US$ 125 per ton.
28