refractoriness accounts for variable spike burst...
TRANSCRIPT

Sensory and Motor Systems
Refractoriness Accounts for Variable Spike BurstResponses in Somatosensory CortexBartosz Tele �nczuk,1 Richard Kempter,2 Gabriel Curio,3 and Alain Destexhe1
DOI:http://dx.doi.org/10.1523/ENEURO.0173-17.2017
1Unité de Neurosciences Information et Complexité, Centre National de la Recherche Scientifique, Gif-sur-Yvette91198, France, 2Institute für Theoretische Biologie, Humboldt Universität zu Berlin, Berlin 10115, Germany, and3Department of Neurology, Universitätsmedizin Charité, Berlin 12203, Germany
AbstractNeurons in the primary somatosensory cortex (S1) respond to peripheral stimulation with synchronized bursts ofspikes, which lock to the macroscopic 600-Hz EEG waves. The mechanism of burst generation and synchroni-zation in S1 is not yet understood. Using models of single-neuron responses fitted to unit recordings frommacaque monkeys, we show that these synchronized bursts are the consequence of correlated synaptic inputscombined with a refractory mechanism. In the presence of noise these models reproduce also the observedtrial-to-trial response variability, where individual bursts represent one of many stereotypical temporal spikepatterns. When additional slower and global excitability fluctuations are introduced the single-neuron spikepatterns are correlated with the population activity, as demonstrated in experimental data. The underlyingbiophysical mechanism of S1 responses involves thalamic inputs arriving through depressing synapses to corticalneurons in a high-conductance state. Our findings show that a simple feedforward processing of peripheral inputscould give rise to neuronal responses with nontrivial temporal and population statistics. We conclude that neuralsystems could use refractoriness to encode variable cortical states into stereotypical short-term spike patternsamenable to processing at neuronal time scales (tens of milliseconds).
Key words: burst; EEG; modelling; spike patterns
IntroductionNeurons usually generate highly variable responses to
repeated presentations of the same stimulus. This vari-
ability might originate from thermal noise in ion channels(Chow and White, 1996; Schneidman et al., 1998), recur-rent activity in the network (van Vreeswijk and Sompolin-
Received May 17, 2017; accepted June 28, 2017; First published August 14,2017.The authors declare no competing financial interests.Author contributions: B.T., R.K., G.C., and A.D. designed research; B.T.,
R.K., G.C., and A.D. performed research; B.T. analyzed data. B.T., R.K., G.C.,and A.D. wrote the paper.
This work was partially funded by the Centre de la Recherche Scientifique(CNRS, France), European Community Future and Emerging Technologiesprogram (Human Brain Project FP7-604102, H2020-720270), and Bundesmin-isteriums für Bildung und Forschung (Grants BCCN-B1, 01GQ1001A, and01GQ0972).
Acknowledgements: We thank Jan Antolik and Andreas Herz for critical
Significance Statement
Neurons in the hand area of the primary somatosensory cortex respond to repeated presentation of thesame stimulus with variable sequences of spikes, which can be grouped into distinct temporal spikepatterns. In a simplified model, we show that such spike patterns are product of synaptic inputs and intrinsicneural properties. This model can reproduce both single-neuron and population responses only when aprivate variability in each neuron is combined with a multiplicative gain shared over whole population, whichfluctuates over trials and might represent the dynamical state of the early stages of sensory processing. Thisphenomenon exemplifies a general mechanism of transforming the ensemble cortical states into precisetemporal spike patterns at the level of single neurons.
New Research
July/August 2017, 4(4) e0173-17.2017 1–17

sky, 1996; Destexhe et al., 2003) or modulation ofneuronal excitability (Destexhe et al., 2001; Faisal et al.,2008; Fontanini and Katz, 2008). Over recent years, manyresults have shown that a significant fraction of this variabil-ity is shared across large populations of neurons. Theseshared fluctuations were attributed to the variations of in-coming stimuli and modulation of excitability (Shadlen andNewsome, 1998; Brody, 1999; Ecker et al., 2014; Goris et al.,2014). However, most of these studies focused on spike-rate variations over long time scales, neglecting millisecond-range spike timing differences. Such short time scales mightbe especially important for neurons that fire brief bursts ofspikes at a frequency reaching several hundred spikes persecond separated by much longer intervals of silences(Evarts, 1964; Llinás and Jahnsen, 1982; Krahe and Gabbi-ani, 2004). Since the transitions between bursting and tonicfiring characterized by longer interspike intervals are dynam-ically controlled (Swadlow and Gusev, 2001) both timescales might be relevant for neuronal processing.
Neurons in somatosensory cortices can encode their sen-sory inputs in the precise lengths (�10 ms) of interspikeintervals (Panzeri et al., 2001; Estebanez et al., 2012; Withamand Baker, 2015), which suggests that high firing precision isimportant for the reliability of stimulus encoding. In the pri-mary somatosensory cortex (S1) of macaque, single neu-rons respond to peripheral stimulation with barrages ofspikes elicited at sub-millisecond precision (Baker et al.,2003; Fig. 2). However, when presented repetitively, thesame stimulus produces variable responses in terms of thenumber of elicited spikes and the lengths of interspike inter-vals, which might limit the amount of information they cancarry. It is, however, possible that such trial-to-trial variabilityrepresents an alternation between several classes of reliableresponses, called spike patterns (Toups et al., 2012). Suchspike patterns have been indeed observed in S1 (Telenczuket al., 2011), but neither the mechanism of their generationnor their functional significance has been identified.
Here, we propose a mechanism that explains the pre-cise patterns of single-neuron responses as an interplaybetween synaptic inputs and intrinsic refractory proper-ties of the neuron (Berry and Meister, 1998; Czanner et al.,2015). To test this hypothesis, we develop simple modelscapturing the two processes, and we are able to fit theparameters of the models to extracellular recordings ofsingle-unit activity in the somatosensory cortex.
MethodsExperimental methods
Neuronal responses were evoked in the hand represen-tation of the S1 of two awake Maccaca mulatta femalemonkeys by electrical median nerve stimulation at thewrist (pulse width: 0.2 ms; repetition rate: 3 Hz; intensity:
150% motor threshold; see also Fig. 1A). Single-unit ac-tivity was recorded extracellularly using a 16-channel Eck-horn drive (Thomas Recording GmbH; Eckhorn andThomas, 1993). Each of the platinum/glass electrodes(electrode impedance: 1 M�) was advanced into cortex(area 3b) until well-isolated neurons were found with oneof the electrodes. The receptive fields of the neurons weretested by means of manual tapping using a stylus.
In addition, we recorded EEG signals from the surfaceof the dura (epidural EEG) with two electrodes placed inthe vicinity of the micro-electrode array. The signals werethen high-pass filtered (�400 Hz) to obtain the high-frequency EEG (hf-EEG).
All experimental procedures were performed accordingto Home Office UK (Scientific Procedures) Act 1986 reg-ulations and institutional ethical guidelines.
Spike sortingFrom the extracellular recording we obtained spike wave-
forms that were first bandpass filtered (1–10 kHz) and thensampled with a frequency of 20 kHz. Action potentials ofneurons surrounding the microelectrode were detected inthe extracellular recordings by means of amplitude thresh-olding; the threshold was chosen manually to detect spikeswhose amplitude was significantly above noise level. Thewave shapes of the detected action potentials were param-etrized by their amplitude, width and projection coefficientson two main principal components. The spike timings ofsingle units were determined based on these shape featuresusing a manual cluster cutting method that allowed for iden-tification of clusters of arbitrary shapes (Lewicki, 1998;Hazan et al., 2006). To ensure correct clustering the proce-dure was performed by two operators and then checked forconsistency.
To validate the spike discrimination, we checked the ex-tracellular action potentials generated by a putative singleneuron for the consistency of the wave shape and ampli-tude. Additionally, we searched for interspike intervals (ISIs)shorter than 1 ms; if such short intervals were found theclustering procedure was repeated. Spike trains with evi-dence of poor spike sorting (inconsistent wave shapes orISIs � 1 ms) were excluded from subsequent analyses.
Spike pattern classificationFrom 46 neurons identified in the two monkeys, we
selected 17 neurons that responded with bursts of spikes.Bursting neurons were defined by responses with morethan one spike for at least 4% of stimuli and a mode of theISI histogram shorter than 1.8 ms (Baker et al., 2003).
Among these 17 neurons we identified neurons thatalso fired spontaneous bursts by counting the number ofISIs in the poststimulus period (�30 ms after the stimulus)that were shorter than 1.8 ms. In this time window, theinitial response dies out and baseline firing rate is re-established. Neurons that fired at least 10% of bursts inthis window were labeled as spontaneous bursters.
In each neuron we summed spikes over all trials, andwe identified prominent peaks in the obtained poststimu-lus time histograms (PSTH; bin width 0.2 ms; Fig. 3A). Asthe within-burst spike composition varied from trial to trial,each trial was described with a binary string whose entries
remarks on earlier version of this paper.Correspondence should be addressed to Bartosz Tele �nczuk at the above
address, E-mail: [email protected]:http://dx.doi.org/10.1523/ENEURO.0173-17.2017
Copyright © 2017 Telenczuk et al.This is an open-access article distributed under the terms of the CreativeCommons Attribution 4.0 International license, which permits unrestricted use,distribution and reproduction in any medium provided that the original work isproperly attributed.
New Research 2 of 17
July/August 2017, 4(4) e0173-17.2017 eNeuro.org

(one or zero) represented the occurrence or nonoccur-rence of a spike in a sequence of bins bracketing themajor peaks of the overall PSTH: the borders between thebins were placed manually in the troughs of the PSTH(Fig. 3A,B, vertical lines). Each binary string correspondedto one spike pattern; the length of the string equalled thetotal number of peaks in the PSTH.
In addition, we averaged the concomitant hf-EEG re-sponses over trials concurring to each of the identifiedspike patterns of a single neuron.
Spike-train probability model (STPM)To reproduce the distribution of emitted spikes in a
single neuron, we chose a minimal model (STPM) thatcould replicate the observed high variability in the corticalresponses (Softky and Koch, 1993; Destexhe et al., 2001)and manifest refractoriness (decreased probability ofspiking for some time after producing a spike).
We assumed that a spike emission is a random pointprocess with the probability
p(spike in interval [t, t � dt])�{ti} � ��t�{ti}�dt , (1)
where �ti� denotes the spiking history earlier than time t,and ��t��ti�� is the conditional intensity.
The conditional intensity ��t��ti�� is assumed to have aMarkov property, i.e., it is conditioned only on the time tlast
of occurrence of the last spike at time: ��t��ti�� � ��t, tlast�. A further assumption is that the firing-rate modu-lation and refractory effects are multiplicative, thus re-flecting the reduction of spike probability due to, forexample, inactivation of sodium channels or hyperpolar-ization caused by opening of potassium channels (Berryand Meister, 1998):
�(t�tlast) � q(t)w(�t) , (2)
where q(t) is the intensity function, w(�t) is the recoveryfunction, and �t � t � tlast is the time interval since the lastspike.
Figure 1. Modeling responses to median nerves stimulation of neurons recorded in S1 of macaque monkeys. A, Sketch of theexperimental paradigm. B, Raster plot of 60-sample responses of a single neuron (top) and the PSTH calculated from all 956 trials(bottom; sbt, spikes per bin per trial, bin size 0.2 ms). C, Simulation of the STPM with sample parameters: exponentially decayingintensity function (left, red line) and recovery function implementing an absolute refractory period of �ref � 1.2 ms (right). The simulatedPSTH (left, black line) contains characteristic peaks separated by intervals �tpeak approximately equal to �ref (left, thin vertical blacklines). Note the similarity to the PSTH calculated from spikes of cortical neurons triggered by the median nerve stimulation (comparewith B, bottom panel).
New Research 3 of 17
July/August 2017, 4(4) e0173-17.2017 eNeuro.org

The parameters of the model, the intensity function q(t)and the recovery function w(�t), are defined on a per-binbasis, and they are fitted to experimental data by meansof a maximum likelihood approach. To capture fine tem-poral details of the neuronal responses (for example, re-sponse onset and ISIs) the intensity and recoveryfunctions were defined with a short sampling interval (0.05ms). The log-likelihood function L�q;w��ti�� is obtained bylog-transforming the probability function of an inhomoge-neous Poisson process with the above conditional inten-sity (2; Johnson and Swami, 1983; Dayan and Abbott,2001):
L(q ;w��ti�) � � �0
T
q(t)w(t � tlast)dt
� �i
ln [q(ti)w(ti � tlast)] . (3)
where T is the duration of response (T � 30 ms), i is thespike index, and ti denotes the times of occurrence ofrecorded spikes. The likelihood L of obtaining the exper-imental spike train ti is maximized with respect to theparameters q(t) and w(�t) by means of an iterativeexpectation-maximization (EM) algorithm, which guaran-tees that the global maximum is reached (Miller, 1985). Inaddition, we ensure that after 5 ms the model neuronrecovers from refractoriness by setting the recovery func-tion to unity for long intervals, i.e., we require w(�t � 5 ms) �1 (Fig. 2A).
To study the effects of refractoriness on the modeledresponses, we compared the results to the STPM withoutrefractory period (nonrefractory STPM, w(�t) � 1 for all �t� 0). The model is fully characterized by its intensityfunction q(t), which can be estimated directly from theexperimental PSTH (bin width set to 0.05 ms to allow forsufficient temporal precision).
Generalized linear model (GLM)One limitation of the STPM is that the history effects are
restricted to the last spike only. To evaluate effectsevoked beyond the last spike, we considered the GLM(Truccolo et al., 2005; Czanner et al., 2015) with condi-tional intensity �GLM�t��ti�� of the form
�GLM(t | {ti}) � exp�s(t) � �i
h(t � ti) (4)
where s(t) is the driving force and h(�) is the spike historykernel.
Note that the intensity function q(t) of the STPM can beidentified with exp �s�t��, and the recovery function w(�t)corresponds to exp� �
ih�t � ti��. In contrast to the STPM,
in the GLM the effects of the previous spikes can extendinfinitely back in time. In practice, we reduce the numberof free parameters of the GLM by restricting the historyhorizon above which the spikes cannot contribute to theresponses anymore; we thus set h�t tmax� � 1. Thehorizon tmax � 8 ms was selected to maximize the AkaikeInformation Criterion (AIC), which balances the goodness
of fit with the number of free parameters of the model (Fig.2C).
The likelihood of the GLM is defined analogously to theSTPM:
L(s ; h | {ti}) � � �0
T
�GLM(t | {ti t})dt
� �i
ln �GLM(ti | {ti t}) (5)
�� �0
T
exp�s(t) � �i
h(t � ti)dt
� �j
�s(tj) � �i
h(tj � ti) (6)
where the sums go over all spikes.Since the log-likelihood function is a convex function of
the parameters, they can be found using standard opti-mization techniques. In the results presented here weused the conjugate gradient optimization.
We compared the goodness-of-fit of the STPM and theGLM using the time-wrapping method (Brown et al.,2002): The ISIs in the experimental data were rescaled toaccount for temporal variations in firing probability. If themodel perfectly reproduced the data the distribution ofthe rescaled ISIs would be uniform (Fig. 2E, diagonal).
Model validationTo validate the model, the dataset was divided into two
nonoverlapping subsets of equal size: a training and avalidation set. The trials for each set were selected ran-domly from all stimulation repetitions. The parameters ofthe model were fitted to the training set. Based on theseparameters 1000 spike trains were simulated. Thegoodness-of-fit was evaluated separately for two statis-tics X, that is, the PSTH (with bin size 0.2 ms) and thespike pattern distribution. For each of the two statistics,the model error was evaluated as the normalised differ-ences between the simulated Xmodel and validations spiketrains Xvalidate (cf. Rauch et al., 2003):
Err(Xmodel, Xvalidate) � �i�1
N �Ximodel � Xi
validate�2
Xivalidate
, (7)
where X � Xi�lN is either the PSTH or the spike pattern
distribution of model (Xmodel) or validation (Xvalidate) set; Nis the size of the vector and equals the number of bins(N � 70 for T � 14 ms and 0.2-ms bins) or the number ofidentified spike patterns (N � 16 for binary words oflength less or equal to 4).
The model error Err�Xmodel, Xvalidate� was comparedagainst the error between the training and validation setsErr�Xtrain, Xvalidate� (reference error). The significance of thedifference between the model and reference errors wasquantified by means of the F test with (N– 1,N– 1) degreesof freedom (Barlow, 1989) where
F � Err(Xmodel, Xvalidate)/Err(Xtrain, Xvalidate) . (8)
New Research 4 of 17
July/August 2017, 4(4) e0173-17.2017 eNeuro.org

Serial correlationsFrom the responses of single neurons we identified
spike triplets defined as three consecutive spikes sepa-
rated by intervals shorter than 4 ms. In this analysis, toincrease the number of intervals, we broadened the anal-ysis window to 50 ms after the stimulus. Next, we calcu-
A B
C D
E F
Figure 2. Models with refractoriness can reproduce the experimental spike trains. A, Intensity function (left) and recovery (right) functionsof the STPM fitted to experimental data (an example for a single neuron). B, Comparison of PSTHs of the training data (top, dark blue line),validation data (light blue line), and model data (red line). Note the overlap between the lines, which is a sign of the match between the modeland both the training and validation sets. The difference between the model PSTH from the validation PSTH (model residuals, bottom) isequivalent to the intrinsic variation between the training and validation set (F � 1.02, p � 0.01, see Methods for definition). C, Fitted intensity(left) and recovery functions (right) of the GLM (bin size, 0.25 ms). D, Correlation coefficients between the residuals (for the STPM shownin B, bottom panel) and the validation PSTH (for the STPM shown light blue in B) calculated for three different models: the STPM, the STPMwithout refractoriness (non-refr. STPM), and the GLM. Box plots represent the distribution of bootstrapped correlation coefficients:boxes - quartiles, notch - median with confidence intervals, whiskers - range. The horizontal dashed line denotes the correlation coefficientbetween the difference of PSTH of validation and training dataset with the training dataset PSTH. E, The empirical cumulative distributionof the ISIs of the experimental spike trains rescaled according to the conditional intensity function of all three fitted models (time-wrappingtest). If the model perfectly reproduced the experimental ISIs the cumulative distribution should line up with the diagonal. This procedurewas repeated for two different bin sizes (0.05 ms, left; and 0.25 ms, right). F, The Kolmogorov-Smirnov (K-S) distance of the model(maximum divergence of the model’s cumulative distribution from diagonal in E) decreased with an increasing bin size in both STPM andGLM. This dependence on bin size was less pronounced for the GLM.
New Research 5 of 17
July/August 2017, 4(4) e0173-17.2017 eNeuro.org

lated Pearson’s correlation between the ISIs of the firstand the second spike and the second and the third spikein the triplet (rdata). We compared the estimated rdata to thecorrelation coefficient calculated from surrogate data(rmodel) for the same number of trials, which were gener-ated by the STPM model with parameters fitted to theexperimental spike trains. The significance of the differ-ences between correlation coefficients found in simulatedand experimental ISIs was evaluated by means of a boot-strap test. To this end, 1000 estimates of rmodel wereobtained from independently simulated datasets, and theresulting coefficients were compared to rdata. The p valuewas taken as the smaller of two values multiplied by 2: (1)the fraction of bootstrap trials for which rmodel was greaterthan rdata; or (2) the fraction of bootstrap trails for whichrmodel was smaller than rdata (two-sided bootstrap test).
Population modelTo model the relation between spike patterns of a single
neuron and the response of the population, we extendedthe STPM to a population of uncoupled neurons receivingcommon inputs.
The population response was calculated from a simu-lated ensemble of 5000 identical neurons. The parametersof the STPM were fitted to the responses of the analyzedneuron, and these parameters were shared by all 5000model neurons. In each trial j the intensity function of allneurons was modulated by a multiplicative gain factor Gj
that was drawn from a uniform distribution on the interval1 � �, 1 � ��, where 0 � � � 1 is the strength ofmodulation. The intensity function in trial j was then qj(t) �Gjq(t). From the obtained single-trial single-neuron re-sponses the total population response was calculated bysumming the binned spike responses of all neurons (binsize 0.2 ms) and subsequent bandpass filtering (400-1200Hz) corresponding to the analysis of EEG data.
Next, we randomly selected a single neuron from thepopulation and used its spikes for further analysis. Weclassified the spike patterns of this neuron in single trialsbased on the occurrence/omission of spikes in a discretesequence of spiking �windows�. The bandpass filteredpopulation response was then averaged over trials withrespect to the type of concomitant spike pattern. Thisprocedure, when applied to the model, reproduced theanalysis that was applied to the experimental data anddescribed above (see below, Spike pattern classification).The root mean square (RMS) amplitude of the pattern-specific average was compared with the experimentally-obtained hf-EEG related to the same spike pattern(Telenczuk et al., 2011). The similarity of the values acrossdifferent spike patterns was quantified by means of Pear-son’s correlation coefficient.
Biophysical modelTo understand the mechanisms of burst generation, we
developed a simplified single-neuron model. The modelconsists of a linear neuron with a spiking threshold (leakyintegrate-and-fire, LIF), which receives conductance-based inputs through depressing synapses (short-termsynaptic depression). The membrane potential in themodel follows the standard membrane equation:
CmdVdt
� �gL(V � Vrest) � Isyn (9)
where Cm is the membrane capacitance, gL is the leakconductance, Vrest is the resting potential, and Isyn are thesynaptic currents. When the membrane potential reachesthe threshold Vthr a spike is generated and the potential isreset to Vreset putting the cell into a hyperpolarized state.The total synaptic current in the leaky integrate-and-fire(LIF) neuron is a sum of intracortical and thalamocorticalcurrents: Isyn�t� � ICortex�t� � ITh�t�.
The cortical synaptic currents are conductance-basedinputs from ninh inhibitory and nexc excitatory neurons. Theexcitatory gexc and inhibitory ginh synaptic conductanceare a sum of contributions mediated by each spike, suchthat gexc/inh�t� � �
texc/inh
g�t � texc/inh�. The times of the excit-
atory texc and inhibitory tinh synaptic inputs are drawn froma homogeneous Poisson process with equal rates forexcitatory and inhibitory inputs fexc � finh. Each spikeresults in a transient increase of the synaptic conductancewith an exponential time course:
g(t � tsp) � wexp� t � tsp
� (10)
for t tsp and 0 otherwise. Here tsp is the time of thespike, w is the synaptic weight and � is the synaptic timeconstant. The reversal potentials for excitation and inhi-bition are Eexc and Iinh, respectively. With these definitionsthe total current of cortical synapses is:
ICortex � gexc(t)(V � Eexc) � ginh(t)(V � Einh) (11)
In addition to the intracortical inputs, the neuron re-ceives excitation from nTh thalamocortical excitatory neu-rons. The thalamocortical neurons are silent in absence ofperipheral stimulation and generate Poisson-distributedspikes 7.68 ms after the onset of the median nerve stim-ulus (the delay takes account of the propagation delaysfrom periphery to the cortex). The strength of thalamocor-tical excitatory synapses providing the feedforward inputsto the model decays with the presynaptic activity follow-ing the short-term synaptic depression mechanism (Tso-dyks and Markram, 1997):
ICortex � gexc(t)(V � Eexc) � ginh(t)(V � Einh) (12)
dyi
dt� �
yi
�1� U(1 � yi � zi)�(t � tsp) (13)
dzi
dt�
yi
�1�
zi
�rec(14)
where yi and zi are fractions of synpatic resources inactive and inactive states, �1 is the decay constant ofsynaptic conductance, �rec is the recovery time from syn-aptic depression and U describes the fraction of availableresources used by each presynpatic spike.
The postsynaptic current due to the thalamocorticalinputs is then:
New Research 6 of 17
July/August 2017, 4(4) e0173-17.2017 eNeuro.org
ITh � GTh(t)(V � Eexc) , (15)
where the total conductance due to thalamic inputs isgiven by:
GTh(t) � �i�1
nTh
yi(t)gTh,i (16)
gTh,i stands for conductance of a single synapse and yi itsefficiency.
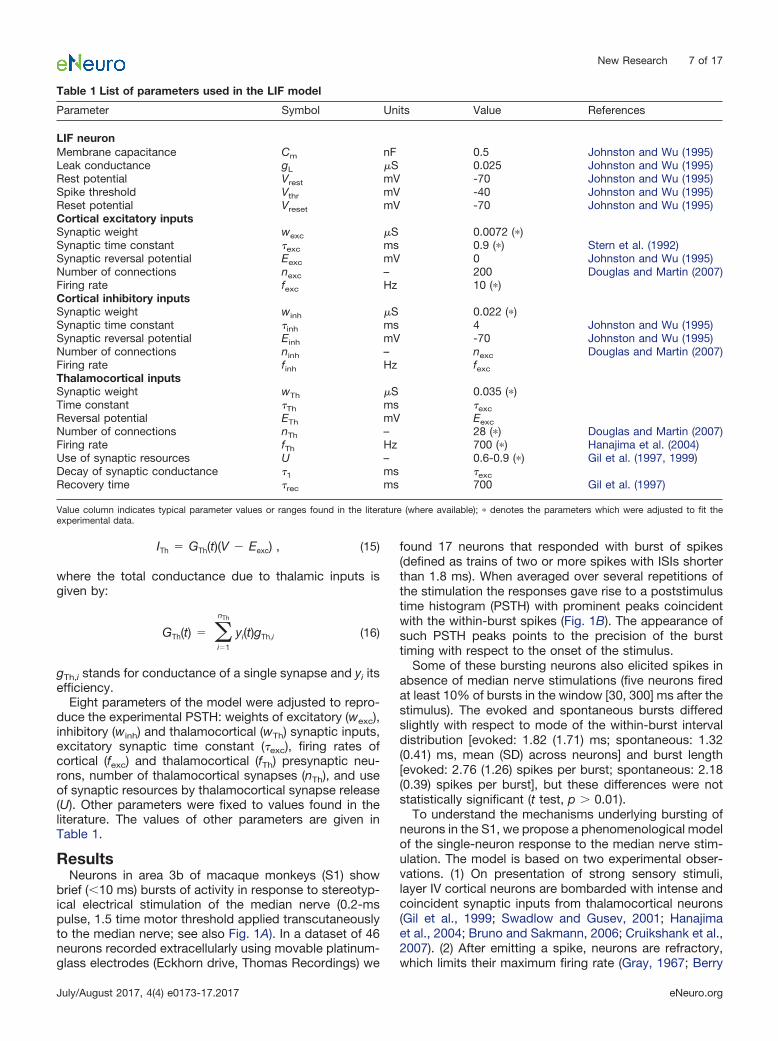
Eight parameters of the model were adjusted to repro-duce the experimental PSTH: weights of excitatory (wexc),inhibitory (winh) and thalamocortical (wTh) synaptic inputs,excitatory synaptic time constant (�exc), firing rates ofcortical (fexc) and thalamocortical (fTh) presynaptic neu-rons, number of thalamocortical synapses (nTh), and useof synaptic resources by thalamocortical synapse release(U). Other parameters were fixed to values found in theliterature. The values of other parameters are given inTable 1.
ResultsNeurons in area 3b of macaque monkeys (S1) show
brief (�10 ms) bursts of activity in response to stereotyp-ical electrical stimulation of the median nerve (0.2-mspulse, 1.5 time motor threshold applied transcutaneouslyto the median nerve; see also Fig. 1A). In a dataset of 46neurons recorded extracellularly using movable platinum-glass electrodes (Eckhorn drive, Thomas Recordings) we
found 17 neurons that responded with burst of spikes(defined as trains of two or more spikes with ISIs shorterthan 1.8 ms). When averaged over several repetitions ofthe stimulation the responses gave rise to a poststimulustime histogram (PSTH) with prominent peaks coincidentwith the within-burst spikes (Fig. 1B). The appearance ofsuch PSTH peaks points to the precision of the bursttiming with respect to the onset of the stimulus.
Some of these bursting neurons also elicited spikes inabsence of median nerve stimulations (five neurons firedat least 10% of bursts in the window [30, 300] ms after thestimulus). The evoked and spontaneous bursts differedslightly with respect to mode of the within-burst intervaldistribution [evoked: 1.82 (1.71) ms; spontaneous: 1.32(0.41) ms, mean (SD) across neurons] and burst length[evoked: 2.76 (1.26) spikes per burst; spontaneous: 2.18(0.39) spikes per burst], but these differences were notstatistically significant (t test, p � 0.01).
To understand the mechanisms underlying bursting ofneurons in the S1, we propose a phenomenological modelof the single-neuron response to the median nerve stim-ulation. The model is based on two experimental obser-vations. (1) On presentation of strong sensory stimuli,layer IV cortical neurons are bombarded with intense andcoincident synaptic inputs from thalamocortical neurons(Gil et al., 1999; Swadlow and Gusev, 2001; Hanajimaet al., 2004; Bruno and Sakmann, 2006; Cruikshank et al.,2007). (2) After emitting a spike, neurons are refractory,which limits their maximum firing rate (Gray, 1967; Berry
Table 1 List of parameters used in the LIF model
Parameter Symbol Units Value References
LIF neuronMembrane capacitance Cm nF 0.5 Johnston and Wu (1995)Leak conductance gL �S 0.025 Johnston and Wu (1995)Rest potential Vrest mV -70 Johnston and Wu (1995)Spike threshold Vthr mV -40 Johnston and Wu (1995)Reset potential Vreset mV -70 Johnston and Wu (1995)Cortical excitatory inputsSynaptic weight wexc �S 0.0072 (�)Synaptic time constant �exc ms 0.9 (�) Stern et al. (1992)Synaptic reversal potential Eexc mV 0 Johnston and Wu (1995)Number of connections nexc – 200 Douglas and Martin (2007)Firing rate fexc Hz 10 (�)Cortical inhibitory inputsSynaptic weight winh �S 0.022 (�)Synaptic time constant �inh ms 4 Johnston and Wu (1995)Synaptic reversal potential Einh mV -70 Johnston and Wu (1995)Number of connections ninh – nexc Douglas and Martin (2007)Firing rate finh Hz fexcThalamocortical inputsSynaptic weight wTh �S 0.035 (�)Time constant �Th ms �excReversal potential ETh mV EexcNumber of connections nTh – 28 (�) Douglas and Martin (2007)Firing rate fTh Hz 700 (�) Hanajima et al. (2004)Use of synaptic resources U – 0.6-0.9 (�) Gil et al. (1997, 1999)Decay of synaptic conductance �1 ms �excRecovery time �rec ms 700 Gil et al. (1997)
Value column indicates typical parameter values or ranges found in the literature (where available); � denotes the parameters which were adjusted to fit theexperimental data.
New Research 7 of 17
July/August 2017, 4(4) e0173-17.2017 eNeuro.org

and Meister, 1998; Kara et al., 2000). To illustrate theeffects of these two phenomena on neuronal responses,we simulated a probabilistic model (the STPM; see Meth-ods) with an exponentially decaying intensity function andan absolute refractory period �ref � 1.2 ms (Fig. 1C). ThePSTH of the simulated spike responses qualitatively re-produces main features of the PSTH obtained from ex-perimental data. Specifically, the absolute refractoryperiod leads to an appearance of multiple peaks in thePSTH (three peaks visible in Figure 1C: at 6, 7.8, and 9.5ms after the stimulus) separated by deep troughs corre-sponding to periods of quiescence during which the neu-ron is refractory. The presence of such peaks and troughsin the trial-averaged PSTH is possible because the re-sponses of the neuron are reliable across trials. The firstpeak of the PSTH reflects the initial spike triggered by thesharp transient of the intensity function (Fig. 1C, red line).This initial response is highly reliable, giving rise to thenarrowest and tallest PSTH peak (half-amplitude width:0.75 ms; peak-to-trough amplitude: 1773 spikes/s in Fig.1C, black line). The refractory state following the firstspike leads to a pronounced decrease of firing probabilityand gives rise to the deep PSTH trough following the initialPSTH peak. The subsequent PSTH peaks become widerand are of smaller amplitude due to the gradual decay ofthe intensity function (second peak: 1.25 ms, 1002spikes/s; third peak: 1.25 ms, 290 spikes/s). The PSTHobtained from this simulation is qualitatively similar tocortical burst responses triggered by peripheral nervestimulation (compare Figure 1C, left, with B, bottom).
Refractoriness explains the intraburst intervalsWe demonstrated that the STPM with a decaying inten-
sity function and an absolute refractory period can pro-duce a PSTH that agrees qualitatively with the responsesof neurons in S1 of macaques. To test whether the STPMcan also quantitatively reproduce the fine details of neu-ronal responses recorded in vivo, we inferred the intensityand recovery functions directly from the data. The twofunctions were defined on per-bin basis and were treatedas the free parameters of the model. These parameterswere then fitted to the experimental spike trains using aconvex optimisation technique guaranteeing the identifi-cation of the most optimal model (see Methods; Fig. 2A).
The fitted intensity function peaks shortly after the stim-ulus onset (�10 ms) and decays back to baseline whenthe burst is terminated (Fig. 2A, left). The intensity functionstill contains three distinct peaks, but they are less prom-inent compared to the peaks in the PSTH (Fig. 1B). Thissmoothing can be attributed to the decoupling of synapticinputs, which are represented by the intensity function,from the refractoriness, which is represented by the re-covery function (Fig. 2A, right). Although the maximum ofthe intensity function is much above the rate at whichindividual neurons can fire spikes, the refractoriness limitsthe firing rate of the model neuron. In agreement with theproperties of biological neurons, the fitted recovery func-tion is equal to 0 for the first 1 ms after emitting a spike(absolute refractory period), but after a few millisecondsfully recovers from the refractoriness returning to the rest
state (w(t) 1). Interestingly, immediately after the abso-lute refractory period the recovery function over-shootsfor 1 ms, largely exceeding the rest value. The fast (��1ms) fluctuations following this over-shoot represent sta-tistical noise due to the finite size of the data set. Alto-gether, the parameters of the STPM disentangle thesynaptic inputs from the refractory effects.
The STPM provides a parsimonious description ofbursting in S1 cortex
The simulated peristimulus time histogram (Fig. 2B, redline) matches closely the one obtained from the experi-mental data (Fig. 2B, dark blue line). To demonstrate thatthis good match is not a result of an over-fitting, weperformed cross-validation. First, the data set was di-vided randomly into two subsets: training data and vali-dation data. The model was fitted only to the first subset,and then the results of the simulation were validated onthe second (Fig. 2B, light blue line). We found that thedifference of the fitted PSTH from the validation set was ofthe same magnitude as the variation within the dataset(see Methods; F test, p � 0.01). This test indicated thatthe model optimally captured the features of both trainingand validation set without considerable over-fitting.
The parameters of the model were fitted to each of the17 neurons yielding similar results. Importantly, an appli-cation of the cross-validation procedure revealed that in12 out of the 17 neurons the PSTH simulated with themodel was not significantly different from the PSTH cal-culated from the recorded spike trains (F � 0.65–1.59,p � 0.01). In the remaining five neurons the modeledPSTH deviated significantly from the validation PSTH (F �2.33–4.88, p � 0.01, F test). This sub-population of neu-rons may have differing firing properties that would needmore sophisticated models (implementing, for example,bursting mechanisms; see Discussion).
To further analyze the cases in which the simulatedspike trains differed from the data, we subtracted themodel PSTH from the validation data PSTH (Fig. 2B,bottom). The resulting residuals still contained fluctua-tions aligned to the peaks of the PSTH. This indicated thatthe model does not fully capture the shape of the PSTH.Indeed, the correlation coefficient between the residualsand the PSTH of the validation set was significantly pos-itive (bootstrapped 95% confidence intervals; Fig. 2D)meaning that the residuals contain some remnants of theaveraged neuron response. Altogether, these resultsshow that the STPM model is sufficient for describingtrial-averaged responses in the majority of recorded neu-rons.
Poisson-like variability explains the occurrence oftemporal spike patterns in repeated trials
Having shown that the interplay between the intensityand recovery functions of the STPM can account for alarge part of the trial-averaged response of a single neu-ron, we tested whether the model can also explain thetrial-to-trial variability of the spiking of cortical neurons.
To quantify the trial-to-trial variability of neuronal re-sponses, we sorted single-trial spike trains according tothe occurrence of spikes in predefined temporal windows
New Research 8 of 17
July/August 2017, 4(4) e0173-17.2017 eNeuro.org

(Fig. 3A–C). Each spike train was assigned a binary wordbased on occupancy of preferred firing windows the bor-ders of which were aligned to the troughs of the PSTH(Fig. 3A, windows labeled x, y, and z). As explained above,these troughs reflect the periods of quiescence due to therefractoriness of the neuron. When the single-trial spiketrains were re-ordered according to the associated binaryword, we could distinguish between several patterns of
activity (spike patterns). In most trials the neuron fired inall three windows (triplet, 111) or only the first two (dou-blet, 110), where the input was the strongest (comparewith Fig. 2A), but also doublets with other combinations ofspikes and silences were common (Fig. 3C, spike patternfrequency distribution). For example, the doublet 101 cor-responds to trials in which the neuron fired at the onset ofthe stimulation (Fig. 3A, window x), then remained silent
A
B C D
E F
xyz
Figure 3. The STPM explains trial-to-trial variability of the data. A, Single-neuron responses averaged over all trials (PSTH, same asin Fig. 1B) reveal that spikes occur preferentially at discrete latencies (delimited by vertical lines and indexed by x for the first peak,y for the second peak, and z for the third peak). B, In single trials, multiple spikes are elicited in diverse combinations of preferredlatencies resulting in significant trial-to-trial response variability. Spike combinations are classified into spike patterns. The time axiswas first divided into three windows aligned to the peaks of the PSTH. Each trial was then assigned a binary string (spike pattern xyz,from 000 to 111), where 1 represents the occurrence and 0 the absence of a spike in a window. Spike timings of eight representativesample responses assigned to each pattern are shown as raster plots. C, Frequency at which the spike patterns occurred overrepeated trials for the neuron in A. D, Firing pattern distribution obtained from the data (white bars, same as C), the STPM (red bars)and the nonrefractory STPM (blue bars). The firing rate of the Poisson model was estimated by a PSTH with bin size 0.05 ms. Insetcompares the PSTHs obtained from each model (color-coded like the bars in main panel). E, Scatter plot of two consecutive ISIswithin spike triplets calculated from the experimental data (filled circles) and responses simulated with STPM (empty circles). Serialcorrelations (Pearson’s correlation coefficient) found in the experimental intervals (rdata) differ only slightly from the respectivecorrelations predicted by the STPM (rmodel, see values in the legend, solid and dashed lines represent the best linear fit to theexperimental and model data, respectively). F, Repeated Monte-Carlo simulations (n � 1000) of the STPM fitted to experimental dataprovide the distribution of serial correlations consistent with the STPM (empty bars); the serial correlations estimated directly fromexperimental data (vertical arrow, rdata) are likely to be drawn from the same distribution (two-sided bootstrap test, p � 0.81).
New Research 9 of 17
July/August 2017, 4(4) e0173-17.2017 eNeuro.org

during the second window (y) and fired again in the thirdwindow (z); the omission of the spike in the window y isthe consequence firing late in the window x (see thecorresponding line in the raster plot; Fig. 3B), so that theneuron is refractory during the window y. In other neuronsthe number of discrete firing windows (determined by thenumber of PSTH peaks) ranged from two to four, and asimilar distribution of spike patterns was obtained. Theappearance of such spike patterns can be attributed tothe chance phenomena (Poisson firing) and their interplaywith the structured input and refractoriness.
We found that the distribution of spike patterns in theexperimental data were similar to the distribution obtainedfrom the STPM (Fig. 3D). In contrast, when the recoveryfunction was constrained to 1 for all bins and the intensityfunction estimated from the data (nonrefractory STPM)some spike patterns appeared at frequencies much dif-ferent from the experimental data (e.g., spike patterns010, 110, 001, and 111; Fig. 3D), despite the fact that theoverall PSTHs were almost identical (Fig. 3D, inset). Thedifferences of spike pattern frequencies can thus be un-derstood as the effect of refractoriness; without it theprobabilities of firing in each window are independent ofthe occurrence of spikes in the previous windows, inwhich case the frequency of a spike pattern can be di-rectly predicted from the trial-averaged response (PSTH).
To quantify the similarity between the experimental andmodeled spike patterns, we used a cross-validated �2
statistics (see Methods, Eq. 7). In 12 of 17 examinedneurons the spike-pattern distribution of the STPM wassimilar to the experimental distribution, and for five cellsthey were significantly different (F test, p � 0.01); in two ofthese five neurons the PSTH was not accurately predictedby the STPM precluding the possibility of predicting thetrial-to-trial variations. In the remaining three neuronsthere were substantial differences in the frequency ofselected spike patterns, which might reflect the misesti-mation of the recovery function. Overall, these resultsshow that in most neurons the STPM with time-dependent inputs and refractoriness can account not onlyfor the trial-averaged but also the trial-to-trial variability ofresponses to somatosensory stimulation.
Within-burst intervals manifest significantcorrelations
Next, we investigated whether the correlations betweenconsecutive ISIs (serial correlations) may play a role in thegeneration of spike patterns. The STPM predicts that theresponse should be fully determined by the current inputand the interval since the last spike. However, the calcu-lation of the serial correlations in the experimental dataobtained from S1 showed that two consecutive ISIs arenot independent (Fig. 3E). Since significant serial correla-tions might be induced by the firing-rate variations alone,we compared the experimental serial correlations with theones obtained with the STPM, which does not assumeany correlations between ISIs. In the example shown inFigure 3E the serial correlations are indeed accounted forby the STPM model meaning that the spiking historybefore the last spike does not affect the response.
In 12 out of 17 neurons the experimental and modelserial correlations were not significantly different (two-sided bootstrap test, p � 0.01; Fig. 3F) confirming that formost neurons the spiking memory did not extend over thelast spike. In three neurons the coefficient could not bedetermined because of a low number of triplets identifiedin responses. In two neurons the correlation coefficientswere larger in the data than in the fitted STPM model(bootstrap test, p � 0.01).
We also compared the STPM with a GLM (Fig. 2C),which can account for spiking history extending over thelast spike. The GLM showed a similar power in explainingboth the average PSTH compared to the STPM (t test,p � 0.01; Fig. 2D, right box). However, it allowed for usinglarger bins without significant loss of goodness-of-fit (Fig.2E,F). Finally, the introduction of spike history effects ex-tending over multiple preceding spikes did not explain thesignificant serial correlations in every neuron. The GLMcould account for the measured serial correlations in 13 outof 17 neurons. Overall, these results show that refractorinessis sufficient to explain the statistics in the within burst inter-vals obtained in most recorded neurons.
Trial-to-trial input variations induce significant serialcorrelations
The significant serial correlations found in two neuronscould result from variability of the inputs that they receive.Although the peripheral stimulation of the median nerveused to evoke the somatosensory responses was wellcontrolled over the duration of the recording, it is possiblethat the effective input to the cortex was modulated at theearly stages of somatosensory pathway (cuneate nucleus,thalamus) and by on-going activity in the cortex. On theother hand, the STPM was fitted under the assumptionthat the inputs and model parameters do no change intime, i.e., that they are stationary.
To test the effects of trial-to-trial variability on the esti-mated STPM parameters and the serial correlations, wesimulated spike trains from the STPM with a step-likerecovery function and an exponentially decaying intensityfunction (Fig. 4B,C, dashed lines). In addition, in each trialwe modulated the amplitude of the intensity function by amultiplicative gain, G, which was randomly drawn fromuniform distribution on the interval [0.2, 1.8] (Fig. 4A).Next, we fitted the simulated surrogate data with anSTPM assuming that the intensity function was fixed andthat the trial-to-trial variability resulted solely from theprobabilistic nature of the model. The fitted intensity func-tion (Fig. 4B, red line) reflected the rapid onset and slowerdecay of the input after the stimulus, but its trace deviatedfrom the “ground-truth” intensity function used in thesimulation (compare the solid red and dashed graycurves; Fig. 4B). Importantly, the intensity function con-tained small ripples akin to the ones visible in the intensityfunction fitted to experimental data (Fig. 2A, left). Simi-larly, the fitted recovery function did not capture the step-like transition from refractoriness to baseline, but itmanifested a prominent overshoot following the absoluterefractory period and slower decay to baseline (Fig. 4C);
New Research 10 of 17
July/August 2017, 4(4) e0173-17.2017 eNeuro.org

such time-dependence was reminiscent of the shape ofrecovery function estimated from the data (Fig. 2A, right).
We also studied the effects of the gain modulation onthe GLM. The intensity function estimated with this modelstill contained fluctuations absent in the function used forsimulation, but their amplitude was reduced compared tothe STPM. A greater improvement was observed in theGLM estimate of the recovery function, which approxi-mated well the real function without a visible overshoot.Overall, both STPM and GLM misestimated some modelparameters in presence of trial-to-trial variation, but wefound that the GLM was more robust (Fig. 4D).
Finally, we estimated the serial correlation between theISIs in presence of the input modulation. We found thatthe serial correlation was significantly larger compared tothe spike trains simulated with the STPM with no trial-to-trial variations (Fig. 4E). This result shows that positiveserial correlations can be obtained when neuronal re-sponses vary from trial to trial reflecting changing inputsor excitability of the neuron. Since in our analysis in Figure3E,F we compared experimental serial correlations to theones obtained from the STPM, which does not accountfor the input variability, our estimate of serial correlationscould reflect input modulation.
In summary, we show that the trial-to-trial variations ofthe input can explain several aspects of the STPM fitted toexperimental data, in particular the ripples in the fitted
intensity functions, overshoot following the refractorinessin the recovery function, and significant correlations be-tween consecutive ISIs.
Trial-to-trial input variations induce correlationsbetween single-neuron and population responses
Simultaneous recordings of single-neuron spike patternsand macroscopic EEG signals recorded from the surface ofdura (high-frequency, �400 Hz, epidural hf-EEG) haveshown that the spike patterns are not private to each neuronbut that they are coordinated across a population of neuronsresponding to peripheral stimulation (Telenczuk et al., 2011).Such a coordination could possibly by achieved with amillisecond range-synchronization of the neurons, but themechanisms of such a synchronization are not clear. Alter-natively, it could be produced by the shared modulation ofinputs or excitability. To test the latter hypothesis, we ap-plied our probabilistic single-neuron model, the STPM, to apopulation of neurons receiving common gain modulation(Fig. 5A).
As before, we assumed that the gain varies from trial totrial due to fluctuations in excitability, synaptic strength, orbackground activity. To investigate the effect of the gainfactor on the population response, we simulated 5000identical, statistically independent model neurons with theparameters estimated from the experimental data. Wefound that the frequencies of individual spike patterns
Figure 4. Input modulation may explain deviations of spike train statistics from the STPM and GLM. A, The STPM was extended byincluding a multiplicative gain factor, which acts on the input function. The gain factor was randomly selected from a uniformdistribution [0.2, 1.8] in each trial. The model was simulated with an exponentially decaying intensity function (B, dashed line);maximum amplitude, 4000 spikes/s, time constant, 3 ms; and a step recovery function (C, dashed line); refractory period, 1.4 ms. B,Intensity function of the STPM (red) and GLM (blue) fitted to the simulated spike trains. The intensity function manifests deviationsfrom the real intensity function used in the simulation (dashed line; gray-shaded area corresponds to the amplitude range of intensityfunction taking into account the gain factor). C, Recovery function of the STPM (red) and GLM (blue) fitted to the simulated spiketrains. The STPM-estimated recovery function displays a characteristic overshoot soon after end of the absolute refractory period (1.4ms; dashed line, real recovery function underlying the spike trains). D, RMS error of the intensity and recovery functions estimatedwith the STPM and GLM. E, The serial correlation of the model with gain modulation (arrow) is significantly larger (p � 0.01) thanpredicted in absence of modulation (bar plot, histogram of 1000 serial correlation coefficient obtained from Monte Carlo simulationsof the STPM with the intensity and recovery functions shown in B, C, red line).
New Research 11 of 17
July/August 2017, 4(4) e0173-17.2017 eNeuro.org

depended on the value of the gain factor: Some patterns (forexample 100) occur more frequently at low gain (G � 0.8),while others (for example 110) tend to occur more often athigh gain (G � 1.2; Fig. 5B). Concurrently, the amplitude ofthe binned spike trains averaged across neurons (populationPSTH) increased with the gain (Fig. 5C).
The concurrent dependence of population PSTH andsingle-neuron spike pattern distribution on the gain factormay also explain the correlation between single-neuronresponses and macroscopic population activity found inexperimental data. Spike patterns that are more frequentat low gain coincide predominately with a low-amplitudepopulation PSTH whereas spike patterns elicited morefrequently at high input gain, on average, coincide moreoften with a high-amplitude population PSTH. Conse-quently, the amplitude of the population PSTH mightco-vary with single-neuron spike patterns. In particular,we found that the RMS amplitude of the high-pass filteredPSTH (�400 Hz) depends on the spike pattern used forgrouping the trials (Fig. 5D).
To test whether gain modulation could explain the ex-perimental results, we simulated the STPM model with
trial-varying gain factor (see Methods) and compared thespike-pattern-specific hf-EEG amplitude calculated fromexperimental data with the simulated population re-sponse. We found that already for a modest level of thegain modulation (modulation strength � � 0.2) the RMSamplitudes of the experimental hf-EEG and high-pass-filtered population PSTH of the model were strongly cor-related (an example for one neuron, Pearson’s r � 0.93;Fig. 5E).
We found a positive correlation coefficient in 12 of 16neurons that produced at least three different patterns.This fraction is significantly above the chance level ex-pected from uncorrelated quantities (two-sided binomialtest, p � 0.05). Thus, we conclude that gain modulationcan introduce correlations between the single-neuronspike patterns and macroscopic population responses.
Spike patterns emerge as input-driven phenomenain a simplified biophysical model of a cortical neuron
The probabilistic models presented so far are abstract,and their parameters (intensity and recovery functions)cannot be linked directly to biophysical properties of a
A B
C
D E
Figure 5. Coordination of spike patterns in the population. A, Simulation of 5000 identical units described by the STPM (Fig. 2C) withgain modulation of the strength � � 0.2. From the simulated spike trains of all neurons (short ticks represent sample spike times) thepopulation PSTH was calculated (bottom, black line) and then high-pass filtered to obtain an estimate of the hf-EEG populationresponse (bottom, red line). B, Distributions of spike patterns of a single neuron in 1000 repetitions of the simulation with a low (0.8,blue) and a high (1.2, red) gain. C, The population PSTH before (top panel) and after high-pass filtering (bottom panel) varies with thegain (blue: 0.8, red: 1.2). D, Single-neuron spike pattern and root-mean square (RMS) amplitude of the high-pass filtered populationPSTH are correlated because both the spike pattern and the PSTH depend on the gain. Box plots represent distribution of single-trialRMS amplitudes for each spike pattern of a single neuron (boxes - quartiles, horizontal lines - medians, whiskers - range excludingoutliers, crosses - outliers). E, The simulated population RMS amplitudes correlate with experimental hf-EEG RMS related to the samepattern (hf-EEG RMS; Telenczuk et al., 2011).
New Research 12 of 17
July/August 2017, 4(4) e0173-17.2017 eNeuro.org

neuron. To interpret the generation of spike patternsmechanistically, we developed a simplified biophysicalmodel of a cortical neuron based on the LIF model. Al-though this model does not reproduce faithfully all biolog-ical properties of realistic neurons, it captures theirintegration and spike generation properties, which areessential to the responses analyzed here. We simulatedthe neuron with two types of synaptic inputs, tonic excit-atory and inhibitory inputs, and phasic thalamic excitatoryinputs representing the barrage of action potentials trig-gered by peripheral stimulation.
In absence of thalamic inputs the model neuron elicitsonly few spikes due to spontaneous threshold crossings.However, in the model the median nerve stimulation isassumed to activate the thalamocortical fibers (28 syn-apses per cortical neuron), which then fire randomly ac-cording to a Poisson distribution with the rate of 700spikes per second. These massive inputs trigger excit-atory postsynaptic currents bringing the membranequickly to the threshold. This results in a series of spikeemissions accompanied by rapid successions of mem-brane de- and repolarizations (Fig. 6A).
We calculated the PSTH of the model by summingspike responses of n � 500 repetitions of the simulation.In each repetition the intracortical excitatory and inhibitoryinputs, as well as the thalamocortical inputs, were drawnrandomly from the Poisson distribution. Despite this ran-domness, the model PSTH is composed of discrete peakswell separated by short valleys showing that the neuronfired precisely at preferred latencies (Fig. 6B). Althoughthe LIF model does not contain an explicit refractoriness,the intervals between the PSTH peaks correspond to thetime required to depolarize the membrane from the reset
potential (Vreset � –70 mV) to the spiking threshold (Vthr �–40 mV). In Figure 6A, this time is seen as the slow risetime following the rapid downstrokes (reset) of the mem-brane potential triggered by spikes. Such a hyperpolar-ized period acts effectively as the refractory period asseen in the STPM and GLM.
The characteristic decay of the response in the somato-sensory cortex observed in the experimental data (Fig. 1B)could be driven by the adaptation of the neuron to theintense stimulation either at synaptic (Markram and Tso-dyks, 1996) or neuronal level (Benda and Herz, 2003).Here, we model this process by means of short-termsynaptic depression, which reflects the depression ofthalamocortical synapses due to prolonged activity (Gilet al., 1997). The gradual decrease of synaptic drivemakes the subsequent peaks smaller, broader, and sep-arated by longer intervals (Fig. 6B) as observed also in theexperimental PSTH (Fig. 1B). After 10 ms of stimulation,the thalamocortical synapses deplete, abolishing furtherdischarges.
In practice, the inputs to somatosensory cortex canalso decay after a brief median nerve simulation (0.2 ms)applied to the median nerve invalidating our assumptionof sustained synaptic drive. However, it has been foundthat the thalamocortical projections can respond withprolonged firing to brief presentation of the stimulus(Swadlow and Gusev, 2001). Interestingly, such re-sponses also formed bursts of action potentials. If theaxonal delays of multiple thalamocortical neurons arematched at the submillisecond level, such bursts couldprovide oscillatory inputs cortical level. The effects ofsuch input patterns on the cortical responses should beinvestigated in the future.
A
B
C
D
E
Figure 6. A LIF model produces variable spike patterns. A, Sample traces of the membrane potential Vm(t) of a LIF model (seeMethods for details) for three repetitions of the simulation. The ticks mark the threshold crossings, which lead to spike emission (colormatched to the color of Vm trace). B, Poststimulus time histogram (firing rate) of spike trains obtained from 500 repetitions of thesimulation. Vertical dashed lines delineate the events used for spike pattern analysis in D. C, Spike raster from all repetitions of thesimulation. The “stim” arrow denotes the onset of the simulated thalamic inputs. D, Distribution of spike patterns obtained in thesimulation of a LIF neuron (inset, PSTH). E, Distribution od spike patterns and PSTH (inset) for a model with modified parameters.Increasing the presynaptic firing rates of intracortical connections leads to higher coincidence of 101 and 011 patterns. In A-D thefollowing parameters were used: wexc � 0.0072 �s, �exc � 0.9 ms, fexc � 10 Hz, winh � 0.02252 �s, wTh � 0.035 �s, nTh � 28, fTh� 700 Hz, U � 0.65. E, Four parameters were modified from this baseline: fexc � 30 Hz, wTh � 0.05 �s, fTh � 300 Hz, U � 0.7. Alldefinitions and values of the remaining parameters are listed in Table 1.
New Research 13 of 17
July/August 2017, 4(4) e0173-17.2017 eNeuro.org

The responses of the LIF model neuron vary from trial totrial (Fig. 6C,D). This variability results from random cor-tical and thalamocortical inputs, which provide Poisson-distributed input spikes. Increasing the rate of inhibitoryand excitatory inputs in a balanced fashion puts the neu-ron in a so-called noise-driven regime in which spikes areevoked by the random fluctuations over the thresholdrather than by the mean depolarization (Destexhe et al.,2003; Zerlaut et al., 2016). In this regime, the responses ofthe neuron are more variable such that a broader range ofdifferent spike patterns is obtained across the trials. Inparticular, we found that the patterns with long latencies(such as, 011) or spike omissions (101) became morefrequent at higher intracortical firing rates (Fig. 6E).
In summary, the LIF model indicates that bursts in thesomatosensory cortex can be driven by the input and donot always require intrinsic bursting mechanisms (re-viewed by Krahe and Gabbiani, 2004). The number ofspikes per burst and the within-burst intervals can bemechanistically explained by the integrating properties ofsingle neurons that are equipped with an intrinsic adap-tation process or driven by synapses that show short-term depression. Strong thalamic inputs can produceprecise population responses at preferred latencies,which can overcome the variability. At the single-trial levelthe variability of the thalamic input is expressed in theform of stereotyped spike patterns.
DiscussionBy means of simplified phenomenological models and a
biophysical point-neuron model, we showed that within-burst variability of cortical S1 neurons can be decom-posed into the private variability of each neuron andmultiplicative input modulation that is shared by the entirepopulation. The private variability explains most of thedifferences between responses elicited in single trials andunderlies the re-appearance of the same spike patternsover multiple repetitions of the stimulus. The shared gainmodulation coordinates the responses of many respond-ing neurons and explains the puzzling co-variabilitybetween single-neuron and macroscopic population re-sponses demonstrated in experimental recordings (Te-lenczuk et al., 2011). The models shed also light on themechanism of S1 burst generation, their synchronizationacross neurons, and suggest that spike patterns mayencode time-varying cortical state at fast temporal scales.
Mechanism of burstingBy means of a simple phenomenological model, the
STPM, we showed that bursting in the S1 results from thecombination of intense synaptic bombardment and a re-fractory period. Such fast bursting triggered and sus-tained by an intense synaptic input has been termed“forced bursting” (Izhikevich, 2006).
The shape of a fitted recovery function in both modelsagrees well with the contribution of an after-hyper-polarization (AHP)-mediated potassium current and anafter-depolarization (ADP) due to either persistent (Baland McCormick, 1996; Brumberg et al., 2000) sodium orlow-threshold calcium current (Jahnsen and Llinás, 1984):The initial dip, which we interpret as refractoriness, might
reflect the AHP and the inactivation of sodium channels,whereas the subsequent over-shoot might correspond tothe ADP. We note, however, that the over-shoot might bean artifact due to trial-to-trial variability (Fig. 4C). We alsodemonstrated in a toy model that the over-shoot is notcritical for bursting responses, the absolute refractoryperiod combined with intense but transient inputs is suf-ficient to produce bursts with similar (but not identical)statistics (Fig. 1C).
The STPM could also account for the correlations be-tween ISIs (serial correlations). However, in a few neuronswe found serial correlations differing from the ones itpredicted. Since in these neurons processes occurring atlong time scales could shape the spike patterns, we fittedthem with the GLM, which considers spike-history effectsextending to multiple ISIs. We found that the GLM with ahorizon of 8 ms provided an optimal fit to these data inagreement with the time scales of short-term synapticplasticity (Tsodyks and Markram, 1997) and firing-rateadaptation (Benda and Herz, 2003). The latter is oftenmediated by the slow AHP currents providing another linkbetween a biophysical process and the recovery functionof our phenomenological model.
The significant serial correlations could be also ex-plained by a model which includes trial-to-trial variationsof the input intensity (gain modulation). We found thatintroducing such variations in the model results in theover-estimation of the serial correlations estimated fromthe simulated data. In addition, these variations may leadto the over-estimation of the recovery function in form ofthe overshoot appearing briefly after the absolute refrac-tory period. Although such an overshoot is also present inthe recovery function estimated from the data, we believethat it is not an artifact of the estimation method. First, themodulation must be strong (� � 0.8) to produce a visibleovershoot, whereas we found that modest modulation (�� 0.2) is consistent with the serial correlation and EEGcorrelation estimated in the data. Secondly, we found thatGLM is robust with respect to such modulation intro-duced in the simulated model, but still it uncovers anovershoot in the experimental data. Nevertheless, in thefuture it would be instructive to extend the spike-trainmodels (STPM and GLM) with the fluctuating gain factorand fit it directly to the data.
We were able to reproduce qualitatively both the aver-age and single-trial features of the burst responses in amore realistic LIF neuron. Although such models are agross simplification of the real neurons both in terms ofspiking mechanism and morphologic features, it has beensuggested that the LIF may faithfully reproduce somefeatures of spike generation (Brette, 2015). In the model,the within-burst interval was controlled by the time re-quired to reach the threshold from the hyperpolarizedstate (membrane time constant), and the gradual decay ofthe amplitude of PSTH peaks was due to the short-termsynaptic depression. The latter mechanism can be relatedto the depletion of the available vesicles in the presynapticterminal (Markram and Tsodyks, 1996). However, it wouldbe possible to replace it with some other form of adapta-tion (Brette and Gerstner, 2005). Both mechanisms lead to
New Research 14 of 17
July/August 2017, 4(4) e0173-17.2017 eNeuro.org
extinction of the initial synaptic drive, which explains theburst-like transient response to the step-like thalamicinputs. We note, however, that without recordings fromthalamocortical projection neurons we cannot infer theinputs of the cortical neurons. Our models are still com-patible with temporally structured inputs.
The trial-to-trial variability of the model was due tovariable arrival times of the thalamic inputs, but also dueto the intracortical inputs. The latter were configured suchthat the neuron was in the “high-conductance state” re-producing the property of cortical neurons receiving con-stant bombardment of inhibitory and excitatory inputs(Destexhe et al., 2003). Apart from decreasing the mem-brane time constant thus allowing for rapid repeated dis-charges, these intracortical inputs introduced substantialtrial-to-trial variability that could explain the observedspike pattern distribution.
Previous studies have shown that most of the burstingneurons in the S1 macaque cortex are characterized bybroad spikes, which suggests that they are pyramidalneurons or spiny stellate neurons (Baker et al., 2003). Thisis confirmed by intracellular recordings in barrel cortexshowing that regular spiking neurons but not intrinsicbursting neurons followed the phase of high-frequencyoscillations in surface recordings (Jones et al., 2000). Ourresults are consistent with these findings and strengthenthe evidence that a subclass of S1 neurons activated bymedian nerve stimulation belongs to the regular spikingneurons. However, a subset of neurons analyzed here (5of 17 neurons) did also fire bursts that were not locked tothe median nerve stimulation showing that at least someof them may belong to the intrinsic bursting class.
Burst synchronizationA striking feature of the S1 bursting is that the signature
of the burst also appears in macroscopic signals such asthe EEG. The visibility of the burst in the surface record-ings was interpreted as a sign of strong synchronizationbetween the neurons (Jones et al., 2000), which could bemediated, for example, by fast synaptic potentials or gapjunctions (Draguhn et al., 1998). By extending our modelto a population of uncoupled neurons, we demonstratedthat the sub-millisecond synchronization between multi-ple neurons does not require a fast coupling mechanisms,but results from shared synaptic inputs arriving throughthalamocortical fibers. Provided that the biophysicalproperties of the receiving population and axonal conduc-tion times vary in a narrow range, these inputs will elicitsynchronous bursts of spikes. The required precision inthe arrivals of afferent spikes could be achieved by meansof a plasticity rule that selects inputs arriving synchro-nously at the cortical synapses (Gerstner et al., 1996).
Role of spike patternsTrial-to-trial variations in S1 responses can be classified
into a set of spike patterns defined by the occurrences ofspikes within 10-ms-long bursts (Telenczuk et al., 2011).Such temporal patterns of neuronal responses were firstidentified in cat striate cortex and crayfish claw (Dayhoffand Gerstein, 1983), and later in the temporal cortex ofmonkeys, cat lateral geniculate nucleus (Fellous et al.,
2004) and in the rat hippocampus (Diba and Buzsáki,2007; Schmidt et al., 2009).
Here, we proposed a model in which the occurrence ofspike patterns is regulated by the input intensity, that isthe rate of incoming spikes; in contrast precise timing ofthe input was not necessary. The temporal informationstored in the spike patterns is complementary to theoutput rate (spike count) in the sense that the spikepatterns with identical number of spikes (and therefore thesame output rate) could still provide extra informationconcerning its inputs. For example, the early (110) doubletis more common for high input intensity; the opposite istrue for the late (011) doublet (Fig. 5B). This mechanismcould be especially useful for encoding inputs that wouldnormally exceed the maximum firing rate set by the re-fractory period.
In one study the stimulus intensity was related to thewithin-burst intervals of spike responses recorded in thedorsal lateral geniculate nucleus (Funke and Kerscher,2000). Our results are consistent with this hypothesis. Inthe STPM, the within-burst intervals are constrained bythe refractory period, but their length can also vary as afunction of the synaptic drive (intensity function). In addi-tion, the length of refractory period may not be fixed but itmight be modulated by the firing rate. It has been shownthat models allowing for this modulation may better de-scribe the spike times in response to the time-varyingstimulation (Koyama and Kass, 2008).
Short trains of spikes are also well suited to evokespecific synaptic response or trigger synaptic plasticity(Lisman, 1997; Tsodyks and Markram, 1997; Maassand Zador, 1999; Song et al., 2000; Swadlow andGusev, 2001), they are optimally placed to representneuronal variables in a form that is easily processed,stored and transmitted (Leibold et al., 2008; Tiesingaet al., 2008). In this spike-timing-based view, neuralsystems take advantage of the temporal informationencoded into spike patterns to represent slowly-changing cortical states (such as attention or waking).Alternatively, spike patterns could also allow for morereliable representation of neuronal inputs (Toups et al.,2012). These rate-based and spike-timing-based inter-pretations of spike patterns are not contradictory andcould even act as independent communication chan-nels (Tiesinga et al., 2008).
We showed that the distribution of spike patterns overneurons and the amplitude of the averaged populationsignal are regulated by input magnitude, which couldreflect gating of neuronal signals through attention, ex-pectation, sleep and waking (Steriade et al., 2001; Shuet al., 2003; Fontanini and Katz, 2008). Similar gain controlmechanisms were implemented in realistic neural modelsthrough, for example, concurrent modulation of excitationand inhibition (Hô and Destexhe, 2000; Chance et al.,2002; Vogels and Abbott, 2009) or short-term synapticdepression (Rothman et al., 2009). More generally, multi-plicative noise can account for the variability and co-variability of neuronal responses in the thalamus andmany cortical areas, including the lateral geniculate nu-cleus, V1, V2, and MT (Goris et al., 2014).
New Research 15 of 17
July/August 2017, 4(4) e0173-17.2017 eNeuro.org

Population correlates of spike patternsMacroscopic signatures of the bursts were shown to
match the somatosensory-evoked potentials in monkeyepidural EEG and human scalp EEG, so the high-frequency EEG burst might link the noninvasive macro-scopic recordings and microscopic neuronal activity(Curio, 2000; Telenczuk et al., 2011). We could reproducethis puzzling relation between the single-neuron spikepatterns and the macroscopic EEG signals by means ofthe STPM with the gain modulation. To model the high-frequency EEG signals, we used the high-pass filteredaverage response of the population (population PSTH).This choice was motivated by previous studies on theorigins of the high-frequency EEG signals: while thelow-frequency field potentials are known to correlatemostly with the synaptic currents (Buzsáki et al., 2012;Mazzoni et al., 2015), it has been recently demonstratedthat the population spike rate is a better predictor ofhigh-frequency �400-Hz EEG power (Tele �nczuk et al.,2011; Tele �nczuk et al., 2015). Based on these resultswe conclude that the link between the microscopic andmacroscopic activity could be partially explained by theneuronal correlations mediated by the common gainmodulation.
To sum up, our modeling shows how the characteristicfeatures of the spike burst, i.e., its frequency and ampli-tude, can be related to the biophysical properties of neu-rons, such as refractory period and short-term synapticdepression, whereas the internal burst composition iscontrolled by the background activity and gain modula-tion. As a conclusion we argue that the brain could usesmall within-burst timing differences to encode the dy-namical cortical state into precise spike patterns amena-ble to neuronal processing.
ReferencesBaker S, Curio G, Lemon R (2003) EEG oscillations at 600 Hz are
macroscopic markers for cortical spike bursts. J Physiol 550:529–534. CrossRef
Bal T, McCormick DA (1996) What stops synchronized thalamocor-tical oscillations? Neuron 17:297–308. CrossRef
Barlow RJ (1989). Statistics: a guide to the use of statistical methodsin the physical sciences. Chichester: Wiley-Blackwell.
Benda J, Herz AVM (2003) A universal model for spike-frequencyadaptation. Neural Comput 15:2523–2564. CrossRef Medline
Berry M, Meister M (1998) Refractoriness and neural precision. JNeurosci 18:2200. Medline
Brette R (2015) What is the most realistic single-compartment modelof spike initiation? PLoS Comput Biol 11:1–13. CrossRef
Brette R, Gerstner W (2005) Adaptive exponential integrate-and-firemodel as an effective description of neuronal activity. J Neuro-physiol 94:3637–3642. CrossRef
Brody CD (1999) Correlations without synchrony. Neural Comput11:1537–1551. Medline
Brown EN, Barbieri R, Ventura V, Kass RE, Frank LM (2002) Thetime-rescaling theorem and its application to neural spike traindata analysis. Neural Comput 14:325–346. CrossRef Medline
Brumberg JC, Nowak LG, McCormick DA (2000) Ionic mechanismsunderlying repetitive high-frequency burst firing in supragranularcortical neurons. J Neurosci 20:4829–4843.
Bruno RM, Sakmann B (2006) Cortex is driven by weak but synchro-nously active thalamocortical synapses. Science 312:1622–1627.CrossRef
Buzsáki G, Anastassiou CA, Koch C (2012) The origin of extracellularfields and currents–EEG, ECoG, LFP and spikes. Nat Rev Neurosci13:407–420. CrossRef Medline
Chance F, Abbott L, Reyes A (2002) Gain modulation from back-ground synaptic input. Neuron 35:773–782. Medline
Chow CC, White JA (1996) Spontaneous action potentials due tochannel fluctuations. Biophys J 71:3013–3021. CrossRef
Cruikshank SJ, Lewis TJ, Connors BW (2007) Synaptic basis forintense thalamocortical activation of feedforward inhibitory cells inneocortex. Nat Neurosci 10:462–468.
Curio G (2000) Linking 600-Hz� spike-like� EEG/MEG wavelets(�sigma-bursts�) to cellular substrates: concepts and caveats. JClin Neurophysiol 17:377–396. Medline
Czanner G, Sarma SV, Ba D, Eden UT, Wu W, Eskandar E, Lim HH,Temereanca S, Suzuki WA, Brown EN (2015) Measuring the signal-to-noise ratio of a neuron. Proc Natl Acad Sci USA 112:7141–7146. CrossRef
Dayan P, Abbott L (2001). Theoretical neuroscience: computationaland mathematical modeling of neural systems. Cambridge: MITPress.
Dayhoff JE, Gerstein GL (1983) Favored patterns in spike trains. I.Detection. J Neurophysiol 49:1334–1348.
Destexhe A, Rudolph M, Fellous JM, Sejnowski TJ (2001) Fluctuatingsynaptic conductances recreate in vivo-like activity in neocorticalneurons. Neuroscience 107:13–24. CrossRef
Destexhe A, Rudolph M, Paré D (2003) The high-conductance stateof neocortical neurons in vivo. Nat Rev Neurosci 4:739–751.CrossRef Medline
Diba K, Buzsáki G (2007) Forward and reverse hippocampal place-cell sequences during ripples. Nat Neurosci 10:1241–1242. Cross-Ref Medline
Douglas RJ, Martin KAC (2007) Mapping the matrix: the ways ofneocortex. Neuron 56:226–238. CrossRef Medline
Draguhn A, Traub RD, Schmitz D, Jefferys JGR (1998) Electricalcoupling underlies high-frequency oscillations in the hippocampusin vitro. Nature 394:189–192. CrossRef Medline
Ecker AS, Berens P, Cotton RJ, Subramaniyan M, Denfield GH,Cadwell CR, Smirnakis SM, Bethge M, Tolias AS (2014) Statedependence of noise correlations in macaque primary visual cor-tex. Neuron 82:235–248. CrossRef
Eckhorn R, Thomas U (1993) A new method for the insertion ofmultiple microprobes into neural and muscular tissue, includingfiber electrodes, fine wires, needles and microsensors. J NeurosciMethods 49:175–179. CrossRef
Estebanez L, Boustani SE, Destexhe A, Shulz DE (2012) Correlatedinput reveals coexisting coding schemes in a sensory cortex. NatNeurosci 15:1691–1699. CrossRef Medline
Evarts EV (1964) Temporal patterns of discharge of pyramidal tractneurons during sleep and waking in the monkey. J Neurophysiol27:152-171.
Faisal AA, Selen LPJ, Wolpert DM (2008) Noise in the nervoussystem. Nat Rev Neurosci 9:292–303. CrossRef Medline
Fellous J-M, Tiesinga P, Thomas P, Sejnowski T (2004) Discoveringspike patterns in neuronal responses. J Neurosci 24:2989–3001.CrossRef Medline
Fontanini A, Katz DB (2008) Behavioral states, network states, andsensory response variability. J Neurophysiol 100:1160–1168.CrossRef Medline
Funke K, Kerscher N (2000) High-frequency (300-800 Hz) compo-nents in cat geniculate (dLGN) early visual responses. J Physiol94:411–425. Medline
Gerstner W, Kempter R, van Hemmen JL, Wagner H (1996) A neu-ronal learning rule for sub-millisecond temporal coding. Nature383:76–78. CrossRef Medline
Gil Z, Connors B, Amitai Y (1997) Differential regulation of neocorticalsynapses by neuromodulators and activity. Neuron 19:679–686.Medline
Gil Z, Connors B, Amitai Y (1999) Efficacy of thalamocortical andintracortical synaptic connections: quanta, innervation, and reli-ability. Neuron 23:385–397. Medline
New Research 16 of 17
July/August 2017, 4(4) e0173-17.2017 eNeuro.org
Goris RLT, Movshon JA, Simoncelli EP (2014) Partitioning neuronalvariability. Nat Neurosci 17:858–865. CrossRef Medline
Gray PR (1967) Conditional probability analyses of the spike activityof single neurons. Biophys J 7:759–777. CrossRef
Hanajima R, Chen R, Ashby P, Lozano AM, Hutchison WD, Davis KD,Dostrovsky JO (2004) Very fast oscillations evoked by mediannerve stimulation in the human thalamus and subthalamic nucleus.J Neurophysiol 92:3171–3182. CrossRef
Hazan L, Zugaro M, Buzsáki G (2006) Klusters, NeuroScope, NDMa-nager: a free software suite for neurophysiological data processingand visualization. J Neurosci Methods 155:207–216. CrossRef
Hô N, Destexhe A (2000) Synaptic background activity enhances theresponsiveness of neocortical pyramidal neurons. J Neurophysiol84:1488–1496.
Izhikevich E (2006) Bursting. Scholarpedia 1:1300. CrossRefJahnsen H, Llinás R (1984) Electrophysiological properties of guinea-
pig thalamic neurones: an in vitro study. J Physiol 349:205–226.Medline
Johnson DH, Swami A (1983) The transmission of signals byauditory-nerve fiber discharge patterns. J Acoust Soc Am 74:493–501. Medline
Johnston D, Wu S (1995). Foundations of cellular neurophysiology.Cambridge: MIT Press.
Jones M, MacDonald K, Choi B, Dudek F, Barth D (2000) Intracellularcorrelates of fast (�200 Hz) electrical oscillations in rat somato-sensory cortex. J Neurophysiol 84:1505–1518.
Kara P, Reinagel P, Reid RC (2000) Low response variability insimultaneously recorded retinal, thalamic, and cortical neurons.Neuron 27:635–646. CrossRef
Koyama S, Kass R (2008) Spike train probability models for stimulus-driven leaky integrate-and-fire neurons. Neural Comput 20:1776–1795. CrossRef
Krahe R, Gabbiani F (2004) Burst firing in sensory systems. Nat RevNeurosci 5:13–23. CrossRef Medline
Leibold C, Gundlfinger A, Schmidt R, Thurley K, Schmitz D, KempterR (2008) Temporal compression mediated by short-term synapticplasticity. Proc Natl Acad Sci USA 105:4417–4422. CrossRef
Lewicki MS (1998) A review of methods for spike sorting: the detec-tion and classification of neural action potentials. Network 9:53.CrossRef
Lisman J (1997) Bursts as a unit of neural information: makingunreliable synapses reliable. Trends Neurosci 20:38–43. CrossRef
Llinás R, Jahnsen H (1982) Electrophysiology of mammalian thalamicneurones in vitro. Nature 297:406–408. Medline
Maass W, Zador AM (1999) Dynamic stochastic synapses as com-putational units. Neural Comput 11:903–917. Medline
Markram H, Tsodyks M (1996) Redistribution of synaptic efficacybetween neocortical pyramidal neurons. Nature 382:807–810.CrossRef
Mazzoni A, Linddé H, Cuntz H, Lansner A, Panzeri S, Einevoll GT(2015) Computing the local field potential (LFP) from integrate-and-fire network models. PLoS Comput Biol 11:e1004584. Cross-Ref
Miller MI (1985) Algorithms for removing recovery-related distortionfrom auditory-nerve discharge patterns. J Acoust Soc Am 77:1452–1464. Medline
Panzeri S, Petersen RS, Schultz SR, Lebedev M, Diamond ME (2001)The role of spike timing in the coding of stimulus location in ratsomatosensory cortex. Neuron 29:769–777. CrossRef
Rauch A, Camera GL, Luscher H, Senn W, Fusi S (2003) Neocorticalpyramidal cells respond as integrate-and-fire neurons to in vivo-like input currents. J Neurophysiol 90:1598–1612. CrossRef Med-line
Rothman JS, Cathala L, Steuber V, Silver RA (2009) Synaptic de-pression enables neuronal gain control. Nature 457:1015–1018.CrossRef Medline
Schmidt R, Diba K, Leibold C, Schmitz D, Buzsáki G, Kempter R(2009) Single-trial phase precession in the hippocampus. J Neu-rosci 29:13232–13241. CrossRef Medline
Schneidman E, Freedman B, Segev I (1998) Ion channel stochasticitymay be critical in determining the reliability and precision of spiketiming. Neural Comput 10:1679–1703. CrossRef
Shadlen M, Newsome W (1998) The variable discharge of corticalneurons: implications for connectivity, computation, and informa-tion coding. J Neurosci 18:3870–3896. Medline
Shu Y, Hasenstaub A, McCormick D (2003) Turning on and offrecurrent balanced cortical activity. Nature 423:288–293. Cross-Ref Medline
Softky WR, Koch C (1993) The highly irregular firing of cortical cellsis inconsistent with temporal integration of random EPSPs. JNeurosci 13:334–350.
Song S, Miller KD, Abbott LF (2000) Competitive Hebbian learningthrough spike-timing-dependent synaptic plasticity. Nat Neurosci3:919–926.
Steriade M, Timofeev I, Grenier F (2001) Natural waking and sleepstates: a view from inside neocortical neurons. J Neurophysiol85:1969–1985. Medline
Stern P, Edwards FA, Sakmann B (1992) Fast and slow componentsof unitary EPSCs on stellate cells elicited by focal stimulation inslices of rat visual cortex. J Physiol 449:247–278. CrossRef
Swadlow HA, Gusev AG (2001) The impact of ’bursting’ thalamicimpulses at a neocortical synapse. Nat Neurosci 4:402–408.CrossRef
Telenczuk B, Baker SN, Herz AV, Curio G (2011) High-frequency EEGco-varies with spike burst patterns detected in cortical neurons. JNeurophysiol 105:2951–2959. CrossRef
Tele �nczuk B, Baker SN, Kempter R, Curio G (2015) Correlates of asingle cortical action potential in the epidural EEG. Neuroimage109:357–367. CrossRef Medline
Tiesinga P, Fellous J, Sejnowski TJ (2008) Regulation of spike timingin visual cortical circuits. Nat Rev Neurosci 9:97–107. CrossRefMedline
Toups JV, Fellous J-M, Thomas PJ, Sejnowski TJ, Tiesinga PH(2012) Multiple spike time patterns occur at bifurcation points ofmembrane potential dynamics. PLoS Comput Biol 8:e1002615.CrossRef
Truccolo W, Eden UT, Fellows MR, Donoghue JP, Brown EN (2005)A point process framework for relating neural spiking activity tospiking history, neural ensemble, and extrinsic covariate effects. JNeurophysiol 93:1074–1089.
Tsodyks M, Markram H (1997) The neural code between neocorticalpyramidal neurons depends on neurotransmitter release probabil-ity. Proc Natl Acad Sci USA 94:719–723. CrossRef
van Vreeswijk C, Sompolinsky H (1996) Chaos in neuronal networkswith balanced excitatory and inhibitory activity. Science 274:1724–1726. CrossRef
Vogels TP, Abbott LF (2009) Gating multiple signals through detailedbalance of excitation and inhibition in spiking networks. Nat Neu-rosci 12:483–491. CrossRef
Witham CL, Baker SN (2015) Information theoretic analysis of pro-prioceptive encoding during finger flexion in the monkey sensori-motor system. J Neurophysiol 113:295–306. CrossRef
Zerlaut Y, Tele �nczuk B, Deleuze C, Bal T, Ouanounou G, Destexhe A(2016) Heterogeneous firing rate response of mouse layer V pyra-midal neurons in the fluctuation-driven regime. J Physiol 594:3791–3808. CrossRef Medline
New Research 17 of 17
July/August 2017, 4(4) e0173-17.2017 eNeuro.org