reforming health care: making sense of health care finance
DESCRIPTION
Reforming Health Care: Making Sense of Health Care Finance. Leonard Rodberg, PhD Urban Studies Dept., Queens College/CUNY Prepared for the Congressional Forum on National Lessons for Health Reform: Examining US Health Insurance April 1, 2009. - PowerPoint PPT PresentationTRANSCRIPT

Reforming Health Care: Making Sense of Health Care Finance
Leonard Rodberg, PhDUrban Studies Dept., Queens College/CUNY
Prepared for the Congressional Forum on National Lessons for Health Reform:
Examining US Health Insurance
April 1, 2009

International Comparison: Universal Coverage at Less Cost -- They Must Be Doing Something Right!
$0
$1,000
$2,000
$3,000
$4,000
$5,000
$6,000
$7,000United StatesGermanyCanadaNetherlandsFranceAustraliaUnited Kingdom
* PPP = Purchasing Power Parity.Data: OECD Health Data 2008, June 2008 version.
Average spending on health per capita ($US PPP*)
All have a strong role for government in funding and regulating their health care system.
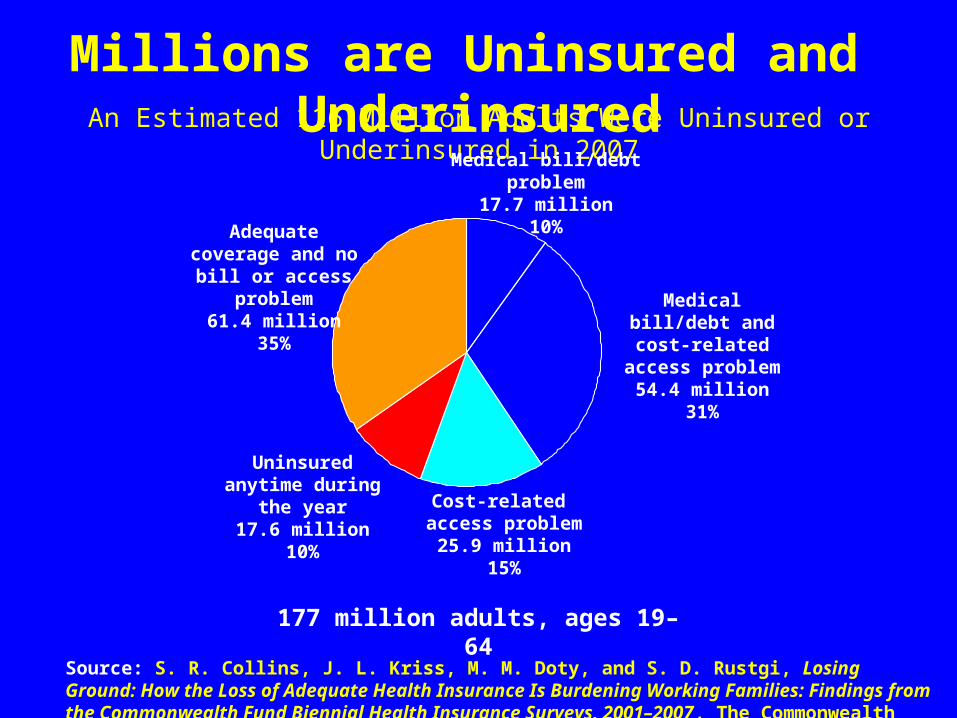
An Estimated 116 Million Adults Were Uninsured or Underinsured in 2007
Medical bill/debt problem17.7 million
10%
Cost-related access problem
25.9 million15%
Source: S. R. Collins, J. L. Kriss, M. M. Doty, and S. D. Rustgi, Losing Ground: How the Loss of Adequate Health Insurance Is Burdening Working Families: Findings from the Commonwealth Fund Biennial Health Insurance Surveys, 2001–2007, The Commonwealth Fund, Aug. 2008..
Adequate coverage and no bill or
access problem61.4 million
35%
Uninsured anytime during the year
17.6 million10%
Medical bill/debt and cost-related access problem
54.4 million31%
177 million adults, ages 19–64
Millions are Uninsured and Underinsured

Medical costs create serious financial problems for millions of us
Source: Health Tracking Poll, Kaiser Family Foundation, April 2008
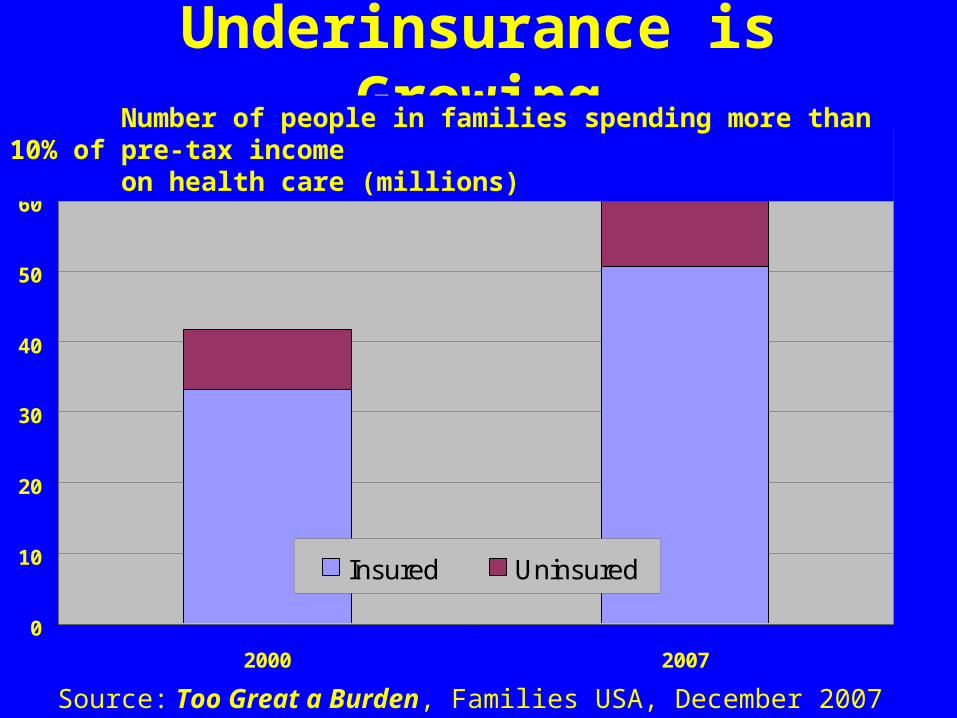
Underinsurance is Growing
0
10
20
30
40
50
60
70
2000 2007
Insured Uninsured
Source: Too Great a Burden, Families USA, December 2007
Number of people in families spending more than 10% of pre-tax income on health care (millions)
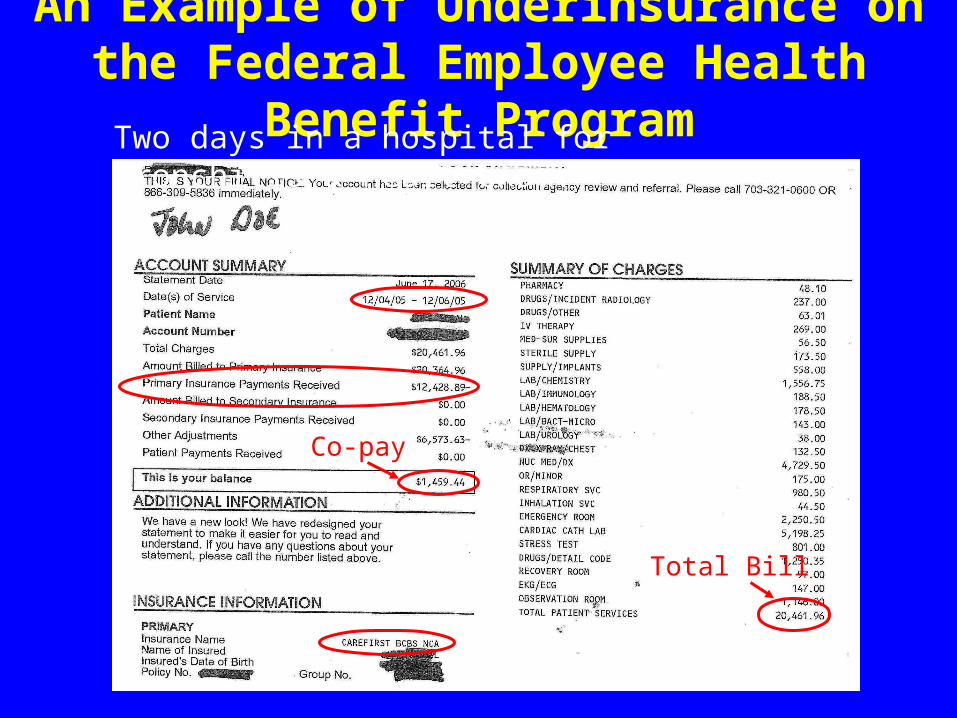
An Example of Underinsurance on the Federal Employee Health Benefit Program
Total Bill
Co-pay
Two days in a hospital for bronchitis & heart exam:
0
10
20
30
40
50
60
70
80
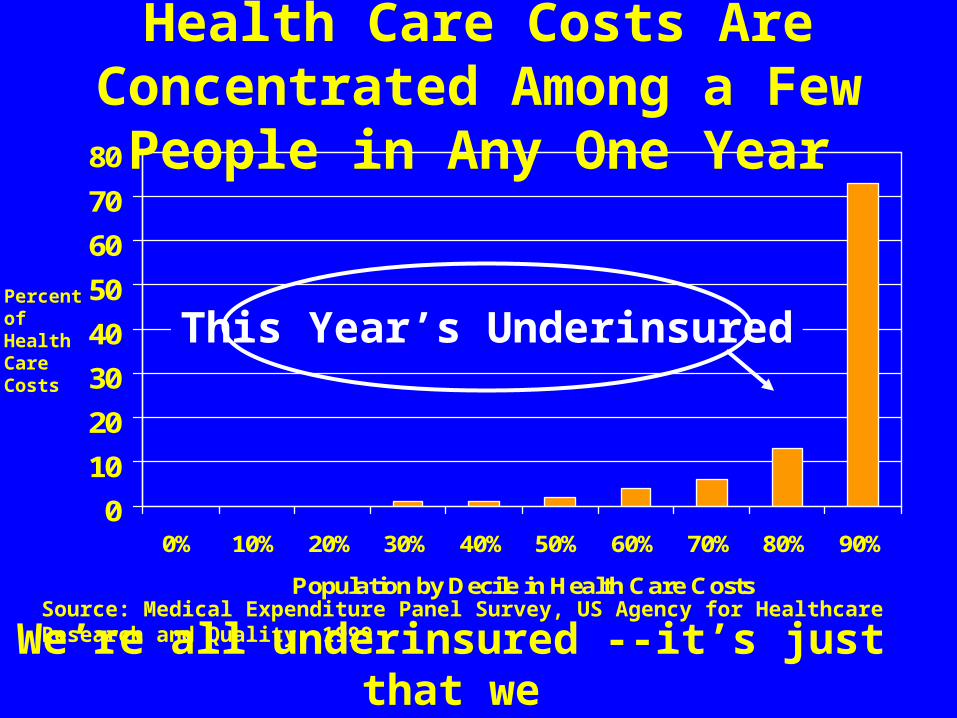
0% 10% 20% 30% 40% 50% 60% 70% 80% 90%
Population by Decile in Health Care Costs
This Year’s Underinsured
Source: Medical Expenditure Panel Survey, US Agency for Healthcare Research and Quality, 1999
Percentof Health CareCosts
Health Care Costs Are Concentrated Among a Few People in Any One Year
We’re all underinsured --it’s just that we don’t know it until we get sick!

• Everyone mandated to have insurance
• Employers should offer insurance or contribute
• Continued reliance on private insurance, with the option of a public Medicare-like plan
• You can “Keep what you have” -- doesn’t address widespread underinsurance: For most families, the problem is not the lack of insurance, it’s the insurance they already have!
• No regulation of insurance company premiums or practices
• Increases cost of the system by hundreds of billions of dollars
• No way to control costs so long as there are many separate plans and payers.
The Private/Public Mandate Model
Nixon Obama

CBO: Mandate Plans Will Not Lead to Universal Health Care or Cut Costs• “…national compliance rates [with mandates] range
from 63 percent to 86 percent.” (p. 49)• “The adoption of more health IT offers many benefits,
but it is generally not sufficient to produce substantial cost savings.” (p.147)
• “The evidence was insufficient to conclude that disease management programs generally reduce health care spending.”(p. 142)
• “Although new research into comparative effectiveness might lead to net cost savings over a long period of time, its effects during the conventional 10-year horizon for budgetary estimates would be limited.” (p.146)
Source: Key Issues in Analyzing Major Health Insurance Proposals, Congressional Budget Office, December 2008.
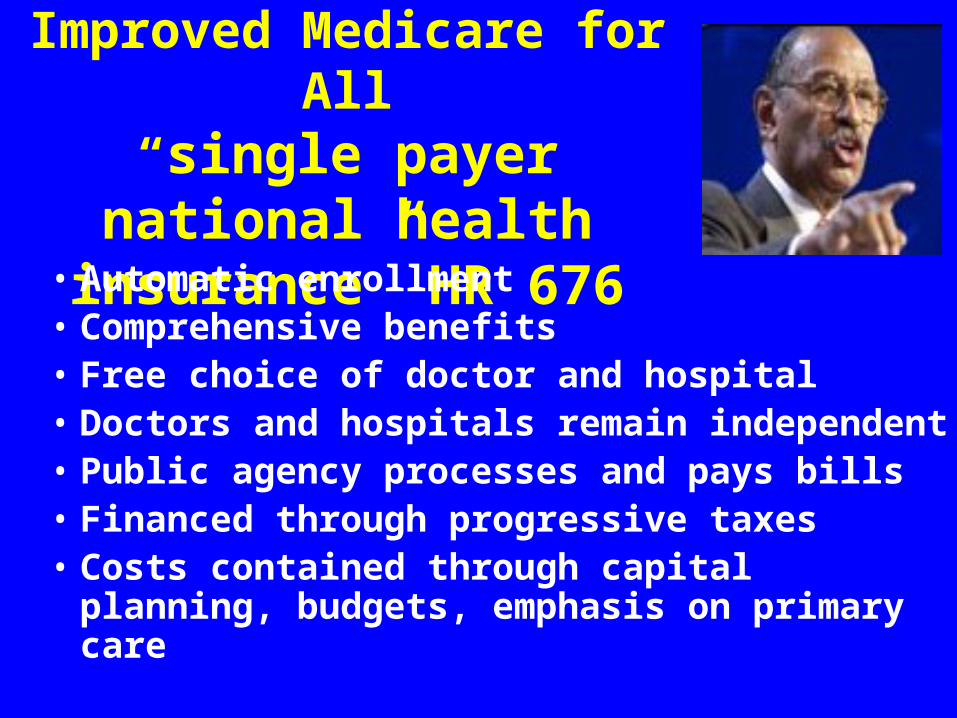
Conyers: Expanded and Improved Medicare for All
“single payer national health insurance” HR 676
• Automatic enrollment• Comprehensive benefits• Free choice of doctor and hospital• Doctors and hospitals remain independent• Public agency processes and pays bills• Financed through progressive taxes• Costs contained through capital planning,
budgets, emphasis on primary care
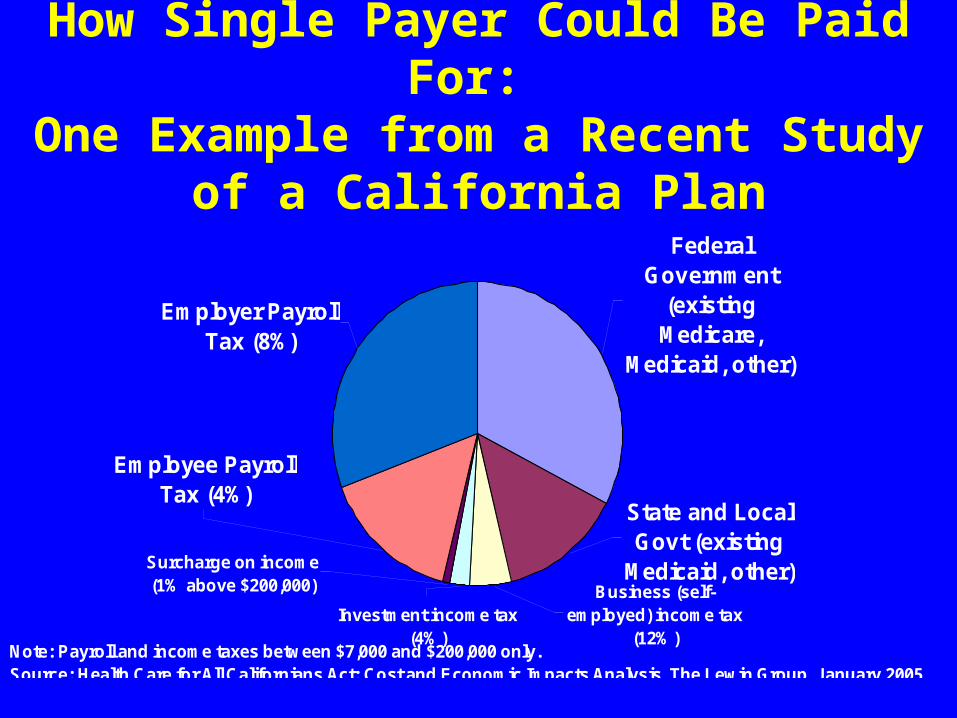
How Single Payer Could Be Paid For: One Example from a Recent Study of a
California Plan
Federal Government
(existing Medicare,
Medicaid, other)
Business (self-employed) income tax
(12%)
State and Local Govt (existing
Medicaid, other)Surcharge on income (1% above $200,000)
Employee Payroll Tax (4%)
Employer Payroll Tax (8%)
Investment income tax (4%)
Note: Payroll and income taxes between $7,000 and $200,000 only. Source: Health Care for All Californians Act: Cost and Economic Impacts Analysis, The Lewin Group, January 2005
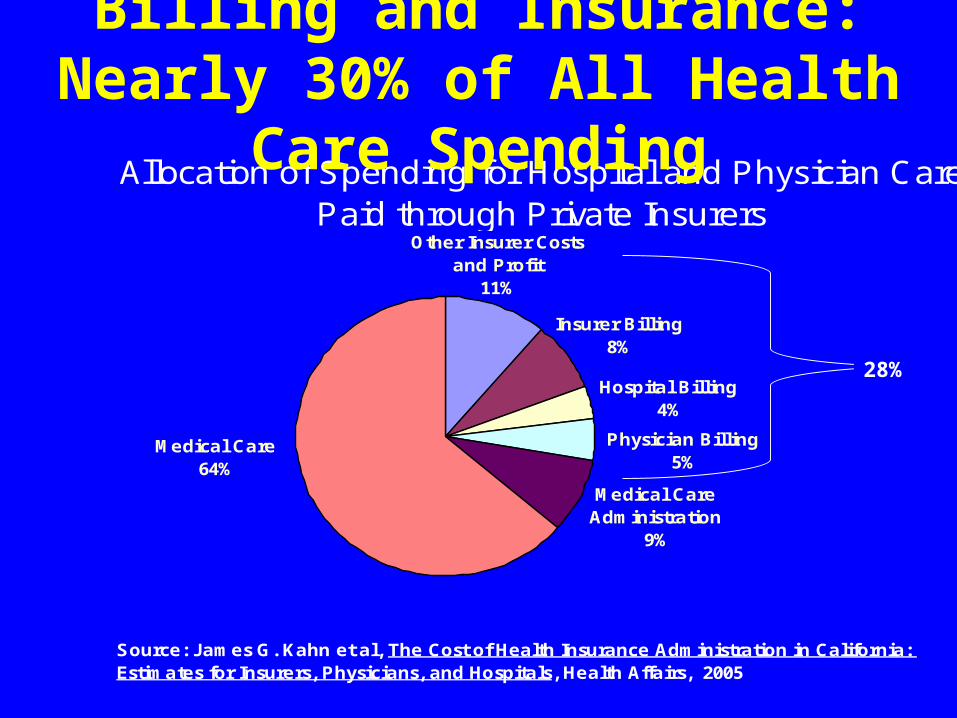
Medical Care Administration
9%
Insurer Billing8%
Other Insurer Costs and Profit
11%
Hospital Billing4%
Medical Care64%
Physician Billing 5%
Source: James G. Kahn et al, The Cost of Health Insurance Administration in California: Estimates for Insurers, Physicians, and Hospitals, Health Affairs, 2005
Allocation of Spending for Hospital and Physician Care Paid through Private Insurers
Billing and Insurance: Nearly 30% of All Health Care Spending
28%
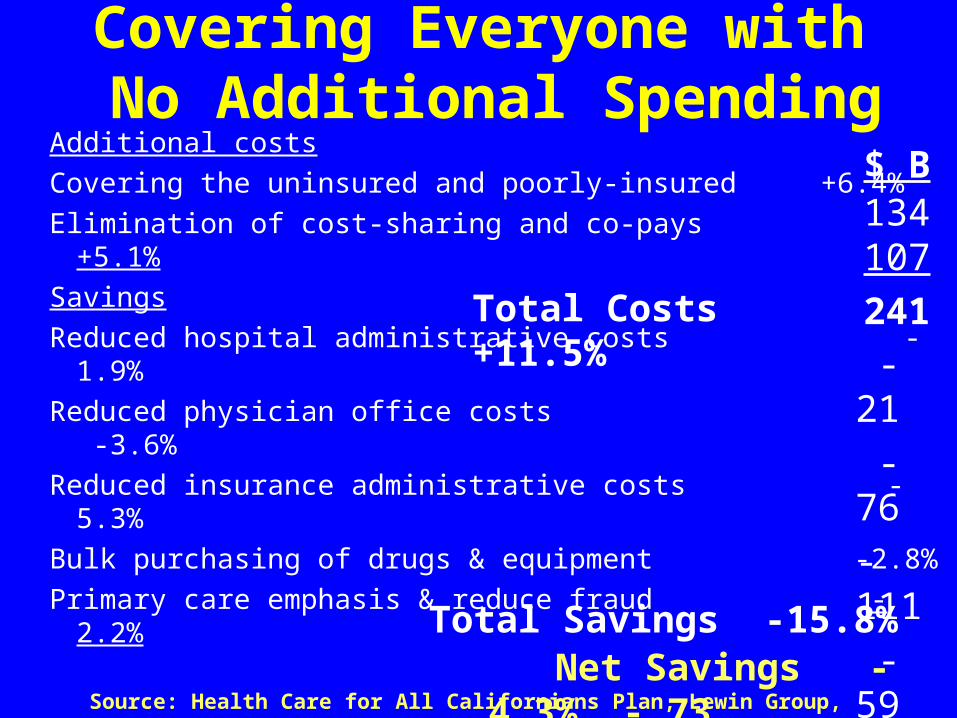
Covering Everyone with No Additional Spending
Additional costs
Covering the uninsured and poorly-insured +6.4%
Elimination of cost-sharing and co-pays +5.1%
Savings
Reduced hospital administrative costs -1.9%
Reduced physician office costs -3.6%
Reduced insurance administrative costs -5.3%
Bulk purchasing of drugs & equipment -2.8%
Primary care emphasis & reduce fraud -2.2%
Source: Health Care for All Californians Plan, Lewin Group, January 2005
134107
241
-21
-76
-111
-59
-46 -313
$ B
Total Costs +11.5%
Total Savings -15.8% Net Savings - 4.3% - 73
The Bottom LineThe Private-Public Mandate model will• Make the world’s most expensive system even costlier.• Not improve insurance coverage for the average person.• Not make affordable insurance available.• Not contain the continuing growth in cost.
In other words, it won’t work!
Only single payer national health insurance will
• Cover everyone for comprehensive services.• Cost no more than we are now spending.• Provide mechanisms for containing the growth in cost.

Will We Get Real Health Care Reform Before the Premium Takes All our Income?
Source: American Family Physician, November 14, 2005
Today